Preprint
Article

This version is not peer-reviewed.

Use of Waste Products in the Form of Dust and Glass Flour in Mortars

A peer-reviewed version of this preprint was published in:
Economics and Environment 2025, 93(2), 1107. https://doi.org/10.34659/eis.2025.93.2.1107

Submitted:

13 December 2024

Posted:

13 December 2024

You are already at the latest version

Abstract

In Poland and the European Union countries, environmental awareness of a rational waste management policy is growing every year. The main problem in waste management has become the lack of areas to store waste. The correct solution seems to be the recovery or recycling of waste. Mortar is one material whose properties can be consciously modified with selected additives derived from waste. The use of waste in mortar is not only waste management, but also the modification of its properties. Today, recycled additives such as various types of glass are increasingly being used in mortar. In Europe, glass recycling reaches up to 85% of all glass packaging. A large proportion of new glass packaging is produced from recycled glass. In Poland, the situation is completely different. Only a small percentage of recycled glass is reused. A significant amount of cullet and waste glass is stored in landfills. This is a major ecological problem, which is why opportunities are being sought to manage as much glass waste material as possible. The aim of the planned laboratory tests was to manage waste coloured glass in building mortars made from Portland cement CEM II/B-V 42.5R and to determine the effect of glass flour and dust replacing cement and sand in varying proportions on the rheological characteristics and physical-mechanical parameters of the mortars. As a result of the tests carried out, the influence of the two-fraction waste material on the basic properties of cement mortars, i.e. setting time, bulk density, consistency, compressive and flexural strength, absorbability and capillary rise, was determined. Compressive and flexural strengths were tested after 7, 14, 28 and 56 days of curing. Half of the specimens made were matured under laboratory conditions and the other half under varying weather conditions. The microstructure of the mortars was examined after 28 days of maturation under a scanning electron microscope.

Keywords: 
;  ;  ;  ;  ;  

1. Introduction

Natural resources, as well as electricity, are used to produce building materials. The demand for building materials is constantly increasing. Each concrete element consists of at least three components such as cement, water and sand. Today, cement is the second most consumed raw material by humans worldwide, after drinking water. Its consumption is increasing year after year, leaving a huge carbon footprint for generations to come [1]. The value of the carbon footprint of building materials depends and will depend mainly on how we produce electricity. This is why so much emphasis is placed on producing as much renewable energy as possible. Both in the production processes of building materials and in their transport and use, there is a strong emphasis on reducingCO2 emissions into the atmosphere. Increasingly, CEM IV pozzolanic cements and CEM V multicomponent cements, which have a significantly lower carbon footprint than CEM I Portland cements - by up to 40% [2], are beginning to appear in the offerings of cement plants. Low-clinker cements are also favoured by the PN-EN 197-5:2021 standard[3], which allows the production of Portland multicomponent cements CEM II/C, with a clinker content in the range 50-64%, and CEM VI multicomponent cements, with a clinker content in the range 35-49% [4,5].
An additional problem in the production of construction materials is becoming a shortage of natural aggregates, mainly sand. The demand for this key raw material in the construction industry is steadily increasing and natural deposits are successively decreasing. Sand mining is the world’s largest extractive industry, responsible for 85% of all mineral extraction. The United Nations Environment Programme (UNEP) estimates that global demand for sand is between 40 and 50 billion tonnes per year. Its overexploitation is mainly driven by the construction industry and dynamic urbanisation. Illegal and uncontrolled exploitation of sand in unauthorised areas without a licence is becoming a common practice. There are even more than 13,700 sites in Poland where sand mineral is illegally extracted. Illegal extraction of this material poses a real threat to Poland’ s raw material security. It causes negative interference in the natural environment, which contributes to irreversible changes in nature, and also creates perfect conditions for the increasing occurrence of illegal waste sites at the site of sand extraction. The NIK reports that, sand resources will be exhausted by 2050 (with the exception of quartz sands) [6]. The shortage of aggregate is forcing the search for alternative methods of producing fine aggregate. Due to the environmental and economic benefits, waste reuse is becoming a popular practice. One of the raw materials finding application in the construction industry is glass, specifically fine cullet. Research into the use of waste glass in the production of building materials has been ongoing for some time. They focus primarily on replacing fine aggregate with cullet [7,8].
Glass, which is an ideal secondary material, is an inorganic amorphous material, formed by rapidly cooling a liquid to a solid form, preventing crystallisation. The internal structure of glass is distinguished by the lack of long-range ordering, characteristic of crystals or polycrystals. As a result, when heated, glass first softens, then becomes malleable, to successively change into a liquid with increasing mobility. This process is reversible. In the internal structure, there is only local ordering, on an atomic scale, with the result that the structure of glass shows characteristics in common with that of an overcooled liquid, while at the same time exhibiting the mechanical properties of a solid, which by definition makes it an amorphous body [9].
The most common type of glass is conventional soda-lime-silicate glass. The basic raw materials used in its production are: quartz sand (SiO2), in an amount of 68÷74%, which is the glass body; limestone meal (CaCO3), as an ingredient stabilising and hardening the glass, as well as increasing its chemical resistance, in an amount of 7÷14%; and soda ash (Na2CO3), which lowers the melting point of the mixture, in an amount of 12÷16%. In addition to the main components, the following are added: aluminium and magnesium, increasing chemical and mechanical resistance, arsenic oxides, antimony and fluorine compounds, facilitating glass clarification and cullet, accelerating the mixture’s melting. In addition to sodium-calcium-silicate glass, a distinction can be made between boron-silicate glass, lead glass, optical glass, sodium glass or sodium-potassium glass refined with barium [9,10,11,12]. Glass is an isotropic material. It has equal properties in every direction. It is a perfectly elastic material. It is also not subject to permanent deformation, but at the same time is characterised by brittleness when subjected to external forces. Glass has a high compressive strength of 500 - 1000 MPa. It is also resistant to the adverse effects of chemicals. This resistance depends, among other things, on the chemical composition of the glass, the condition of its surface, temperature and even the duration of exposure to selected external factors. A very important parameter of this material, as a building material component, is its chemical resistance to water [9,10,11,12,13]. In the construction industry, waste glass may find application in the production of insulation and acoustic materials, as well as decorative elements. In mortar technology, waste glass can be used as a non-reactive filler or reactive pozzolanic additive. The use of waste glass in mortar production depends mainly on the grain size of the ground glass and its reactivity. Glass grain sizes up to 0.3 mm show pozzolanic properties. It is then a potential replacement for cement. This is also confirmed by studies conducted by Gołek M., Szudek W., Błądek M., Cięciwa M. [12]. On the other hand, waste glass granulation above 0.3 mm can be used as fine aggregate [8,9,13,14]. The potential use of recycled glass in the construction sector, in terms of its environmental impact, may have many advantages. Firstly, it influences the reduction of landfill waste and secondly, it enables the replacement of natural raw materials with recycled ones. These measures aim to reduce the negative impact on the environment, in line with the idea of sustainability [11,15,16].

2. Materials and Methods

The test programme comprised three series of mortars in which cement was replaced by 10%, 20% , 30% by weight, and three series in which sand was replaced by 20%, 35% and 50% by weight. Portland cement CEM II/B-V 42.5 R was used for the mortars [Figure 2] in accordance with EN 197-1: 2012 [17]. Quartz sand of fraction 0 ÷ 2 mm according to PN-EN 12620+A1:2010 [18], tap water [19] were used as aggregates. All series of mortars were made according to the procedure recorded in PN-EN 196-1:2016-07 [20].
Table 1. Shows the compositions of the individual construction mortars.
Quantity of
ingredients, [g]
SW
(L,Z)
1C10%
L,Z
1C20%
L,Z
1C30%
L,Z
1P20%
L,Z
1P35%
L,Z
1P50%
L,Z
Cement 450 405 360 315 450 450 450
Sand 1350 1350 1350 1350 1080 472,5 675
Water 225 225 225 225 225 225 225
Glass flour - - - - 270 877,5 675
Glass dust - 45 90 135 - - -
Fluidizing admixture - - - - 3 3 3
Designations: SW - reference series, 1C10% - 10% dust was used as a replacement for cement, 1P20% - 20% glass flour was used as a replacement for sand, etc. Half of the samples from each series were cured under laboratory conditions (designation L), the other half under variable weather conditions outdoors (designation Z).
For the samples ripened under variable weather conditions (month of February), the temperature was measured three times a day at 7am, 1pm and 9pm. A graph of the temperature variation is shown below (Figure 1).
For the first seven days, the temperature varied between +1°C and +5°C. On the eleventh day of maturation, the temperature dropped to -2°C at night. The highest temperature recorded was +13°C.
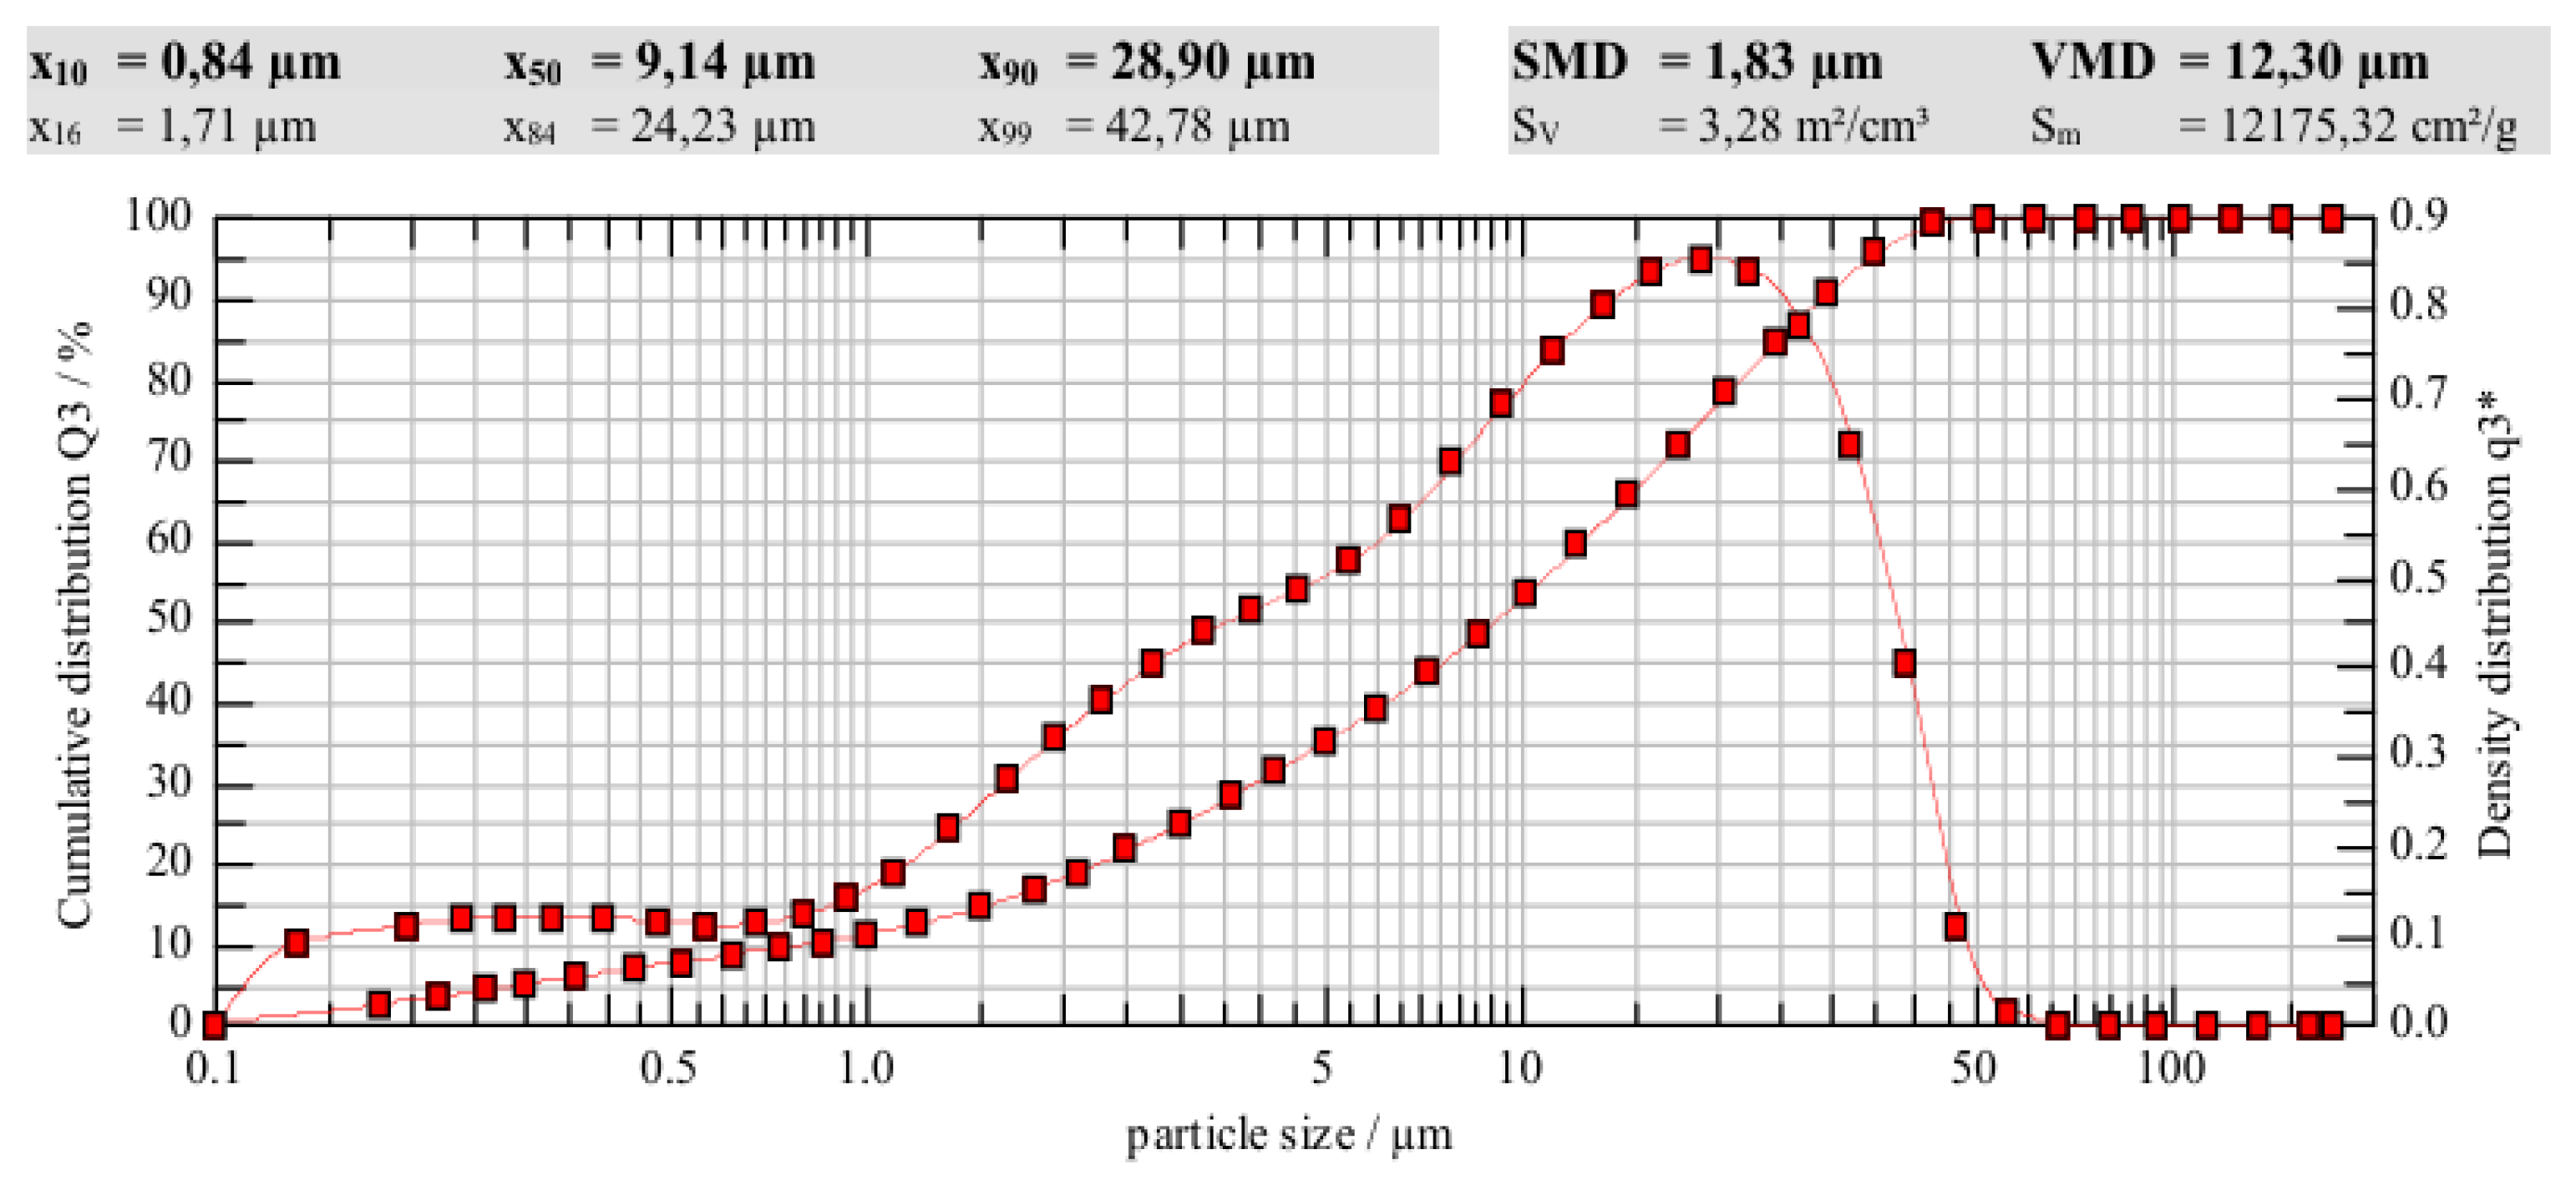
Portland ash cement CEM II/B-V 42.5 R was used for the mortars. A granulometric analysis of the cement was carried out (Figure 2).
Figure 2. Granulometric analysis of the cement.
Preprints 142833 g002
Analysis of the granulometric study of the cement (Figure 2) showed that the particle size of 50% of the cement is smaller than 9.14 µm. However, the highest concentration of particles is found in the fraction range from 1 µm to 40 µm.
Recycled cullet was used in the composition of the mortars, which was substituted for sand at 20%, 35% and 50% by weight. The aggregate was mostly white glass, but coloured glass (green, brown) was also visible. The glass flour used in the mortars was characterised by a grain size of 0 - 2 mm.
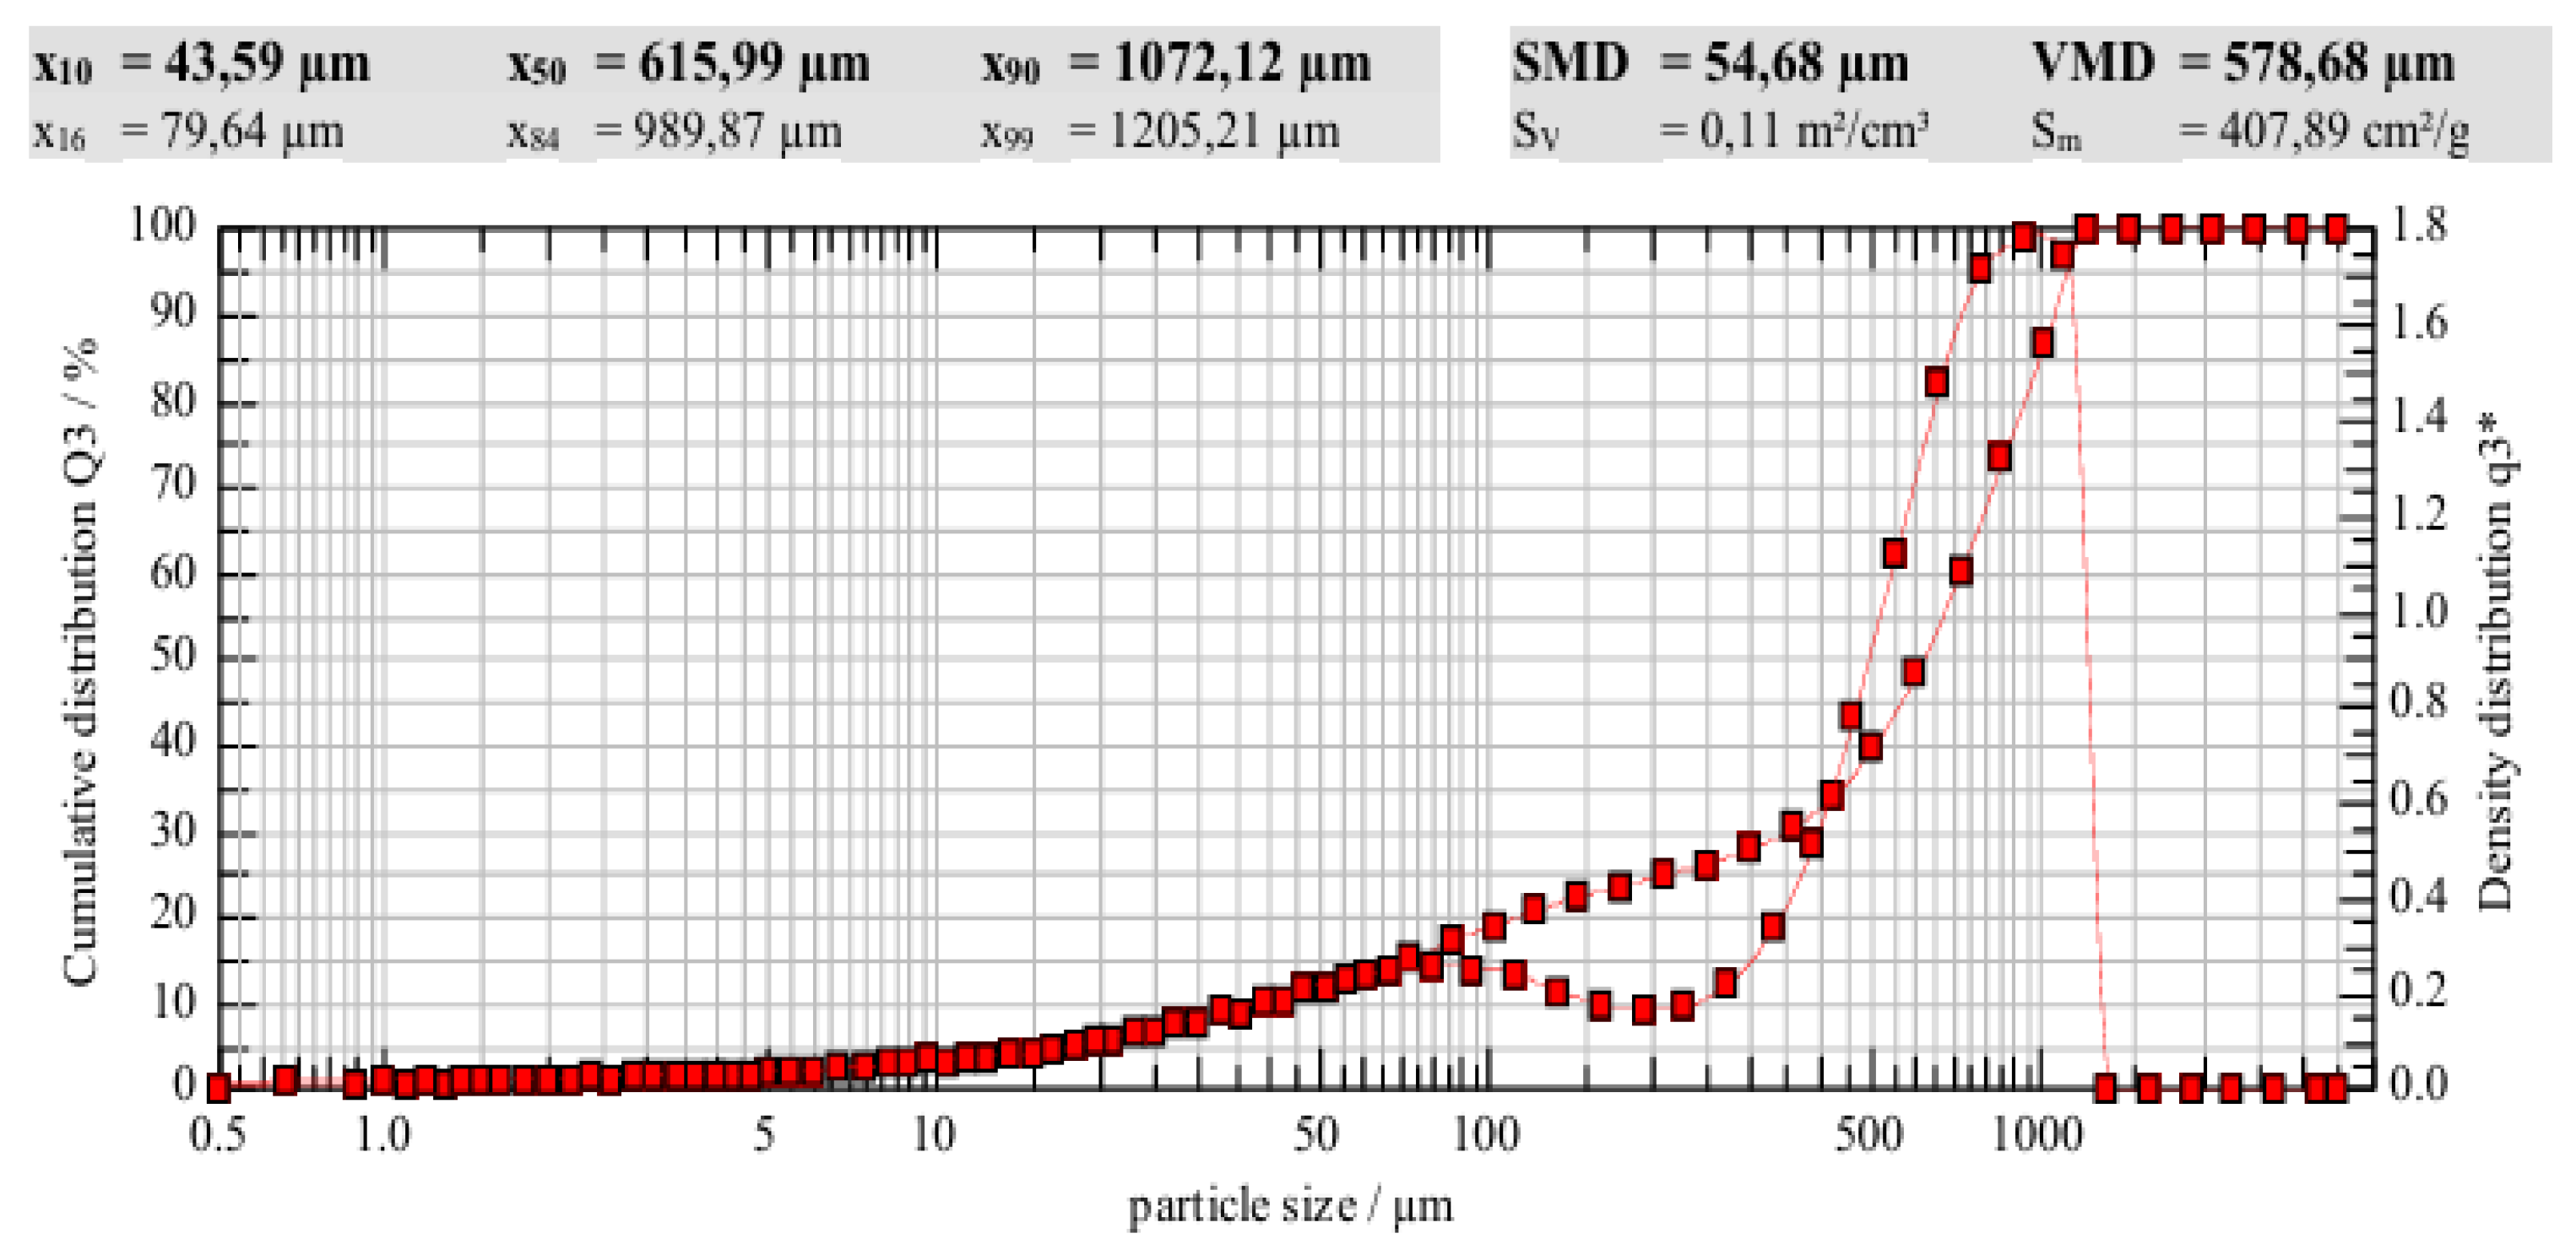
From the data obtained in the glass meal granulometric analysis study (Figure 3), it can be deduced that the glass meal particle size is 50% smaller than 615.99 µm. In contrast, the highest concentration of particles is found in the fraction range from 300 µm to 1050 µm.
Ground glass granules in the form of glass dust replaced cement at 10%, 20% and 30% by weight. It was characterised by a grain size of 0 - 0.1 mm.
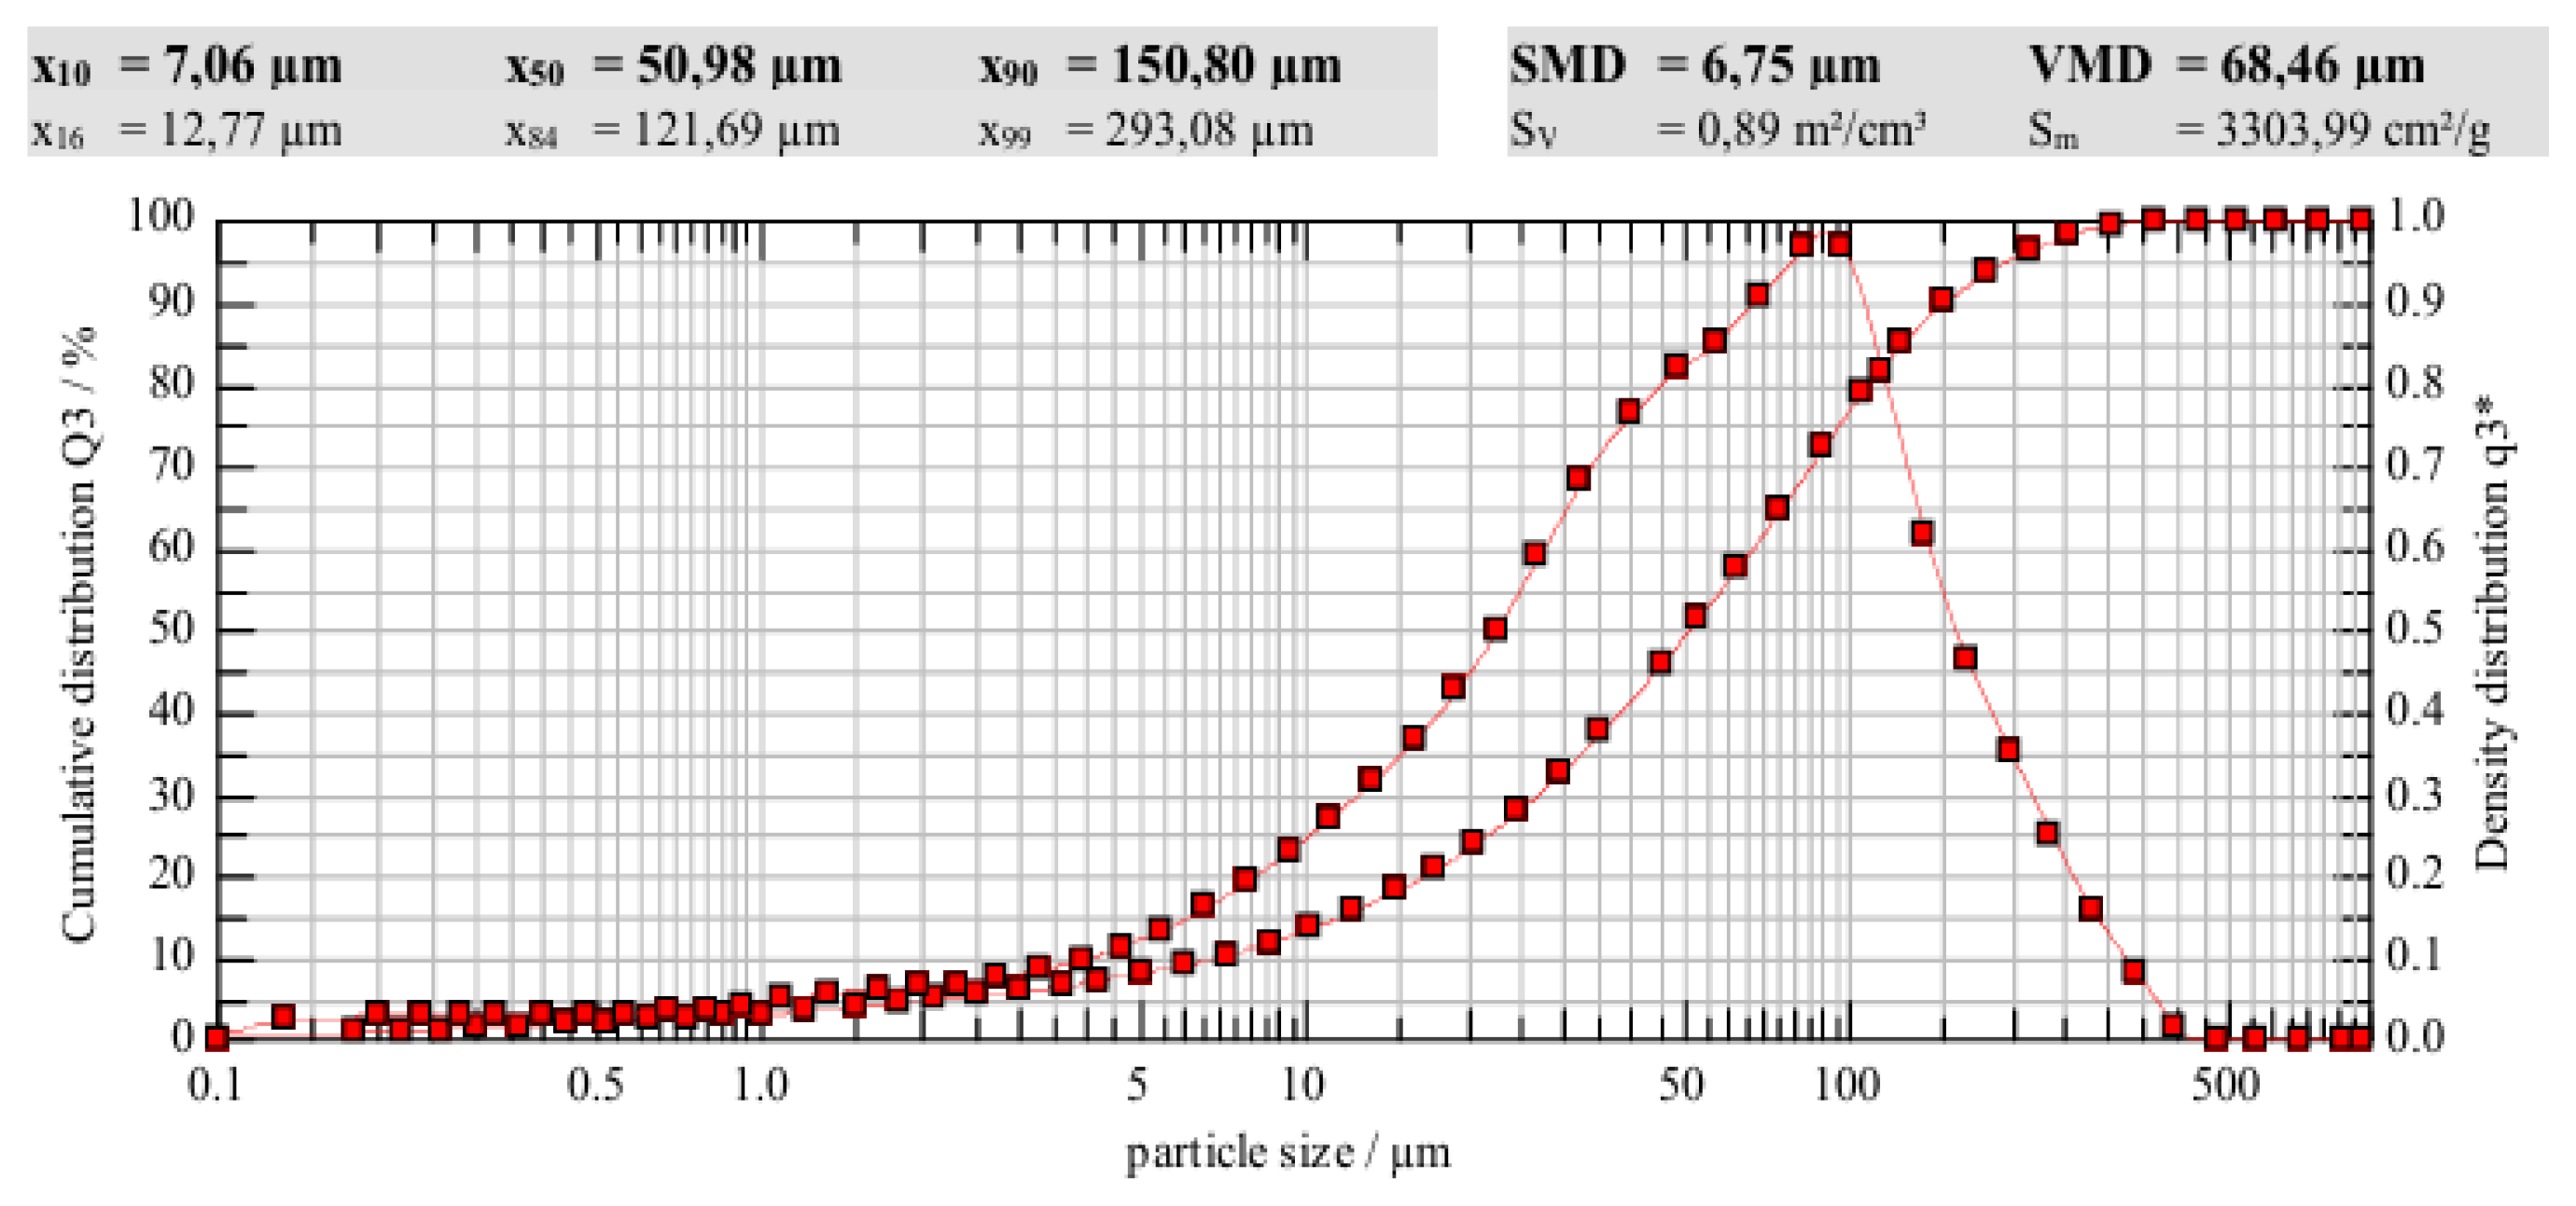
From the data obtained in the granulometric analysis study (Figure 4) of the glass dust, it can be concluded that the particle size of 50% of the glass dust is smaller than 50.98 µm. However, the highest concentration of particles is found in the fraction range from 7 µm to 400 µm.
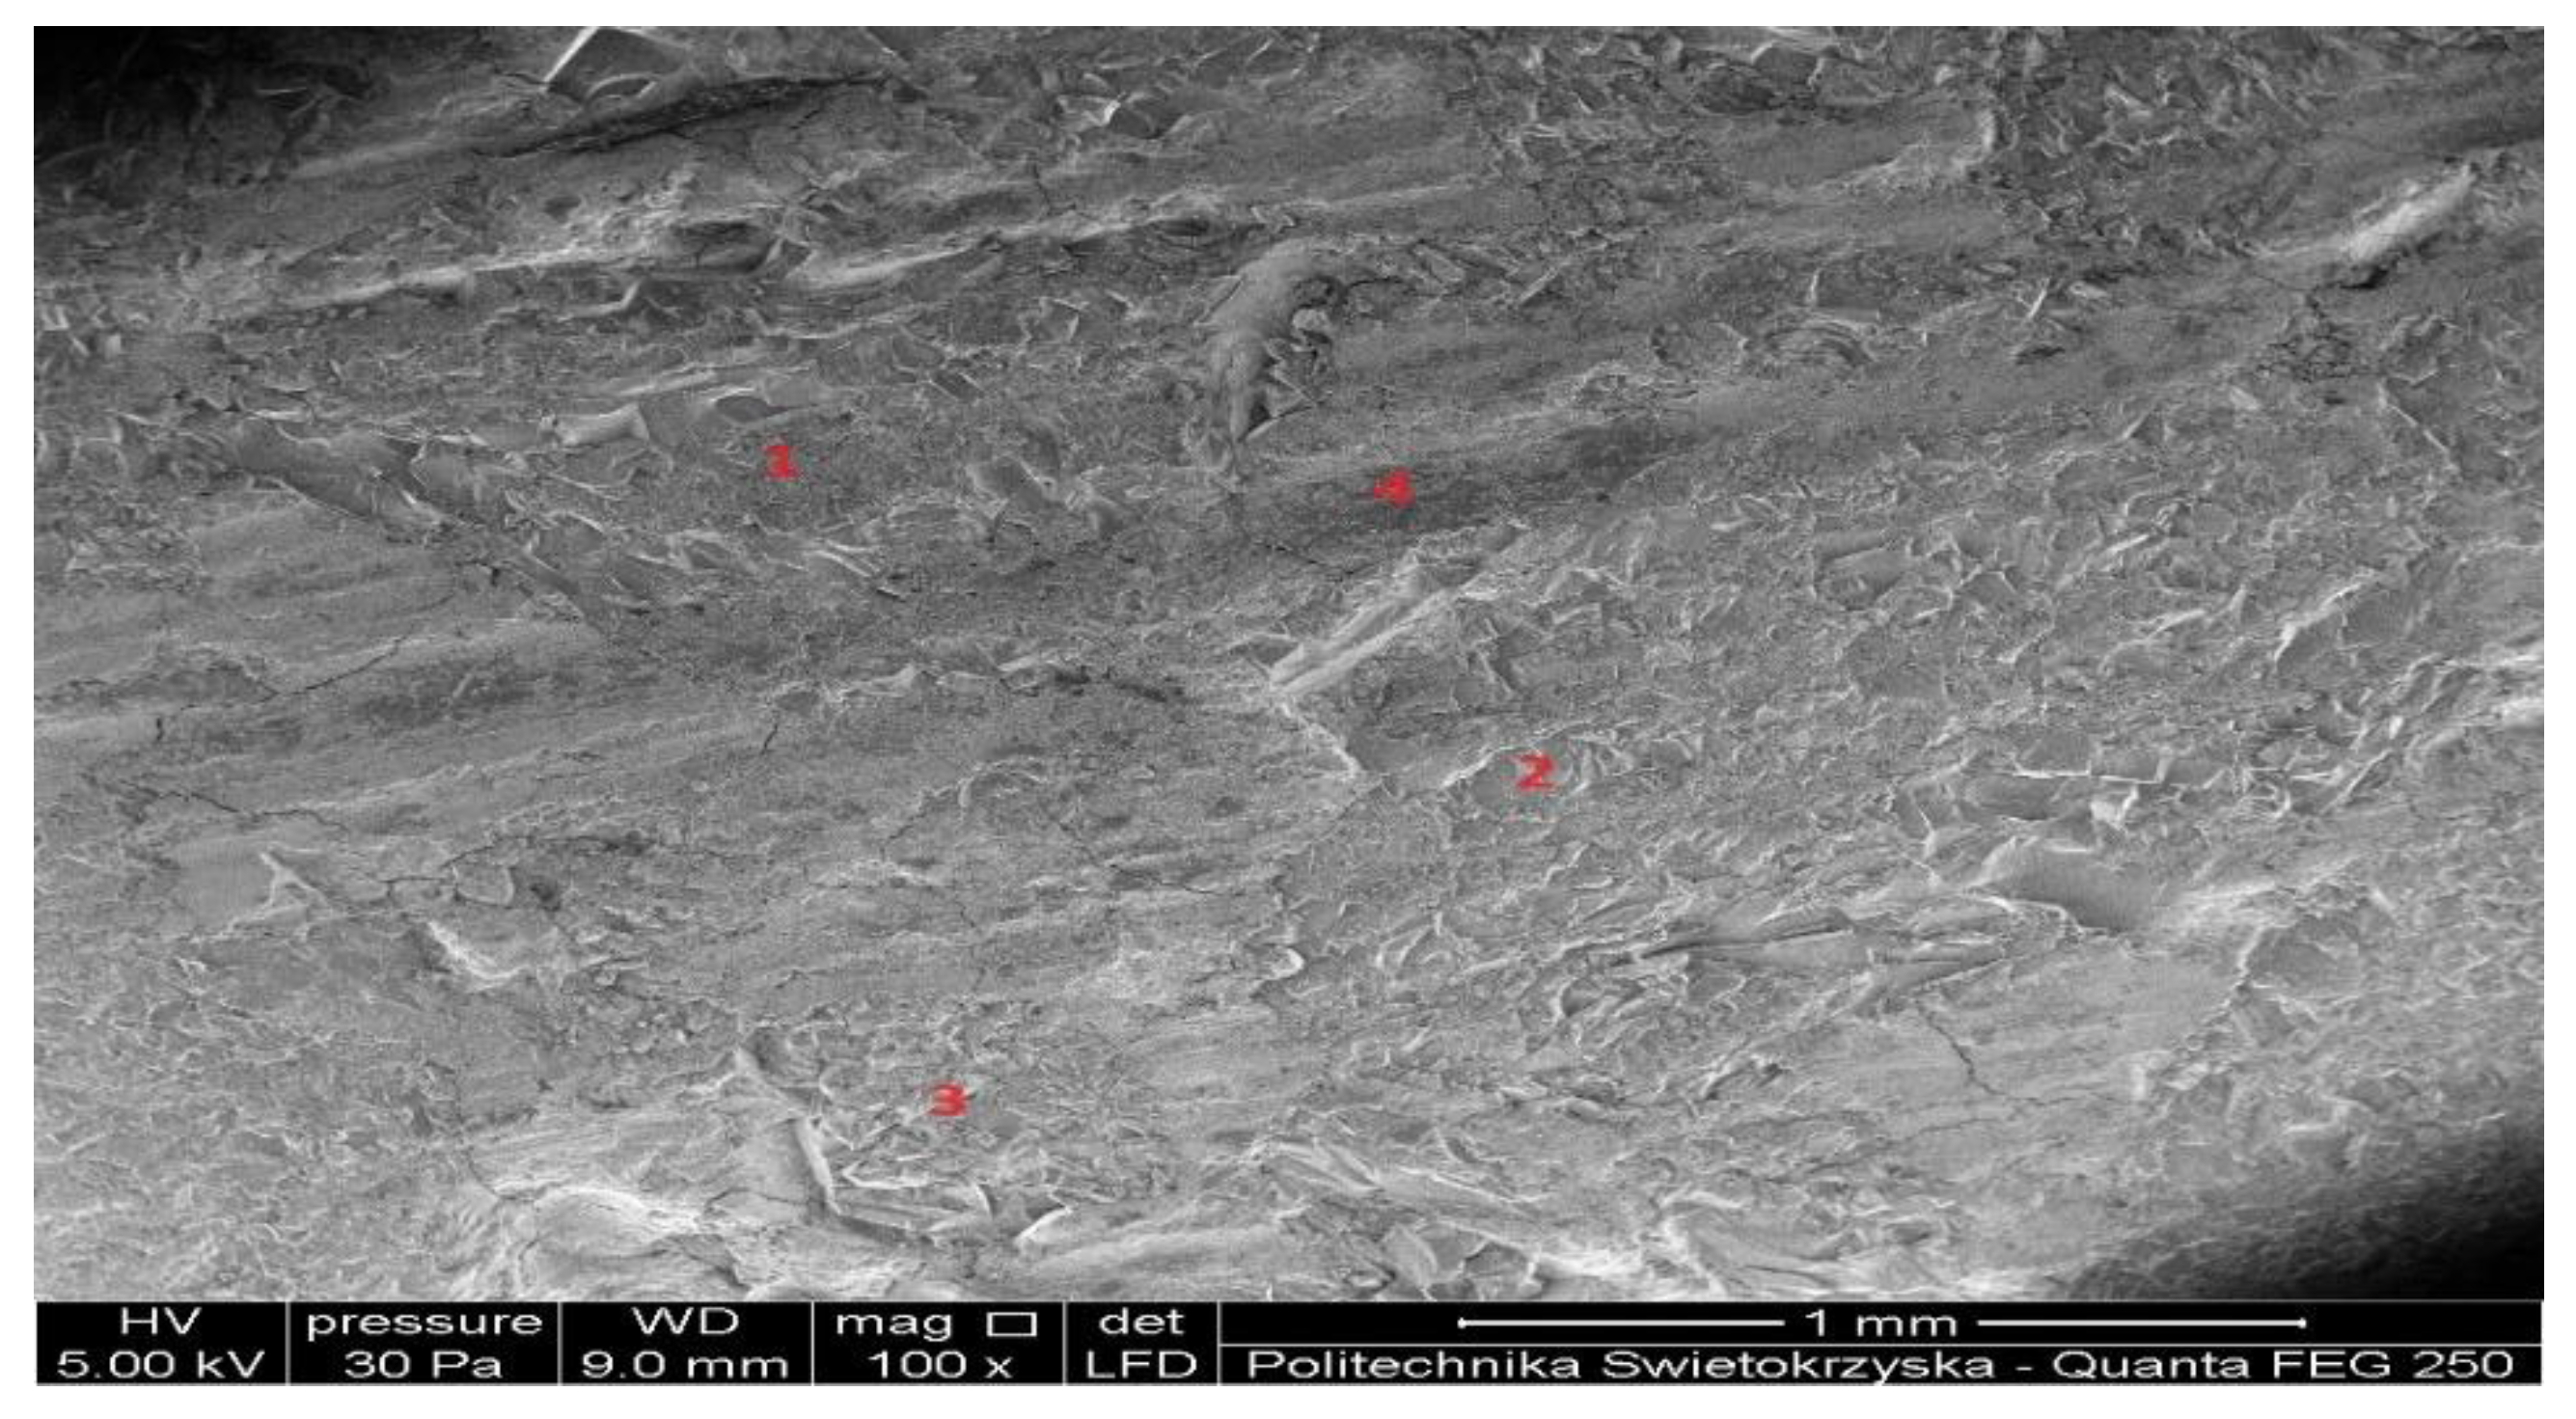
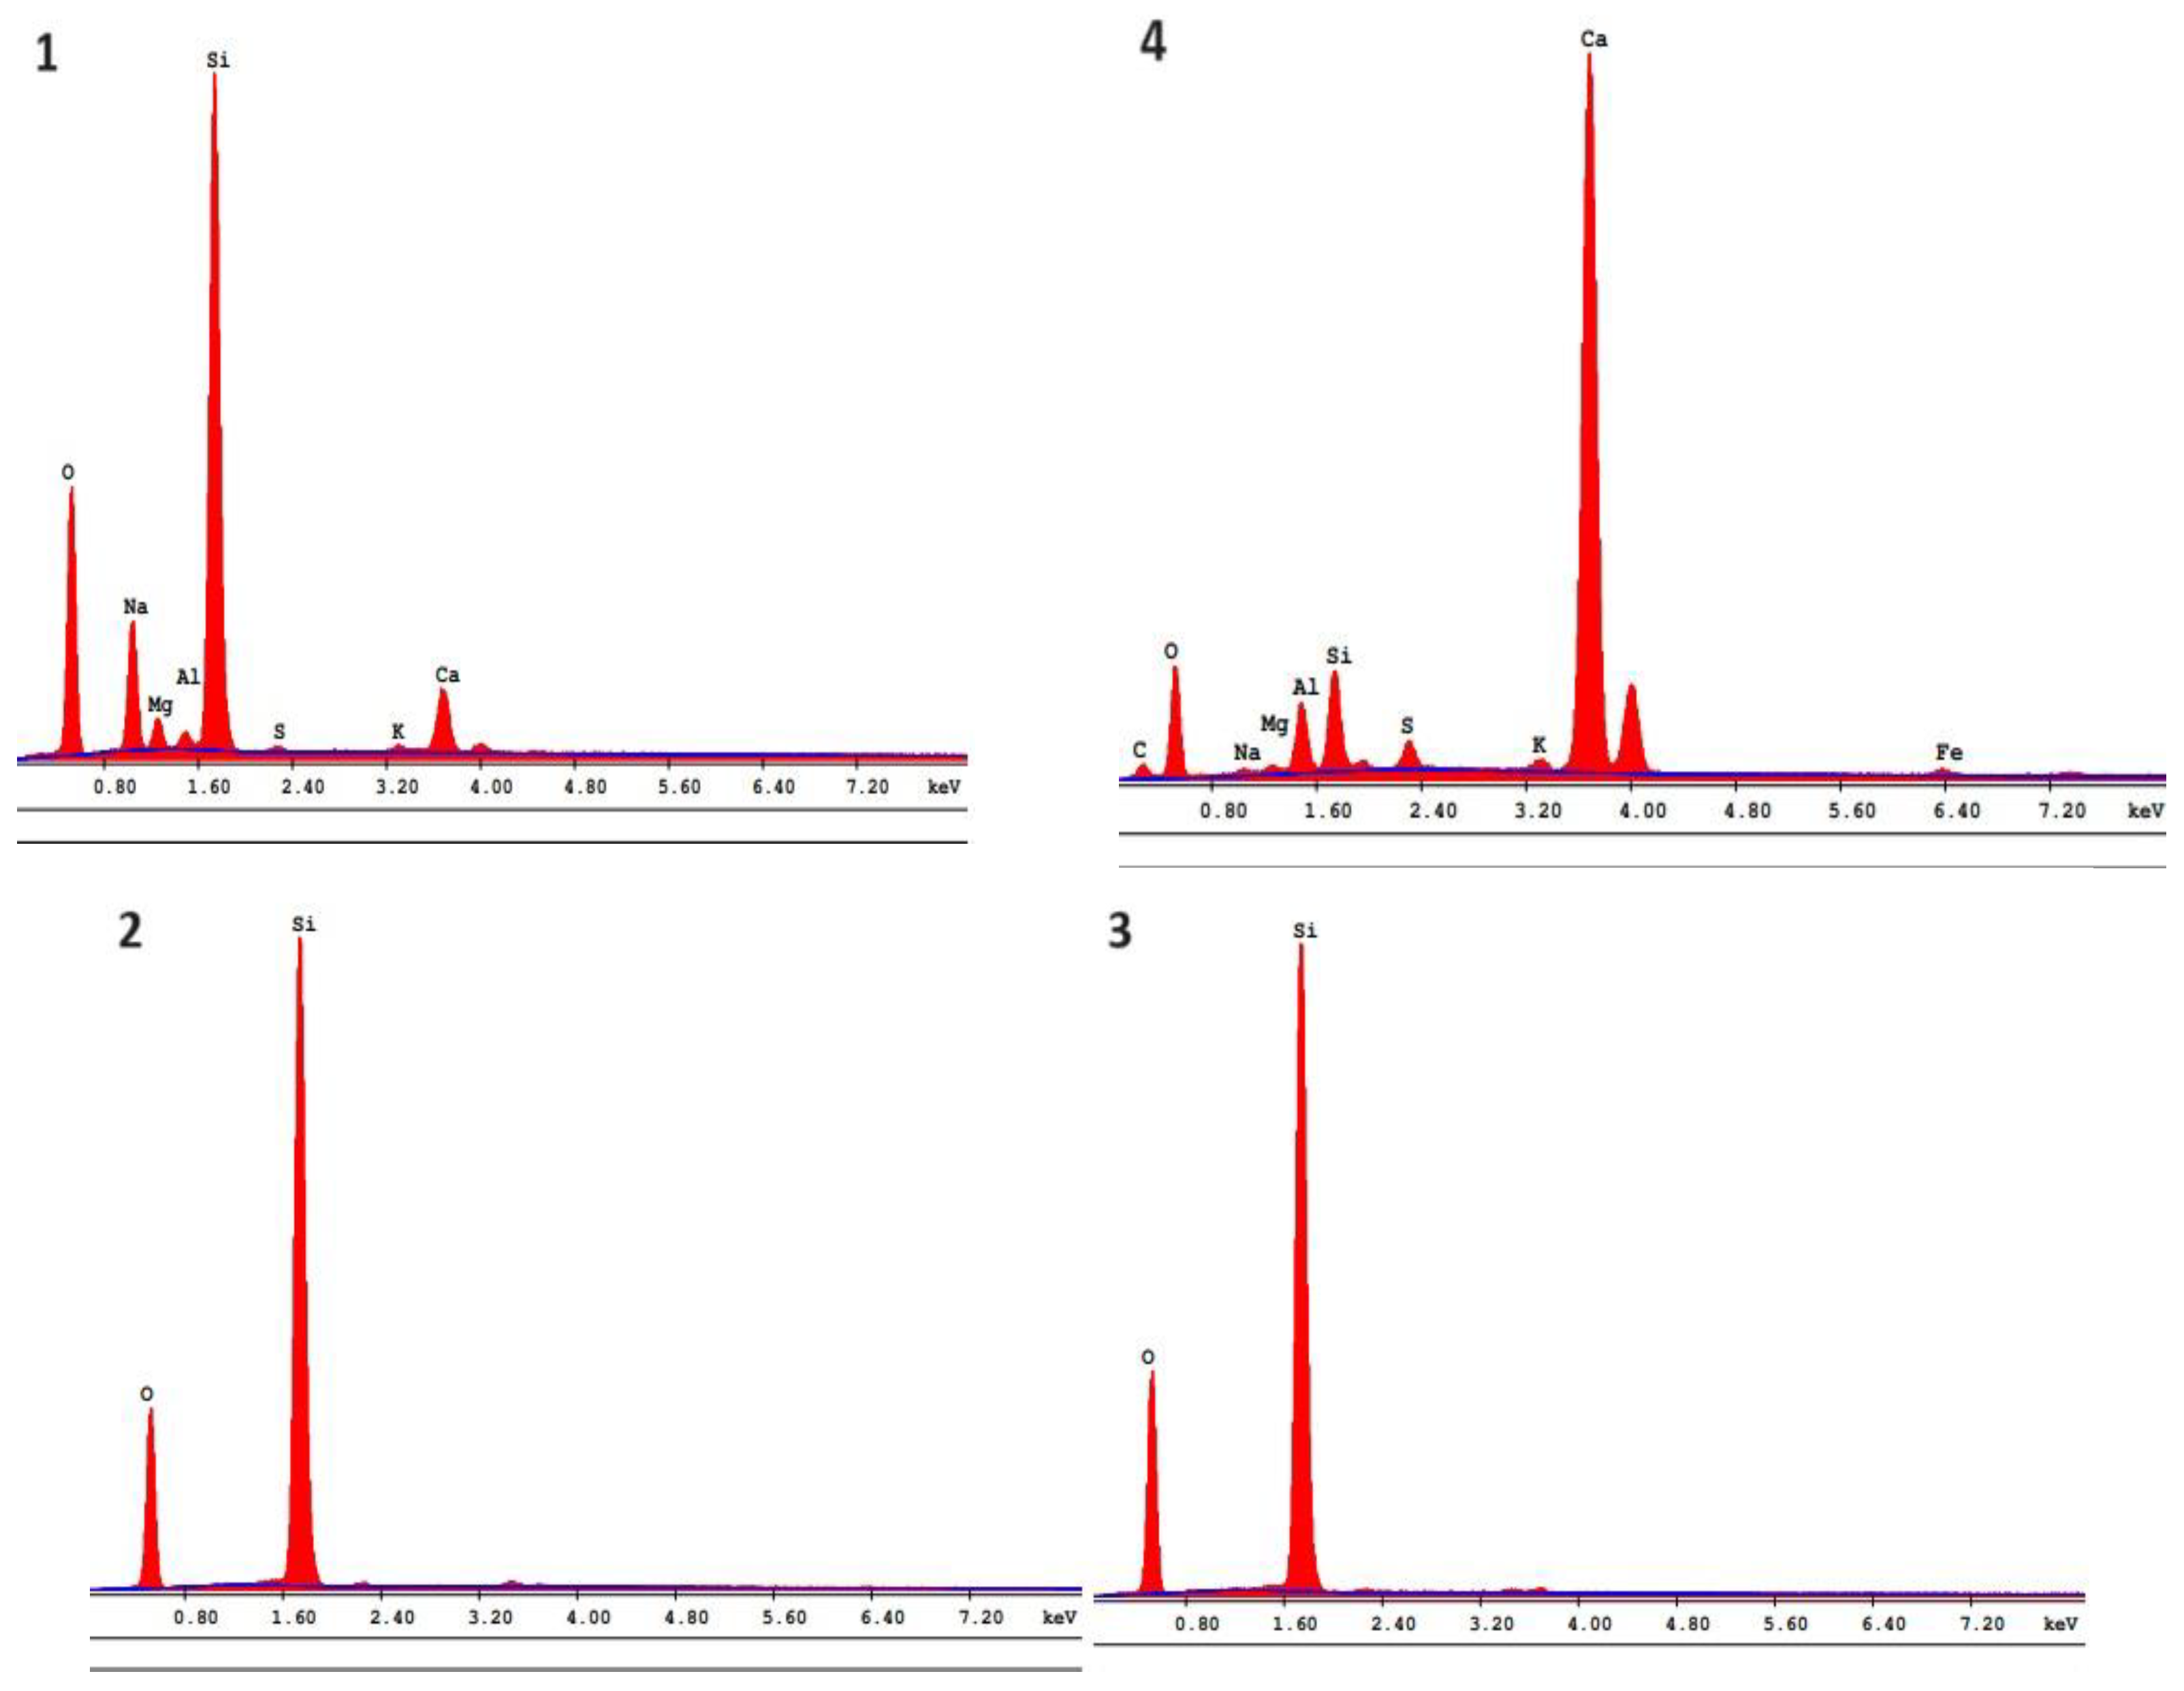
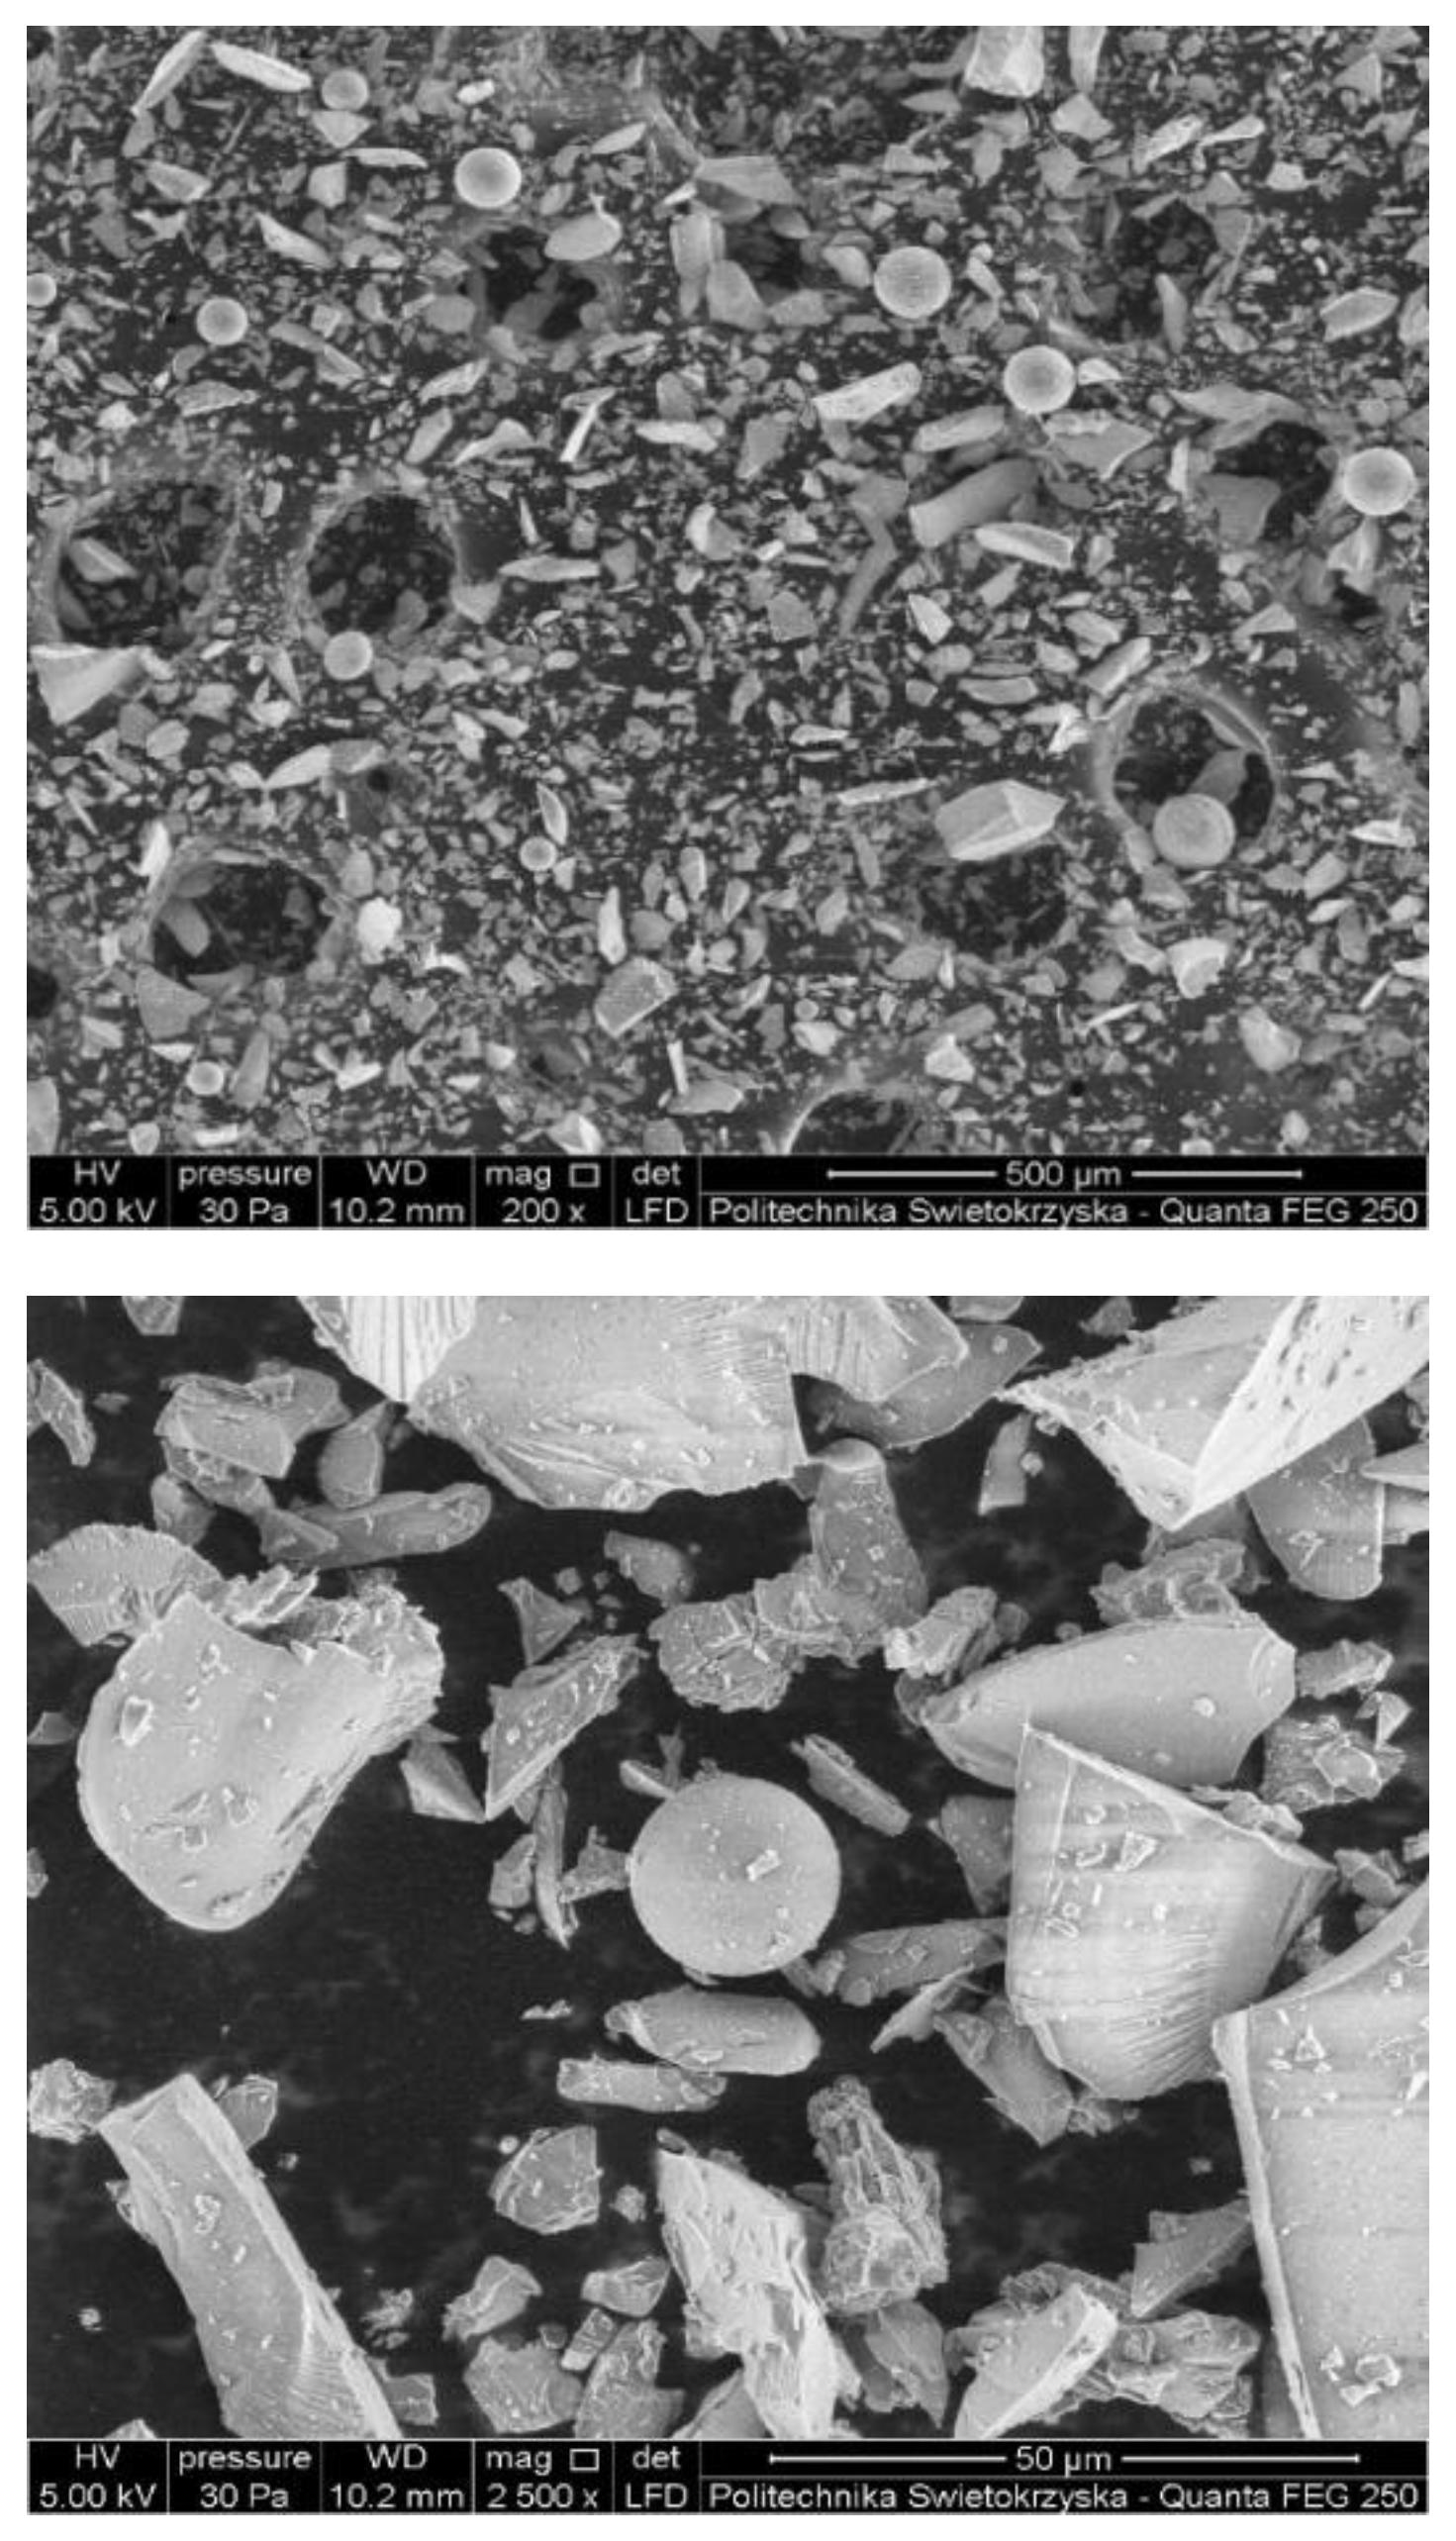
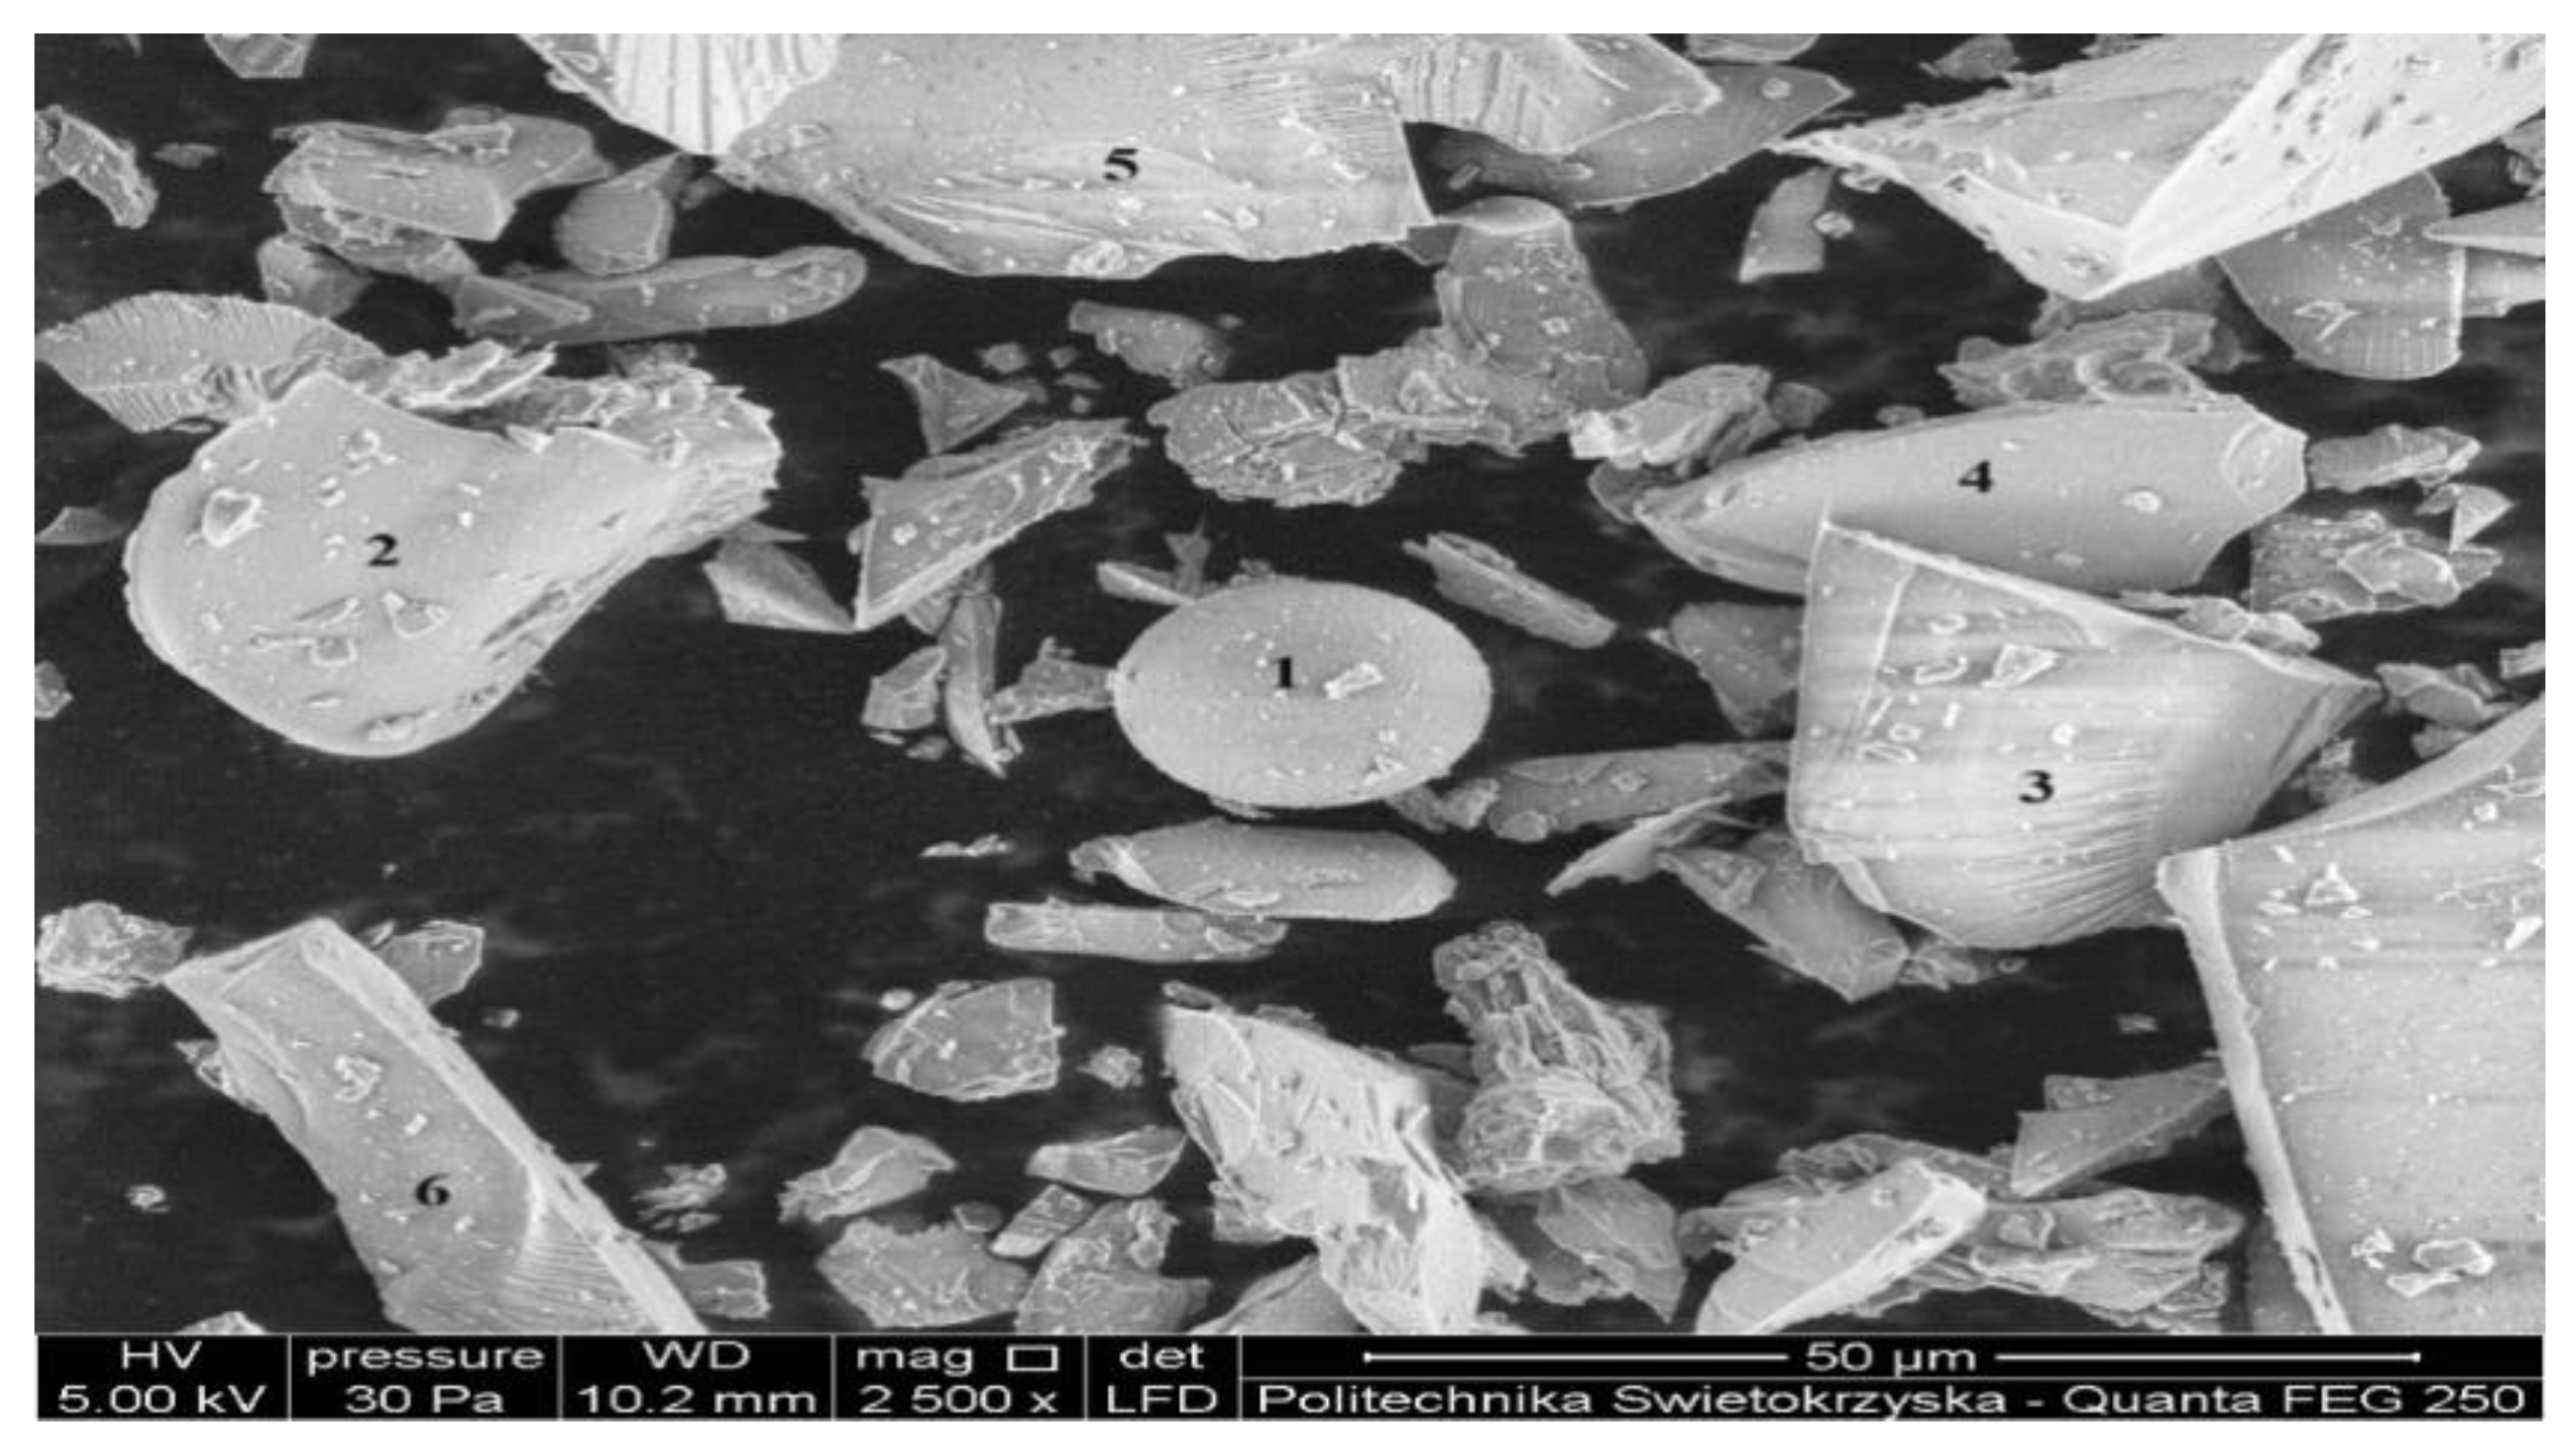
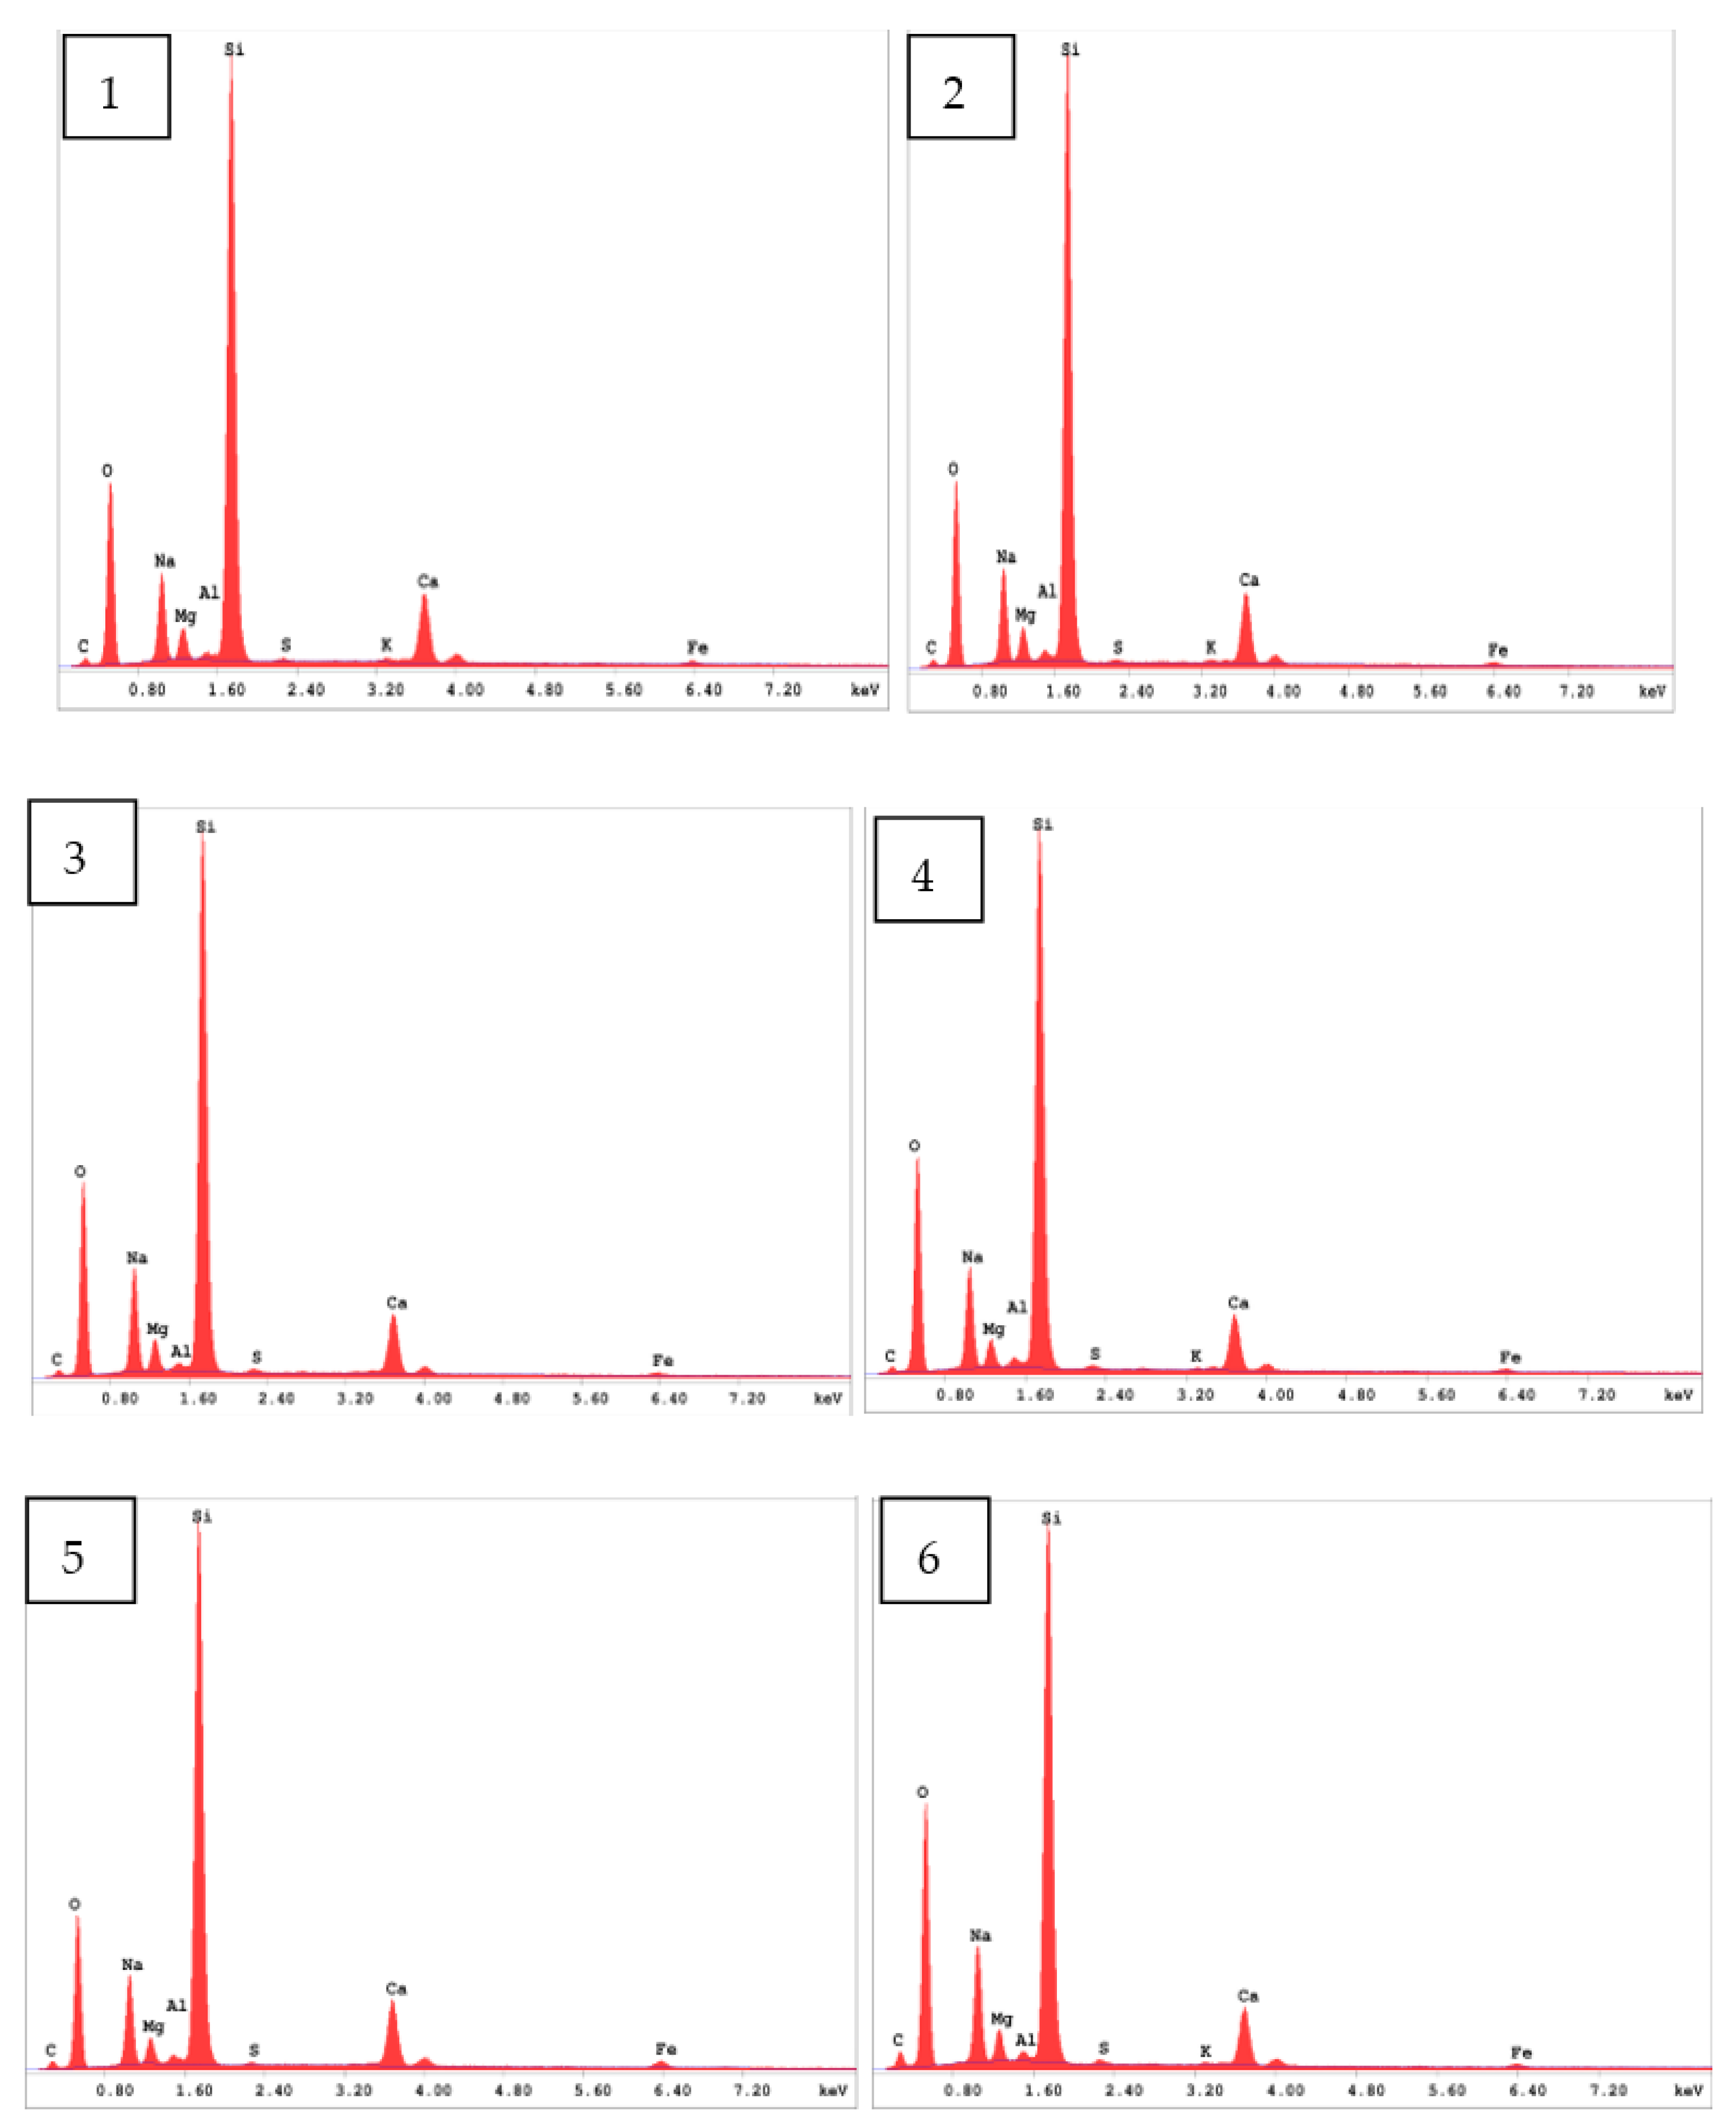
Prior to the mortars, EDS analysis of the glass dust was carried out at selected points (Figure 5, Figure 6 and Figure 7).
EDS analysis of the glass dust (Figure 7) carried out using a scanning microscope showed that the recycled glass is a soda-lime-silicate glass, due to the predominant amount of sodium oxide and limestone in the test sample.
A liquefying admixture was used in the study. It is an advanced superplasticiser from the new generation of PCE polymers. It is characterised by a strong plasticising effect, rapid development of early strength and a moderate reduction in w/c ratio. The admixture was dosed directly into the wet mortar components.
Compressive and flexural strength testing was carried out on 4x4x16 cm standard specimens according to EN 1015-11:2020-04 [21].Half of the specimens were matured in the laboratory in water at +18±2ºC after forming. The other half of the specimens from each series were subjected to variable maturation temperatures according to Figure 1. Compressive and flexural strengths were tested after 7, 28, 56 days, each time on six specimens from each series.
Capillary rise was tested according to PN-88/B-06250 [22] on 4x4x16 cm specimens. Half of the beads were stored in water at +18±2ºC for 7 days after forming, while the other half were matured in air at varying temperatures. The samples from the laboratory conditions were then stored in an air-dry environment at +18±2ºC for 21 days. The weight gain of the tested mortars was controlled after 28 days of maturation for all samples. Before testing, the mortars were placed in an air-conditioning chamber at a constant temperature of +40ºC for a period of 120 hours. After the samples were removed from the chamber, the weight gain of the mortars was tested 15 min, 30 min, 1 h, 4 h after the samples were in contact with water. Subsequent weight measurements were made every 24 hours. The samples were immersed to a height of approximately 5 mm in water throughout the test period.
The absorbability test was carried out in accordance with PN-88/B-06250 [22] on samples measuring 4x4x16 cm. The mortar samples from the laboratory conditions were stored for a period of 7 days in water at +18±2ºC and a further 21 days for the test in air at +18±2ºC. And the second part of the samples from each batch was stored outside the building at varying temperatures in air for a period of 28 days. All samples were then placed in water up to half their height for a period of 24 hours. After one day, the water was replenished to +1 cm above the height of the samples. The weight gain of the tested mortars was monitored every 24 h until there was no weight gain of the tested mortars.
The determination of water absorption and capillary rise was carried out on six samples from each batch, three matured under laboratory conditions and three under varying conditions.

3. Results

For the consistency determination, the spreading table method was used in accordance with PN-EN 1015-3:2 [23] (Figure 2).
Table 2. Consistency test results for mortars.
Series name Flow [mm] Consistency class
SW 125x125 Dense plastic
1C10% 125x125
1C20% 130x130
1C30% 134x134
1P20% 100x100
1P35% 120x120
1P50% 120x120
All mortar series tested were characterised by their dense-plastic consistency.
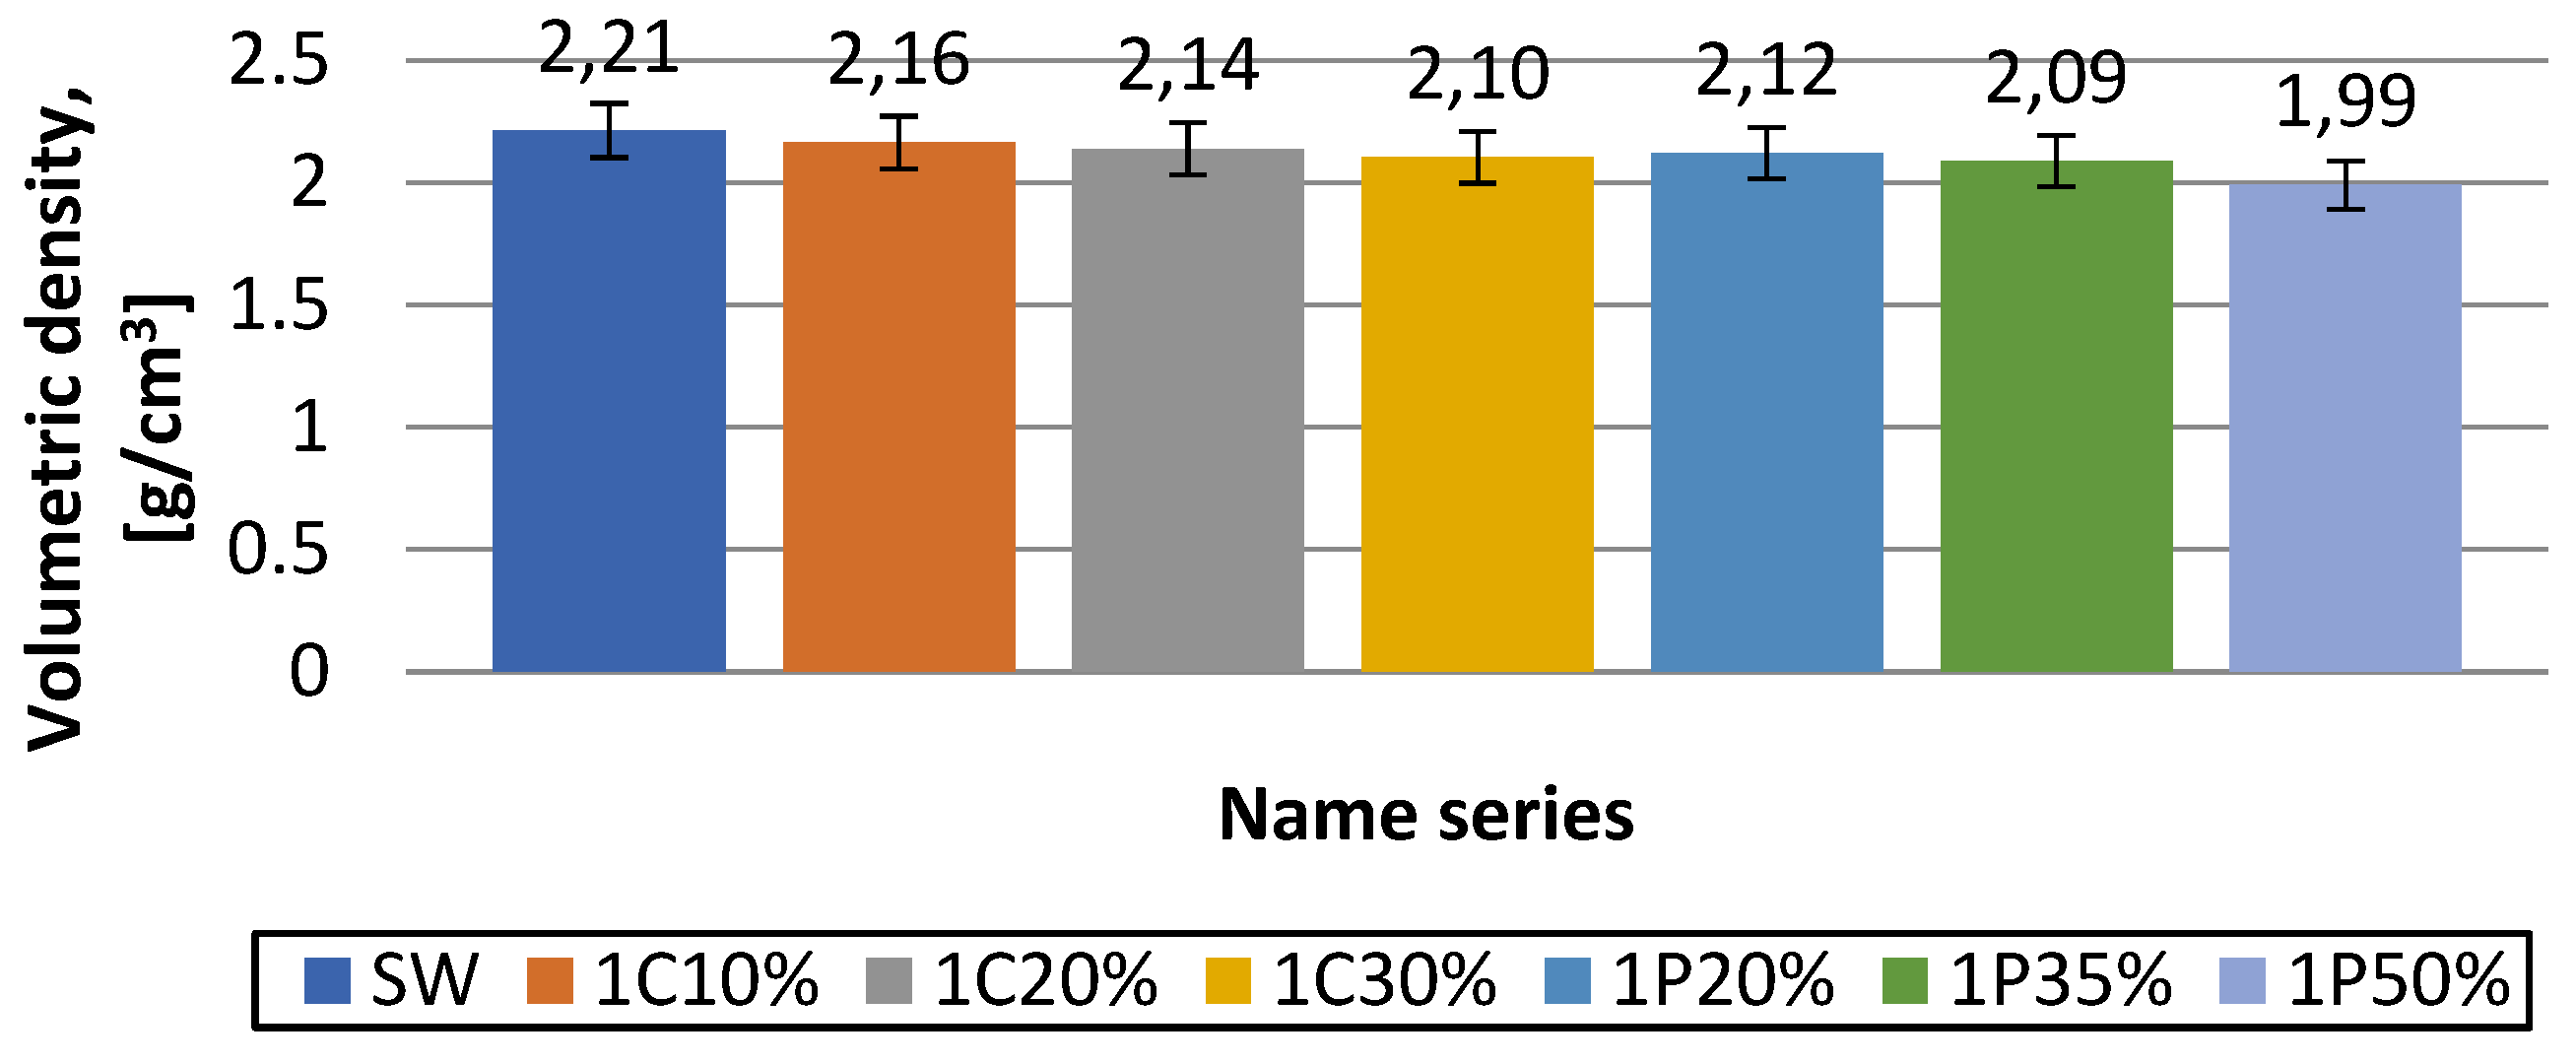
The volumetric density test was carried out in accordance with PN-EN 1015-6:2000, [24].
Figure 8. Volumetric density results for the different batches.
Preprints 142833 g008
The use of a cement substitute in the form of glass dust influenced a slight decrease in the volumetric density of the mortars. The more of this substitute, the lower the volumetric density of the mortar. For mortars in which sand was replaced by glass flour with a 0-2 mm fraction, a decrease in this parameter was also recorded. For the 1P50 series, in which sand was replaced by 50% glass flour, the decrease was 9.95% compared with the reference series.
The setting time test was carried out in accordance with EN 96-3:2016-12 [25]. A Vicata apparatus was used to determine the setting time.
The cement substitute in the form of glass dust had the effect of prolonging the start and end of mortar setting. The more substitute the longer this time [Table 3].
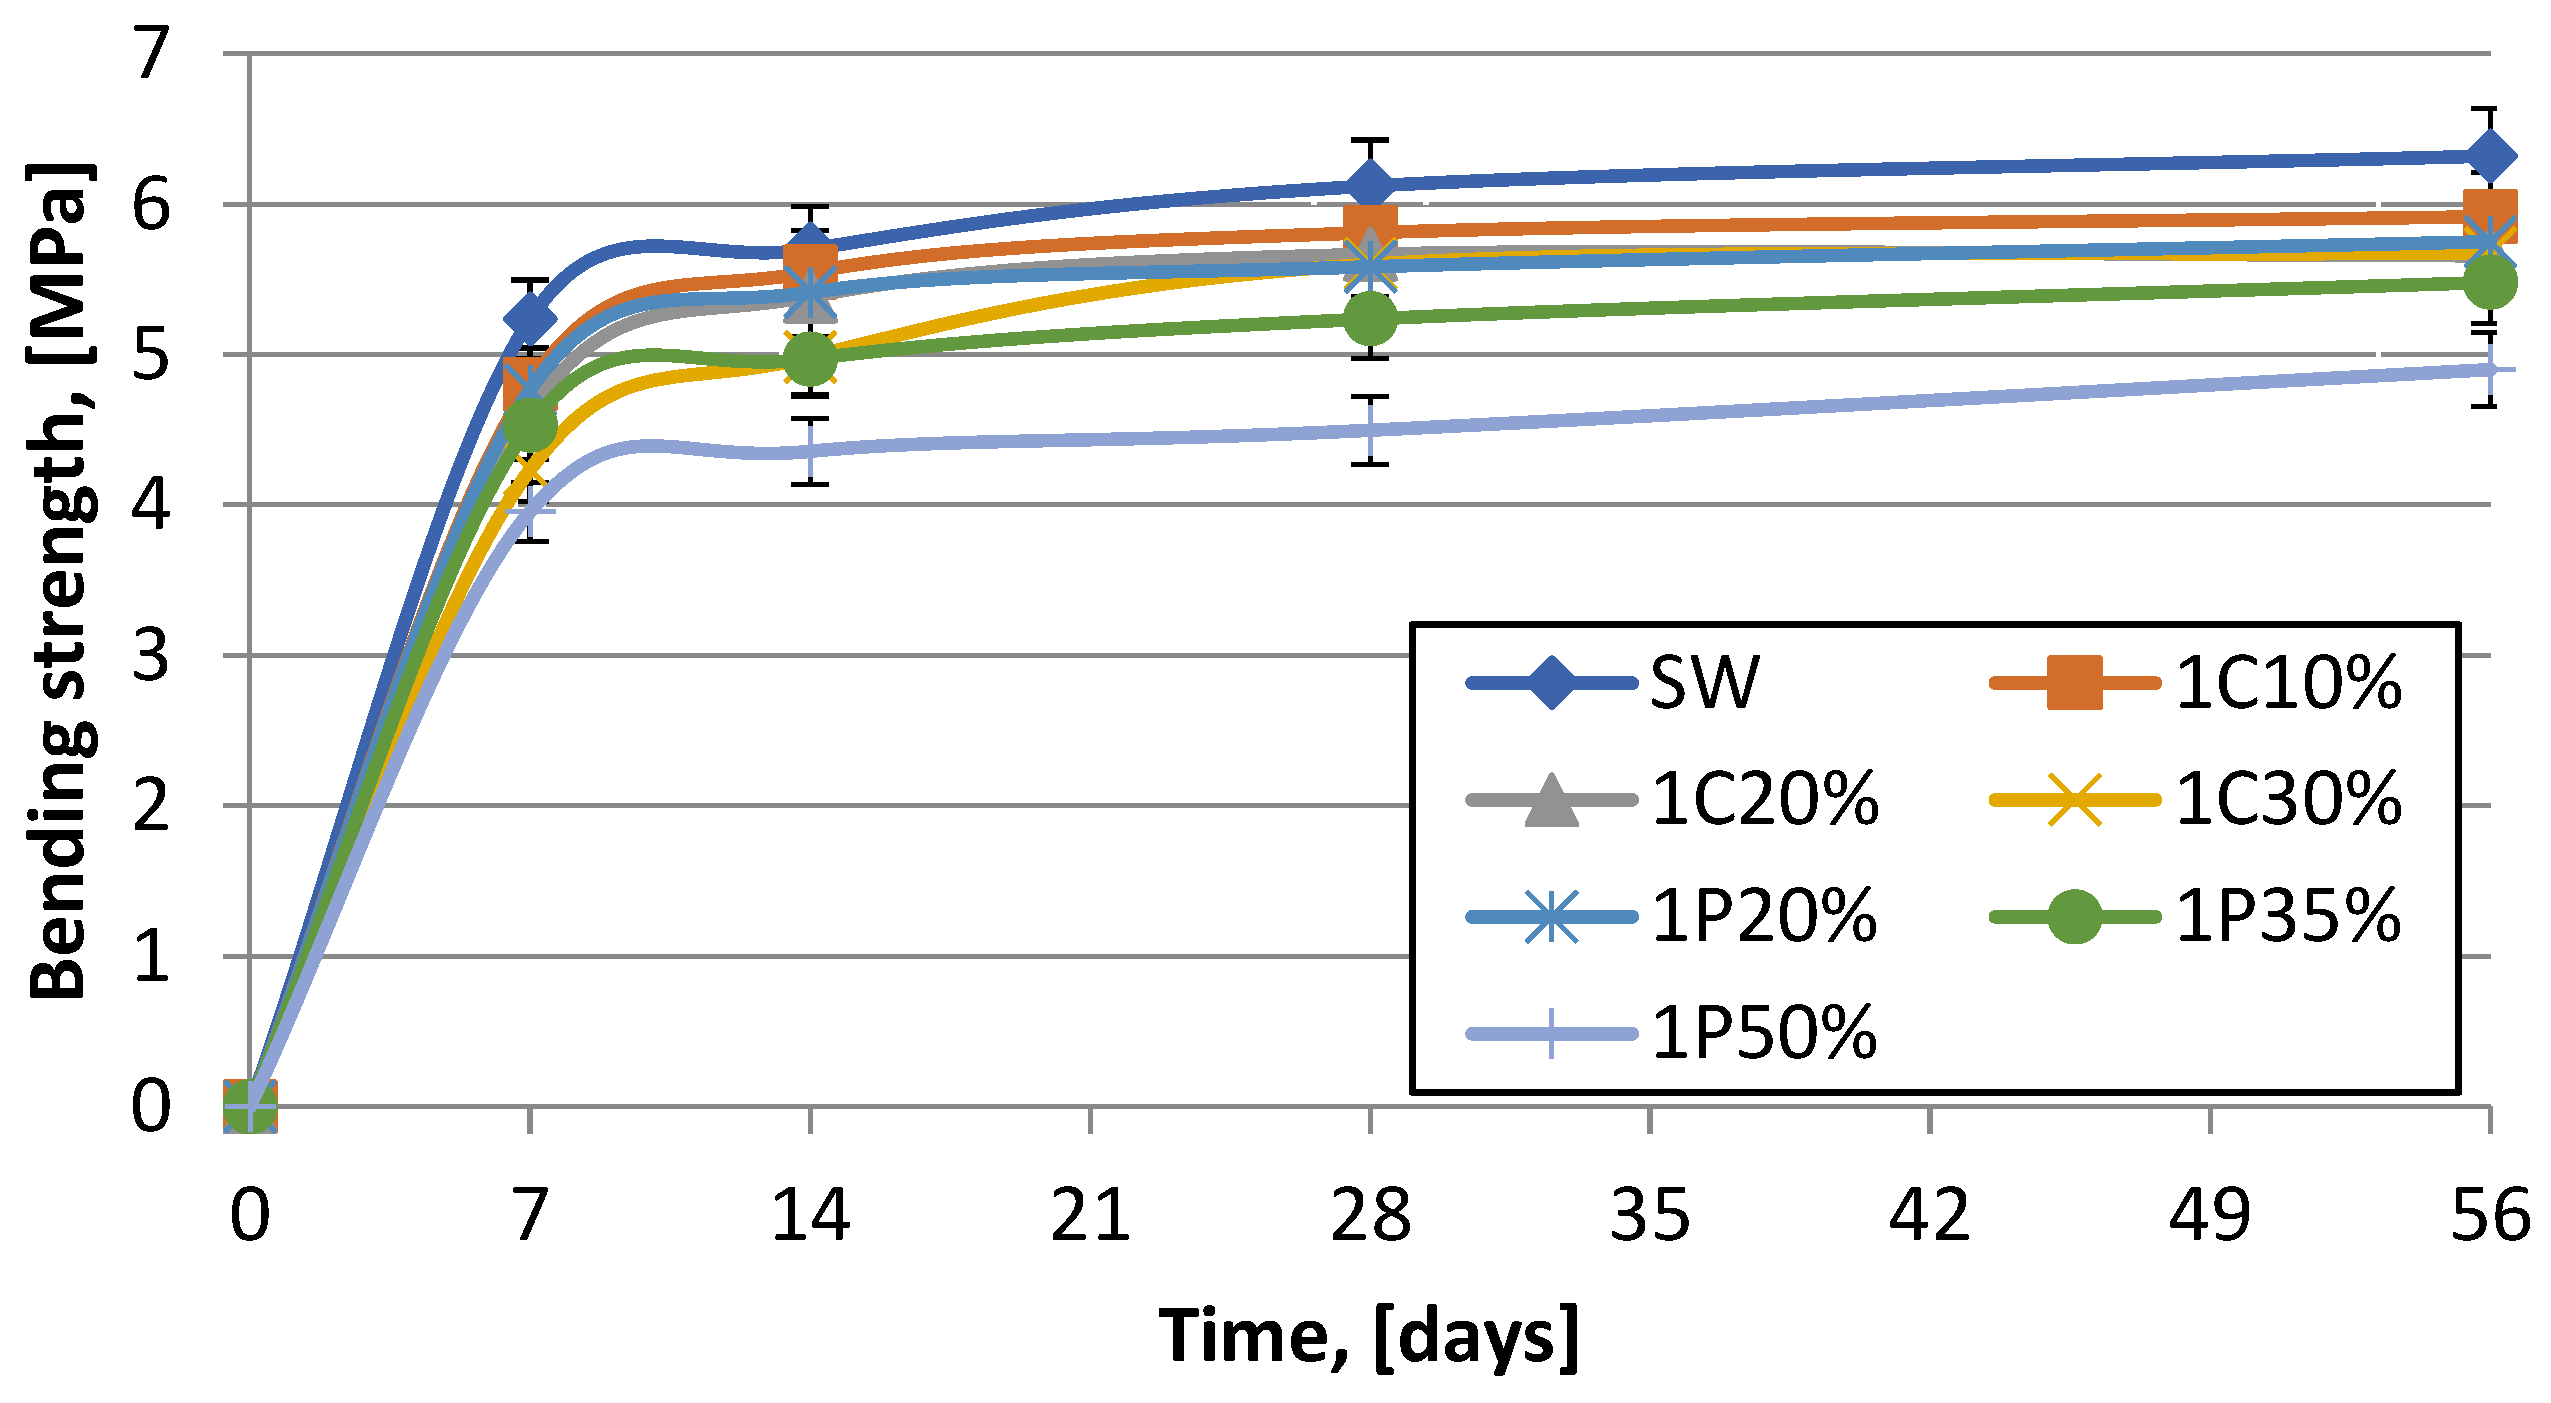
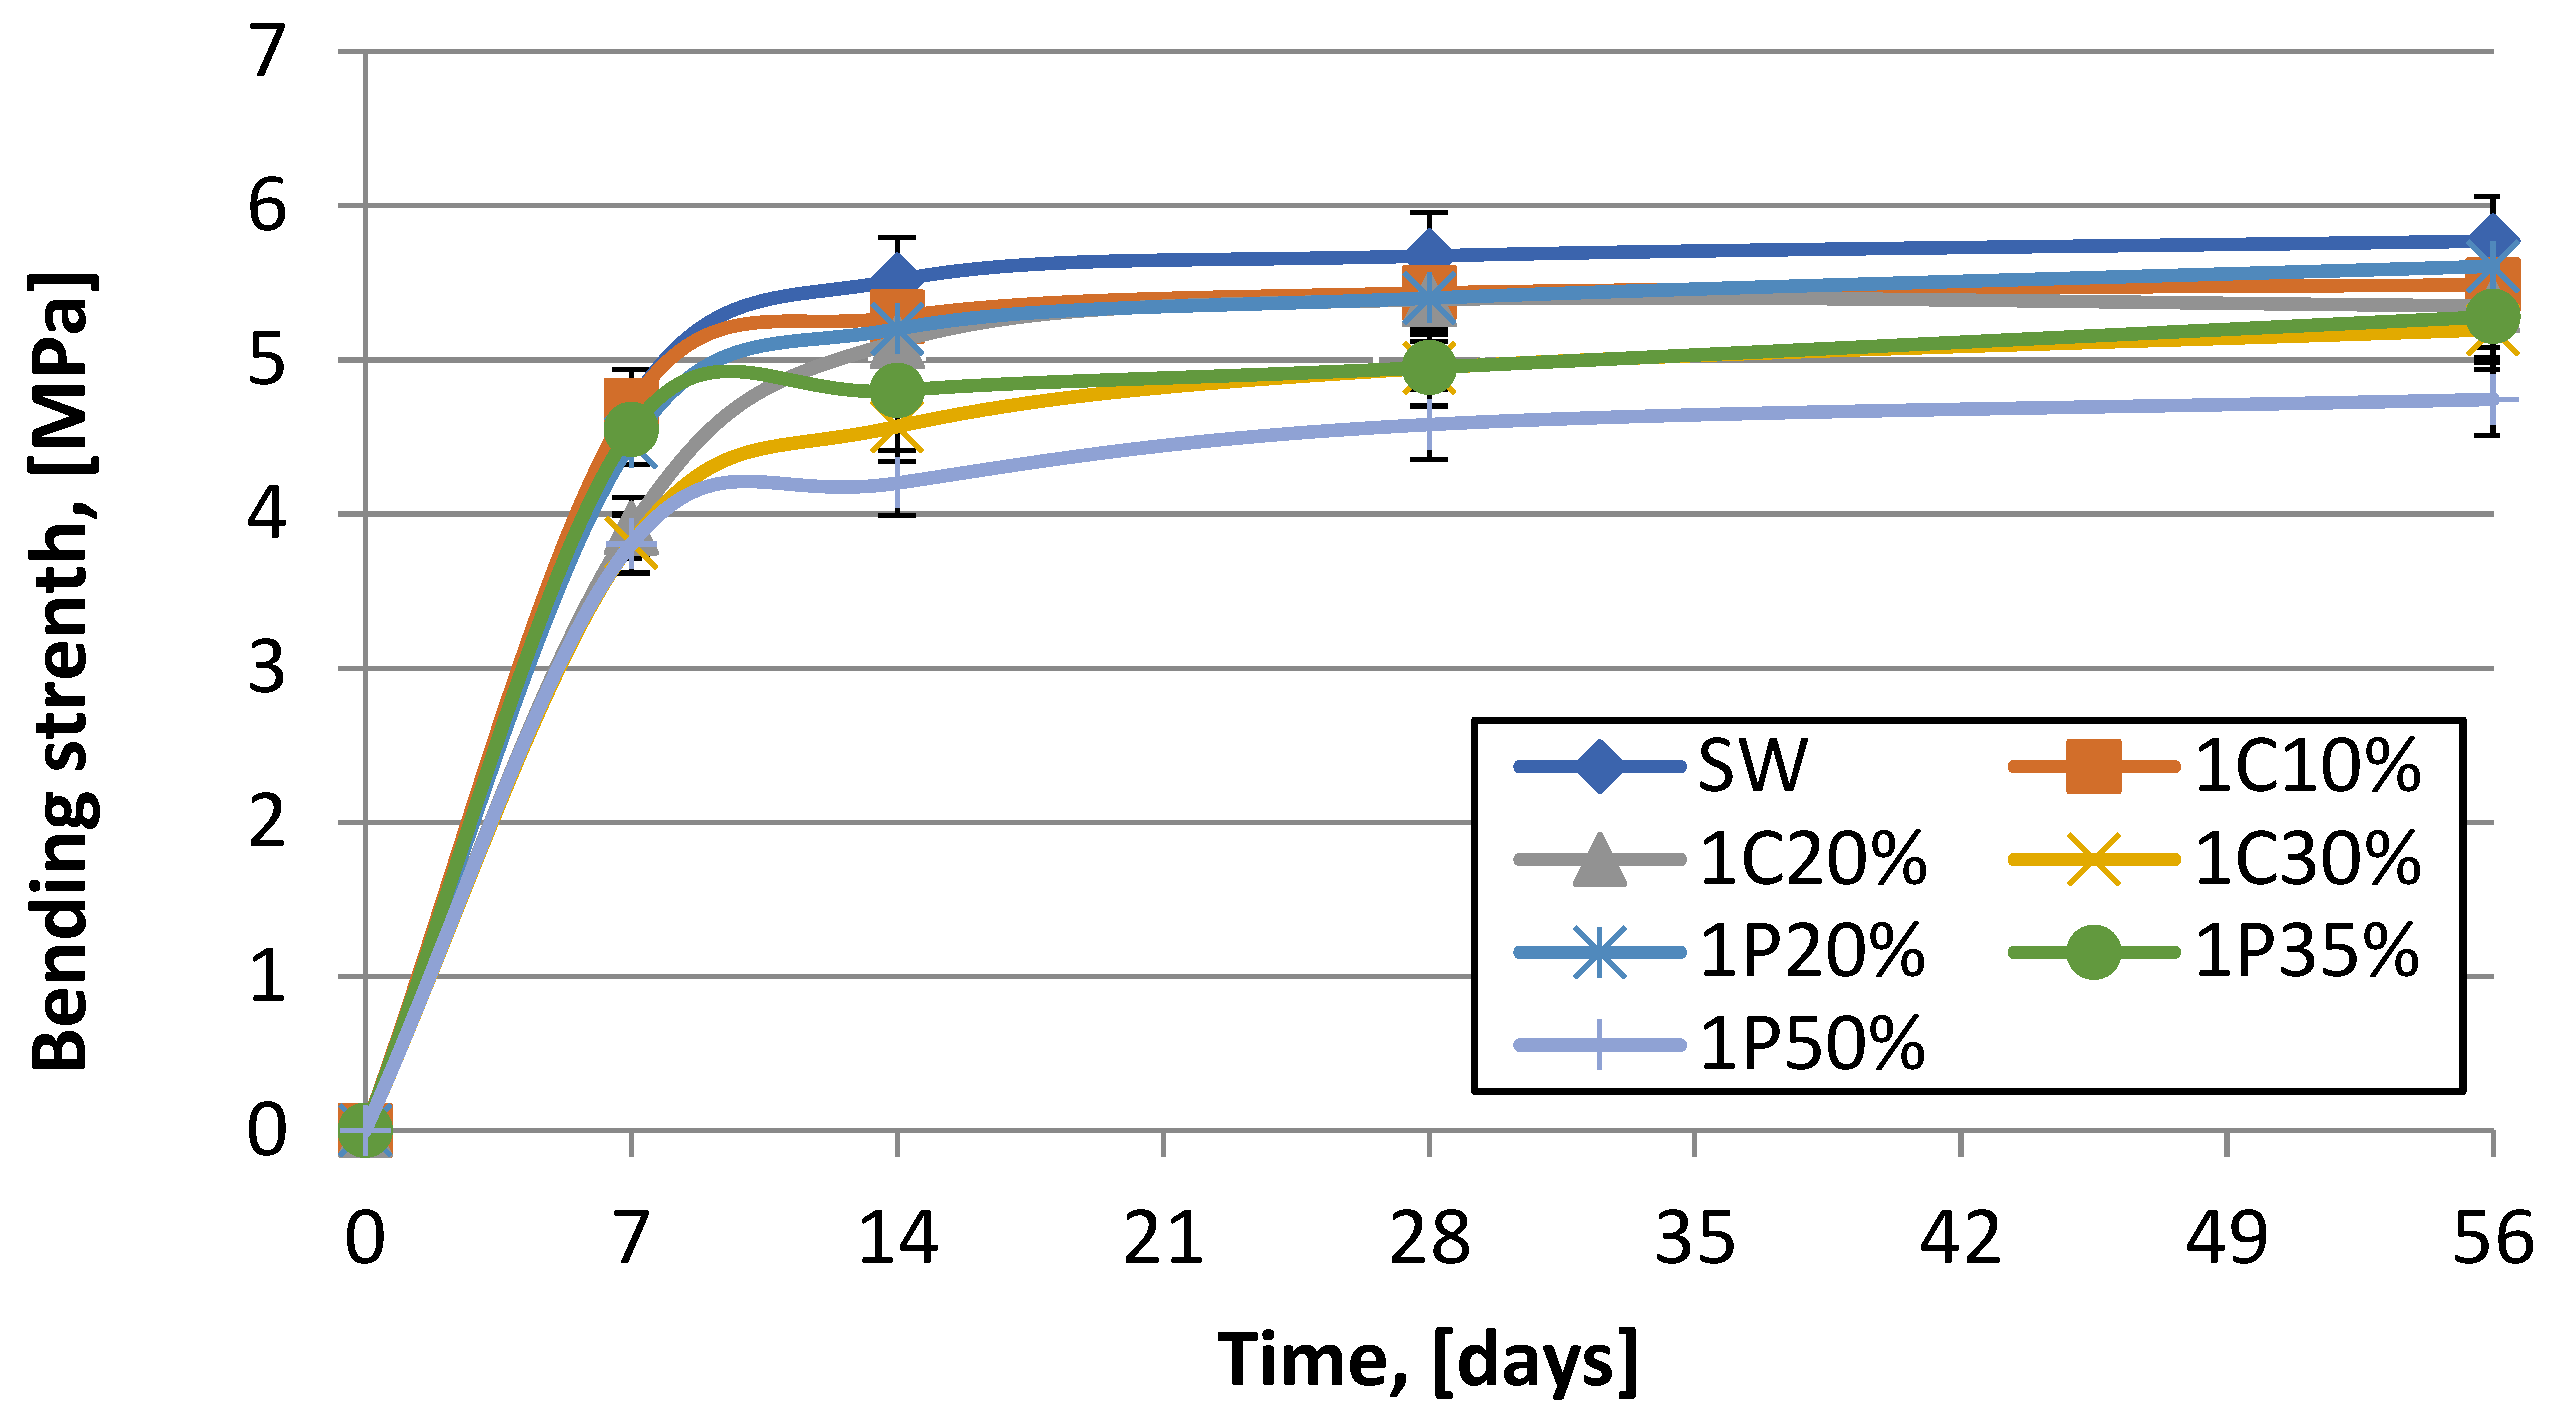
The flexural strength test was carried out in accordance with PN - EN 1015-11:2020-04 and is shown in Figure 9 and Figure 10 [26].
Comparing the maturation conditions of the series, it can be seen that the samples matured at varying temperatures recorded decreases in flexural strength ranging from 6-8% compared to the series matured under laboratory conditions. The 1C20 and 1C30 series recorded a 9% decrease in strength, while the 1C10 series recorded a 6% decrease after 56 days of maturation. When considering the series in which sand was replaced by flour, the greatest reduction in flexural strength was recorded for series 1P50% at 25%. The prolonged maturation time did not improve this parameter positively.
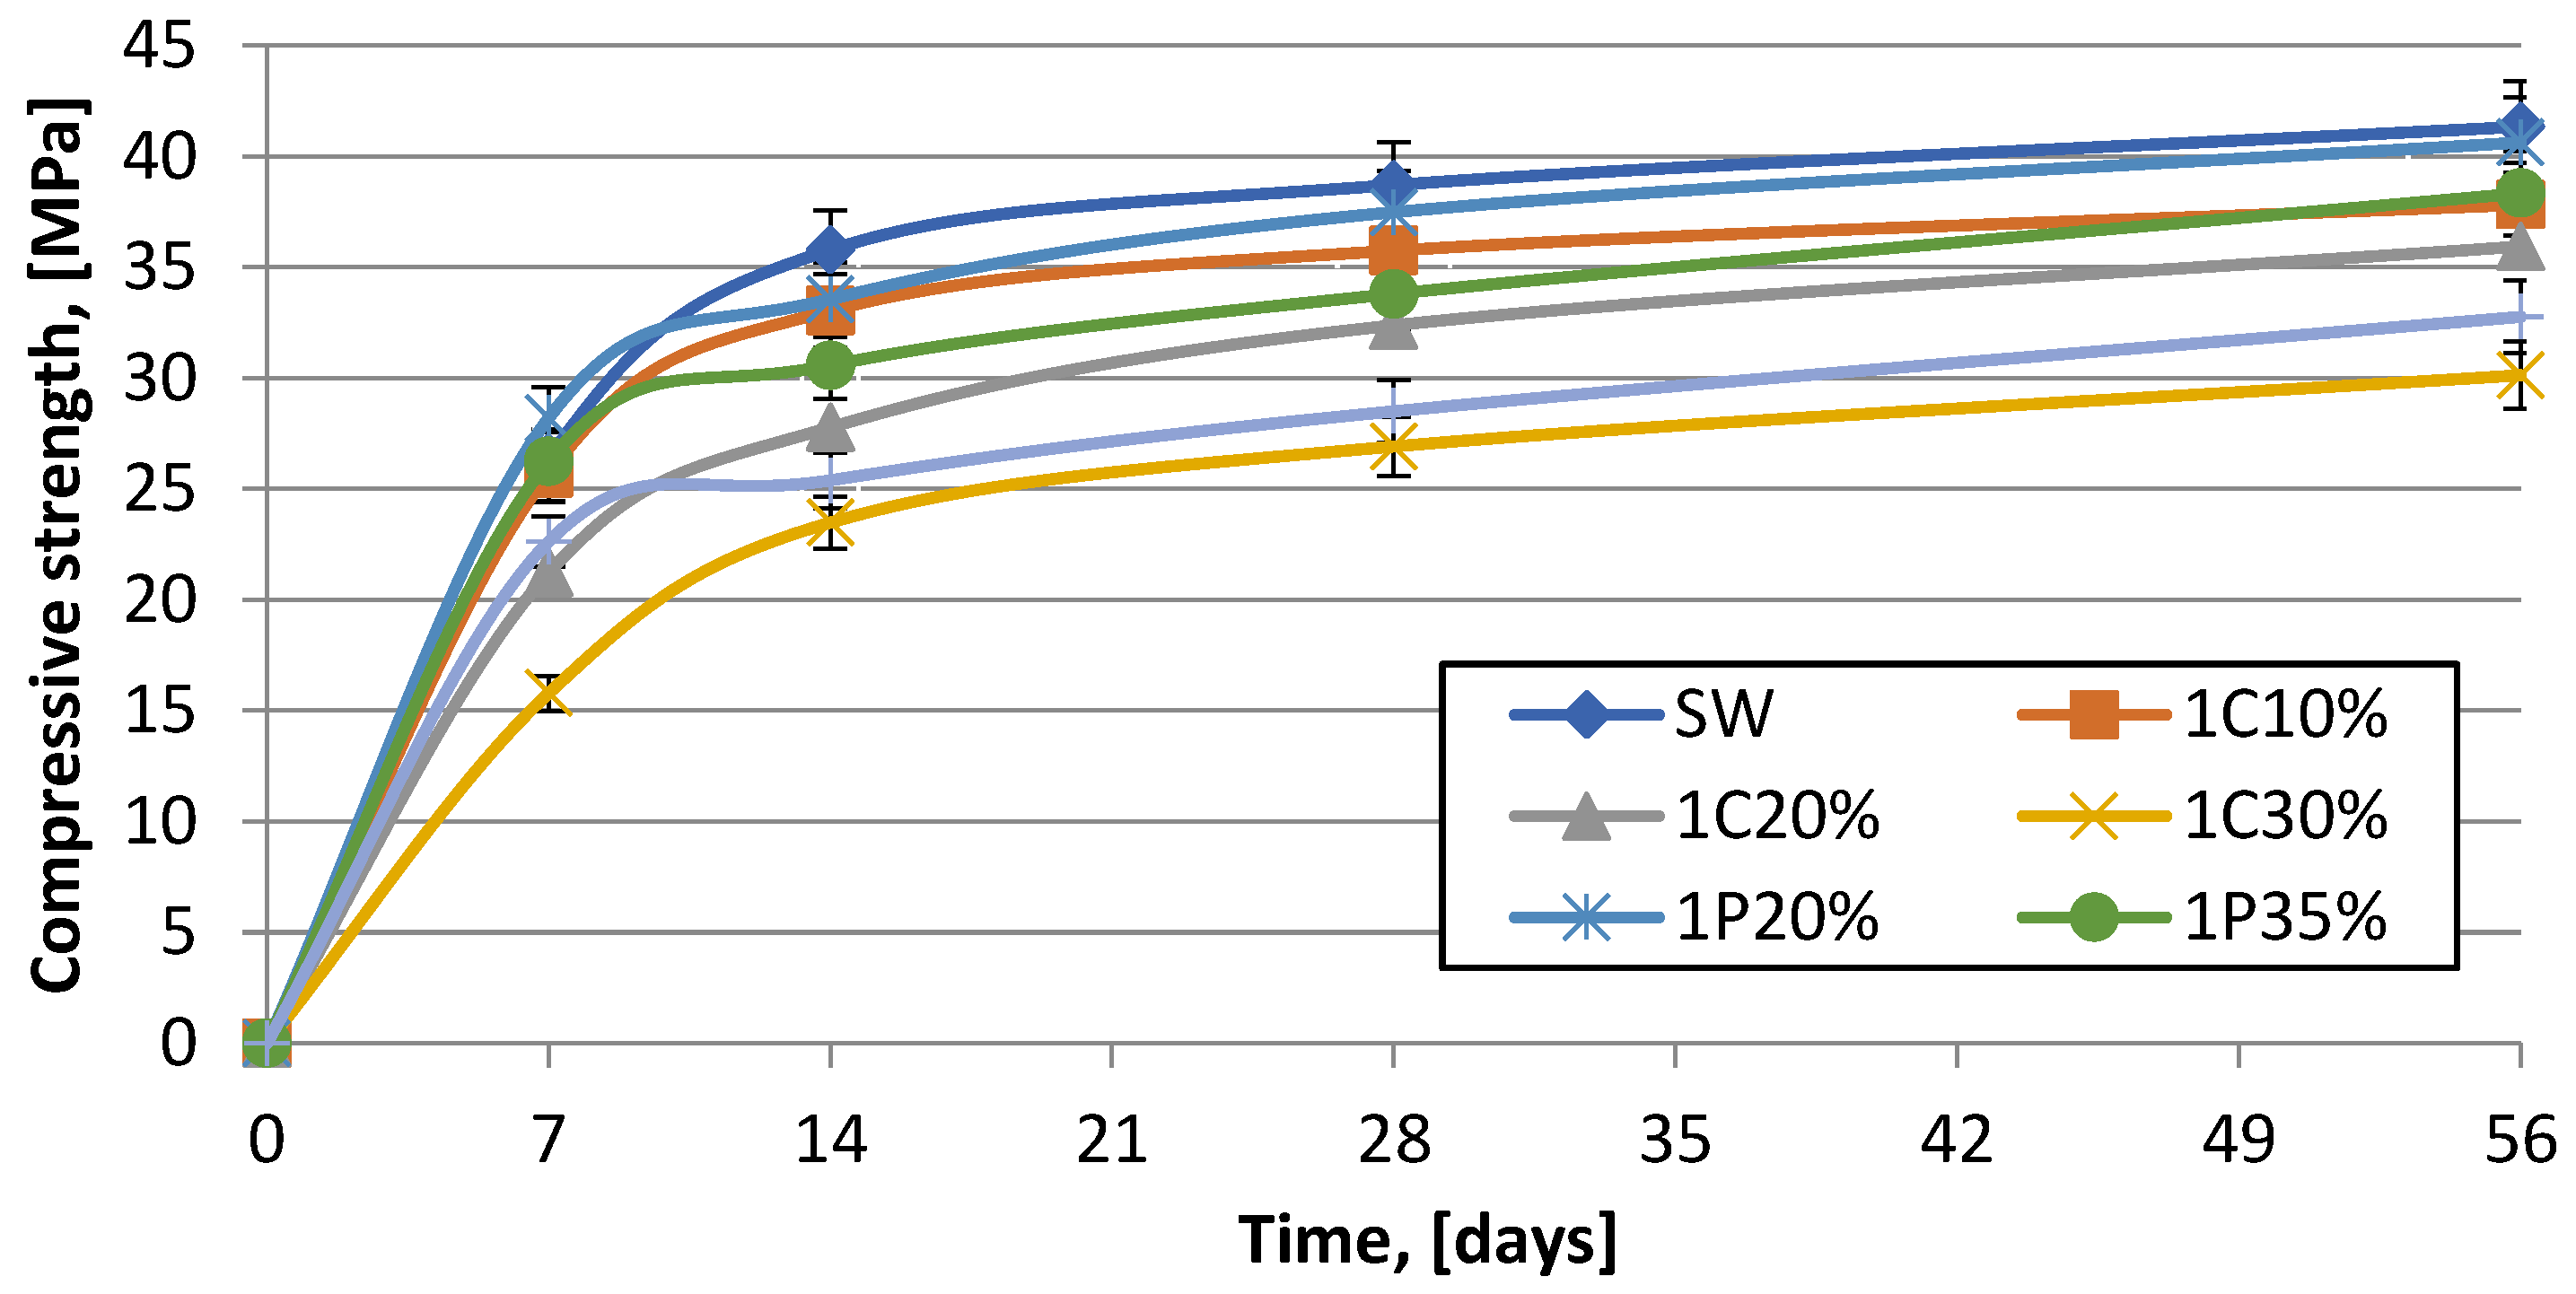
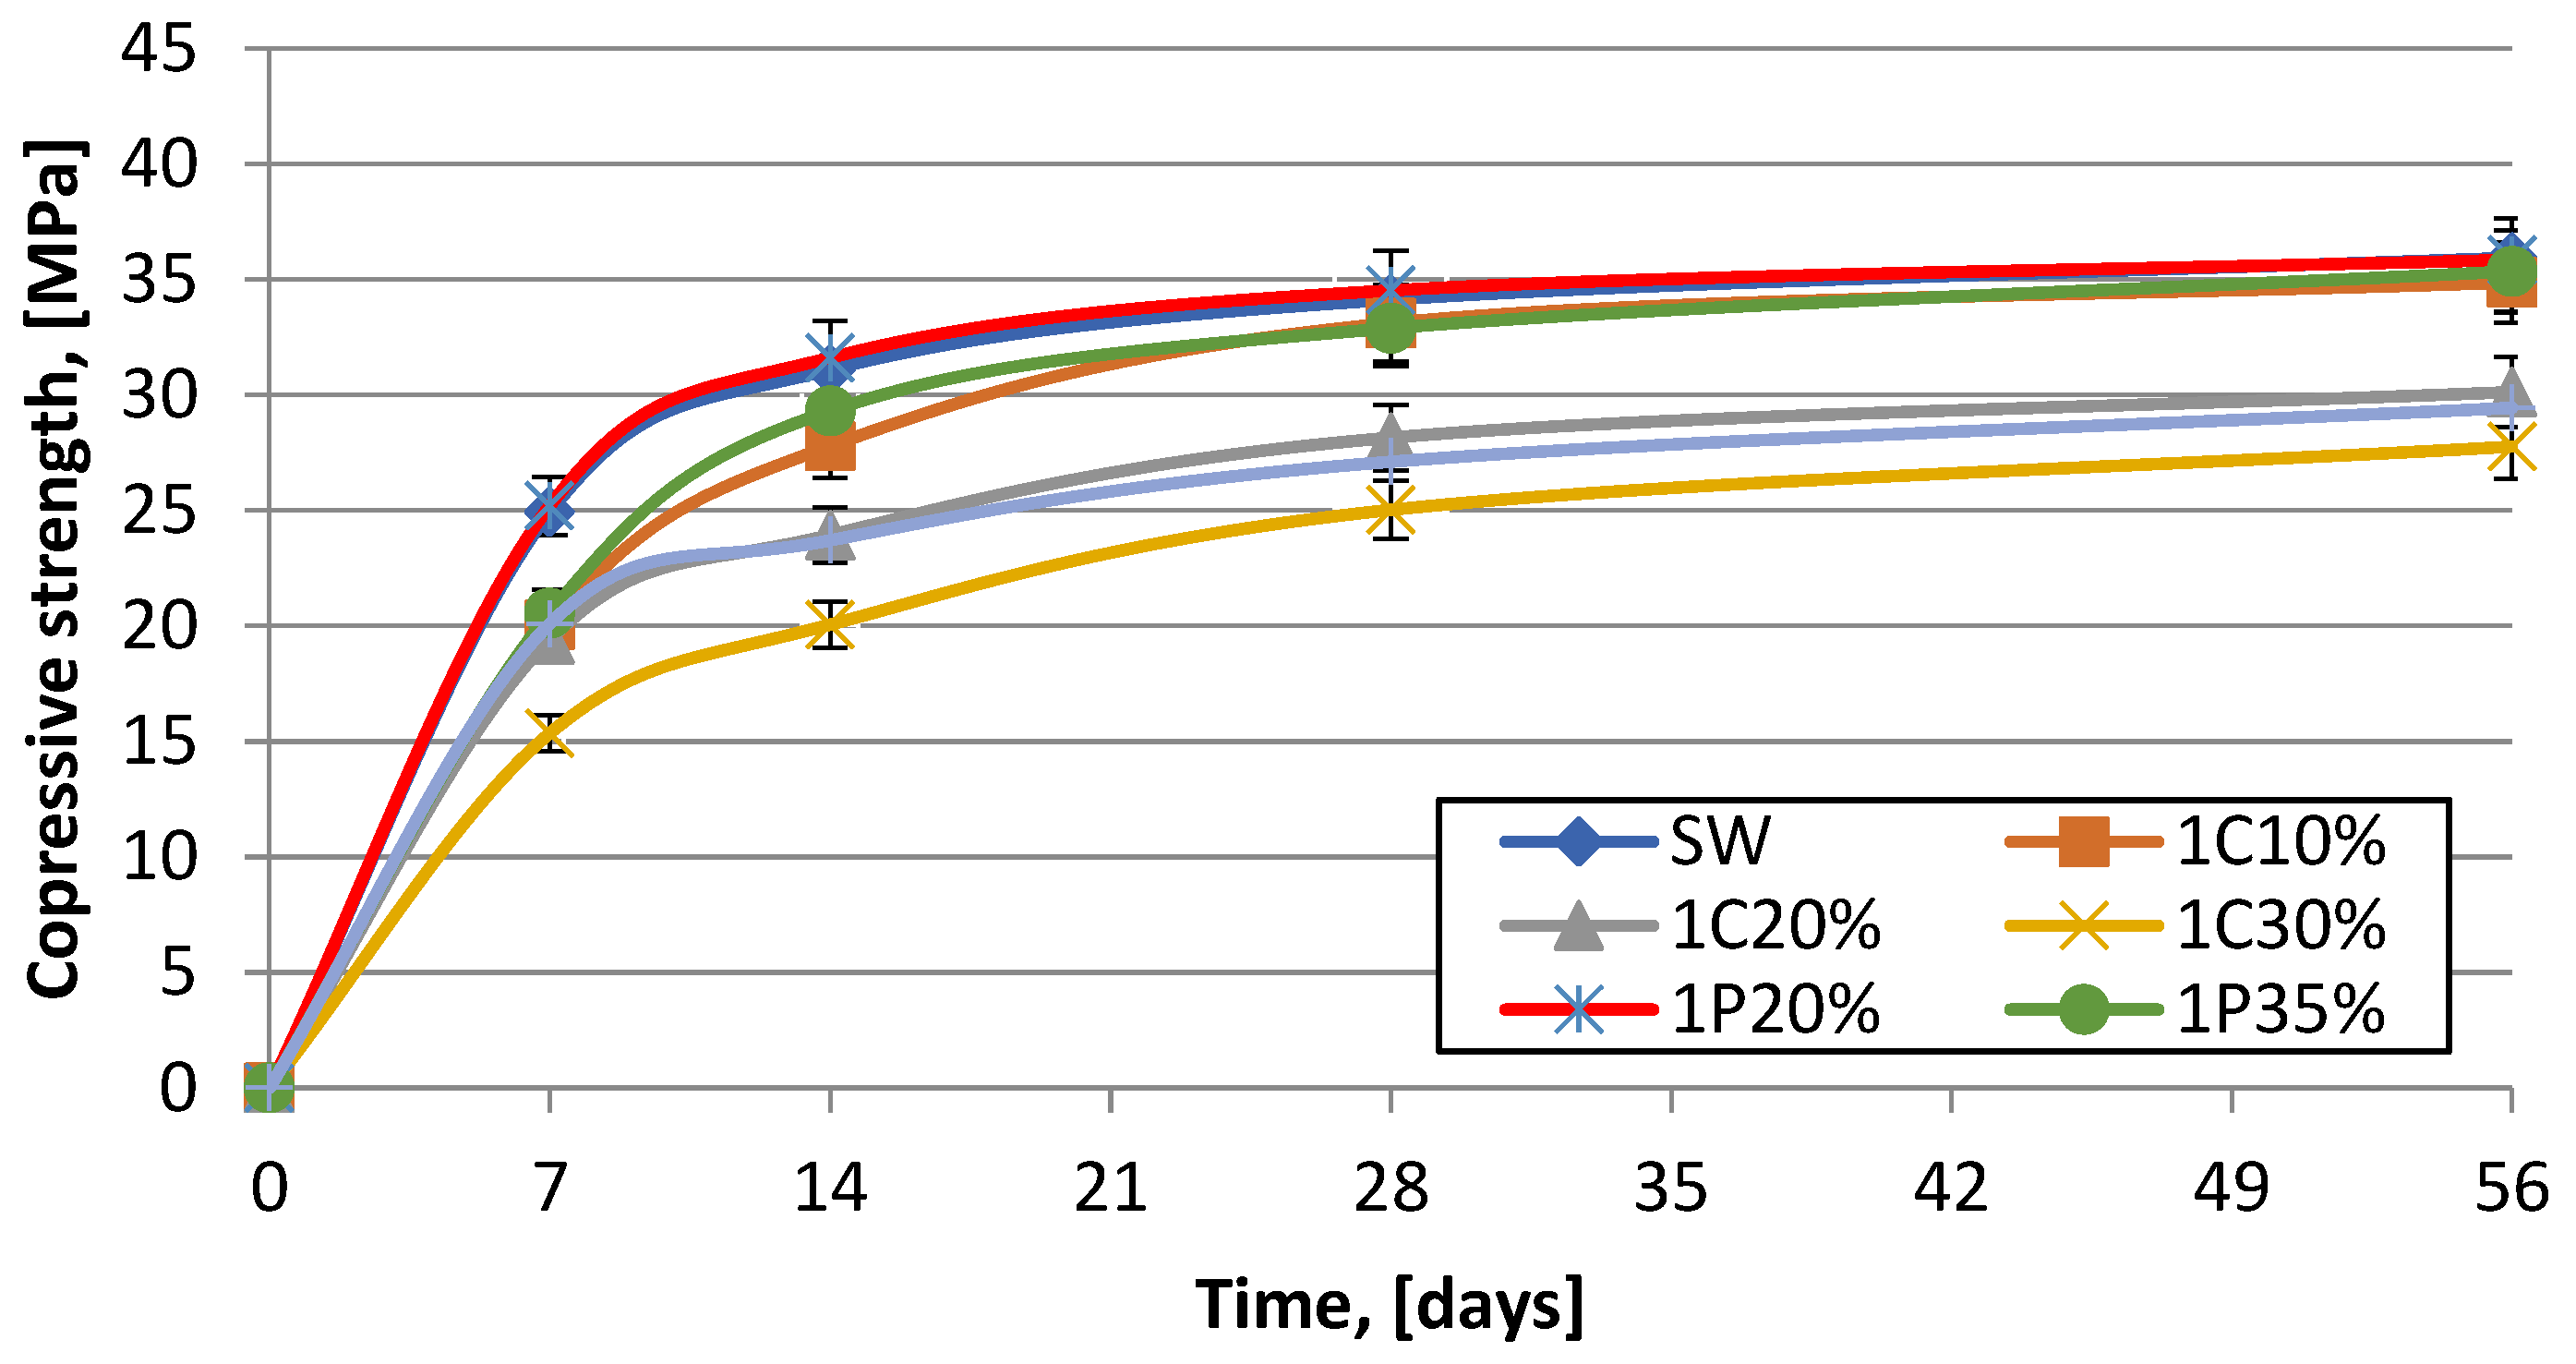
The compressive strength test was carried out in accordance with EN 1015-11:2020-04, [21].
Figure 11. Compressive strength for mortars matured under laboratory conditions.
Preprints 142833 g011
Figure 12. Compressive strength for mortars matured under varying weather conditions.
Preprints 142833 g012
Starting with a comparison of the maturation conditions of the tested series, we find that the samples matured at variable temperatures are characterised by a decrease in compressive strength of 13%. The smallest decrease in compressive strength is characterised by the series in which cement was replaced by glass dust at 10% and this decrease is 8.5%. The largest for series 1C30%, i.e. 27%. Comparing the series with sand replacement. The reference series and the 1P20% series received comparable compressive strength gain results. The 1P50% mortar showed the greatest decrease in compressive strength at 20.5%.
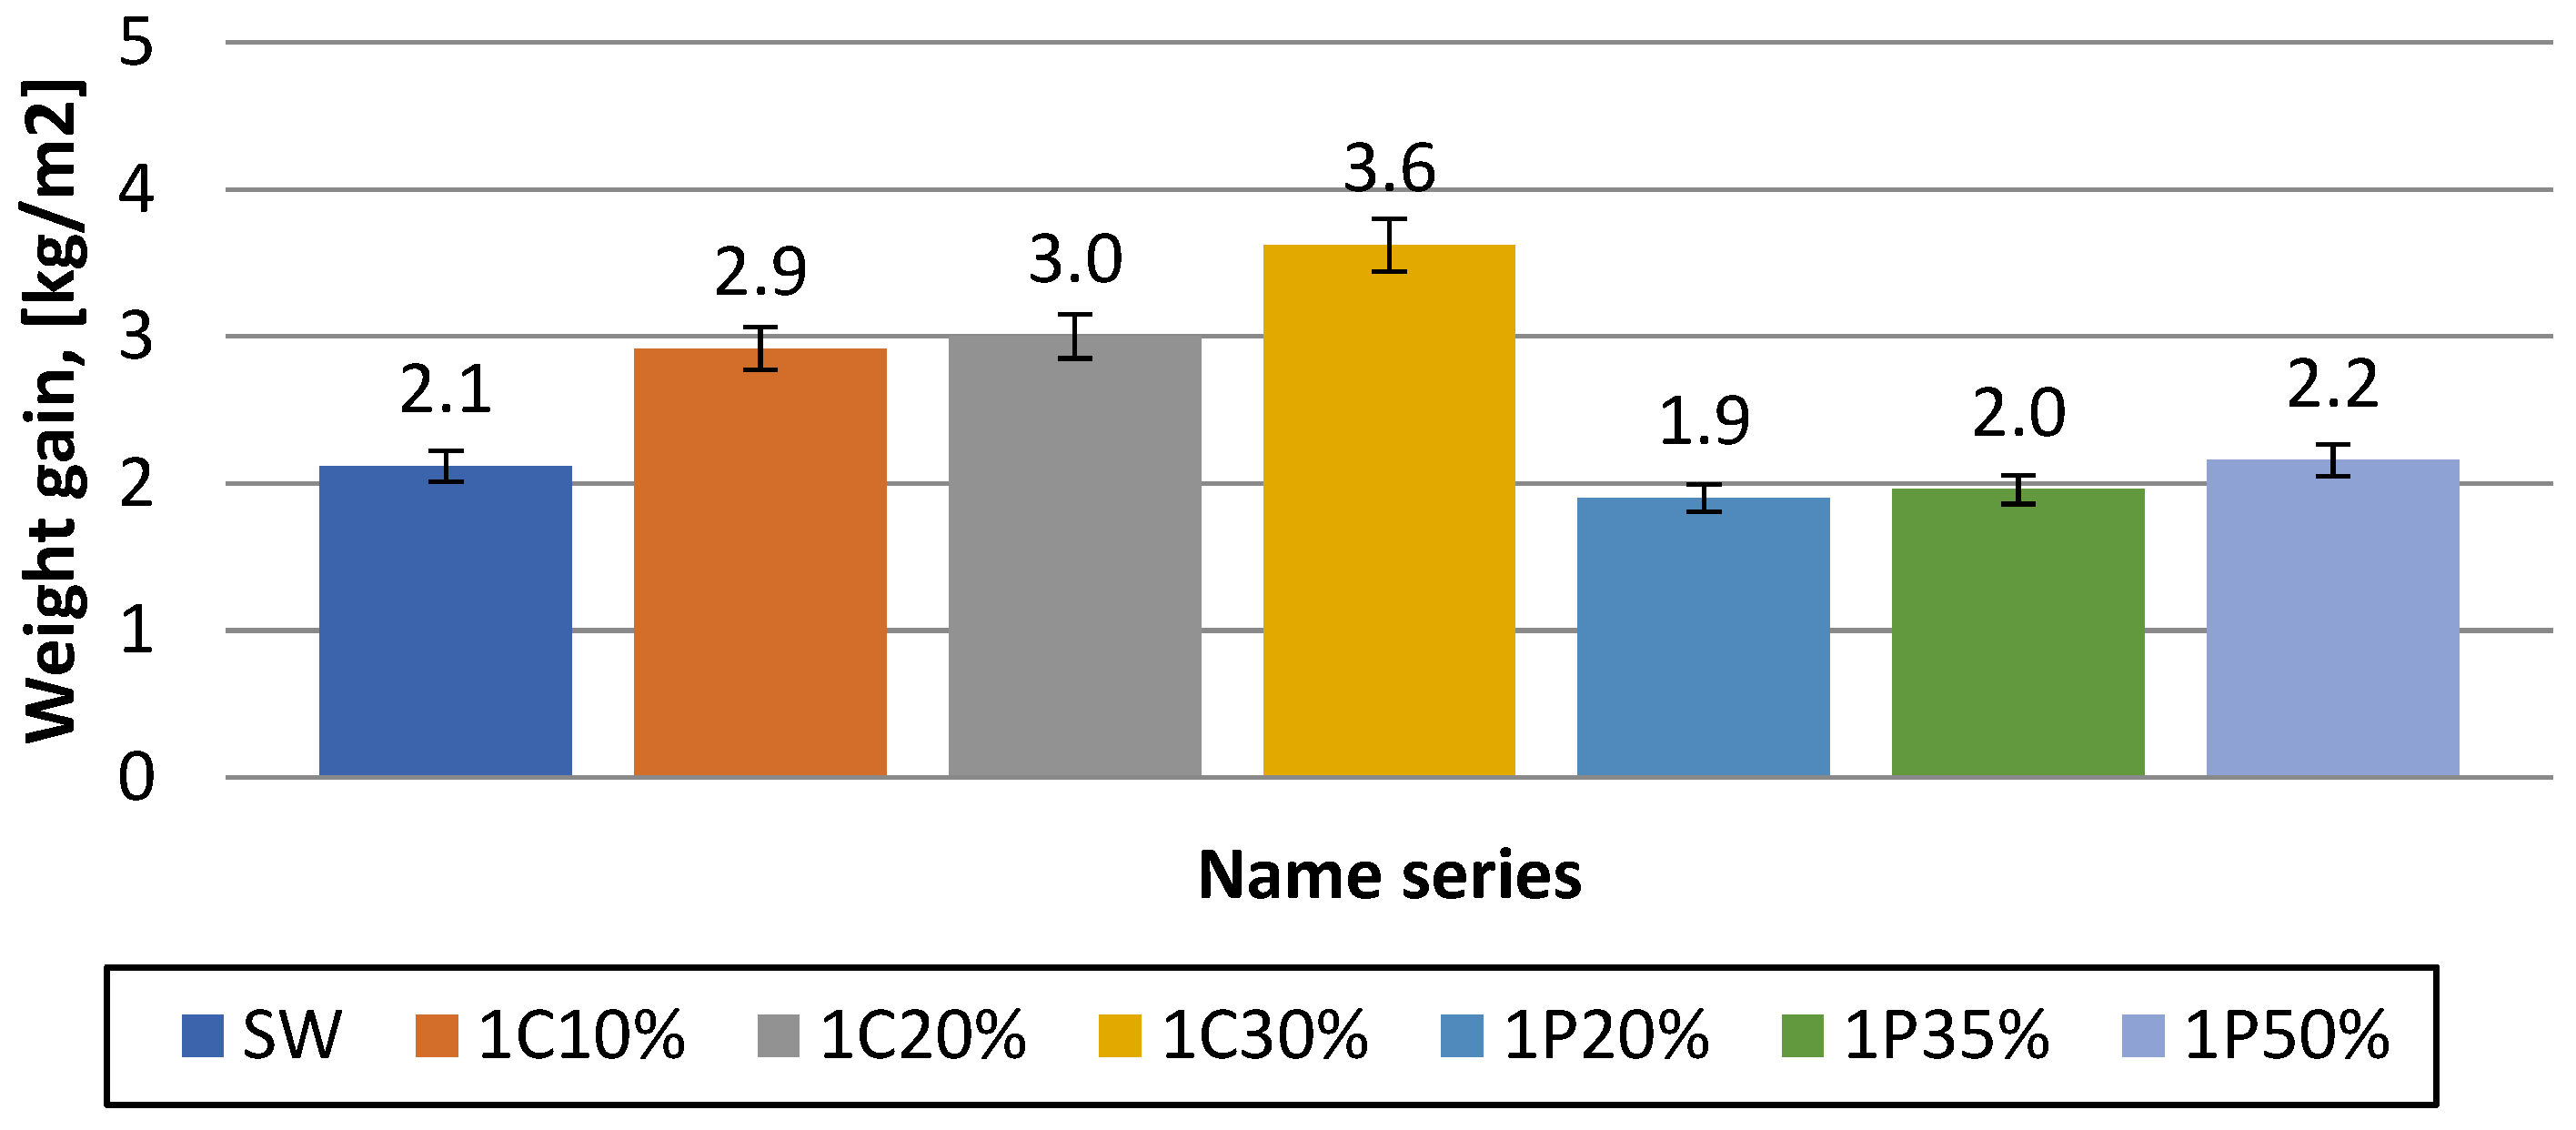
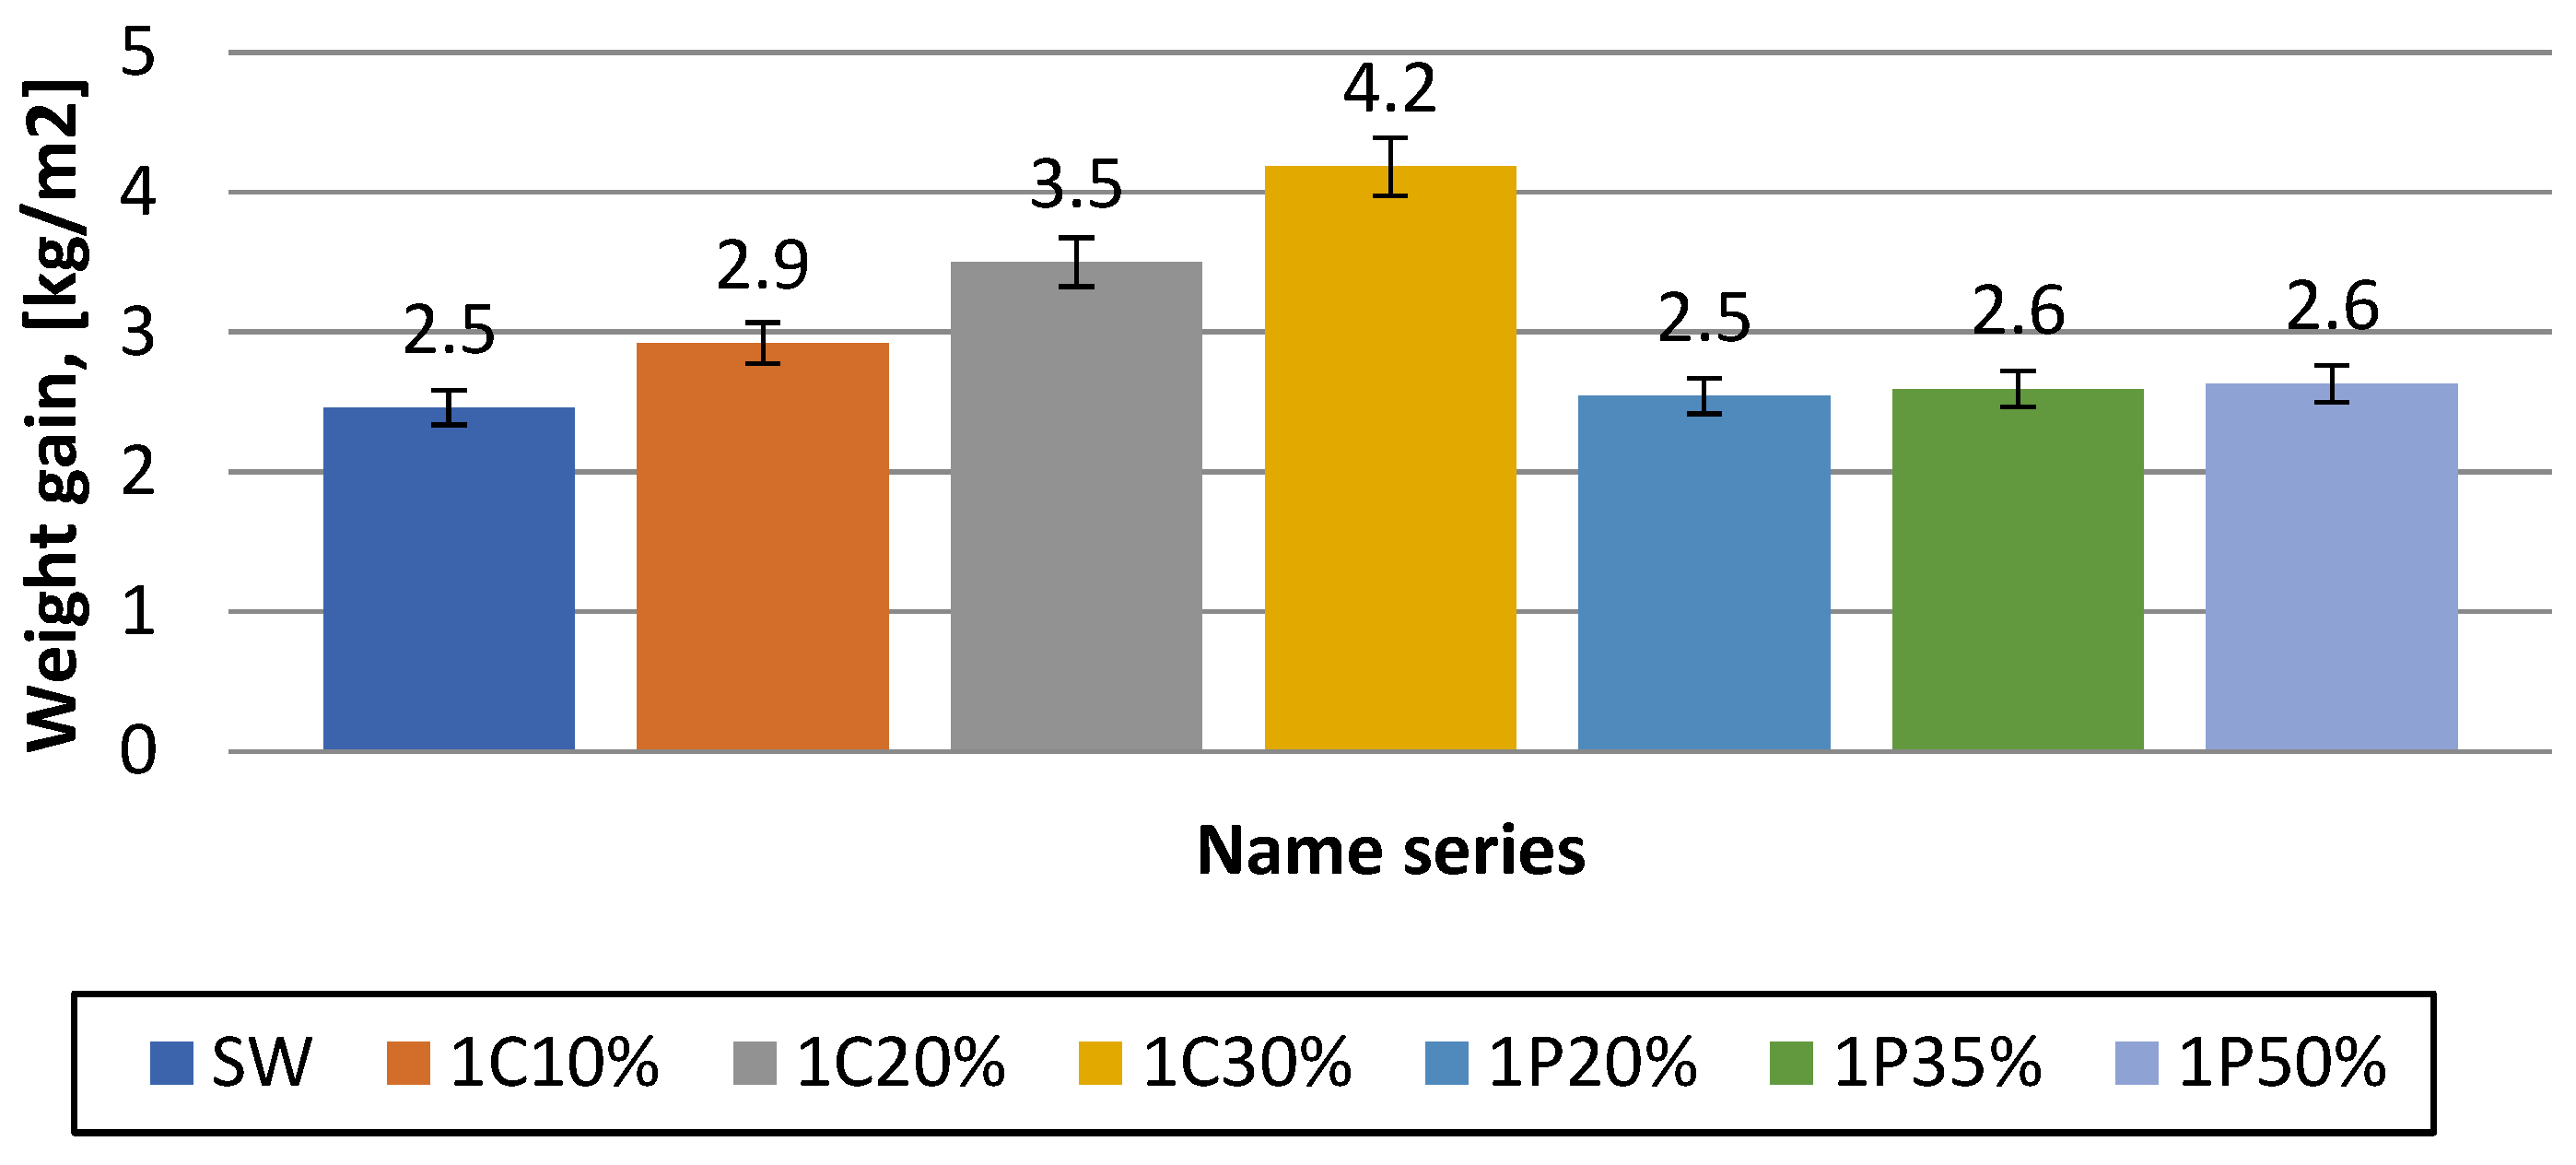
Capillary rise was tested in accordance with EN 1015-18:2003, [26] on 40 x40 x160mm specimens (Figure 13 and Figure 14).
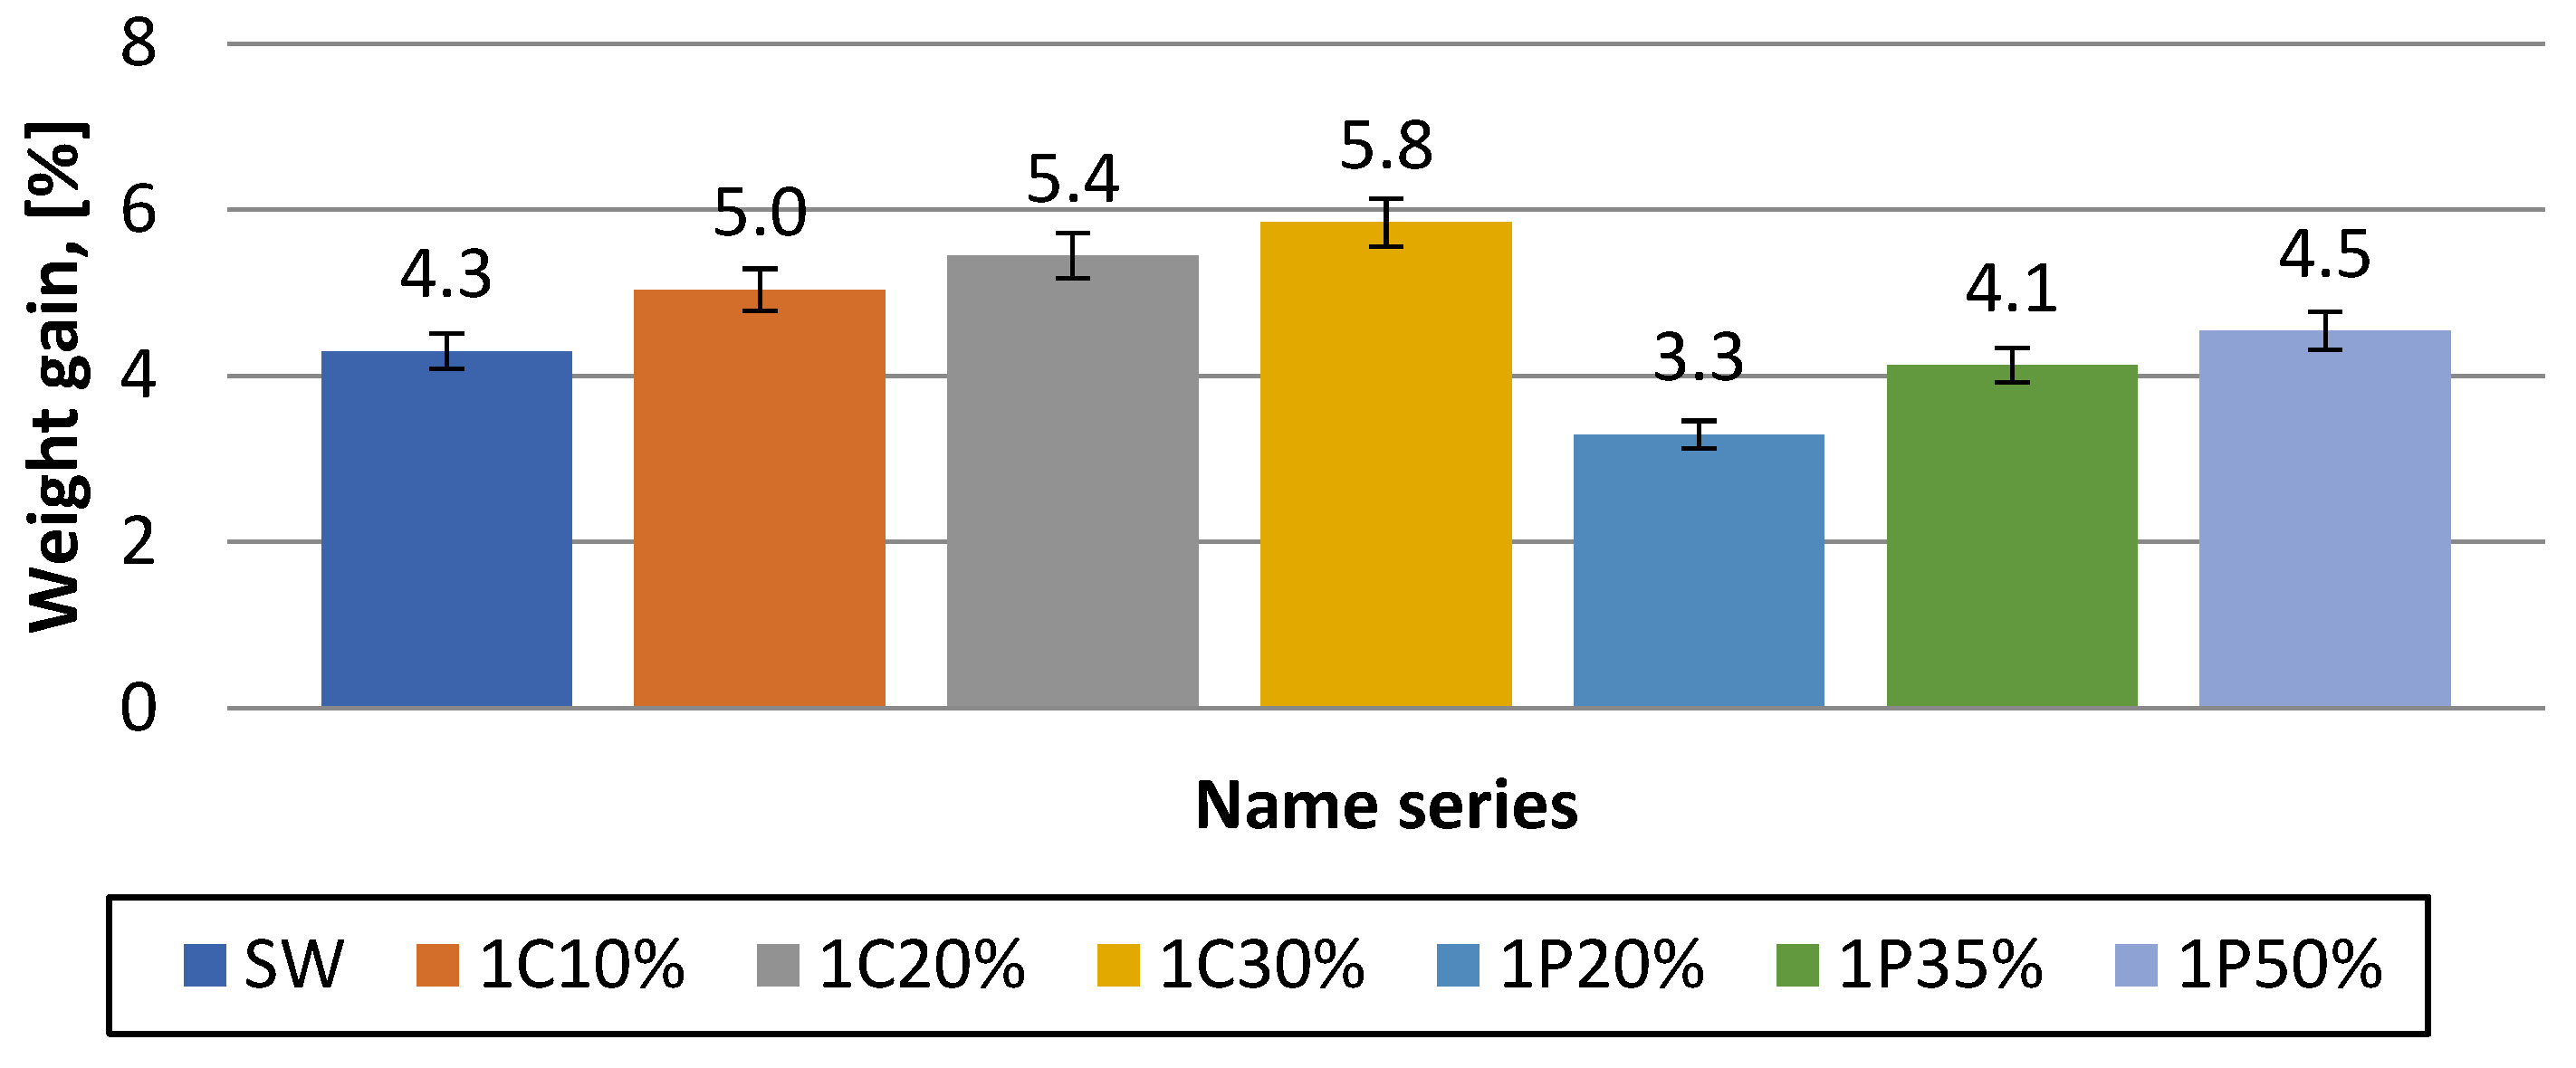
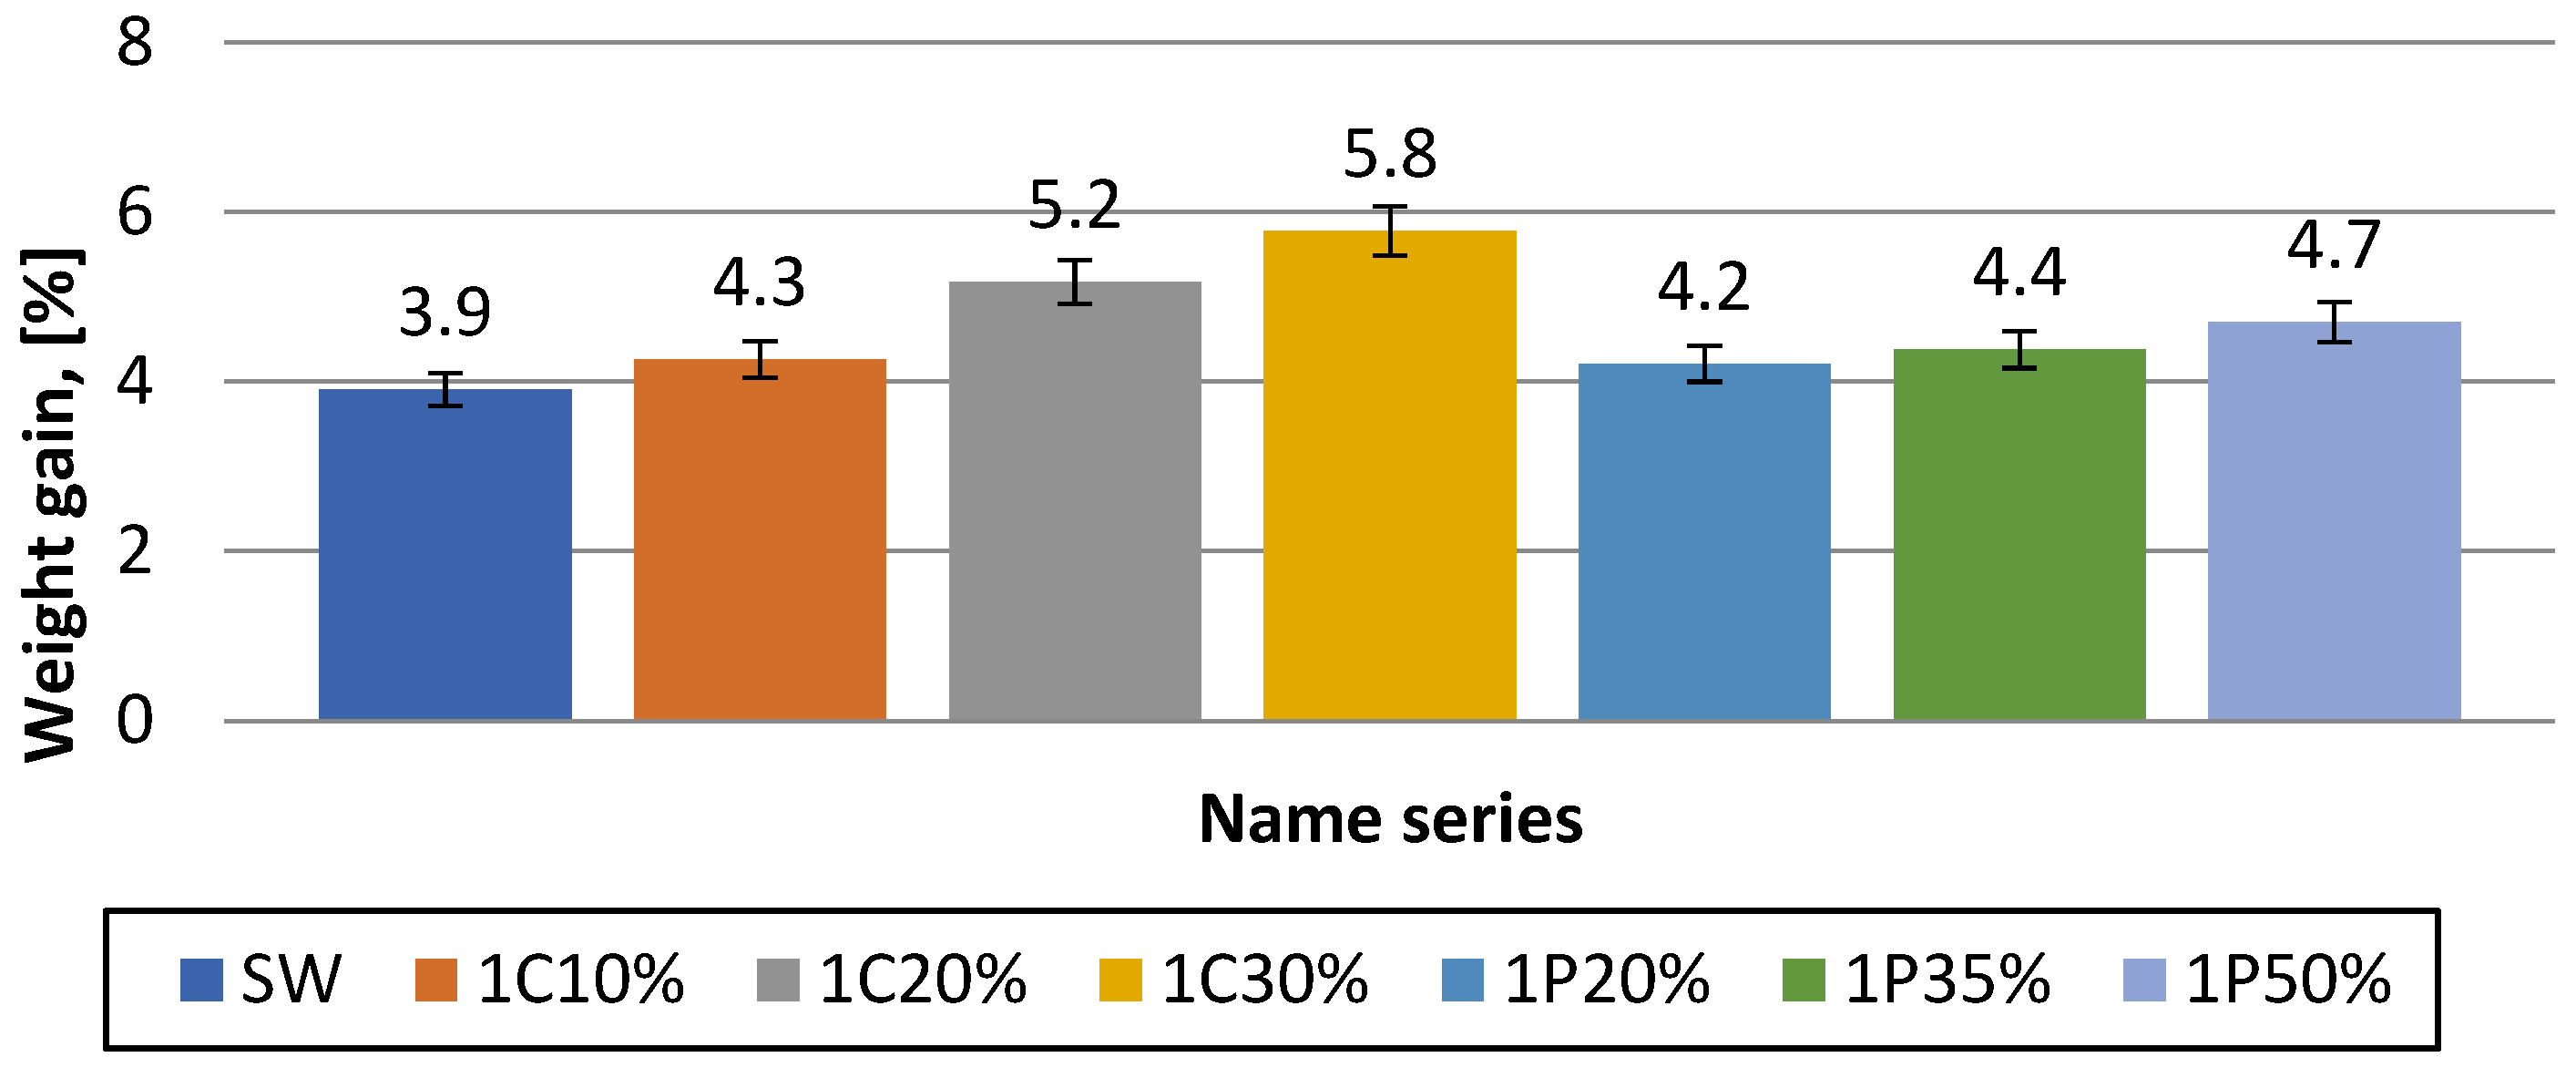
The series matured under varying temperatures have a higher weight gain of the samples in the test. The reference series has a similar weight gain to the 1P20%, 1P35% and 1P50% series. The more cement replacement the greater the weight increase in the mortar capillary rise test. The largest was recorded for the 1C30% series.
The water absorption was tested according to PN-88/B-06250, [22] on specimens measuring 40 x40 x160 mm (Figure 15 and Figure 16).
Analysing the weight gain results obtained in the absorbability test, it can be concluded that mortars matured under varying temperatures were characterised by a higher weight gain. Mortars in which cement was replaced by glass dust showed a higher weight gain compared to the reference series. A similar trend was also observed for the mortar series in which sand was replaced by glass flour. The more flour instead of sand, the greater the weight gain in the series tested.
Figure 18. Microstructure area of the 1C30%/L mortar with analysed points.
Preprints 142833 g017
Figure 19. Chemical composition analysis of the point 4 area of the 1P35%/L sample.
Preprints 142833 g018
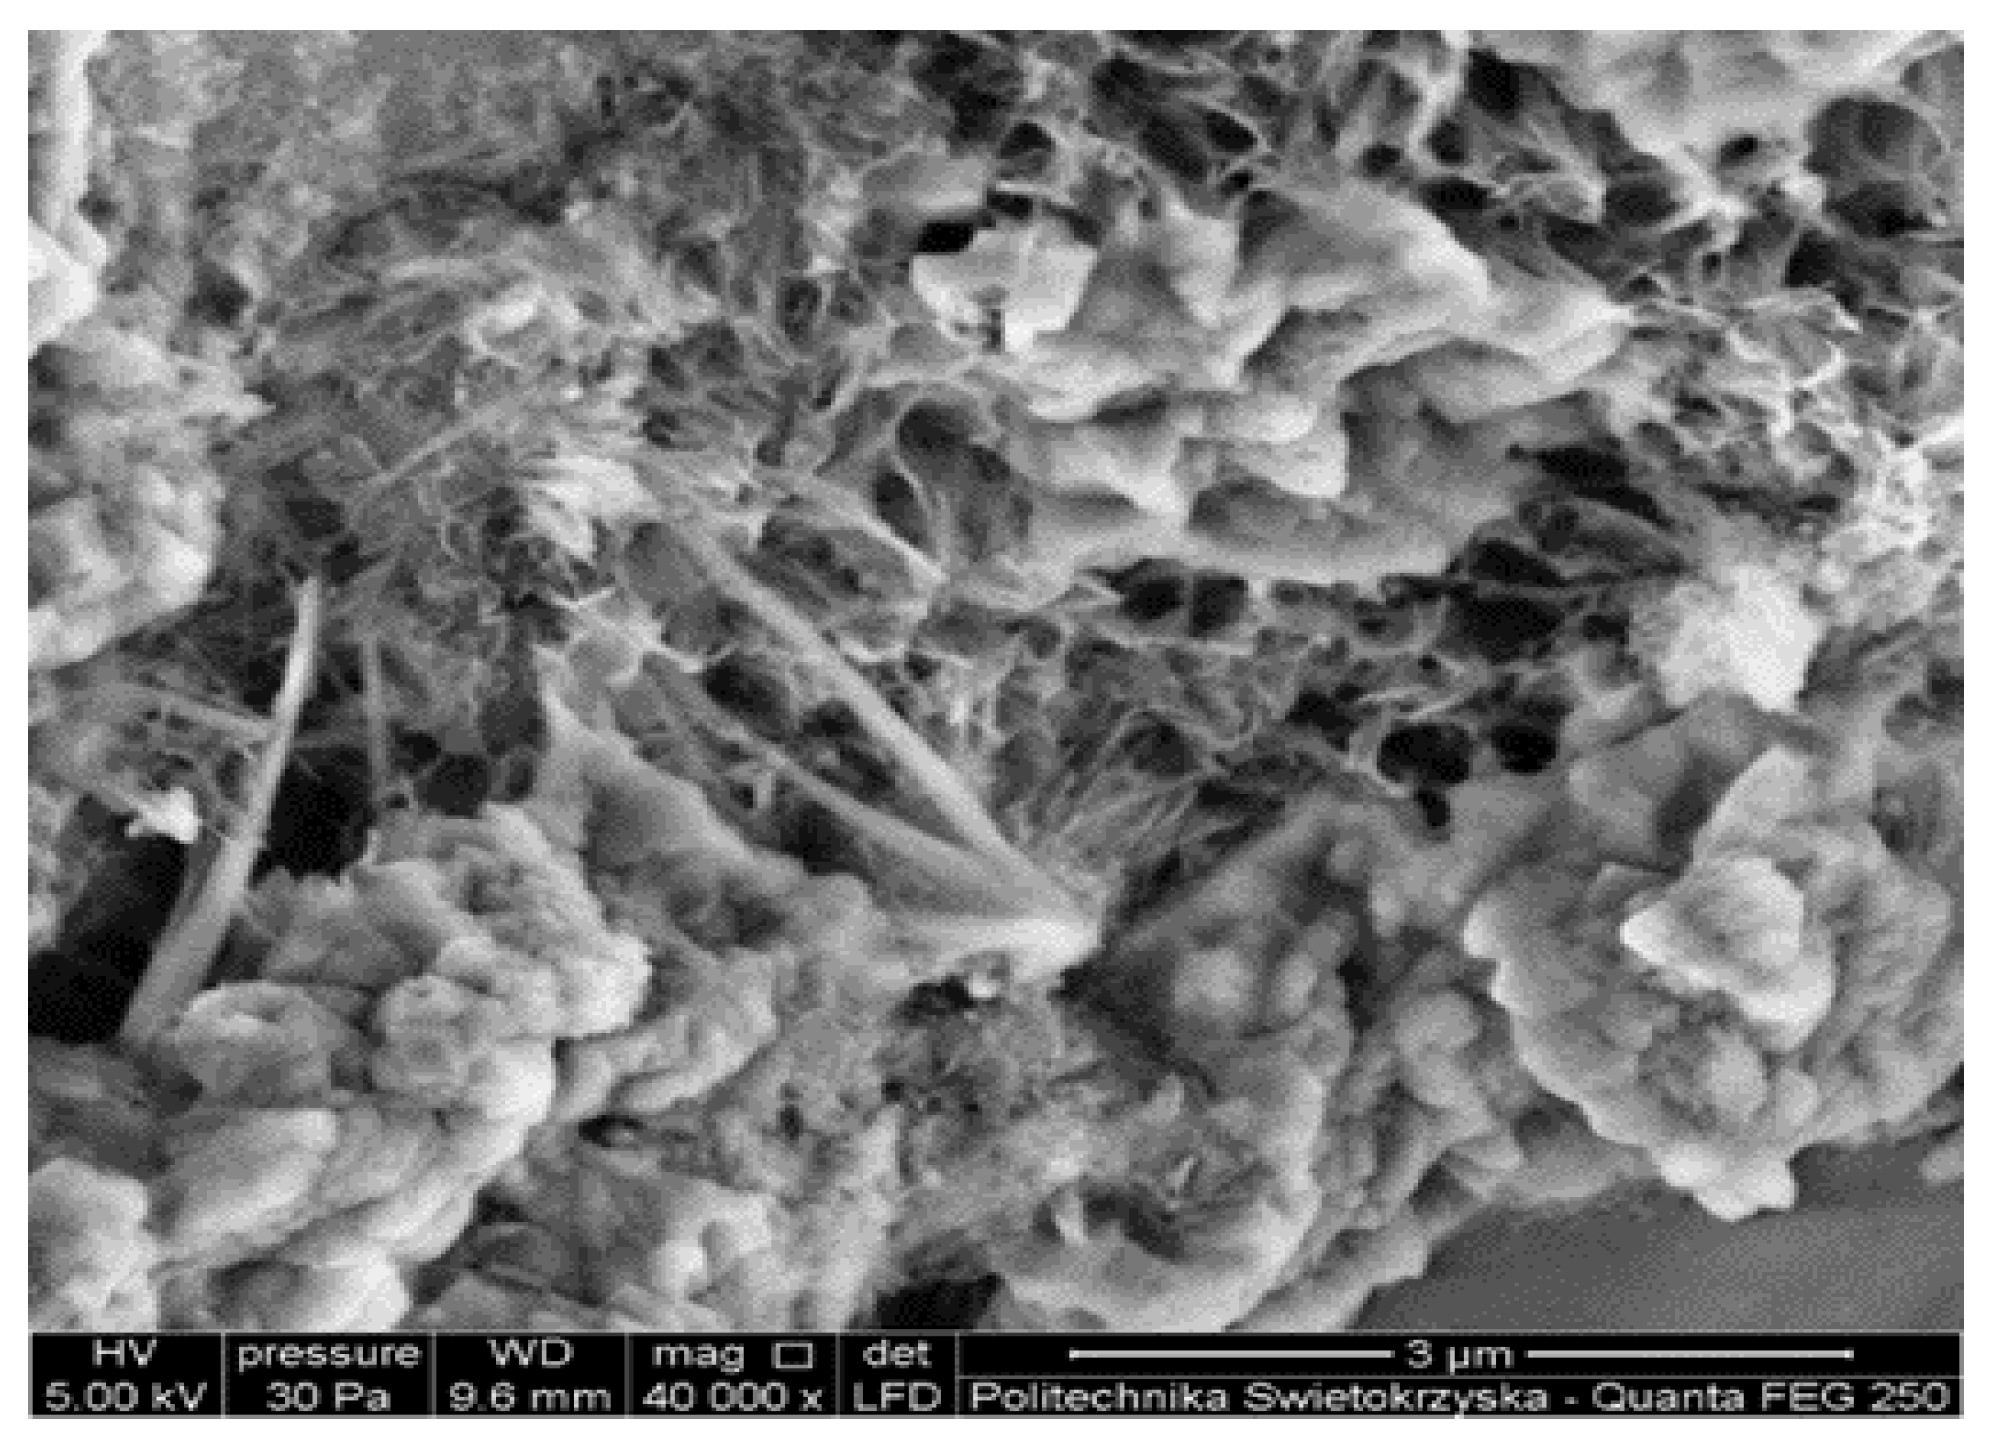
Figure 20. Hydration products of sample 1P35%/L.
Preprints 142833 g019
In the area of point 1 of the analysed sample, glass crystals were observed - glass flour, which is composed of silicon oxide and in small amounts of sodium and calcium oxide. The glass crystals, have very irregular shapes compared to the fine aggregate - sand. The analysis at 2 and 4 shows a very high presence of silicon oxide, indicating the aggregate content of the sample structure. The chemical composition at point 4 consists mainly of calcium oxide and in smaller amounts of silicon oxide, aluminium, sulphur, potassium, carbon, iron, which are all components of the hydration process.

4. Discussion

How to reduce the carbon footprint of building materials?
The carbon footprint of building materials depends in large part on the sources of electricity. The two materials that generate the largest carbon footprint are concrete and steel. The search for opportunities to reduce the carbon footprint has led to the innovative solution of producing cement with recycled materials in a fairly small number of cement plants. Such a large-scale solution would reduce the production of Portland clinker itself and the associatedCO2 emissions, an important environmental benefit. Glass is regarded as an environmentally friendly material due to the fact that it is easily recyclable. Unfortunately, it turns out that there is so much of it that we cannot keep up with its recycling, especially of small waste glass. The possibility of using cullet as a non-clinker ingredient in cements could solve the problem of excessive amounts of landfilled fine glass.
How much dust or glass flour can we add to mortars to maintain the chosen parameters?
For consideration, we will consider the results obtained by the 1C10 series, in which the cement was replaced with 10% glass dust. For this series, the decrease in flexural strength was recorded at 6% and the decrease in compressive strength at 7%. The weight gain in the capillary rise test was more than 38% compared to the reference series. And the mortar absorbability for this series increased by 16% compared to the SW series. Series 1P20 is a mortar series in which sand was replaced by glass flour at a rate of 20%. The decrease in compressive strength was only 2% compared to the reference series, while the decrease in flexural strength was 13% compared to the SW series. In the capillary rise and absorption test, the series had a smaller weight gain. By 9% in capillary rise and by 23% in soakability to the reference series. These two series are characterised by test results similar to those of the reference series.
Does the glass dust tested exhibit pozzolanic properties?
Analysis of the chemical composition of the C-S-H phase point for the 1C10% series showed a high concentration of silicon. This indicates that glass dust may be present in the slurry matrix. The C-S-H phase resembles a honeycomb in appearance. According to the researchers, this appearance is characteristic of grout without mineral additives, [27]. On the basis of the examination of the microstructure of the mortars, it was not found that the pozzolanic reaction was fully taking place. This can also be confirmed by the decrease in compressive and flexural strengths of the tested series.

5. Conclusions

As a result of the analysis of the tests carried out, the following conclusions were drawn:
1. All tested mortar series were characterised by a densoplastic consistency. At the same time, it was found that increasing the percentage of glass dust replacing cement increased the workability of the mortar. This may be influenced by an increase in the percentage of dust fraction. This is due to the difference between the density of the cement and the density of the glass. Similar laboratory results were obtained by Czapik P., Kruza D., Boronia M. [8].
2. Cement replacement in the form of glass dust in the amount of 10%, 20% and 30% influenced the prolongation of the beginning and end of mortar setting. The more dust in the mortars, the longer this time is.
3. Cement replacement in the form of glass dust with a grain size of 0 - 0.1 mm and glass flour with a grain size of 0 - 2 mm as a substitute for sand decreased the volumetric density. The more substitute, the lower this density. This may be indicative of the lower water content of dust and glass flour compared to that of cement and sand.
4 Comparing the maturation conditions of the tested series, it can be concluded that the samples matured at varying temperatures recorded decreases in flexural strength ranging from 6-8% compared to the series matured under laboratory conditions. Series 1C20 and 1C30, in which cement was replaced at 20% and 30%, recorded a strength drop of 9%, while series 1C10 (10% dust) recorded a 6% drop after 56 days of maturation. When glass dust was used as a cement replacement, the decrease in compressive strength was around 10%. When considering the series in which sand was replaced by flour, the greatest decrease in flexural strength was recorded for the 1P50% series at around 25%. Increasing the maturing time did not significantly improve the parameter considered. Therefore, it can be concluded that it is not due to chemical processes in the mortars.
5. Mortars matured at variable temperatures show a decrease in compressive strength of 13% compared to mortars matured in the laboratory. The smallest decrease in compressive strength was observed in the series in which cement was replaced with glass dust at a rate of 10%, and this decrease was 8.5%. The largest decrease was recorded for series 1C30%, i.e. 27%, which corresponds to the degree to which the cement was replaced by glass dust. Thus, it cannot be concluded that the glass dust tested exhibits full pozzolanic properties.
6. The reduced compressive and flexural strength parameters of mortars modified with glass dust and glass flour may be due to the low density of glass and its unshaped shape compared to the more regular shapes of sand grains. Air voids are more likely to form between the dust and glass flour, which negatively affects the strength performance of the mortars.
7. The series matured at varying temperatures have a higher weight gain of the specimens in the capillary rise test. The reference series has a similar weight gain to the 1P20%, 1P35% and 1P50% series. The more cement replacement the weight increase in the test. The highest weight gain was recorded for the 1C30% series.
8. Mortars in which cement was replaced with glass dust showed a greater increase in mass compared to the reference series in the absorbability test. A similar trend was also observed for the mortar series in which sand was replaced by glass flour. The more flour instead of sand, the greater the weight increase in the series tested.
9. The ground glass dust replacing the cement showed incomplete pozzolanic properties. Partial pozzolanic properties can be evidenced by the hydration envelopes visible under the scanning microscope around the glass grains. Evidence can also be found in the sodium present in the hydration products from the dissolved glass.
10. In the course of tests carried out in accordance with ASTM C1260, [28], no adverse effect of the reaction of sodium and potassium hydroxide with activated silica on strength and microstructure was observed. The expansion achieved did not exceed the 0.1% threshold when tested for 14 days according to the standard. This is probably related to the large specific surface area of the cullet used. However, in the light of literature reports [29,30], further studies are necessary to verify that such a reaction does not occur at a later stage.

Author Contributions

Conceptualization, A.K.; methodology, A.K.; software, I.J. validation, A.K. and I.J..; formal analysis, I.J. and A.K.; investigation, A.K.; resources, I.J. data curation, A.K.; writing—original draft preparation, A.K. and I.J..; writing—review and editing, A.K. and I.J..; visualization, A.K.; supervision, A.K. and I.J.; project administration, I.J., funding acquisition, A.K. All authors have read and agreed to the published version of the manuscript.

Funding

Not applicable.

Institutional Review Board Statement

Not applicable.

Data Availability Statement

Not applicable.

Conflicts of Interest

Authors declare no conflict of interest.

References

  1. Błaszczyński T. Z., Król M. R., Cement industry in pursuit of environmental performance, Konferencja Dni Betonu, 2016, pp. 3-12.
  2. Mazurowski R. F., TELL Qaramel. Excavations 2005, Wydawnictwo Uniwersytetu Warszawskiego, Warsaw, 2007, pp. 483-499.
  3. PN-EN 197-5:2021-07, Cement. Part 5: Portland multicomponent cement CEM II/C-M and multicomponent cement CEM VI, Polski Komitet Normalizacyjny, Warsaw, Poland, 2021.
  4. Giergiczny Z., Szybilski M. Revision of EN 197-1 - Three-component general purpose cements with low Portland clinker content, Materiały Budowlane, Volume 507, 2014, pp. 3-5.
  5. Wierzbowska-Kujda M., Lessy, sand or peat - the NIK has put illegal mineral extraction under the microscope, Teraz Środowisko, 09.12.2024r.
  6. Kuryś D., Drabczyk M. Carbon footprint of building materials and its impact on the carbon performance of buildings and Structure, Technologie, VII-IX 2023, pp. 68-73.
  7. Najduchowska M., Różycka K., Rolska G. Assessment of the possibility of using cullet in the construction industry in terms of its environmental impact, Prace IciMB 2014 Volume 17, Warsaw – Opole, 2014, pp. 46-56.
  8. Czapik P., Kuza D., Boroń M. Effect of using waste glass on mortar properties, Konferencja Dni Betonu, 2021, pp. 199-208.
  9. Gawlicki M., Pichór W., Brylska E., Brylicki W., Łagosz A., Nocuń-Wczelik W., Petri M., Pytel Z., Roszczynialski W., Stolecki J., Malata G., Reben M., pod red. Małolepszego J. Fundamentals of building materials technology and test methods, Wydawnictwa AGH, Kraków, 2013.
  10. Biernacki J., Bullard J., Sant G., Brows K., Glasser F., Jones S., Ley T., Livingston R., Nicoleau L., Olek J., Sanchez F., Shahsavari R., Stutzman P., Sobolev K., Prater T. Cements in the 21st Century: Challenges, Perspectives, and Opportunities, 2017.
  11. Rutkowska G., Wichłowski P., Lipiński R., Influence of ground glass waste on selected properties of concretes made with it, Przegląd Naukowy – Inżynieria i Kształtowanie Środowiska, Volume 27 (4), Warsaw, 2018, pp. 463–475.
  12. Gołek M., Szudek W., Błądek M., Cięciwa M., Effect of the addition of ground glass cullet on the strength and microstructure of Portland cement slurries and mortars, Cement Wapno Beton, 2020, pp. 480-494.
  13. Szymański E., Building Materials. Volume II, Oficyna Wydawnicza WSEiZ, Warsaw, 2012.
  14. Śliwiński J., Gąciarz B., Luchter-Marchewka E., Zych T., Building Materials. Laboratory exercises, Politechnika Krakowska, Kraków, 1997.
  15. Król A., Kuterasińska J., Properties of new types of ternary cements CEM II/C and CEM VI, Materiały Budowlane, Volume 518, 2015, pp. 92-95.
  16. Jura J., Ecological aspects of the use of waste materials in the construction sector, Częstochowa University of Technology, Accessible construction: selected design and implementation aspects, Volume 2, 2017, pp. 20-32.
  17. PN-EN 197-1:2012, Cement. Part 1: Composition, requirements and conformity criteria for cements for general use, Polish Komitet Normalizacyjny, Warsaw, Poland, 2013.
  18. PN-EN 13139:2003, Mortar aggregates, Polish Komitet Normalizacyjny, Warsaw, Poland, 2003.
  19. PN-EN 1008:2004, Concrete batch water. Specification for the sampling, testing and assessment of the suitability of concrete batch water, including recycled water from concrete production processes, Polish Komitet Normalizacyjny, Warsaw, Poland, 2004.
  20. PN-EN 196-1:2016-07 Methods of testing cement - Part 1: Determination of strength, Polish Komitet Normalizacyjny, Warsaw, Poland, 2018.
  21. PN-EN 1015-11:2020-04, Test methods for mortars for masonry. Part 11: Determination of flexural and compressive strength of hardened mortar, Polish Komitet Normalizacyjny, Warsaw, Poland, 2020.
  22. PN-88/B-06250, Plain concrete, Polish Komitet Normalizacyjny, Warsaw, Poland,1988.
  23. PN-EN 1015-3:2000 Test methods for mortars for masonry - Determination of the consistency of fresh mortar (using a spreading table), Polish Komitet Normalizacyjny, Warsaw, Poland, 2000.
  24. PN-EN 1015-6:2000 Test method for masonry mortars. Determination of the volumetric density of fresh mortar, Polish Komitet Normalizacyjny, Warsaw, Poland, 2000.
  25. PN-EN 196-3:2016-12 Test methods for cement. Part 3: determination of setting times and volume constancy, Polish Komitet Normalizacyjny, Warsaw, Poland, 2018.
  26. PN-EN 1015-18:2003, Test methods for mortars for masonry -- Part 18: Determination of the coefficient of water absorption due to capillary rise of hardened mortar, Polish Komitet Normalizacyjny, Warsaw, Poland, 2003.
  27. Kurdowski W., Cement and Concrete Chemistry, SPC, Kraków 2010.
  28. ASTM C1260 Standard Test Method for Potential Alkali Reactivity of Aggregates (Mortar-Bar Method).
  29. Gołek Ł., Glass powder and high-calcium fly ash based binders – long term examinations, J. Clean. Prod., 2019, pp. 493-506. [CrossRef]
  30. Jasiczak J., Mikołajczak P., Concrete technology modified with admixtures and additives, Politechnika Poznańska, 2003.
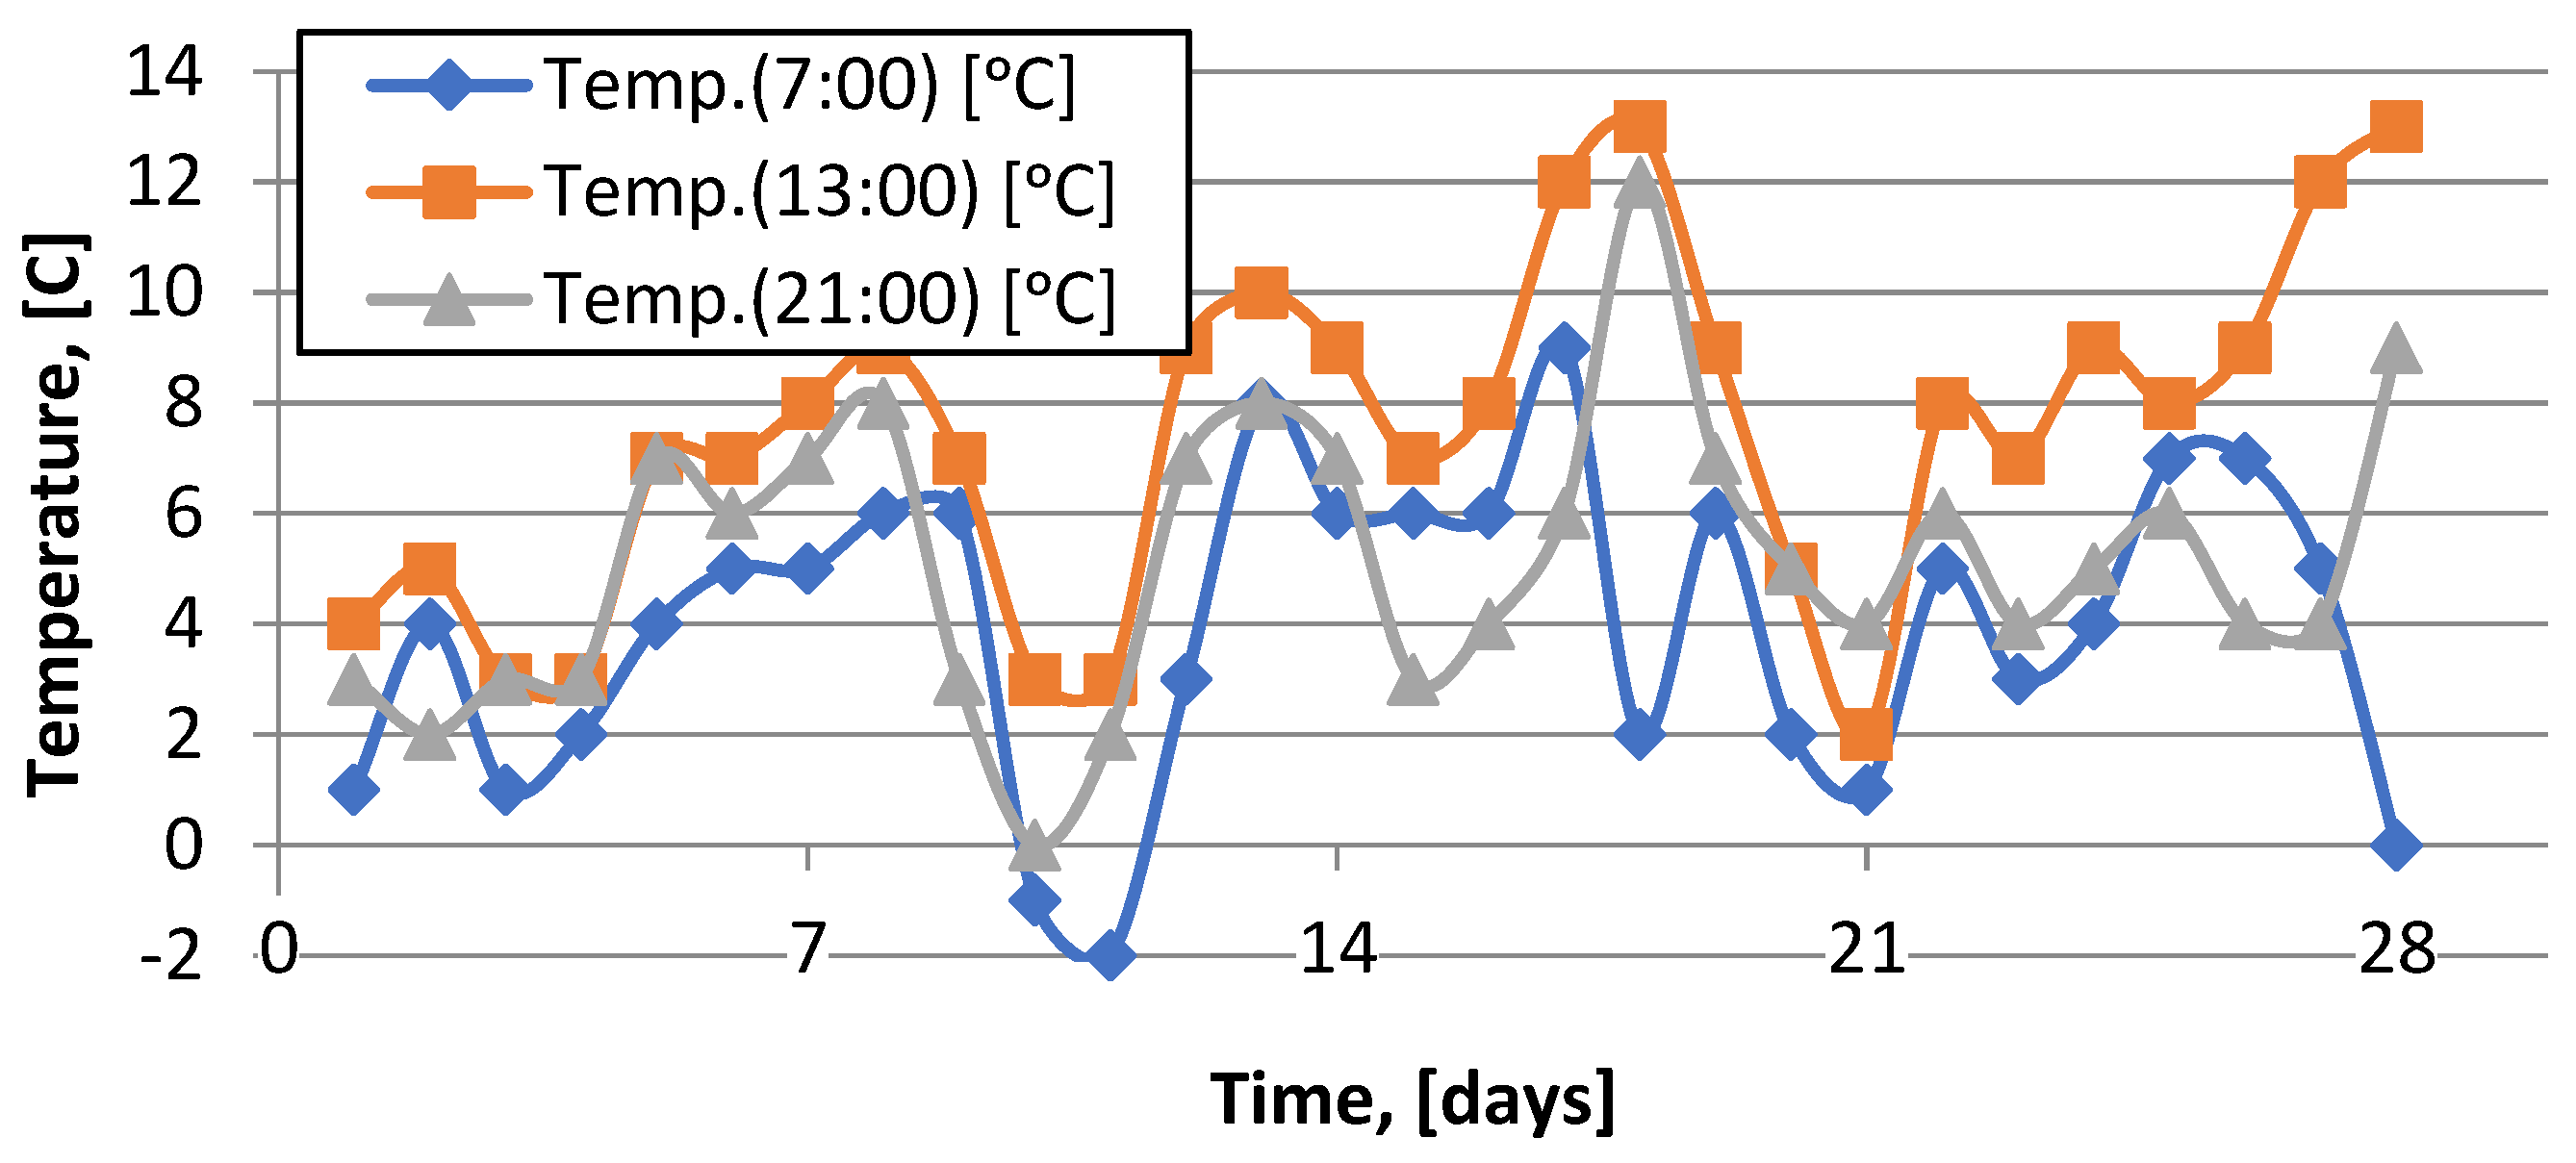
Figure 1. Plot of temperature variation during the maturation of samples influenced by external temperatures.
Preprints 142833 g001
Figure 3. Granulometric analysis of glass flour.
Preprints 142833 g003
Figure 4. Granulometric analysis of glass dust.
Preprints 142833 g004
Figure 5. Microstructure of glass dust.
Preprints 142833 g005
Figure 6. Determination of the points of the tested glass dust microstructure.
Preprints 142833 g006
Figure 7. EDS analysis of glass dust.
Preprints 142833 g007
Figure 9. Bending strength graph for the entire series of specimens matured under laboratory conditions.
Preprints 142833 g009
Figure 10. Flexural strength for mortars matured under varying weather conditions.
Preprints 142833 g010
Figure 13. Weight gain in capillary rise determination for samples matured under laboratory conditions.
Preprints 142833 g013
Figure 14. Weight gain in capillary rise determination for mortars matured under variable atmospheric conditions.
Preprints 142833 g014
Figure 15. Weight gain in the saturation test of maturing mortars under laboratory conditions.
Preprints 142833 g015
Figure 16. Increase in absorbability of mortars matured under varying atmospheric conditions.
Preprints 142833 g016
Table 3. Determination of setting time.
Name series Start of setting time, [min] End of setting time, [min]
SW 210 272
1C10% 232 289
1C20% 263 315
1C30% 290 337
Disclaimer/Publisher’s Note: The statements, opinions and data contained in all publications are solely those of the individual author(s) and contributor(s) and not of MDPI and/or the editor(s). MDPI and/or the editor(s) disclaim responsibility for any injury to people or property resulting from any ideas, methods, instructions or products referred to in the content.
Copyright: This open access article is published under a Creative Commons CC BY 4.0 license, which permit the free download, distribution, and reuse, provided that the author and preprint are cited in any reuse.
Prerpints.org logo

Preprints.org is a free preprint server supported by MDPI in Basel, Switzerland.

Subscribe

© 2026 MDPI (Basel, Switzerland) unless otherwise stated

Accessibility

Disclaimer

Terms of Use

Privacy Policy

Privacy Settings