Submitted:
13 December 2024
Posted:
13 December 2024
You are already at the latest version
Abstract
As a well-known photocatalyst, TiO₂, still suffers from rapid electron-hole recombination and limited visible light absorption. To overcome these challenges, the combination of graphene and TiO₂ has been proposed. However, traditional methods such as ball milling and hydrothermal synthesis face limitations, including high energy consumption and complex procedures. Here, we developed a simple and industrially feasible method to prepare reduced graphene oxide (rGO) coated TiO₂ nanoparticles, referred to as rGO-TiO₂ composites. The optimized rGO-TiO₂ composites exhibited enhanced photocatalytic degradation of of Rhodamine B (RhB) under simulated sunlight condition. The effects of pH and NaCl concentration on the degradation efficiency of rGO-TiO₂ were also investigated. Additionally, the key reactive species involved in the degradation process were identified. After characterization, the enhanced photocatalytic activity is ascribed to the introduction of rGO and the generation of surface oxygen vacancies (OV) and Ti³⁺ in TiO₂ crystals.
Keywords:
photocatalyst
; rGO-TiO₂
; vacuum high-temperature annealing
; industrial feasibility
1. Introduction
Photocatalytic oxidation can be widely used to remove pollutants in wastewater[1,2,3]. Titanium dioxide (TiO2) is a typical photocatalyst, but still suffers from rapid electron-hole recombination and limited visible light absorption[4,5,6]. With the advancement of synthesis techniques for graphene and its derived materials, the combination of graphene and TiO2 has attracted increasing attention[7,8,9,10,11,12,13,14,15]. Graphene oxides (GOs) combined with TiO2 nanoparticles through ball milling demonstrate effective adsorption of dye molecules in solution [13]. TiO2-reduced GO (rGO) composites obtained through a hydrothermal reaction can achieved a 99% degradation and decolorization rate for Reactive Red 3BS dye [12]. The previously discussed methods have inherent limitations. Ball milling damages the structure due to high mechanical stress and the prolonged ball milling time increases production cycles with large energy consumption [16]. The hydrothermal method requires strict control of reaction parameters and involves complex operations [17].
Up to date, there are still more work for rGO-TiO2 composites to simplify the synthesis process and achieve industrial-scale production. Here, we demonstrate that rGO-TiO2 composites can be produced in two steps: (1) first, by mixing a high-concentration GO dispersion with TiO2 nanoparticles to form GO-TiO2 composites, and (2) then by vacuum annealing at high temperature to obtain rGO-TiO2 composites. Rhodamine B (RhB) is selected as a representative dye pollutant for its extensive industrial usage. And we measured the degradation efficiency of various rGO-TiO2 composites under simulated sunlight conditions to evaluate their photocatalytic activities.
2. Experimental Section
2.1. Materials
Nano TiO2 used was from Vapor-phase nano TiO2 (≥99.5%, Hifull Inc. China). Graphite (≥99.95% metals basis, 1200mesh, Aladdin), sulfuric acid (≥70%, Aladdin) and K2S2O8 (AR grade, ≥99.5%, Aladdin) were used to form GO. RhB (AR grade, Aladdin) was chosen as model dye pollutant for the evaluation of the photocatalytic activity. Deionized water (DI, 18.2 MΩ·cm Millipore system) was used as solvent.
2.2. Sample Preparation
GO suspension with the concentration of ~10 mg/ml was prepared by the modified Hummers method [18,19]. Ten-minutes’ ultrasonic treatment with the frequency of 70 kHz has been performed to enhance the dispersion of GO sheets. 5g nano TiO2 was weighed into a beaker, followed by the addition of 5ml, 10ml, 20ml and 25ml of GO dispersion to obtain the GO-TiO2 mixture solution. Subsequently, the GO-TiO2 mixture solution were stirred for 3 hours, respectively. The solution was separated by centrifugation at 4000 rpm and then solid GO-TiO2 mixture was prepared by filtration. The mixtures were then dried in an oven at 80°C for 24 hours to obtain GO-TiO2 composites with mass ratios of 1%, 2%, 4% and 5%, designated as 1% GO-TiO2, 2% GO-TiO2, 4% GO-TiO2 and 5% GO-TiO2 respectively. These composites were subsequently annealed in a vacuum furnace at 600°C for 2 hours and labeled as 1% rGO-TiO2, 2% rGO-TiO2, 4% rGO-TiO2 and 5% rGO-TiO2. The vacuum pressure in the vacuum furnace was maintained at 10−3 Pa during annealing process. Digital photographs of nano TiO2, 4% GO-TiO2, and 4% rGO-TiO2 composites are shown in Figure S1.
2.3. Characterization
The sample morphology was characterized using scanning electron microscopy (SEM) (LEO 1530VP, LEO Elektronenmikroskopie GmbH, Germany) and transmission electron microscopy (TEM) (Tecnai G2 F20 S-TWIN, FEI, USA). The phase composition of the samples was characterized using an X-ray diffractometer (D8 Advance, Bruker, Germany), with a Cu Kα radiation source (λ = 1.5406 Å). Raman spectra were excited by a cw 532 nm laser line and measured by Raman spectrometer (Horiba HR Evolution, Horiba Jobin Yvon, France), using a silicon (100) wafer for calibration. The fourier transform infrared (FTIR) spectra of the samples were recorded using a Nicolet 6700 spectrometer (Thermo Fisher Scientific, USA), operating in the range of 4000-400 cm⁻1.The diffusive reflectance and absorbance spectra of the samples in the range of 200-800 nm were measured using a UV-Vis spectrophotometer (UV3600, Shimadzu, Japan), while BaSO4 was used as the reference. The band gap (Eg) of the samples were determined by using a tauc plot. The specific surface area of the photocatalyst was measured using the Brunauer-Emmett-Teller (BET) method through nitrogen adsorption-desorption experiments. Based on the cylindrical pore model, the pore size distribution was estimated using the Barrett-Joyner-Halenda (BJH) method [20]. Chemical structure characterizations were conducted using x-ray photoelectron spectroscopy (XPS) (Escalab Xi+, Thermo Fisher Scientific, USA) with Al Kα radiation.
2.4. Evaluation of Photocatalytic Performance
The concentration of the pollutant RhB was set to 10 mg/L, and the catalyst concentration was 1 g/L. A beaker with internal cooling reflux was used as the reactor. The EOSUN Xe-100 light source from EOS Technologies Inc. was used for photocatalysis experiments. The reaction mixture was stirred using a magnetic stirrer, and the install is shown in Figure S2. Samples of 2 mL were taken at 0, 10, 20, 30, 50, and 80 minutes. After centrifugation at 1080 rpm for 3 minutes, the supernatant was analyzed for absorbance at 554 nm by using a microplate reader (Spectramax M2e, Molecular Devices, USA), and the concentration of RhB was calculated based on the absorbance and a standard calibration curve obtained from experiment (Figure S3) [21,22]. The degradation of RhB under simulated sunlight was described using first-order chemical reaction kinetics.
3. Results and Discussion
3.1. Photocatalytic Activity
Figure 1 shows the photocatalytic activities of the samples for the removal of RhB under simulated sunlight irradiation. Compared to the photocatalytic performance of the nano TiO2, rGO-TiO2 composites display considerable photocatalytic activity. Moreover, the photocatalytic activity of the rGO-TiO2 composites progressively improves as the rGO/TiO2 ratio is from 1% to 4%. When the ratio further increases to 5%, the photocatalytic activity declines. The 4% rGO-TiO2 composites exhibited the best photocatalytic activity by achieving a RhB removal efficiency of 99.95% within 80 minutes, while nano TiO2 sample only achieves 66.88%. The first-order reaction rate constants (k) of these samples are listed in Table S1. The k of 4% rGO-TiO2 is 0.0867 min⁻1, 5.42 times higher than the k of nano TiO2 sample (0.0135 min⁻1).
The photocatalytic activtities of the nano TiO2, 4% GO-TiO2 and 4% rGO-TiO2 samples are compared in Figure 2. It is apparent that the addition of GO can strengthen the photocatalytic activtity. Furthermore, the 4% rGO-TiO2 sample, prepared via the high temperature vacuum annealing, exhibits the best photocatalytic activtity. That is, the incorporation of GO combined with high temperature vacuum annealing can lead to significant enhancement on the photocatalytic activity of TiO2.
Figure 3a,b illustrate the degradation efficiency of the 4% rGO-TiO2 in response to pH and NaCl concentration. The results indicate that the degradation efficiency of the 4% rGO-TiO2 is mildly influenced by pH, with the highest efficiency observed under neutral conditions, followed by alkaline conditions, and the lowest under acidic conditions. At pH 11.89, the degradation efficiency reaches 94.90% within 80 minutes, whereas at pH 2.01, it is only 80.14%. Figure 3b demonstrates that the degradation efficiency of the 4% rGO-TiO2 composite material is largely unaffected by NaCl concentration.
To investigate the key reactive species involved in the degradation process, the following experimental studies were conducted. Generally, the main reactive species in photocatalytic processes include hydroxyl radicals (•OH), superoxide radicals (•O2), photogenerated holes (h⁺), and singlet oxygen (1O2) [23,24,25,26]. In this study, tert-butyl alcohol (TBA) [24], ascorbic acid (AA) [26], disodium ethylenediaminetetraacetate (EDTA-2Na) [23], and L-histidine (L-His) [25] were used as scavengers for these reactive species respectively, and the results are shown in Figure 4. The addition of TBA has no significant effect on the photocatalytic activity of the 4% rGO-TiO2 composite, indicating that hydroxyl radicals are not the primary reactive species. When AA, L-His, and EDTA-2Na were used, the degradation efficiency of RhB decreases to 92.03%, 82.25%, and 78.87%, respectively. These results demonstrate that h⁺ and 1O2 are the primary reactive species, while •O2 play a lesser role in the degradation process.
3.2. Characterization Results
Figure 3 shows the TEM images of nano TiO2, 4% GO-TiO2 and 4% rGO-TiO2. The sizes of nano TiO2 are in the range of 10-25 nm (Figure 5a). After the incorporation of GO, the sizes become in the range of 15-30 nm (Figure 5b). Vacuum annealing can induce agglomeration of the 4% rGO-TiO2 nano particles (Figure 5c), which is consistent with the the SEM images in Figure S5. And the sizes of the 4% rGO-TiO2 nano particles have obvious growth and become in the range of 20-35 nm. That is, 4% rGO-TiO2 nano particles have a tendency of crystal growth by vacuum annealing. The high-magnification TEM image of 4% rGO-TiO2 in Figure 5d shows the TiO2 nanoparticle is coated by the rGO. The lattice fringes of the TiO2 nanoparticle are also clearly observed. the lattice spacing is 0.35nm (the inset of Figure 5d), corresponding to the (101) planes of anatase TiO2.
The specific surface area (SBET), pore volume, and pore size of nano TiO2, 4% GO-TiO2 and 4% rGO-TiO2 samples are shown in Table 1. In comparison with nano TiO2, 4% GO-TiO2 sample has obvious increase in SBET, pore volume, and pore size. Note that SBET decreases after vacuum annealing. This may be caused by the growth and agglomeration of TiO2 nanoparticles during high-temperature annealing [27,28].
Figure 6 shows the XRD patterns of nano TiO2, 4% GO-TiO2 and 4% rGO-TiO2 samples. The diffraction peaks at 25.3°, 37.9°, 48.0°, 54.1°, and 62.7° correspond to the (101), (004), (200), (105), and (204) planes of anatase TiO2, respectively. And the peaks at 27.4°, 36.1°, 41.2°, and 69.0° are attributed to the (110), (101), (111), and (301) planes of rutile TiO2, respectively [29]. This indicates that the nano TiO2 is a mixture of anatase and rutile. No diffraction peaks for GO or rGO are observed in the 4% GO-TiO2 and 4% rGO-TiO2 samples, likely because of their low concentrations [30,31]. Moreover, the diffraction peak at 24.4° for rGO is close to the anatase TiO2 (101) peak at 25.3°, which cause the overlapping of rGO diffraction peak in 4% rGO-TiO2 composites [30]. As shown in Figure 6, compared with the intensities of anatase TiO2 diffraction peaks, the relative intensities of rutile TiO2 diffraction peaks are enhanced after vacuum annealing, indicating that some of the anatase are transformed into rutile (see Table S2) [28,32,33,34]. Moreover, using the Debye-Scherrer formula, the average crystallite sizes shown in Table S2 are increased by the addition of GO and high temperature annealing, which is in consistent with the TEM observation.
Figure 7 shows the Raman spectra of 4% GO-TiO2 and 4% rGO-TiO2 samples. The five bands at 144 cm⁻1, 197 cm⁻1, 399 cm⁻1, 520 cm⁻1, and 637 cm⁻1 are corresponding to the five active vibrational modes Eg, Eg, B1g, A1g+B1g, and Eg of anatase TiO2, confirming as the dominant crystalline phase, consistent with XRD results [27,35]. The D band (1360 cm⁻1) and G band (1590 cm⁻1) characteristics of GO and rGO are prominent, indicating GO and rGO coating of TiO2. Moreover, the ID/IG ratios of 4% rGO-TiO2 is 0.84, lower than that of 4% GO-TiO2 (0.89), which is attributed to the removal of oxygen functional groups during annealing [36]. The FTIR analysis in Figure S8 can also confirm the reduction of GO.
Figure 8 displays the diffusive reflectance and absorbance spectra of the nano TiO2, 4% GO-TiO2 and 4% rGO-TiO2 samples. All samples exhibit strong absorption in the ultraviolet region (200−400 nm). For 4% GO-TiO2 sample, red-shift absorbance can be observed. Furthermore, high-temperature vacuum annealing causes the more significant visible light absorption. The obvious shifts in the light absorption from UV to visible light clearly show the reduction of the band gap. Figure S6 reveals that the bandgaps of the nano TiO2, 4% GO-TiO2 and 4% rGO-TiO2 samples are 3.19 eV (~ 388.73 nm), 2.95 eV (~ 420.58 nm) and 2.68 eV (~ 462.95 nm), respectively. That is, the coating of GO or rGO incorporation and high-temperature vacuum annealing can effectively narrows the bandgap, which critically influences the photocatalytic activity of catalysts [37].
The change of surface chemical bonding of the nano TiO2, 4% GO-TiO2 and 4% rGO-TiO2 samples was examined using XPS, as shown in Figure 9. The O 1s XPS spectra show dramatic differences. Though the Ti−O−Ti peak (530.2 eV) is almost the same, 4% rGO-TiO2 presents a significant enhancement of the peak (532.2 eV), indicating the formation of oxygen vacancies (O¬V) in crystal surface [38,39,40]. The C 1s XPS spectra show the binding energies of C-C, C-O, and C=O are 284.8, 286.5, and 288.7 eV, respectively. There is no carbon in nano TiO2, and its C 1s peak must come from the adventitious carbon species [38,39,40]. It should be noted that the C-O peak of 4% rGO-TiO2 sample is more obvious, indicating that the C in rGO have a tendency to bond the O in TiO2 during high-temperature vacuum annealing. This may also cause the formation of O¬V. In the Ti 2p XPS spectra of 4% rGO-TiO2, the same shape of Ti 2p3/2 but a decrease in the 2p1/2 peak compared to 4% GO-TiO2 are observed, which may be attributed to the partial reduction of Ti⁴⁺ to Ti³⁺ during the vacuum high-temperature annealing process. Further analysis in the Figure S7 revealed the successful separation of Ti³⁺ from Ti⁴⁺, indicating the presence of Ti³⁺ on the material’s surface [41,42,43] As the result, high-temperature vacuum annealing may enhance the interfacial interaction between rGO and TiO2 and the formation of some defects (like O¬V and Ti³⁺) in the the 4% rGO-TiO2, which may lead to the enhanced absorption (Figure 8) and narrowed bandgap (Figure S6) [28]. Thus, the 4% rGO-TiO2 demonstrates the best photocatalytic activity in all samples.
4. Conclusions
In summary, rGO-TiO2 composites were synthesized by mixing a high-concentration GO dispersion with TiO2 nanoparticles and high-temperature vacuum annealing. The 4% rGO-TiO2 composites demonstrate a removal efficiency of 99.95% for the degradation of Rhodamine B under simulated sunlight. Moreover, the degradation of RhB using rGO-TiO2 composites was less sensitive to variations in pH and NaCl concentration. The crystal phase and structure, band gap, morphology and composition of rGO-TiO2 composites were investigated for explaining the enhanced photocatalytic performance. High-temperature vacuum annealing leads to transformation of anatase to rutile of TiO2, the increase of average crystallite size and the decrease of the surface area of rGO-TiO2. These changings are harmful for photocatalysis, as larger crystallite sizes may lead to an increased recombination rate of electron-hole and rutile TiO2 exhibits inferior photocatalytic activity compared to anatase TiO2 [44,45]. Moreover, the reduction of GO and formation of Ov and Ti³⁺ in the 4% rGO-TiO2 composite are also analyzed. These promote the light absorption and a bandgap reduction of the rGO-TiO2 compared to TiO2 and GO-TiO2. High-temperature vacuum annealing and the integration of rGO onto TiO2 provide a promising direction for developing efficient photocatalysts for environmental applications. In the future, the rGO-TiO2 composites are expected to be applied in the photocatalytic degradation of persistent organic pollutants, such as chlorobenzene, bisphenol A, and toxaphene.
Acknowledgments
This work was supported by the National Natural Science Foundation of China (Nos. 12175302, 12005284) and ABA Company (No. SCH1829202E). We would like to thank the ABA Company for providing financial support to this research. This work was also supported by the User Experiment Assist System of Shanghai Synchrotron Radiation Facility (SSRF).
Conflicts of Interest
The authors declare no conflicts of interest.
References
- Kumari, H.; Sonia; Suman; Ranga, R.; Chahal, S.; Devi, S.; Sharma, S.; Kumar, S.; Kumar, P.; Kumar, S.; et al. A Review on Photocatalysis Used For Wastewater Treatment: Dye Degradation. Water, Air, Soil Pollut. 2023, 234, 1–46. [CrossRef]
- Khan, S.; Noor, T.; Iqbal, N.; Yaqoob, L. Photocatalytic Dye Degradation from Textile Wastewater: A Review. ACS Omega 2024, 9, 21751–21767. [CrossRef]
- Dey, S.; Manna, K.; Pradhan, P.; Sarkar, A.N.; Roy, A.; Pal, S. Review of Polymeric Nanocomposites for Photocatalytic Wastewater Treatment. ACS Appl. Nano Mater. 2024, 7, 4588–4614. [CrossRef]
- Guo, Q.; Zhou, C.; Ma, Z.; Ren, Z.; Fan, H.; Yang, X. ChemInform Abstract: Elementary Photocatalytic Chemistry on TiO2 Surfaces. ChemInform 2016, 47. [CrossRef]
- Liu, R.; Li, H.; Duan, L.; Shen, H.; Zhang, Q.; Zhao, X. Influences of annealing atmosphere on phase transition temperature, optical properties and photocatalytic activities of TiO2 phase-junction microspheres. J. Alloy. Compd. 2019, 789, 1015–1021. [CrossRef]
- Liang, Z.; Hou, H.; Fang, Z.; Gao, F.; Wang, L.; Chen, D.; Yang, W. Hydrogenated TiO2 Nanorod Arrays Decorated with Carbon Quantum Dots toward Efficient Photoelectrochemical Water Splitting. ACS Appl. Mater. Interfaces 2019, 11, 19167–19175. [CrossRef]
- Williams, G.; Seger, B.; Kamat, P. V., TiO2-graphene nanocomposites.: UV-assisted photocatalytic reduction of graphene oxide. Acs Nano 2008, 2 (7), 1487-1491.
- Chen, C.; Cai, W.; Long, M.; Zhou, B.; Wu, Y.; Wu, D.; Feng, Y. Synthesis of Visible-Light Responsive Graphene Oxide/TiO2 Composites with p/n Heterojunction. ACS Nano 2010, 4, 6425–6432. [CrossRef]
- Zhu, C.; Guo, S.; Wang, P.; Xing, L.; Fang, Y.; Zhai, Y.; Dong, S. One-pot, water-phase approach to high-quality graphene/TiO2 composite nanosheets. Chem. Commun. 2010, 46, 7148–7150. [CrossRef]
- Han, L.; Wang, P.; Dong, S. Progress in graphene-based photoactive nanocomposites as a promising class of photocatalyst. Nanoscale 2012, 4, 5814–5825. [CrossRef]
- Hu, G.; Yang, J.; Zhao, D.; Chen, Y.; Cao, Y. Research on Photocatalytic Properties of TiO2-Graphene Composites with Different Morphologies. J. Mater. Eng. Perform. 2017, 26, 3263–3270. [CrossRef]
- Wu, H.; Gao, X.; Fang, J.; Liu, Q.; He, P., Preparation and photocatalytic degradation decoloring of TiO2 /reduced graphene oxide composites. Journal of Textile Research 2018, 39 (12), 78-83.
- Cano, F.J.; Reyes-Vallejo, O.; Ashok, A.; Olvera, M.d.l.L.; Velumani, S.; Kassiba, A. Mechanisms of dyes adsorption on titanium oxide– graphene oxide nanocomposites. Ceram. Int. 2023, 49, 21185–21205. [CrossRef]
- Pan, X.; Zhao, Y.; Liu, S.; Korzeniewski, C. L.; Wang, S.; Fan, Z., Comparing Graphene-TiO2 Nanowire and Graphene-TiO2 Nanoparticle Composite Photocatalysts. ACS Applied Materials & Interfaces 2012, 4 (8), 3944-3950.
- Wang, R.; Shi, K.; Huang, D.; Zhang, J.; An, S., Synthesis and degradation kinetics of TiO2/GO composites with highly efficient activity for adsorption and photocatalytic degradation of MB. Scientific Reports 2019, 9 (1), 18744.
- Joy, J.; Krishnamoorthy, A.; Tanna, A.; Kamathe, V.; Nagar, R.; Srinivasan, S. Recent Developments on the Synthesis of Nanocomposite Materials via Ball Milling Approach for Energy Storage Applications. Appl. Sci. 2022, 12, 9312. [CrossRef]
- Huang, L.; Liu, T.; Zhang, H.; Guo, W.; Zeng, W. Hydrothermal synthesis of different TiO2 nanostructures: structure, growth and gas sensor properties. J. Mater. Sci. Mater. Electron. 2012, 23, 2024–2029. [CrossRef]
- Jiang, J.; Mu, L.; Qiang, Y.; Yang, Y.; Wang, Z.; Yi, R.; Qiu, Y.; Chen, L.; Yan, L.; Fang, H. Unexpected Selective Absorption of Lithium in Thermally Reduced Graphene Oxide Membranes. Chin. Phys. Lett. 2021, 38. [CrossRef]
- Jiang, J.; Yan, L.; Fang, H. Effect of Oxide Content of Graphene Oxide Membrane on Remarkable Adsorption for Calcium Ions. Chin. Phys. Lett. 2021, 38. [CrossRef]
- Zhou, G.; Shen, L.; Xing, Z.; Kou, X.; Duan, S.; Fan, L.; Meng, H.; Xu, Q.; Zhang, X.; Li, L.; Zhao, M.; Mi, J.; Li, Z., Ti3+ self-doped mesoporous black TiO2/graphene assemblies for unpredicted-high solar-driven photocatalytic hydrogen evolution. J Colloid Interface Sci 2017, 505, 1031-1038.
- Zhang, Z.; Yan, H.; Xu, B.; Weng, S.; Wang, S.; Tan, S.; Xie, Z.; Fang, F. FeCoNiMn/Ti electrode prepared by magnetron sputtering for efficient RhB degradation. Vacuum 2023, 214. [CrossRef]
- Quanju, Y.; Zeyan, W.; Ye, Z.; Manyun, L., Study on the performance of Cu2+ doped nano zero-valent iron for the oxidative degradation of Rhodamine B. Chemical Research and Application 2024, 36 (07), 1632-1638.
- Miao, Z.; Wang, G.; Li, L.; Wang, C.; Zhang, X., Fabrication of black TiO2/TiO2 homojunction for enhanced photocatalytic degradation. Journal of Materials Science 2019, 54 (23), 14320-14329.
- Hu, X.; Han, W.; Zhang, M.; Li, D.; Sun, H. Enhanced adsorption and visible-light photocatalysis on TiO2 with in situ formed carbon quantum dots. Environ. Sci. Pollut. Res. 2022, 29, 56379–56392. [CrossRef]
- Wang, Z.; Li, M.; Li, J.; Zhou, W.; Wang, Y.; Li, Q. Sulfate promotes the photocatalytic degradation of antibiotics by porphyrin MOF: The electron-donating effect of the anion. Environ. Funct. Mater. 2023, 2, 46–56. [CrossRef]
- MA Chaoge; FANG Guoli; TIAN Jing; ZHANG Gang; YAN Xianghui, Effect of Bi/Cl atomic ratio on the photocatalytic activities of TiO2/BixOyClz composites. Acta Materiae Compositae Sinica 2024, 43, 1-10.
- Štengl, V.; Bakardjieva, S.; Grygar, T.M.; Bludská, J.; Kormunda, M. TiO2-graphene oxide nanocomposite as advanced photocatalytic materials. BMC Chem. 2013, 7, 41–41. [CrossRef]
- Katal, R.; Salehi, M.; Farahani, M.H.D.A.; Masudy-Panah, S.; Ong, S.L.; Hu, J. Preparation of a New Type of Black TiO2 under a Vacuum Atmosphere for Sunlight Photocatalysis. ACS Appl. Mater. Interfaces 2018, 10, 35316–35326. [CrossRef]
- Sukarman; Kristiawan, B.; Khoirudin; Abdulah, A.; Enoki, K.; Wijayanta, A.T. Characterization of TiO2 nanoparticles for nanomaterial applications: Crystallite size, microstrain and phase analysis using multiple techniques. Nano-Structures Nano-Objects 2024, 38. [CrossRef]
- Trapalis, A.; Todorova, N.; Giannakopoulou, T.; Boukos, N.; Speliotis, T.; Dimotikali, D.; Yu, J., TiO2/graphene composite photocatalysts for NOx removal: A comparison of surfactant-stabilized graphene and reduced graphene oxide. Applied Catalysis B: Environmental 2016, 180, 637-647.
- Ruidíaz-Martínez, M.; Álvarez, M. A.; López-Ramón, M. V.; Cruz-Quesada, G.; Rivera-Utrilla, J.; Sánchez-Polo, M., Hydrothermal Synthesis of rGO-TiO2 Composites as High-Performance UV Photocatalysts for Ethylparaben Degradation. 2020, 10 (5), 520.
- Yu, J.; Yu, H.; Cheng, B.; Zhou, M.; Zhao, X. Enhanced photocatalytic activity of TiO2 powder (P25) by hydrothermal treatment. J. Mol. Catal. A: Chem. 2006, 253, 112–118. [CrossRef]
- Lin, C.-P.; Chen, H.; Nakaruk, A.; Koshy, P.; Sorrell, C. Effect of Annealing Temperature on the Photocatalytic Activity of TiO2 Thin Films. Energy Procedia 2013, 34, 627–636. [CrossRef]
- Velardi, L.; Scrimieri, L.; Serra, A.; Manno, D.; Calcagnile, L. Effect of temperature on the physical, optical and photocatalytic properties of TiO2 nanoparticles. SN Appl. Sci. 2020, 2, 1–6. [CrossRef]
- Ohsaka, T.; Izumi, F.; Fujiki, Y. Raman spectrum of anatase, TiO2. J. Raman Spectrosc. 1978, 7, 321–324. [CrossRef]
- Lee, E.; Lee, D.; Yoon, J.; Yin, Y.; Na Lee, Y.; Uprety, S.; Yoon, Y.S.; Kim, D.-J. Enhanced Gas-Sensing Performance of GO/TiO2 Composite by Photocatalysis. Sensors 2018, 18, 3334. [CrossRef]
- Ullah, I.; Haider, A.; Khalid, N.; Ali, S.; Ahmed, S.; Khan, Y.; Ahmed, N.; Zubair, M. Tuning the band gap of TiO2 by tungsten doping for efficient UV and visible photodegradation of Congo red dye. Spectrochim. Acta Part A: Mol. Biomol. Spectrosc. 2018, 204, 150–157. [CrossRef]
- Zhang, P.; Tachikawa, T.; Fujitsuka, M.; Majima, T. Atomic Layer Deposition-Confined Nonstoichiometric TiO2 Nanocrystals with Tunneling Effects for Solar Driven Hydrogen Evolution. J. Phys. Chem. Lett. 2016, 7, 1173–1179. [CrossRef]
- Cui, Z.; Zhao, M.; Li, S.; Wang, J.; Xu, Y.; Ghazzal, M.N.; Colbeau-Justin, C.; Pan, D.; Wu, W. Facile Vacuum Annealing of TiO2 with Ethanol-Induced Enhancement of Its Photocatalytic Performance under Visible Light. Ind. Eng. Chem. Res. 2022, 61, 14455–14461. [CrossRef]
- Cui, Z.; Zhao, M.; Que, X.; Wang, J.; Xu, Y.; Ghazzal, M.N.; Colbeau-Justin, C.; Pan, D.; Wu, W. Facile Vacuum Annealing-Induced Modification of TiO2 with an Enhanced Photocatalytic Performance. ACS Omega 2021, 6, 27121–27128. [CrossRef]
- Ran, P.; Jiang, L.; Li, X.; Zuo, P.; Li, B.; Li, X. J.; Cheng, X. Y.; Zhang, J. T.; Lu, Y. F., Redox shuttle enhances nonthermal femtosecond two-photon self-doping of rGO-TiO2-x photocatalysts under visible light. Journal of Materials Chemistry A 2018, 6 (34), 16430-16438.
- Song, X.; Li, W.; He, D.; Wu, H.; Ke, Z.; Jiang, C.; Wang, G.; Xiao, X. The “Midas Touch” Transformation of TiO2 Nanowire Arrays during Visible Light Photoelectrochemical Performance by Carbon/Nitrogen Coimplantation. Adv. Energy Mater. 2018, 8. [CrossRef]
- Zheng, P.; Liu, T.; Su, Y.; Zhang, L.; Guo, S. TiO2 nanotubes wrapped with reduced graphene oxide as a high-performance anode material for lithium-ion batteries. Sci. Rep. 2016, 6, 36580. [CrossRef]
- Li, D.; Song, H.; Meng, X.; Shen, T.; Sun, J.; Han, W.; Wang, X. Effects of Particle Size on the Structure and Photocatalytic Performance by Alkali-Treated TiO2. Nanomaterials 2020, 10, 546. [CrossRef]
- Morgunov, V.; Lytovchenko, S.; Chyshkala, V.; Riabchykov, D.; Matviienko, D. Comparison of Anatase and Rutile for Photocatalytic Application: the Short Review. 1 2021, 18–30. [CrossRef]
Figure 1.
Degradation efficiency of nano TiO2 sample and different rGO-TiO2 (1%, 2%, 4% and 5%) samples on RhB solution under simulated sunlight condition.
Figure 1.
Degradation efficiency of nano TiO2 sample and different rGO-TiO2 (1%, 2%, 4% and 5%) samples on RhB solution under simulated sunlight condition.
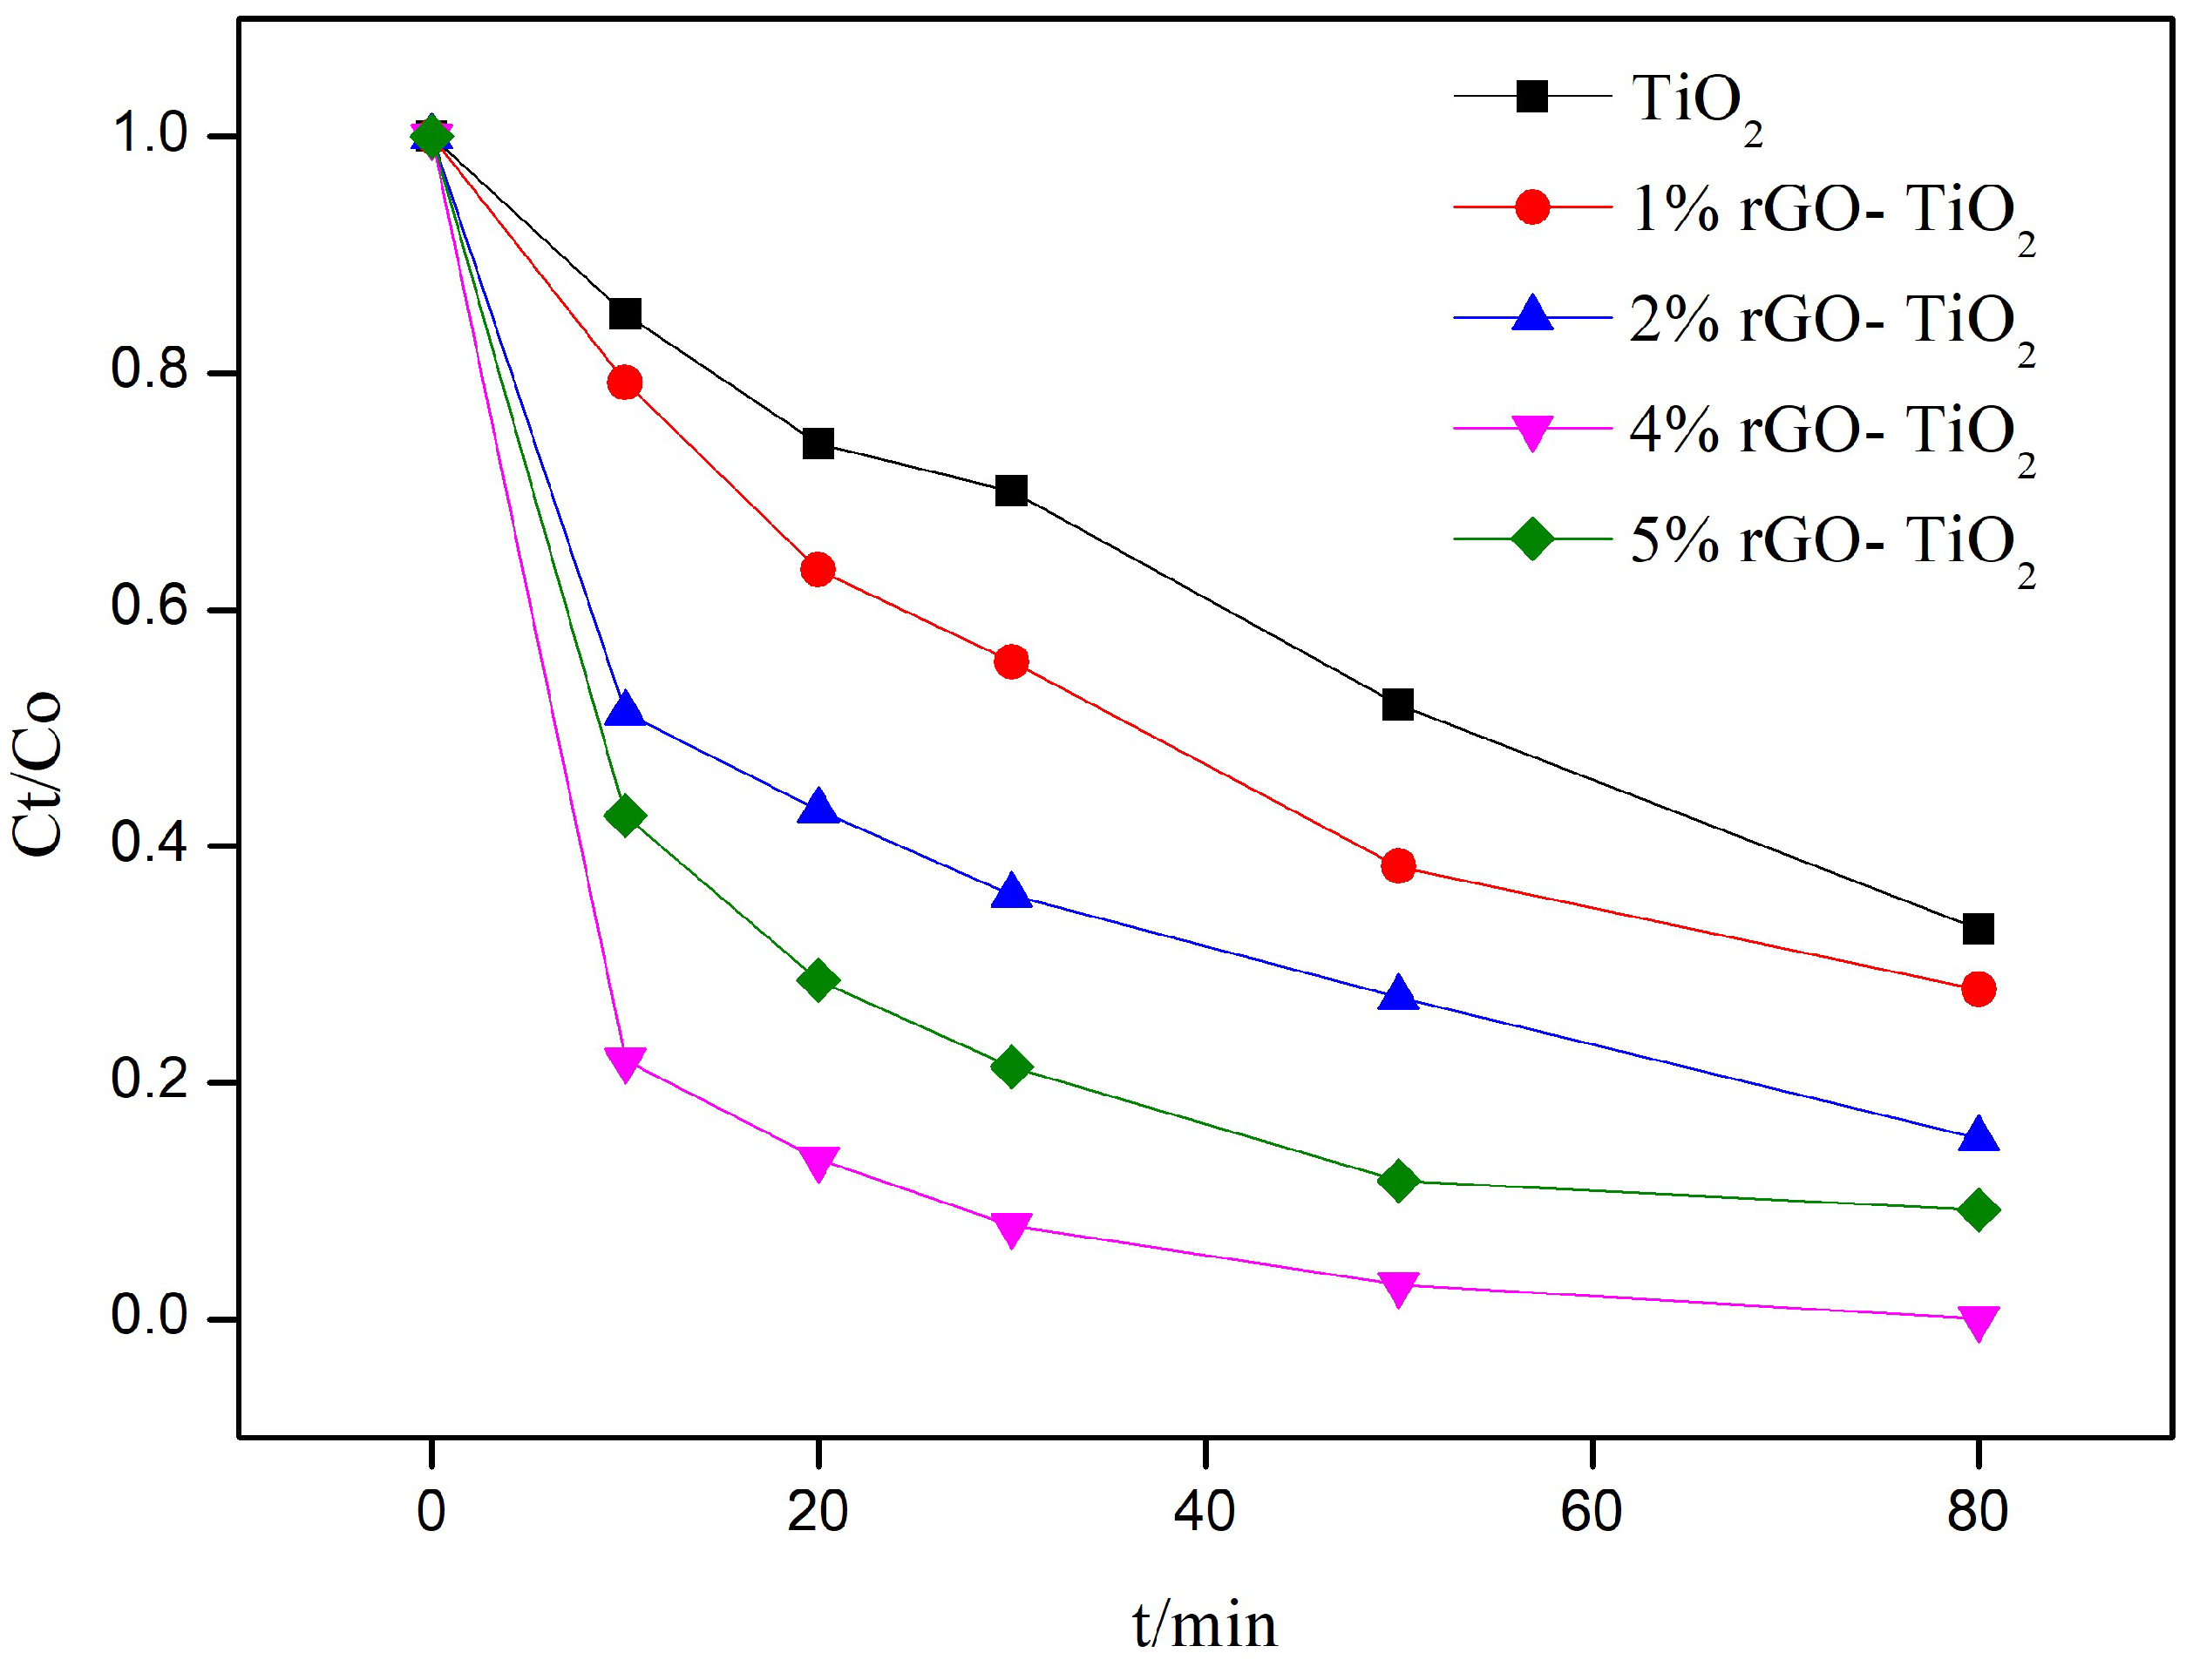
Figure 2.
Degradation efficiency of nano TiO2, 4% GO-TiO2 and 4% rGO-TiO2 on RhB under simulated sunlight condition (3.867 W).
Figure 2.
Degradation efficiency of nano TiO2, 4% GO-TiO2 and 4% rGO-TiO2 on RhB under simulated sunlight condition (3.867 W).
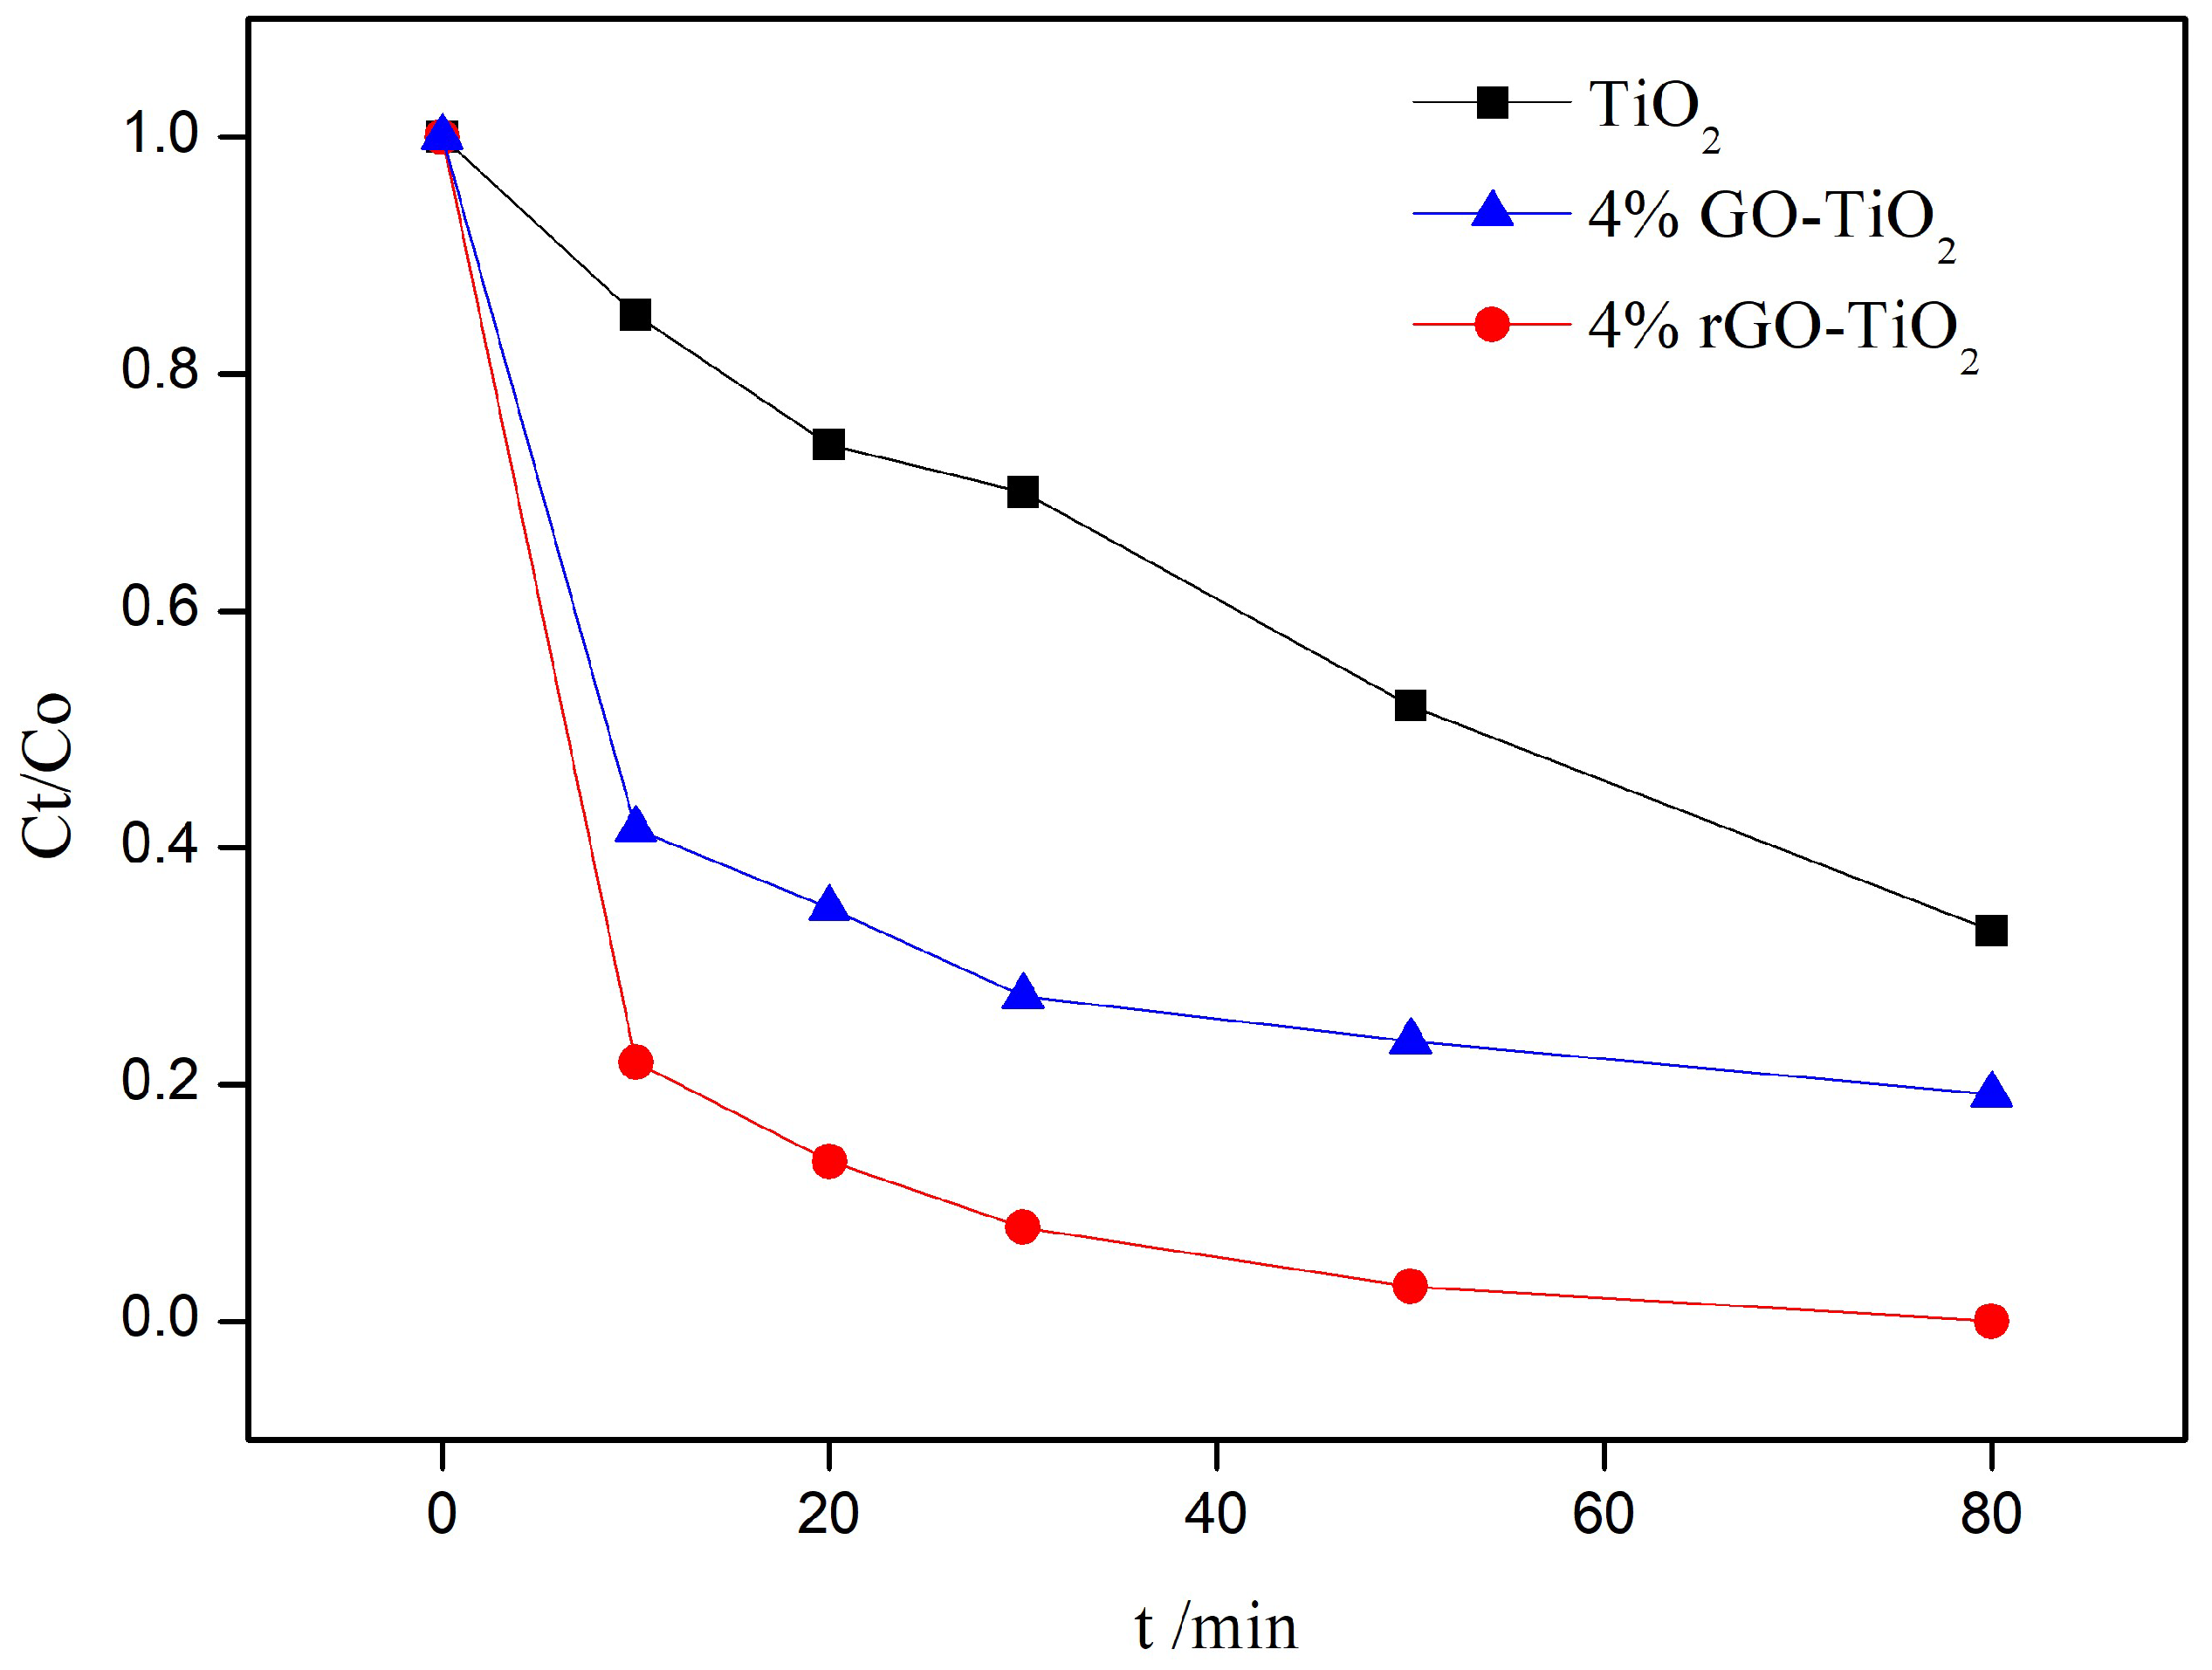
Figure 3.
The effect of pH (a) and NaCl (b) on the degradation efficiency of 4% rGO-TiO2.
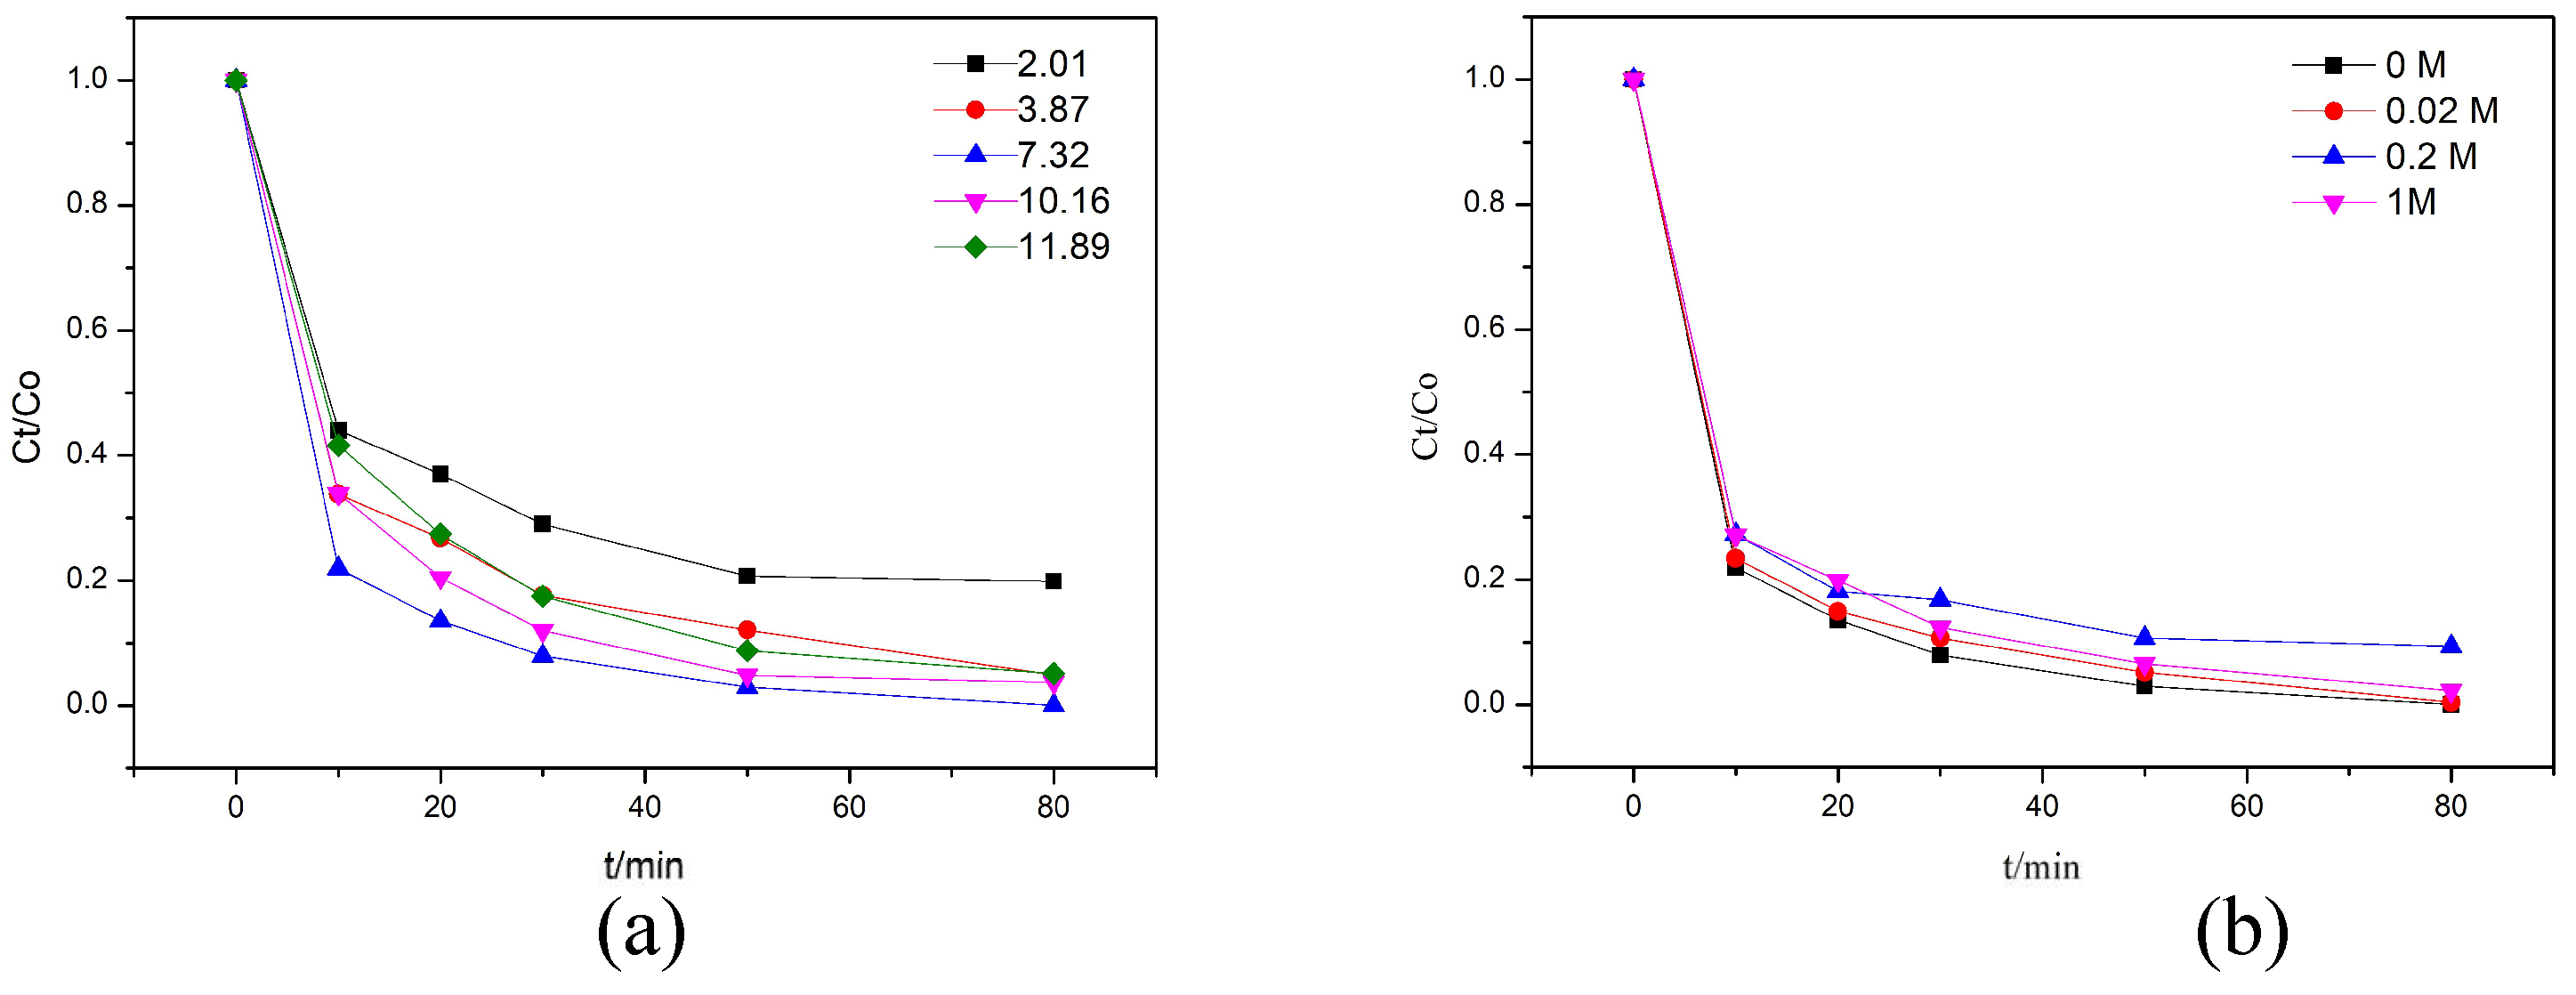
Figure 4.
Photodegradation of RhB solution under simulated sunlight irradiation in the presence of 4% rGO-TiO2 without or with adding tertiary butyl alcohol (TBA), ascorbic acid (AA), ethylenediaminetetra-acetic acid disodium salt(EDTA-2Na)and L-histidine (L-His).
Figure 4.
Photodegradation of RhB solution under simulated sunlight irradiation in the presence of 4% rGO-TiO2 without or with adding tertiary butyl alcohol (TBA), ascorbic acid (AA), ethylenediaminetetra-acetic acid disodium salt(EDTA-2Na)and L-histidine (L-His).
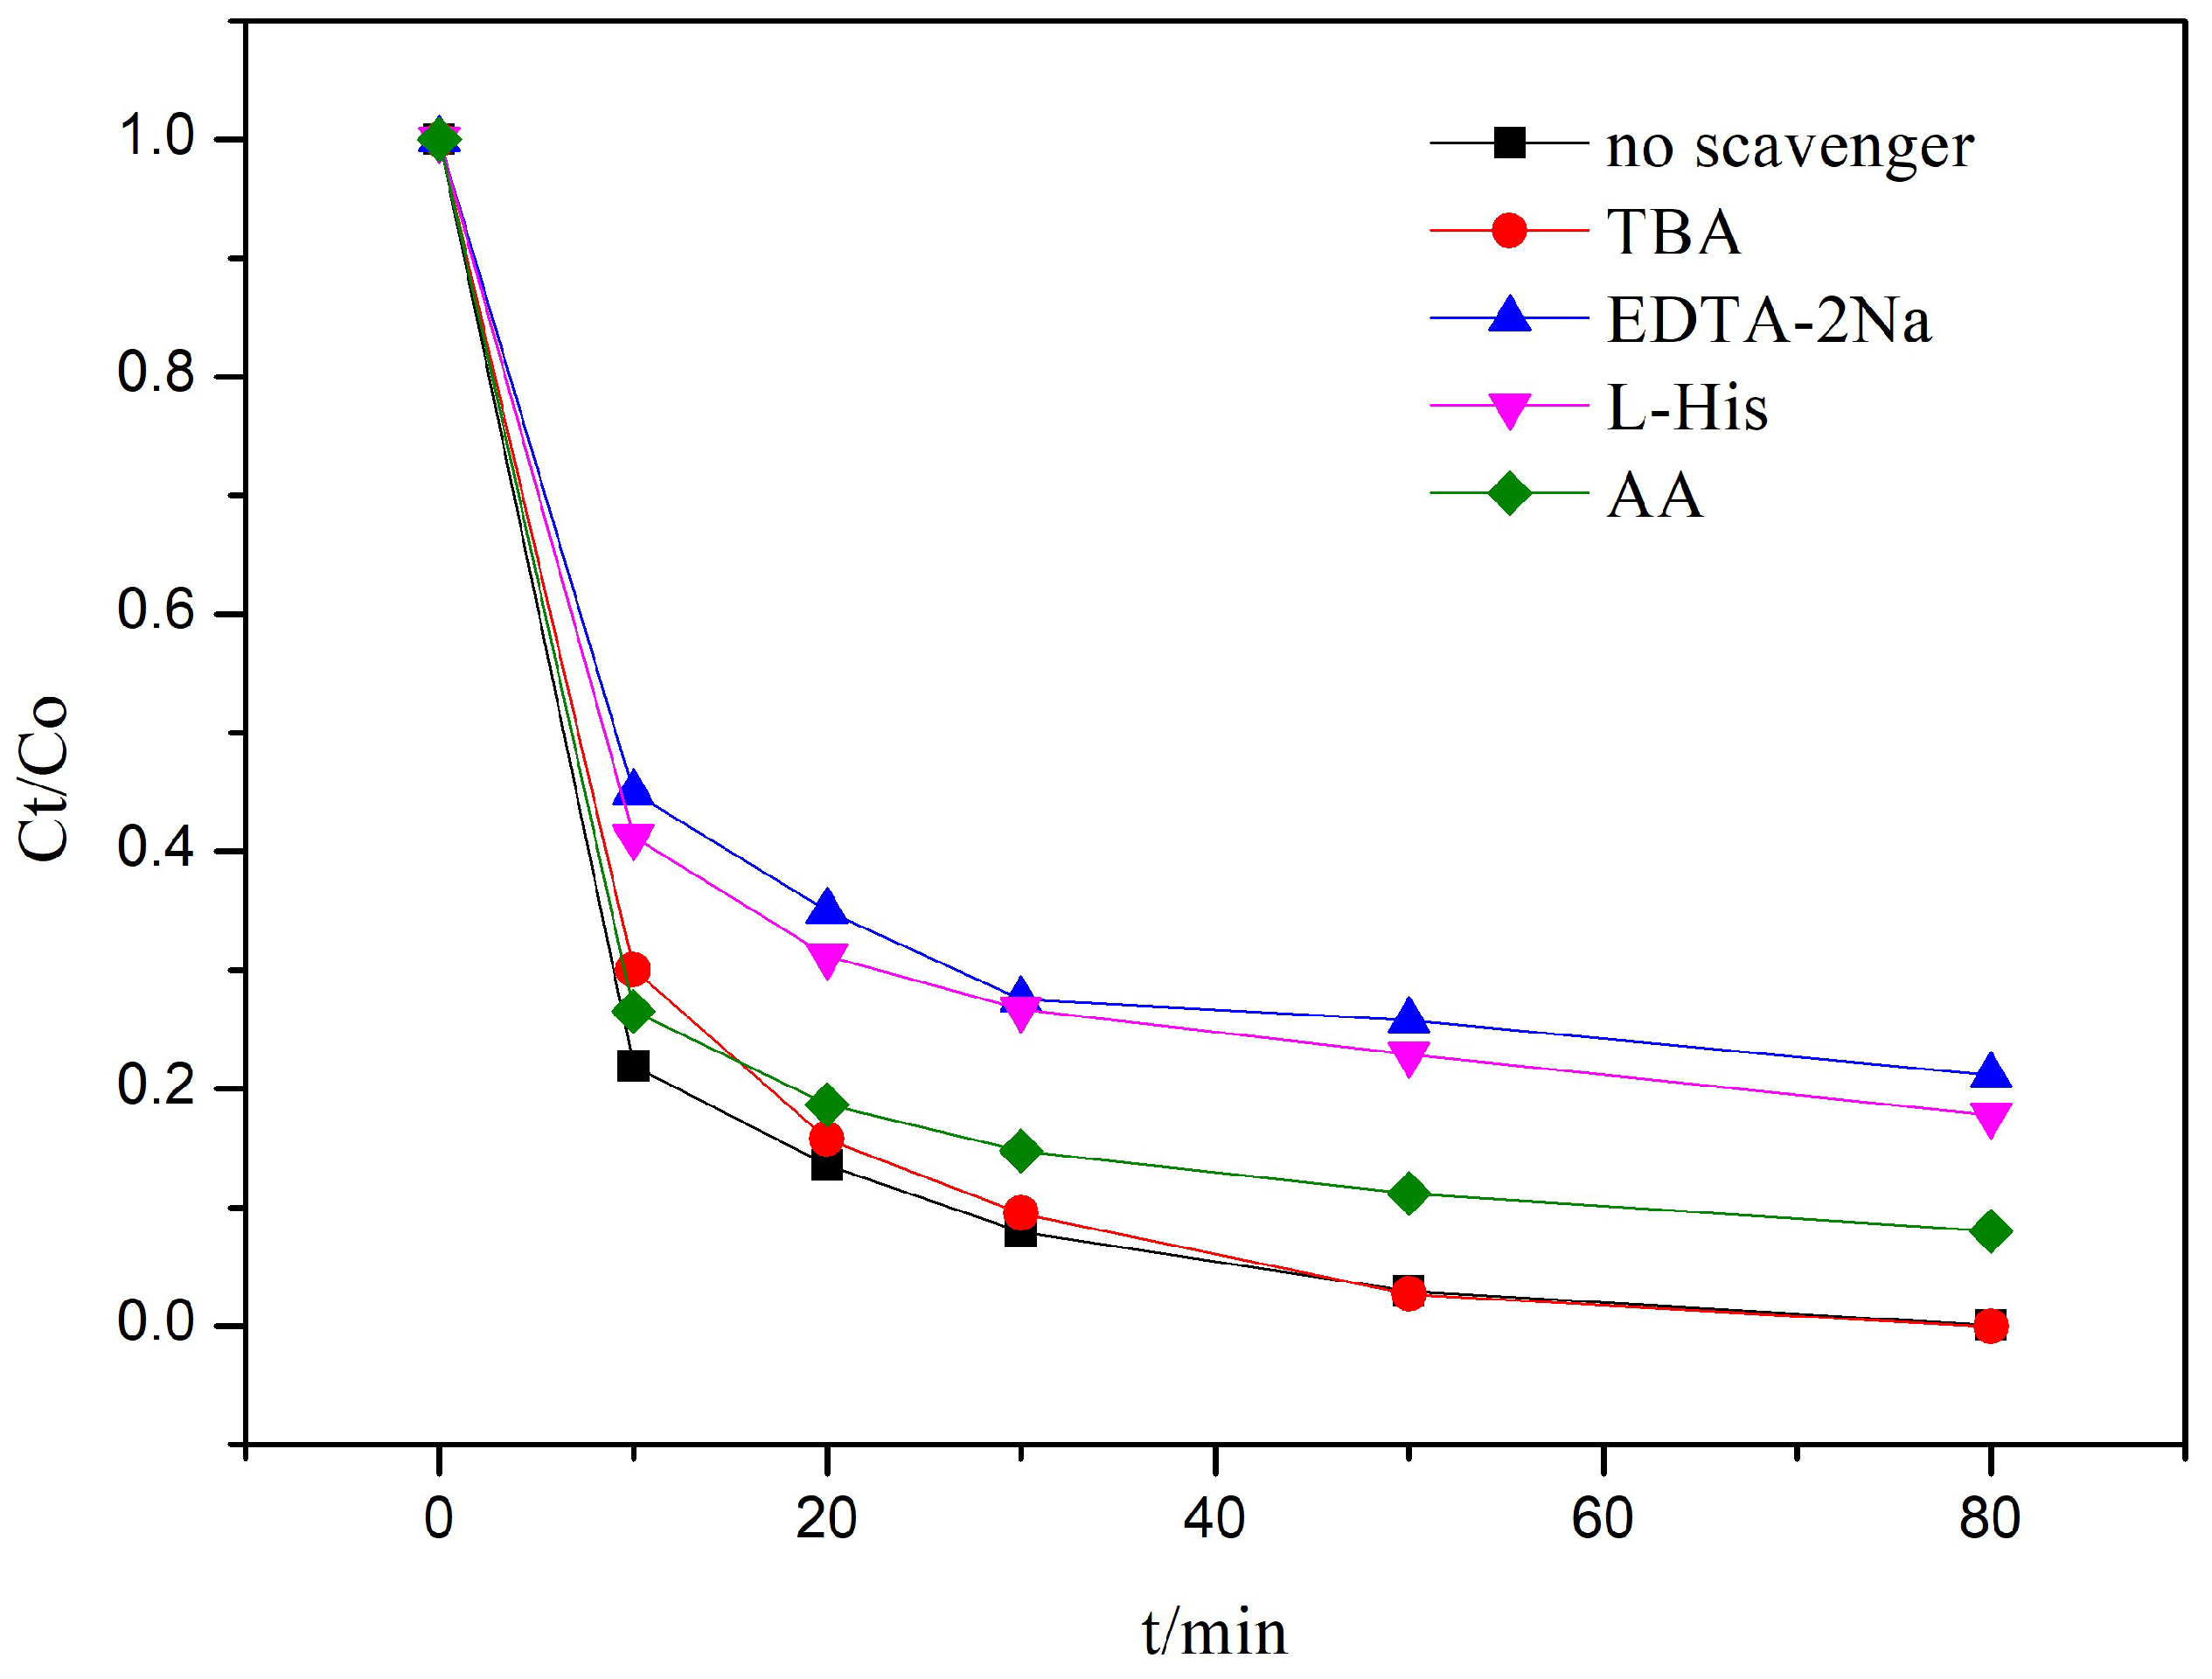
Figure 5.
TEM images of (a) nano TiO2, (b) 4% GO-TiO2, and 4% rGO-TiO2 (c) are shown at a scale of 200 nm, while (d) presents a high-magnification TEM image of 4% rGO-TiO2 at a scale of 5 nm. The inset of (d) highlights the lattice spacing.
Figure 5.
TEM images of (a) nano TiO2, (b) 4% GO-TiO2, and 4% rGO-TiO2 (c) are shown at a scale of 200 nm, while (d) presents a high-magnification TEM image of 4% rGO-TiO2 at a scale of 5 nm. The inset of (d) highlights the lattice spacing.
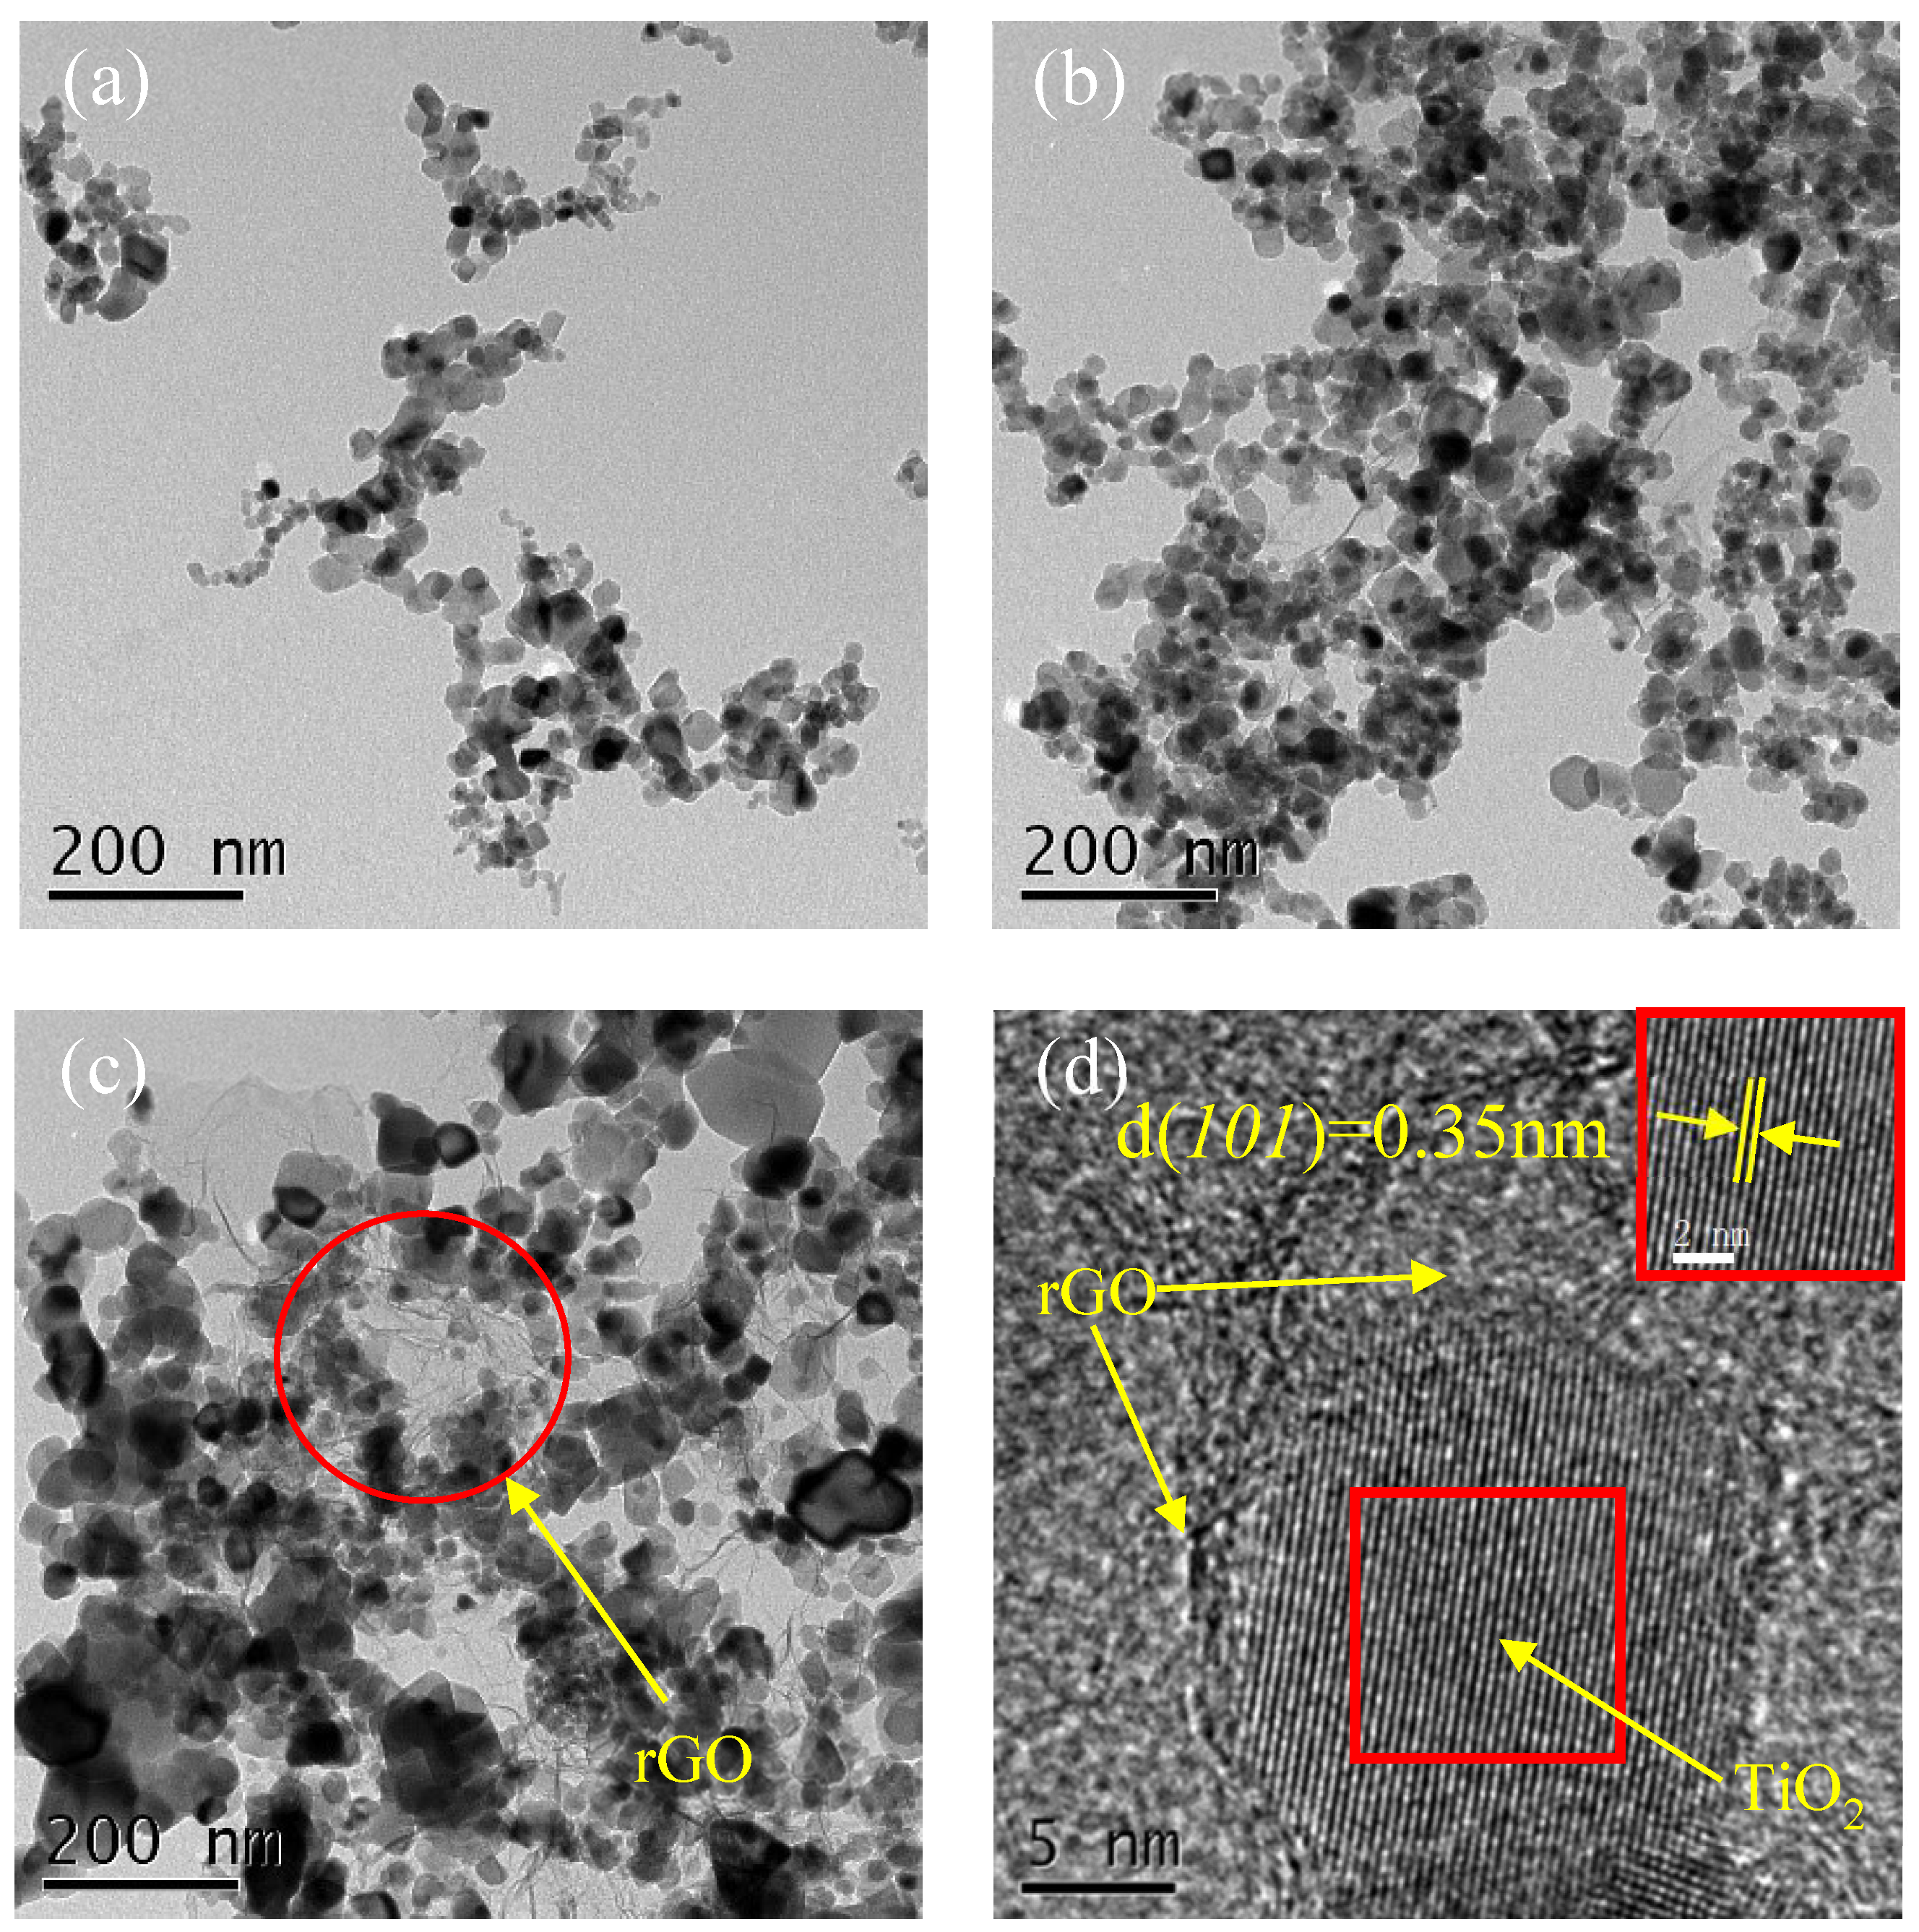
Figure 6.
XRD patterns of nano TiO2, 4% GO-TiO2 and 4% rGO-TiO2: A (101) corresponds to the (101) crystal plane of anatase, while R (110) refers to the (110) crystal plane of rutile, and so on for other crystal planes.
Figure 6.
XRD patterns of nano TiO2, 4% GO-TiO2 and 4% rGO-TiO2: A (101) corresponds to the (101) crystal plane of anatase, while R (110) refers to the (110) crystal plane of rutile, and so on for other crystal planes.
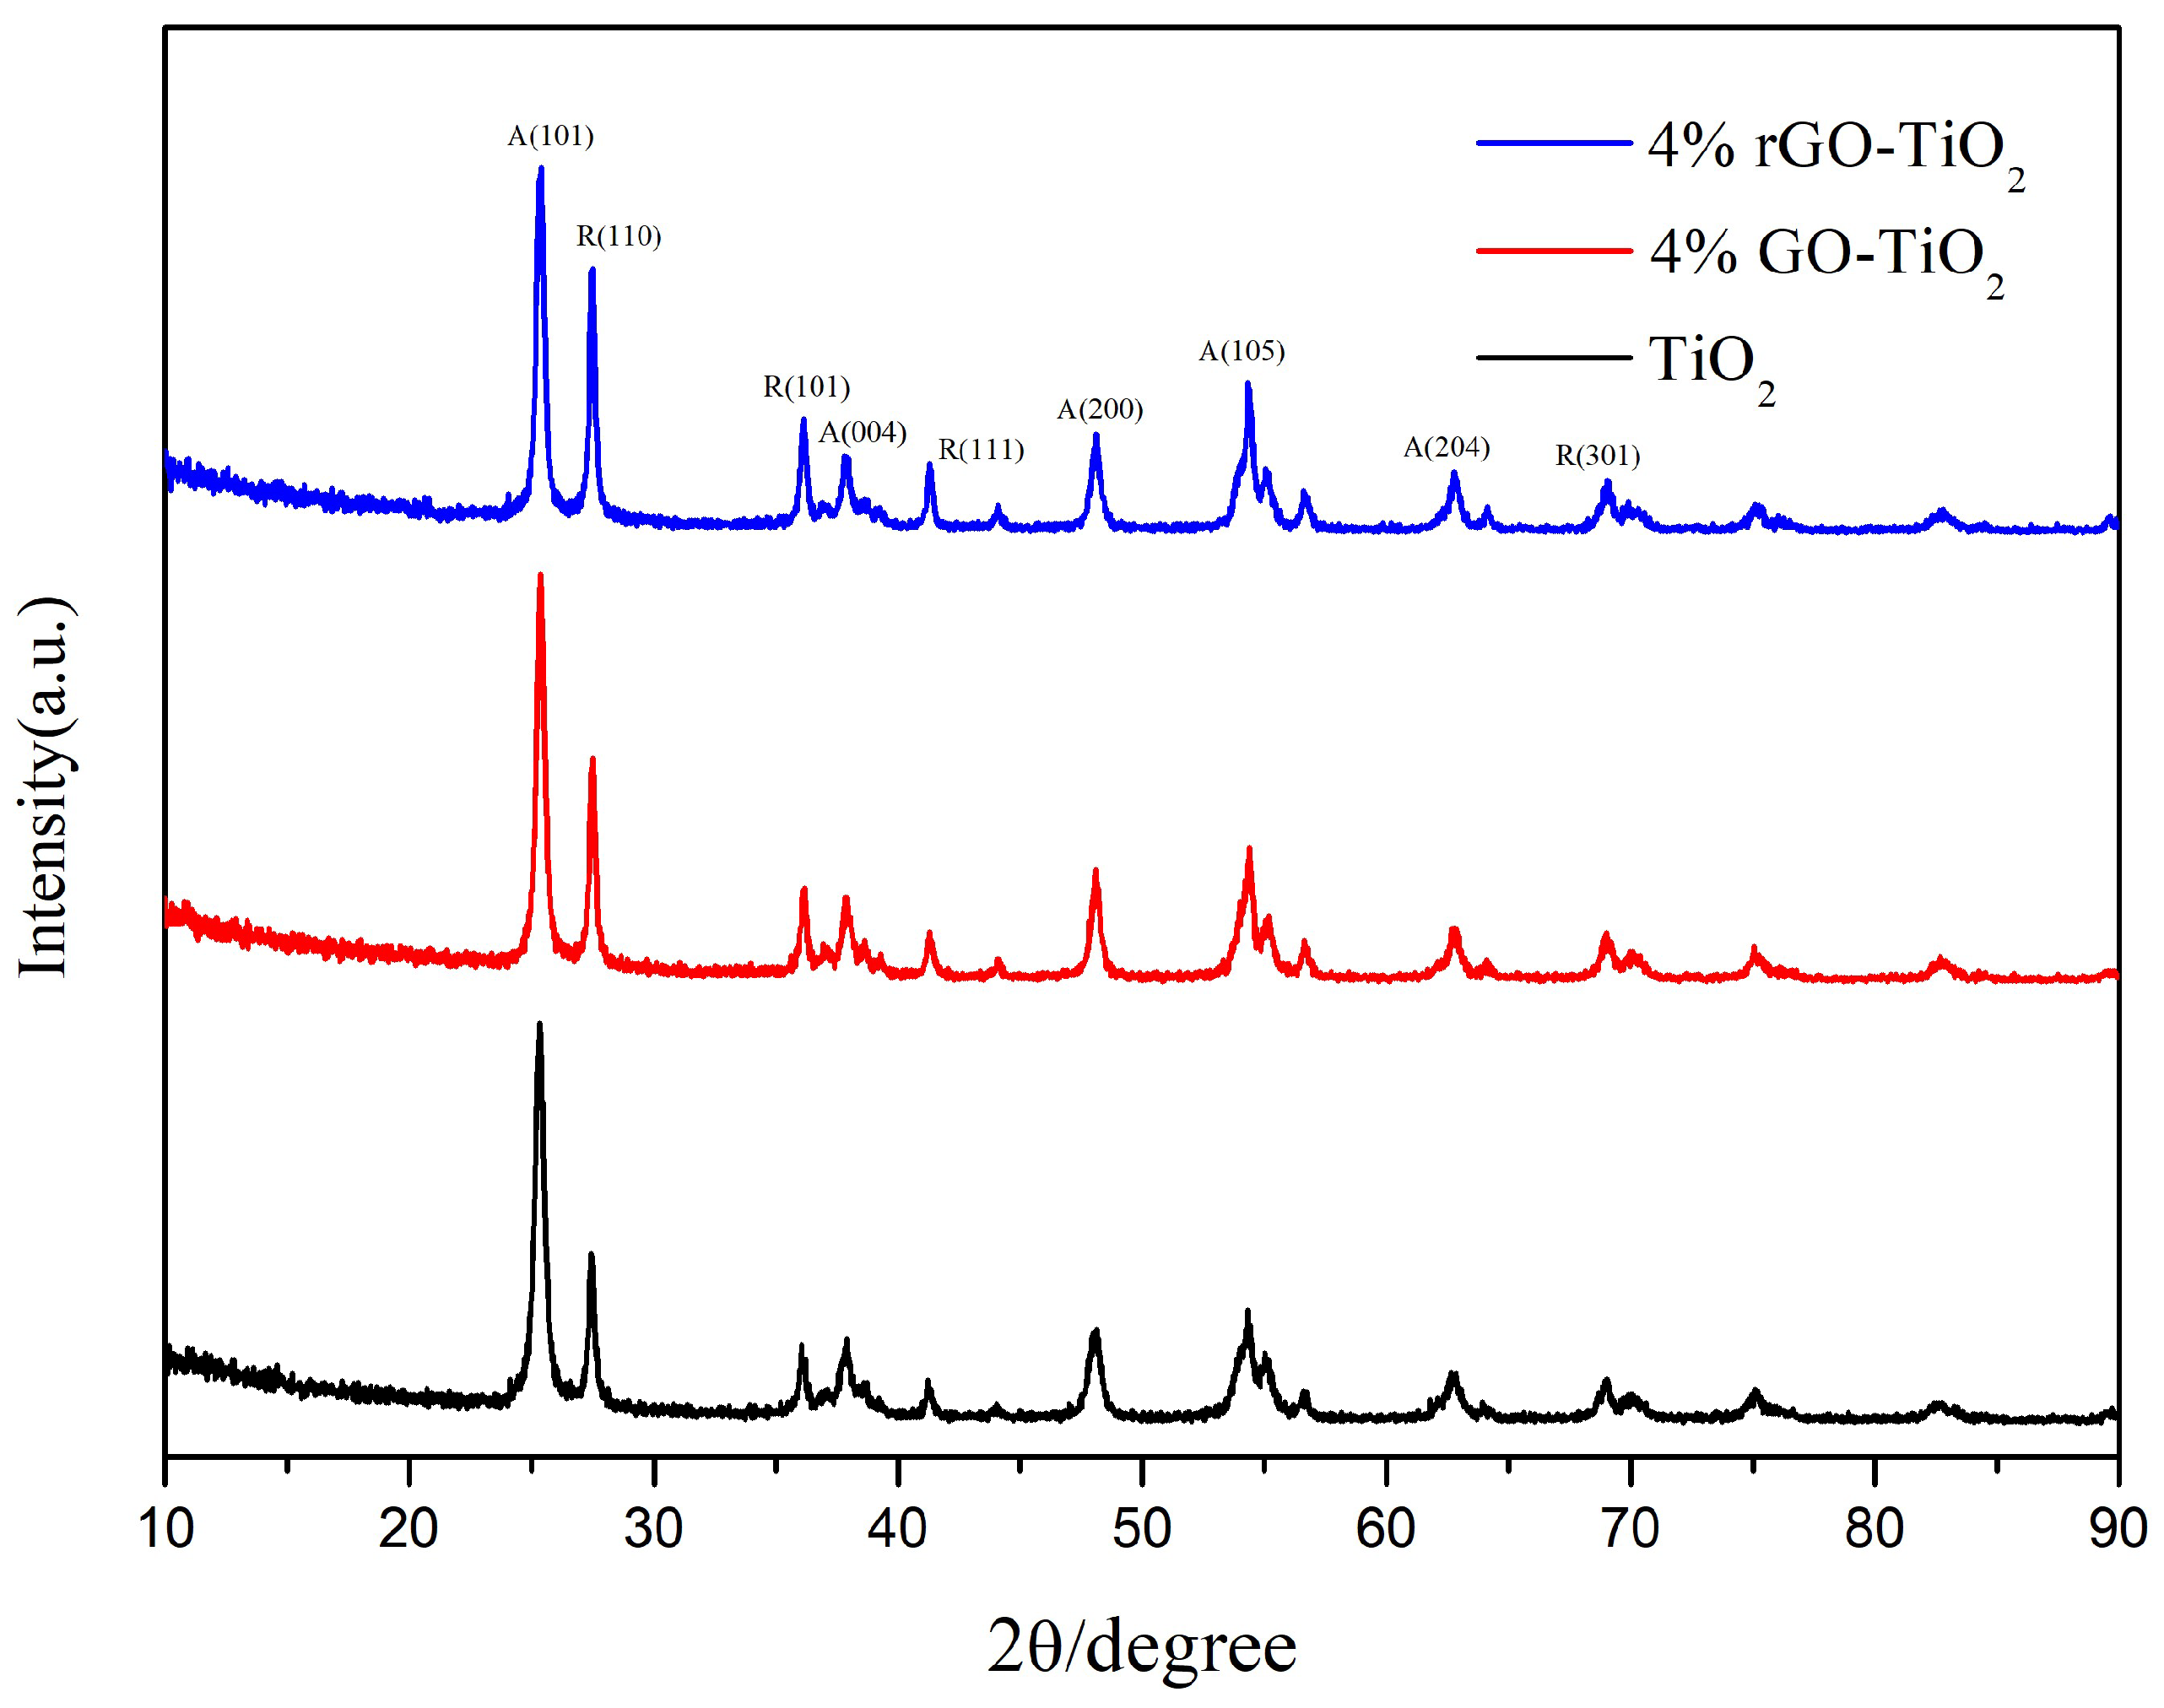
Figure 7.
Raman spectra of 4% GO-TiO2 and 4% rGO-TiO2 samples in the range of 100 to 2000 cm⁻1. The inset highlights the differences in the D band (associated with sp³ defects) and the G band (linked to sp² carbon) within the 1200 to 1800 cm⁻1 range. The ID/IG values of 4% GO-TiO2 and 4% rGO-TiO2 samples are 0.89 and 0.84, respectively.
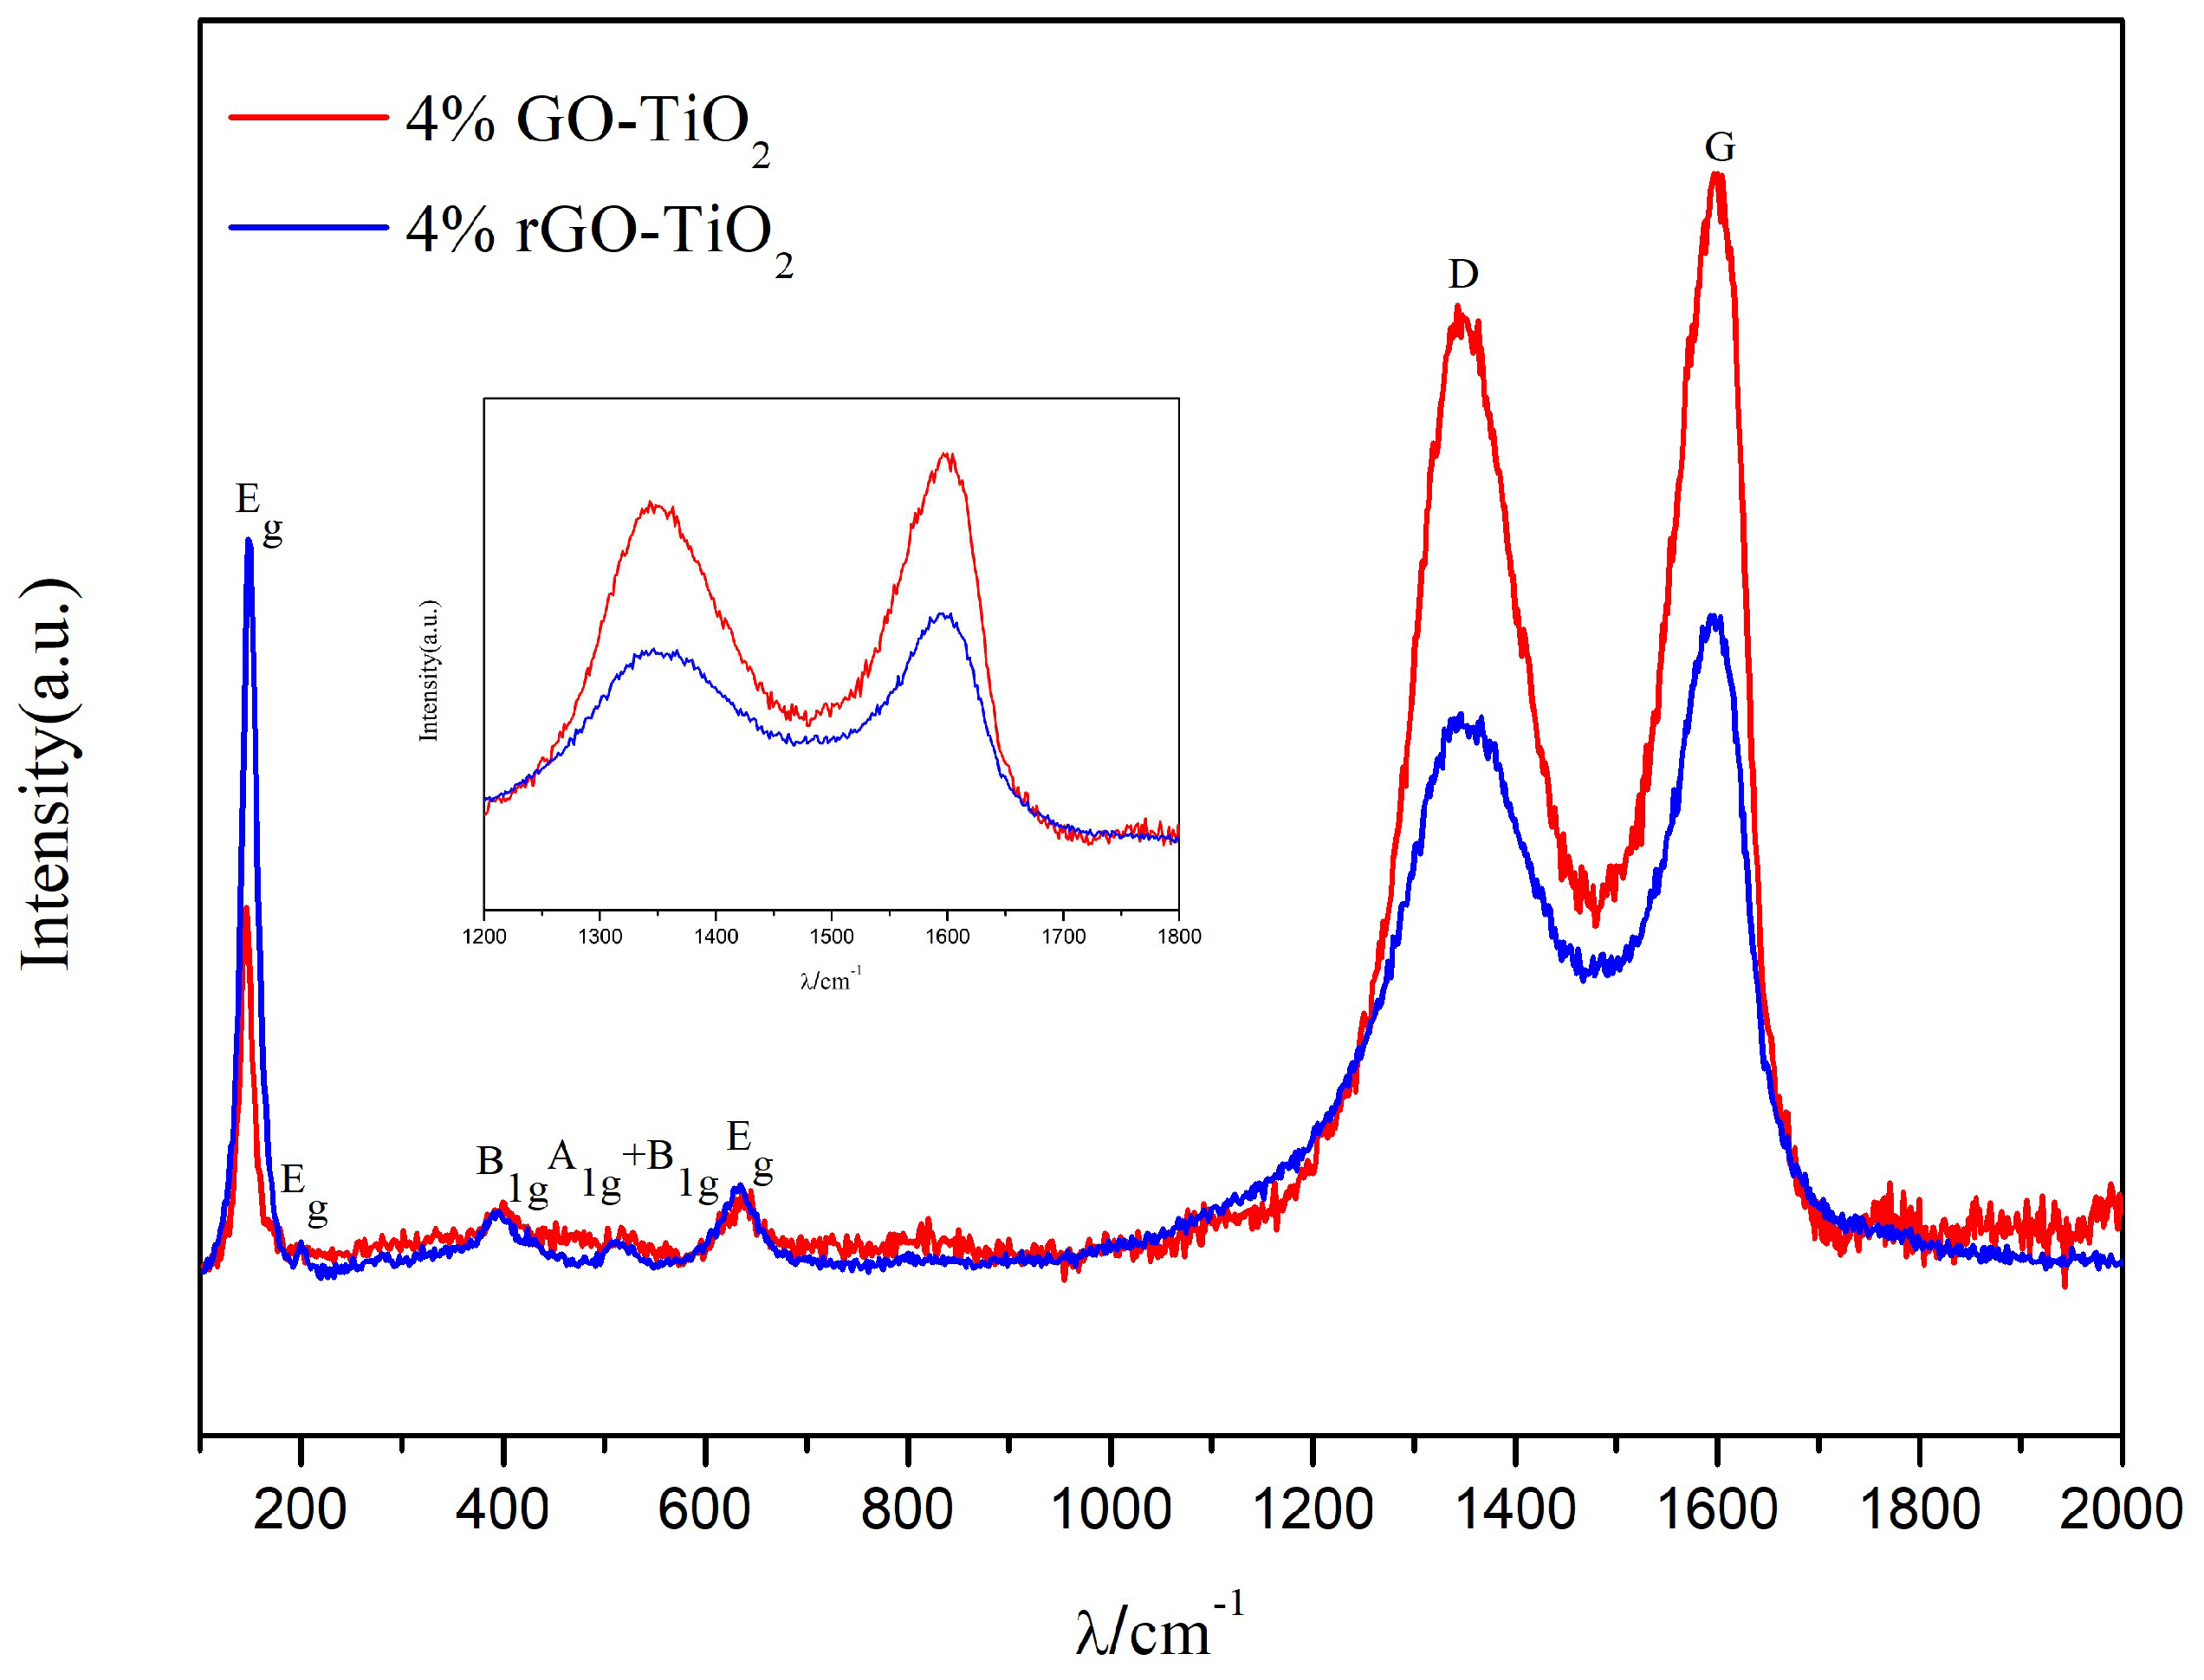
Figure 8.
Diffusive reflectance and absorbance spectra of nano TiO2, 4% GO-TiO2 and 4% rGO-TiO2.
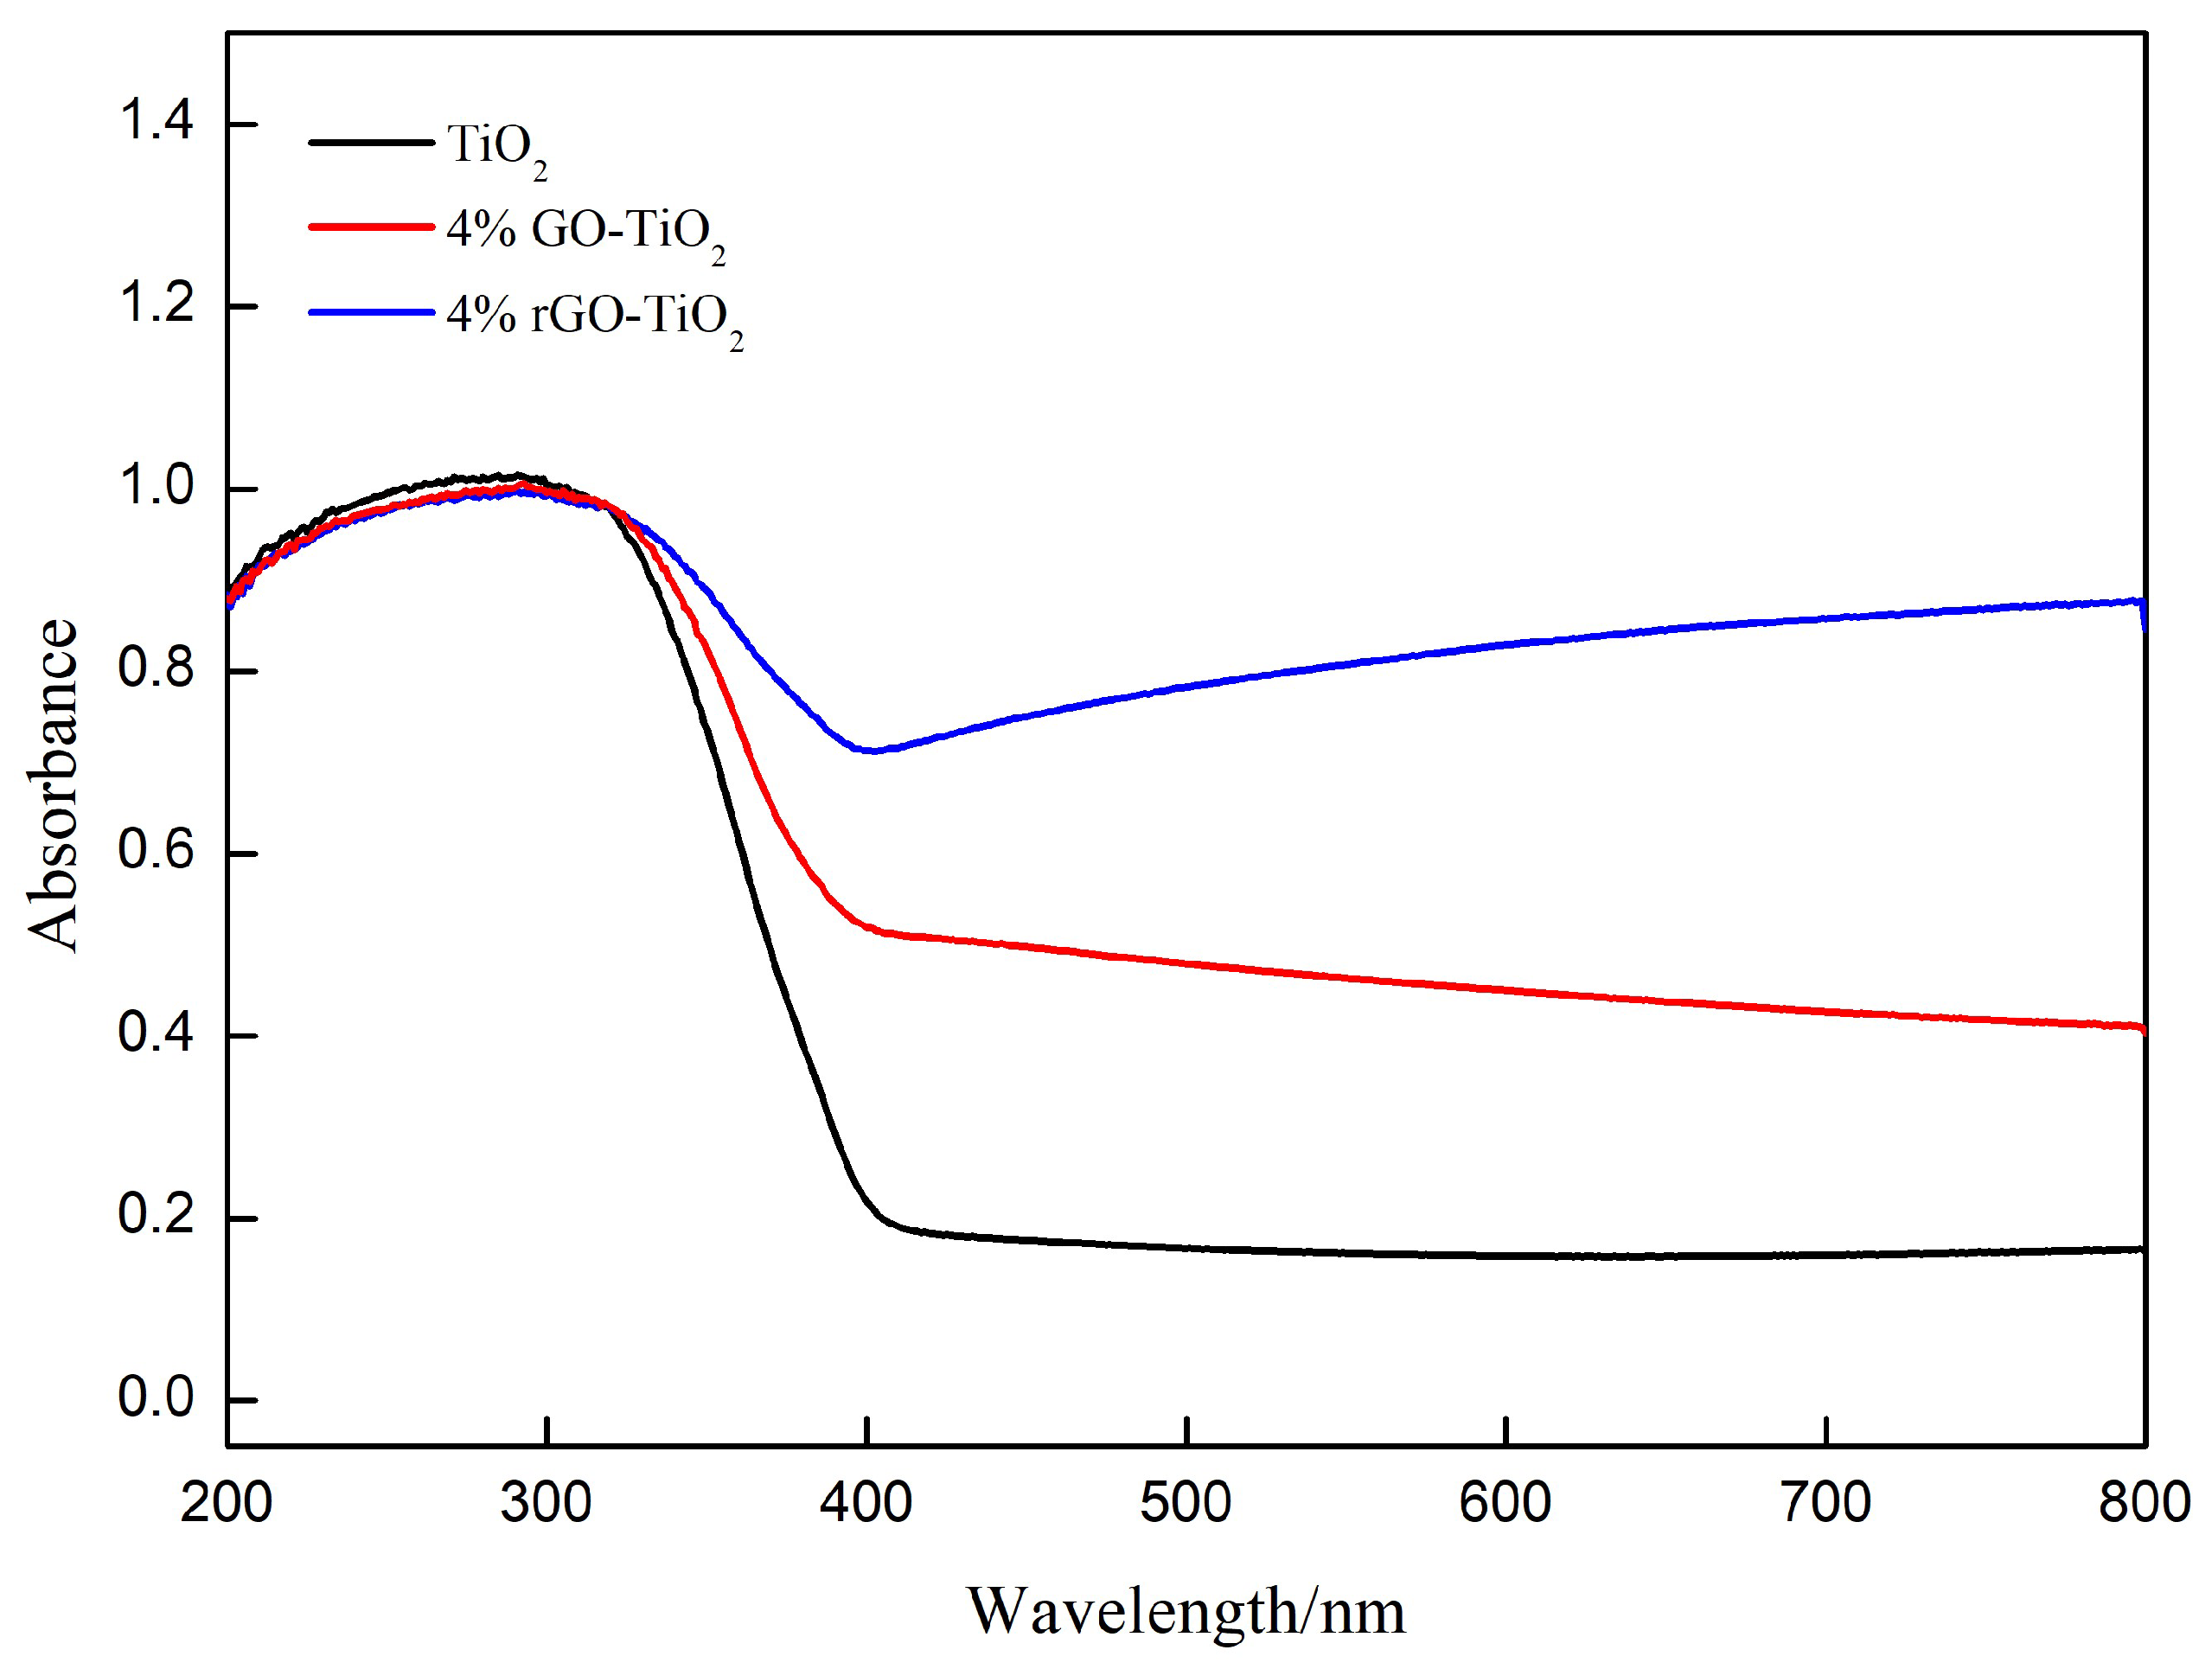
Figure 9.
XPS spectra of nano TiO2, 4% GO-TiO2 and 4% rGO-TiO2. The left panel shows the O 1s spectra, highlighting the oxygen vacancy peak observed at approximately 532 eV for the 4% rGO-TiO2 sample. The mid panel depicts the C 1s spectra, where the formation of the C-O-Ti bond is observed around 286-287 eV. The right panel exhibits the Ti 2p spectra. The Ti 2p3/2 peak remains unchanged, while a decrease in the Ti 2p1/2 peak is observed in the 4% rGO-TiO2 sample compared to 4% GO-TiO2.
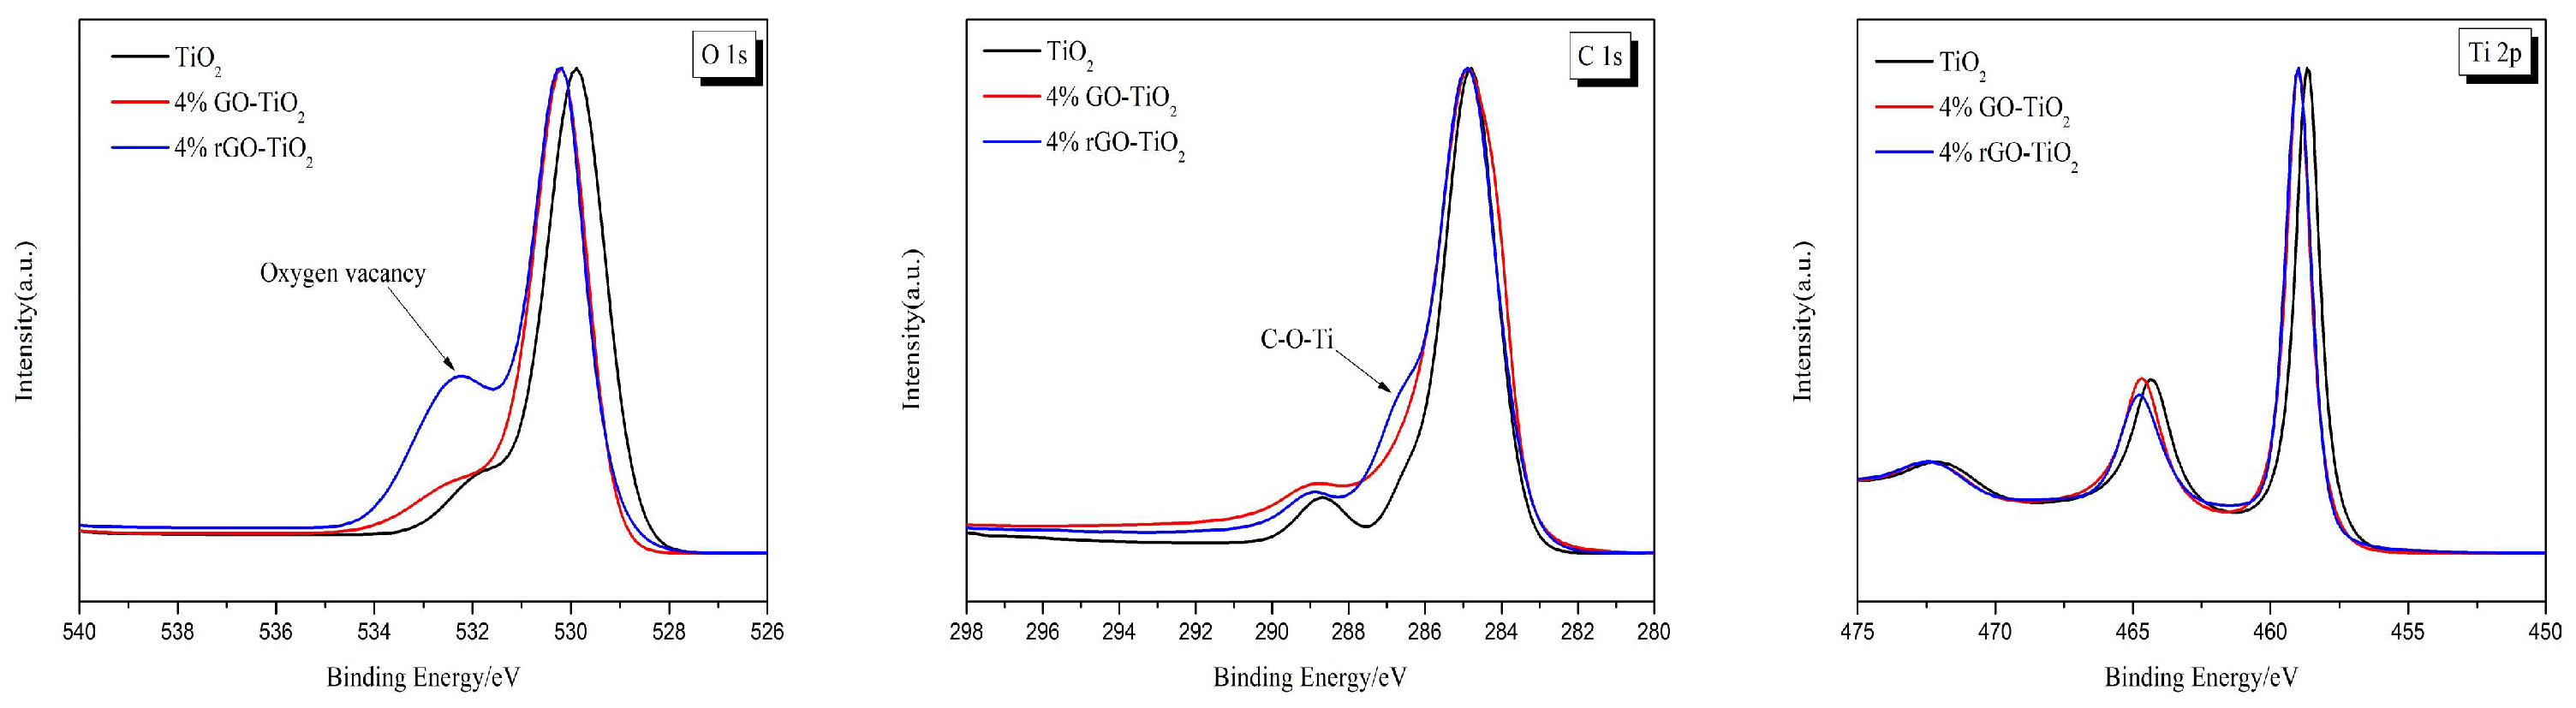

Table 1.
BET area, pore size and pore volume of nano TiO2, 4% GO-TiO2 and 4% rGO-TiO2.
| sample | SBET(m2/g) | pore volume (cm3/g) |
pore size (nm) |
|---|---|---|---|
| TiO2 | 45.91 | 0.1152 | 10.27 |
| 4% GO-TiO2 | 66.44 | 0.2405 | 13.96 |
| 4% rGO-TiO2 | 58.28 | 0.2483 | 15.85 |
Disclaimer/Publisher’s Note: The statements, opinions and data contained in all publications are solely those of the individual author(s) and contributor(s) and not of MDPI and/or the editor(s). MDPI and/or the editor(s) disclaim responsibility for any injury to people or property resulting from any ideas, methods, instructions or products referred to in the content. |
© 2024 by the authors. Licensee MDPI, Basel, Switzerland. This article is an open access article distributed under the terms and conditions of the Creative Commons Attribution (CC BY) license (http://creativecommons.org/licenses/by/4.0/).
Copyright: This open access article is published under a Creative Commons CC BY 4.0 license, which permit the free download, distribution, and reuse, provided that the author and preprint are cited in any reuse.


