
Submitted:
10 December 2024
Posted:
11 December 2024
You are already at the latest version
Abstract
Eosinophils are granulocytes involved in the effector phase of type 2 T cell immune responses, which are elevated in inflammatory conditions like ulcerative colitis (UC) and other allergic diseases. UC is a chronic inflammatory colon disease, marked by excessive eosinophil infiltration, upregulation of their regulatory molecules, and elevated Th2 cytokines, which contribute to mucosal inflammation and tissue damage. This research is the first to explore the dose-dependent effects of tartaric acid (TA), a naturally occurring organic acid, on eosinophil activation and Th2 cytokine response in both normal mice and a dextran sulfate sodium (DSS)-induced colitis model. Normal mice were treated with TA at varying doses (5 µg, 25 µg, and 50 µg/mouse/day), while colitis mice received 50 µg TA. Eosinophil activation markers (CD11b+, SiglecF+, CCR3+) and Th2 cytokines (IL-4, IL-13, IL-31), and IL-17 were assessed in peripheral blood leukocytes, lymph nodes, and splenocytes using flow cytometry. Additionally, mRNA expression levels of eosinophil-associated chemokines and cytokines in the splenocytes were quantified with real-time qPCR. Our results demonstrate a dose-dependent effect of TA, with the highest dose (50 µg) significantly increasing eosinophil activation markers, Th2 cytokines, IL-17, and mRNA expression of SiglecF, CCL11 and toll-like receptor 4 in normal mice. In colitis mice, treatment with 50 µg TA showed marked increases in IL-13 levels compared to untreated colitis mice, reflecting increased eosinophil recruitment to inflamed tissues. Moreover, mRNA expression of IL-5Rα was elevated in normal mice and colitis mice administered with TA. These results suggest that TA enhances eosinophil proliferation, upregulation of their regulatory molecules, and Th2 immune profiles, potentially worsening the severity of colitis.
Keywords:
eosinophils
; Th2 cytokines
; tartaric acid
; colitis
; mouse model
1. Introduction
Eosinophils are innate immune cells derived from myeloid lineage present across all vertebrates [1]. They represent a small fraction of the blood cell population and have a crucial role in type 2 T cell (Th2) responses. Under non-inflammatory conditions, eosinophils primarily reside within mucosal tissues including the respiratory and gastrointestinal (GI) tract. They are also found in the blood, LN, spleen, and bone marrow, where they contribute to various homeostatic functions [2]. Eosinophils are uniquely identified in peripheral blood and tissues by their bilobed nuclei, large specific granules containing cytokines, cationic proteins, and enzymes. Upon maturation, eosinophils express surface markers and receptors such as CD11b, SiglecF, CC-chemokine receptor 3 (CCR3), and the interleukin (IL)-5 receptor alpha (IL-5Rα) [3,4,5].
Eosinophils are distinctly recognized for their detrimental role in multiple inflammatory and allergic diseases including, ulcerative colitis (UC) asthma, atopic dermatitis (AD), and eosinophilic esophagitis [6,7,8,9]. Clinically, a high number of eosinophils, known as eosinophilia, manifest with a diverse array of symptoms including gastrointestinal problems, respiratory difficulties, skin rashes, and systemic inflammation [10,11,12]. Eosinophilia in the bloodstream or tissues may result from numerous factors, such as allergic reactions to food, parasitic infections, certain drugs, and inflammatory disorders [6,13,14,15]. UC is a chronic inflammatory bowel disease (IBD) affecting the colonic mucosa, characterized by continuous superficial inflammation limited to the colon [16]. Various factors actively contribute to the development and progression of UC patients, including an exaggerated immune response in the intestines [17,18]. Previous research showed that UC patients have notably higher levels of activated eosinophils than healthy individuals. Persistent blood eosinophilia is correlated with increased disease severity in these patients [19,20]. Understanding the factors that impact eosinophil accumulation is essential for elucidating the pathogenesis of eosinophil-related disorders and developing certain treatments.
AHAs, or alpha hydroxy acids, are organic acids featuring a hydroxyl group at the alpha position of the carboxyl group. Common AHAs, such as citric acid, tartaric acid (TA), and lactic acid, are widely used in cosmetic products. At high concentrations, AHAs lead to irritation, while low concentrations may offer advantages through epigenetic alterations of the inflammasome complex. [21]. Among these, TA, a naturally occurring organic acid mainly observed in fruits and beverages such as wine, has recently garnered attention for its potential immunomodulatory properties. TA is best known for its antioxidant and antimicrobial activities when consumed in appropriate amounts [22]. However, at higher concentrations, TA can have toxic effects [23]. Emerging evidence suggests TA may also influence immune responses, though its precise role remains unclear. Further studies are needed to clarify the role of TA in immune regulation in normal and disease states and to explore its potential in the exacerbation of immune-related diseases.
The regulation of eosinophilic inflammation is mediated by T-cells, notably Th2 cells. These cells can secrete an array of cytokines, including IL-4, IL-5, IL-13, and IL-31, that are integral to mediating allergic inflammation [24,25]. They can further induce the accumulation of eosinophils by stimulating their development, survival, activation, and movement to areas of inflammation [26], thereby exacerbating the inflammatory responses at these sites. In the inflamed intestine, eosinophil trafficking and activation are promoted by the Th2-mediated immune responses [27]. Inappropriate Th2 and Th17-mediated immune responses have been detected in UC patients. Th2 cells producing IL-13 and Th17 cells producing IL-17 are commonly present in the lamina propria mucosae, contributing to UC pathology [28]. However, whether the TA is involved in the modulation of these cytokines is not known. Understanding the modulation of these cytokines in response to TA treatment in both normal and colitis mice may help to elucidate the mechanisms underlying colitis, allergic reactions, and other eosinophil-related diseases.
Eosinophils possess receptors for various chemokines, adhesion molecules, and cytokines, enabling their involvement in regulating homeostasis, inflammation, and immune responses [12,24]. CCR3 is a G protein-coupled membrane receptor largely expressed on eosinophils and a subset of Th2 lymphocytes [29,30,31]. Researchers using CCR3 knockout mice discovered that reduction of CCR3 expression prevented eosinophil infiltration and minimized the generation of Th2 cytokines [4]. In colonic biopsies from UC patients, CCR3 expression was higher and more frequent than those with Crohn’s disease (CD) or controls, regardless of disease activity [32]. CC-chemokine ligand 11 (CCL11) often referred to as eotaxin-1, serves as a ligand for CCR3. CCL11 stimulates the migration of eosinophils and Th2 cells through its interaction with CCR3 [33]. CCL11 induces eosinophilia through both IL-5 and IL-5-independent mechanisms. Moreover, inflammatory diseases, including UC [34], allergic rhinitis [35], AD [36], asthma [37], and gastrointestinal conditions [38], have indicated high levels of CCL11. The production of eosinophils is noticeably affected by IL-5 through the IL-5Rα located on the surface of eosinophils [39]. IL-5 has been reported to contribute to IBD pathogenesis, and IL-5 receptor antagonists have demonstrated protective effects in DSS colitis mice by increasing colon length and decreasing the fecal blood index [40]. Eosinophils also express toll-like receptors (TLRs). TLR-mediated activation of eosinophils is implicated in UC [41].
This study aimed to assess whether TA induces immune responses that exacerbate Th2-dominant diseases. Additionally, it examined the expression of CCR3, CCL11, IL-5Rα, and TLRs in TA-treated normal and colitis mice to evaluate the role of TA in enhancing eosinophil-mediated inflammation through modulation of these receptors and ligands. This study included evaluation of dose-dependent effects of TA on eosinophil activation and Th2 cytokine responses in normal and colitis mice, with a focus on its role in immune modulation. Eosinophil activation markers were assessed in the spleen, PBLs, and LN, alongside Th2 cytokines and IL-17 levels. Additionally, expressions of eosinophil-regulatory molecules were quantified. This study suggests the need for further exploration of the mechanisms by which TA regulates eosinophil activity and Th2 cytokine production, which may have implications for the management of immune-related diseases such as UC.
2. Results
2.1. Expression Levels of Eosinophil Activation Markers in PBLs of Normal Mice Treated with Tartaric Acid (TA)
The frequencies of various eosinophil markers were analyzed in both untreated and TA-treated normal mice. Specifically, the presence of CD11b+, SiglecF+, CCR3+, SiglecF+CD11b+, and SiglecF+CCR3+ cells were assessed in PBLs collected from 8-week-old mice by flow cytometry. Normal mice administered 50 µg TA had significantly higher frequencies of SiglecF+ (p < 0.05), CCR3+ (p < 0.05), and SiglecF+CCR3+ (p < 0.05) compared to normal controls (Figure 1B,C,E). In addition, the frequencies of CCR3+ (p < 0.05) and SiglecF+CCR3+ (p < 0.05) cells were significantly increased in mice treated with 50 µg TA as opposed to mice administered 5 µg TA (Figure 1C,E). These results indicate that TA is important for inducing eosinophil responses, as indicated by the frequencies of SiglecF+, CCR3+, and SiglecF+CCR3+ cells. The frequencies of CD11b+ and SiglecF+CD11b+ cell, another marker associated with eosinophil activation, did not differ significantly between the control and TA-treated groups (Figure 1A,D). Figure 1F provides the gating strategy used to identify and quantify the eosinophil populations within the PBLs.
2.2. Increased frequencies of SiglecF+ Cells in LN of TA-Treated Mice
To further examine the effects of TA on the eosinophil activation within LN, the frequencies of CD11b+, SiglecF+, CCR3+, SiglecF+CD11b+, and SiglecF+CCR3+ cells were assessed in 8-week-old TA-treated mice using flow cytometry. The study detected a significant upregulation in the frequencies of SiglecF+ cells in mice administered 50 µg TA compared to normal controls (p < 0.05) and the mice receiving 5 µg TA (p < 0.05), showing the dose-dependent effects of TA on SiglecF+ eosinophils (Figure 2B). This indicates that higher doses of TA selectively enhance SiglecF+ eosinophil expression within LN, and the proliferation of these SiglecF+ eosinophils is more prominent at higher TA doses. Other markers, such as CD11b+, CCR3+, SiglecF+CD11b+, and SiglecF+CCR3+, did not show significant differences between normal control and TA-treated mice (Figure 2A,C,D,E). Figure 2F outlines the gating strategy employed for the LN analysis.
2.3. Upregulation of SiglecF+ and SiglecF+CCR3+ Cells in the Spleen of TA-Treated Mice
The influence of TA on splenic eosinophils in mice was assessed by measuring the frequencies of CD11b+, SiglecF+, CCR3+, SiglecF+CD11b+, and SiglecF+CCR3+ cells using flow cytometry. The results showed that the frequencies of SiglecF+ cells (p < 0.05) and SiglecF+CCR3+ cells (p < 0.001) were significantly increased in mice treated with 50 µg TA compared to those in the control group (Figure 3B,E). In addition, when mice treated with 25 µg TA were compared to those in the control group, the frequencies of SiglecF+ cells (p < 0.05) and SiglecF+CCR3+ cells (p < 0.05) were also increased (Figure 3B,E). This suggests that the medium and high doses of TA significantly enhanced splenic eosinophil proliferation and activation. No significant changes were found in the frequencies of CD11b+, CCR3+, and SiglecF+CD11b+ cells in any group (Figure 3A,C,D). The gating strategy used to identify splenic eosinophil populations is shown in Figure 3F.
2.4. Increased Th2 Cytokine Expression in TA-Treated Mice
Eosinophils have been extensively linked to Th2 immunity [42]. To further study whether the Th2 response, which is closely associated with eosinophil activation and is also affected by TA treatment, the frequencies of Th2 cytokine-producing cells in the LN and PBLs of untreated normal mice and TA-treated mice were analyzed. These cytokines were significantly increased in the LN of normal mice treated with 50 µg TA compared to the normal control group (Figure 4A–D). IL-4 and IL-13, which are important for Th2 cell maturation and eosinophil recruitment in LN, were significantly elevated in 50 µg TA-treated mice compared with the normal control group (p < 0.05), reflecting an enhanced Th2 response (Figure 4A,B). Additionally, the frequencies of IL-31 expressing cells were also significantly increased in the 50 µg TA group (p < 0.05) (Figure 4C), which is consistent with its role in promoting inflammation and pruritus. IL-17, a cytokine known to play a role in inducing Th2 immune responses[43], was significantly increased in this 50 µg TA group (p < 0.05) (Figure 4D). This suggests that TA is also involved in IL-17 production and thus in immune regulation. Interestingly, the lower TA doses (5 µg and 25 µg) did not elicit such pronounced cytokine responses, indicating that the dose of TA is important for activating the Th2-mediated immune response. No significant differences were detected in the PBLs from untreated and TA-treated mice (Figure 4E–H). Figure 4I shows the gating strategy implemented for LN analysis from untreated and 50 µg TA-treated normal mice.
2.5. Changes in IL-5, IL-5Rα, and CCL11 mRNA Expression After TA Administration to Mice
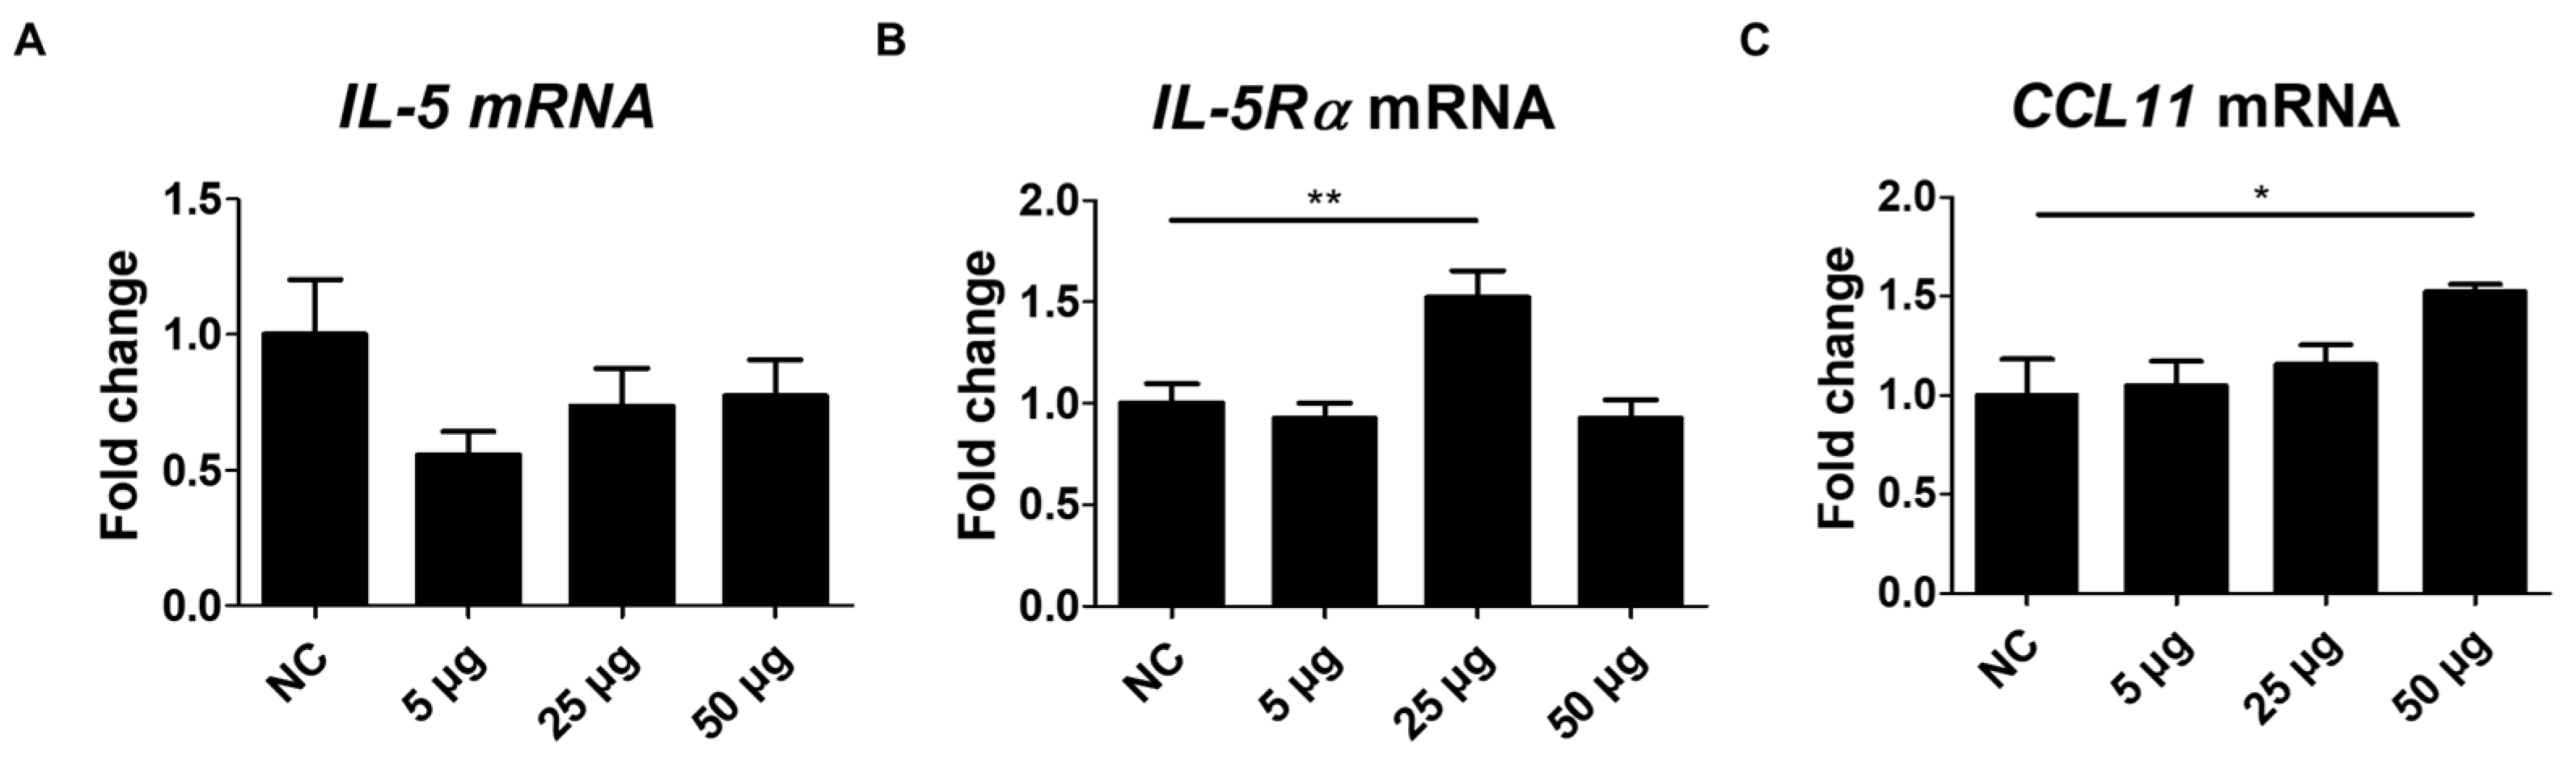
To further address the effects of TA on eosinophils, the expressions of IL-5, IL-5Rα, and CCL11 were assessed in the spleen tissues of TA-treated mice. IL-5, a pro-inflammatory cytokine involved in the development, activation, and trafficking of eosinophils via the IL-5Rα [44], showed no significant difference between the untreated and TA-treated mice (Figure 5A). However, IL-5Rα expression levels were significantly enhanced in mice treated with 25 µg TA relative to normal controls (p < 0.01) (Figure 5B). No increase in IL-5Rα was observed in mice treated with 50 µg TA. This suggests that 25 µg TA is adequate to increase IL-5Rα in mice, and increasing the dose does not directly correlate with an increase in receptor expression levels.
CCL11, a chemokine that selectively attracts eosinophils to the site of inflammation and contributes to polarized Th2 immune responses [37], was significantly increased in mice administered 50 µg TA (p < 0.05) (Figure 5C). Elevated CCL11 levels in the spleen tissues of 50 µg TA-treated mice suggest an enhanced chemotactic environment that may contribute to Th2 immune responses by promoting eosinophil accumulation and activation. The expression of IL-5, IL-5Rα, and CCL11 was unchanged in 5 µg TA-treated mice (Figure 5A–C), indicating that low-dose TA did not affect eosinophil activation. Collectively, these results suggest that IL-5Rα and CCL11 were upregulated in response to TA treatment, emphasizing a possible role for IL-5Rα and CCL11 in mediating eosinophil activation in mice.
Figure 5.
Analysis of IL-5, IL-5Rα, and CCL11 expression in mice administered TA at doses of 5 µg, 25 µg, or 50 µg using real-time qPCR. mRNA expression levels of IL-5, IL-5Rα, and CCL11 were measured via qRT-PCR in 8-week-old mice. (A-C) show the expression levels of IL-5, IL-5Rα, and CCL11 in untreated and TA-treated mice (n=6). Statistical significance was assessed using the Student’s t-test. Data are presented as means and error bars represent standard deviations. * p < 0.05, ** p < 0.05.
2.6. Eosinophil Identification in LN of TA-Treated Mice by Transmission Electron Microscope
TEM showed a marked increase in the number of eosinophils in the LN of mice treated with 50 µg TA (Figure 6B). High-resolution images clearly show typical eosinophils characterized by granular cytoplasm and two-lobed nuclei in the LN of mice treated with 50 µg TA. In contrast, normal controls showed no eosinophils in the LN (Figure 6A). This observation suggests that daily administration of 50 µg TA for 10 days plays a role in eosinophil production in the LN.
2.7. Effects of TA on DSS-Induced Colitis in Mice
A DSS model was constructed to evaluate the effects of TA in colitis mice (Figure 7A). To induce colitis, 4% DSS was provided in the drinking water for 7 days, followed by regular water for 3 days. To determine the effects of TA, a separate group of mice was given 50 µg TA together with DSS for the first 7 days, and then 50 µg TA alone for the next 3 days. Body weight was tracked throughout the study (Figure 7B). Colitis mice administered TA show a decrease in body weight, especially compared with the normal control group and the group treated with 50 µg TA. No significant difference in body weight was observed between the DSS group and DSS administered 50 µg TA group. Similarly, colon length was reduced in both colitis groups compared with the control groups, and there was no difference between colitis mice treated with or without TA (Figure 7C). Eosinophils with early-stage granules were observed in the LN of colitis mice administered TA by TEM, but no eosinophils were found in the LN of colitis mice not administered TA (Figure 7D). TA can accelerate the appearance of eosinophils in mice with colitis.
2.8. mRNA Expression of Eosinophil-Related Regulatory Molecules After TA Administration to Mice with Colitis
Several regulatory molecules play a key role in the recruitment of eosinophils into tissues during inflammatory responses [45]. To identify eosinophil-related regulatory molecules in colitis mice according to TA treatment, mRNA levels of CCR3, SiglecF, TLR2, and TLR4 in the spleen were quantified. Untreated colitis mice and 50 µg TA-treated colitis mice exhibited significantly increased expression levels of CCR3 (p < 0.001 and p < 0.05, respectively) and SiglecF (p < 0.01 and p < 0.05, respectively) compared to the normal control group (Figure 8A,B). TLR2 expression levels were significantly higher in both colitis (p < 0.001) and TA-administered colitis (p < 0.05) mice compared to the normal control group (Figure 8C). TLR4 expression levels were also increased in both colitis and TA-administered colitis mice compared to the normal control group (p < 0.001). In normal mice administered TA, the expression of SiglecF (p < 0.05) and TLR4 (p < 0.05) was significantly increased compared to normal mice that were not administered TA (Figure 8B,D). TLR2 and TLR4 expression was significantly higher in colitis mice compared to TA-administered normal mice. However, there was no significant difference in CCR3, SiglecF, TLR2, and TLR4 expression depending on whether TA was administered or not in colitis mice. This suggests that 50 µg of TA administration for 10 days did not significantly affect eosinophil-related regulatory molecules in colitis mice.
2.9. Th2 Cytokine mRNA Expression by TA Administration in Colitis Mice
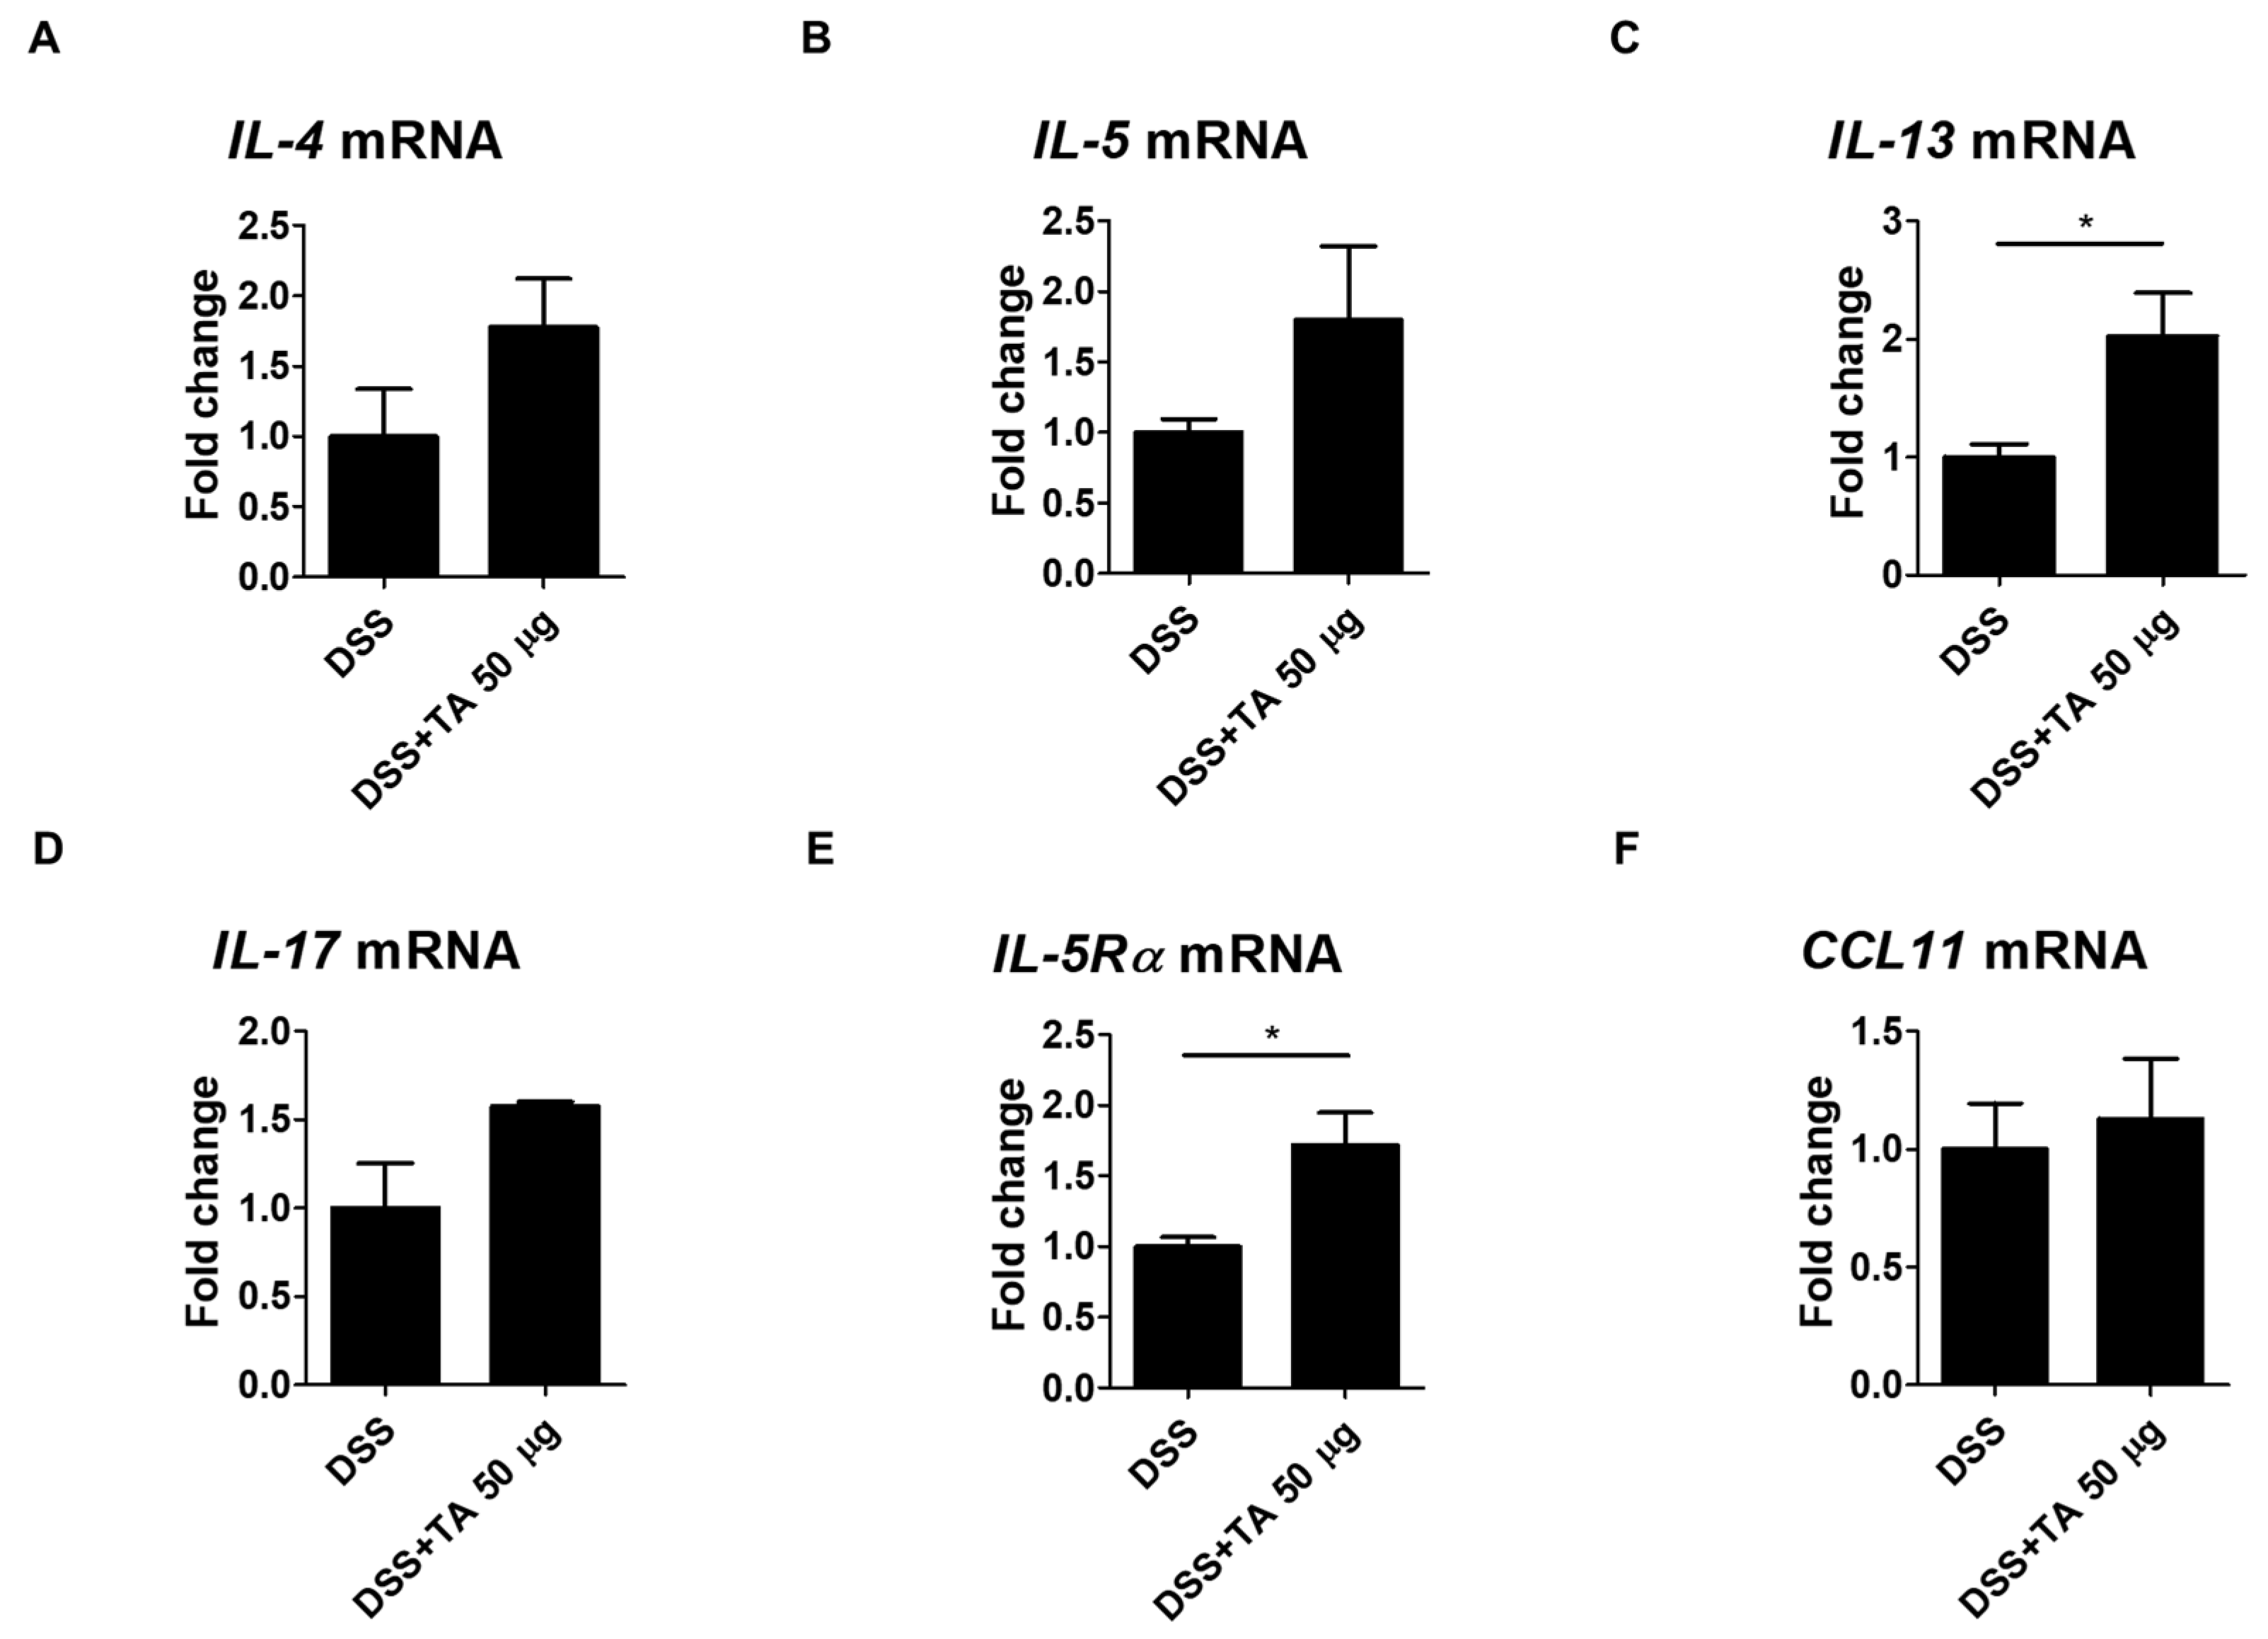
Eosinophil activation is influenced by Th2 cytokines and their levels were elevated in the intestinal tissues of patients with UC [46]. The mRNA expression levels of Th2 cytokines and IL-17, IL-5Rα, and CCL11 were analyzed in TA-treated and TA -non-treated colitis mice. IL-13 is known to induce inflammation and contribute to UC pathology [47]. IL-13 (p = 0.05) and IL-5Rα (p < 0.05) were significantly increased in the TA-administered colitis group compared with the unadministered colitis group (Figure 9C,E). This suggests that TA treatment may increase these markers and aggravate colitis. The levels of IL-4, IL-5, IL-17, and CCL11 were increased in the TA-administered colitis group compared with the unadministered colitis mice, but this increase was not statistically significant (Figure 9A,B,D,F). These results suggest that TA can selectively amplify specific Th2 cytokine responses, especially IL-13 and IL-5Rα, in colitis, which may negatively affect colitis symptoms.
3. Discussion
Eosinophils exhibit a regulatory role in maintaining immune homeostasis. Eosinophilic diseases are well-defined by elevated eosinophil numbers either in specific tissues and/or in the blood (eosinophilia), where eosinophils promote tissue damage and inflammation through receptors, chemokines, cytotoxic granules, and cytokines [12]. Eosinophilia and localized eosinophil accumulation are commonly caused by eosinophilic gastrointestinal disorders, including eosinophilic esophagitis and ulcerative colitis (UC) [48,49] and allergic reactions in asthma [50]. TA is a naturally occurring organic acid found mainly in fruits and beverages such as wine [51]. It is also widely used as a food additive, antioxidant, and in pharmaceutical formulations [52]. In pharmaceutical formulations for humans, the acceptable daily intake (ADI) for TA is 30 mg/kg body weight (BW) [53]. For rodents, the ADI was 500 mg sodium tartrate/kg BW at which no adverse effects were observed based on gastrointestinal effects, equivalent to 25 mg TA/day per 20 g mouse [54]. However, the specific effects of TA on eosinophilic and Th2 cytokine responses have not been systematically investigated.
The present work aimed to provide important insights into the effects of TA on eosinophil activation and Th2 cytokine responses in normal healthy and colitis mice. Specifically, with a main focus on how different doses of TA have distinct immunological effects in these mice. Current research has found TA exerts a dose-dependent effect on eosinophil activation makers, Th2 cytokines, IL-17, and eosinophil-related regulatory molecules such as TLR2, TLR4, IL-5Rα, and CCL11. The high dose (50 µg) of TA significantly alters the expression levels of eosinophil activation markers, promoting Th2 cytokine profiles, IL-17, TLR4, and CCL11 expression levels in normal healthy control mice. This broad upregulation suggests that TA primes the immune response even in the absence of inflammation. Moreover, colitis mice treated with 50 µg TA exhibited significant increases in IL-13 and IL-5Rα levels, which likely contribute to the exacerbation of colitis symptoms rather than promoting resolution. These findings underscore the potential of TA to modulate immune responses in both healthy and inflammatory conditions, offering new insights into its role in eosinophil-driven inflammation.
CCR3 is a G protein-associated membrane receptor largely present on eosinophils and related to UC and allergic diseases [29,30,32]. It is additionally found on Th2 cells and plays a role in their development and the secretion of Th2 cytokines [29]. Researchers using CCR3 knockout mice have found that reduced CCR3 expression inhibited eosinophil infiltration and reduced the release of Th2 cytokines [4]. In the current research, upregulation in the frequencies of CCR3+ cells were noticed in the PBLs of normal mice treated with 50 µg TA compared to controls. CCR3 expression in colonic biopsies from UC patients was higher and more frequent than in controls, regardless of disease activity [32]. However, in this study, no difference in CCR3 mRNA levels was observed between TA-treated and untreated colitis mice. SiglecF, a glycan-binding protein prominently expressed on mature circulating mouse eosinophils, is known to regulate eosinophilic inflammation. [55]. In our study, treatment with 50 µg TA to normal mice led to significantly enhanced frequencies of SiglecF+ cells compared to normal control group and 5 µg TA-treated group in LN. At this does, SiglecF+ and SiglecF+CCR3+ cell frequencies were significantly raised in the PBLs and spleen of normal mice. This increase was not detected in normal control mice or in normal mice administered with 5 µg TA. In colitis mice, SiglecF+ expression was not significantly influenced in TA-administered colitis mice compared to untreated colitis mice. Upregulation of these eosinophil markers in normal mice administered TA suggests that higher concentrations of TA promote eosinophil proliferation or generation, thereby increasing recruitment and activation. There are several studies on TA and disease, including its ability to improve experimental nonalcoholic fatty liver disease [22], its ability to improve polycystic ovary syndrome (PCOS) in animal models of PCOS [56], and its potential to exert antihypertensive and vasorelaxant effects in rodents [57]. Regarding the negative effects of tartaric acid, one study showed that inhaled tartaric acid lowered the cough sensitivity threshold in patients with bronchitis [58] but other than that, there are few studies on its negative functions [23]. We have not yet found any reports linking SiglecF and TA.
Eosinophils can amplify Th2-mediated immune responses by secreting various cytokines, such as IL-4, IL-5, IL-13, IL-31, and IL-17. These cytokines play a central role in eosinophil activation and recruitment, and are essential for Th2 inflammation [42]. Previous animal studies showed that reduced IL-4 levels correspond with decreased eosinophilia, emphasizing its role in eosinophil regulation [59]. Additionally, IL-13 is known to promote eosinophil survival, activation, and trafficking, as demonstrated in animal models of eosinophilic inflammation [60]. Imbalances in IL-4 and IL-13 are implicated in the development of inflammatory diseases like UC and asthma [61]. Moreover, eosinophils are a significant source of IL-31 and IL-17, which, beyond their roles in allergic inflammation, also contribute to the deterioration of colitis at higher levels by intensifying eosinophil-driven inflammation [46,62,63]. In the current study, treatment of normal mice with 50 µg TA led to increased levels of IL-4, IL-13, IL-31, and IL-17 compared to normal healthy controls. In colitis mice, however, only IL-13 showed a pronounced increase following 50 µg TA treatment compared to untreated colitis mice, suggesting a selective enhancement of this cytokine in the inflammatory setting.
Eosinophils express receptors for multiple chemokines and cytokines enabling them to play their role in inflammatory responses and maintaining homeostasis [64]. Eotaxin-1/CCL11 is an inflammatory chemokine primarily renowned for its contribution to attracting eosinophils to inflammatory sites [37]. In addition, CCL11 levels are elevated in both the serum and colonic tissues of patients with UC and are also increased in the colitis model [34,65]. CCL11 interacts with the CCR3 receptor present on eosinophils and induces eosinophil migration both in vitro and in vivo [66,67]. Additionally, CCL11 is involved in promoting Th2 immune response [37]. The findings of the present study showed that CCL11 mRNA levels were significantly increased in the spleens of normal mice treated with 50 µg TA. The increased CCL11 mRNA expression suggests a chemotactic environment created by TA, which may facilitate the selective migration of eosinophils into tissues and further amplify the Th2 response. Although CCL11 expression was also higher in colitis mice treated with 50 µg TA compared to untreated colitis mice, this increase did not reach statistical significance. Additionally, the production and activation of eosinophils are significantly influenced by IL-5 through IL-5Rα [68]. Our study showed that IL-5 levels in normal and colitis mice did not significantly differ depending on whether TA was administered. In IL-5Rα, IL-5Rα mRNA levels were significantly increased in normal mice treated with 25 µg TA compared to 5 µg TA-treated and control mice. Interestingly, upregulation in IL-5Rα expression was observed in colitis mice treated with 50 µg TA compared to untreated colitis mice, suggesting that the effect of TA on eosinophil activation may be dose-dependent, with higher doses likely to correlate with increased receptor expression and thus enhance eosinophil functions.
Moreover, TLRs and TLR-mediated activation of these cells have been implicated in the pathogenesis of colitis [41]. In this study, increased mRNA expressions of TLR2 and TLR4 were observed in the DSS colitis group compared to normal group. In normal mice, TA administration increased the expression of TLR4, while in colitis mice, TA did not affect the mRNA levels of TLR2 and TLR4. This suggests that 50 µg TA is not sufficient to further activate the pathway for TLR expression when inflammation is already established. In addition, TLR4 expression in TA-administered normal mice was significantly higher than that in non-administered normal mice, suggesting that higher doses of TA may be required to activate the immune system by upregulating TLR4, which is involved in pathogen recognition and initiation of inflammatory responses [69]. These results suggest that TA has the potential to modulate innate immune receptors such as TLR2 and TLR4. Further studies are needed to understand the mechanisms by which TA affects TLR2 and TLR4 activation in both inflammatory and non-inflammatory conditions.
Despite this, this article has some limitations. First, the present study did not investigate the long-term effects of TA exposure. While the short-term impacts on eosinophil activation and cytokine expression were demonstrated, it remains unclear whether these effects persist over time or lead to any long-term alterations in immune functions. Second, the study focused primarily on a few specific markers, chemokines, cytokines, and receptors associated with eosinophil activation. The roles of other chemokines and cytokines that interact with eosinophils were not explored, which might have revealed further complexities of the effect of TA. Thirdly, the exact mechanism by which TA influences eosinophil activation and Th2 cytokine production in inflammatory and non-inflammatory conditions remains unclear. Lastly, the environmental and genetic factors that might influence the response to TA were not controlled in this study. Additional analysis is required to consider all these factors to deeply understand the context in which TA exerts its effects.
Based on the observed effects of TA on eosinophil activity and Th2 cytokine production in non-inflammatory conditions and inflammatory diseases such as UC, TA may exacerbate conditions associated with eosinophilia and Th2-biased immune responses in certain other eosinophil-associated diseases. Future studies should evaluate the effects of TA and the detailed mechanisms by which it exacerbates these conditions, which may provide valuable insights into developing therapeutic strategies.
4. Materials and Methods
4.1. Mice
In this study, 8-week-old 44 male BALB/c mice were purchased from Orient Bio (Seongnam-si, Gyeonggi-do, Republic of Korea). All mice were housed in a specific pathogen-free (SPF) facility. The environmental conditions were meticulously adjusted with a temperature range of 20-23℃, and a humidity level of 50%-60%. Ethical approval for all experimental protocols was strictly reviewed and granted by the Institutional Animal Care and Use Committee (IACUC) of Ajou University (IACUC approval number: AMC-2023-0022). All procedures in animal experiments were performed in strict accordance with relevant regulations and instructions. Before starting the experiment, all mice were acclimated to standard environmental conditions for 7 days. During this acclimation period, mice had unrestricted access to standard food and autoclaved water. All mice were carefully monitored throughout the experimental work.
4.2. Experimental Design and Dextran Sodium Sulfate (DSS)-Induced Colitis
Mice were divided into eight groups, with five to six mice in each group. Groups 1 to 4 were experiments to study the effects of various doses of tartaric acid (TA) (Sigma–Aldrich, St. Louis, MO, USA). Group 1 was the normal healthy control group. Group 2 was the low-dose TA group and received 5 µg TA. Group 3 was the medium-dose TA group and was administered 25 µg TA, and group 4 was the high-dose TA group and was administered 50 µg TA. TA was administered orally. Groups 5-8 were experiments to examine the role of TA in the colitis model. Group 5 was a healthy normal control, group 6 was administered 50 µg TA to healthy normal mice, group 7 was administered DSS (MP Biomedicals, Irvine, CA, USA) to induce colitis, and group 8 was administered 50 µg TA simultaneously with DSS. DSS was used at a concentration of 4% and administered via drinking water. The administration period for all groups was 10 days. Body weights were recorded daily during this period. On day 11, all mice were sacrificed, and peripheral blood leukocytes (PBLs), lymph nodes (LN), spleen, and intestine samples were collected and further analyzed.
4.3. Preparation of Single-Cell Suspensions
Single-cell suspensions were made from PBLs, spleen, and LN for flow cytometric analysis. For PBL collection, red blood cell lysis was performed using ammonium-chloride-potassium (ACK) lysis buffer (150 mM NH4Cl, 1 mM KHCO3, and 0.1 mM EDTA) at 37℃ for 5 minutes (min). Cells were then rinsed with autoclaved PBS (pH 7.2). Whole spleen and LN tissues were isolated from individual mice and gently minced with a 70 μm mesh strainer to obtain a fine suspension of individual cells. The spleen tissue was then treated with ACK buffer to lyse red blood cells. To eliminate any remaining lysed cells and ACK buffer, splenocytes and LN cells were rinsed with PBS.
4.4. Flow Cytometric Analysis
The flow cytometry procedure was performed according to the protocol previously established [42]. In brief, 1×10⁶ cells from PBLs, LN and splenocytes were incubated separately with anti-mouse antibodies, such as efluor450-conjugated CD11b (eBioscience, Cat# 48-0112-82 San Diego, CA, USA), PE-conjugated SiglecF (eBioscience, Cat# 12-1702-82) and APC-conjugated CCR3 (BD Biosciences, Cat# 747820) at 4℃ for 30min in the dark to assess the surface expressions. After staining, cells were rinsed twice with PBS to remove residual unbound antibodies before being resuspended in 300 µL of PBS.
For intracellular staining of PBLs and LN, 2×10⁶ cells were cultured in 12-well plates with RPMI medium supplemented with 1 μg/mL brefeldin A (eBioscience) at 37℃ in a humidified atmosphere containing 5% CO2 for 4h to block cytokine secretion. After incubation, cells were washed with PBS. These cells were further treated with Cytofix/Cytoperm buffer (BD Biosciences, San Diego, CA, USA) for fixation and permeabilization. Afterwards, cells were stained with FITC-conjugated IL-4 (eBioscience, Cat# 11-7042-82), efluor450-conjugated IL-13 (eBioscience, Cat# 48-7133-82), PE-conjugated IL-31(BD Biosciences, Cat# 160704), and PE-cyanine7-conjugated IL-17 (eBioscience, Cat# 25-7177-82) anti-mouse antibodies in Perm/Wash buffer (BD Biosciences) for 40min at room temperature. After staining, cells were washed with PBS. Surface and intracellular stained cells were examined by Cytek Aurora flow cytometer (Cytek Biosciences, Fremont, CA, USA) for data acquisition. Gating was performed by initially excluding debris from the cell population according to forward scatter area (FSC-A) versus side scatter area (SSC-A). Subsequently, the identification of single cells was achieved by comparing forward scatter height (FSC-H) with FSC-A.
4.5. RNA Extraction and Real-Time Quantitative PCR (qRT-PCR)
Total RNA was extracted using TRIzol (Thermo Fisher, Waltham, MA, USA) according to the manufacturer’s instructions using homogenized splenocytes. Subsequently, 1 µg of total RNA was pre-transcribed using the Prime Script cDNA Synthesis kit (Takara Shuzo Co., Otsu, Shiga, Japan) to obtain first-strand cDNA. Each target gene was analyzed in duplicate by qRT-PCR with SYBR Green PCR Master Mix (Applied Biosystems, Foster City, CA, USA) using a 7500 Real-Time PCR System (Applied Biosystems). In qRT-PCR, a 20 µL reaction volume was utilized together with a 1 µL cDNA template. The following were the cycle conditions: an initial denaturation at 94℃ for 2min, followed by 40 cycles of 94℃ for 3 seconds (s), 55℃ for 30s, and 72℃ for 30s, with a final extension at 72℃ for 10min. The 2-ΔΔCt method was used to assess the relative gene expression levels [43]. To determine relative expression ratios, mRNA for each gene was normalized to the housekeeping gene β-actin and compared to the control. The results are expressed as fold changes relative to the controls. The primer sequences used in this experiment are summarized in Table 1.

Table 1.
Primer sequences for PCR.
| Gene | Forward | Reverse |
| IL-4 | GGTCTCAACCCCCAGCTAGT | GCCGATGATCTCTCTCAAGTGAT |
| IL-5 | AGGCTTCCTGTCCCTACTCAT | ATTTCCACAGTACCCCCACG |
| IL-13 | CCTGGCTCTTGCTTGCCTT | GGTCTTGTGTGATGTTGCTCA |
| IL-17 | CCTCACACGAGGCACAAGTG | CTCTCCCTGGACTCATGTTTGC |
| CCR3 | TGATGTTTACTACCTGACTGGTG | TGCCATTCTACTTGTCTCTGGT |
| CCL11 | GAATCACCAACAACAGATGCAC | ATCCTGGACCCACTTCTTCTT |
| SiglecF | CTCCACAGAAGATGACCATCAGG | CTGTCAGCCATACAGACCAGGC |
| IL-5Rα | AGAACACTGTGTAGCCCTGTT | ACCTGTCCAGTGAGCTTCTTC |
| TLR2 | CACTGGGGGTAACATCGCTT | GAGAGAAGTCAGCCCAGCAA |
| TLR4 | CGAGAGCCCATGGAACACAT | CCCCTGGAAAGGAAGGTGTC |
| β-actin | TGTCCACCTTCCAGCAGATGT | AGCTCAGTAACAGTCCGCCTAG |
4.6. Transmission Electron Microscopy
LN was obtained from each mouse and processed for transmission electron microscopy (TEM) using a routine method. The collected LN tissues were first immersed in Karnovsky’s fixative solution for more than 2h, then washed with PBS, and postfixed with 1% osmium tetroxide for 30min to further stabilize the tissues. The samples were then rinsed with PBS. The tissues were sequentially dehydrated in ethanol. The dehydrated tissues were embedded in Epon-Araldite resin to make a solid block containing the tissues. The resin-embedded tissues were cut into ultrathin sections using an ultramicrotome (Reichert Jung Ultracut S (Leica, Vienna, Austria) and then placed on copper grids. These thin sections were treated with lead citrate and uranyl acetate for staining. These stained sections were examined and analyzed by Zeiss electron microscope (Leo, Oberkohen, Germany) (A = SE1, WD = 2.9 mm, EHT = 28.00 kv).
4.7. Statistical Analysis
Statistical comparison between experimental groups was assessed by performing an unpaired Student’s t-test. Data are presented as mean ± standard deviation (SD). Results were considered statistically significant if the p-value was less than 0.05. All analyses were carried out with GraphPad Prism (version 8.3.1) for Windows (GraphPad Software, La Jolla, CA, USA.
5. Conclusions
This study demonstrates that TA exerts a dose-dependent effect on eosinophil activation and Th2 cytokine responses in both normal and colitis mice. Specifically, TA administration in normal mice significantly enhanced eosinophil activation markers such as SiglecF+, CCR3+, Th2 cytokines (IL-4, IL-13, IL-31), IL-17, and eosinophil-related regulatory molecules such as CCL11 and TLR4. In addition, IL-5Rα expression was increased in TA-treated normal mice. These findings suggest that TA induces eosinophil activation and promotes a Th2-driven immune response even in the absence of inflammation. In colitis mice, TA treatment increased IL-13 and IL-5Rα levels compared to untreated colitis mice, suggesting that TA may exacerbate colitis symptoms. These results emphasize that the TA drives a more pronounced eosinophil activity and Th2 cytokine profiles in inflammatory and non-inflammatory conditions. However, studies are needed to clarify the long-term effects, underlying mechanisms, and the precise role of TA in the progression of colitis. These findings provide new insights into the potential of TA to influence immune responses and its implications in inflammatory and eosinophil-related diseases.
Author Contributions
Conceptualization and supervision S.S.; experiment, B.R., H.-M.R. and B.C.; validation, H.-M.R.; writing—original draft preparation, B.R.; writing—review and editing, S.S. and H.-M.R.; project administration, S.S.; funding acquisition, S.S. All authors have read and agreed to the published version of the manuscript.
Funding
This study was supported by a grant (2020R1A2C2012721) through the NRF funded by the Ministry of Science and ICT (MIST), Republic of Korea. This research was also supported by a research grant (2019R1A6C1010003) of the Korea Basic Science Institute (National Research Facility Equipment Center) funded by the Ministry of Education, Republic of Korea.
Institutional Review Board Statement
The animal study was reviewed and approved by Institutional Animal Care and Use Committee (IACUC) of Ajou University (IACUC approval number: AMC-2023-0022).
Informed Consent Statement
Not applicable.
Data Availability Statement
Not applicable.
Conflicts of Interest
The authors declare no conflict of interest.
References
- Rothenberg, M.E.; Hogan, S.P. The eosinophil. Annu Rev Immunol 2006, 24, 147–174. [Google Scholar] [CrossRef]
- Rosenberg, H.F.; Dyer, K.D.; Foster, P.S. Eosinophils: changing perspectives in health and disease. Nat Rev Immunol 2013, 13, 9–22. [Google Scholar] [CrossRef]
- Rubinstein, E.; Cho, J.Y.; Rosenthal, P.; Chao, J.; Miller, M.; Pham, A.; Aceves, S.S.; Varki, A.; Broide, D.H. Siglec-F inhibition reduces esophageal eosinophilia and angiogenesis in a mouse model of eosinophilic esophagitis. J Pediatr Gastroenterol Nutr 2011, 53, 409–416. [Google Scholar] [CrossRef]
- Yuan, J.; Liu, Y.; Yu, J.; Dai, M.; Zhu, Y.; Bao, Y.; Peng, H.; Liu, K.; Zhu, X. Gene knockdown of CCR3 reduces eosinophilic inflammation and the Th2 immune response by inhibiting the PI3K/AKT pathway in allergic rhinitis mice. Sci Rep 2022, 12, 5411. [Google Scholar] [CrossRef] [PubMed]
- Bagnasco, D.; Ferrando, M.; Varricchi, G.; Puggioni, F.; Passalacqua, G.; Canonica, G.W. Anti-Interleukin 5 (IL-5) and IL-5Ra Biological Drugs: Efficacy, Safety, and Future Perspectives in Severe Eosinophilic Asthma. Front Med (Lausanne) 2017, 4, 135. [Google Scholar] [CrossRef]
- Masterson, J.C.; McNamee, E.N.; Fillon, S.A.; Hosford, L.; Harris, R.; Fernando, S.D.; Jedlicka, P.; Iwamoto, R.; Jacobsen, E.; Protheroe, C.; et al. Eosinophil-mediated signalling attenuates inflammatory responses in experimental colitis. Gut 2015, 64, 1236–1247. [Google Scholar] [CrossRef]
- Fulkerson, P.C.; Rothenberg, M.E. Targeting eosinophils in allergy, inflammation and beyond. Nat Rev Drug Discov 2013, 12, 117–129. [Google Scholar] [CrossRef]
- Nakagome, K.; Nagata, M. Involvement and Possible Role of Eosinophils in Asthma Exacerbation. Front Immunol 2018, 9, 2220. [Google Scholar] [CrossRef]
- Low, E.E.; Dellon, E.S. Review article: Emerging insights into the epidemiology, pathophysiology, diagnostic and therapeutic aspects of eosinophilic oesophagitis and other eosinophilic gastrointestinal diseases. Aliment Pharmacol Ther 2024, 59, 322–340. [Google Scholar] [CrossRef] [PubMed]
- Long, H.; Zhang, G.; Wang, L.; Lu, Q. Eosinophilic Skin Diseases: A Comprehensive Review. Clin Rev Allergy Immunol 2016, 50, 189–213. [Google Scholar] [CrossRef] [PubMed]
- Jackson, D.J.; Akuthota, P.; Roufosse, F. Eosinophils and eosinophilic immune dysfunction in health and disease. Eur Respir Rev 2022, 3, 210150. [Google Scholar] [CrossRef] [PubMed]
- Wechsler, M.E.; Munitz, A.; Ackerman, S.J.; Drake, M.G.; Jackson, D.J.; Wardlaw, A.J.; Dougan, S.K.; Berdnikovs, S.; Schleich, F.; Matucci, A.; et al. Eosinophils in Health and Disease: A State-of-the-Art Review. Mayo Clin Proc 2021, 96, 2694–2707. [Google Scholar] [CrossRef]
- O’Sullivan, J.A.; Bochner, B.S. Eosinophils and eosinophil-associated diseases: An update. J Allergy Clin Immunol 2018, 141, 505–517. [Google Scholar] [CrossRef] [PubMed]
- O’Connell, E.M.; Nutman, T.B. Eosinophilia in Infectious Diseases. Immunol Allergy Clin North Am 2015, 35, 493–522. [Google Scholar] [CrossRef] [PubMed]
- Diny, N.L.; Rose, N.R.; Čiháková, D. Eosinophils in Autoimmune Diseases. Front Immunol 2017, 8, 484. [Google Scholar] [CrossRef] [PubMed]
- Segal, J.P.; LeBlanc, J.F.; Hart, A.L. Ulcerative colitis: an update. Clin Med (Lond) 2021, 21, 135–139. [Google Scholar] [CrossRef] [PubMed]
- Du, L.; Ha, C. Epidemiology and Pathogenesis of Ulcerative Colitis. Gastroenterol Clin North Am 2020, 49, 643–654. [Google Scholar] [CrossRef] [PubMed]
- Kałużna, A.; Olczyk, P.; Komosińska-Vassev, K. The Role of Innate and Adaptive Immune Cells in the Pathogenesis and Development of the Inflammatory Response in Ulcerative Colitis. J Clin Med 2022, 11, 400. [Google Scholar] [CrossRef] [PubMed]
- Barrie, A.; Mourabet, M.E.; Weyant, K.; Clarke, K.; Gajendran, M.; Rivers, C.; Park, S.Y.; Hartman, D.; Saul, M.; Regueiro, M.; et al. Recurrent blood eosinophilia in ulcerative colitis is associated with severe disease and primary sclerosing cholangitis. Dig Dis Sci 2013, 58, 222–228. [Google Scholar] [CrossRef] [PubMed]
- Xenakis, J.J.; Howard, E.D.; Smith, K.M.; Olbrich, C.L.; Huang, Y.; Anketell, D.; Maldonado, S.; Cornwell, E.W.; Spencer, L.A. Resident intestinal eosinophils constitutively express antigen presentation markers and include two phenotypically distinct subsets of eosinophils. Immunology 2018, 154, 298–308. [Google Scholar] [CrossRef] [PubMed]
- Tang, S.C.; Yang, J.H. Dual Effects of Alpha-Hydroxy Acids on the Skin. Molecules 2018, 23, 863. [Google Scholar] [CrossRef]
- Pei, Y.; He, Y.; Wang, X.; Xie, C.; Li, L.; Sun, Q.; Liu, L.; Shan, S.; Wang, P.; Liu, T.; et al. Tartaric acid ameliorates experimental non-alcoholic fatty liver disease by activating the AMP-activated protein kinase signaling pathway. Eur J Pharmacol 2024, 975, 176668. [Google Scholar] [CrossRef] [PubMed]
- Inoue, K.; Morikawa, T.; Takahashi, M.; Yoshida, M.; Ogawa, K. Obstructive nephropathy induced with DL-potassium hydrogen tartrate in F344 rats. J Toxicol Pathol 2015, 28, 89–97. [Google Scholar] [CrossRef]
- Wen, T.; Rothenberg, M.E. The Regulatory Function of Eosinophils. Microbiol Spectr 2016, 4, 10.1128. [Google Scholar] [CrossRef] [PubMed]
- Spencer, L.A.; Szela, C.T.; Perez, S.A.; Kirchhoffer, C.L.; Neves, J.S.; Radke, A.L.; Weller, P.F. Human eosinophils constitutively express multiple Th1, Th2, and immunoregulatory cytokines that are secreted rapidly and differentially. J Leukoc Biol 2009, 85, 117–123. [Google Scholar] [CrossRef] [PubMed]
- Robinson, D.; Humbert, M.; Buhl, R.; Cruz, A.A.; Inoue, H.; Korom, S.; Hanania, N.A.; Nair, P. Revisiting Type 2-high and Type 2-low airway inflammation in asthma: current knowledge and therapeutic implications. Clin Exp Allergy 2017, 47, 161–175. [Google Scholar] [CrossRef] [PubMed]
- Bamias, G.; Cominelli, F. Role of type 2 immunity in intestinal inflammation. Curr Opin Gastroenterol 2015, 31, 471–476. [Google Scholar] [CrossRef] [PubMed]
- Neurath, M.F. Targeting immune cell circuits and trafficking in inflammatory bowel disease. Nat Immunol 2019, 20, 970–979. [Google Scholar] [CrossRef] [PubMed]
- Tang, S.; Shu, X. [Effect of CCR3 gene on related inflammatory cells in respiratory allergic diseases]. Lin Chuang Er Bi Yan Hou Tou Jing Wai Ke Za Zhi 2021, 35, 80–84. [Google Scholar]
- Grozdanovic, M.; Laffey, K.G.; Abdelkarim, H.; Hitchinson, B.; Harijith, A.; Moon, H.G.; Park, G.Y.; Rousslang, L.K.; Masterson, J.C.; Furuta, G.T.; et al. Novel peptide nanoparticle-biased antagonist of CCR3 blocks eosinophil recruitment and airway hyperresponsiveness. J Allergy Clin Immunol 2019, 143, 669–680.e612. [Google Scholar] [CrossRef]
- Sallusto, F.; Mackay, C.R.; Lanzavecchia, A. Selective expression of the eotaxin receptor CCR3 by human T helper 2 cells. Science 1997, 277, 2005–2007. [Google Scholar] [CrossRef] [PubMed]
- Manousou, P.; Kolios, G.; Valatas, V.; Drygiannakis, I.; Bourikas, L.; Pyrovolaki, K.; Koutroubakis, I.; Papadaki, H.A.; Kouroumalis, E. Increased expression of chemokine receptor CCR3 and its ligands in ulcerative colitis: the role of colonic epithelial cells in in vitro studies. Clin Exp Immunol 2010, 162, 337–347. [Google Scholar] [CrossRef]
- Zhang, M.; Xia, L.; Peng, W.; Xie, G.; Li, F.; Zhang, C.; Syeda, M.Z.; Hu, Y.; Lan, F.; Yan, F.; et al. CCL11/CCR3-dependent eosinophilia alleviates malignant pleural effusions and improves prognosis. NPJ Precis Oncol 2024, 8, 138. [Google Scholar] [CrossRef]
- Polosukhina, D.; Singh, K.; Asim, M.; Barry, D.P.; Allaman, M.M.; Hardbower, D.M.; Piazuelo, M.B.; Washington, M.K.; Gobert, A.P.; Wilson, K.T.; et al. CCL11 exacerbates colitis and inflammation-associated colon tumorigenesis. Oncogene 2021, 40, 6540–6546. [Google Scholar] [CrossRef] [PubMed]
- Paplińska, M.; Hermanowicz-Salamon, J.; Nejman-Gryz, P.; Białek-Gosk, K.; Rubinsztajn, R.; Arcimowicz, M.; Placha, G.; Góra, J.; Chazan, R.; Grubek-Jaworska, H. Expression of eotaxins in the material from nasal brushing in asthma, allergic rhinitis and COPD patients. Cytokine 2012, 60, 393–399. [Google Scholar] [CrossRef]
- Owczarek, W.; Paplińska, M.; Targowski, T.; Jahnz-Rózyk, K.; Paluchowska, E.; Kucharczyk, A.; Kasztalewicz, B. Analysis of eotaxin 1/CCL11, eotaxin 2/CCL24 and eotaxin 3/CCL26 expression in lesional and non-lesional skin of patients with atopic dermatitis. Cytokine 2010, 50, 181–185. [Google Scholar] [CrossRef]
- Wu, D.; Zhou, J.; Bi, H.; Li, L.; Gao, W.; Huang, M.; Adcock, I.M.; Barnes, P.J.; Yao, X. CCL11 as a potential diagnostic marker for asthma? J Asthma 2014, 51, 847–854. [Google Scholar] [CrossRef]
- Adar, T.; Shteingart, S.; Ben Ya’acov, A.; Bar-Gil Shitrit, A.; Goldin, E. From airway inflammation to inflammatory bowel disease: eotaxin-1, a key regulator of intestinal inflammation. Clin Immunol 2014, 153, 199–208. [Google Scholar] [CrossRef]
- Gurtner, A.; Borrelli, C.; Gonzalez-Perez, I.; Bach, K.; Acar, I.E.; Núñez, N.G.; Crepaz, D.; Handler, K.; Vu, V.P.; Lafzi, A.; et al. Active eosinophils regulate host defence and immune responses in colitis. Nature 2023, 615, 151–157. [Google Scholar] [CrossRef] [PubMed]
- Ou, Y.; Yang, Z.; Zhou, Y.; Yue, H.; Hua, L.; Liu, Z.; Lin, G.; Cai, H.; Chen, Y.; Hu, W.; et al. Antagonizing interleukin-5 receptor ameliorates dextran sulfate sodium-induced experimental colitis in mice through reducing NLRP3 inflammasome activation. Eur J Pharmacol 2024, 965, 176331. [Google Scholar] [CrossRef]
- Albert, E.J.; Duplisea, J.; Dawicki, W.; Haidl, I.D.; Marshall, J.S. Tissue eosinophilia in a mouse model of colitis is highly dependent on TLR2 and independent of mast cells. Am J Pathol 2011, 178, 150–160. [Google Scholar] [CrossRef]
- Folci, M.; Ramponi, G.; Arcari, I.; Zumbo, A.; Brunetta, E. Eosinophils as Major Player in Type 2 Inflammation: Autoimmunity and Beyond. Adv Exp Med Biol 2021, 1347, 197–219. [Google Scholar]
- Allen, J.E.; Sutherland, T.E.; Rückerl, D. IL-17 and neutrophils: unexpected players in the type 2 immune response. Curr Opin Immunol 2015, 34, 99–106. [Google Scholar] [CrossRef] [PubMed]
- Matucci, A.; Maggi, E.; Vultaggio, A. Eosinophils, the IL-5/IL-5Rα axis, and the biologic effects of benralizumab in severe asthma. Respir Med 2019, 160, 105819. [Google Scholar] [CrossRef]
- Gigon, L.; Fettrelet, T.; Yousefi, S.; Simon, D.; Simon, H.U. Eosinophils from A to Z. Allergy 2023, 78, 1810–1846. [Google Scholar] [CrossRef] [PubMed]
- Nakase, H.; Sato, N.; Mizuno, N.; Ikawa, Y. The influence of cytokines on the complex pathology of ulcerative colitis. Autoimmun Rev 2022, 21, 103017. [Google Scholar] [CrossRef]
- Hoving, J.C. Targeting IL-13 as a Host-Directed Therapy Against Ulcerative Colitis. Front Cell Infect Microbiol 2018, 8, 395. [Google Scholar] [CrossRef]
- Uppal, V.; Kreiger, P.; Kutsch, E. Eosinophilic Gastroenteritis and Colitis: a Comprehensive Review. Clin Rev Allergy Immunol 2016, 50, 175–188. [Google Scholar] [CrossRef]
- Valent, P.; Degenfeld-Schonburg, L.; Sadovnik, I.; Horny, H.P.; Arock, M.; Simon, H.U.; Reiter, A.; Bochner, B.S. Eosinophils and eosinophil-associated disorders: immunological, clinical, and molecular complexity. Semin Immunopathol 2021, 43, 423–438. [Google Scholar] [CrossRef] [PubMed]
- Tran, T.N.; Khatry, D.B.; Ke, X.; Ward, C.K.; Gossage, D. High blood eosinophil count is associated with more frequent asthma attacks in asthma patients. Ann Allergy Asthma Immunol 2014, 113, 19–24. [Google Scholar] [CrossRef]
- Domínguez-López, I.; Parilli-Moser, I.; Arancibia-Riveros, C.; Tresserra-Rimbau, A.; Martínez-González, M.A.; Ortega-Azorín, C.; Salas-Salvadó, J.; Castañer, O.; Lapetra, J.; Arós, F.; et al. Urinary Tartaric Acid, a Biomarker of Wine Intake, Correlates with Lower Total and LDL Cholesterol. Nutrients 2021, 13, 2883. [Google Scholar] [CrossRef] [PubMed]
- Khurram; Ghaffar, A.; Zulfiqar, S.; Khan, M.; Latif, M.; Cochran, E.W. Synthesis of polyaniline-coated composite anion exchange membranes based on polyacrylonitrile for the separation of tartaric acid via electrodialysis. RSC Adv 2024, 14, 29648–29657. [Google Scholar] [CrossRef] [PubMed]
- Younes, M.; Aquilina, G.; Castle, L.; Engel, K.H.; Fowler, P.; Frutos Fernandez, M.J.; Fürst, P.; Gürtler, R.; Gundert-Remy, U.; Husøy, T.; et al. Re-evaluation of l(+)-tartaric acid (E 334), sodium tartrates (E 335), potassium tartrates (E 336), potassium sodium tartrate (E 337) and calcium tartrate (E 354) as food additives. Efsa j 2020, 18, e06030. [Google Scholar]
- Lynch, B.; Emmen, H.; van Otterdijk, F.; Lau, A. Subchronic and reproductive/developmental (screening level) toxicity of complexation products of iron trichloride and sodium tartrate (FemTA). J Food Sci 2013, 78, T1476–1485. [Google Scholar] [CrossRef] [PubMed]
- Bochner, B.S.; O’Sullivan, J.A.; Chang, A.T.; Youngblood, B.A. Siglecs in allergy and asthma. Mol Aspects Med 2023, 90, 101104. [Google Scholar] [CrossRef]
- Vakili, S.; Koohpeyma, F.; Samare-Najaf, M.; Jahromi, B.N.; Jafarinia, M.; Samareh, A.; Hashempur, M.H. The Effects of L-Tartaric Acid on Ovarian Histostereological and Serum Hormonal Analysis in an Animal Model of Polycystic Ovary Syndrome. Reprod Sci 2024, 31, 3583–3594. [Google Scholar] [CrossRef] [PubMed]
- Amssayef, A.; Bouadid, I.; Eddouks, M. L-Tartaric Acid Exhibits Antihypertensive and Vasorelaxant Effects: The Possible Role of eNOS/NO/cGMP Pathways. Cardiovasc Hematol Agents Med Chem 2023, 21, 202–212. [Google Scholar] [CrossRef]
- Fujimura, M.; Sakamoto, S.; Kamio, Y.; Saito, M.; Miyake, Y.; Yasui, M.; Matsuda, T. Cough threshold to inhaled tartaric acid and bronchial responsiveness to methacholine in patients with asthma and sino-bronchial syndrome. Intern Med 1992, 31, 17–21. [Google Scholar] [CrossRef] [PubMed]
- Foster, P.S.; Hogan, S.P.; Ramsay, A.J.; Matthaei, K.I.; Young, I.G. Interleukin 5 deficiency abolishes eosinophilia, airways hyperreactivity, and lung damage in a mouse asthma model. J Exp Med 1996, 183, 195–201. [Google Scholar] [CrossRef]
- Doran, E.; Cai, F.; Holweg, C.T.J.; Wong, K.; Brumm, J.; Arron, J.R. Interleukin-13 in Asthma and Other Eosinophilic Disorders. Front Med (Lausanne) 2017, 4, 139. [Google Scholar] [CrossRef]
- Kasaian, M.T.; Page, K.M.; Fish, S.; Brennan, A.; Cook, T.A.; Moreira, K.; Zhang, M.; Jesson, M.; Marquette, K.; Agostinelli, R.; et al. Therapeutic activity of an interleukin-4/interleukin-13 dual antagonist on oxazolone-induced colitis in mice. Immunology 2014, 143, 416–427. [Google Scholar] [CrossRef]
- Dias, P.M.; Banerjee, G. The role of Th17/IL-17 on eosinophilic inflammation. J Autoimmun 2013, 40, 9–20. [Google Scholar] [CrossRef]
- Borgia, F.; Custurone, P.; Li Pomi, F.; Cordiano, R.; Alessandrello, C.; Gangemi, S. IL-31: State of the Art for an Inflammation-Oriented Interleukin. Int J Mol Sci 2022, 23, 6507. [Google Scholar] [CrossRef] [PubMed]
- Davoine, F.; Lacy, P. Eosinophil cytokines, chemokines, and growth factors: emerging roles in immunity. Front Immunol 2014, 5, 570. [Google Scholar] [CrossRef] [PubMed]
- Coburn, L.A.; Horst, S.N.; Chaturvedi, R.; Brown, C.T.; Allaman, M.M.; Scull, B.P.; Singh, K.; Piazuelo, M.B.; Chitnavis, M.V.; Hodges, M.E.; et al. High-throughput multi-analyte Luminex profiling implicates eotaxin-1 in ulcerative colitis. PLoS One 2013, 8, e82300. [Google Scholar] [CrossRef]
- Kitaura, M.; Nakajima, T.; Imai, T.; Harada, S.; Combadiere, C.; Tiffany, H.L.; Murphy, P.M.; Yoshie, O. Molecular cloning of human eotaxin, an eosinophil-selective CC chemokine, and identification of a specific eosinophil eotaxin receptor, CC chemokine receptor 3. J Biol Chem 1996, 271, 7725–7730. [Google Scholar] [CrossRef] [PubMed]
- Ye, J.; Kohli, L.L.; Stone, M.J. Characterization of binding between the chemokine eotaxin and peptides derived from the chemokine receptor CCR3. J Biol Chem 2000, 275, 27250–27257. [Google Scholar] [CrossRef]
- Esnault, S.; Johansson, M.W.; Mathur, S.K. Eosinophils, beyond IL-5. Cells 2021, 10. [Google Scholar] [CrossRef] [PubMed]
- Molteni, M.; Gemma, S.; Rossetti, C. The Role of Toll-Like Receptor 4 in Infectious and Noninfectious Inflammation. Mediators Inflamm 2016, 2016, 6978936. [Google Scholar] [CrossRef]
Figure 1.
TA administration impacts the expression of SiglecF+, CCR3+, and SiglecF+CCR3+ eosinophil markers in peripheral blood leukocytes of 8-week-old mice (n=6). Eosinophil markers were evaluated by flow cytometry after TA administration at doses of 5 µg, 25 µg, or 50 µg in normal mice. (A–E) show the expression levels of eosinophil activation markers in untreated normal control mice and mice administered various doses of TA. Panel (F) is a histogram showing the gating strategy and the distribution of SiglecF+, CCR3+, and SiglecF+CCR3+ eosinophil markers in PBLs. Statistical significance was assessed using the Student’s t-test. Data are presented as means and error bars represent standard deviations. * p < 0.05.

Figure 2.
Effects of TA on eosinophil activation markers in lymph nodes of 8-week-old mice (n=6 per group). Eosinophil markers were evaluated by flow cytometry in LN after mice were administered TA at doses of 5 µg, 25 µg, or 50 µg. (A-E) show the relative expression of eosinophil activation markers in the different treatment groups. (F) shows the gating strategy and histograms showing the distribution of SiglecF+, CCR3+, and SiglecF+CCR3+ eosinophil markers in LN. Statistical significance was assessed using the Student’s t-test. Data are presented as means and error bars represent standard deviations. * p < 0.05.
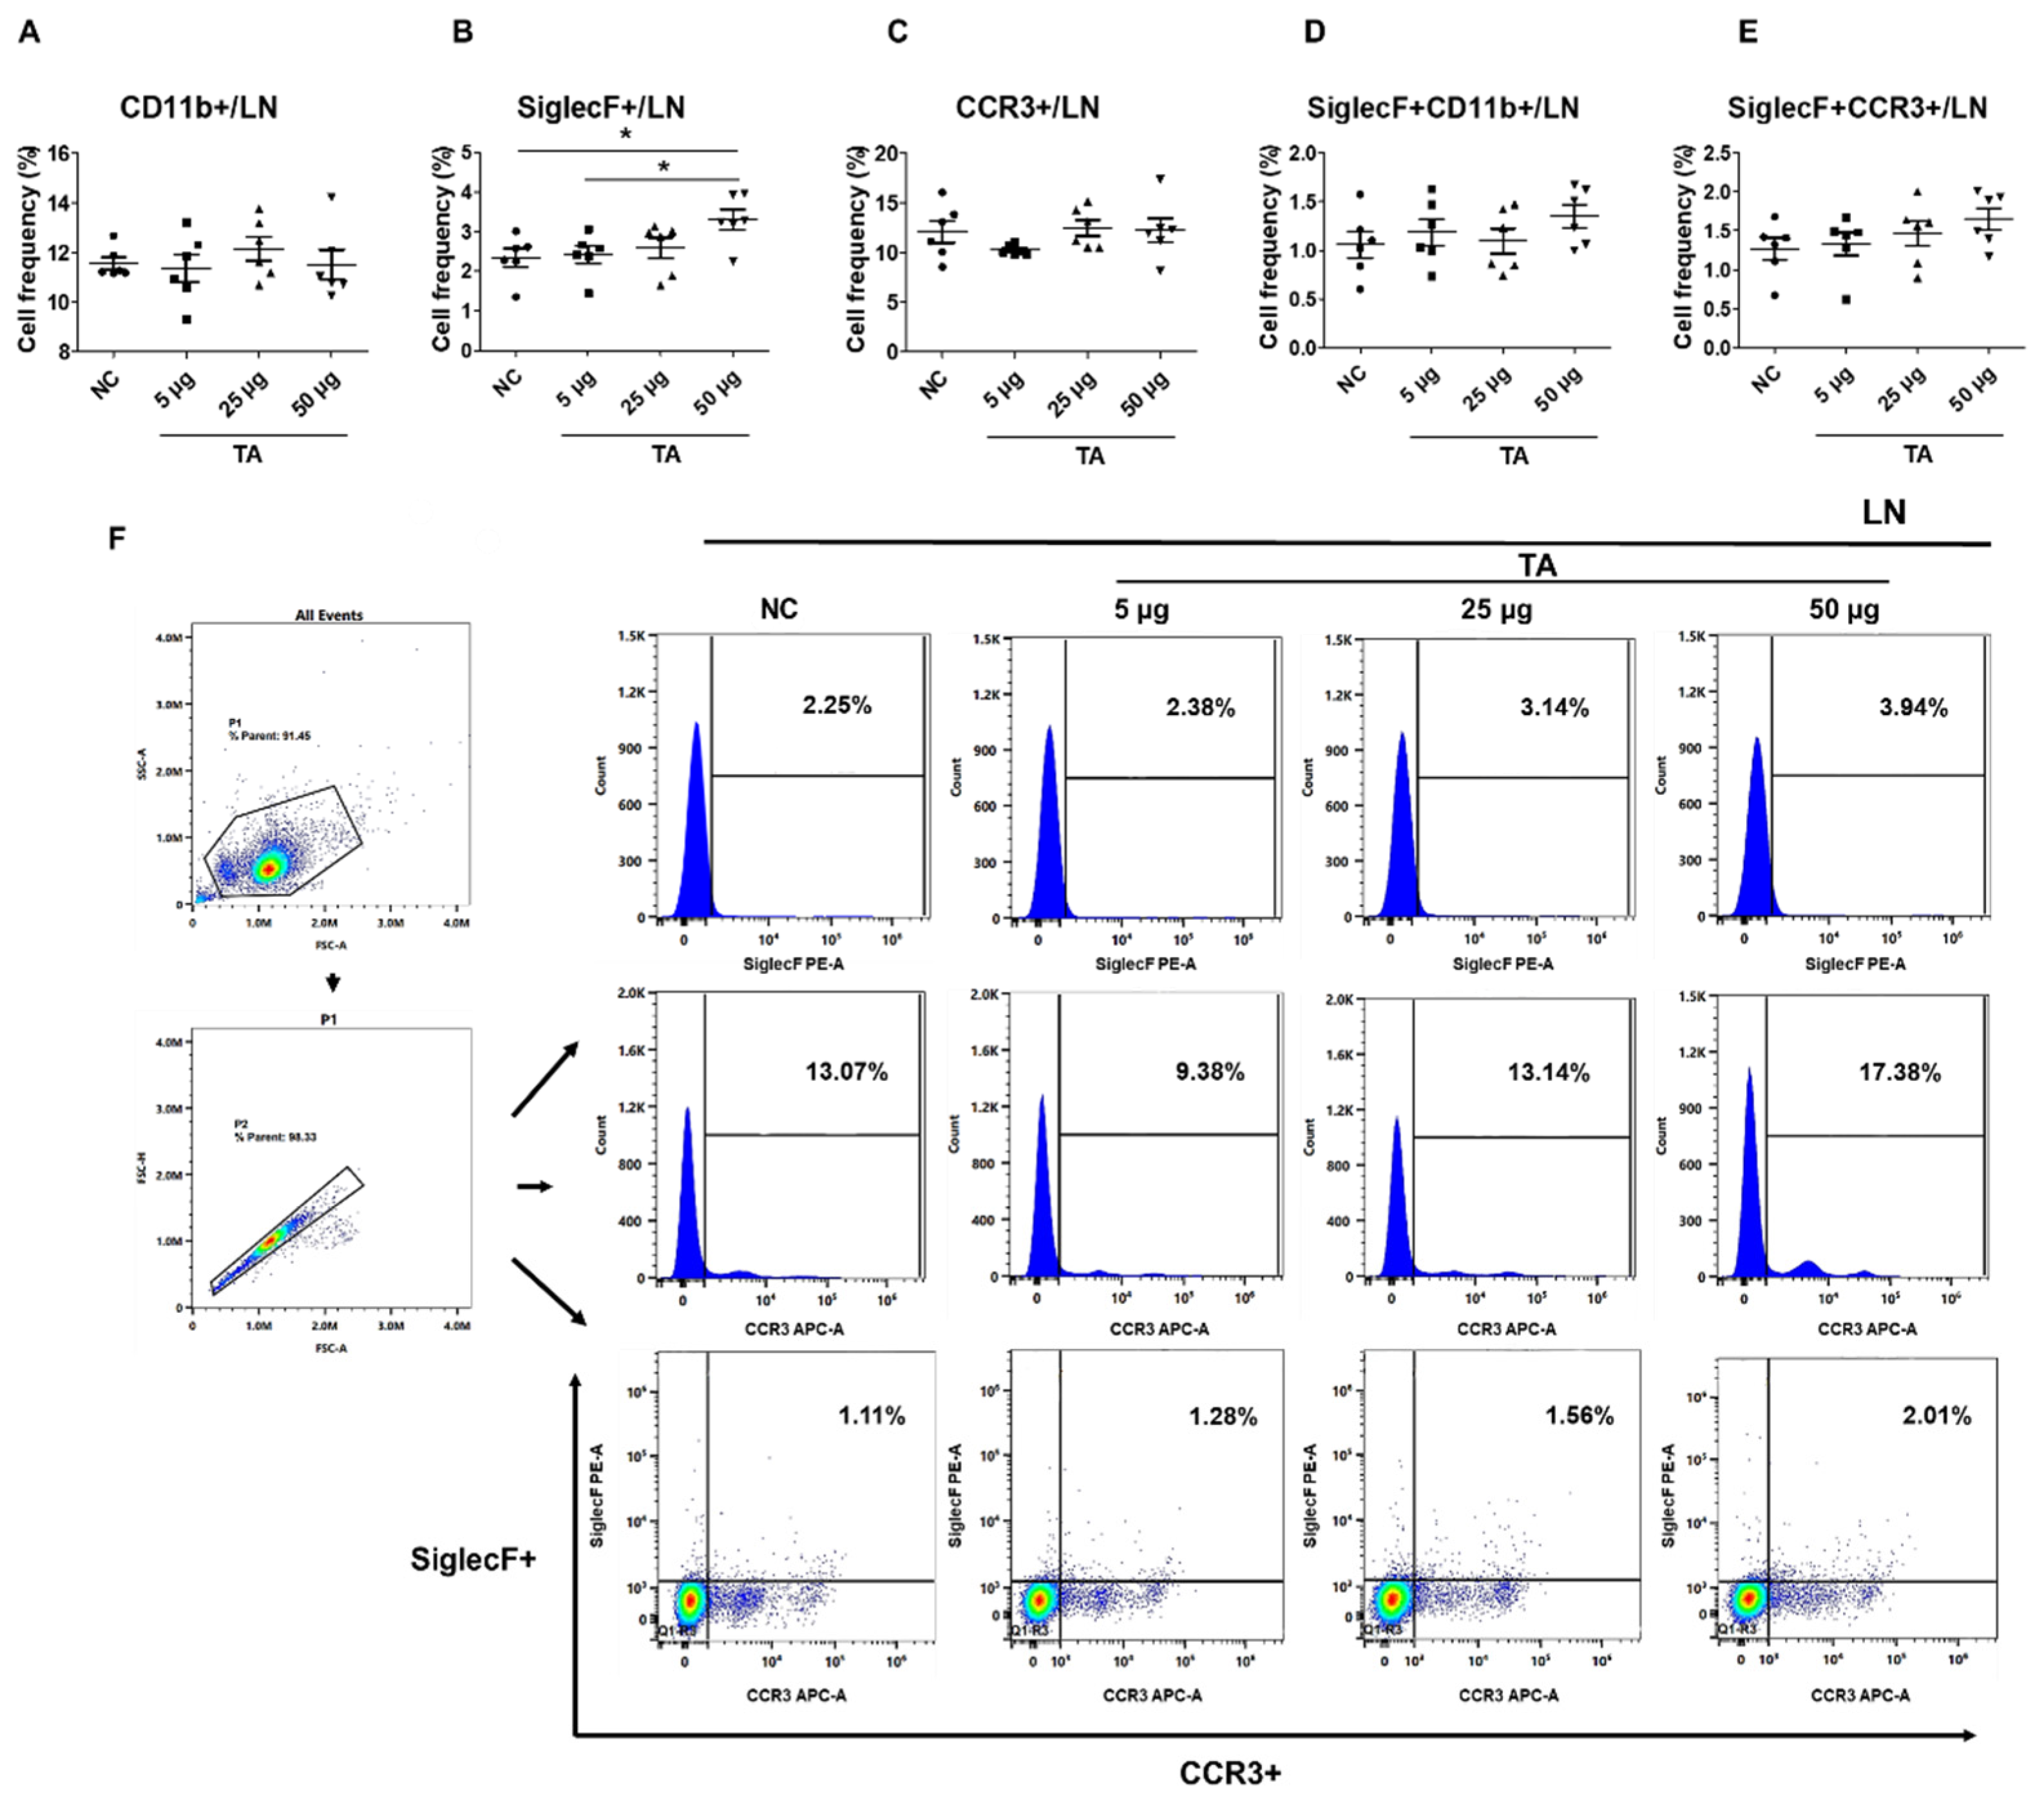
Figure 3.
Influence of TA on the expression of SiglecF+ and SiglecF+CCR3+ eosinophil markers in the spleen of 8-week-old mice (n=6 per group). Eosinophil markers were analyzed by flow cytometry after administering TA to normal mice at doses of 5 µg, 25 µg, or 50 µg. (A–E) show the frequencies of eosinophil activation marker-positive cells under different treatment conditions. (F) shows the gating strategy and histogram showing the distribution of SiglecF+, CCR3+, and SiglecF+CCR3+ cells in the spleen. Statistical significance was assessed using the Student’s t-test. Data are presented as means and error bars represent standard deviations. * p < 0.05, *** p < 0.001.
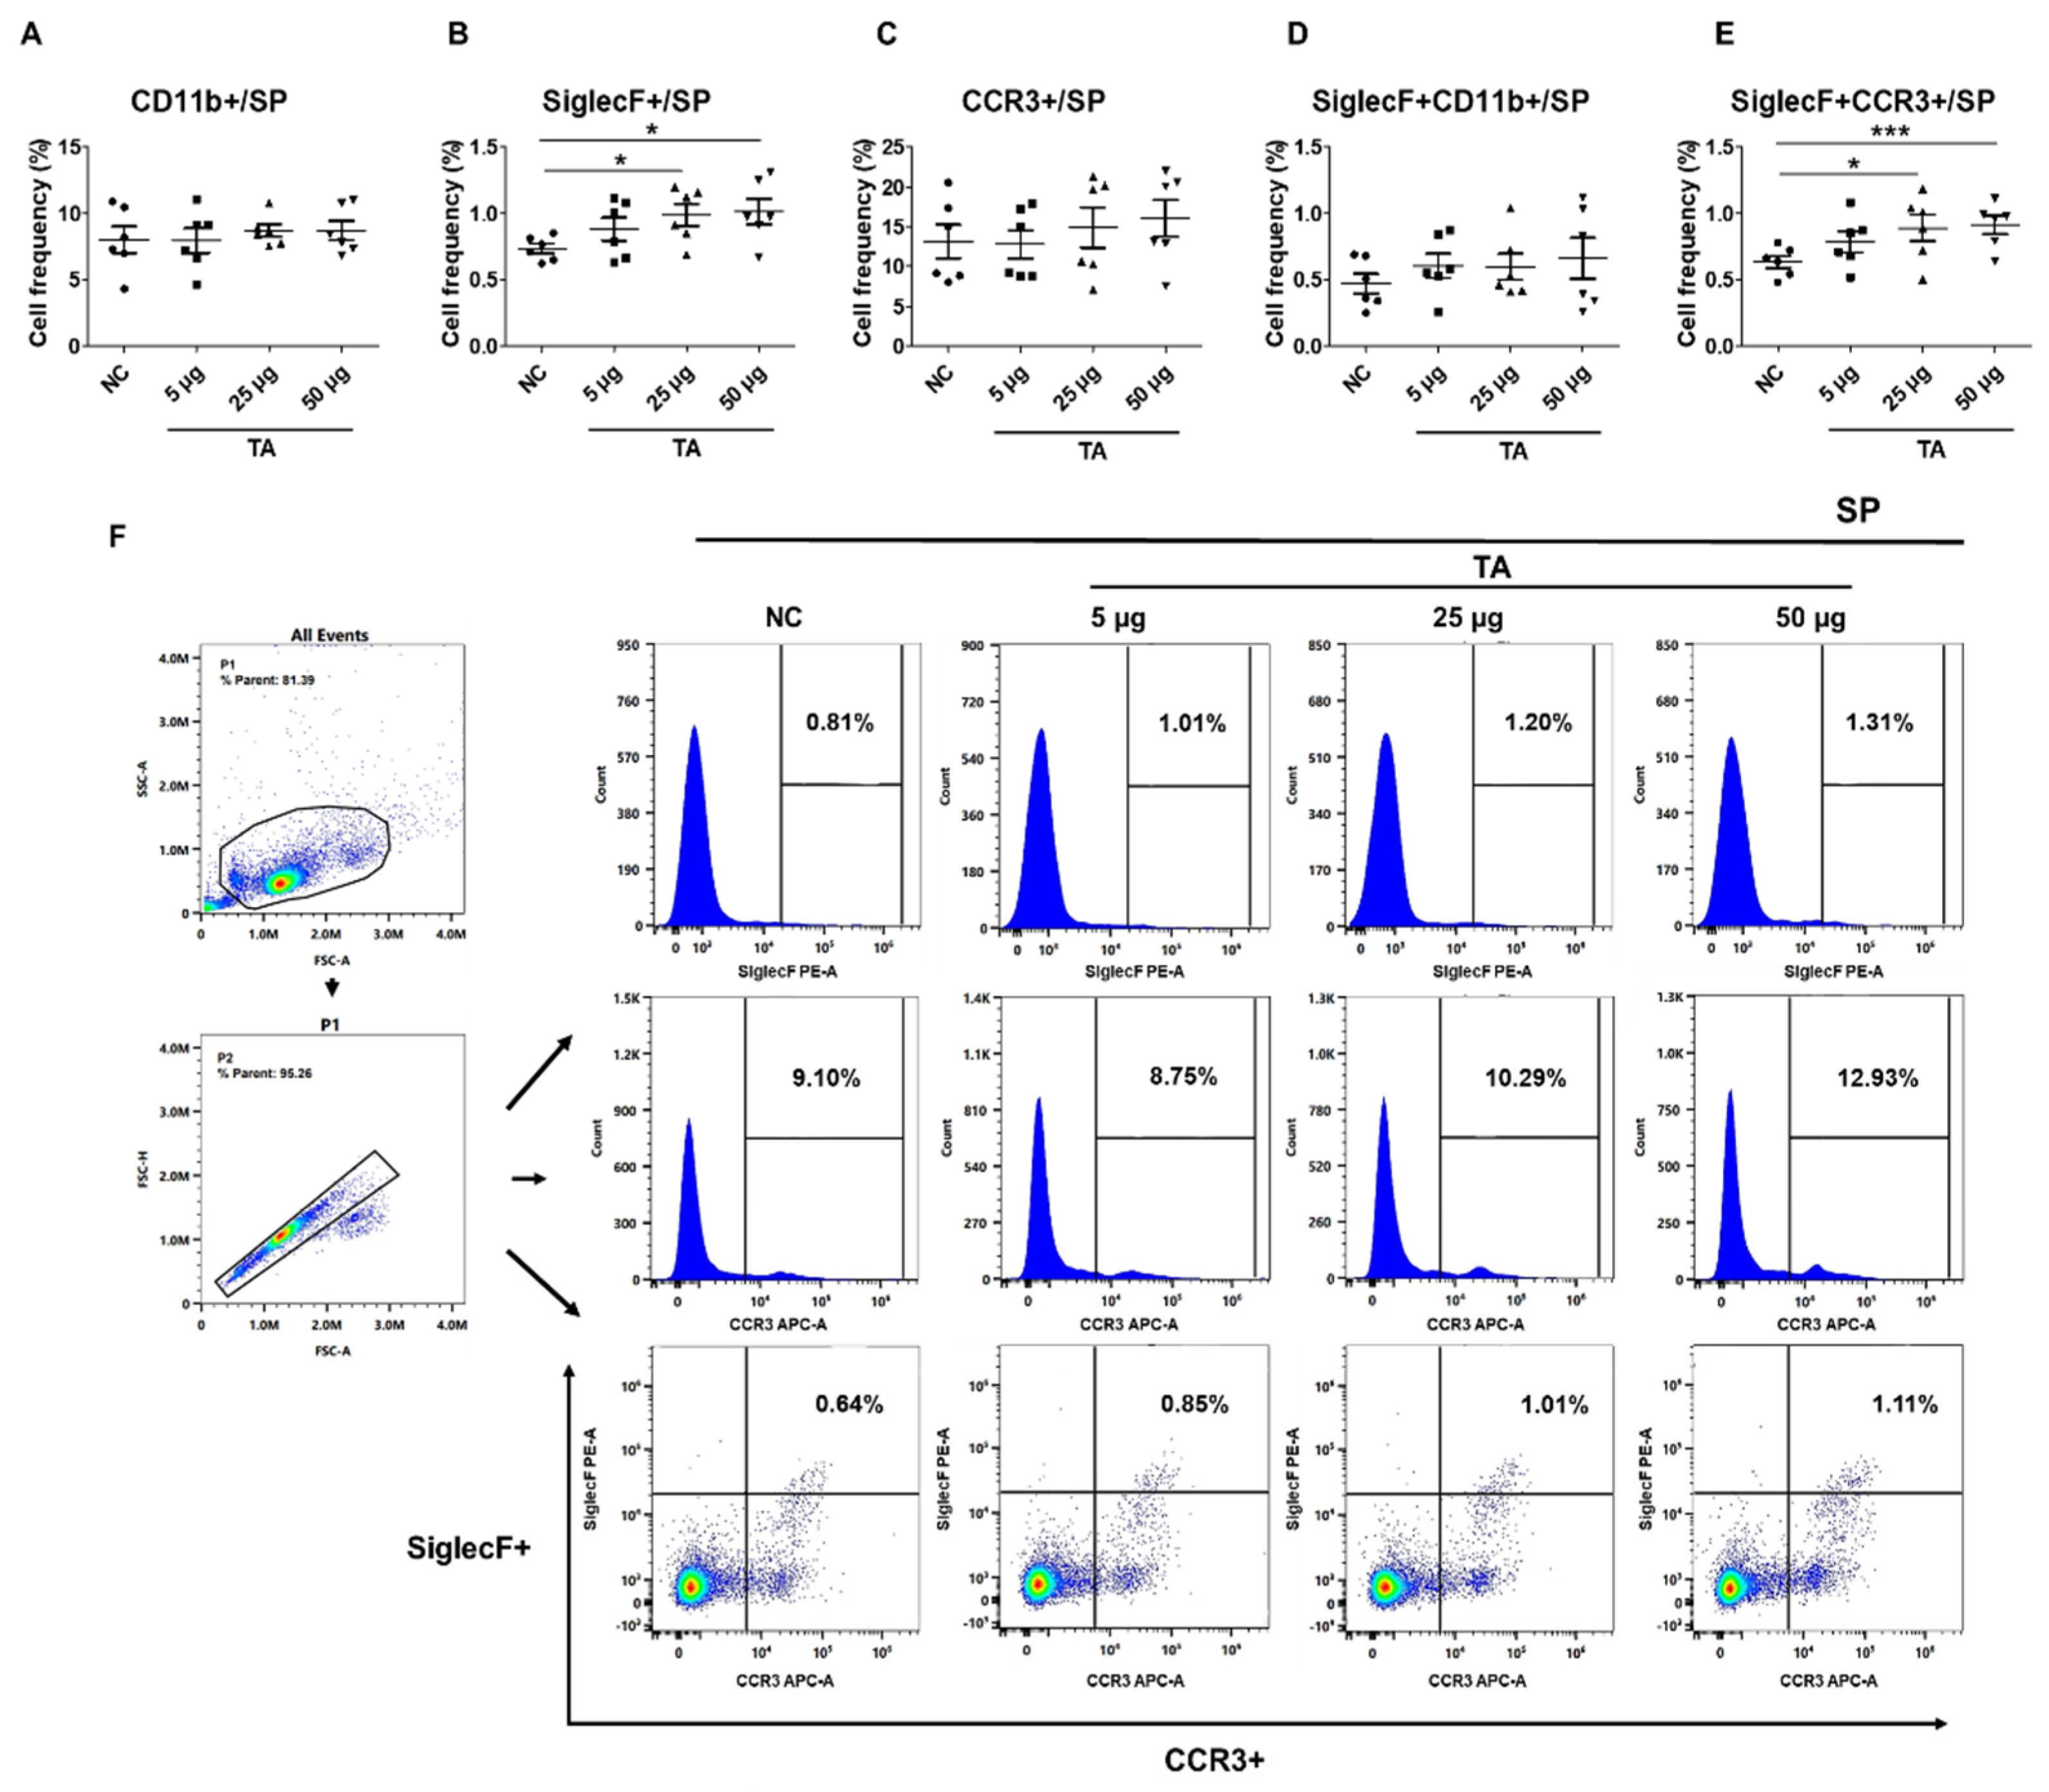
Figure 4.
TA influences Th2 cytokine expressions in 8-week-old mice (n=5 per group). Th2 cytokines (IL-4, IL-13, IL-31) and IL-17 were measured by flow cytometry in LN and PBLs after TA administration to normal mice at doses of 5 µg, 25 µg, or 50 µg. (A-D) show higher expressions of IL-4, IL-13, IL-31, and IL-17 in the LN of mice treated with 50 µg TA compared to mice treated with low and medium TA doses (5 µg and 25 µg) and normal controls. In PBLs, there were no significant differences in the frequencies of cytokine-positive cells (E-H). (I) shows the gating strategy for LN analysis in untreated and 50 µg TA-treated mice. Statistical significance was assessed using the Student’s t-test. Data are presented as means and error bars represent standard deviations. * p < 0.05.
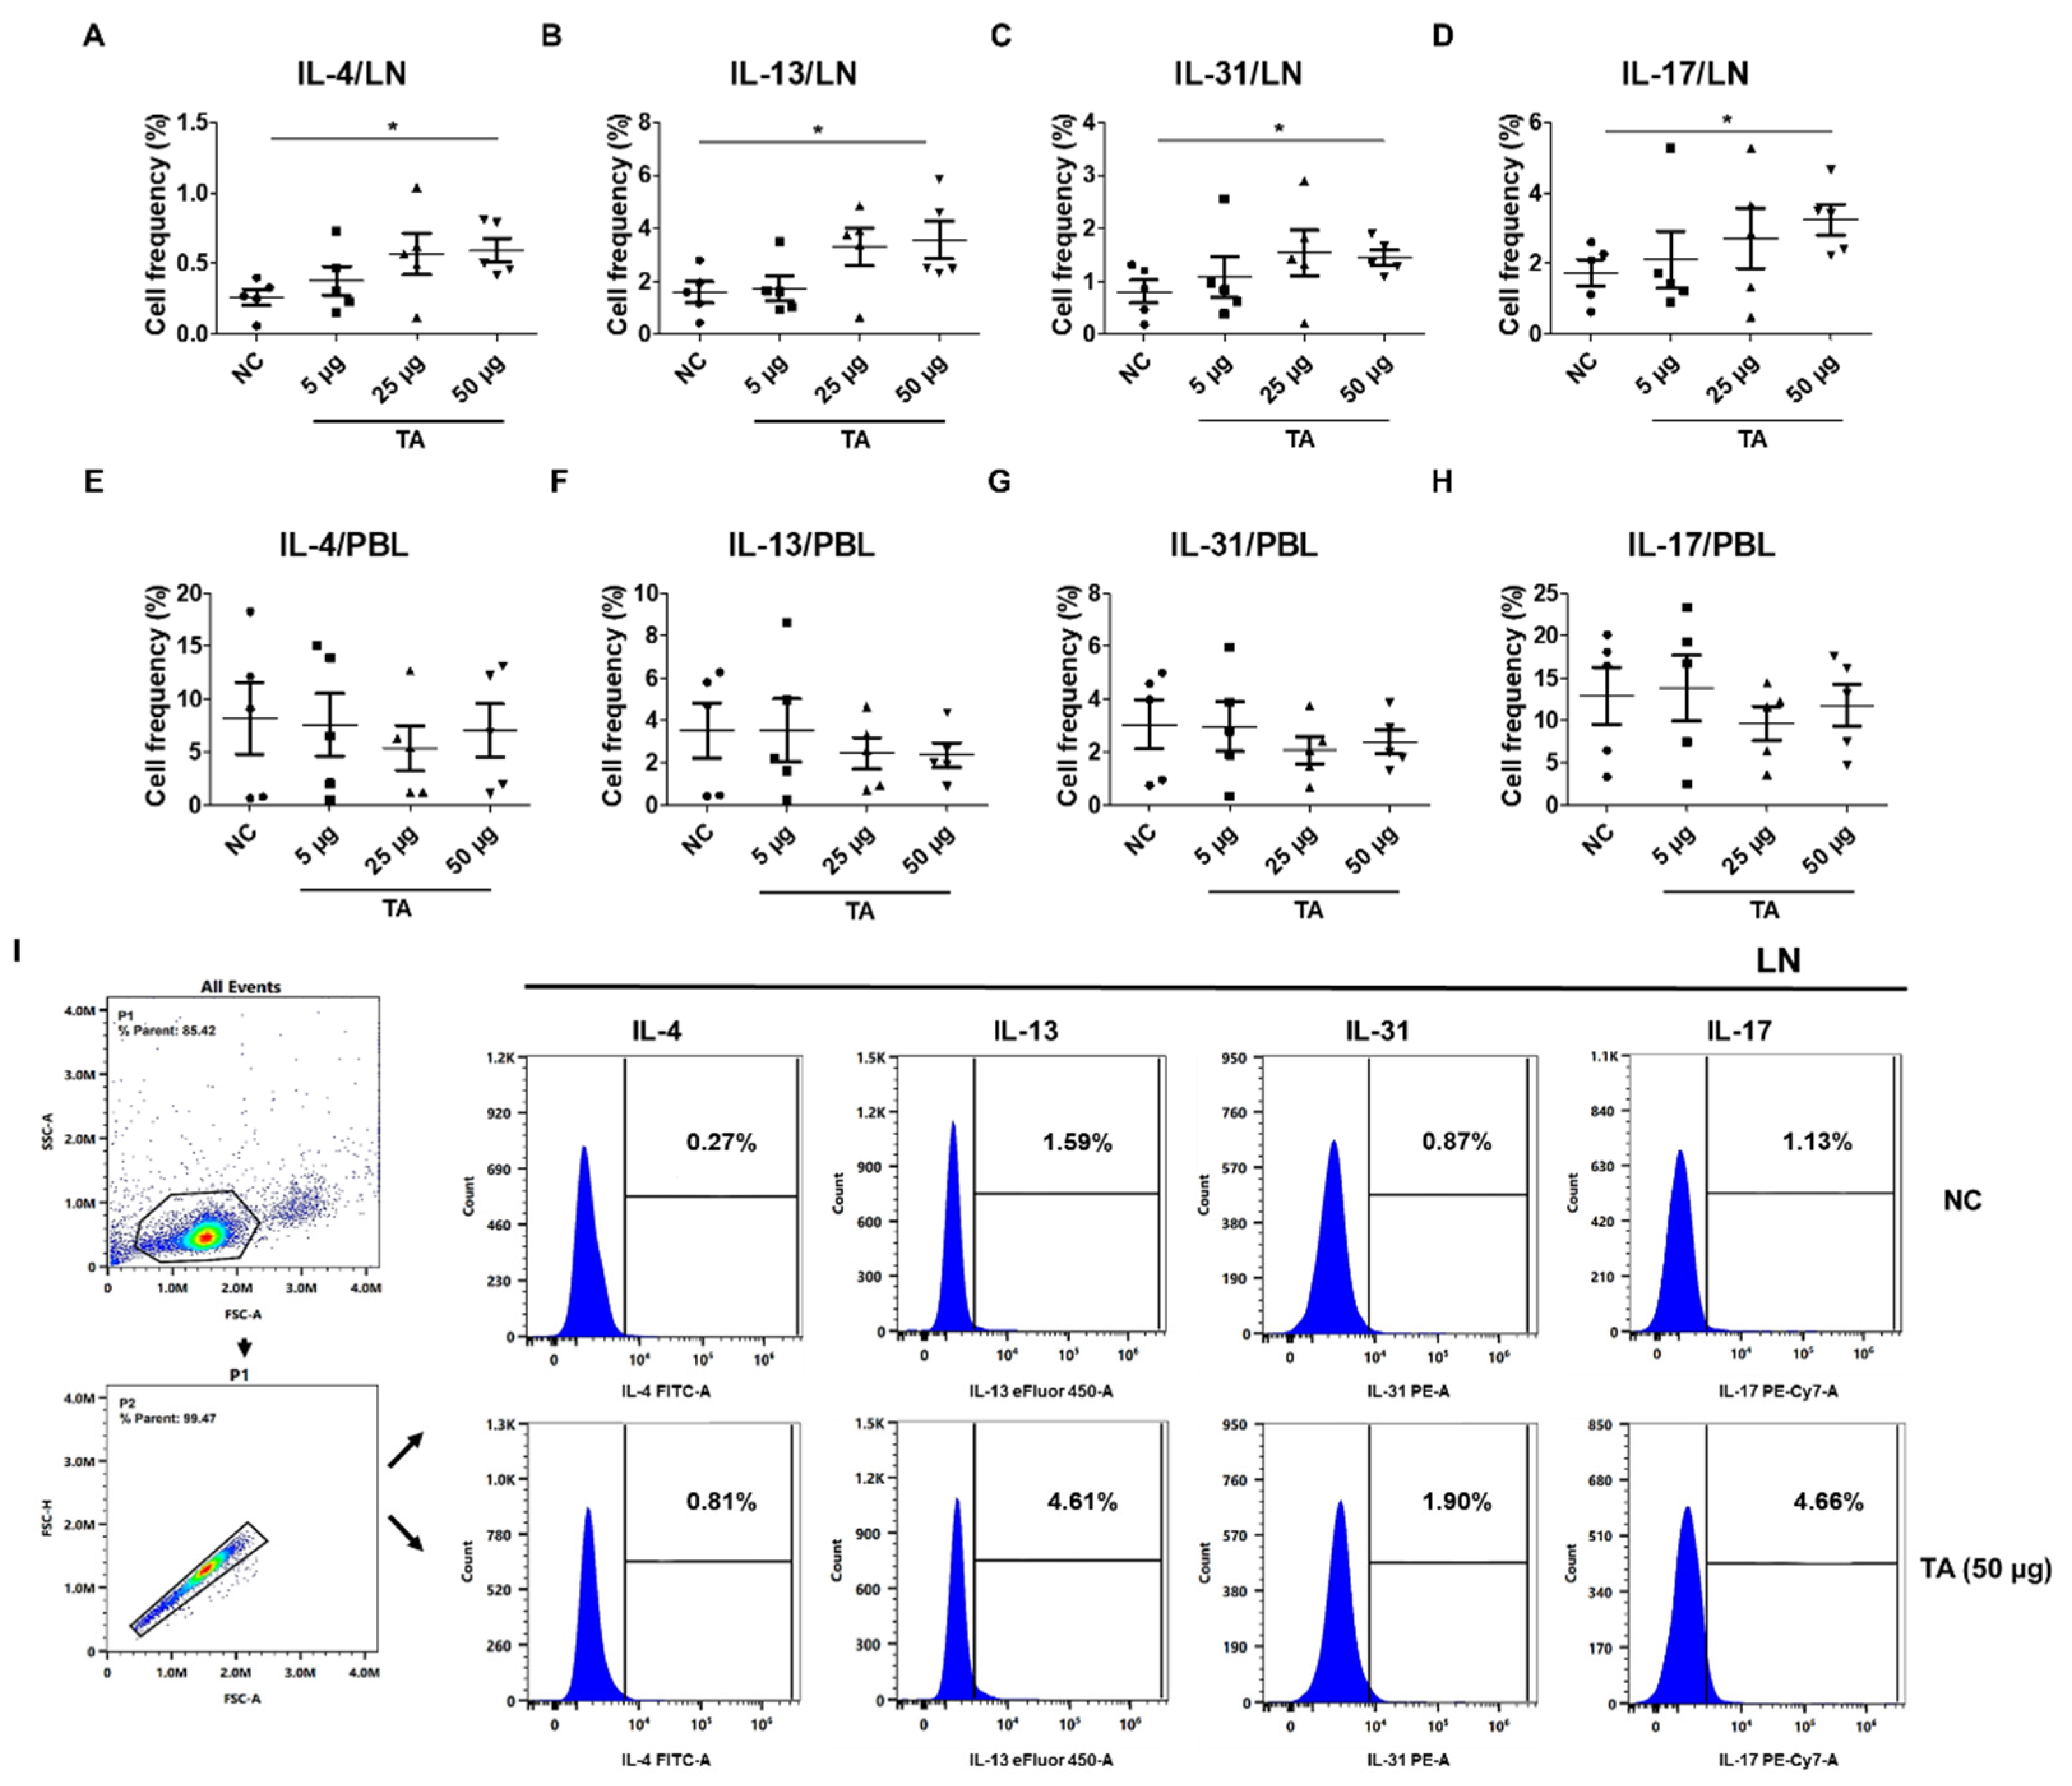
Figure 6.
Electron microscopic images of immune cells in lymph nodes of 8-week-old mice. (A) LN from normal control mice without eosinophils. (B) LN from mice administered 50 µg TA showing eosinophils. Images highlight the presence and morphology of eosinophils in the treated group in contrast to the control group.
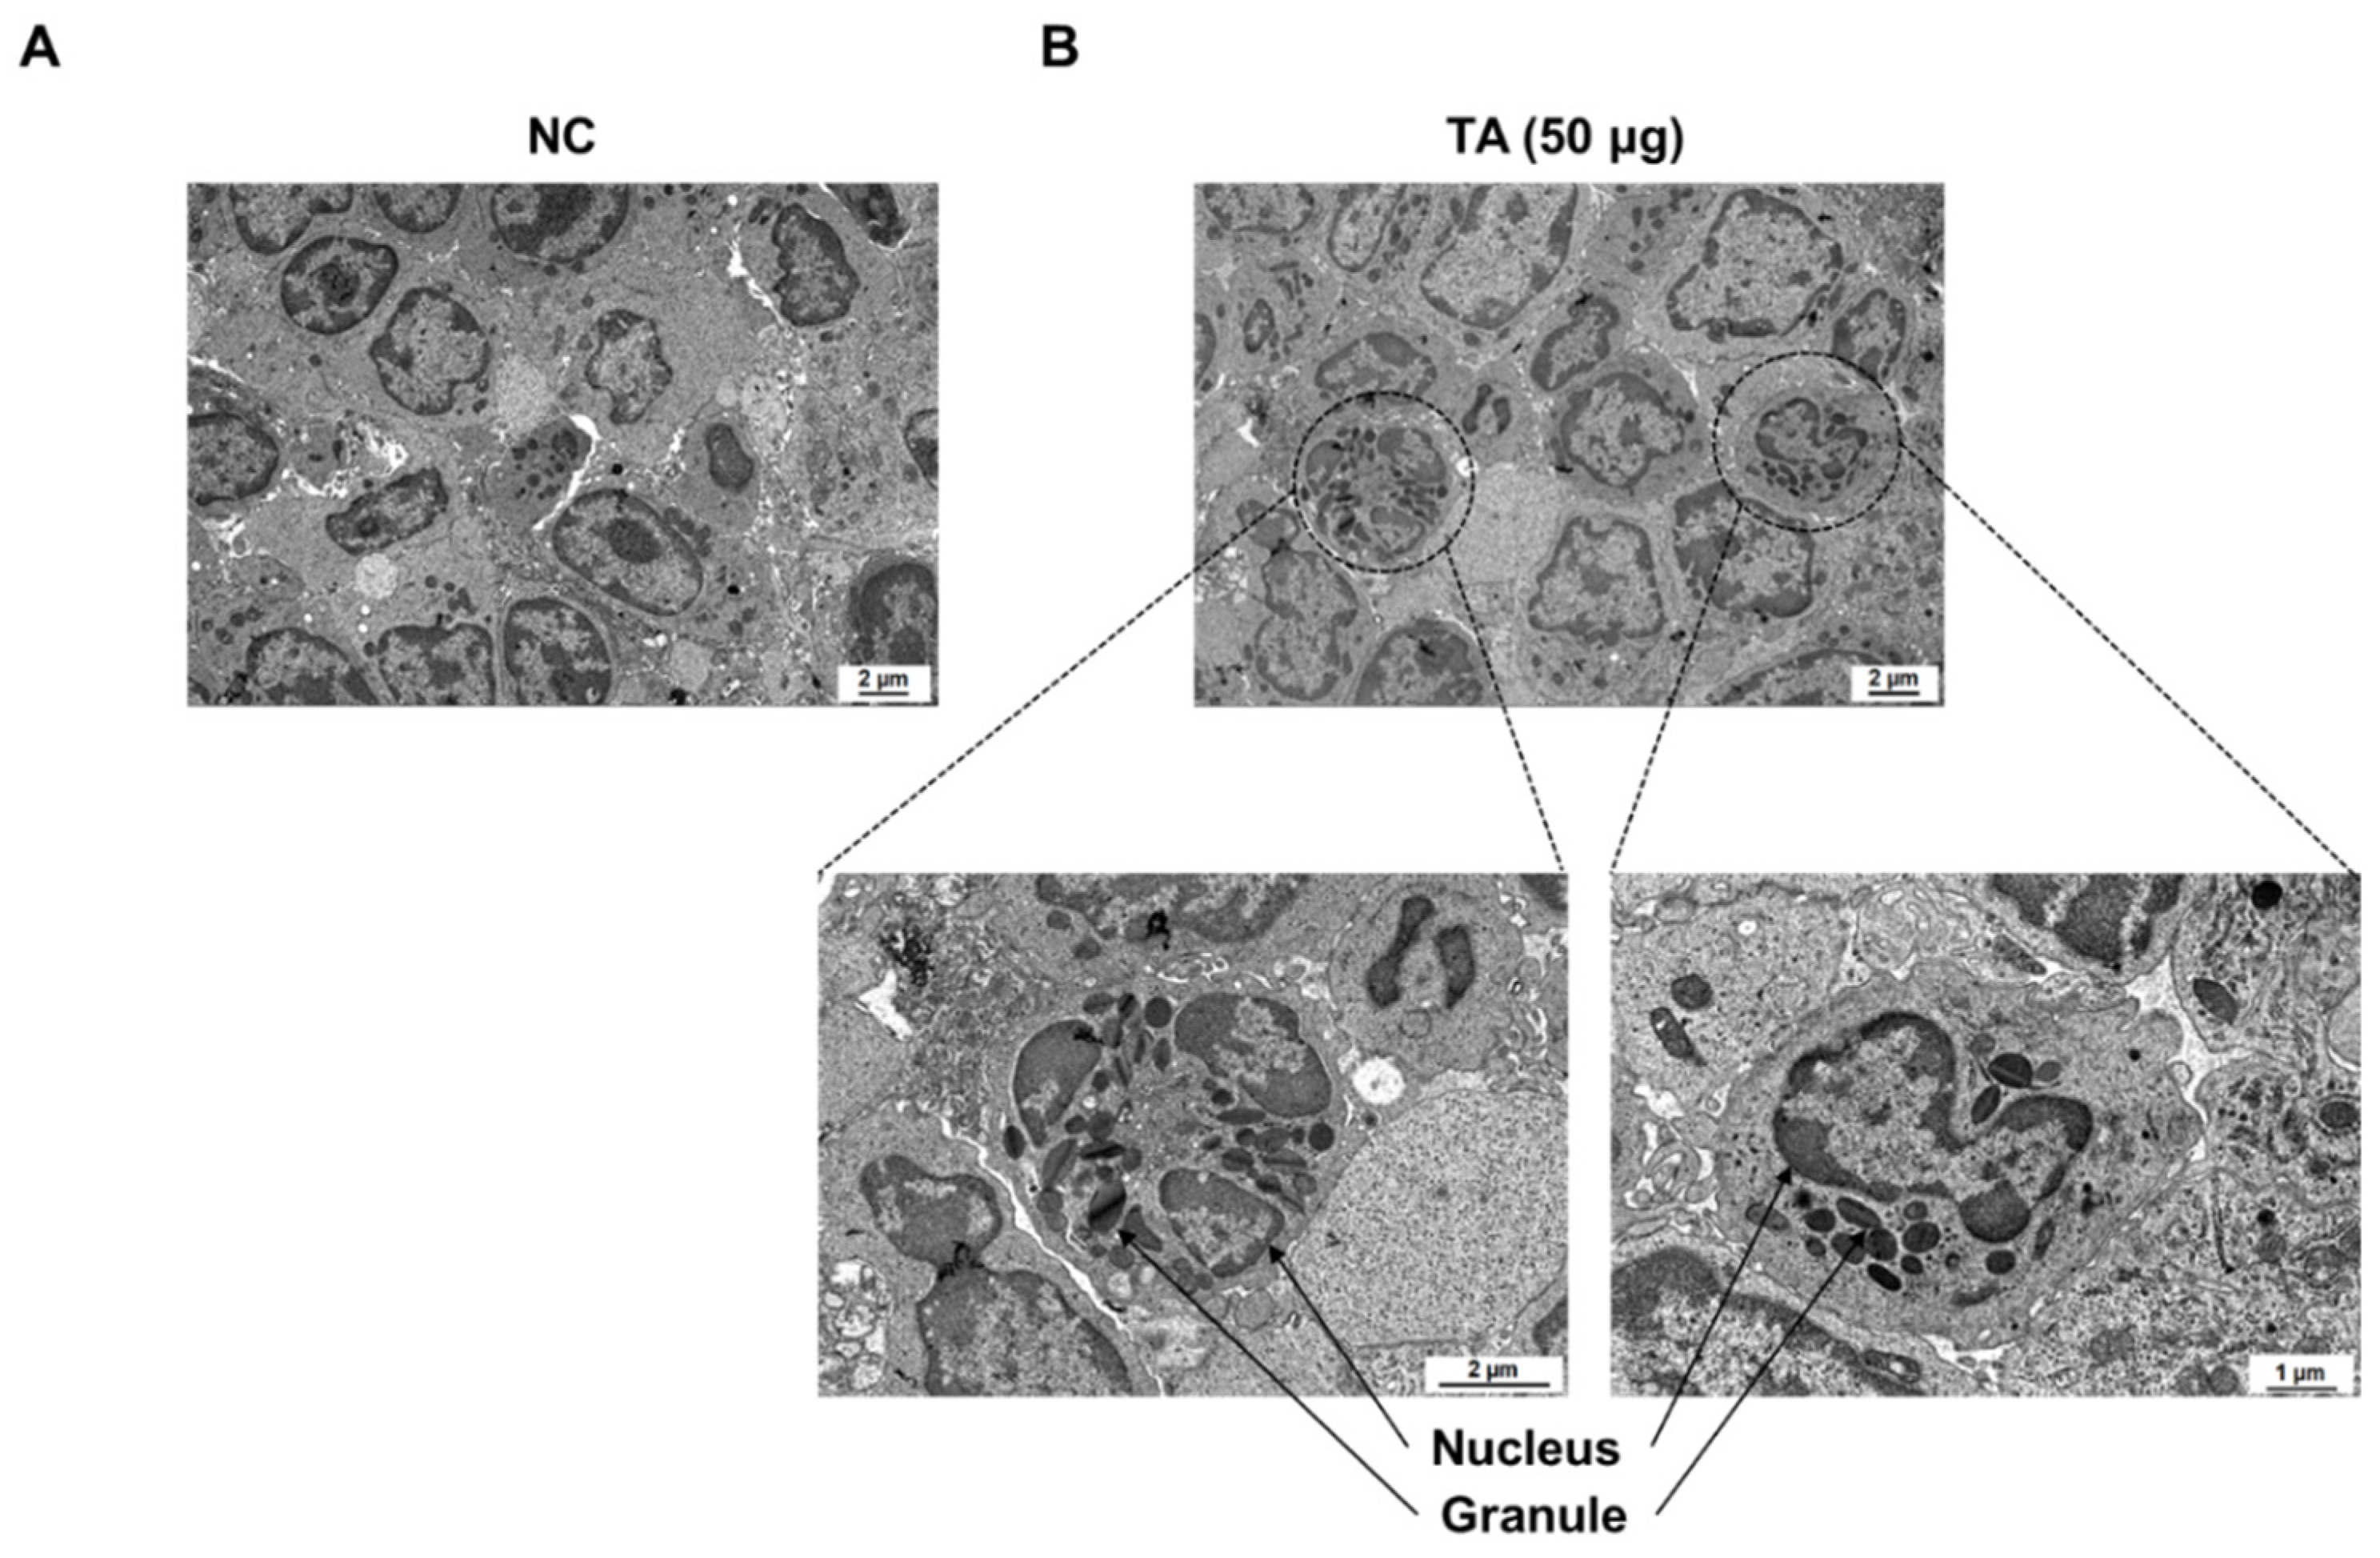
Figure 7.
Influence of TA in DSS-induced colitis model. The experiment was performed using 8-week-old mice (n = 5 per group). (A) Experimental groups and dosing schedule. (B) Trends in body weight changes. (C) Comparison of colon lengths. Data are expressed as mean ± SD, and error bars represent standard deviations. (D) TEM images of the LN of colitis mice administered with TA and the LN of colitis mice not administered with TA. The arrow indicates eosinophil granule. *** p < 0.001.
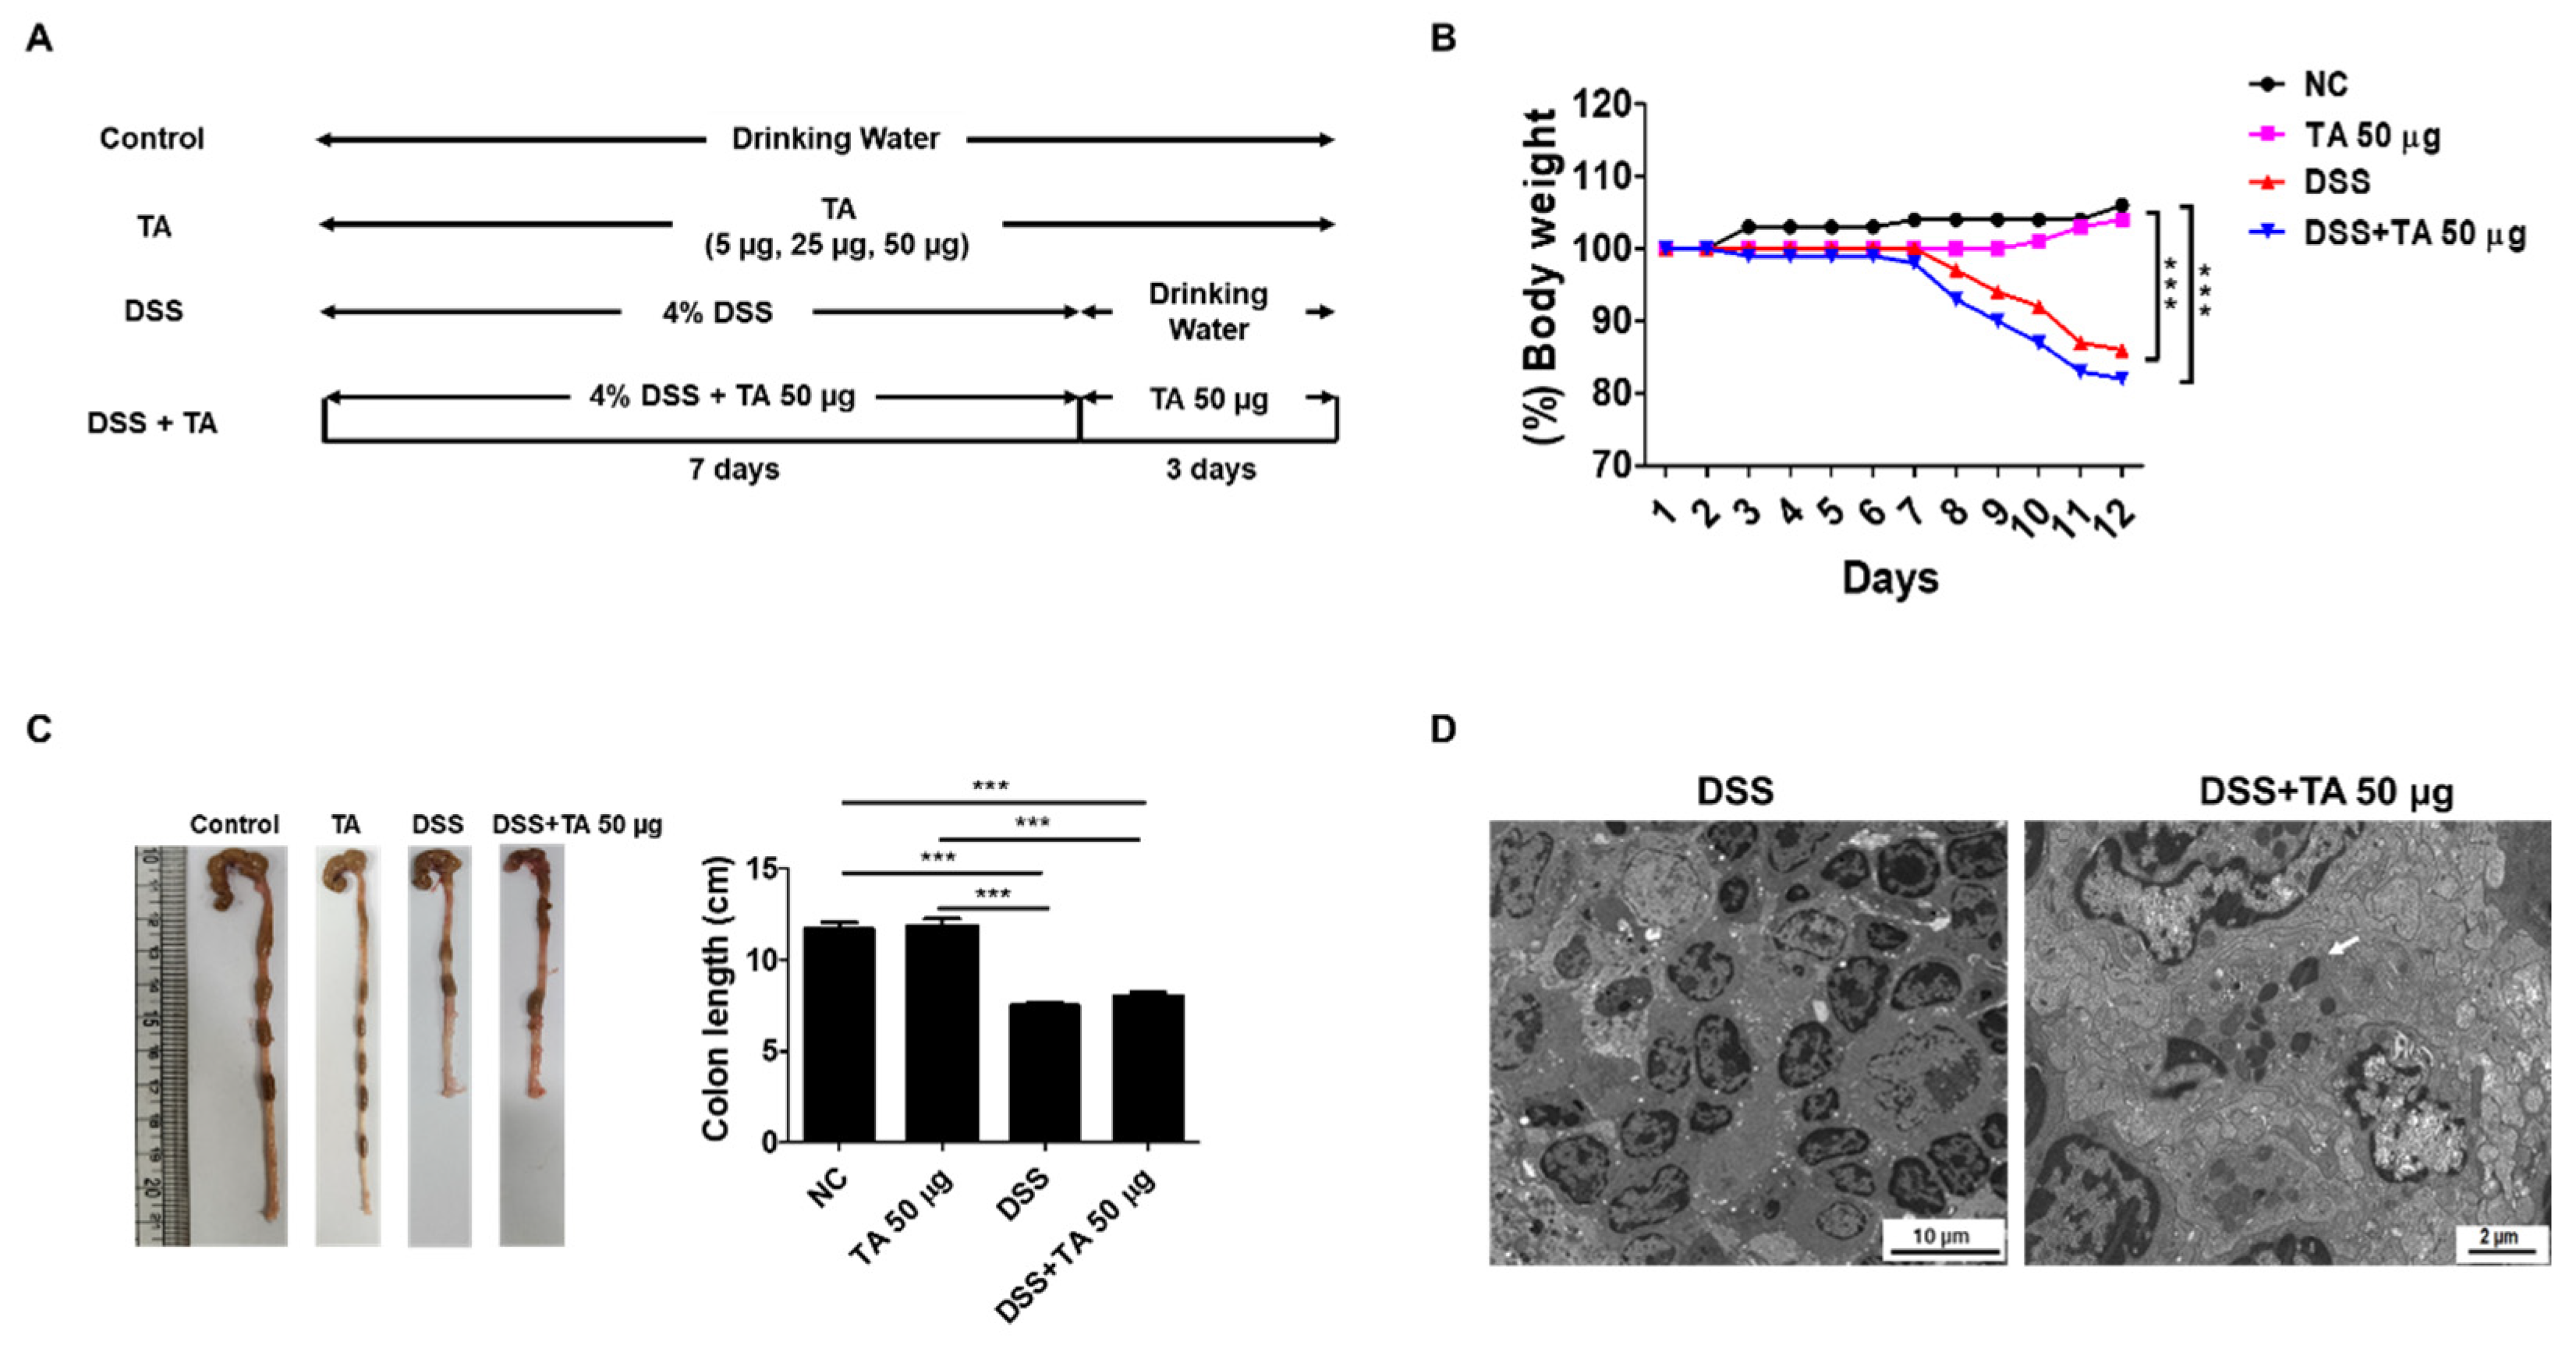
Figure 8.
Analysis of mRNA expression of eosinophil-related regulatory molecules in the spleen of colitis mice following TA administration by qRT-PCR (n = 5 per group). (A) CCR3, (B) SiglecF, (C) TLR2, and (D) TLR4. Statistical significance was determined using the Student’s t-test. Bars represent mean expression levels, and error bars represent standard deviation. * p < 0.05, ** p < 0.01, *** p < 0.001.
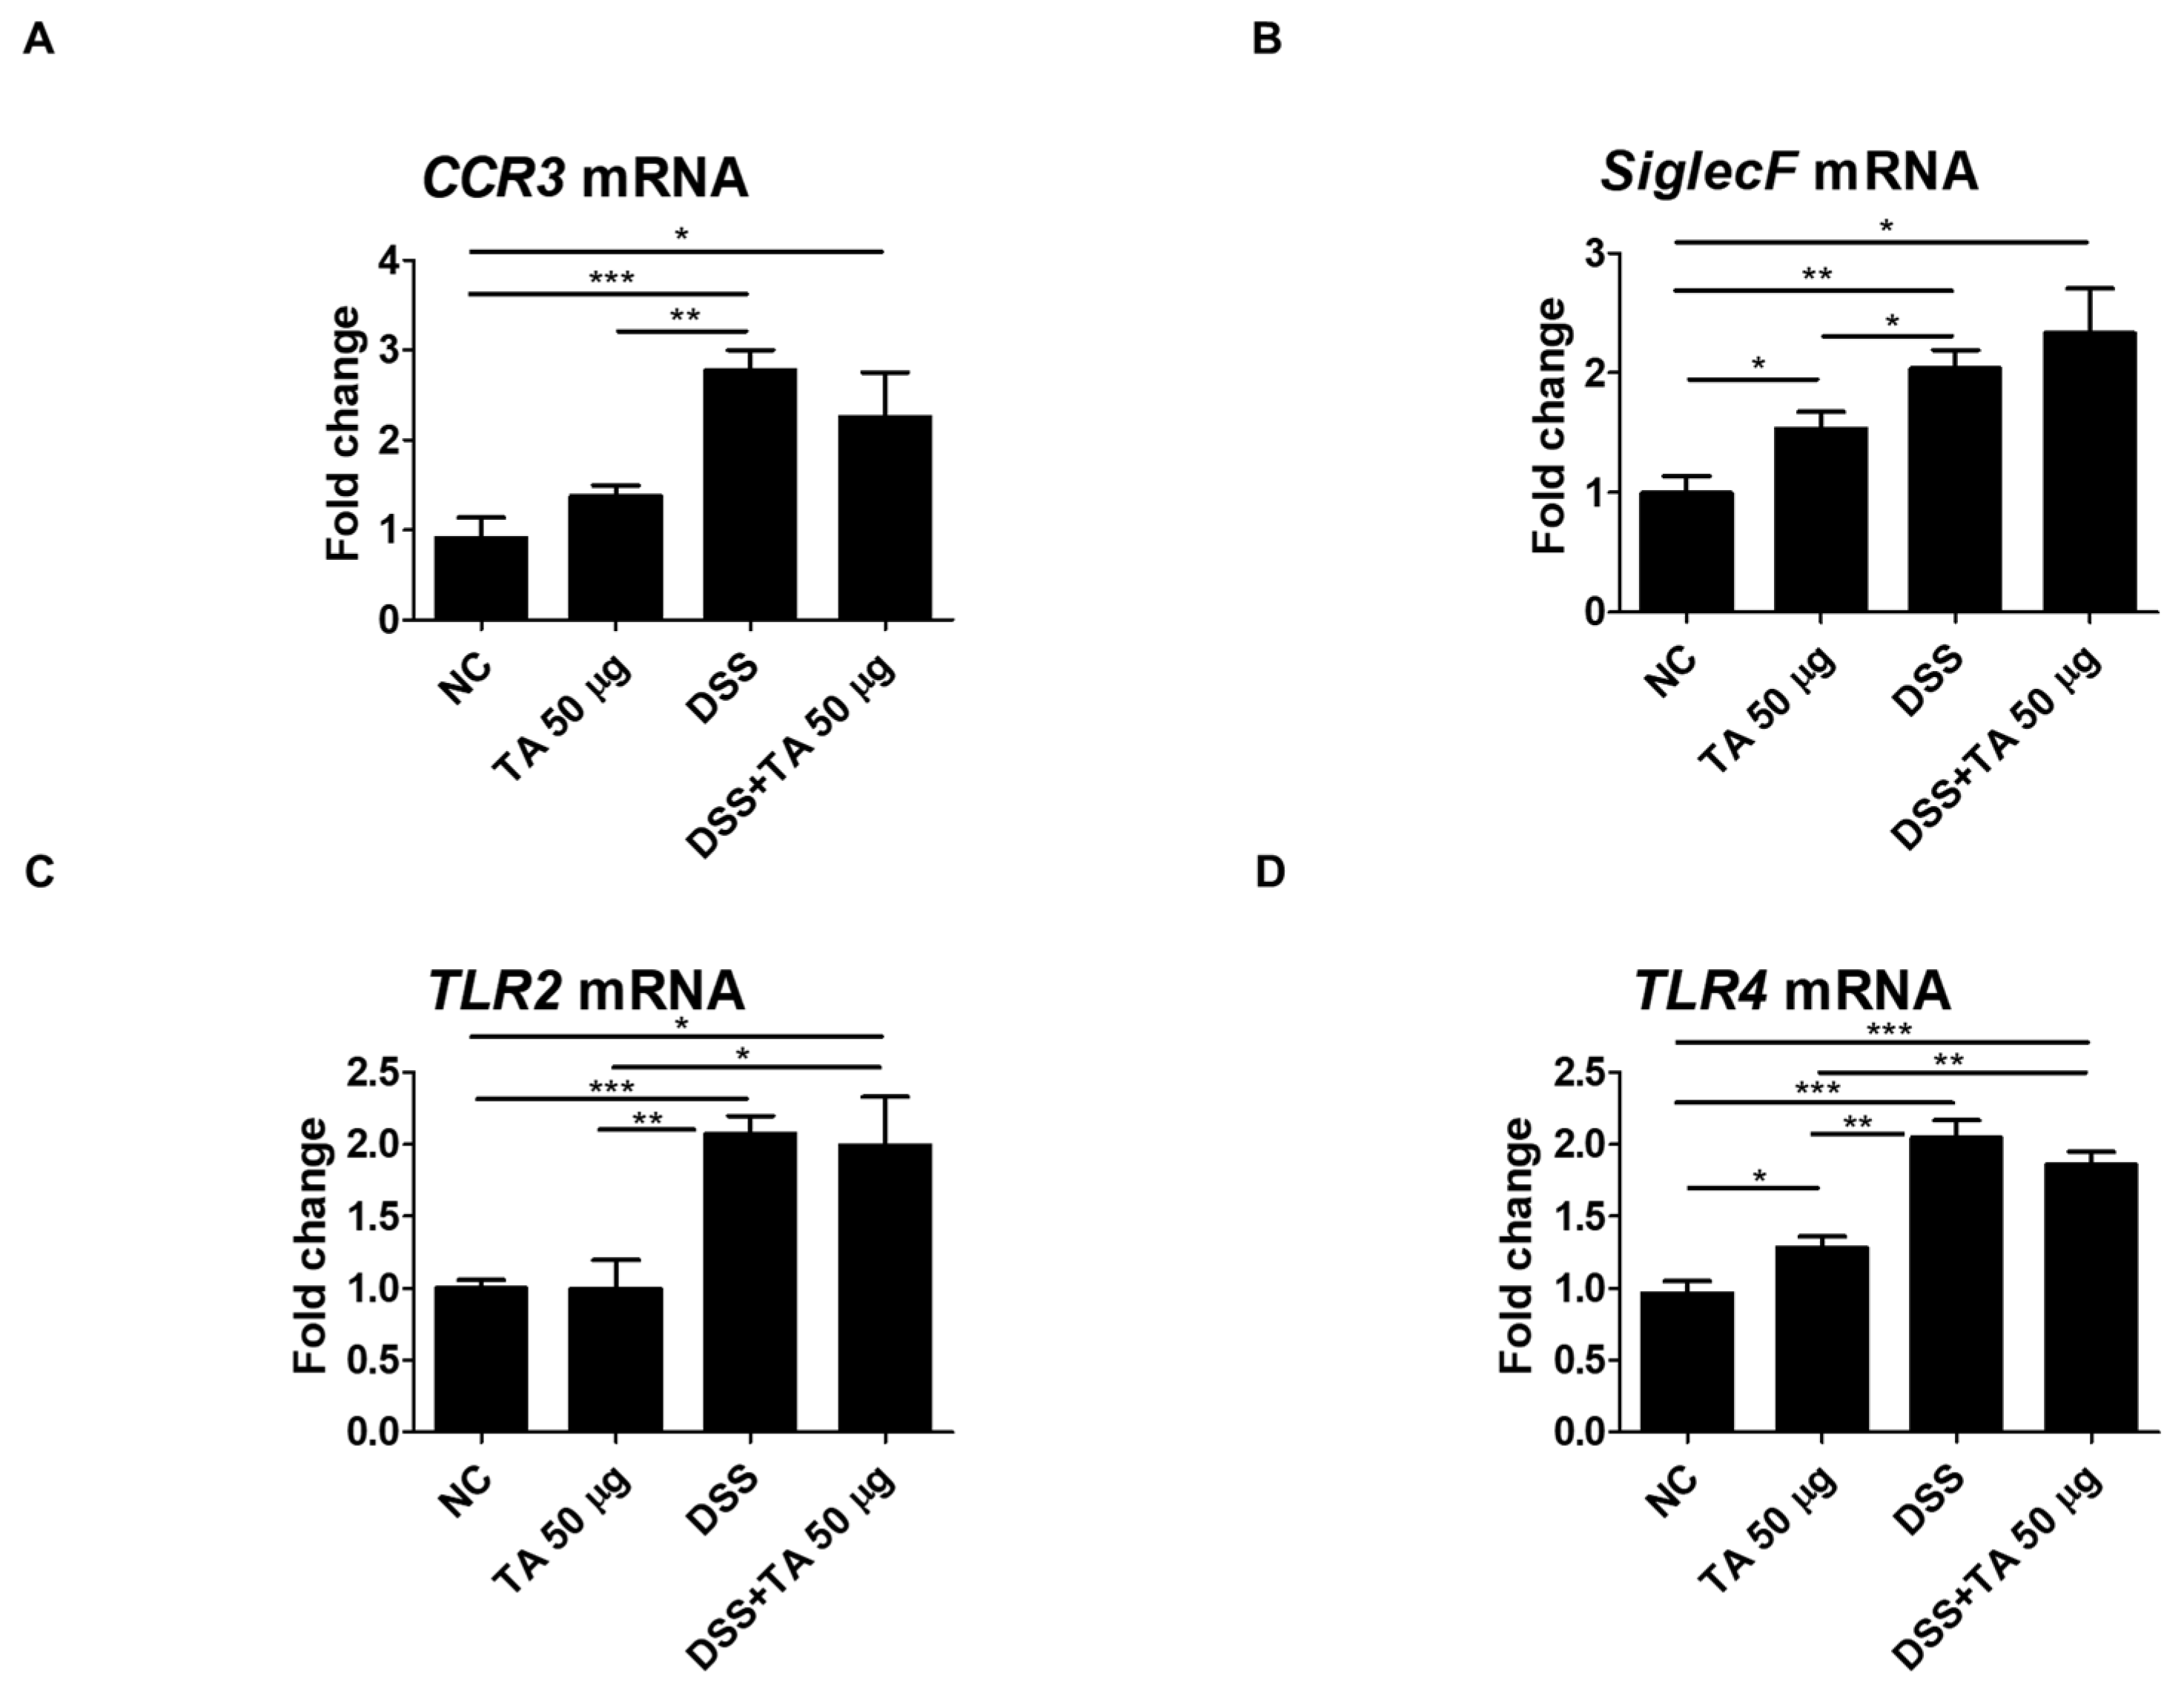
Figure 9.
TA administration modulated mRNA expression of eosinophil-associated cytokines in colitis mice (n = 5 per group). qRT-PCR was used to measure mRNA expression levels of genes. (A) IL-4, (B) IL-5, (C) IL-13, (D) IL-17, (E) IL-5Rα, and (F) CCL11. Statistical significance was determined using the Student’s t-test. Bars represent mean expression levels, and error bars represent standard deviation. * p < 0.05.
Disclaimer/Publisher’s Note: The statements, opinions and data contained in all publications are solely those of the individual author(s) and contributor(s) and not of MDPI and/or the editor(s). MDPI and/or the editor(s) disclaim responsibility for any injury to people or property resulting from any ideas, methods, instructions or products referred to in the content. |
© 2024 by the authors. Licensee MDPI, Basel, Switzerland. This article is an open access article distributed under the terms and conditions of the Creative Commons Attribution (CC BY) license (https://creativecommons.org/licenses/by/4.0/).
Copyright: This open access article is published under a Creative Commons CC BY 4.0 license, which permit the free download, distribution, and reuse, provided that the author and preprint are cited in any reuse.


