
Submitted:
20 November 2024
Posted:
11 December 2024
You are already at the latest version
Preprints on COVID-19 and SARS-CoV-2
Abstract
The intramuscular administration of polymerized type I collagen (PTIC) for adult symptomatic COVID-19 outpatient downregulated hyperinflammation and improved symptoms. We inferred that LAIR-1 is a potential receptor for PTIC. Thus, binding assay and surface plasmon resonance binding assay were performed to estimate the affinity of the interaction between LAIR-1 and PTIC. M1-macrophage derived from THP-1 cells were cultured with 2-10% PTIC for 24 h. Lysates from PTIC-treated THP-1 cells, macrophages-like cells (MLCs), M1, M1+IFN-γ, and M1+LPS were analyzed by western blot for NF-κB(p65), p38, STAT-1, and pSTAT-1 (tyrosine701). Serum cytokine levels and monocyte LAIR-1 expression (Mo1 and Mo2) were analyzed by luminometry and flow cytometry in symptomatic COVID-19 outpatients on PTIC treatment. PTIC-bound LAIR-1 with a similar affinity to collagen in M1-macrophages. It downregulated pSTAT-1 in IFN-γ-induced M1. COVID-19 patients under PTIC treatment significantly decreased Mo1 percentage and cytokines (IP-10/MIF/eotaxin/IL-8/IL-1RA/M-CSF) associated with STAT-1 and increased Mo2 subset. The inflammatory mediators and Mo1 downregulation were related to better oxygen saturation and decreased dyspnea, chest pain, cough, and chronic fatigue syndrome in the acute and long-term phase of infection. PTIC is an agonist of LAIR-1 and downregulates STAT-1 phosphorylation. PTIC could be relevant for treating STAT-1-mediated inflammatory diseases, including COVID-19 and long-COVID.
Keywords:
polymerized type I collagen
; STAT-1
; LAIR-1
; M1-macrophages
; Mo1-monocytes
; long COVID
1. Introduction
Polymerized type I collagen (PTIC) is a γ-irradiated mixture of pepsinized porcine type I collagen and polyvinylpyrrolidone (PVP) in a citrate buffer solution. PTIC has immunomodulatory properties. The addition of 1% PTIC to synovial tissue cultures from patients with rheumatoid arthritis or osteoarthritis downregulates proinflammatory cytokines (IL-1β, TNF-α, IL-8, IL- 17, IFN-γ, PDGF, and TGF-β1); the adhesion molecule expression (ELAM-1, VCAM-1, and ICAM-1); cyclooxygenase (Cox)-1; and the collagenolytic activity. Moreover, PTIC has been shown to induce a positive regulation of the tissue inhibitor of metalloproteases-1 (TIMP-1), IL-10, and regulatory T cells [ 1-15].
Studies of intramuscular PTIC administration to patients with moderate-severe COVID-19 were associated with the downregulation of the hyperinflammatory syndrome and better oxygen saturation values compared to placebo. PTIC shortened symptom intensity and duration. A higher mean oxygen saturation value and proportion of patients retaining oxygen saturation values ≥ 92% were observed. This could be related to a decrease in dyspnea and chest pain, as well as cough. An unadjusted accelerated failure time model showed that the PTIC group achieved the outcome 2.70-fold faster (P<0.0001) than the placebo. Symptom duration in the PTIC group was reduced by 6.1±3.2 days vs. placebo. No differences in adverse effects were observed between the groups [16-19].
To date, neither the receptor nor the signaling pathway of PTIC has been described. Thus, leukocyte-associated immunoglobulin-like receptor1 (LAIR-1 or CD305) was evaluated as a potential receptor for PTIC. LAIR-1 is a transmembrane inhibitory receptor that contains two immunoreceptors tyrosine-based inhibitory motif (ITIM) domains in its cytoplasmatic region [20]. LAIR-1 is expressed in most hematopoietic cells, including T and B cells, neutrophils, dendritic cells (DCs), monocyte-derived DCs, natural killers, monocytes (Mos), macrophages and CD34+ hematopoietic progenitor cells [20,21]. Native and detanurated α chains of types I, II, and III collagens and collagen domain-containing proteins are natural ligands for LAIR-1; their engagement on immune cells downregulates excessive inflammation [20-24]. It has been demonstrated that the LAIR-1 KO collagen-induced arthritis model develops severe arthritis and has a more significant percentage of affected limbs than the wild-type mice [25,26]. Moreover, decreased levels of LAIR-1 in circulating CD4 T cells in synovial fluid and increased levels of LAIR-1 in Mos and local CD68+ macrophages in synovial tissue have been used as biomarkers of active rheumatoid arthritis patients. LAIR-1 is highly expressed on intermediate Mos (CD14+/CD16+) and plasmacytoid DCs (CD14-/CD1c-/CD123+/CD303+). In vitro, Mo and type-2 conventional DC stimulation leads to LAIR-1 upregulation, which may reflect its importance as a negative regulator under inflammatory conditions. LAIR-1 ligation on Mos inhibits TLR4 and IFN-α-induced signals. LAIR-1 is downregulated on GM-CSF and IFN-γ Mo-derived macrophages and Mo-derive DC. Thus, the interaction LAIR-1 with collagen could play a role in controlling immune cells in various phases of the inflammatory response [27].
In this study, we show evidence of LAIR as one receptor for PTIC through in vitro analysis of THP-1 cells polarized to M1 and in circulating Mos of symptomatic COVID-19 outpatients on treatment with intramuscular administration of PTIC.
2. Results
2.1. Differentiation of THP-1 to macrophage-like cells and polarization to M1
THP-1 cells were stimulated with PMA, inducing an MLC phenotype. Morphological changes were observed at 72 h. THP-1 cells changed from cells in suspension (Figure 1A) to adherent cells (Figure 1B). For polarization to M1, MLCs were stimulated with IFN-γ and LPS, verified by the expression of CD36, CD86, and IL-1β (Fig 1E) vs unstimulated MLCs (Figure 1C).
2.2. The effect of polymerized type I collagen on M1 macrophages is dose-dependent, favoring polarization toward the M2 phenotype
To determine the effect of PTIC and whether it was dose-dependent, a gel electrophoresis shift assay in lysates of M1 cells cultured with 2, 5, or 10% PTIC was performed. This method identified a mixture of proteins before and after CI or PTIC treatment and their absence or shift in position due to CI or PTIC binding to the LAIR-1 receptor. We found that the 100 kDa, 75 kDa, 55 kDa, 25 kDa, and 22 kDa bands were decreased, and 40 kDa and 78 kDa bands were increased in a PTIC dose-dependent manner (Figure 1I). Based on these observations, we carried out all the assays using 10% PTIC.
The addition of 10% PTIC to the M1 cultures induced a decrease in the percentage of CD16+/CD36+/CD86+/IL-1β-expressing cells (Figure 1G) and an increase of CD14+/CD16+/CD163+/IL-10-expressing cells, favoring the M2 phenotype (Figure 1H), in contrast to untreated PTIC cultures (Figure 1D, F). This suggests that the PTIC can play a role in macrophage phenotype.
2.3. Polymerized type I collagen binds to LAIR-1 with a similar affinity as native type I collagen
Using the biacore sensor chip CM5 with LAIR-1, a binding assay was conducted to determine whether the type I collagen of PTIC is also a ligand for LAIR-1. The chip was incubated with CI or PTIC. The LAIR-1 affinity for PTIC was like that of CI (Figure 2A). The Ka value for PTIC was 9.10x10⁷ ± 2.28x10⁶ M-1 s-1, whereas the Ka value for CI was 4.73x10⁷ ± 2.20x10⁶ M-1s-1. Similarly, the Kd value for PTIC was 4.80x10⁻⁴ ± 2.26x10⁻⁵ s-1, while the Kd value for CI was 5.89x10⁻⁴ ± 1.05x10⁻⁵ s-1. The KD value for PTIC was 0.247±0.133 nM, whereas the KD value for CI was 0.118±0.053 nM (Figure 2B). The above suggests that the collagen of the PTIC compound can bind with the same affinity as CI to the LAIR-1 receptor.
2.4. Activation of the LAIR-1 receptor with the anti-huLAIR-1 antibody or polymerized type I collagen favors the change of M1 to M2 macrophage phenotype
The addition of anti-LAIR-1 antibody to CD36+/CD86+/IL-1β+ M1 decreased the expression of its characteristic subset markers (Figure 2C) and increased M2 markers (CD14, CD16, CD163, and IL-10; Figure 2D). A similar response was observed in M1 cells cultured with the mixture of anti-LAIR-1 antibody and 10% PTIC (Figure 2E, F, G).
2.5. Polymerized type I collagen downregulates INF-γ gene expression in M1 macrophages
The addition of PTIC to M1 cultures prevented the increase of the expression of ifn-γ mRNA at 24 and 48 h. Moreover, PTIC downregulated the expression of ifn-γ mRNA in M1 despite constant stimulation with IFN-γ and LPS at 24 h. Il-10 mRNA increases at 6 h in cultures with or without PTIC, decreasing at 24 and 48 h. While adding PTIC to IFN-γ and LPS stimulated M1 cells decreased the il-10 mRNA at 6, 24, or 48 h. IL-1 β mRNA gradually increases at 6 and 24 h and decreases at 48 h in M1. Despite constant M1 stimulation with IFN-γ and LPS, PTIC reduced IL-1β mRNA levels compared to M1 cells (Figure 2H).
2.6. The binding of polymerized type I collagen to LAIR-1 downregulates inflammation through decrease of STAT-1 phosphorylation in M1 macrophages
To determine the signaling pathway regulated by PTIC binding to the LAIR-1 receptor, the lysates from THP-1 cells, M1, M1 treated with 10% PTIC, and M1 activated with IFN-γ or LPS were obtained. They were analyzed by western blot to identify the transcription factors NF-κB (p65), p38, and STAT-1. Adding 2 or 10% PTIC to M1 cultures did not alter NF-κB (p65) or p38 expression (data not shown). This suggests that none of these pathways participates in the LAIR-1 signaling pathway activated by PTIC. Nevertheless, a PTIC dose-dependent decrease in STAT-1 phosphorylation (tyrosine701) was determined. STAT1 activation entails the phosphorylation of residue tyrosine701 and the subsequent homo- or heterodimerization via reciprocal phosphor-Tyr:SH1 and 2 domain interactions. It transforms the STAT into high-affinity DNA-binding transcriptional regulators and triggers their retention in the nucleus. Thus, unphosphorylated monomers derived from PTIC treatment could exert a negative regulatory effect on the inflammation mediated by M1, inhibiting the signaling by IFN-γ (Figure 3A, B). Adding anti-LAIR-1 antibodies to M1 cultures activated the receptor, reducing STAT-1 phosphorylation more efficiently than PTIC or the combination of anti-LAIR-1 and PTIC (Figure 3C, D).
2.7. Evaluation of the polymerized type I collagen effect on circulating monocytes (Mo)1 of COVID-19 patients.
2.7.1. Baseline description of the study population
Forty adult non-hospitalized patients with COVID-19 (mild to moderate disease) were included in the study. The mean (±SD) age of the patients was 49.6±13.8 years. Twenty patients (50%) were male. According to the Guangzhou score to predict the occurrence of critical illness, the mean score was 93.2±24.4 (medium risk). The mean (±SD) oxygen saturation of study participants was 91.8±2.9. Sixteen patients (40%) had an oxygen saturation of 91% or lower while breathing ambient air (6 of the PTIC group and 10 of the placebo group). Coexisting conditions and symptoms are described in Table 1. Patients were randomly assigned to receive either 1.5 ml of PTIC intramuscularly every 12h for 3 days and then every 24h for 4 days or a matching placebo.
Regarding radiological abnormalities on chest CT, 35 patients (87%) had lung disease; of these, 26 (65%) had less than 20% lung parenchymal involvement, 8 (20%) had between 20 and 50%, and 1 (2%) had higher than 50% lung parenchymal involvement (Table 1).
2.7.2. Concomitant medications
Of 40 patients at baseline, 28 (70%) were being treated with acetaminophen, 13 (33%) with acetylsalicylic acid, 3 (8%) with antivirals (oseltamivir), and 16 (40%) with antibiotics (azithromycin, ceftriaxone, penicillin, clarithromycin, and levofloxacin). The use of acetaminophen (35% vs. 35%), acetylsalicylic acid (20% vs. 13%), antivirals (5% vs. 3%), and antibiotics (22% vs. 18%) were similar in the PTIC and placebo groups, respectively. No patients were treated with anticoagulants or steroids.
2.7.3. COVID-19 patients under treatment with polymerized type I collagen decrease the number of IP-10-producing monocytes (Mo)1 and increase the number of regulatory IDO-expressing Mo2
Mos are heterogeneous and highly plastic immune cells that can shape acute inflammation through diverse immunomodulatory functions. During the early phase of the COVID-19 infection, the Mos1 are responsible for the release of several growth factors and proinflammatory cytokines, including CXCL1, CXCL2, CXCL10 (IP-10), CCL2, and TNF-α. Particularly in the study nested cohort, a high percentage of IP-10-producing Mo1 was determined (Figure 4B-C; Table 1), which decreased to statistically significant levels from day 8 to 90 post-treatment with PTIC but not with placebo (Figure 4D-F; Table 1). Differences in the number of circulating Mo1 on days 15 and 90 post-treatment with PTIC and placebo were determined (P=0.008 and P=0.011, respectively; Figure 4G; Table 1).
In contrast, the percentage of IDO-producing Mo2 increased to statistically significant levels from day 8 to 90 post-treatment with PTIC vs. placebo (Figure 5B-F; Table 1). Differences were found between the groups in the number of circulating Mo2 at day 8 and 90 post-treatment (P=0.002, P<0.001, and P<0.001, respectively (Figure 5G; Table 1).
2.7.4. Polymerized type I collagen decreases the expression of LAIR-1 in monocytes (Mo)1 and increases it in Mo2
LAIR-1 is consistently upregulated on Mos during inflammatory phase of immune response. Thus, during the early phase of COVID-19 infection, a high percentage of circulating LAIR-1-expressing Mo1 was observed. However, this percentage decreased significantly over time in COVID-19 patients who received treatment with PTIC compared to those who received a placebo (Figure 4H). Differences in the number of circulating Mo1 on days 8, 15, and 90 post-treatment with PTIC or placebo were determined (P=0.0036; P<0.001; and P=0.001, respectively Figure 4H). Activation of LAIR-1 seems to inhibit proinflammatory Mo1 and, in contrast, promotes the percentage of LAIR-1-expressing Mo2 to statistically significant levels from day 8 to 15 post-treatment with PTIC vs. placebo (Figure 5H). Differences were found between the treatments in the number of circulating Mo2 at day 8 and 15 post-treatment (P=0.016 and P=0.048, respectively, Figure 5H).
2.7.5. COVID-19 patients under treatment with polymerized type I collagen have lower proinflammatory cytokines and chemokines serum levels
A significant decrease of pathogen-induced cytokine hyperinflammation, including IP-10 (P<0.001; Figure 6A), IL-8 (P<0.001; Figure 6D), Hu M-CSF (P=0.021; Figure 6F), Hu HGF (P=0.030; Figure 6G) and IL-1RA (P=0.003; Figure 6H) was determined while there was an increase in stem cell factor (Hu SCF, P=0.005; Figure 6E) and tumor necrosis factor (TNF)-related apoptosis-inducing ligand (TRAIL, P=0.003; Figure 6I) on day 8 of PTIC post-treatment. The migration inhibitory factor (MIF, P=0.049; Figure 6B) decreased on day 8 and eotaxin on day 90 (P=0.015; Figure 6C). The results suggest that PTIC downregulates the production of the key cytokines and chemokines, considered biomarkers of disease severity.
2.7.6. COVID-19 patients under treatment with polymerized type I collagen have better oxygen saturation than those treated with placebo
On days 8, 15, and 90 post-treatment, the percentage reported by the subjects with oxygen saturation readings ≥92% in the PTIC and placebo groups were 90 vs. 70%, 100 vs. 75% (P=0.047), and 100 vs. 95%, respectively (Table 1). The mean oxygen saturation in the PTIC and placebo groups in the time above points were 93.7±1.8 vs. 91.9±3.6 (P=0.048), 94.4±1.7 vs. 91.9±2.9 (P=0.003), and 95.2±2.5 vs. 94.5±2.2 (P=0.382), respectively (Figure 7A, Table 1), which could be based on the downregulation of systemic hyperinflammation and the reduction of cough and dyspnea.
2.7.7. Treatment with polymerized type I collagen was associated with normal spirometries in post-COVID patients
Imaging of subjects initially revealed characteristic patchy infiltration, progressing to extensive ground-glass opacities that often presented bilaterally. Abnormalities on chest CT scans were detected among 82% of the patients in the study, and no differences between groups were detected (Table 1). At 90-day post-treatment, 2 (10%) patients in the PTIC group and 3 (15%) patients in the placebo group had cicatricial changes. Furthermore, 8 (40%) patients in the PTIC group and 10 (50%) patients in the placebo group had pneumonitis. No patient had pneumonia.
At 90 days post-treatment, all patients treated with PTIC (11) had normal spirometry, while 3 of 13 (23%) patients in the placebo group had a mild restrictive pattern.
2.7.8. Polymerized type I collagen treatment was associated with a reduction in symptom duration
The patient's symptom improvement was registered daily and compared with the baseline. Significant improvements in the intensity of dyspnea (Figure 7B), cough (Figure 7C), headache (Figure 7D), and chronic fatigue syndrome (Figure 7E) were noticed during treatment and follow-up in PTIC subjects. Symptom duration in the PTIC group was reduced by 6.1±3.2 days vs placebo.
2.7.9. Polymerized type I collagen is safe and well-tolerated
No serious adverse events were detected. PTIC was safe and well-tolerated. In the PTIC group, the following were observed on day one after treatment: 13 patients had pain in the injection site lasting 15-20 minutes, and one patient had an urticarial rash at the injection site on day 6. On days 8 and 90 after treatment, no adverse events were reported.
In the placebo group, the following were observed on day one after treatment: 15 patients had pain in the injection site lasting 15-20 minutes, and one patient had abdominal pain. On days 8 and 90, 1 patient had tachycardia.
2.7.10. Treatment with polymerized type I collagen decreases serum proinflammatory biomarkers and the neutrophil-to-lymphocyte ratio
No differences in laboratory results were found among the PTIC and placebo groups at baseline (Table 1).
On days 8, 15, and 90 post-treatment with PTIC, serum levels of high sensitivity CRP (hs-CRP), which reflects the total systemic burden of inflammation, decreased compared with placebo (P≤0.001, P=0.013 and P=0.025, Table 1).
On day 8 after PTIC treatment, serum levels of lactate dehydrogenase, an enzyme that reflects cell damage and impaired blood flow and oxygen delivery, decreased compared with placebo (P=0.027, Table 1).
On days 15 and 90 post-treatment with PTIC, serum levels of albumin increased compared with the placebo (P=0.023, and P≤0.001, Table 1), suggesting an improvement in the prognosis of the disease.
On day 8 after PTIC treatment, the neutrophil-to-lymphocyte ratio (NLR) decreased compared with placebo (P=0.040, Table 1). The increase in NLR and hs-CRP are associated with the severity and mortality of COVID-19. Therefore, their decrease in post-treatment with PTIC suggests improving patient recovery prognosis.
3. Discussion
The extracellular matrix is a complex and dynamic structure that in mammals is composed of at least 1100 different proteins, recognized as the matrisome. It is classified into collagens, glycosaminoglycans, proteoglycans, and glycoproteins. The collagen family represents 25 to 30% of all body proteins. In vertebrates, more than 40 genes synthesize α chains, which associate in threes to form up to 29 different types of collagen molecules. Its primary function is to create a support structure resistant to the force of mechanical tension for the tissues. Cells adhere to collagen through adhesion molecules such as integrins, selectins, receptor tyrosine kinases, and molecules from the immunoglobulin family. Collagen is characterized by having a composition rich in glycine (−Gli−X−Y−Gli−X−Y), where "X" and "Y" are usually proline and hydroxyproline, respectively. The most frequent is type I, which represents 90% of the total collagen in the organism [32].
It has been previously reported that type I collagen is a functional ligand for LAIR-1. We determined that the collagen of PTIC also binds strongly to LAIR-1, and its modification does not alter its binding (Figure 2 A,B). The interaction depends on the conserved glycine-proline-hydroxyproline (GPO) repeat region of collagen and a conserved arginine residue on LAIR-1 (R59). Thus, the engagement of collagen and LAIR-1 directly inhibits immune cell function [33]. LAIR-1 is expressed in most hematopoietic cells, and its role has been studied on multiple immune cells, mainly lymphocytes and neutrophils. Nonetheless, several functions of LAIR-1 associated with Mos/macrophages have been reported. LAIR-1 ligands may inhibit the levels of M1 inflammatory mediators, including CXCL1 (GRO1), CXCL10 (IP-10), CCL2 (MCP-1), TNF-α, macrophage inflammatory protein (MIP)-1, MIP-2a (CXCL2 o GRO2), RANTES, and macrophage-induced gene (MIG), and may modulate apoptosis.34]. LAIR-1 is highly expressed by nonclassical Mos2, followed by classical Mos1, and tissue-resident macrophages [35].
To analyze the mechanism of PTIC on macrophages, THP-1 cells were differentiated to M1 and treated with different concentrations of PTIC. We assessed the activation of the main signaling pathways NF-kB, p38 (data not shown), and STAT-1, and we only observed a significant decrease in STAT-1 phosphorylation (tyrosine701). This downregulation seems to favor the polarization towards M2 (increased IL-10 and CD163), which could contribute to the repair of damaged tissue and decrease inflammation. It has been reported that macrophages can reverse their polarized phenotypes depending on STAT-1 phosphorylation. The intracytoplasmic domain of LAIR-1 is intimately tied to immunoreceptor tyrosine-based inhibitory motifs (ITIM) downstream signaling and the recruitment of SHIP1,2, and Src2 domain-containing phosphatase-1, leading to dephosphorylation of JAKs and/or STAT-1 protein, suppressing the M1 polarization and thus promoting the phosphorylation of STAT-6 and the M2 phenotype [36-38]. This would contribute to a less inflammatory microenvironment because the binding of LAIR-1 with its ligand, the PTIC, downregulates the chemokine production.
In this vein, during the acute respiratory distress syndrome (ARDS), recruited alveolar neutrophils and Mos/macrophages acquire a classically activated phenotype (Mo1/M1) responsible for the release of several growth factors and proinflammatory cytokines, including CXCL1, CXCL2, CXCL10, CCL2, and TNF-α. Nonetheless, the expression of inhibitory immune checkpoints, such as LAIR-1, and its engagement with CI activate the receptor that is intimately tied to immunoreceptor tyrosine-based inhibitory motifs downstream signaling and the recruitment of SHIP1,2, and Src2 domain-containing phosphatase-1, therefore leading to negative regulatory effects on immune cells, as demonstrated in many inflammatory contexts, including rheumatoid arthritis, systemic lupus erythematosus, and recently in allergic asthma [38].
LAIR-1 downregulates the production of crucial chemokines in the lungs and reduces lung permeability in the ARDS model. Thus, LAIR-1 knockout (KO) mouse macrophages on the C57BL/6J background upregulated PI3K/AKT pathway, p38, STAT-3, iNOS, and TLR signaling pathways. The essential genes belonging to the NF-kB pathway, such as Myd88, Cd40, and Rel, showed differential upregulation in the model. Most genes from pathogen-induced cytokine storm pathways, including Il1b, Ccl2, Cxcl1, Cxcl10, and Il12b, are significantly upregulated without LAIR-1 [38]. Moreover, it has been demonstrated that in purified Mos, LAIR-1 ligation inhibited LPS-induced il-6, tnf, il8, ccl2, cxcl10, tlr7, il10, and stat1 mRNA expression, and IL-8, TNF-α, IL-6, and IP-10 protein expression [24]. The findings are consistent with those observed in our nested cohort of outpatients with COVID-19 treated with PTIC, where there was a decreased serum IP-10, IL-8, eotaxin, and M-CSF, all early markers of Mo1 associated with severe disease [39-44]. PTIC downregulates STAT-1 signaling IFN-γ induced in Mo1/M1 and, consequently, the inflammatory microenvironment. Moreover, Carvalheiro T, and cols [24]. determined that in Mos of PBMCs, LAIR-1 expression is downregulated upon LAIR-1 engagement with anti-LAIR-1 agonistic antibody before LPS or IFN-α stimulation, most likely due to receptor internalization, as we observed in COVID-1 Mo1 patients under treatment with PTIC. These data indicate that the expression of LAIR-1 is dynamic and varies during the different phases of inflammation and resolution of the immune response.
The macrophages are significant players in the so-called cytokine storm and produce damage to the tissues. Thus, SARS-CoV-2 induces lethal macrophage-activation syndrome [45], which could be contained through the PTIC effect on the M1 macrophages.
This study demonstrated that PTIC treatment helped decrease the levels of IP-10 by 70% at week 1 in patients with moderate disease, suggesting its regulatory role in cytokine release syndrome and improving disease progression.
Intramuscular PTIC was associated with better oxygen saturation values when compared to placebo. Also, PTIC shortened symptom duration. At days 8, 15, and 90 post-treatment with PTIC, a higher mean oxygen saturation value and a higher proportion of patients retaining oxygen saturation values ≥92% were observed. This could be related to decreased dyspnea and cough [16-19,47]. It should be noted that patients treated with PTIC did not present chronic fatigue syndrome compared to patients treated with the placebo.
Regarding systemic inflammation, at days 8, 15, and 90 post-treatment with PTIC, statistically significant lower levels of hs-CRP, NLR, and lactate dehydrogenase were observed. The benefit was evident in the early stage of the infection (7 days after symptom onset). NLR and CRP reflect the total systemic burden of inflammation in several disorders. CRP has been shown to upregulate the production of proinflammatory cytokines and adhesion molecules (ICAM-1, VCAM-1 end ELAM-1), and its expression is regulated by a proinflammatory milieu enriched with IL-6 [16-19,47]. High levels of CRP and NLR are closely correlated with disease severity [47]. The decrease of lactate dehydrogenase has been associated with cellular preservation and improved oxygenation, while the increase of albumin down-regulates the expression of ACE2 and is inversely associated with COVID-19 severity.
The PTIC was safe, well-tolerated, and effective for improving symptoms in outpatients with mild to moderate COVID-19. It did not induce liver damage, hematopoiesis impairment, or blood count alterations.
The study's strengths are highlighted by the potential role of LAIR-1 engagement by PTIC in leading in vitro M1 to M2 polarization through downregulation of STAT-1 phosphorylation and the replication of the effect in mild to moderate COVID-19 patients under treatment with PTIC.
However, we acknowledge several limitations. We showed evidence that LAIR-1 engagement by PTIC results in the downregulation of inflammation through the STAT signaling pathway. Nonetheless, further mechanistic studies are required to establish details of the direct or indirect signaling pathway. Moreover, this is a small study conducted within a single center, so findings should be replicated in more extensive clinical trials with a more heterogeneous study population.
4. Materials and Methods
4.1. Cell Culture
Human monocytic leukemia THP-1 cell line was maintained in culture with GIBCO RPMI 1640 (ThermoFisher Sci. USA) and 10% heat-inactivated fetal bovine serum (PAN-Biotech, De) at 37 ºC, with 5% CO2 and 95% relative humidity.
4.2. Cell differentiation and treatments
The THP-1 cells were obtained from a repository (Biobank from Department of Pathology, INCMNSZ) and differentiated into macrophage-like cells (MLCs) by 72 h incubation with 100 nM phorbol-12-myristate13-acetate (PMA, Sigma P8139). MLCs were polarized to M1 by stimulation with 20 ng/mL of IFN-γ and 1μg/mL of LPS for 24 h [28]. M1 were treated with different concentrations PTIC (2, 5, and 10 %, as previously reported), anti-LAIR-1 (1:100 dilution), (HycultBiotech # HM2364-100UG), or anti-LAIR-1 (1:100) + PTIC (10%) for 24 h at 37°C, with 5% CO2 and 95% relative humidity. Polarized M1 were also cultured for 6, 24, and 48 h with or without constant stimulus (20 ng/mL of IFN-γ and 1μg/mL of LPS) and PTIC (10%).
4.3. Flow cytometry
The treated or untreated MLCs and M1 were incubated with 5 μL Human TruStain FcXTM (BioLegend Inc.) per million cells in 100 μl PBS for 10 minutes. Then they were labeled with 3 µL of anti-human: (a) M1: CD36 FITC, CD16 PeCy, and CD86 APC or (b) M2: CD14 FITC, CD16 PeCy, and CD163 APC antibodies in separated tubes for 20 min at room temperature in the dark. Cells were permeabilized with 200 µL of cytofix/cytoperm solution (BD Biosciences) at 4°C for 30 min. Intracellular staining was performed with an anti-human (a) IL-1β PE or (b) IL-10 PE-labeled mouse monoclonal antibodies for 30 min at 4°C in the dark. 50,000-100,000 events of each sample were acquired on an Accuri C6 flow cytometer (BD Biosciences). The FlowJo X program (Tree Star, Inc.) was used for the analysis. An electronic gate was made for live cells (FCSA vs. FCSH), then for (a) CD16+/CD36+/CD86+ and (b) CD14+/CD16hi/CD163+ cells. Results are expressed as the relative percentage of (a) M1: IL-1β+ and (b) M2: IL-10+-expressing cells in each gate. Cell subsets were analyzed blindly regarding the clinical classification of the sample. As isotype control, IgG1 FITC/IgG1 PE/CD45 PeCy5 mouse IgG1 kappa (BD Tritest, BD Biosciences) was employed to set the threshold and gates in the cytometer. We ran an unstained (autofluorescence control) and permeabilized cell sample. Autofluorescence control was compared to single-stained cell positive controls to confirm that the stained cells were on the scale for each parameter. Besides, BD Calibrate 3 beads were used to adjust instrument settings, set fluorescence compensation, and check instrument sensitivity (BD calibrates, BD Biosciences). Fluorescence minus one (FMO) control was stained in parallel using the panel of antibodies with the sequential omission of intracellular antibodies.
4.4. Western blotting
Whole-cell lysates were generated in RIPA lysis buffer with 1 mM phenylmethylsulfonyl fluoride (PMSF) and incubated for 15 min, 4ºC. The supernatant was collected after centrifugation (13000 rpm, 15 min, 4°C). Protein concentration was determined by a bicinchoninic acid assay. The protein solutions were loaded onto SDS-polyacrylamide gel and transferred to PVDF membranes (Bio-Rad, Lab Inc. USA). The membranes were blocked and then incubated with primary antibodies (1:100): anti-phospho-STAT-1 (p-STAT-1; SC-136229), anti-STAT (SC-464), anti-p65 (SC-136548), anti-p38 (SC-7973), and anti-β actin (SC-47778; Santa Cruz Biotechnology) at 4°C overnight and then with secondary antibodies labeled with horseradish peroxidase (HP)-conjugated mouse anti-human IgG (Sigma) at room temperature 2 h. The signals were detected using enhanced chemiluminescence reagents (Thermo Scientific, USA). The relative expression was performed by normalizing the intensity of the actin band and adjusting the intensity of the expression in M1 (control) to 1 unit; subsequently, the intensities of the bands of the treated samples were obtained and compared based on M1 and analyzed with the ImageJ 1.53e software (NIH, USA)
4.5. LAIR-1 Binding Assays
Binding assays were performed by incubating various concentrations of recombinant human LAIR-1 (R&D #2664-LR-050) overnight at 4ºC in 96 micro-wells plates coated with 5 μg/mL native porcine type I collagen (CI) or PTIC and blocked with 5% fat-free milk-PBS. Excess protein was removed by washing PBS containing 0.05% Tween 20. Subsequently, a 1:500 dilution mouse anti-human LAIR-1 (HycultBiotech # HM2364-100UG) was added overnight at 4ºC. Then, it was incubated with anti-IgG mouse labeling HP. The plates were developed with para-nitrophenyl-β-d-fucopyranoside (P-NPF). Optical density (OD) was quantified with a microplate reader at 450 nm. Ovalbumin was used as a non-binder control [29].
4.6. RT-qPCR
The cytokine mRNA detection was carried out in triplicate with TaqMan RNA-to Ct 1-step Kit (Applied Biosystems) for cytokines IL-1β (Hs01555410_m1), IL-10 (Hs00961622_m1), IFN-γ (Hs00989291_m1), and GAPDH (Hs02786624) as control, with the following conditions qPCR step 48°C by 15min, enzyme activation 95°C by 10 min, denature 95°C by 15 sec and anneal/extend 60°C by 1 min for 40 cycles, in the thermal cycler Rotogene 6000 with version 1.7 software. Expression values were reported as ΔΔCT.
4.7. Surface Plasmon Resonance Binding Assay
A Biacore T200 Surface Plasmon Resonance instrument (GE Healthcare) was used to estimate the interaction affinity of LAIR-1 with PTIC, CI, and ovalbumin (non-binder control). Amine-coupling chemistry was used to immobilize LAIR-1 on the surface of a CM5 biosensor chip Serie S (Cytiva) in sodium acetate pH 4.5, which was injected at 30 µg/mL, giving a surface density of 473.1 response units (RU). The reference flow cell (lane 1) was left blank. Flow cells were activated with a 1:1 mixture of N-hydroxysuccinimide and 1-ethyl-3-(3-dimethyl aminopropyl) carbodiimide hydrochloride. The excess of active groups on the dextran matrix was blocked using 1M ethanolamine, pH 8.5. CI and PTIC were diluted in HBS-EP+ buffer (0.1M HEPES, 1.5M NaCl; 0.03M EDTA 0.5% v/v surfactant P20, pH 7.4). The concentration ranges were 0.0093 μg/mL – 0.15 μg/mL (0.019nM- 0.0154nM) for CI and PTIC by dilution series, passed over LAIR-1 ligand independently. Conditions of contact time were 120s with a 30 μl/min flow rate and dissociation time 600s. After each binding cycle and before signal detection, a regeneration solution of NaOH 50 mM was injected for the 30s. The Flow rate was 30 μl to remove any noncovalently bound protein. All the sensorgrams were recorded at 25°C. Assay channel data were subtracted from reference flow cell data. Data was assessed using Biacore T200 Evaluation Software version 2.0. The BIA evaluation software provides numerical integration of binding curves and global fitting to different kinetic models, enabling accurate calculation of kinetic interactions from a single data series. The curves were fitted to a 1:1 Langmuir binding model [29].
4.8. Study nested cohort
Forty samples of PBMCs and sera were obtained from a single-center, double-blind, placebo-controlled, randomized clinical trial comparing PTIC with placebo in adult outpatients with confirmed COVID-19 [16]. The institutional review board of the Instituto Nacional de Cencias Médicas y Nutrición Salvador Zubirán (INCMNSZ, reference number IRE 3412-20-21-1) approved the study. It was conducted following the Declaration of Helsinki World [30], the Good Clinical Practice Guidelines, and local regulatory requirements. All participants gave written informed consent before being randomly assigned to PTIC or placebo. This study is registered with the ClinicalTrials.gov identifier NCT04517162. Patients were randomly assigned to receive either 1.5 ml of PTIC intramuscularly every 12h for 3 days and then every 24h for 4 days (n=20), or matching placebo (n=20) (Supplementary Material 1)
4.9. Serum cytokines
Serum samples were collected from patients treated with PTIC or placebo at baseline, 8-, 15-, and 90 days post-treatment, according to our protocol in the previous work [16]. Cytokines were evaluated using the kit Bio-Plex (Bio-Rad, Lab Inc. USA). The samples were processed according to the manufacturer's manual and read using Bio-Plex 200 System with Bio-Plex Manager 6.1 Software (Bio-Rad, Lab Inc. USA).
4.10. Peripheral blood mononuclear cell isolation and flow cytometry
A venous blood sample (10 mL) from each patient and 20 healthy subjects from the blood bank were drawn to perform flow cytometry analysis. Peripheral blood mononuclear cells (PBMCs) were obtained by gradient centrifugation on Lymphoprep (Axis-Shield PoC AS, Oslo, Norway). The cell pellet was resuspended in 1 mL RPMI at 1-2 X 10⁶ cells/mL. PBMCs were incubated with 5 μL of Human TruStain FcXTM (BioLegend Inc.) per million cells in 100 μl PBS for 10 minutes, and then they were labelled with 2 µL of anti-human: (a) CD86 FITC, CD11c PeCy5, CD3 APC, LAIR-1 PE; (b) CD11b FITC, CD16 PeCy5, CD163 APC, LAIR-1 PE; (c) CD86 FITC, CD11c PeCy5, CD3 APC; or (d) CD11b FITC, CD16 PeCy5, CD163 APC; antibodies in separated tubes during 20 min at 37°C in the dark. Cells of (c) and (d) were permeabilized with 200 µL of cytofix/cytoperm solution (BD Biosciences) at 4°C for 30 min. Intracellular staining was performed with an anti-human: (a) IP-10 PE or (b) IDO PE-labeled mouse monoclonal antibodies for 30 min at 4°C in the dark. An electronic gate was made for live cells (FCSA vs. FCSH), then (a) CD86+/CD11c PeCy5+/CD3+/LAIR-1+; (b) CD11b+/CD16+/CD163+/LAIR-1+; (c) CD86+/CD11c+/CD3-or (d) CD11b+/CD16+/CD163+ cells. Results are expressed as the relative percentage of IP-10+ and IDO+-expressing cells in each gate.
4.11. Chest CT
A semiquantitative scoring system was used to estimate pulmonary involvement based on the affected pulmonary area [31].
4.12. Basic spirometry
Before the forced expiration, tidal (normal) breaths were taken first, followed by a deep breath while still using the mouthpiece, followed by a quick, full inspiration. For FVC and FEV1, the patient took a deep breath in as long as possible, blew out as hard and fast as possible, and kept going until no air was left. PEF was obtained from the FEV1 and FVC maneuvers. For VC, the patient takes a deep breath in, as large as possible, and blows steadily for as long as possible until there is no air left. Nose clips were essential for VC as air can leak out due to the low flow. The IVC maneuver was performed at the end of FVC/VC by taking a deep, fast breath after breathing.
4.13. Statistical analysis
A descriptive analysis was done. Continuous variables were expressed by means and standard deviations (normal distribution) or medians, and categorical variables were summarized using proportions. The student's t-test or the Wilcoxon rank sum test was used for the inferential analysis of continuous variables.
5. Conclusions
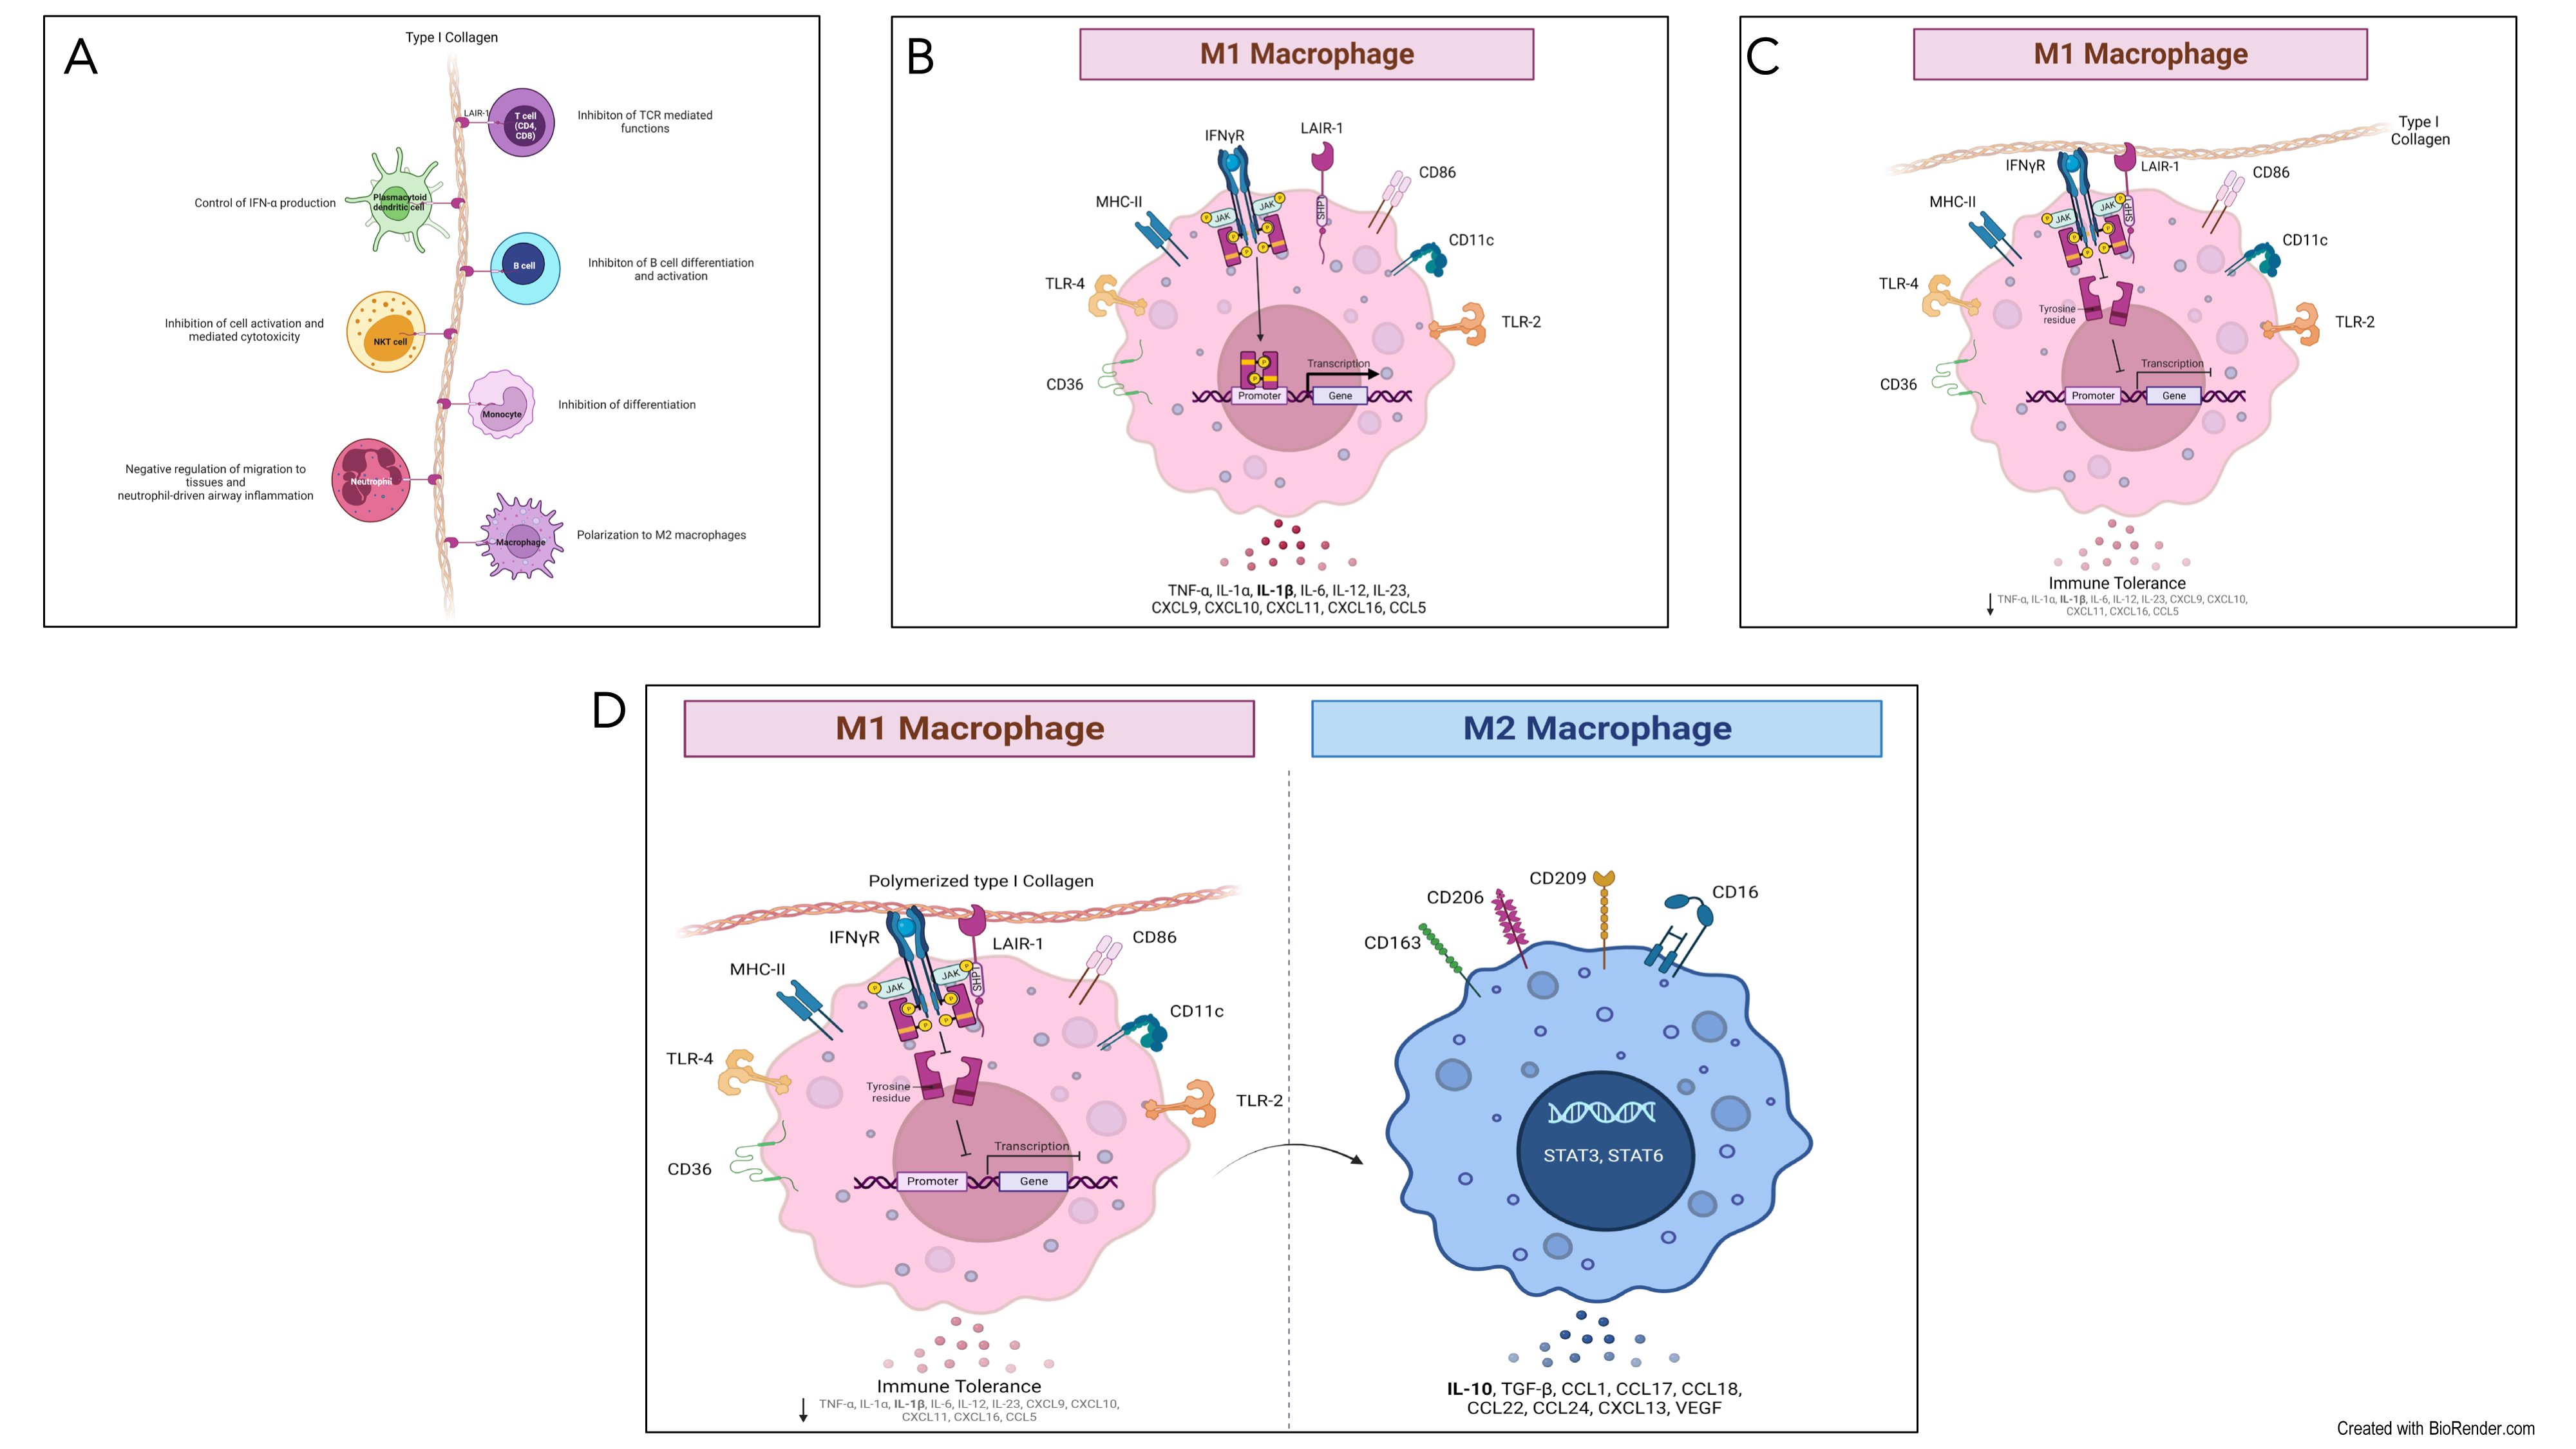
PTIC binds LAIR-1 with a similar affinity to CI. The binding downregulated STAT-1 phosphorylation (Figure 8). In hyperinflammatory syndromes like COVID-19, PTIC administration decreases the M1 subset, chemokines, and growth factors associated with STAT-1, improving the acute phase of the infection and avoiding long COVID-19. PTIC could be relevant for treating STAT-1-mediated inflammatory diseases, including COVID-19 and long COVID-19 (Figure 8). PTIC regulates STAT-1 phosphorylation through LAIR-1 in M1 and favors polarization towards M2. (A) Leukocyte-associated immunoglobulin-like receptor 1 (LAIR1, or CD305) is a type I transmembrane glycoprotein that contains one extracellular Ig-like domain and two immunoreceptor tyrosine-based inhibitory motifs (ITIMs) in its intracellular domain. LAIR1 is expressed in most hematopoietic lineages, including monocytes, macrophages, dendritic cells (DCs), natural killer (NK) cells, and many T and B cell populations. Its extracellular domain binds to glycine-proline-hydroxyproline collagen repeats, and its ITIMs recruit phosphatases SHP-1 and SHP-2. Collagens, C1q, MBL, surface protein-D (SP-D), Rifins, and Colec12 have been reported as ligands for LAIR1. It downregulates T, B, and natural killer (NK) cell functions by recruitment of SHP1 and SHP2 phosphatases. (B) The pre-polarized (M0) macrophage subsets challenge with LPS/IFN-γ induce polarization to M1. The human monocytic cell line THP-1 expresses high levels of LAIR1. (C) LAIR1 binding type I collagen regulates immune system balance and protects against tissue damage against a hyperactive immune response or autoimmune dysfunction through SHP-1, SHP-2, CSK, and pSTAT-1 intracellular signaling. (D) Polymerized type I collagen induces downregulation of phosphorylation of STAT-1 in M1 and promotes polarization to M2.
6. Patents
Patent pending: Request ID: 38909
Author Contributions
J.F-C. and G.T-V. had full access to all of the data in the study. They took responsibility for the data's integrity and the data analysis's accuracy.Concept and design: J.F-C.Acquisition, analysis, or interpretation of data: S.M-F., A.P-R., D.A-L., H.O-P., K.I.R-R., E.O-H., S.U-T, L.S-S., T.H-G, D.A-L, E.O-M., D.F.H-R, and C.A.N-A.Drafting of the manuscript: E.O-M., D.F.H-R, C.A.N-A., J.F-C. and G.T-V.Critical revision of the manuscript for important intellectual content: M.C., S.M-F., A.P-R., D.A-L., H.O-P., K.I.R-R., L.G.L-M., E.R-C., S.U-T, L.S-S., D.A-L, E.O-M., D.F.H-R, C.A.N-A., J.F-C. and G.T-V.Statistical analysis: E.O-M., D.F.H-R, C.A.N-A.Supervision: J.F-C. and G.T-V.
Funding
ASPID SA DE CV donated the PTIC to carry out the study.
Institutional Review Board Statement
The study was approved by the institutional review board at Instituto Nacional de Ciencias Médicas y Nutrición Salvador Zubirán (INCMNSZ, reference no. IRE 3412-20-21-1) and was conducted in compliance with the Declaration of Helsinki (World Medical Association. World Medical Association Declaration of Helsinki. JAMA. 2013;310(20):2191-2194.), the Good Clinical Practice guidelines, and local regulatory requirements. All participants provided written informed consent. TRIAL REGISTRATION ClinicalTrials.gov Identifier: NCT04517162
Informed Consent Statement
Informed consent was obtained from all subjects involved in the study.
Data Availability Statement
Data available on request from the authors
Conflicts of Interest
The authors declare no conflicts of interest, except J.F-C., who receives consulting and lecture fees.
Appendix A
Methodology
The diagnosis was based on suggestive symptoms (fever, headache, cough, or dyspnea, plus at least another symptom such as malaise, myalgias, arthralgias, rhinorrhea, throat pain, conjunctivitis, vomiting, or diarrhea) and a positive real-time reverse-transcription polymerase chain reaction result for SARS-CoV-2. Subjects who fulfilled the above criteria and whose symptoms started within the previous seven days were included. Exclusion criteria were: hypersensitivity to PTIC or any of its excipients; COVID-19 patients that required hospitalization; all pregnant or breast-feeding women; patients with chronic kidney disease (estimated glomerular filtration rate less than 60 for more than three months or need for hemodialysis or hemofiltration); decompensated liver cirrhosis; congestive heart failure (New York Heart Association class III or IV); and patients with cerebrovascular disease, autoimmune disease, cancer, multiorgan failure, or immunocompromise (solid organ transplant recipient or donor, bone marrow transplant recipient, AIDS, or treatment with biologic agents or corticosteroids). Patients were evaluated by staff at the study site (S.M-F, A.P-R, D.A-Ll, H.O-P, E.O-H, E.R-C.) on days 8, 15, and 97 (1, 7, and 90 days after the last dose of PTIC or placebo, respectively), and patients were encouraged to complete questionnaires daily.
Individuals were asked to provide personal information (date of birth, type of job, educational level, previous contact with infected individuals), pre-existing conditions (systemic hypertension, diabetes mellitus, cardiovascular disease, cerebrovascular disease, hypertriglyceridemia, dyslipidemia), and symptoms. Personal data, exposure history, clinical presentation, chest computed (CT) tomography, laboratory tests, previous treatment, and outcome data were collected prospectively and from inpatient medical records. Laboratory data collected from each patient from the study at baseline, 8 (day one post-treatment), 15 (day eight post-treatment), and 97 days (day 90 post-treatment) included complete blood count, coagulation profile, serum biochemical tests (including renal and liver function tests, electrolytes, lactate dehydrogenase, D dimer, and creatine kinase), serum ferritin, C-reactive protein (CRP) and procalcitonin, basic spirometry, and chest CT scans were done in all patients at baseline, post-treatment and 3months follow-up.
Patients were randomized in a 1:1 fashion to PTIC or placebo. All outcome assessors, investigators, and research staff who interacted with participants were blinded to participant treatment assignment.
Participants received an intramuscular dose of either PTIC (1.5 ml, equivalent to 12.5 mg of collagen) every 12 h for three days and then every 24 h for four days or a placebo. Only acetaminophen or acetylsalicylic acid was allowed as concomitant therapy. Compliance monitoring was evaluated by counting empty vials returned on subsequent visits.
References
- Chimal-Monroy, J.; Bravo-Ruíz, T.; Krötzsch-Gómez, F.E.; Díaz de León, L. Implantes de FibroquelMR aceleran la formación de hueso nuevo en defectos óseos inducidos experimentalmente en cráneos de rata: un estudio histológico. Rev. Biomed. 1997, 8, 81–88. [Google Scholar]
- Krötzsch-Gómez, F.E.; Furuzawa-Carballeda, J.; de León, L.D.; Reyes-Márquez, R.; Quiróz-Hernández, E. Cytokine Expression is Downregulated by Collagen-Polyvinylpyrrolidone in Hypertrophic Scars. J. Investig. Dermatol. 1998, 111, 828–834. [Google Scholar] [CrossRef] [PubMed]
- Furuzawa-Carballeda, J.; Rodríguez-Calderón, R.; León, L.D.D.; Alcocer-Varela, J. Mediators of inflammation are down-regulated while apoptosis is up-regulated in rheumatoid arthritis synovial tissue by polymerized collagen. Clin. & Exp. Immunol. 2002, 130, 140–149. [Google Scholar] [CrossRef]
- Furuzawa-Carballeda, J.; Muñoz-Chablé, O.A.; Barrios-Payán, J.; Hernández-Pando, R. Effect of polymerized-type I collagen in knee osteoarthritis. I.In vitrostudy. Eur. J. Clin. Investig. 2009, 39, 591–597. [Google Scholar] [CrossRef]
- Furuzawa-Carballeda, J.; Macip-Rodríguez, P.; Galindo-Feria, A.S.; Cruz-Robles, D.; Soto-Abraham, V.; Escobar-Hernández, S.; Aguilar, D.; Alpizar-Rodríguez, D.; Férez-Blando, K.; Llorente, L. Polymerized-Type I Collagen Induces Upregulation of Foxp3-Expressing CD4 Regulatory T Cells and Downregulation of IL-17-Producing CD4+T Cells (Th17) Cells in Collagen-Induced Arthritis. Clin. Dev. Immunol. 2012, 2012, 1–11. [Google Scholar] [CrossRef]
- Furuzawa-Carballeda, J.; Krotzsch, E.; Barile-Fabris, L.; Alcala, M.; Espinosa-Morales, R. Subcutaneous administration of collagen-polyvinylpyrrolidone down regulates IL-1beta, TNF-alpha, TGF-beta1, ELAM-1 and VCAM-1 expression in scleroderma skin lesions. Clin. Exp. Dermatol. 2005, 30, 83–86. [Google Scholar] [CrossRef]
- Furuzawa-Carballeda, J.; Ortíz-Ávalos, M.; Lima, G.; Jurado-Santa Cruz, F.; Llorente, L. Subcutaneous administration of polymerized type I collagen downregulates interleukin (IL)-17A, IL-22 and transforming growth factor-β1 expression, and increases Foxp3-expressing cells in localized scleroderma. Clin. Exp. Dermatol. 2012, 37, 599–609. [Google Scholar] [CrossRef]
- Almonte-Becerril, M.; Furuzawa-Carballeda, J. Polymerized-Type I Collagen Induces a High Quality Cartilage Repair in a Rat Model of Osteoarthritis. Int. J. Bone Rheumatol. Res. 2017, 68–76. [Google Scholar] [CrossRef]
- Furuzawa-Carballeda, J.; Muñoz-Chablé, O.A.; Macías-Hernández, S.I.; Agualimpia-Janning, A. Effect of polymerized-type I collagen in knee osteoarthritis. II.In vivostudy. Eur. J. Clin. Investig. 2009, 39, 598–606. [Google Scholar] [CrossRef] [PubMed]
- Furuzawa-Carballeda, J.; Lima, G.; Llorente, L.; Nuñez-Álvarez, C.; Ruiz-Ordaz, B.H.; Echevarría-Zuno, S.; Hernández-Cuevas, V. Polymerized-Type I Collagen Downregulates Inflammation and Improves Clinical Outcomes in Patients with Symptomatic Knee Osteoarthritis Following Arthroscopic Lavage: A Randomized, Double-Blind, and Placebo-Controlled Clinical Trial. Sci. World J. 2012, 2012, 1–11. [Google Scholar] [CrossRef]
- Borja-Flores, A.; Macías-Hernández, S.I.; Hernández-Molina, G.; Perez-Ortiz, A.; Reyes-Martínez, E.; Belzazar-Castillo de la Torre, J.; Ávila-Jiménez, L.; Vázquez-Bello, M.C.; León-Mazón, M.A.; Furuzawa-Carballeda, J.; et al. Long-Term Effectiveness of Polymerized-Type I Collagen Intra-Articular Injections in Patients with Symptomatic Knee Osteoarthritis: Clinical and Radiographic Evaluation in a Cohort Study. Adv. Orthop. 2020, 2020, 1–9. [Google Scholar] [CrossRef]
- Furuzawa-Carballeda, J.; Rojas, E.; Valverde, M.; Castillo, I.; de León, L.D.; Krötzsch, E. Cellular and humoral responses to collagenpolyvinylpyrrolidone administered during short and long periods in humans. Can. J. Physiol. Pharmacol. 2003, 81, 1029–1035. [Google Scholar] [CrossRef] [PubMed]
- Furuzawa-Carballeda, J.; Cabral, A.R.; Zapata-Zúñiga, M.; Alcocer-Varela, J. Subcutaneous administration of polymerized-type I collagen for the treatment of patients with rheumatoid arthritis. An open-label pilot trial. J. Rheumatol. 2003, 30, 256–259. [Google Scholar]
- Furuzawa-Carballeda, J.; Fenutria-Ausmequet, R.; Gil-Espinosa, V.; Lozano-Soto, F.; Teliz-Meneses, M.A.; Romero-Trejo, C. , Alcocer-Varela, J. Polymerized-type I collagen for the treatment of patients with rheumatoid arthritis. Effect of intramuscular administration in a double blind placebo-controlled clinical trial. Clin. Exp. Rheumatol. 2006, 24, 514–520. [Google Scholar] [PubMed]
- Méndez-Flores, S.; Priego-Ranero, Á.; Azamar-Llamas, D.; Olvera-Prado, H.; Rivas-Redonda, K.I.; Ochoa-Hein, E.; Perez-Ortiz, A.; Rendón-Macías, M.E.; Rojas-Castañeda, E.; Urbina-Terán, S.; et al. Effect of polymerised type I collagen on hyperinflammation of adult outpatients with symptomatic COVID-19. Clin. Transl. Med. 2022, 12. [Google Scholar] [CrossRef] [PubMed]
- Carpio-Orantes, L.D.; García-Méndez, S.; Sánchez-Díaz, J.S.; Aguilar-Silva, A.; Contreras-Sánchez, E.R.; Hernández, S.N.H. Use of Fibroquel® (Polymerized type I collagen) in patients with hypoxemic inflammatory pneumonia secondary to COVID-19 in Veracruz, Mexico. J. Anesthesia & Crit. Care 2021, 13, 69–73. [Google Scholar] [CrossRef]
- Castro-Rocha MD, H.A. Safety and efficacy of Fibroquel® (polymerized type I collagen) in adult outpatients with moderate COVID-19: an open-label study. J. Anesthesia Crit. Care 2021, 13, 101–108. [Google Scholar] [CrossRef]
- Melchor-Amador, J.R.; Mota-González, E.; M. Amador-Ayestas, S.; Castelán-López, M.; M.Vidal-Mendez, A.; Ojeda Guevara, J.A.; Palma-Vázquez, K.; Ríos-Lina, A.A. Polymerized type I collagen improves the mean oxygen saturation and efficiently shortens symptom duration and hospital stay in adult hospitalized patients with moderate to severe COVID-19: Randomized controlled clinical trial. J. Anesthesia & Crit. Care 2021, 13, 190–196. [Google Scholar] [CrossRef]
- Guo, N.; Zhang, K.; Gao, X.; Lv, M.; Luan, J.; Hu, Z.; Li, A.; Gou, X. Role and mechanism of LAIR-1 in the development of autoimmune diseases, tumors, and malaria: A review. Curr. Res. Transl. Med. 2020, 68, 119–124. [Google Scholar] [CrossRef] [PubMed]
- Wang, H. A Review of the Effects of Collagen Treatment in Clinical Studies. Polymers 2021, 13, 3868. [Google Scholar] [CrossRef]
- Jin, J.; Wang, Y.; Ma, Q.; Wang, N.; Guo, W.; Jin, B.; Fang, L.; Chen, L. LAIR-1 activation inhibits inflammatory macrophage phenotype in vitro. Cell. Immunol. 2018, 331, 78–84. [Google Scholar] [CrossRef]
- Nordkamp, M.J.M.O.; van Roon, J.A.G.; Douwes, M.; de Ruiter, T.; Urbanus, R.T.; Meyaard, L. Enhanced secretion of leukocyte-associated immunoglobulin-like receptor 2 (LAIR-2) and soluble LAIR-1 in rheumatoid arthritis: LAIR-2 is a more efficient antagonist of the LAIR-1-collagen inhibitory interaction than is soluble LAIR-1. Arthritis & Rheum. 2011, 63, 3749–3757. [Google Scholar] [CrossRef]
- Carvalheiro, T.; Garcia, S.; Pascoal Ramos, M.I.; Giovannone, B.; Radstake, T.R.D.J.; Marut, W.; Meyaard, L. Leukocyte Associated Immunoglobulin Like Receptor 1 Regulation and Function on Monocytes and Dendritic Cells During Inflammation. Front. Immunol. 2020, 11. [Google Scholar] [CrossRef]
- Kim, S.; Easterling, E.R.; Price, L.C.; Smith, S.L.; Coligan, J.E.; Park, J.-E.; Brand, D.D.; Rosloniec, E.F.; Stuart, J.M.; Kang, A.H.; et al. The Role of Leukocyte-Associated Ig-like Receptor-1 in Suppressing Collagen-Induced Arthritis. J. Immunol. 2017, 199, 2692–2700. [Google Scholar] [CrossRef]
- Myers, L.K.; Winstead, M.; Kee, J.D.; Park, J.J.; Zhang, S.; Li, W.; Yi, A.-K.; Stuart, J.M.; Rosloniec, E.F.; Brand, D.D.; et al. 1,25-Dihydroxyvitamin D3 and 20-Hydroxyvitamin D3 Upregulate LAIR-1 and Attenuate Collagen Induced Arthritis. Int. J. Mol. Sci. 2021, 22, 13342. [Google Scholar] [CrossRef] [PubMed]
- Zhang, Y.; Lv, K.; Zhang, C.M.; Jin, B.Q.; Zhuang, R.; Ding, Y. The role of LAIR-1 (CD305) in T cells and monocytes/macrophages in patients with rheumatoid arthritis. Cell. Immunol. 2014, 287, 46–52. [Google Scholar] [CrossRef] [PubMed]
- Genin, M.; Clement, F.; Fattaccioli, A.; Raes, M.; Michiels, C. M1 and M2 macrophages derived from THP-1 cells differentially modulate the response of cancer cells to etoposide. BMC Cancer 2015, 15. [Google Scholar] [CrossRef]
- Kenakin, TA. Pharmacology Primer: Theory, Application and Methods, Elsevier Science & Technology Books, 2004.
- World Medical Association Declaration of Helsinki. JAMA 2013, 310, 2191. [CrossRef] [PubMed]
- Inoue, A.; Takahashi, H.; Ibe, T.; Ishii, H.; Kurata, Y.; Ishizuka, Y.; Hamamoto, Y. Comparison of semiquantitative chest CT scoring systems to estimate severity in coronavirus disease 2019 (COVID-19) pneumonia. Eur. Radiol. 2022. [Google Scholar] [CrossRef] [PubMed]
- Boyd, D.F.; Thomas, P.G. Towards integrating extracellular matrix and immunological pathways. Cytokine 2017, 98, 79–86. [Google Scholar] [CrossRef]
- Meyaard, L. The inhibitory collagen receptor LAIR-1 (CD305). J. Leukoc. Biol. 2008, 83, 799–803. [Google Scholar] [CrossRef]
- Keerthivasan, S.; Şenbabaoğlu, Y.; Martinez-Martin, N.; Husain, B.; Verschueren, E.; Wong, A.; Yang, Y.A.; Sun, Y.; Pham, V.; Hinkle, T.; et al. Homeostatic functions of monocytes and interstitial lung macrophages are regulated via collagen domain-binding receptor LAIR1. Immunity 2021, 54, 1511–1526.e8. [Google Scholar] [CrossRef]
- Yi, X.; Zhang, J.; Zhuang, R.; Wang, S.; Cheng, S.; Zhang, D.; Xie, J.; Hu, W.; Liu, X.; Zhang, Y.; et al. Silencing LAIR-1 in human THP-1 macrophage increases foam cell formation by modulating PPARγ and M2 polarization. Cytokine 2018, 111, 194–205. [Google Scholar] [CrossRef] [PubMed]
- Fu, Q.; Sun, Y.; Tao, Y.; Piao, H.; Wang, X.; Luan, X.; Du, M.; Li, D. Involvement of the JAK-STAT pathway in collagen regulation of decidual NK cells. Am. J. Reprod. Immunol. 2017, 78. [Google Scholar] [CrossRef] [PubMed]
- Wang, J.; Gao, H.; Xie, Y.; Wang, P.; Li, Y.; Zhao, J.; Wang, C.; Ma, X.; Wang, Y.; Mao, Q.; et al. Lycium barbarum polysaccharide alleviates dextran sodium sulfate-induced inflammatory bowel disease by regulating M1/M2 macrophage polarization via the STAT1 and STAT6 pathways. Front. Pharmacol. 2023, 14. [Google Scholar] [CrossRef]
- Helou, D.G.; Quach, C.; Hurrell, B.P.; Li, X.; Li, M.; Akbari, A.; Shen, S.; Shafiei-Jahani, P.; Akbari, O. LAIR-1 limits macrophage activation in acute inflammatory lung injury. Mucosal Immunol. 2023. [Google Scholar] [CrossRef] [PubMed]
- Yang, Y.; Shen, C.; Li, J.; Yuan, J.; Wei, J.; Huang, F.; Wang, F.; Li, G.; Li, Y.; Xing, L.; et al. Plasma IP-10 and MCP-3 levels are highly associated with disease severity and predict the progression of COVID-19. J. Allergy Clin. Immunol. 2020, 146, 119–127.e4. [Google Scholar] [CrossRef] [PubMed]
- Chen, Y.; Wang, J.; Liu, C.; Su, L.; Zhang, D.; Fan, J.; Yang, Y.; Xiao, M.; Xie, J.; Xu, Y.; et al. IP-10 and MCP-1 as biomarkers associated with disease severity of COVID-19. Mol. Med. 2020, 26. [Google Scholar] [CrossRef] [PubMed]
- Li, L.; Li, J.; Gao, M.; Fan, H.; Wang, Y.; Xu, X.; Chen, C.; Liu, J.; Kim, J.; Aliyari, R.; et al. Interleukin-8 as a Biomarker for Disease Prognosis of Coronavirus Disease-2019 Patients. Front. Immunol. 2021, 11. [Google Scholar] [CrossRef] [PubMed]
- Qazi, B.S.; Tang, K.; Qazi, A. Recent Advances in Underlying Pathologies Provide Insight into Interleukin-8 Expression-Mediated Inflammation and Angiogenesis. Int. J. Inflamm. 2011, 2011, 1–13. [Google Scholar] [CrossRef]
- Cesta, M.C.; Zippoli, M.; Marsiglia, C.; Gavioli, E.M.; Mantelli, F.; Allegretti, M.; Balk, R.A. The Role of Interleukin-8 in Lung Inflammation and Injury: Implications for the Management of COVID-19 and Hyperinflammatory Acute Respiratory Distress Syndrome. Front. Pharmacol. 2022, 12. [Google Scholar] [CrossRef] [PubMed]
- Melton, D.W.; McManus, L.M.; Gelfond, J.A.L.; Shireman, P.K. Temporal phenotypic features distinguish polarized macrophagesin vitro. Autoimmunity 2015, 48, 161–176. [Google Scholar] [CrossRef]
- Pagliaro, P. Is macrophages heterogeneity important in determining COVID-19 lethality? Med. Hypotheses 2020, 143, 110073. [Google Scholar] [CrossRef] [PubMed]
- Zhao, Y.; Qin, L.; Zhang, P.; Li, K.; Liang, L.; Sun, J.; Xu, B.; Dai, Y.; Li, X.; Zhang, C.; et al. Longitudinal COVID-19 profiling associates IL-1RA and IL-10 with disease severity and RANTES with mild disease. JCI Insight 2020, 5. [Google Scholar] [CrossRef] [PubMed]
- Del Carpio-Orantes, L. New off-label or compassionate drugs and vaccines in the fight against COVID-19. Microbes, Infect. Chemother. 2022, 2, e1430. [Google Scholar] [CrossRef]
- Karadag, F.; Kirdar, S.; Karul, A.B.; Ceylan, E. The value of C-reactive protein as a marker of systemic inflammation in stable chronic obstructive pulmonary disease. Eur. J. Intern. Med. 2008, 19, 104–108. [Google Scholar] [CrossRef]
Figure 1.
Effect of PTIC on M1. (A) THP-1 cells. (B) Monocyte-like cells (MLCs): THP-1 cells stimulated with 100 nM PMA for 72 h. Characterization of M1 (CD16+/CD36+/CD86+/IL-1β+) in (C) MLCs, (E) M1 (MLCs incubated with 20 ng/mL of IFN-γ and 1μg/mL of LPS for 24 h), and (G) M1 treated with 10% PTIC. Characterization of M2 (CD14+/CD16hi/CD163+/IL-10+) in (D) MLCs, (F) M1, and (H) M1 treated with 10% PTIC. (I) Protein expression curves at different concentrations of PTIC (2%, 5%, and 10%). Arrows depict the electrophoretic shifts.
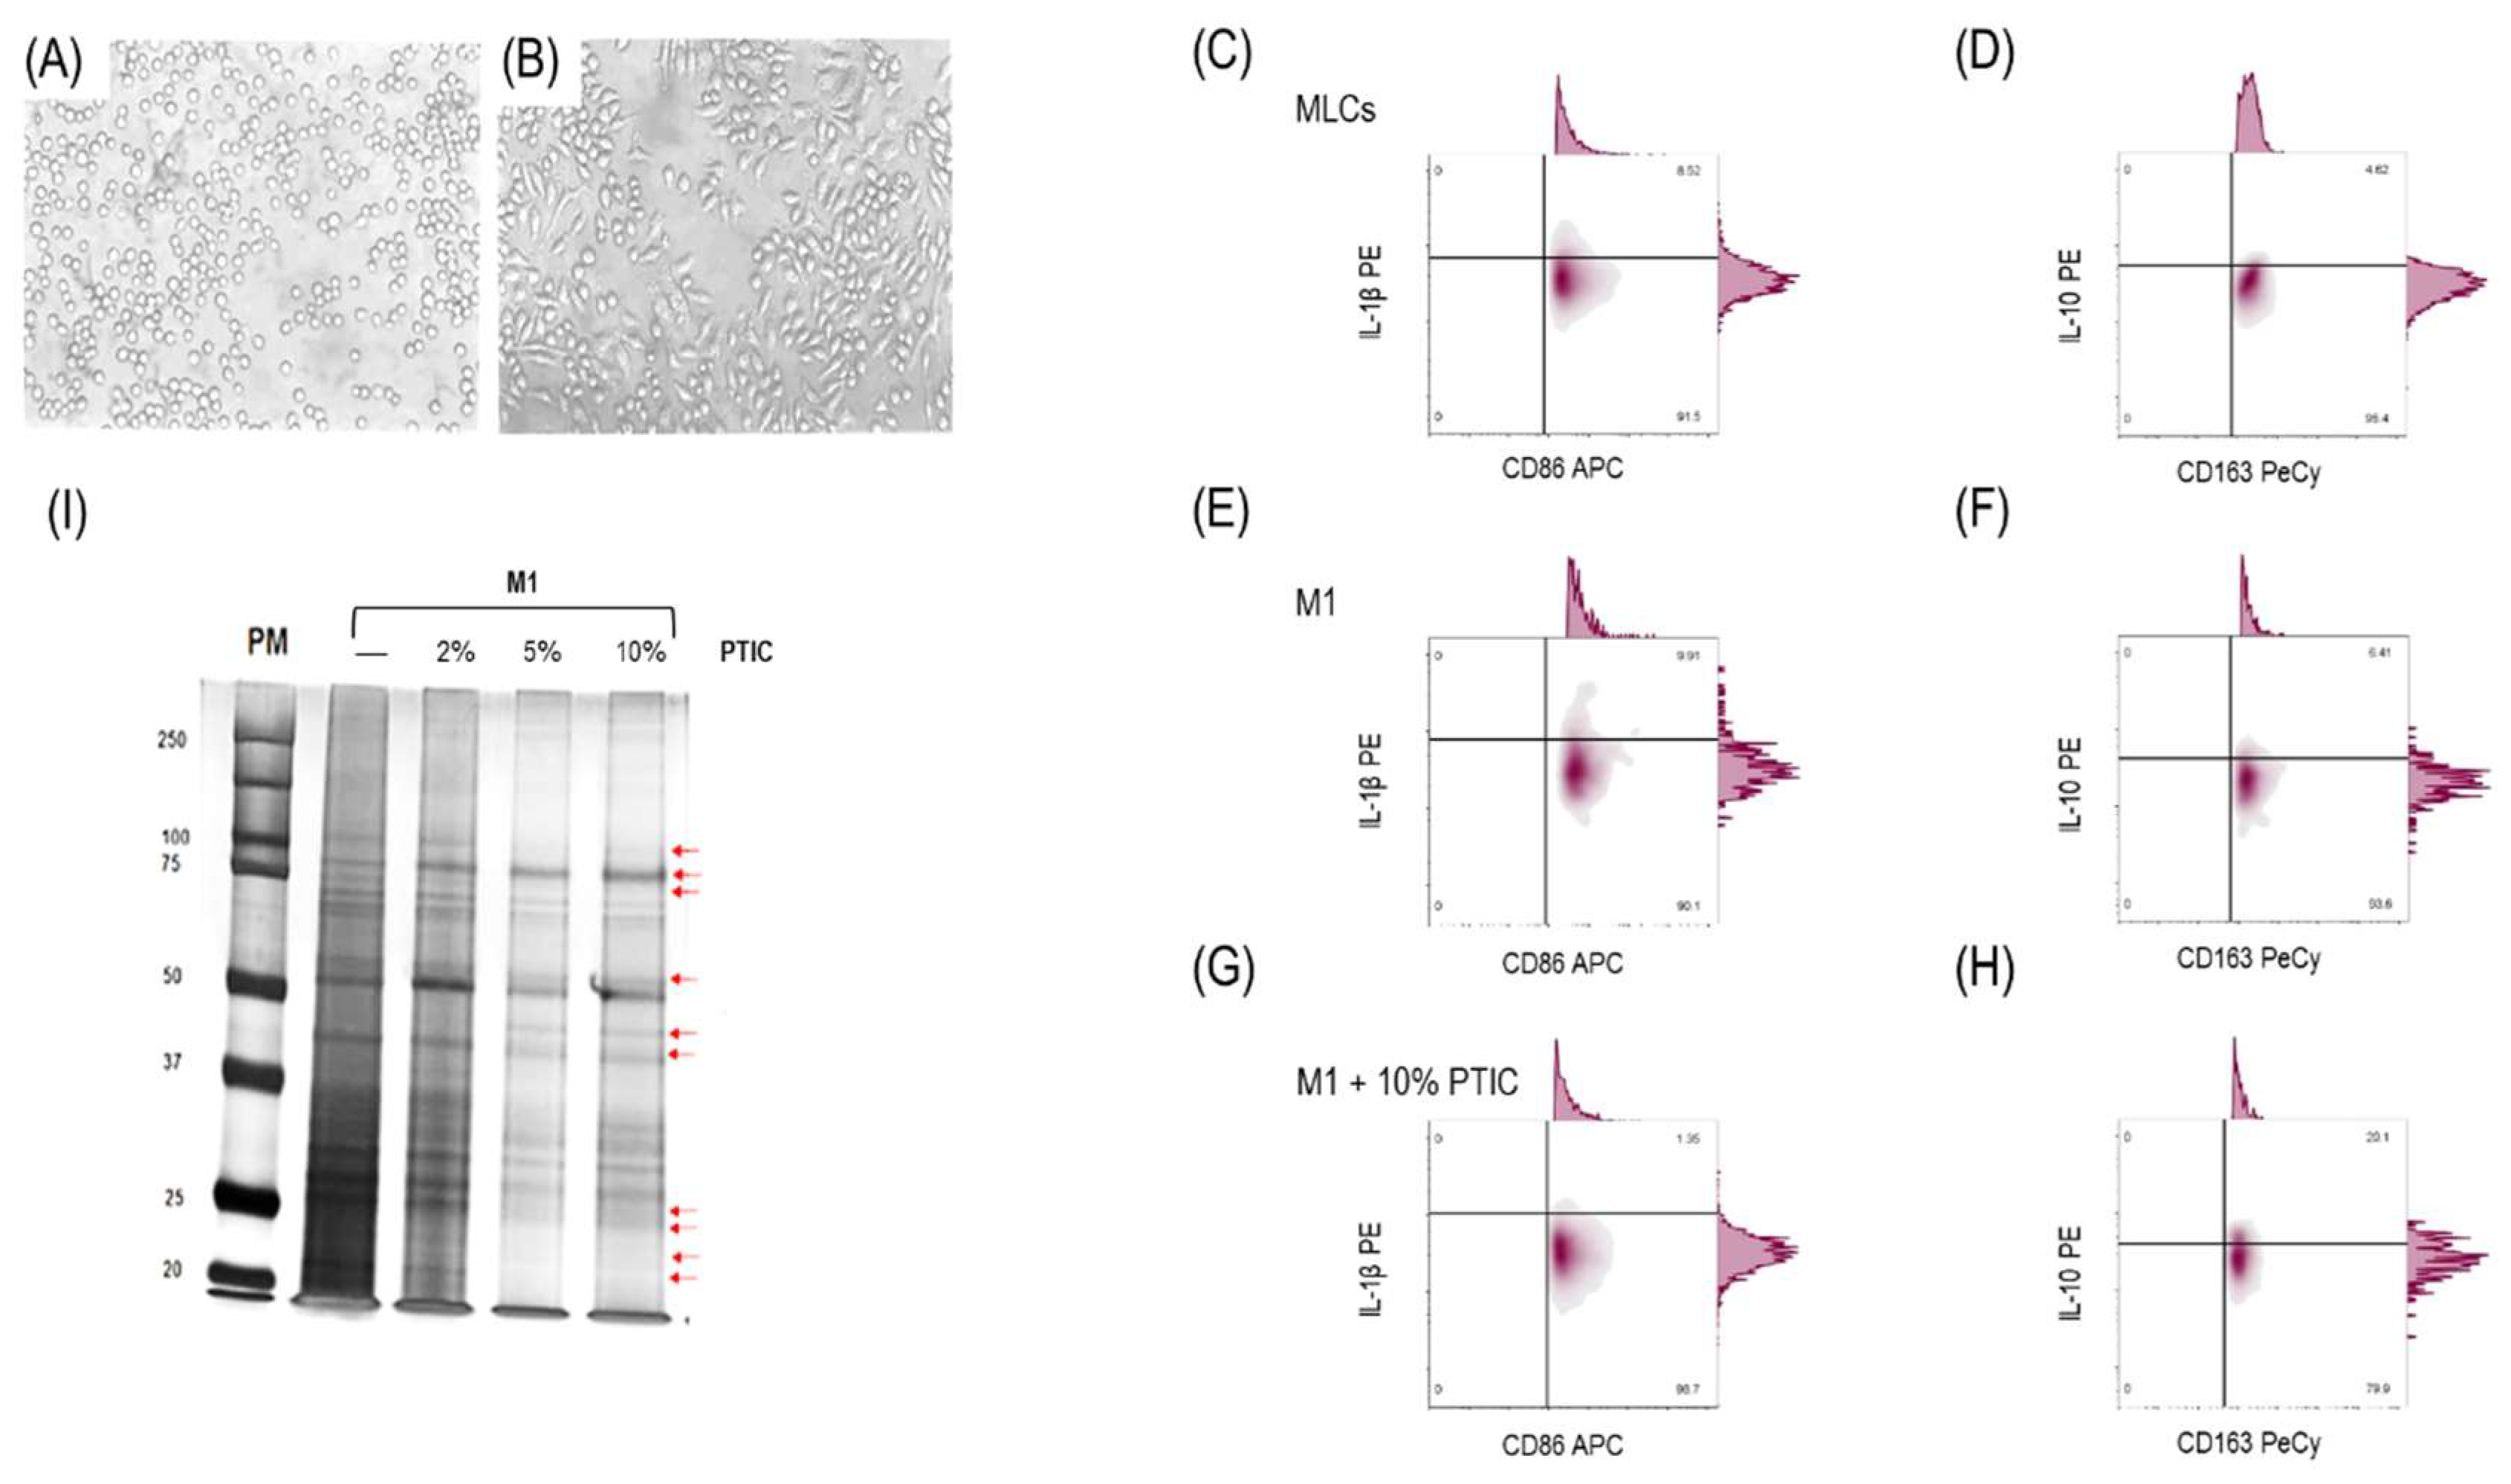
Figure 2.
Binding of PTIC to LAIR-1 and its effect on M1. (A) ELISA binding assay of PTIC or CI to LAIR; (B) SRP binding assay of PTIC or CI to LAIR-1. M1 stimulated with anti-LAIR-1 antibody (1:100) for 24 h to detect (C) M1 (CD16+/CD36+/CD86+/IL-1β+) and (D) M2 (CD14+/CD16hi/CD163+/IL-10+). M1 stimulated with anti-LAIR-1 antibody (1:100) + 10% PTIC for 24 h to detect (E) M1 and F. M2; (G) M1 and M2 cell percentage. (H) Cytokine mRNA expression in M1 treated with PTIC (values were reported as ΔΔCT).
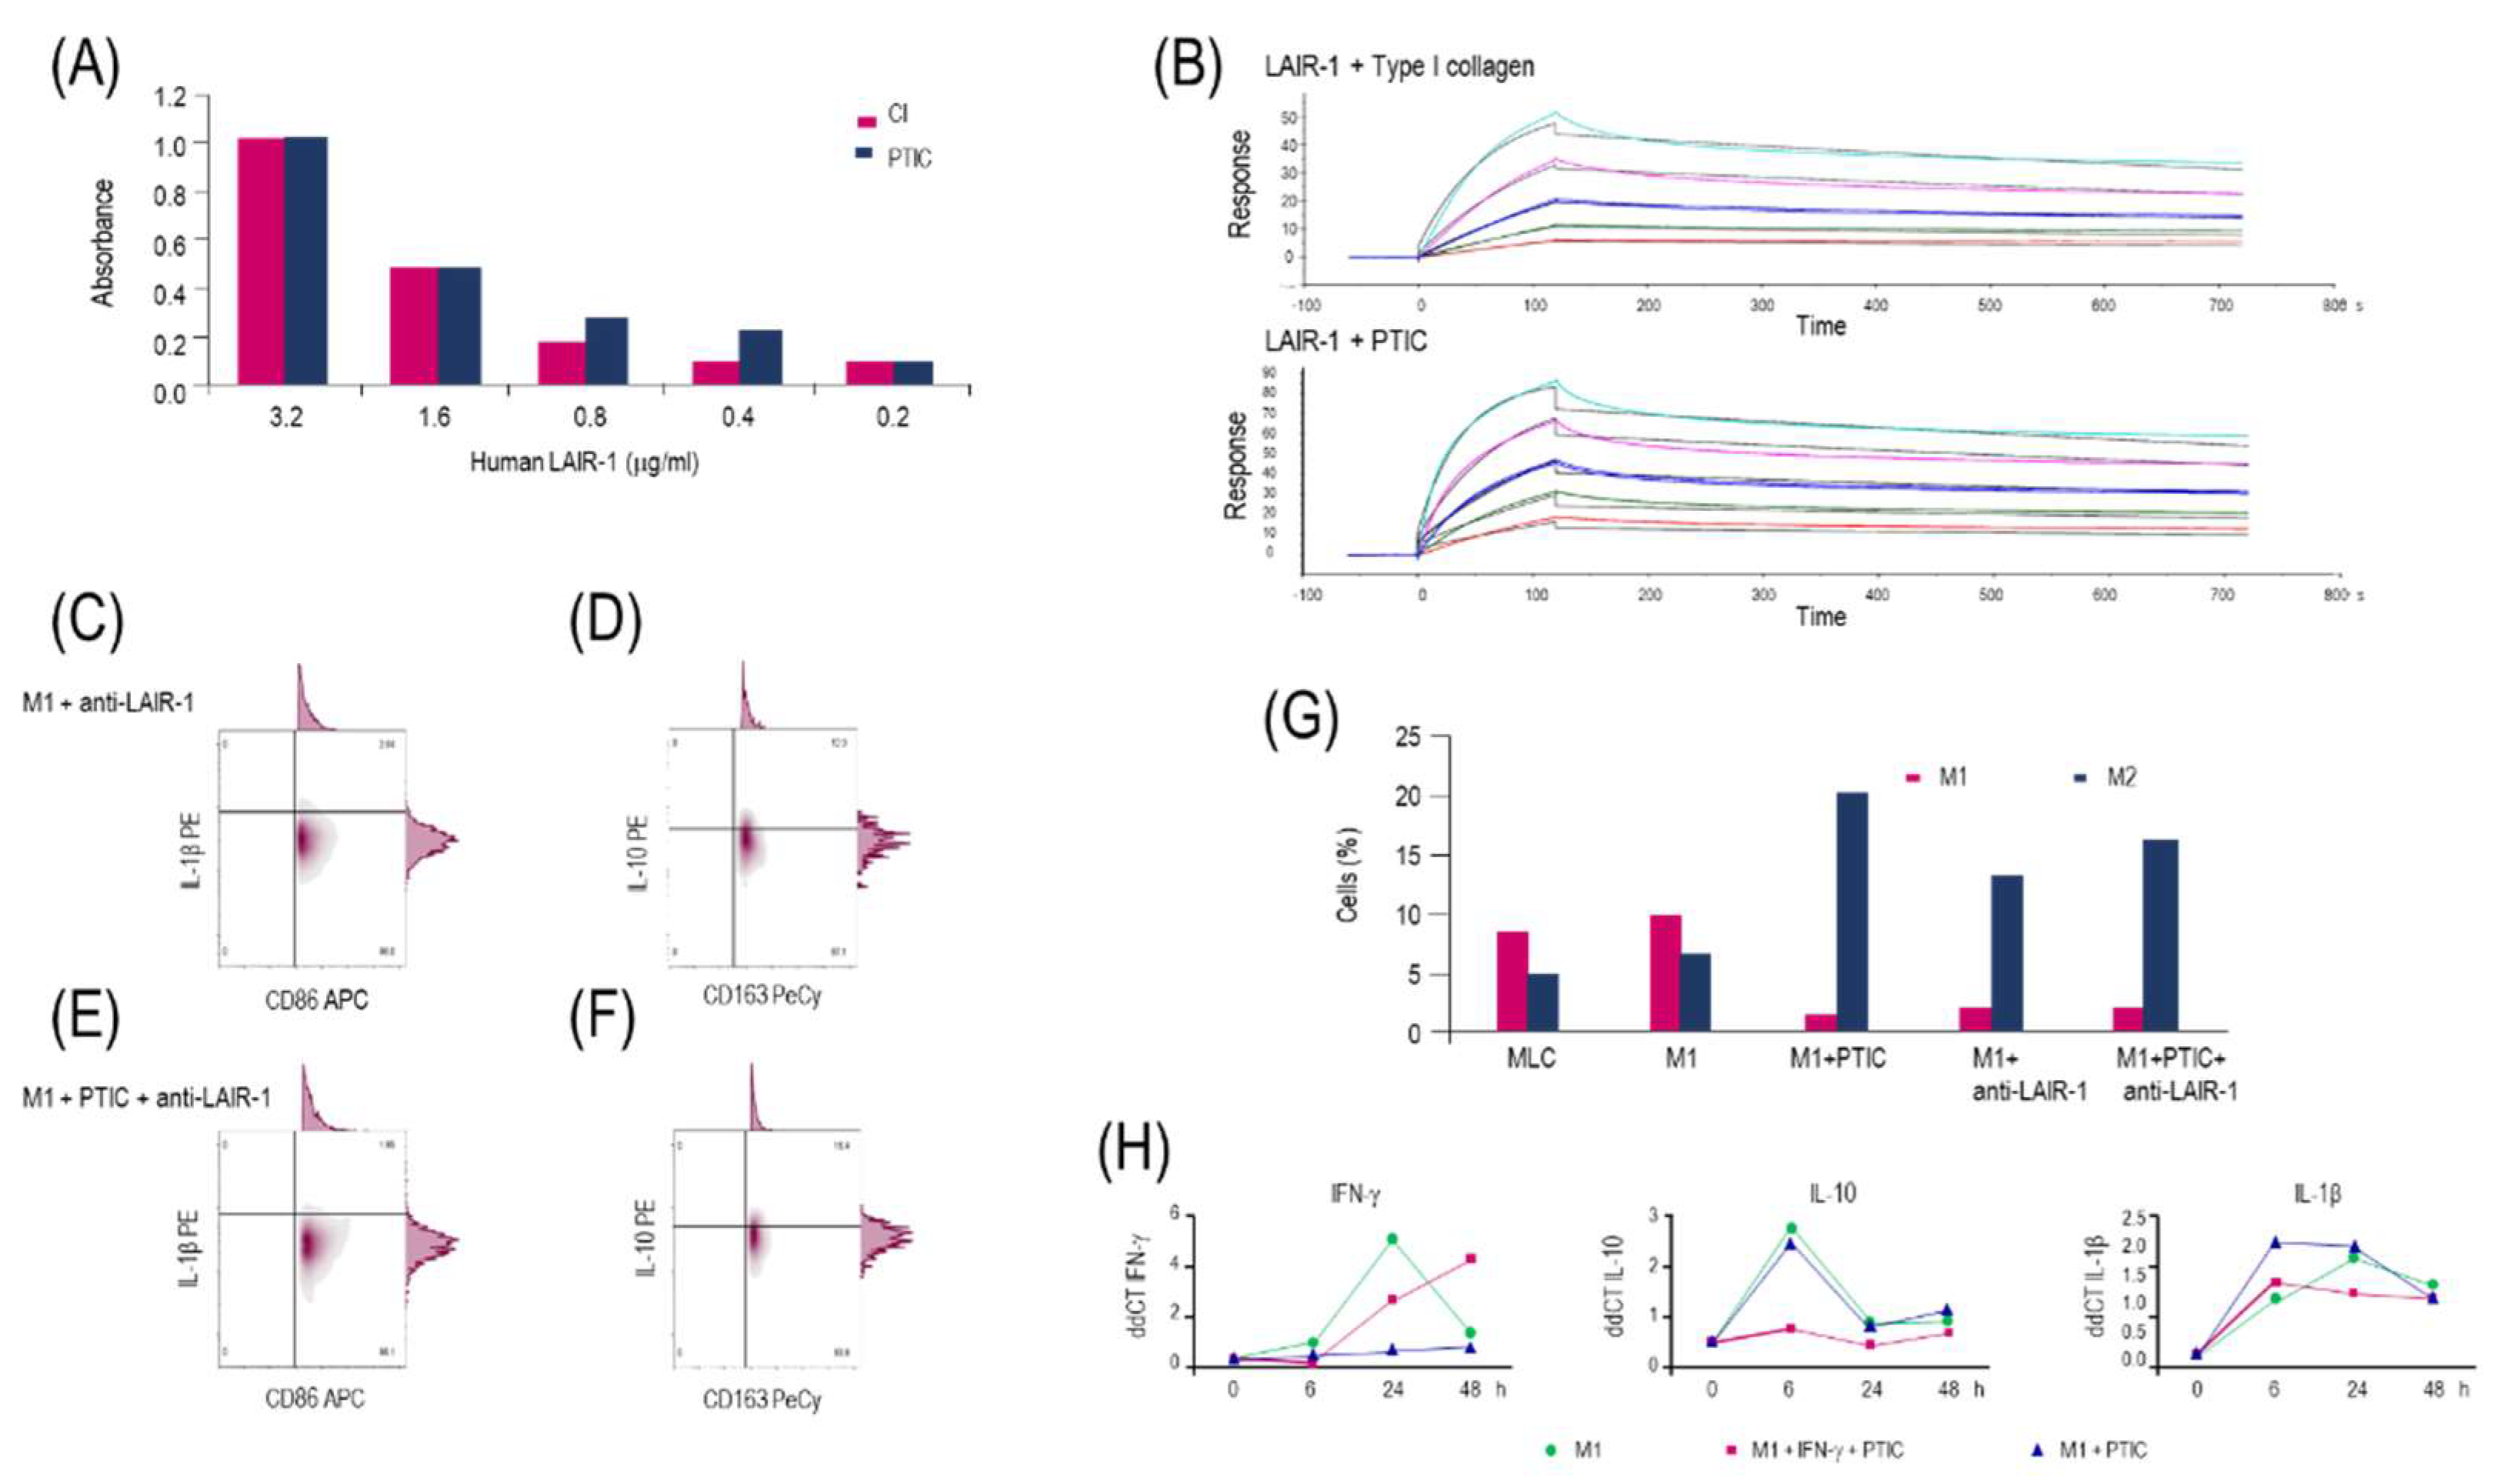
Figure 3.
The binding of PTIC to LAIR-1 induces downregulation of STAT-1 phosphorylation. (A) Western blotting relative expression of STAT-1 and p-STAT1. (B) Relative expression of STAT-1 and pSTAT-1. Both were normalized for actin and were adjusted to 1 unit. (C) Effect of STAT-1 phosphorylation by activating LAIR-1 with anti-LAIR-1 antibody in M1. (D) Relative expression of phosphorylated STAT-1.
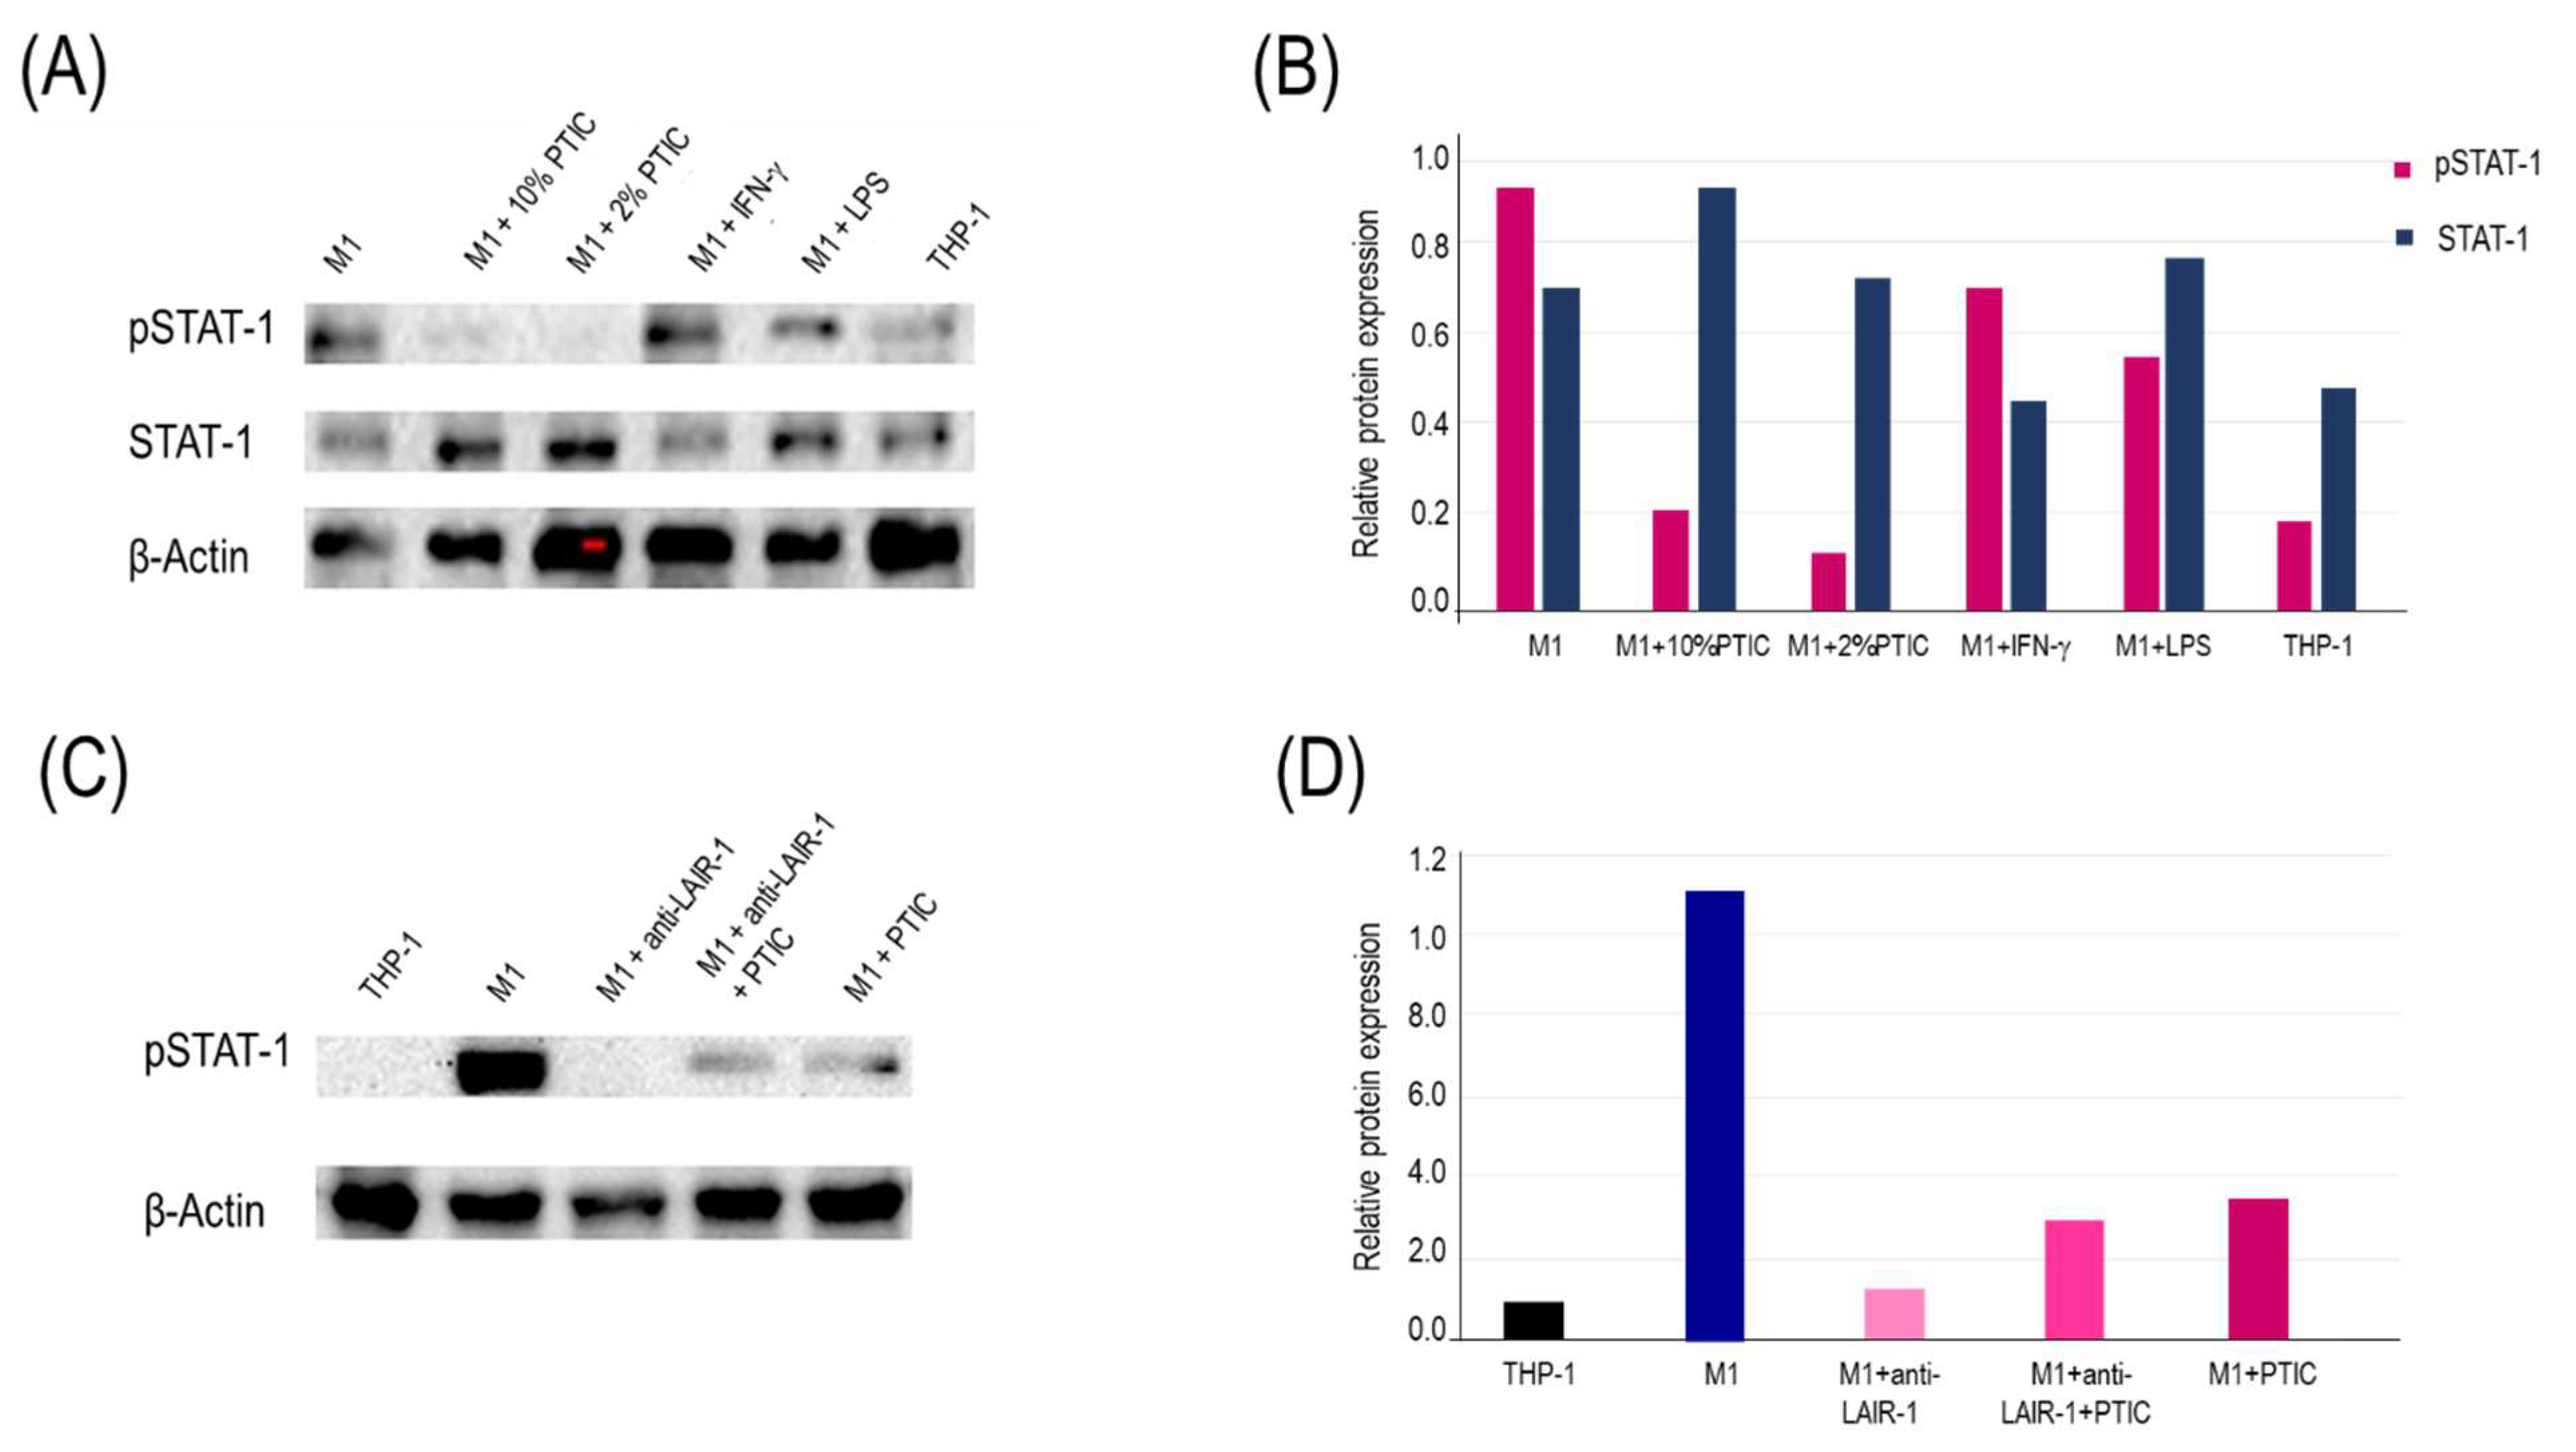
Figure 4.
Representative flow plots of circulating Mo1 subset in SARS-CoV2-infected symptomatic outpatients at baseline 8-, 15-, and 90-days post-treatment with PTIC (n=20) or placebo (n=20). CD86+/CD11c+/CD3-/IP-10+-expressing cells in (A) healthy donors and patients at (B) baseline, (C) 8 days, (D) 15 days, and (E) 90 days post-treatment. (F) Flow plots at baseline (red) and 90 days post-treatment with PTIC (blue). (G) CD86+/CD11c+/CD3-/IP-10+-producing cells are expressed as mean ± SEM. (H) CD14+/CD11c+/CD86+/LAIR-1+-producing cells are expressed as mean ± SEM. Blue stars show the day the treatment reached a P<0.05 compared to the PTIC treatment baseline. Pink stars depict the day the therapy reached a P<0.05 compared to the baseline for the placebo. The numbers on the graph represent the statistical significance between the patients treated with PTIC vs. placebo. *P≤0.05 and **P≤0.001 depict the statistically significant difference from baseline (blue: PTIC, pink: placebo, green: healthy donors).
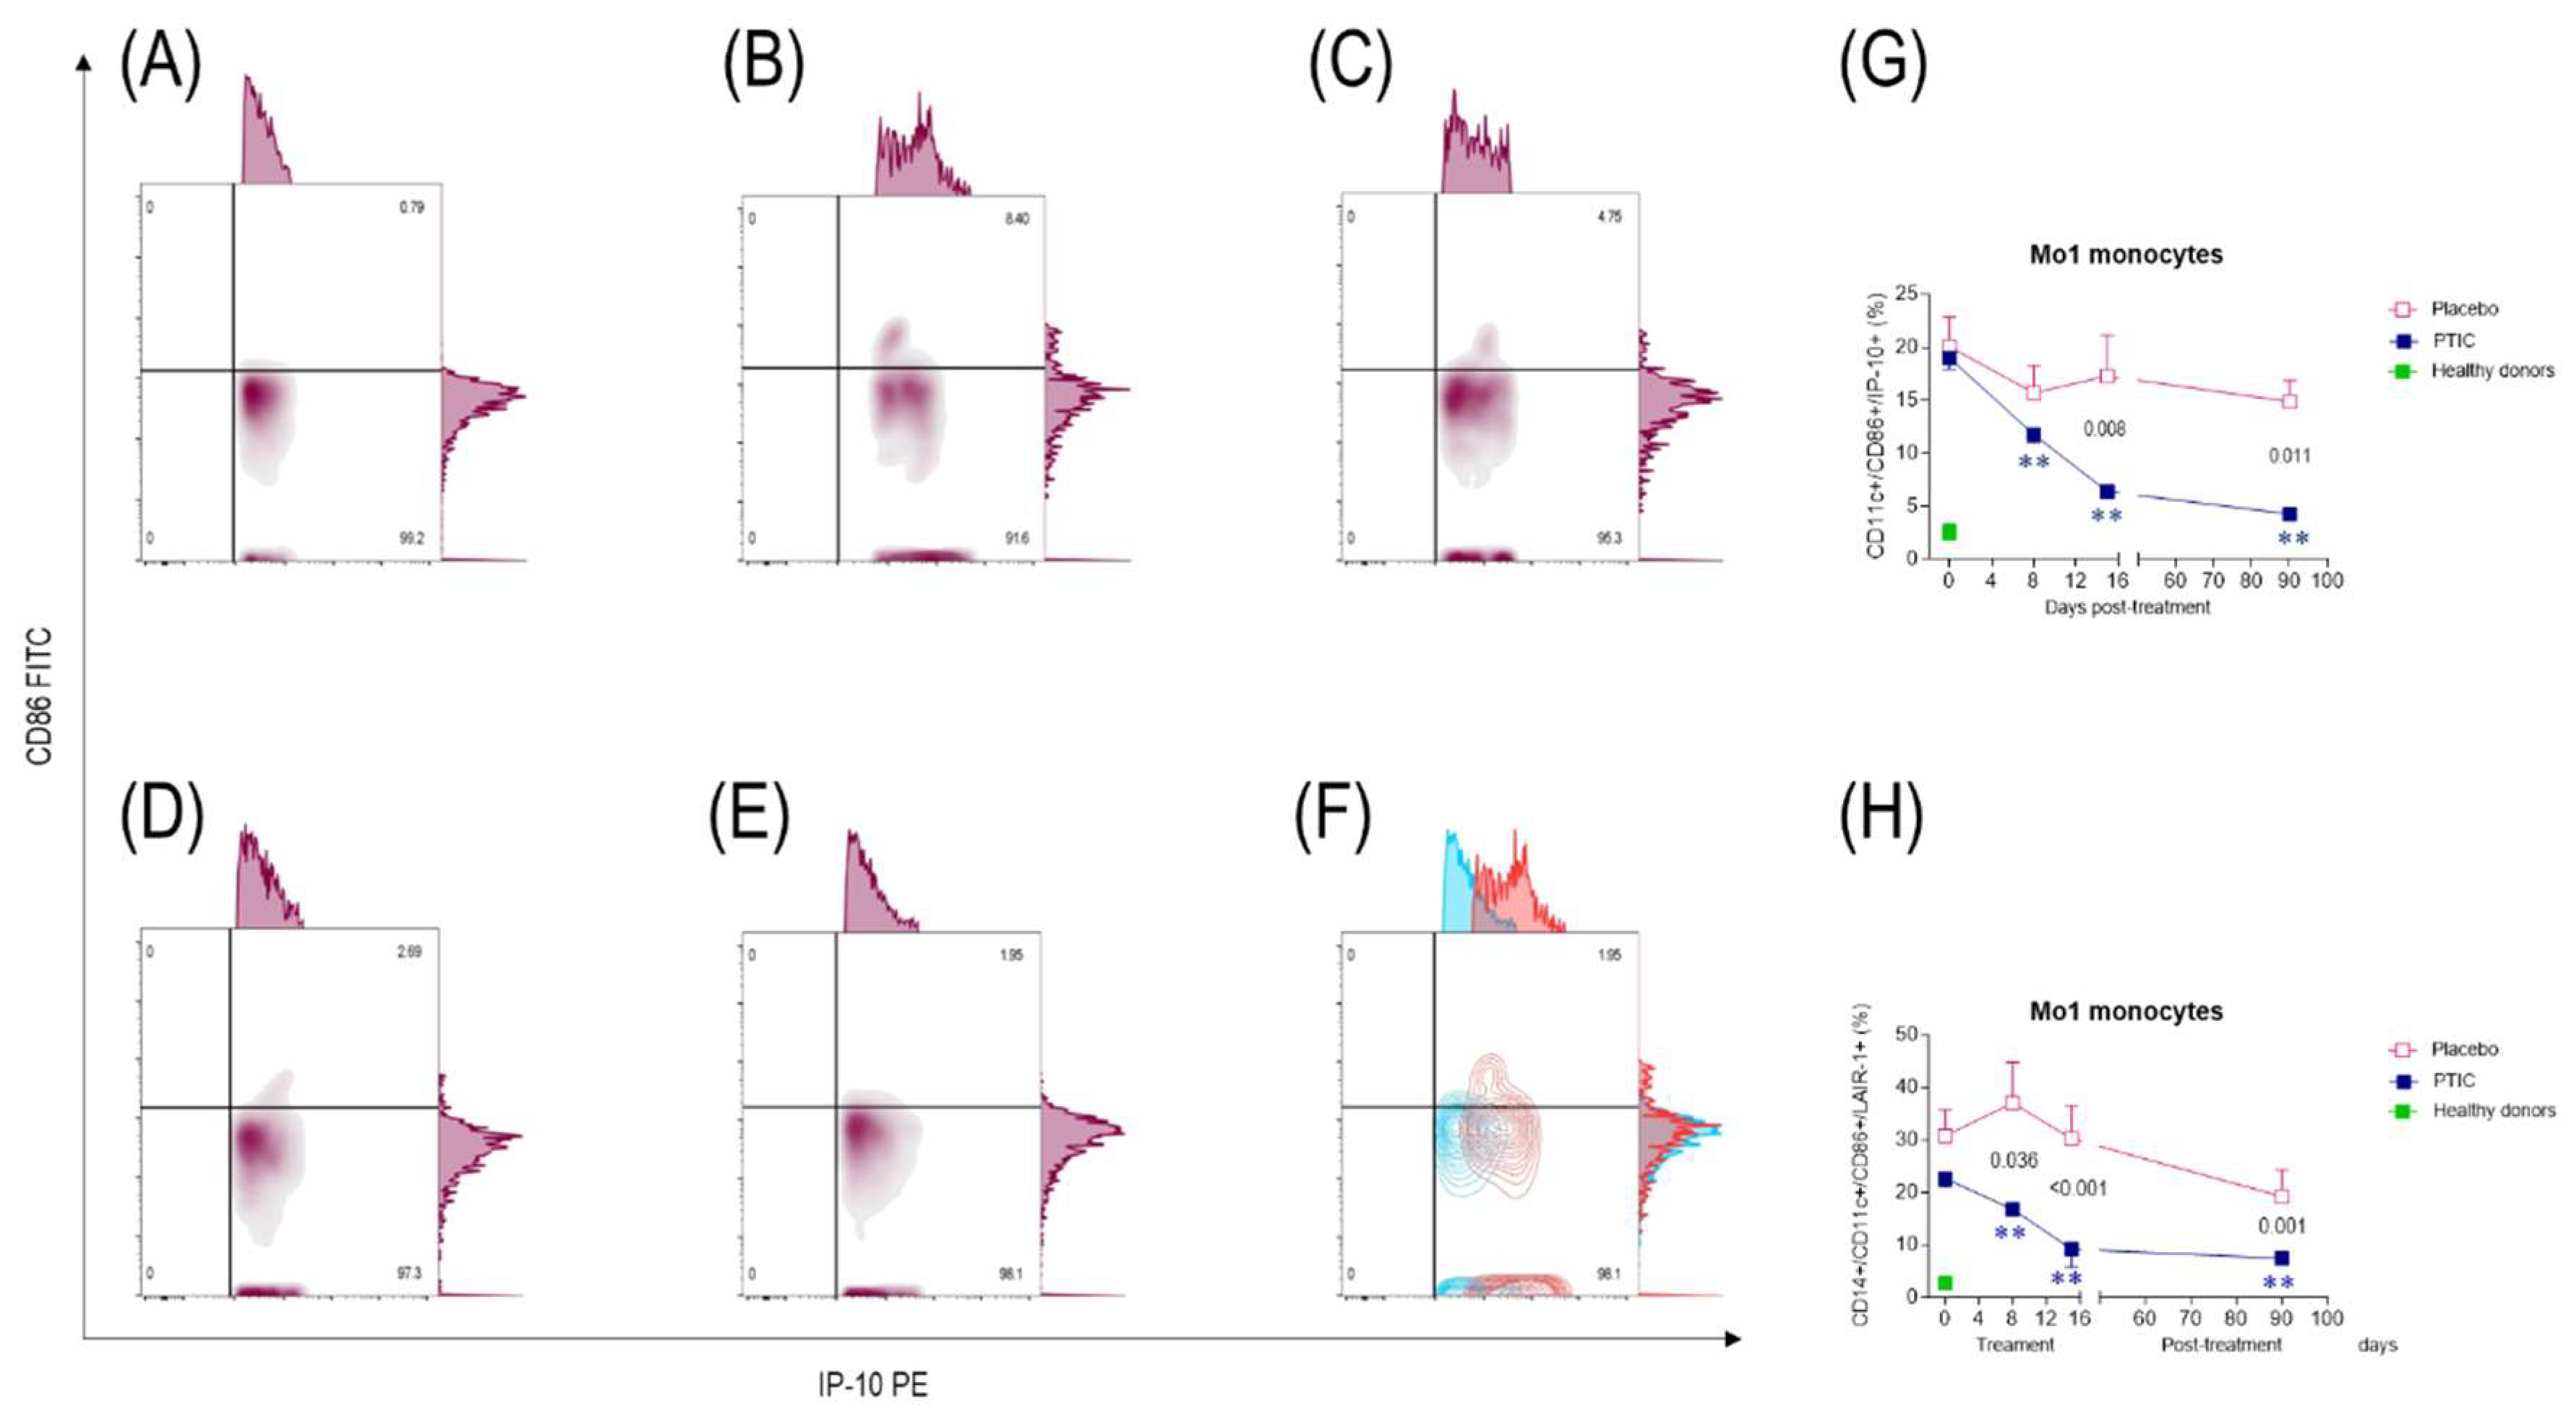
Figure 5.
Representative flow plots of circulating Mo2 subset in SARS-CoV2-infected symptomatic outpatients at baseline 8-, 15-, and 90-days post-treatment with PTIC (n=20) or placebo (n=20). CD11b+/CD16+/CD163+/IDO+-expressing cells in (A) healthy donors and patients at (B) baseline, (C) 8 day, (D) 15 days, and (E) 90 days post-treatment. (F) Flow plots at baseline (red) and 90 days post-treatment with PTIC (blue). (G) CD16+/CD11b+/CD163+/IDO+-producing cells are expressed as mean ± SEM. (H) CD16+/CD11b+/CD163+/LAIR-1+-producing cells are expressed as mean ± SEM. Blue stars show the day the treatment reached a P<0.05 compared to the PTIC treatment baseline. Pink stars depict the day the treatment reached a P < 0.05 compared to the baseline for the placebo. The numbers on the graph represent the statistical significance between the patients treated with PTIC vs. placebo. *P≤0.05 and **P≤0.001 depict the statistically significant difference from baseline (blue: PTIC, pink: placebo, green: healthy donors).
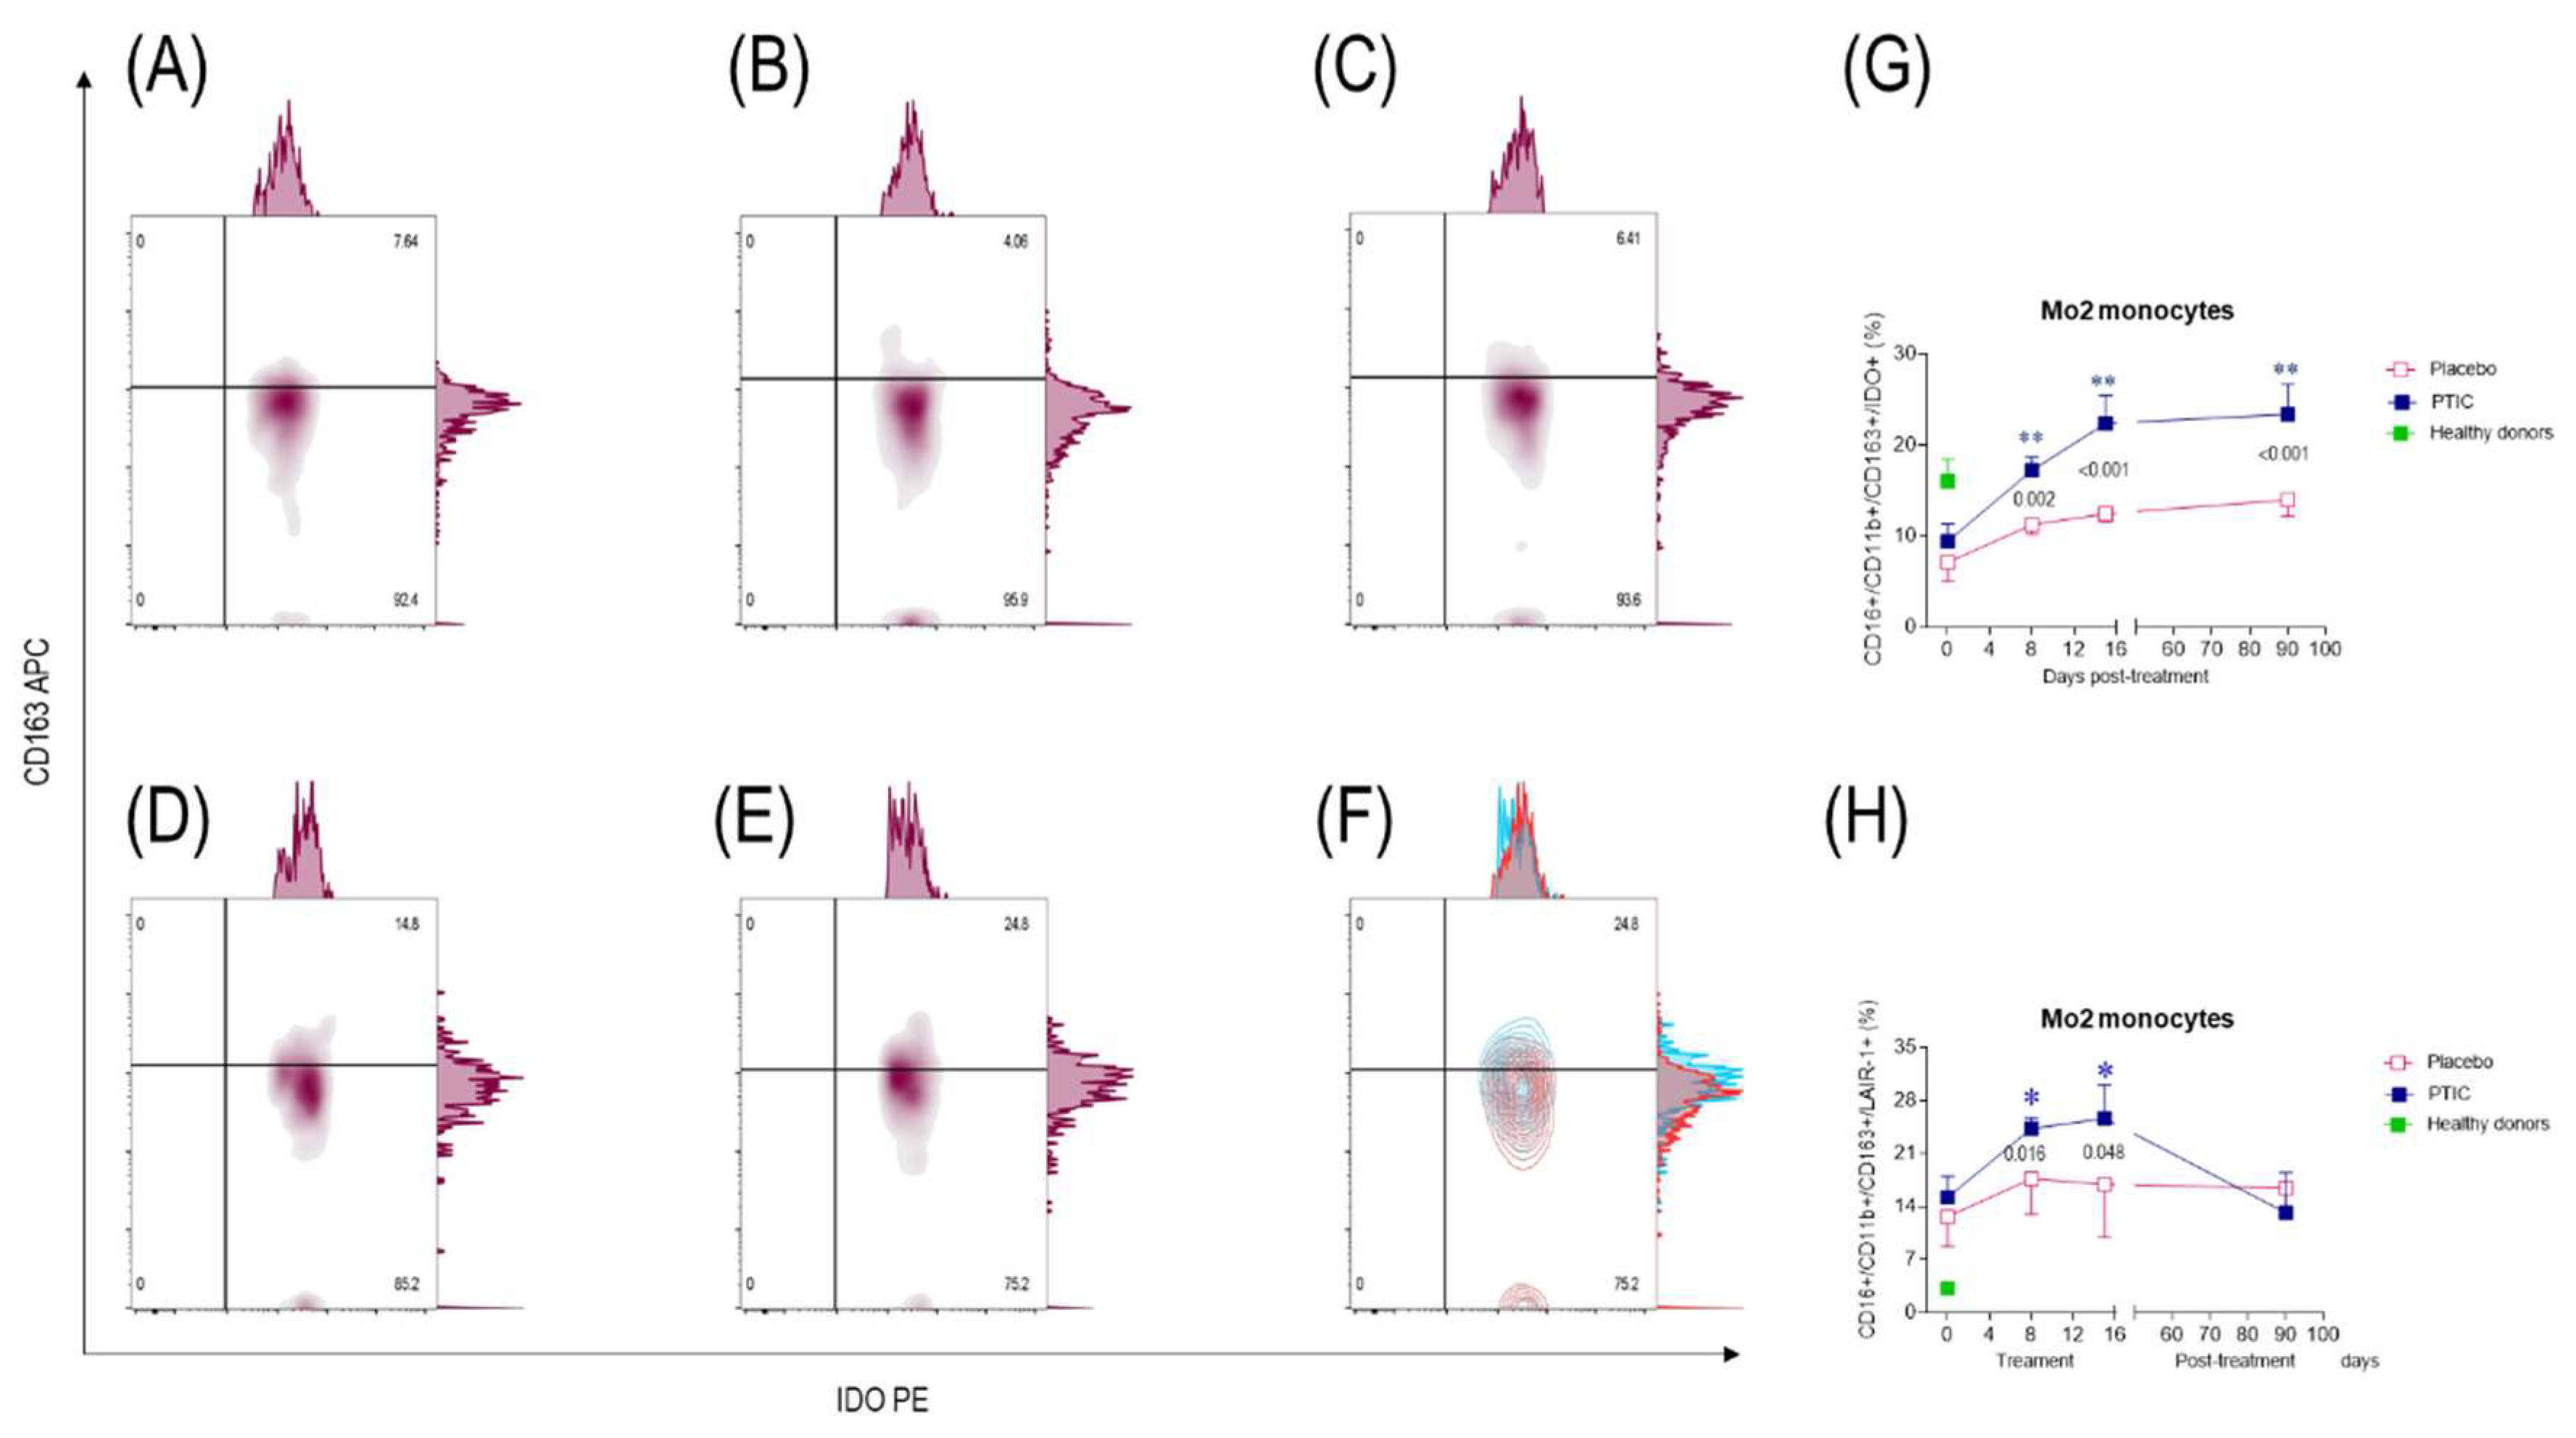
Figure 6.
Serum cytokine and chemokine levels of SARS-CoV2-infected symptomatic outpatients at baseline 8-, 15-, and 90-days post-treatment with PTIC (n=20) or placebo (n=20). Data are expressed as mean ± sem. (A) IP-10, (B) Hu MIF, (C) Eotaxin, (D) IL-8, (E) Hu SCF, (F) Hu M-CSF, (G) Hu HGF, (H) IL-1Ra, and (I) Hu TRAIL. The numbers on the graph represent the statistical significance between the patients treated with PTIC vs. those treated with a placebo. *P≤0.05 and **P≤0.001 depict the statistically significant difference from baseline (blue: PTIC, pink: placebo, green: healthy donors).
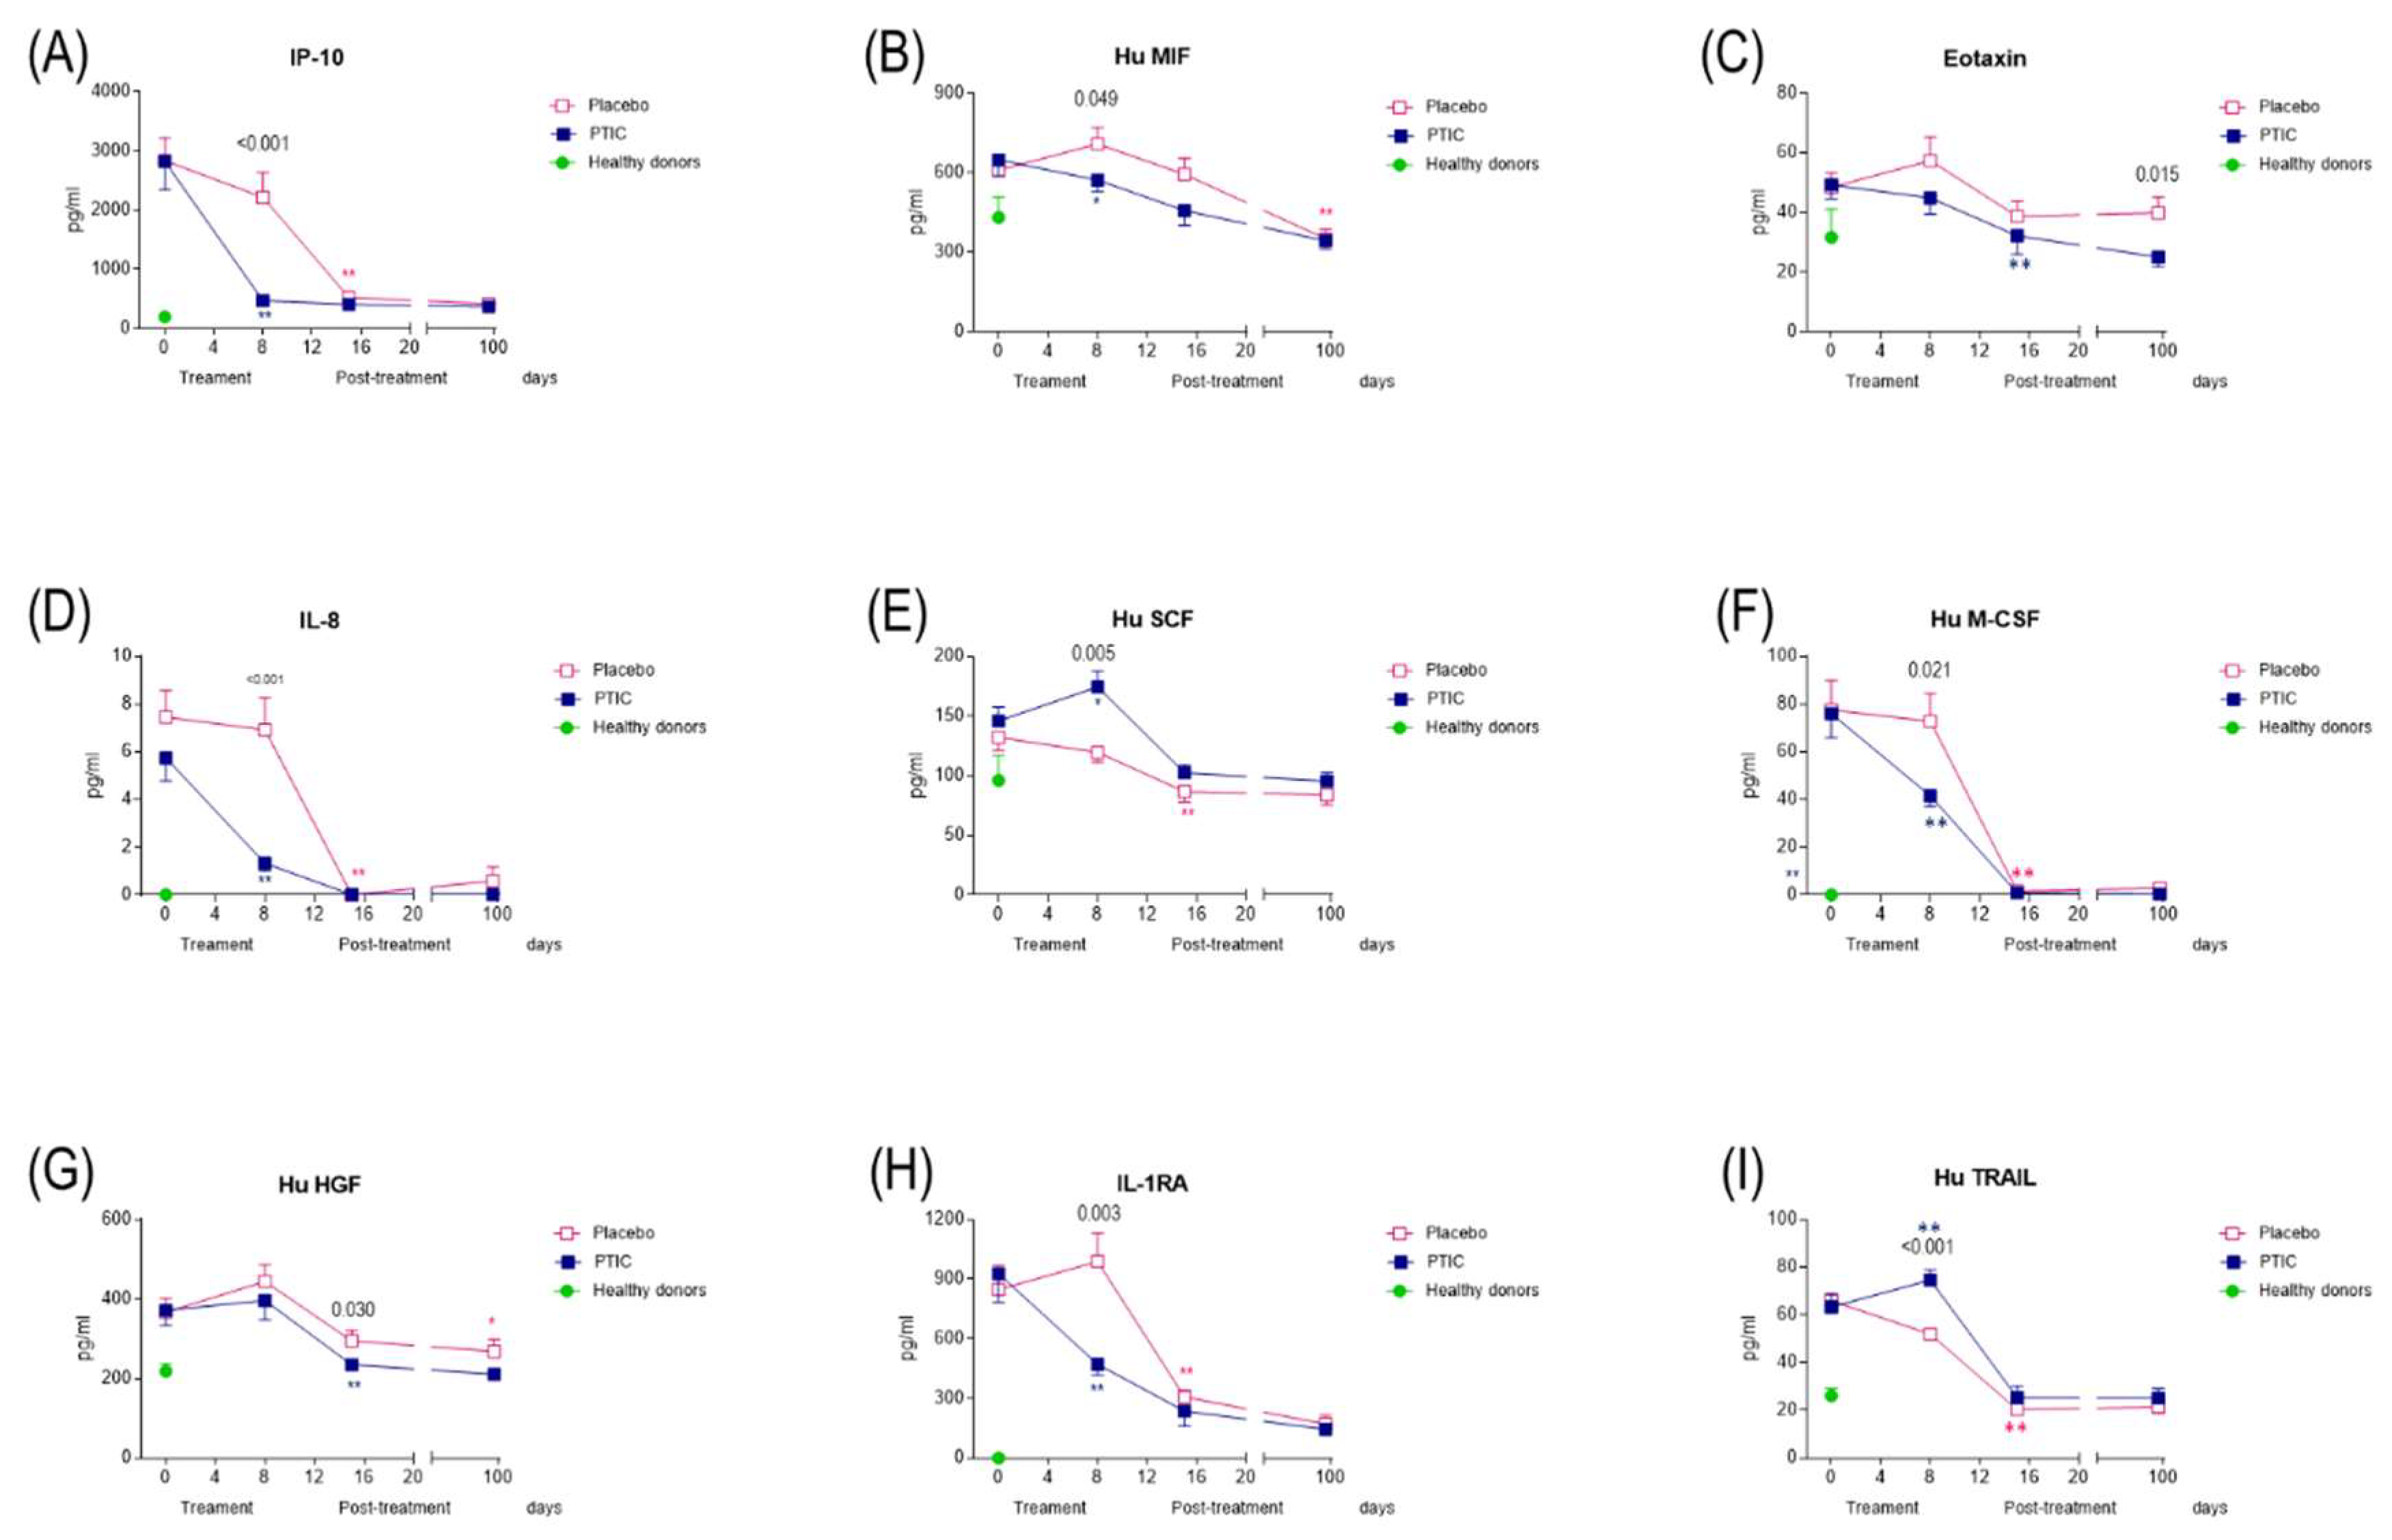
Figure 7.
(A) Oxygen saturation of SARS-CoV2-infected symptomatic outpatients at baseline and 90 days post-treatment with PTIC (n=20) or placebo (n=20). The numbers on the graph represent the statistical significance between the patients treated with PTIC and those treated with placebo .*P≤0.05 and **P≤0.001 depict the statistically significant difference from baseline (blue: PTIC, pink: placebo). The intensity of symptoms during treatment and follow-up of outpatients with symptomatic COVID-19 treated with PTIC or placebo. (B) Dyspnea, (C) cough, (D) headache, (E) chronic fatigue syndrome evaluated by chalder fatigue questionnaire (The bimodal evaluation produces a score from 0 to 11. A score greater than or equal to 4 qualifies as a "case"). The intensity of the symptom was evaluated on a 4-point rating scale (0 = without symptom, 1 = mild, 2 = moderate, 3 = severe). Blue lines represent the group of patients under polymerized type I collagen treatment. Red lines represent the group of patients under placebo treatment. Results depict mean ± standard error of the mean. Blue stars show the day the treatment reached P < 0.05 compared to the PTIC treatment baseline. Pink stars depict the day the treatment reached P < 0.05 compared to the baseline for the placebo.
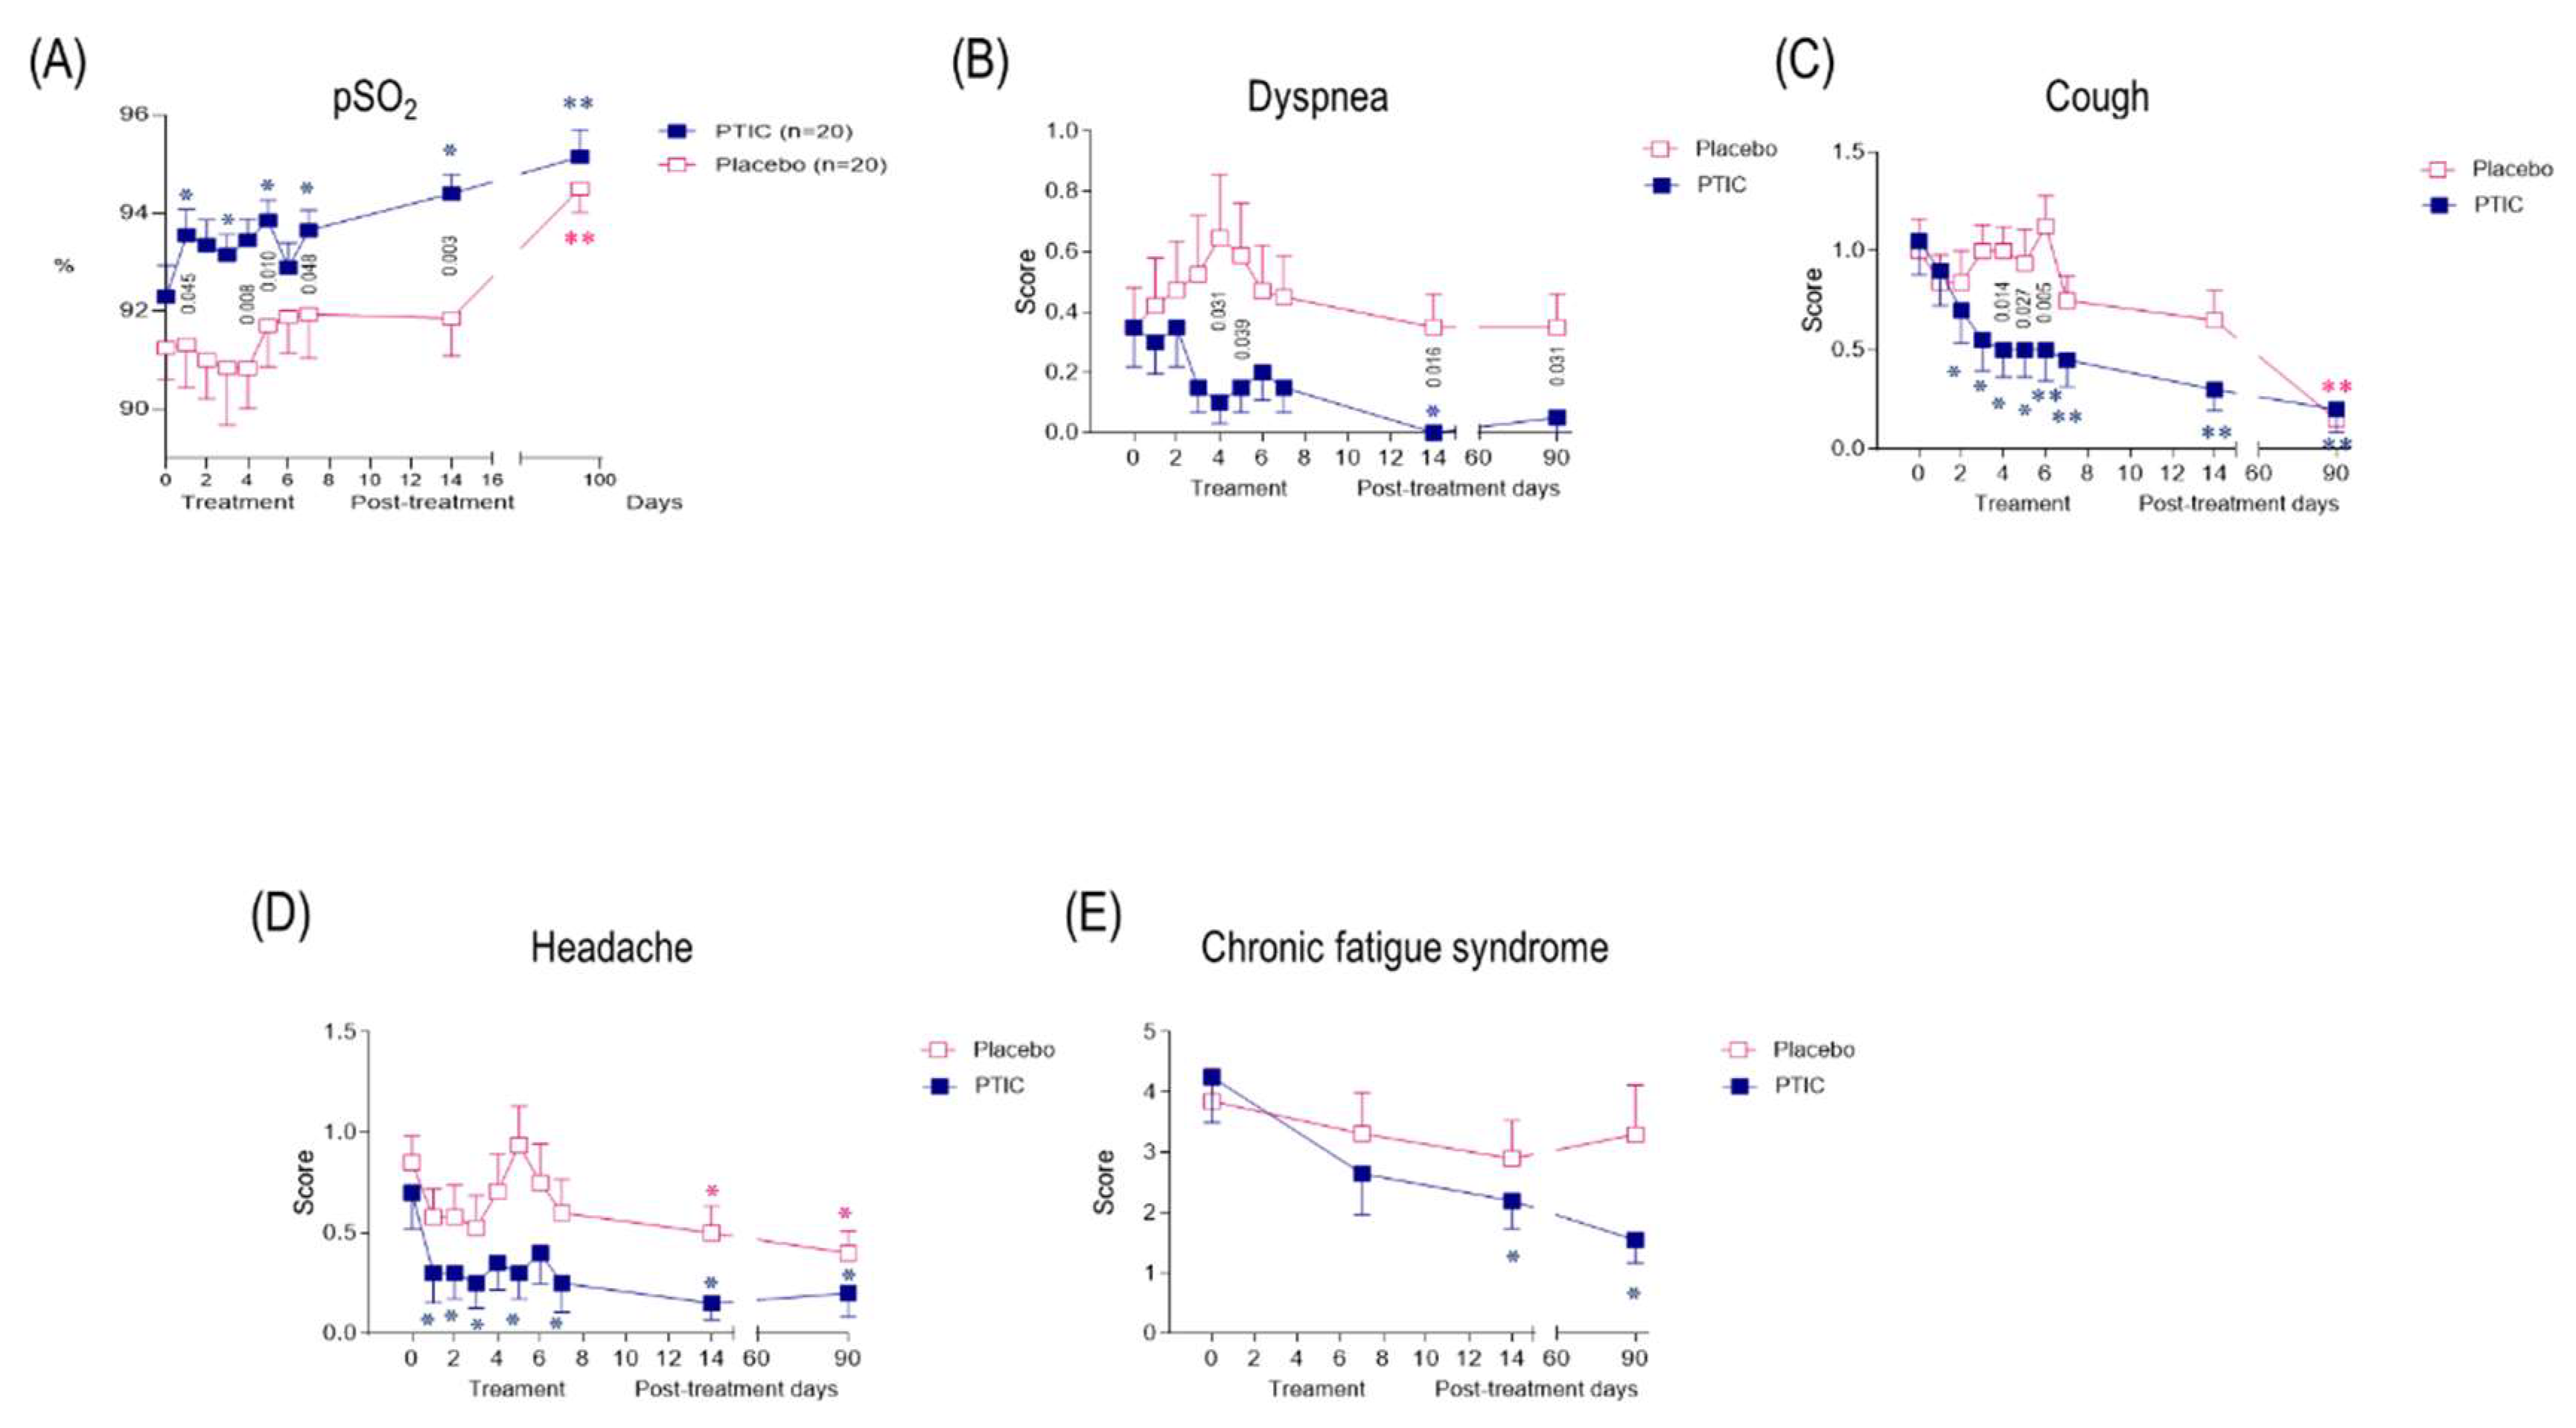
Figure 8.
PTIC regulates STAT-1 phosphorylation through LAIR-1 in M1 and favors polarization towards M2. (A) Leukocyte-associated immunoglobulin-like receptor 1 (LAIR1, or CD305) is a type I transmembrane glycoprotein that contains one extracellular Ig-like domain and two immunoreceptor tyrosine-based inhibitory motifs (ITIMs) in its intracellular domain. LAIR1 is expressed in most hematopoietic lineages, including monocytes, macrophages, dendritic cells (DCs), natural killer (NK) cells, and many T and B cell populations. Its extracellular domain binds to glycine-proline-hydroxyproline collagen repeats, and its ITIMs recruit phosphatases SHP-1 and SHP-2. Collagens, C1q, MBL, surface protein-D (SP-D), Rifins, and Colec12 have been reported as ligands for LAIR1. It downregulates T, B, and natural killer (NK) cell functions by recruitment of SHP1 and SHP2 phosphatases. (B) The pre-polarized (M0) macrophage subsets challenge with LPS/IFN-γ induce polarization to M1. The human monocytic cell line THP-1 expresses high levels of LAIR1. (C) LAIR1 binding type I collagen regulates immune system balance and protects against tissue damage against a hyperactive immune response or autoimmune dysfunction through SHP-1, SHP-2, CSK, and pSTAT-1 intracellular signaling. (D) Polymerized type I collagen induces downregulation of phosphorylation of STAT-1 in M1 and promotes polarization to M2.
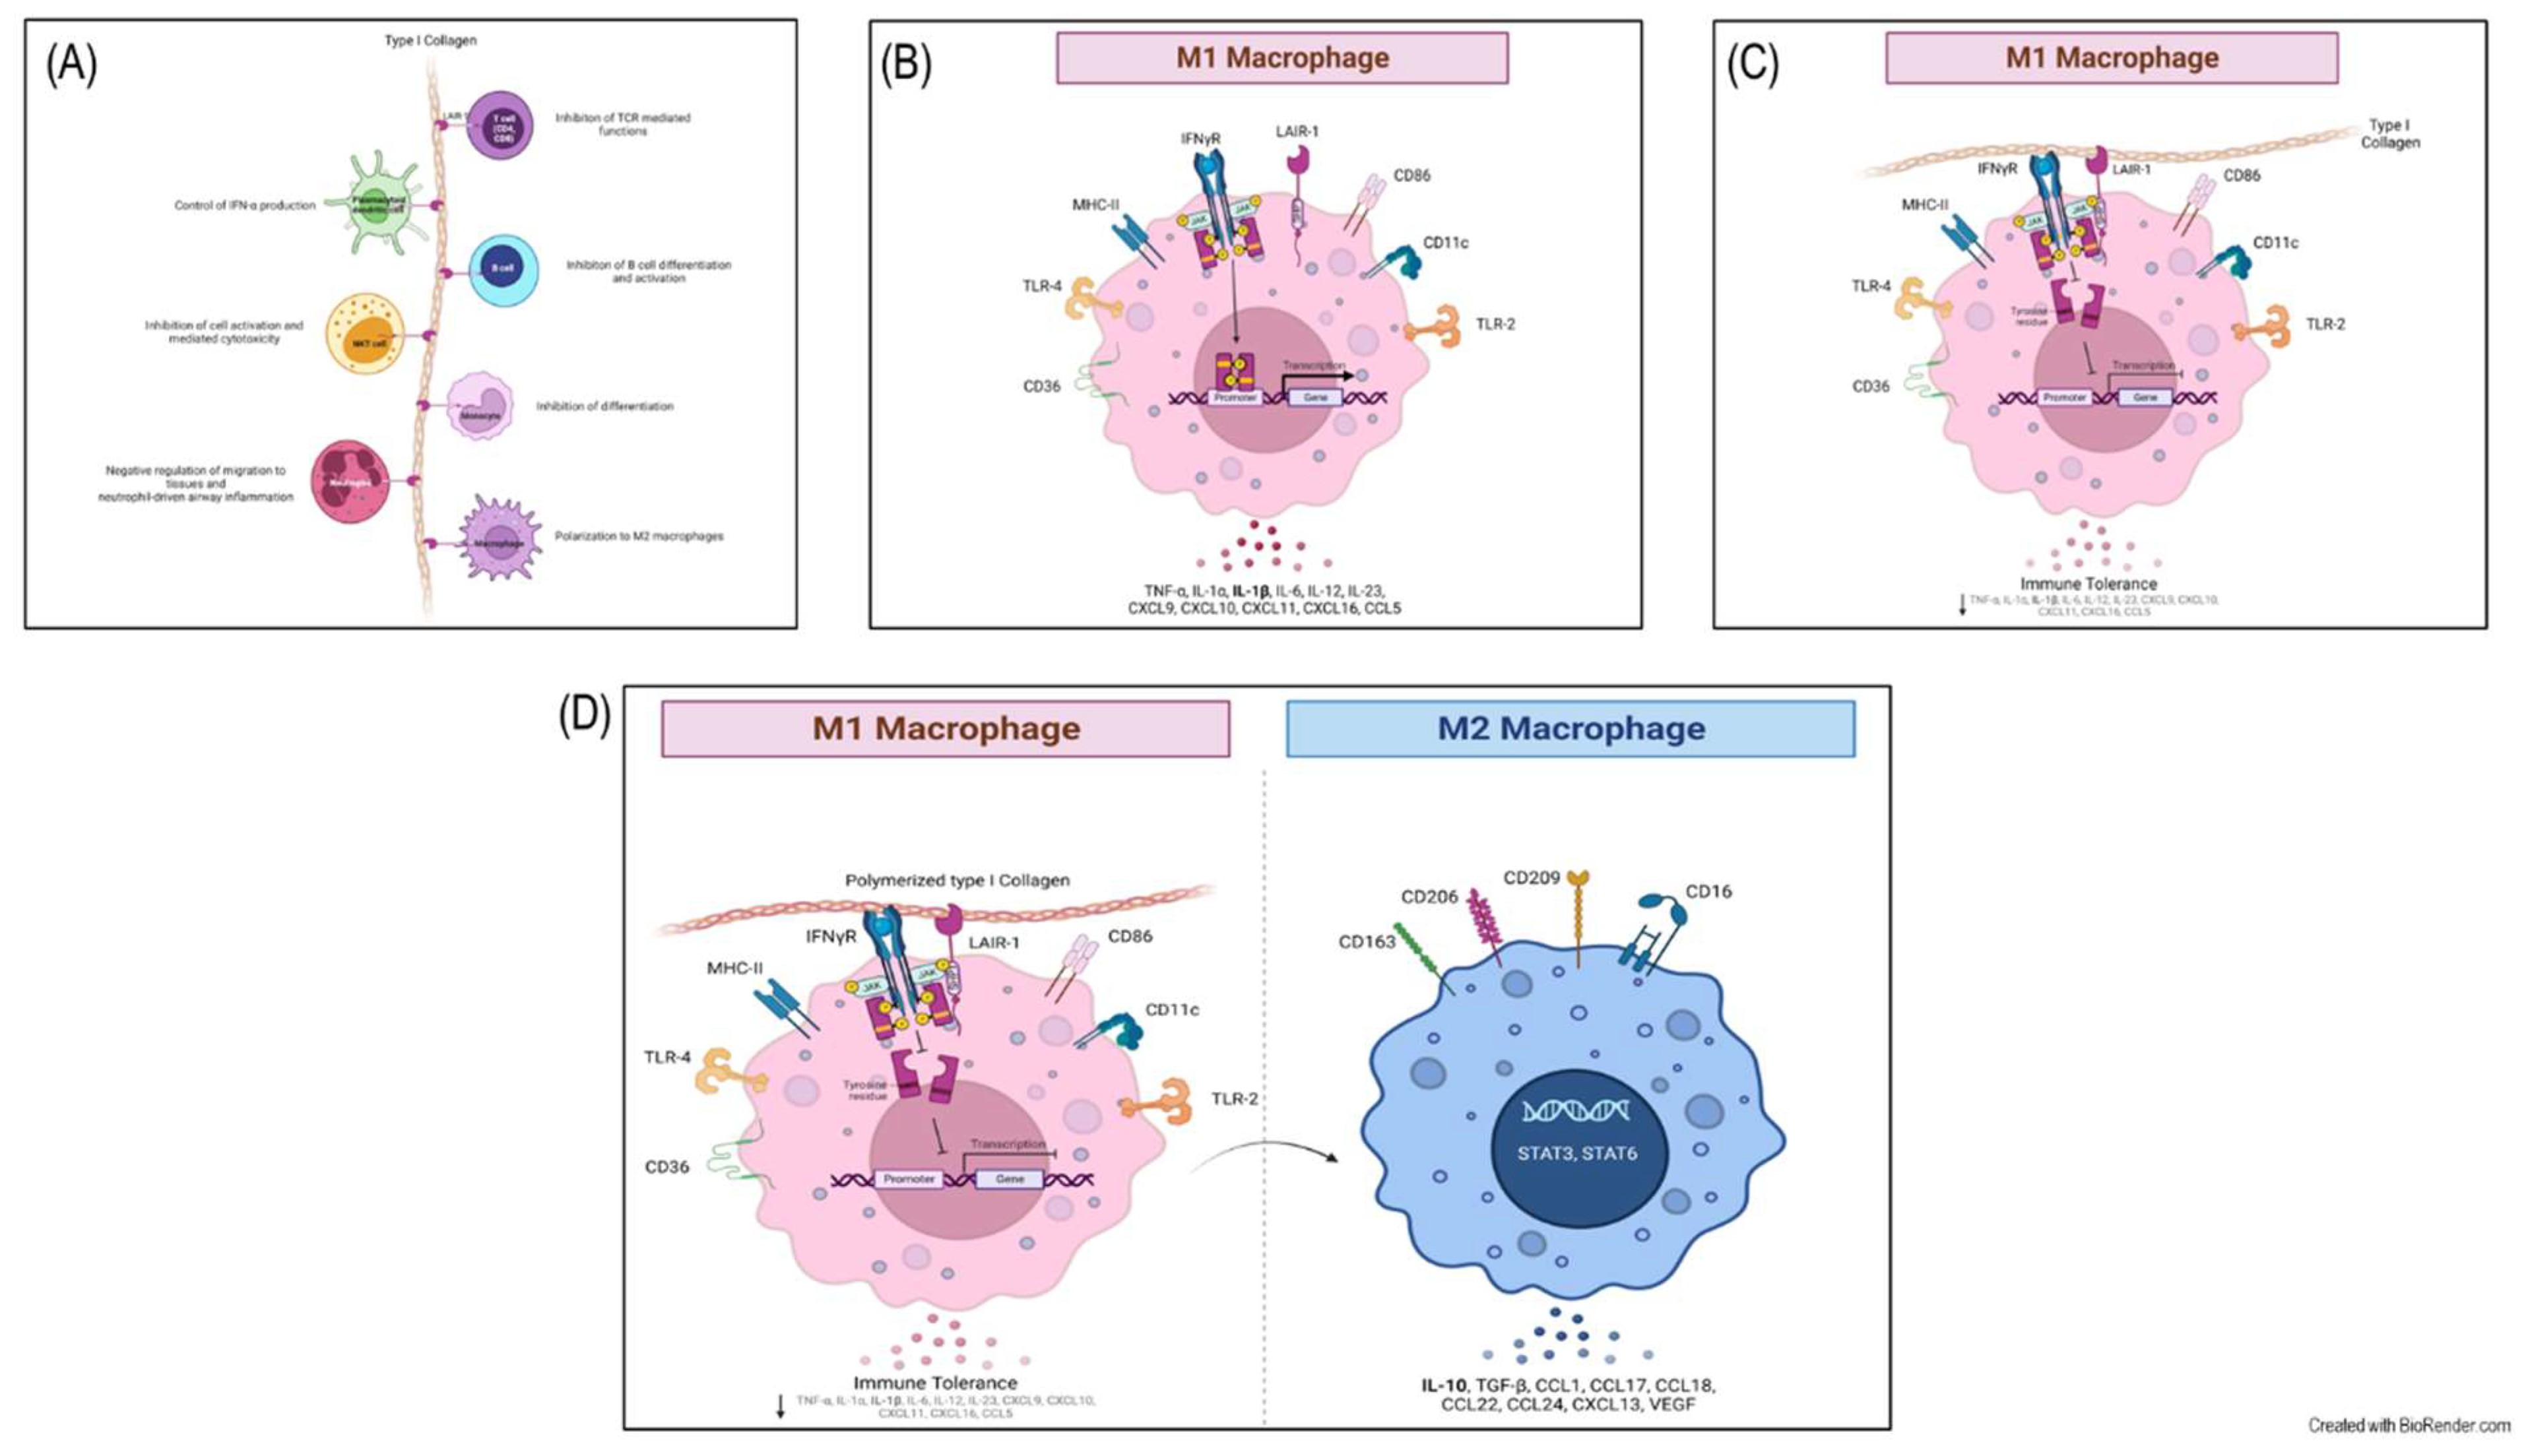

Table 1.
Demographic and clinical characteristics of the trial population.
| Baseline | 8-day post-treatment | 15-day post-treatment | 90-day post-treatment | ||||||||||
|---|---|---|---|---|---|---|---|---|---|---|---|---|---|
| All Subjects (N= 40) |
PTCI (N= 20) |
Placebo (N= 20) |
P |
PTCI (N= 20) |
Placebo (N= 20) |
P |
PTCI (N= 20) |
Placebo (N= 20) |
P |
PTCI (N= 20) |
Placebo (N= 20) |
P | |
| Demographics | |||||||||||||
| Age (years), mean±SD Median Range |
49.6±13.8 48.0 19.0–78.0 |
48.5±15.1 45.5 19.0–73.0 |
50.7±12.6 50.5 31.0–78.0 |
0.612 | |||||||||
| Male sex, n, (%) | 20 (50.0) | 12 (60.0) | 8 (40.0) | 0.343 | |||||||||
| BMI (kg/m2), mean±SD Median Range |
29.7±4.2 29.4 22.7–40.8 |
28.7±3.5 28.4 23.1–38.3 |
30.6±4.7 30.5 22.7–40.8 |
0.145 | |||||||||
| Guangzhou Severity Index, mean±SD Median Range |
93.2±24.4 92.9 44.4–137.5 |
92.7±27.1 93.3 44.4–134.1 |
93.7±22.1 91.8 53.2-137.5 |
0.907 | |||||||||
| Chest CT Score 0% <20% 20-50% >50% |
5 (13) 26 (65) 8 (20) 1 (2) |
3 (15) 12 (60) 4 (20) 1 (5) |
2 (10) 14 (70) 4 (20) 0 (0.0) |
||||||||||
| pSO2<92% (%) | 16 (40) | 6 (30) | 10 (50) | 0.333 | 2 (10) | 6 (30) | 0.235 | 0 (0) | 5 (25) | 0.047 | 0 (0) | 1 (5) | 1.00 |
| pSO2; mean±SD Median Range |
91.8±2. 9 92.0 84-97 |
92.3±2.9 92.5 84-96 |
91.3±2.9 91.5 86-97 |
0.255 |
93.7±1.8 93.5 91-97 |
91.9±3.6 93.0 84-97 |
0.048 |
94.4±1.7 94.5 92-97 |
91.9±2.9 92.5 87-97 |
0.003 |
95.2±2.5 94.5 92-100 |
94.5±2.2 94.0 91-99 |
0.382 |
| Laboratory variables | |||||||||||||
| Complete blood count | |||||||||||||
| Leukocyte count (x10^3/µL), mean±SD Median Range |
5.9±2.3 5.4 2.8-12.5 |
5.5±1.6 5.6 2.8–8.0 |
5.7±2.5 4.9 3.0-12.5 |
0.490 |
6.2±1.5 6.3 3.6-9.3 |
6.4±1.7 6.0 3.9-11.4 |
0.766 |
6.6±1.2 6.5 4.8-9.6 |
7.1±1.2 6.9 5.1-9.7 |
0.462 |
6.7±1.3 6.8 3.7-8.5 |
6.8±1.5 6.7 4.6-9.5 |
0.856 |
| Hemoglobin (g/dL), mean±SD Median Range |
15.3±2.03 15.25 10.5-20.1 |
15.9±2.6 16.0 11.9-20.1 |
14.9±1.8 15.1 10.5-18.1 |
0.274 |
15.4±1.8 15.3 11.9-20.1 |
14.6±1.9 14.7 9.7-18.3 |
0.191 |
15.2±1.5 15.7 11.2-17.6 |
14.4±1.6 14.4 10.0-16.9 |
0.182 |
15.7±1.7 16.0 12.0-19.4 |
14.9±1.7 14.7 11.2-19.0 |
0.395 |
| Platelets (K/µL), mean±SD Median Range |
265±41 239 73–910 |
286±162 241 150-910 |
243±118 229 73-568 |
0.522 |
331±122 297 151-642 |
312±127 287 85-605 |
0.678 |
299±897 297 166-469 |
365±158 312 20-620 |
0.121 |
274±75 267 169-460 |
282±971 271 150-579 |
0.775 |
| Lymphocyte count (%), mean±SD Median Range |
28.0±11.3 27.7 8.0–54.0 |
28.6±11.5 30.8 8.1–43.5 |
28.1±12.0 24.4 8.0-54.0 |
0.938 |
31.7±7.0 33.9 17.4 |
25.7±9.7 26.0 6.6-42.0 |
0.050 |
31.6±8.0 31.5 15.1-46.4 |
29.5±7.1 29.2 12.6-39.6 |
0.324 |
32.0±6.6 33.0 18.1-41.5 |
31.8±8.8 31.0 14.3-49.3 |
0.929 |
| Neutrophil count (%), mean±SD Median Range |
62.5±11.2 62.3 39.0–82.0 |
61.2±12.0 57.9 46.3–80.4 |
62.6±11.4 66.5 39.0–82.0 |
0.962 |
58.1±6.6 55.8 49.0-71.0 |
64.7±10.5 64.3 48.9-85.2 |
0.050 |
58.5±7.4 56.8 44.9-71.2 |
60.1±7.5 59.5 48.7-76.3 |
0.402 |
58.5±6.3 56.2 50.5-71.3 |
58.0±8.3 58.0 41.9-76.3 |
0.845 |
| Neutrophil-lymphocyte ratio (NLR), mean±SD Median Range |
3.0±2.3 2.3 0.7-10.3 |
3.0±2.4 2.1 1.1-9.9 |
3.0±2.3 2. 8 0.7-10.3 |
0.475 |
2.0±0.8 1.7 1.2-4.0 |
3.6±3.3 2.5 1.2-12.9 |
0.040 |
2.1±0.9 1.8 1.0-4.7 |
2.3±1.1 2.1 1.2-6.1 |
0.190 |
2.0±0.7 1.7 1.2-3.7 |
2.1±1.1 1.9 0.9-5.1 |
0.475 |
| Monocytes count (%), mean±SD Median Range |
7.8±2.1 7.7 4.0-11.4 |
7.7±2.0 7.9 4.2-11.4 |
7.9±2.1 7.6 4.0-11.3 |
7.5±1.2 7.4 5.6-10.0 |
7.6±1.9 7.7 4.9-11.9 |
7.2±1.6 6.7 5.3-10.7 |
7.6±1.6 7.6 4.9-10.5 |
6.7±1.3 6.5 5.0-9.6 |
6.8±1.4 2. 8 3.1-9.1 |
||||
| Liver function test (LFT) | |||||||||||||
| Total bilirubin (mg/dL), mean±SD Median Range |
0.6±0.3 0.6 0.2-1.4 |
0.6±0.3 0.6 0.3-1.3 |
0.6±0.3 0.5 0.2–1.4 |
0.597 |
0.8±0.3 0.7 0.4-1.3 |
0.6±0.2 0.6 0.2-1.1 |
0.064 |
0.8±0.3 0.7 0.3-1.3 |
0.6±0.3 0.6 0.2-1.4 |
0.280 |
0.8±0.4 0.8 0.3-1.8 |
0.7±0.3 0.6 0.3-1.5 |
0.142 |
| Direct bilirubin (mg/dL), mean±SD Median Range |
0.1±0.1 0.1 0.03-0.4 |
0.1±0.1 0.1 0.04-0.3 |
0.1±0.1 0.1 0.03-0.4 |
0.987 |
0.1±0.1 0.1 0.05-0.2 |
0.1±0.1 0.1 0.05-0.3 |
0.592 |
0.1±0.04 0.1 0.07-0.2 |
0.1±0.05 0.1 0.04-0.2 |
0.886 |
0.1±0.04 0.1 0.07-0.2 |
0.1±0.05 0.1 0.06-0.3 |
0.613 |
| Indirect bilirubin (mg/dL), mean±SD Median Range |
0.5±0.20 0.5 0.15–1.0 |
0.5±0.19 0.5 0.22–1.0 |
0.5±0.22 0.4 0.15–1.0 |
0.449 |
0.6±0.23 0.6 0.28-1.0 |
0.5±0.15 0.5 0.16-0.7 |
0.017 |
0.6±0.27 0.6 0.27-1.1 |
0.5±0.23 0.5 0.19-1.2 |
0.216 |
0.7±0.33 0.7 0.24-1.6 |
0.5±0.25 0.5 0.25-1.3 |
0.113 |
| Aminotransferase, serum aspartate (AST) (U/L), mean±SD Median Range |
35.2±27.3 28.5 9–158 |
27.5±16.6 22.0 11-83 |
40.9±34.2 31.5 9-58 |
0.142 |
23.5±9.0 23.0 12.0-51.0 |
34.5±27.0 25.0 14.0-126.0 |
0.167 |
21.6±13.1 18.0 12.0-70.0 |
23.9±10.9 22.00 12.0-49.0 |
0.623 |
20.0±7.7 19.5 2.8-34.0 |
28.3±18.1 20.5 10.0-87.0 |
0.114 |
| Aminotransferase, serum alanine (ALT) (U/L), mean±SD Median Range |
40±32 29.5 9.0-129.8 |
31±23 28.0 9.0–92.0 |
43±33 31.5 12.0–120.0 |
0.372 |
33±21 32.0 9.0-88.0 |
40±38 28.0 12.0-178.0 |
0.679 |
25±14 22.5 6.0-60.0 |
30±12 28.0 15.0-52.0 |
0.327 |
22±11 19.5 5.0-50.0 |
31±18 23.0 12.0-76.0 |
0.077 |
| Albumin (g/dL), mean±SD Median Range |
4.3 ± 0.4 4.3 3.5 – 5.1 |
4.5 ± 0.3 4.4 3.8 - 5.1 |
4.2 ± 0.3 4.2 3.6-4.7 |
0.150 |
4.2±0.7 4.3 1.9-5.1 |
4.0±0.4 4.0 3.4-4.8 |
0.315 |
4.5±0.4 4.5 3.8-5.6 |
4.1±0.3 4.1 3.6-4.8 |
0.023 |
4.6±0.33 4.7 4.0-5.2 |
4.3±0.2 4.4 3.9-4.7 |
0.001 |
| Fasting glucose (mg/dL) Mean±SD Median Range |
128±77 104.0 70–386 |
117±72 95.5 70-386 |
139±82 104.5 79-354 |
0.284 |
112±60 97.5 81-361 |
121±54 99.0 82-286 |
0.568 |
110±46 96.5 85-297 |
120±62 95.0 78-317 |
0.854 |
104±44 94.5 80-286 |
122±54 98.5 85-307 |
0.133 |
| Lactate dehydrogenase (LDH) (U/L) Mean±SD Median Range |
172±51 162.0 97–303 |
173±64 157.5 97-303 |
171±34 165.5 121-271 |
0.923 |
149±52 140.50 95-338 |
186±64 170.0 121-271 |
0.027 |
134±25 128.5 91-169 |
174±72 159.0 104-422 |
0.058 |
147±24 153.0 104-192 |
168±30 164.5 125-235 |
0.065 |
| C-reactive protein (mg/dL) mean±SD Median Range |
2.2±3.2 1.3 0.05-16.5 |
2.4±4.2 1.1 0.05-16.5 |
2.1±2.5 1.3 0.08-11.5 |
0.860 |
0.4±0.3 0.3 0.03-1.3 |
3.8±5.3 1.9 0.15-22.7 |
0.001 |
0.3±0.8 0.2 0.03-3.6 |
1.1±2.2 0.4 0.11-9.1 |
0.013 |
0.2±0.2 0.2 0.04-1.1 |
0.6±0.5 0.4 0.05-1.7 |
0.025 |
| Ferritin (ng/mL) mean±SD Median Range |
267±322 189.7 6-1614 |
285±342 203.3 6-1614 |
250±309 1390.0 6-1277 |
0.841 |
220±256 155 3-1194 |
274±350 131.1 17-1420 |
1.00 |
158±143 114.0 3-627 |
173±209 142.6 13-860 |
0.824 |
94±86 70.0 13-379 |
70±68 55.5 4-277 |
0.393 |
| D-dimer (ng/dL) mean±SD Median Range |
1047±2498 481.5 192-15000 |
1619±3476 511.5 192-5000 |
475±196 451.5 213-987 |
0.189 |
968±1683445.5 154-7525 |
967±1596 613.5 244-7634 |
0.430 |
850±1393 395.0 190-6333 |
1016±1821 482.5 186-7764 |
0.747 |
374±382 284.5 169-1894 |
387±218 366.5 169-1091 |
0.165 |
| CD11c+/CD86+/IP-10+-expressing cells (M1%) mean±SEM Median Range |
19.0±1.1 19.6 15-22 |
20.1±2.8 19.9 15-26 |
0.914 |
11.8±1.8 12.2 9-14 |
15.7±2.6 14.6 11-23 |
0.118 |
6.4±0.5 6.5 5-8 |
17.3±3.9 15.0 11-28 |
0.008 |
4.3±0.4 4.4 3-6 |
14.9±2.0 13.9 11-20 |
0.011 | |
| CD11b+/CD16hi/CD163+/IDO+-expressing cells (M2%) mean±SEM Median Range |
7.7±1.0 8.0 4-11 |
7.1±2.2 6.8 3-12 |
0.776 |
18.3±2.6 18.5 15-22 |
11.2±1.1 11.1 9-14 |
0.002 |
5.2±1.4 24.6 21-32 |
12.5±0.9 12.3 10-15 |
<0.001 |
26.4±1.5 26.8 20-31 |
14.0±1.8 14.1 11-17 |
<0.001 |
|
| CD4+/CD183+/CD192+/IFN-γ+-expressing cells (Th1%) mean±SEM Median Range |
3.1±0.7 3.2 2 - 4 |
2.5±0.2 2.6 2-3 |
0.103 |
8.7±0.7 9.0 6-10 |
3.6±0.7 3.4 2-5 |
<0.001 |
14.0±0.8 13.1 13-18 |
4.3±0.7 3.9 3-6 |
0.011 |
3.1±0.2 3.2 2-4 |
5.0±0.5 4.8 4-7 |
0.005 |
|
| Summary of Comorbidities | |||||||||||||
| None, n, (%) | 1 (3) | 1 (5) | 0 (0) | 1.00 | |||||||||
| One, n, (%) | 7 (18) | 3 (15) | 4 (20) | 1.00 | |||||||||
| 2 or More, n, (%) | 32 (80) | 16 (80) | 16 (80) | 1.00 | |||||||||
| Clinical Comorbidities | |||||||||||||
| History or current tobacco use, n, (%) | 8 (20) | 5 (25) | 3 (15) | 0.695 | |||||||||
| Overweight, n, (%) | 19 (48) | 11 (55) | 8 (40) | 0.527 | |||||||||
| Obesity, n, (%) | 17 (43) | 6 (30) | 11 (55) | 0.200 | |||||||||
| Hypertension, n, (%) | 10 (25) | 5 (25) | 5 (25) | 1.00 | |||||||||
| Diabetes, n, (%) | 8 (20) | 2 (10) | 6 (30) | 0.235 | |||||||||
| Dyslipidemia, n, (%) | 6 (15) | 5 (25) | 1 (5) | 0.181 | |||||||||
| Hypertriglyceridemia, n, (%) | 21 (53) | 12 (60) | 9 (45) | 0.527 | |||||||||
| Coronary artery disease, n, (%) | 0 (0) | 0 (0) | 0 (0) | - | |||||||||
| Congestive heart failure, n, (%) | 1 (3) | 0 (0) | 1 (5) | 1.00 | |||||||||
| Chronic respiratory disease (emphysema), n, (%) | 1 (3) | 0 (0) | 1 (5) | 1.00 | |||||||||
| Asthma, n, (%) | 1 (3) | 0 (0) | 1 (5) | 1.00 | |||||||||
| Chronic liver disease (chronic hepatitis, cirrhosis), n (%) | 0 (0) | 0 (0) | 0 (0) | – | |||||||||
| Chronic kidney disease, n, (%) | 0 (0) | 0 (0) | 0 (0) | – | |||||||||
| Cancer, n (%) | 0 (0) | 0 (0) | 0 (0) | – | |||||||||
| Immune deficiency (acquired or innate), n, (%) | 0 (0) | 0 (0) | 0 (0) | – | |||||||||
| Symptoms | |||||||||||||
| Dyspnea, n (%) | 12 (30) | 6 (30) | 6 (30) | 1.00 | 3 (15) | 8 (40) | 0.155 | 0 (0) | 7 (35) | 0.008 | 1 (5) | 7 (35) | 0.044 |
| Cough, n (%) | 32 (80) | 16 (80) | 16 (80) | 1.00 | 8 (40) | 14 (70) | 0.111 | 6 (30) | 11 (55) | 0.200 | 3 (15) | 3 (15) | 1.00 |
| Chest pain, n (%) | 11 (28) | 6 (30) | 5 (25) | 1.00 | 3 (15) | 4 (20) | 1.00 | 2 (10) | 3 (15) | 1.00 | 2 (10) | 1 (5) | 1.00 |
| Rhinorrhea, n (%) | 18 (45) | 7 (35) | 11 (55) | 0.341 | 5 (25) | 5 (25) | 1.00 | 2 (10) | 3 (15) | 1.00 | 3 (15) | 2 (10) | 1.00 |
| Headache, n (%) | 25 (63) | 10 (50) | 15 (75) | 0.191 | 3 (15) | 9 (45) | 0.082 | 3 (15) | 9 (45) | 0.082 | 3 (15) | 8 (40) | 0.155 |
| Sore throat, n (%) | 21 (53) | 10 (50) | 11 (55) | 1.00 | 5 (25) | 5 (25) | 1.00 | 2 (10) | 4 (20) | 0.661 | 1 (5) | 2 (10) | 1.00 |
| Malaise, n (%) | 21 (53) | 11 (55) | 10 (50) | 1.00 | 6 (30) | 6 (30) | 1.00 | 3 (15) | 4 (20) | 1.00 | 4 (20) | 5 (25) | 1.00 |
| Arthralgia, n (%) | 21 (53) | 9 (45) | 12 (60) | 0.527 | 4 (20) | 5 (25) | 1.00 | 3 (15) | 3 (15) | 1.00 | 3 (15) | 4 (20) | 1.00 |
| Myalgia, n (%) | 22 (55) | 10 (50) | 12 (60) | 0.751 | 5 (25) | 5 (25) | 1.00 | 3 (15) | 4 (20) | 1.00 | 2 (10) | 2 (10) | 1.00 |
| Brain fog, n (%) | 17 (43) | 10 (50) | 7 (35) | 0.523 | 4 (20) | 7 (35) | 0.480 | 2 (10) | 4 (20) | 0.661 | 2 (10) | 6 (30) | 0.235 |
| Ageusia, n (%) | 20 (50) | 11 (55) | 9 (45) | 0.752 | 6 (30) | 9 (45) | 0.500 | 3 (15) | 6 (30) | 0.451 | 3 (15) | 5 (25) | 0.695 |
| Anosmia, n (%) | 22 (55) | 11 (55) | 11 (55) | 1.00 | 9 (45) | 10 (50) | 1.00 | 7 (35) | 7 (35) | 1.00 | 3 (15) | 4 (20) | 1.00 |
| Diarrhea, n (%) | 7 (18) | 3 (15) | 4 (20) | 1.00 | 0 (0) | 3 (15) | 0.231 | 0 (0) | 1 (5) | 1.00 | 0 (0) | 0 (0) | - |
| Abdominal pain, n (%) | 2 (5) | 2 (10) | 4 (20) | 0.661 | 1 (5) | 3 (15) | 0.605 | 0 (0) | 1 (5) | 1.00 | 0 (0) | 1 (5) | 1.00 |
Disclaimer/Publisher’s Note: The statements, opinions and data contained in all publications are solely those of the individual author(s) and contributor(s) and not of MDPI and/or the editor(s). MDPI and/or the editor(s) disclaim responsibility for any injury to people or property resulting from any ideas, methods, instructions or products referred to in the content. |
© 2024 by the authors. Licensee MDPI, Basel, Switzerland. This article is an open access article distributed under the terms and conditions of the Creative Commons Attribution (CC BY) license (https://creativecommons.org/licenses/by/4.0/).
Copyright: This open access article is published under a Creative Commons CC BY 4.0 license, which permit the free download, distribution, and reuse, provided that the author and preprint are cited in any reuse.


