
Submitted:
10 December 2024
Posted:
10 December 2024
You are already at the latest version
Abstract
Aim: Meal sequencing of macronutrients has been shown to ameliorate postprandial glucose excursion, but its effects in daily meals has not been investigated. We examined the impact on the glucose response to meal sequencing in healthy Japanese adults using Continuous Glucose Monitoring (CGM) during a typical lunch meal.
Method: The test meal was a Japanese set meal or a beef and rice bowl, the contents of which were categorized as "rice" or "non-rice". In the meal experiments, subjects ingested the two categories of food in one of three orders: non-rice before rice, non-rice and rice together, and non-rice after rice. In the beef and rice bowl experiments, the subjects ingested either non-rice 15 minutes before rice or the two foods together. The postprandial glucose level was measured over a 4 h period and the mean level of postprandial glucose was significantly lower than that when eating rice before non-rice or both together.
Results and Conclusion: Consuming non-rice before rice significantly reduced postprandial glycemic excursions in healthy adults in both experiments. Meal-sequencing by “eat carbs last” is a feasible dietary strategy for better prevention and management of diabetes.
Keywords:
meal sequence
; incretin
; diabetes
; diet therapy
; glucose monitoring
Introduction
Blood glucose level fluctuates in nature under the sophisticated homeostatic system in healthy individuals. The deterioration of the homeostasis such as the decrease of insulin secretory capacity and the increase of insulin resistance cause the impaired glucose tolerance manifesting as persistent postprandial elevation of blood glucose begins in pre-diabetes. Impaired glucose tolerance in prediabetes is associated with increased risk of cardiovascular disease and microvascular complications [1,2,3,4]. Early dietary intervention for prediabetes is advantageous for lowering the risk of diabetes and diabetic complications.
Postprandial glucose homeostasis is orchestrated by various factors, including nutrient quantity and composition, gastric emptying rate, the incretins glucagon-like peptide-1(GLP-1) and glucose-dependent insulinotropic polypeptide (GIP), and insulin secretion [3,5,6]. Incretins are potent insulinotropic hormones secreted from the gut upon nutrient loading; approximately two-thirds of the insulinotropic effect of incretins are elicited by GIP and the other third by GLP-1 [7]. GLP-1 and cholecystokinin, but not GIP, are reported to delay gastric emptying by regulating its rate according to the macronutrient content of food [10,11,12,13]. There are reports that preloading of fat and protein enhances incretin secretion and delays gastric emptying [14,15,16,17] in advance of carbohydrate-induced glucose elevation. Meal sequencing thus presents an avenue to mitigation of postprandial glycemic rises in healthy individuals as well as those with prediabetes for better health outcomes.
What order you eat for managing the glycemic fluctuation has been reported for certain foods. The ingestion of whey protein or olive oil 30 min before mashed potato was reported to suppress glucose excursions [5,18]. In our earlier study, we demonstrated that ingesting meat or fish (protein and fat) 15 minutes before rice (carbohydrate) suppressed postprandial glucose elevation by promoting incretin secretion and reducing gastric motility [19] However, neither the content nor the time intervals of the meals tested in previous studies are feasible to be directly applied to daily meals. There remains limited evidence to generalize the meal sequencing in an application of dietary therapy for healthy people or people with diabetes. To clarify the efficiency of meal sequencing for a daily meal, we investigated the effects of meal sequencing for a Japanese meal plate in mitigating postprandial glucose excursions by using Continuous Glucose Monitoring (CGM).
Materials and Methods
Participants
Healthy volunteers between 20 and 50 years of age with body mass index 16-30 kg/m2 were enrolled. Height, body weight, BMI, and blood samples at study entry were taken; blood glucose, glycated hemoglobin, total cholesterol, LDL cholesterol, HDL cholesterol, triglycerides, and standard indices of renal and hepatic function were determined. We excluded volunteers with allergic symptoms to the adhesives used in continuous glucose monitoring sensors, those with a history of gastrointestinal tract surgery, and those pregnant or potentially pregnant during the study period.
Ethics
The study was conducted at Kansai Electric Power Hospital, a single facility in Osaka, Japan, according to the principles of the Declaration of Helsinki. The protocol was approved by the Ethics Committee of Kansai Electric Power Hospital (UMIN registration number: UMIN000047131). Written informed consent was obtained from all participants.
Study Design
The study is a randomized, crossover, non-blinded design. Participants wore continuous glucose monitoring devices (FreeStyle Libre, Abbott Laboratories) for 14 days. A typical Japanese set meal (1913-2219 kJ, P 14.8-25.6 g; F 8.9-16.0 g; C 68.3-79.1 g) or a beef and rice bowl (2625 kJ, P 19.4 g; F 20.4 g; C 87.6 g) was employed as lunch. The meal contained 120g steamed rice (796 kJ, P 3.0 g; F 0.4 g; C 44.5 g), a main dish, a side dish, soup, and dessert (fruit or gelatin), and was prepared in the cafeteria of Kansai Electric Power Hospital under the guidance of a dietitian. The food items included varied from day to day but were grouped as "rice" and "non-rice". Non-rice included main dishes, side dishes, soup, and dessert. For the meal experiments, 5 meal sequences were: (1) non-rice 15 minutes before rice (-15 dish), (2) non-rice 10 minutes before rice (-10 dish), (3) non-rice 5 minutes before rice (-5 dish), (4) whatever order participants preferred (together), and (5) non-rice 15 minutes after rice (+15 dish). There was no restriction on the order in which the non-rice elements were eaten. The beef and rice bowl contained 220 g steamed rice (1549 kJ, P 5.5 g; F 0.7 g; C 81.6 g) with simmered beef and onions on top (1076 kJ, P 13.9 g; F 19.7 g; C 6.0 g) and was grouped into "rice" and "non-rice". The 2 meal sequences were: (1) non-rice 15 minutes before rice (-15beef) and (2) rice and non-rice consumed together (0beef). The respective test meals were eaten on 7 separate days in random order after 4 hours fast. The subjects’ CGM was scanned just before the test and the time to start the second course was set. The participants were monitored for compliance and maintained a normal level of physical activity for the duration of the study. The CGM-measured postprandial glucose concentrations over a 4 h period were collected; results are expressed as mean ± SD. Statistical analysis was performed using Repeated Measures ANOVA. Only for the comparison of mean levels of postprandial glucose in the analysis on rice bowls, the paired t-test was used. P-value <0.05 was considered as statistically significant.
Results
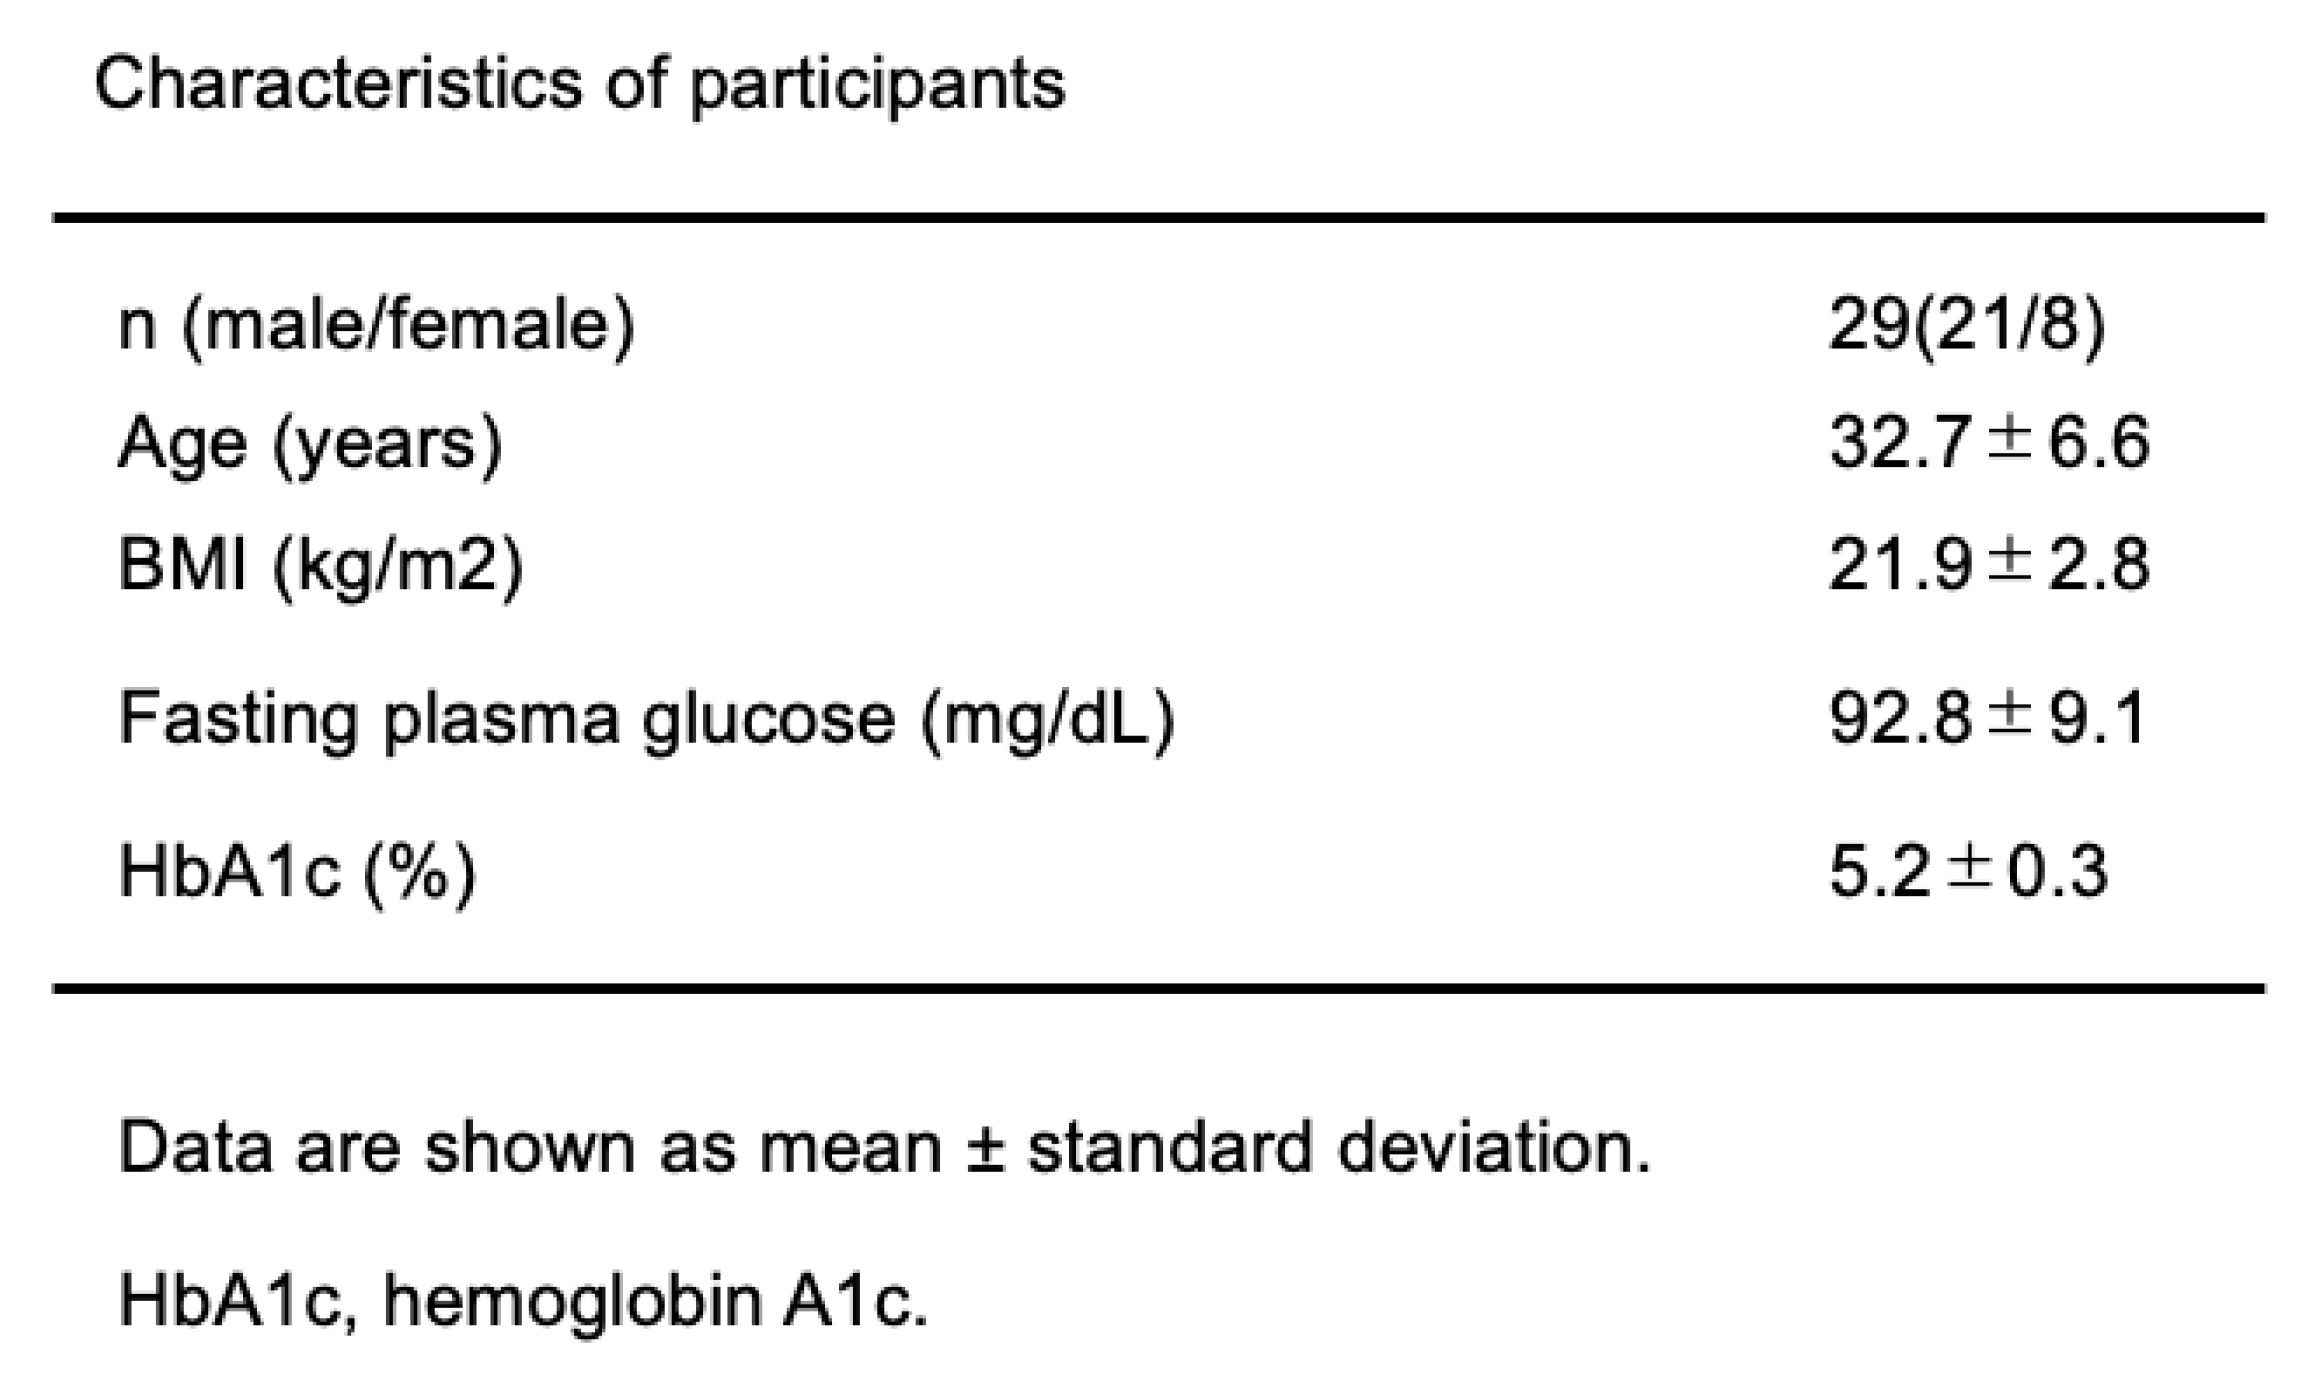
Twenty-nine healthy volunteers were included in the study. The average age ± SD was 32.7 ± 6.6 years, BMI was 21.9 ± 2.8 kg/m2, and HbA1c was 5.2 ± 0.3%. The clinical characteristics are shown in Table 1. The daily activities and dietary habits of participants were asked to continue with their normal routine and fast for four hours before eating the test meals at lunch.
In the meal experiment, we primarily aimed to test whether eating rice last does efficiently suppress the postprandial glycemic rise regardless of the differences in menus. We also discussed how much time should be left between eating rice and non-rice food. The participants consumed a designated meal plate, the menus of which is daily changing, at lunch following the designated eating orders. The postprandial glycemic changes had monitored by CGM wore on at least two days before starting the experiment. Meal sequencing was examined by dividing the test meal into two parts, rice and non-rice elements, and whether the rice was eaten first, the non-rice elements first, and how long to wait before eating rice after starting to eat non-rice elements as thoroughly written in the Method section. They followed their individual schedules for the meal sequencing, which means a randomized trial.
As a result, the glucose levels levels of postprandial glucose over four hour period were significantly lower when non-rice was consumed before rice (-5dish, -10dish, and -15dish) than when rice was consumed first (15dish) or when rice and non-rice were consumed together (0dish) (Figure 1a). The peak glucose levels were significantly lower when non-rice was consumed before rice (-5dish, -10dish, and -15dish) than when rice was consumed first (15dish): (-5dish 145.2±26.3 mg/dL; -10dish 152.8±27.1 mg/dL; -15dish 148.4±33.0 mg/dL; 15dish 169.5±25.8 mg/dL) (Figure 1b). When comparing eating carbohydrates first or last in healthy subjects, the postprandial blood glucose rise was significantly higher when carbohydrates were eaten first. In addition, eating rice at 5, 10 or 15 minutes after starting to eat non-rice elements was shown to be superior to eating rice first in all cases, reducing the postprandial rise in blood glucose. This result suggested at least 5 min to wait for eating carbohydrates after start eating meals.
In the beef and rice bowl experiment, we primarily aimed to teat the effectiveness of separating side dishes and rice as in a set meal rather than a rice bowl menu. The meal sequencing followed as the protocol written in the Method section.
As a result, the mean level of the postprandial glucose over four hour period was significantly lower when non-rice was consumed before rice (-15beef) than when rice and non-rice were consumed together (0beef) (Figure 2a). The peak glucose level was significantly lower when rice and beef plate was consumed separately (-15beef) than when beef rice bowl (0 beef) was consumed (140.6±25.4 mg/dL vs 158.1±28.1 mg/dL, p<0.01, paired t-test), and the peak of postprandial glycemia was delayed in -15beef compared to that in 0beef (Figure 2b). The results show that eating set meal style, such as rice and side dishes, and eating rice last, rather than beef bowls as rice bowl menus, suppresses the post-meal rise in blood glucose. Interestingly, eating simmered beef before rice made the slope of glycemic rise milder than eating a beef rice bowl, which was not observed in the meal plate experiments. There is a distinction in the effects of meal sequencing within a menu or PFC content, which required the further study.
Discussion
In this study, we find that postprandial glucose excursion is suppressed when carbohydrate is consumed after protein and fat in a typical Japanese set meal in healthy adults, despite daily changes of food content in the test meal. We also compared ingestion of a beef and rice bowl when the beef was eaten before and with the rice and obtained results similar to those in the meal experiment. These findings suggest that meal sequencing by consuming carbohydrates last in a daily meal can be beneficial for the management of blood glucose in a daily meal.
Interestingly, in a previous study of healthy adults, eating rice before meat (boiled chicken) and vegetables was found to elicit greater postprandial glucose excursions than when vegetables were included with the rice [20]. However, in that study, 180g of leafy vegetable was used, which is an extraordinary condition, not a practical in the daily life. A previous study of prediabetics reported that eating chicken and vegetables for 10 minutes, followed by a 10-minute rest interval and then eating bread (carbohydrates) elicited less post-meal glucose compared with the reverse order [21]. In our prior study, we reported similar findings using an interval between fish or meat and rice of 15 minutes [19]. Thus, a series of meal sequence experiments has consistently shown that eating non-carb elements first can suppress elevation of postprandial blood glucose. However, these studies examined postprandial glucose when the interval between eating each category of food was 10-30 minutes [16,17,18,19,20,21,22], which is not appropriate for daily meals. We found similar improvement in this study using a more reasonable interval of 5 minutes between macronutrient ingestion to show that meal sequencing can be effective in daily life.
This study used continuous glucose monitoring to reveal the temporal dynamics of postprandial glucose fluctuations and provide compelling evidence of the benefit of meal sequencing in heathy individuals on a normal diet.
Even though the meal content varied in the test meal in the present study, consuming the non-rice category, a mixed protein and fat source, before the rice, a carbohydrate source, clearly mitigated postprandial glycemic elevations. Postprandial peak glycemia was similarly suppressed at -5dish, -10dish, and -15dish in the test meal. With these findings, we can generalize the idea of meal sequencing on the postprandial glycemic elevation suggested by our previous data. [19]. Interestingly, in the beef and rice bowl experiment, the postprandial increase of -15beef was delayed compared to that of 0beef, which was not the case in the meal experiment. This may be because the beef and rice bowl contained more fat than the meal, and fat retards gastric emptying; however, further study is required to confirm this. The strength of this study is that we used typical dietary content and more modest intervals that better simulate ordinary eating behavior to show that meal sequencing is both beneficial and feasible in daily life. A limitation of the study is that blood glucose was determined only by CGMS. In addition, a test meal prepared in a hospital setting was different day to day, although the total calorie and PFC balance were matched. To evaluate whether the effect of meal sequencing is effective in other cuisines, further investigation is required. In conclusion, meal-sequencing by “eat carbs last” in a typical Japanese meal plate improves postprandial glycemic excursions in healthy adults.
Author Contributions
YK: HK and YY contributed to study design and analysis, data collection, and interpretation of data and writing of the manuscript. MaM, YO, MI, SN, MiM, TH, and SM contributed to data collection, and critical revisions of the manuscript for important intellectual content. YH, YuY, and YS contributed to analysis and critical revisions of the manuscript for important intellectual content. All authors approved the version to be published.
Funding
This research was supported by Japan Agency for Medical Research and Development (AMED) under Grant Number JP23ek0210188h001.
Acknowledgments
We thank our colleagues for discussion. We are grateful to S. Horikawa of Kansai Electric Power Hospital for his valuable assistance.
Conflicts of Interest
YY received honoraria for lectures from Sumitomo Pharma Co., Mitsubishi Tanabe Pharma Corporation, and Eli Lilly Japan K.K. HK received grants from Ono Pharmaceutical Co., Taisho Pharmaceutical Co. and Novo Nordisk Pharma Ltd.; and honoraria for lectures from Sanofi K.K. and Taisho Pharmaceutical Co. YH received grants from Sumitomo Pharma Co. and Nippon Boehringer Ingelheim Co., Ltd.; and honoraria for lectures from Novo Nordisk Pharma Ltd., Eli Lilly Japan K.K., Daiichi Sankyo Company, Mitsubishi Tanabe Pharma Corporation, Taisho Pharmaceutical Co., MSD K.K. and Sumitomo Pharma Co. YS has received grants from Nippon Boehringer Ingelheim Co., Ltd., ARKRAY Marketing, Inc., Taisho Pharmaceutical Co., Ltd., Novo Nordisk Pharma Ltd., Terumo Corporation and Sumitomo Pharma Co.; and honoraria for lectures from Taisho Pharmaceutical Co., Ltd., Nippon Becton Dickinson Company, Ltd., Novo Nordisk Pharma Ltd., Eli Lilly Japan K.K., Sumitomo Pharma Co., Ltd. and Ono Pharmaceutical Co., Ltd. DY received grants from Terumo Corporation, Nippon Boehringer Ingelheim Co., Ltd., Novo Nordisk Pharma Ltd., Taisho Pharmaceutical Co., Ltd. and ARKRAY, Inc.; and honoraria for lectures from Novo Nordisk Pharma Ltd., Nippon Boehringer Ingelheim Co., Ltd., Eli Lilly Japan K.K., Sanofi K.K., Sumitomo Pharma Co. and Kyowa Kirin Co., Ltd. YuiY has received honoraria for lectures from Ono Pharmaceutical Co., Ltd., Sumitomo Pharma Co., Ltd., Novo Nordisk Pharma Ltd. and Teijin Pharma Limited. The other authors declare no conflict of interest.
References
- Okada A, Kaneko H, Matsuoka S, et al. Association of cardiovascular health metrics with annual incidence of prediabetes or diabetes: Analysis of a nationwide real-world database. J. Diabetes Invest. 2023; 14: 452-462. [CrossRef]
- Ceriello A, Esposito K, Piconi L, et al. Oscillating glucose is more deleterious to endothelial function and oxidative stress than mean glucose in normal and type 2 diabetic patients. Diabetes. 2008; 57: 1349-1354. [CrossRef]
- Jin J and Lu P. Association between prediabetes and retinopathy: a meta-analysis. Horm. Metab. Res. 2021; 53: 801-809. [CrossRef]
- Diurlin S, Lindblad, Daka B. Persisting prediabetic conditions and glomerular filtration rate - A longitudinal study. Prim. Care Diabetes 2022; 16: 597-599. [CrossRef]
- Ahrén B. Glucose-dependent insulinotropic polypeptide secretion after oral macronutrient ingestion: The human literature revisited and a systematic study in model experiments in mice. J Diabetes Invest. 2022; 13: 1655-1665. [CrossRef]
- Kuwata H, Yabe D, Murotani, et al. Effects of glucagon-like peptide-1 receptor agonists on secretions of insulin and glucagon and gastric emptying in Japanese individuals with type 2 diabetes: A prospective, observational study. J Diabetes Invest. 2021; 12: 2162-2171. [CrossRef]
- Nauck MA and Meier JJ. GIP and GLP-1: Stepsiblings rather than monozygotic twins within the incretin family. Diabetes 2019; 68: 897-900. [CrossRef]
- Holst JJ, Gribble F, Horowits M, et al. Roles of the gut in glucose homeostasis. Diabetes Care 2016; 39: 884-892. [CrossRef]
- Rayner CK, Samsom M Jones KL, et al. Relationships of upper gastrointestinal motor and sensory function with glycemic control. Diabetes Care 2001; 24: 371-38. [CrossRef]
- Phillips LK, Deane AM et al. Gastric emptying and glycaemia in health and diabetes mellitus. Nat Rev Endocrinol 2014; 11: 112-128. [CrossRef]
- Phillips LK, Rayner CK, Jones KL, Horowitz M. Measurement of gastric emptying in diabetes. J Diabetes Complication 2014; 28: 894-903. [CrossRef]
- Seino, Y, Kuwata, H, Yabe, D. Incretin-based drugs for type 2 diabetes: Focus on East Asian perspectives. J. Diabetes Investig. 2016; 7 (Suppl. 1): 102-109. [CrossRef]
- Wu T, Rayner CK, Jones K et al. Dietary effects on incretin hormone secretion. Vit Horm 2010; 84: 81-110. [CrossRef]
- Feinle C, O'Donovan D Doran S, et al. Effects of fat digestion on appetite, APD motility, and gut hormones in response to duodenal fat infusion in humans. Am J Physiol Gastrointest Liver Physiol 2003; 284: G798-807. [CrossRef]
- Nauck MA, Vardarli I Deacon CF, et al. Secretion of glucagon-like peptide-1 (GLP-1) in type 2 diabetes: what is up, what is down? Diabetologia 2010; 54: 10-18. [CrossRef]
- Wu T, Little TJ, Bound MJ, et al. A Protein Preload Enhances the Glucose-Lowering Efficacy of Vildagliptin in Type 2 Diabetes. Diabetes Care 2016; 39: 511-517. [CrossRef]
- Ma J, Stevens JE, Cukier K et al. Effects of a protein preload on gastric emptying, glycemia, and gut hormones after a carbohydrate meal in diet-controlled type 2 diabetes. Diabetes Care 2009; 32: 1600-1602. [CrossRef]
- Gentilcore D, Chaikomin R, Jones KL, et al. Effects of fat on gastric emptying of and the glycemic, insulin, and incretin responses to a carbohydrate meal in type 2 diabetes. J Clin Endocrinol Metab 2006; 91: 2062-2067. [CrossRef]
- Kuwata H, Iwasaki M, Shimizu S, et al. Meal sequence and glucose excursion, gastric emptying and incretin secretion in type 2 diabetes: a randomised, controlled crossover, exploratory trial. Diabetologia 2016; 59: 453-461. [CrossRef]
- Sun L, Goh HJ, Govindharajulu P, et al. Postprandial glucose, insulin and incretin responses differ by test meal macronutrient ingestion sequence (PATTERN study). Clin Nutr. 2020; 39: 950-957. [CrossRef]
- Shukla AP, Dickison M, Coughlin N, et al. The impact of food order on postprandial glycaemic excursions in prediabetes. Diabetes Obes Metab. 2019; 21: 2: 377-81. [CrossRef]
- Bae JH, Kim LK, Min SH, et al. Postprandial glucose-lowering effect of premeal consumption of protein-enriched, dietary fiber-fortified bar in individuals with type 2 diabetes mellitus or normal glucose tolerance. J. Diabetes Investig. 2018; 9: 1110-1118. [CrossRef]
- Trico D, Baldi S, Tulipani A, et al. Mechanisms through which a small protein and lipid preload improves glucose tolerance. Diabetologia 2015; 58: 2503-2512. [CrossRef]
- Kong F, Singh RP. Disintegration of solid foods in human stomach. J Food Sci 2008; 73: R67-80. [CrossRef]
Figure 1.
CGM-measured postprandial glucose concentrations in the Japanese set meal. (a) Time course curves for glucose levels. (b) Postprandial glucose peak. Two-way repeated measures ANOVA was used. Data are the mean ± standard error of the mean. *P< 0.05.
Figure 1.
CGM-measured postprandial glucose concentrations in the Japanese set meal. (a) Time course curves for glucose levels. (b) Postprandial glucose peak. Two-way repeated measures ANOVA was used. Data are the mean ± standard error of the mean. *P< 0.05.
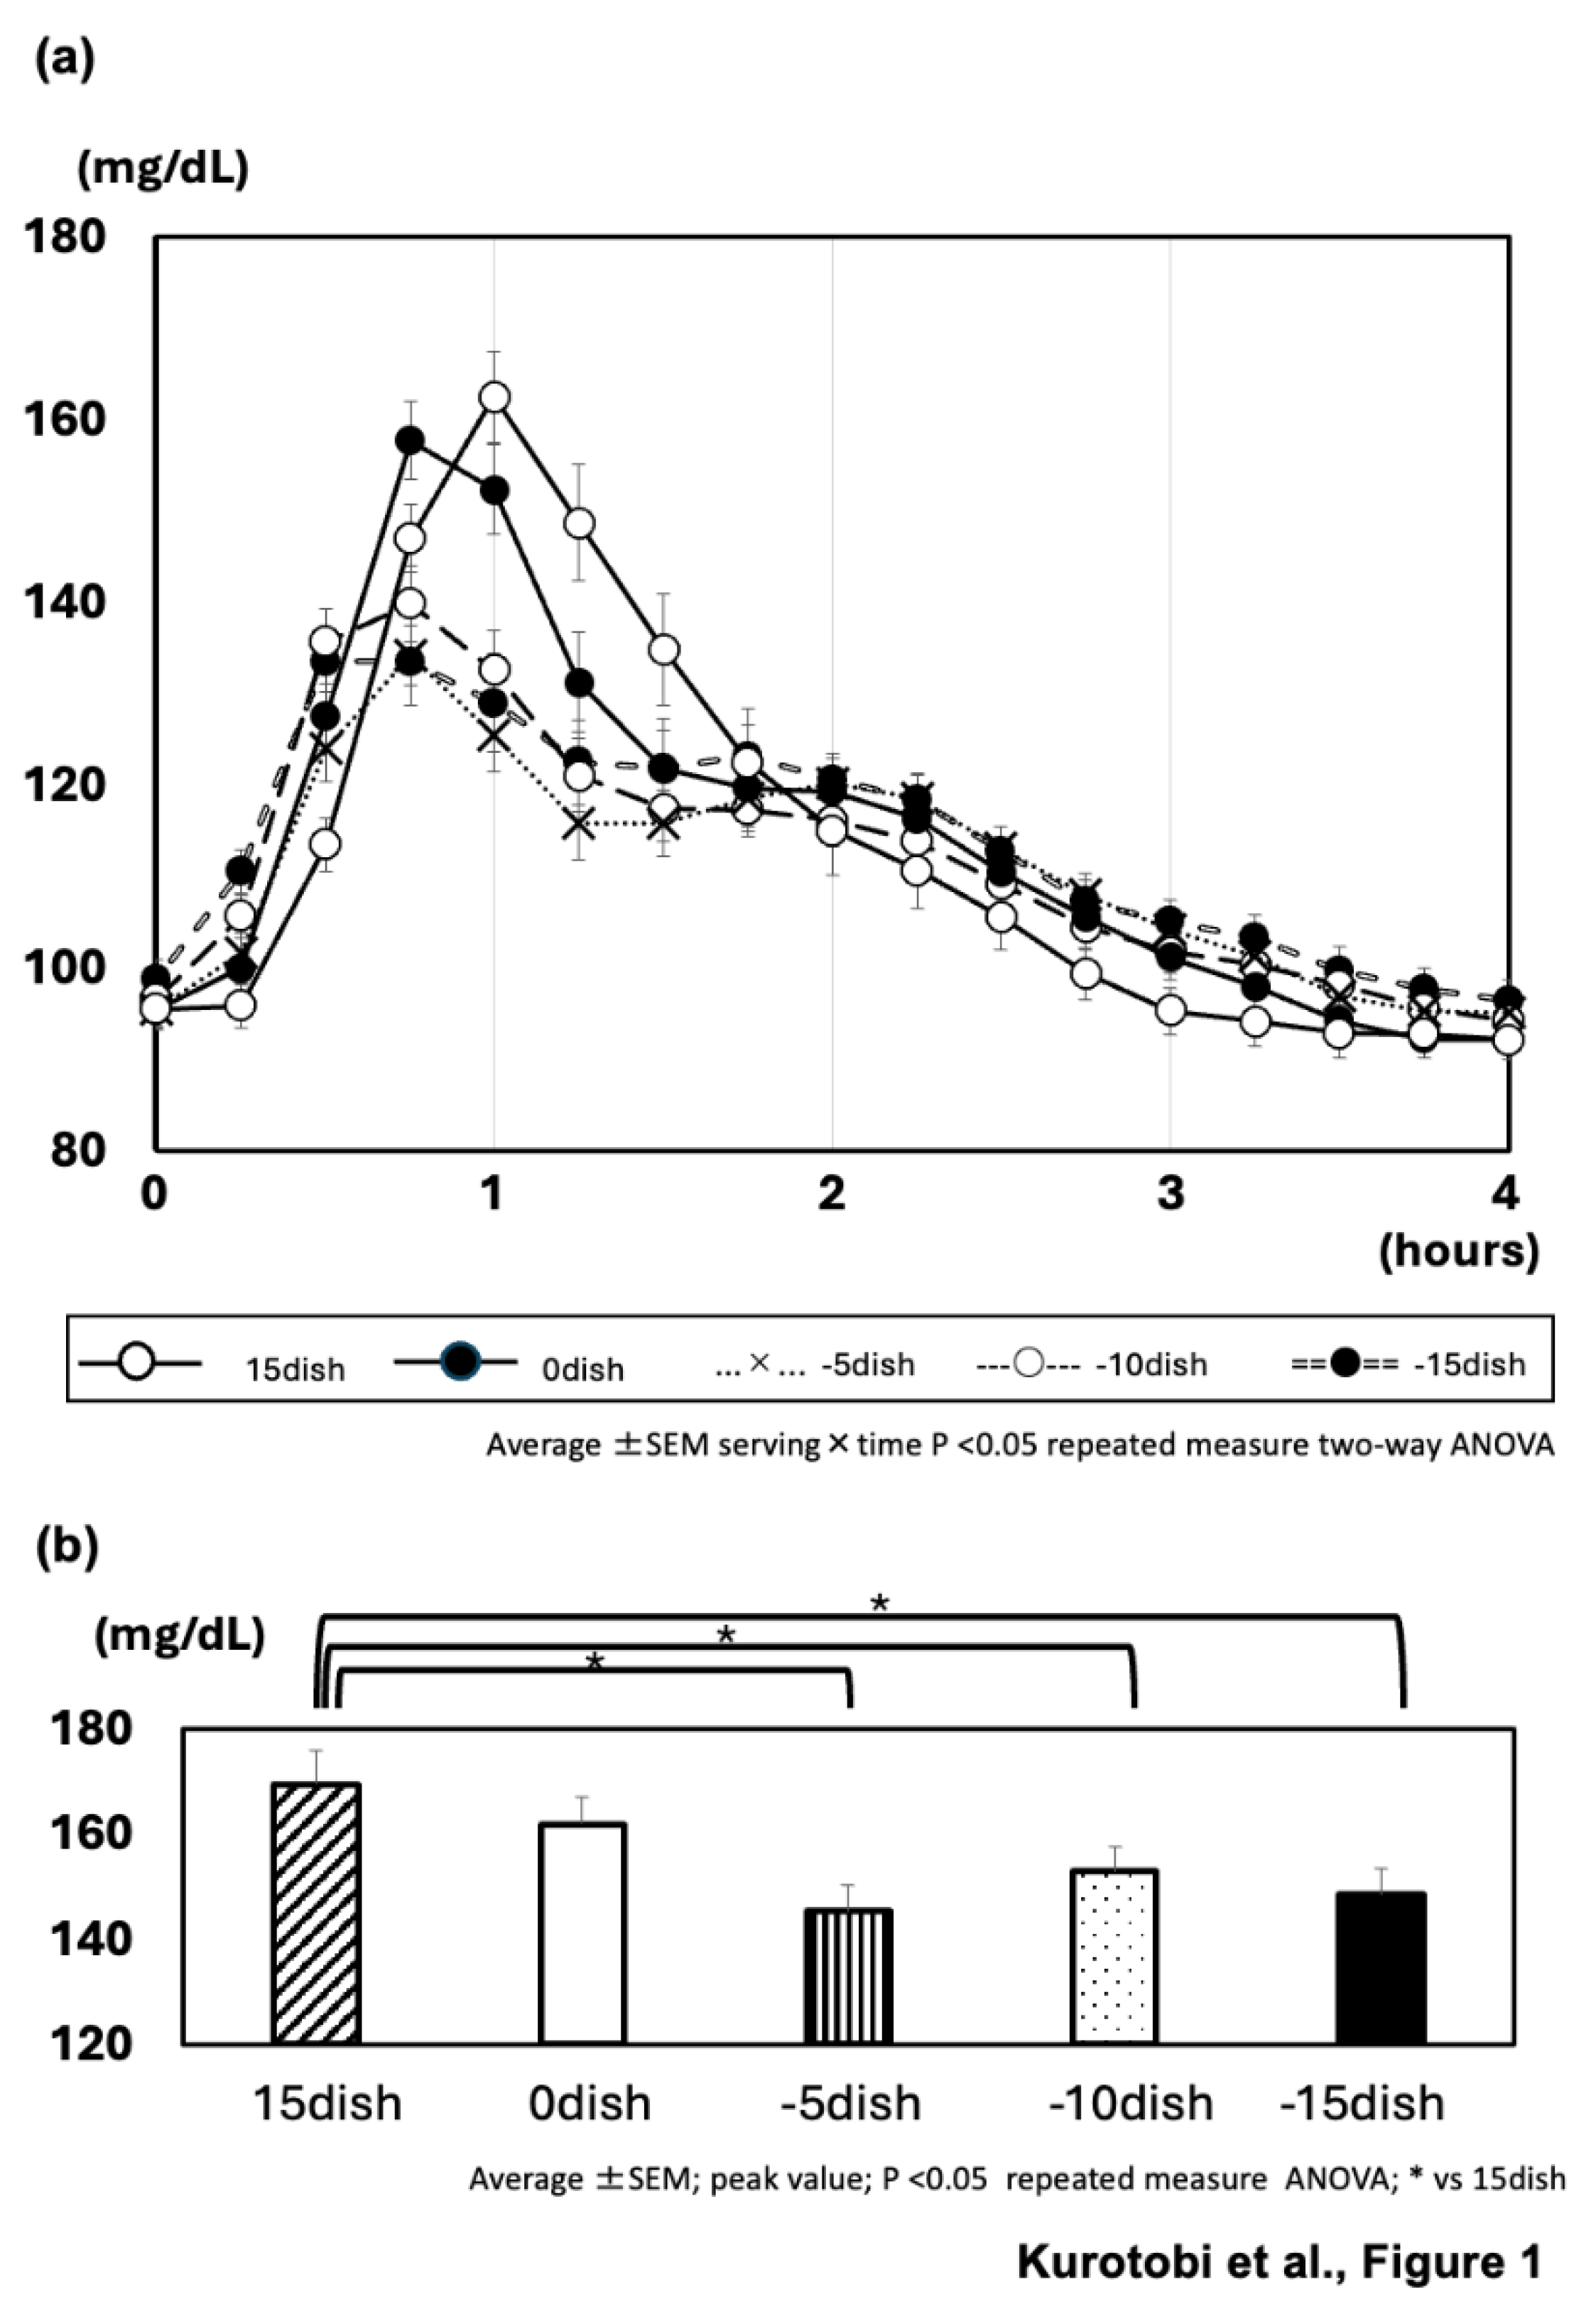
Figure 2.
CGM-measured postprandial glucose concentrations in the beef bowl meal. (a) Time course curves for glucose levels. Two-way repeated measures ANOVA was used. (b) Postprandial glucose peak analyzed by paired t-test. Data are the mean ± standard error of the mean. *P< 0.05, **P< 0.01.
Figure 2.
CGM-measured postprandial glucose concentrations in the beef bowl meal. (a) Time course curves for glucose levels. Two-way repeated measures ANOVA was used. (b) Postprandial glucose peak analyzed by paired t-test. Data are the mean ± standard error of the mean. *P< 0.05, **P< 0.01.
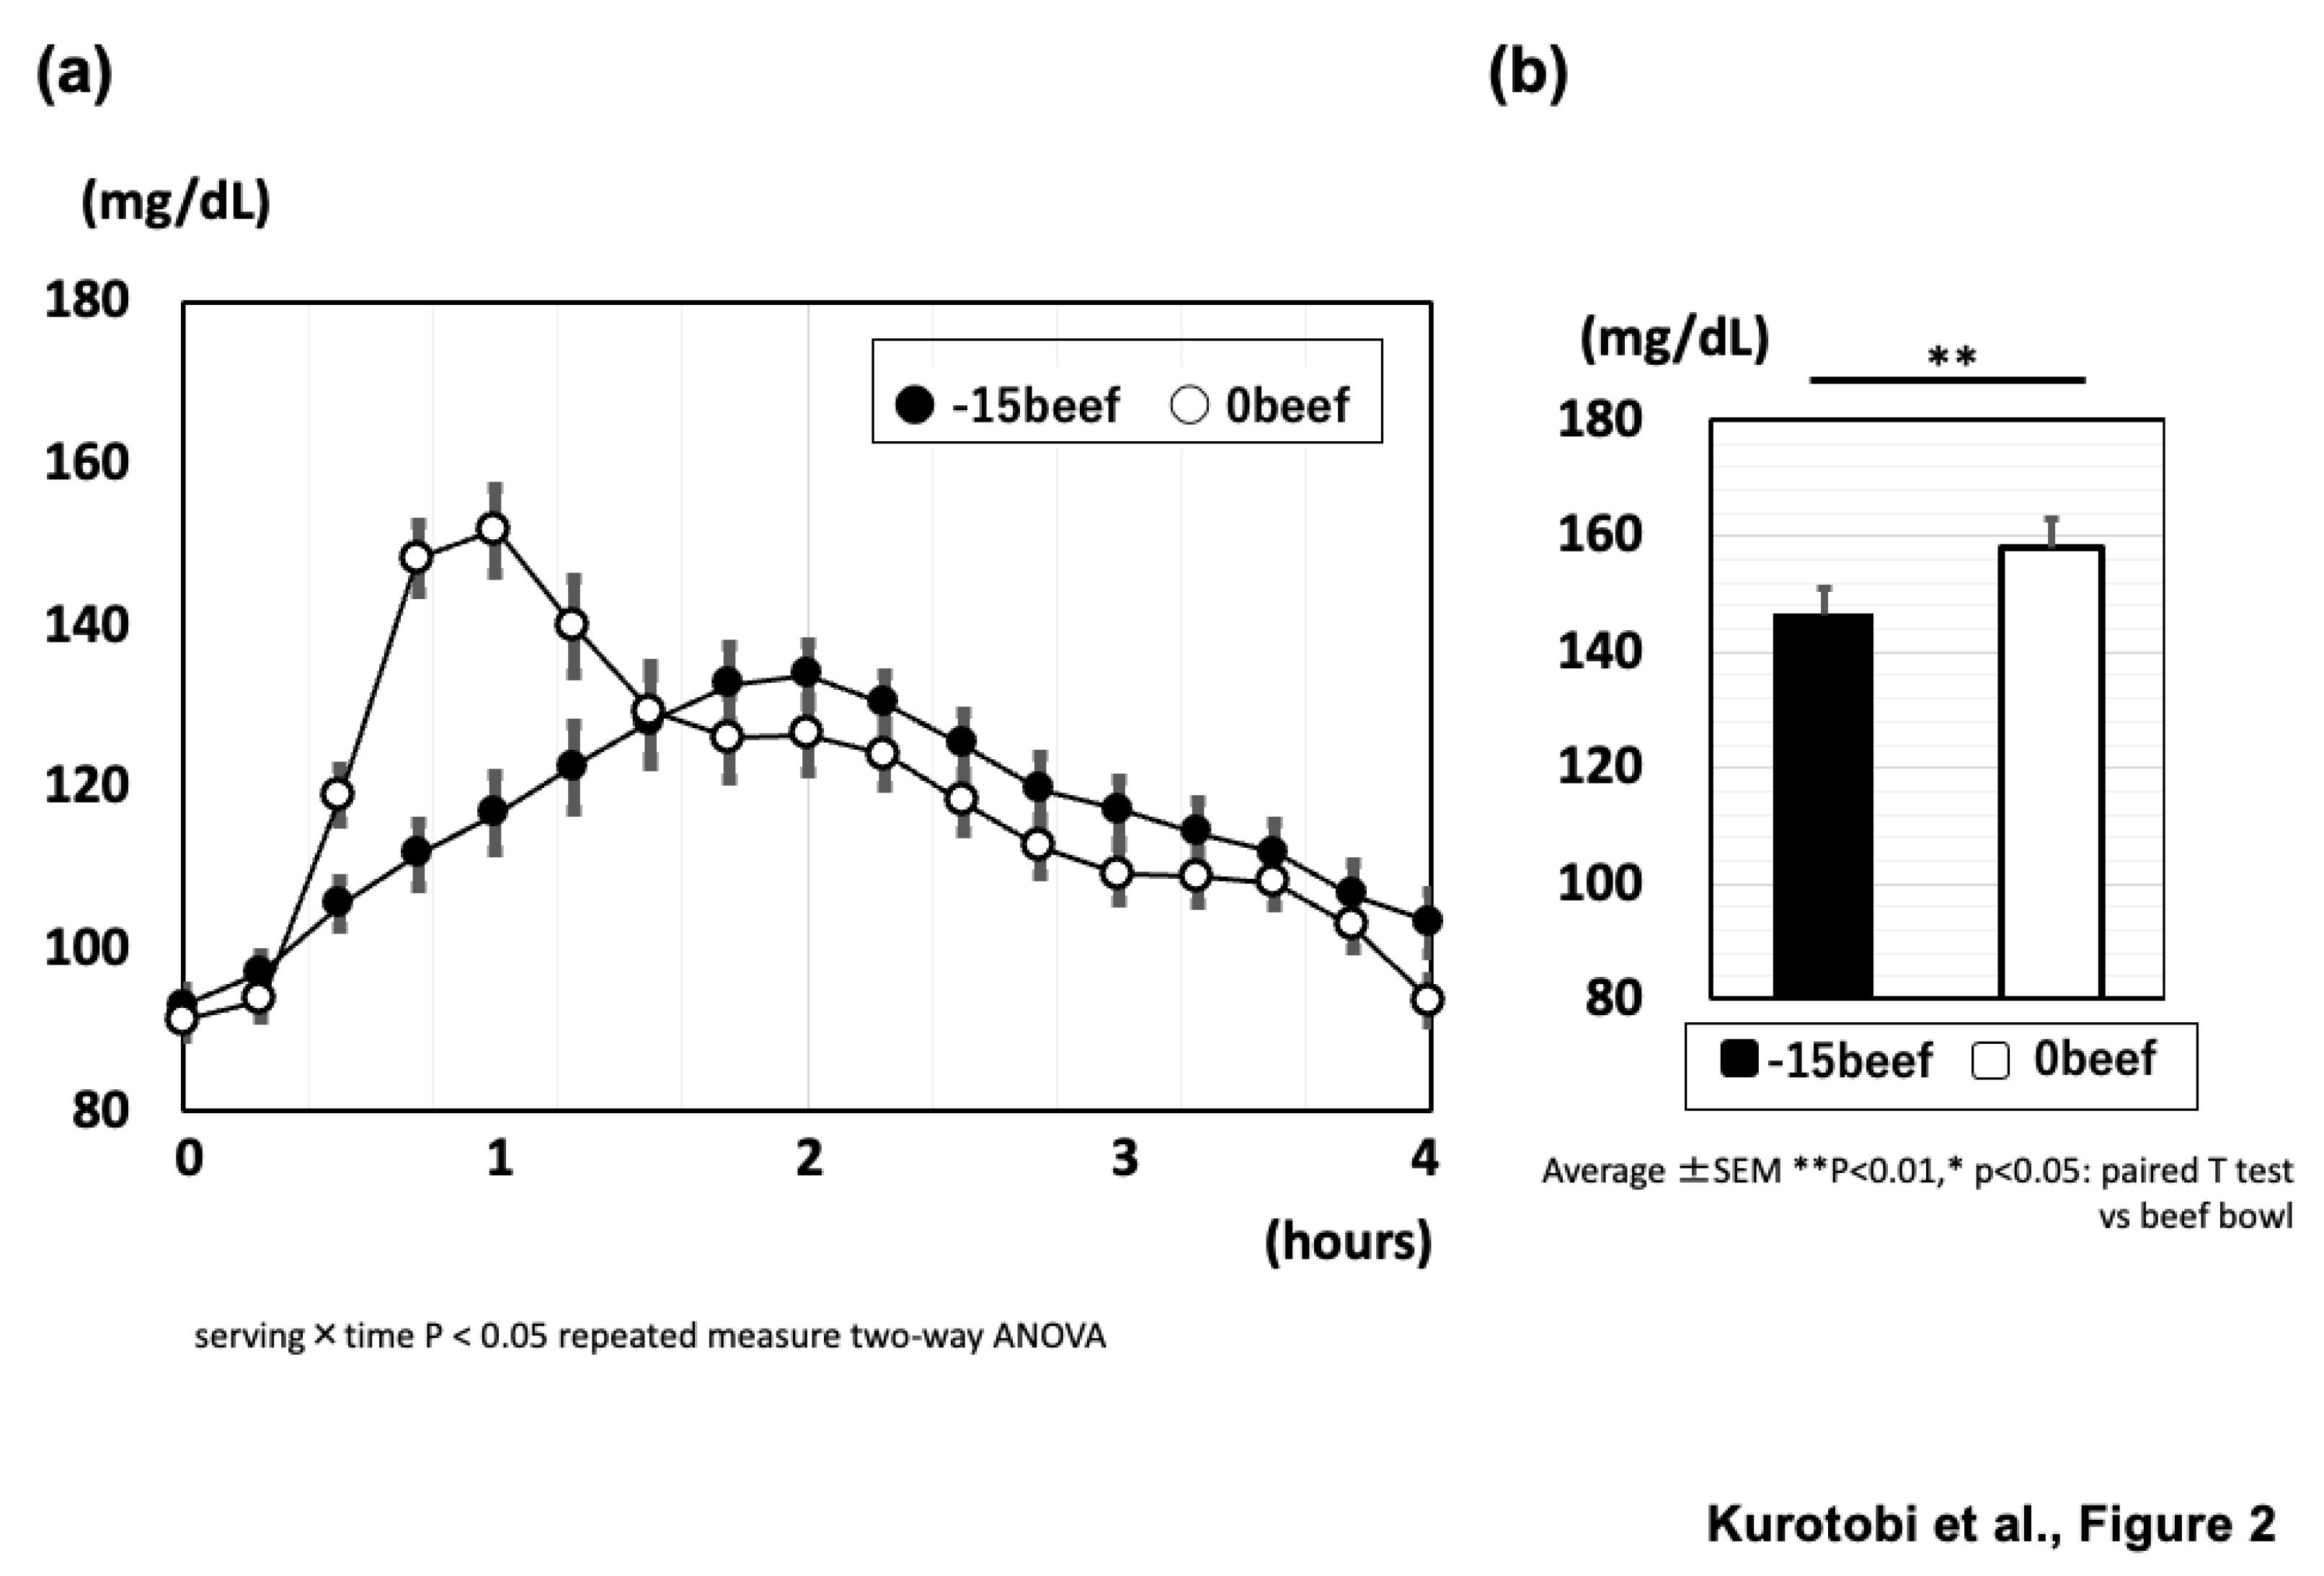

Table 1.
Characteristics of participants. Data are shown as mean ± standard deviation. HbA1c, hemoglobin A1c.
Table 1.
Characteristics of participants. Data are shown as mean ± standard deviation. HbA1c, hemoglobin A1c.
 |
Disclaimer/Publisher’s Note: The statements, opinions and data contained in all publications are solely those of the individual author(s) and contributor(s) and not of MDPI and/or the editor(s). MDPI and/or the editor(s) disclaim responsibility for any injury to people or property resulting from any ideas, methods, instructions or products referred to in the content. |
© 2024 by the authors. Licensee MDPI, Basel, Switzerland. This article is an open access article distributed under the terms and conditions of the Creative Commons Attribution (CC BY) license (https://creativecommons.org/licenses/by/4.0/).
Copyright: This open access article is published under a Creative Commons CC BY 4.0 license, which permit the free download, distribution, and reuse, provided that the author and preprint are cited in any reuse.


