
Submitted:
06 December 2024
Posted:
10 December 2024
You are already at the latest version
Abstract
In this study, we propose a queuing model for the Toll Plan system, designed to manage vehicle flow through toll booths within the Indian transportation infrastructure. The Toll Plan focuses on optimizing toll booth utilization, reducing driver wait times, and improving overall traffic efficiency. Analyzing queuing behavior at toll booths, we develop a mathematical model to accurately represent vehicle arrival patterns, service times, and queue lengths. The model incorporates key operational factors such as the number of toll booths, traffic volume, and vehicle types. To reflect varying traffic conditions, we examine scenarios for both peak and off-peak hours, capturing fluctuations throughout the day. Using queuing theory principles, we derive critical performance metrics—including average wait times, queue lengths, and service rates—that provide actionable insights into the Toll Plan's efficiency.Additionally, the model is employed for sensitivity analysis and optimization of the Toll Plan's configuration. We investigate strategies such as increasing toll booth capacity, introducing electronic tolling systems and implementing dynamic pricing schemes to evaluate their effects on system performance. These findings offer toll booth operators practical guidance for improving the Toll Plan's design, ensuring smoother traffic flow and enhanced efficiency. Overall, this queuing model serves as a valuable tool for analyzing and enhancing toll booth operations. By leveraging insights from the model, toll authorities can reduce congestion, improve operational efficiency, and significantly enhance the commuting experience for drivers relying on the Toll Plan system.
Keywords:
Devihalli Tollable
; NH-75 Highway
; Passenger Car Unit (PCU)
; Space Mean Speed
; Traffic Volume
; Design Capacity
; Toll Plaza Traffic Analysis
; Road Width Impact
; Traffic Flow Measurement
; Manual Counting
; Automatic Counting
; Video Analysis
; Tollable Length
; Traffic Congestion
; Vehicle Load Intensity
; Pavement Characteristics
; Uniform Traffic Distribution
; Highway Traffic Estimation&mid
Chapter 1: Introduction
Toll plazas play a crucial role in managing vehicular movement and maintaining the flow of traffic across highways and major road networks. In countries like India, where the transportation infrastructure is under constant pressure due to high traffic volumes, toll booth operations must balance efficiency, cost-effectiveness, and user convenience. However, challenges such as long wait times, uneven traffic distribution, and congestion at toll plazas often disrupt this balance, leading to inefficiencies that impact both commuters and operators. To address these challenges, this study introduces a comprehensive queuing model for the Toll Plan system, aimed at optimizing toll booth operations. By leveraging queuing theory principles, the model provides a mathematical framework to analyze and predict traffic behavior, including vehicle arrivals, service times, and queue lengths. This approach not only enhances operational performance but also informs decision-making processes for improving the overall efficiency and reliability of toll plazas.
In this paper, we explore the dynamics of toll booth operations through the lens of queuing theory, integrating critical factors such as traffic volume, vehicle types, and peak-hour variations. By examining diverse scenarios and evaluating potential optimization strategies, the proposed model serves as a valuable tool for enhancing toll plaza operations in India’s transportation network.
1.1. General
The toll processing operations on a national highway typically involve a systematic set of procedures designed to ensure efficiency, accuracy, and convenience for both operators and commuters. These steps are outlined as follows:
Toll Plaza Setup: Toll plazas are strategically positioned along national highways to facilitate toll fee collection. Toll booths and designated lanes are established to streamline the process.
Vehicle Approach: Vehicles approaching the toll plaza are directed to appropriate lanes using clear signage and road markings. Drivers must reduce speed and adhere to traffic regulations as they approach the toll booths.
Vehicle Classification: Vehicles are classified based on attributes such as size, weight, and type to determine the applicable toll fee. This step ensures fair and accurate tolling for all vehicle categories.
Toll Collection: Toll fees are collected through various methods, including:
Cash payments: Drivers pay the toll fee in cash at the booth.
Electronic Toll Collection (ETC): Payments are processed electronically via RFID tags or other automated systems.
RFID-based systems: Vehicles equipped with RFID tags allow for seamless toll fee deduction.
Toll Ticket Validation: For cash transactions, toll tickets are issued to drivers as proof of payment. These tickets typically include details such as the toll plaza entry point and the amount paid.
Toll Booth Operations: Toll booth operators are responsible for maintaining a steady flow of vehicles through the lanes, reducing delays, and ensuring an orderly process.
Traffic Management: To manage fluctuations in traffic volume, particularly during peak hours or congestion, toll plaza authorities implement effective traffic management techniques such as lane prioritization or dynamic lane allocation.
Auditing and Revenue Management: Regular audits are conducted to verify toll collections, detect discrepancies, and prevent fraud. This step ensures transparency and accountability in revenue management.
Maintenance and Upkeep: Routine maintenance is essential to ensure the smooth functioning of toll booths, electronic systems, and related infrastructure. This includes repairing road surfaces, updating software systems, and servicing equipment.
Customer Service: Toll Plaza operators provide support to drivers by addressing inquiries, resolving complaints, and helping when required. Effective customer service enhances the overall commuter experience.
These procedures may vary depending on the specific toll system employed and the regulations of the country. However, the overarching goal remains consistent:
Figure 1.
Toll Plaza Architecture.
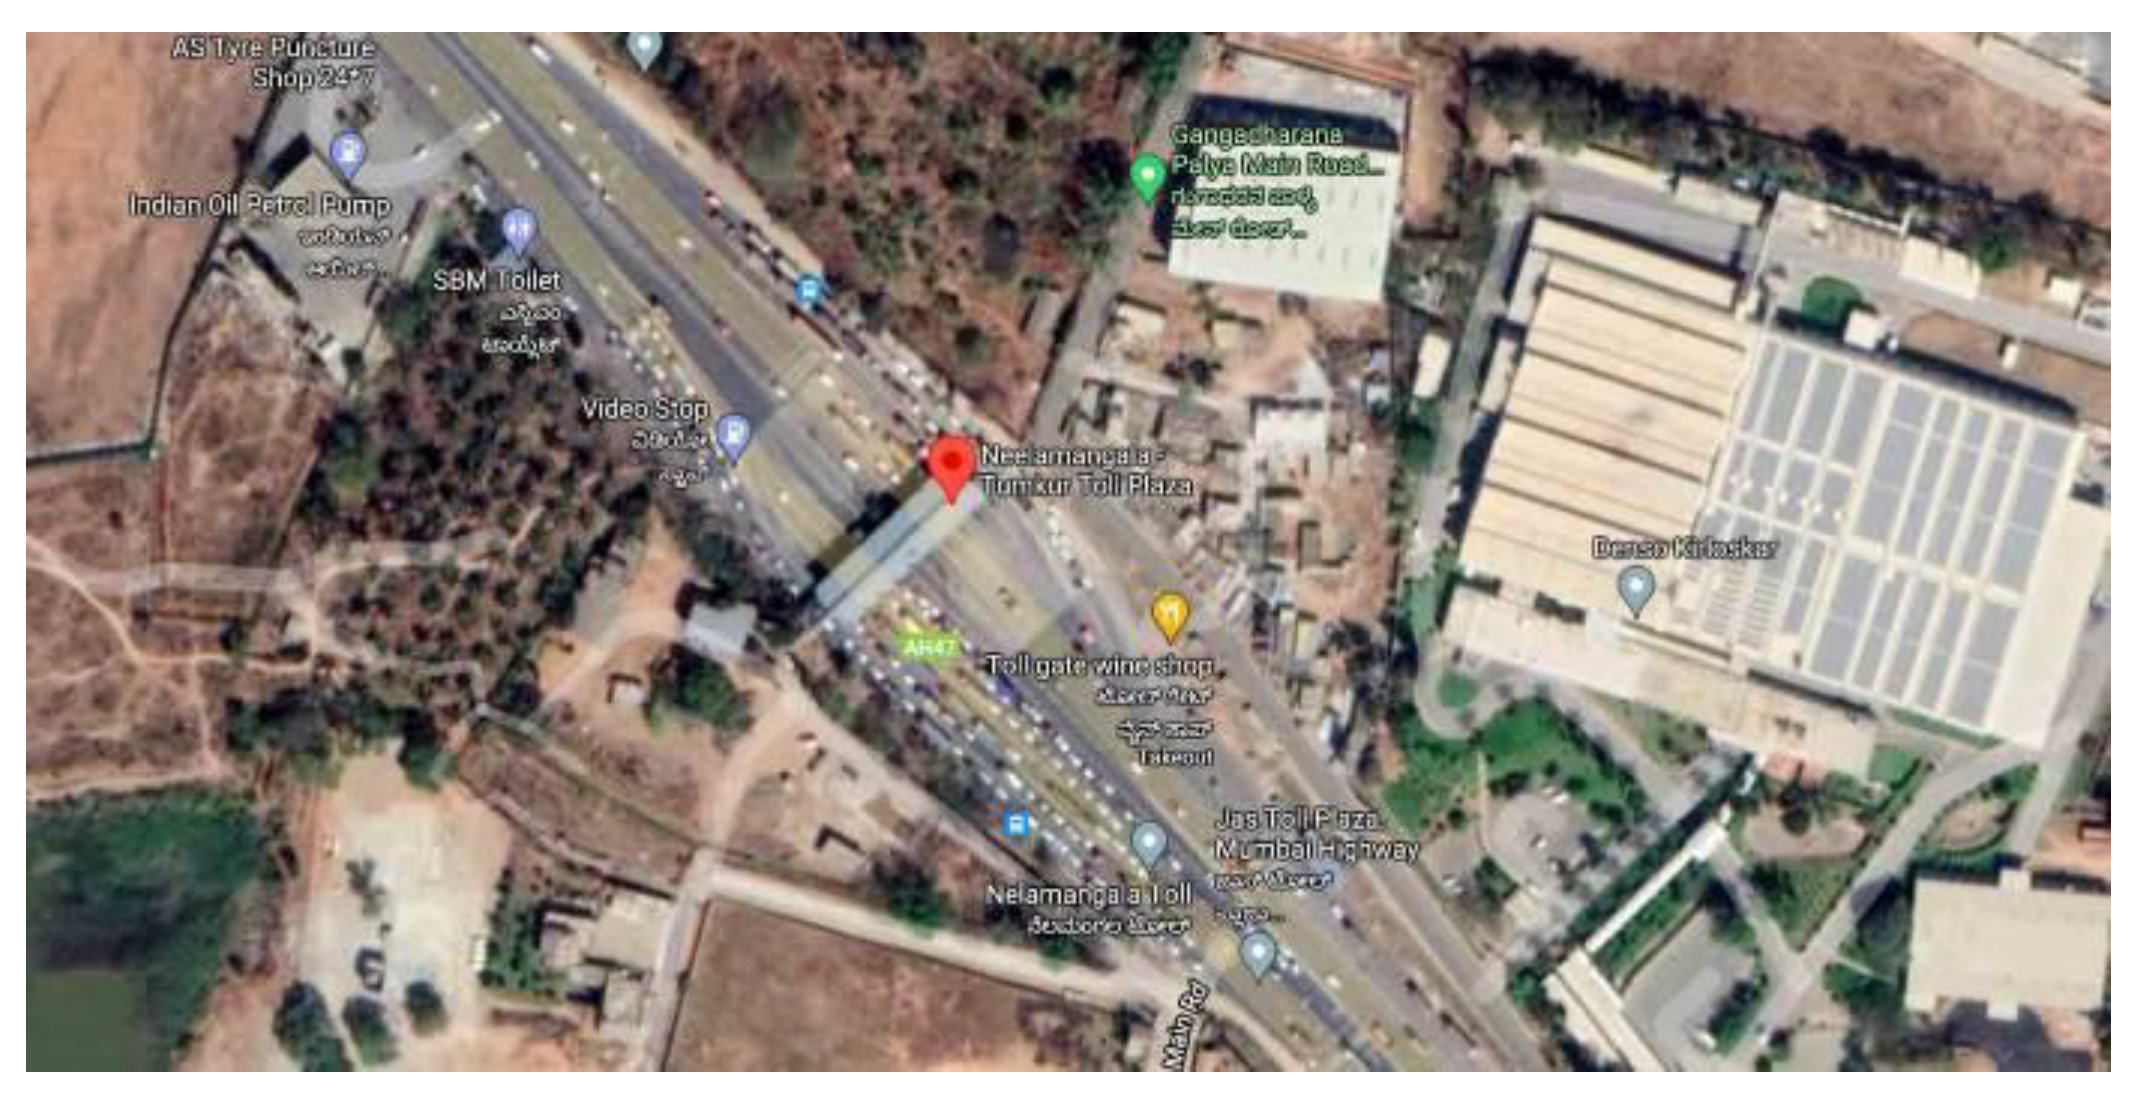
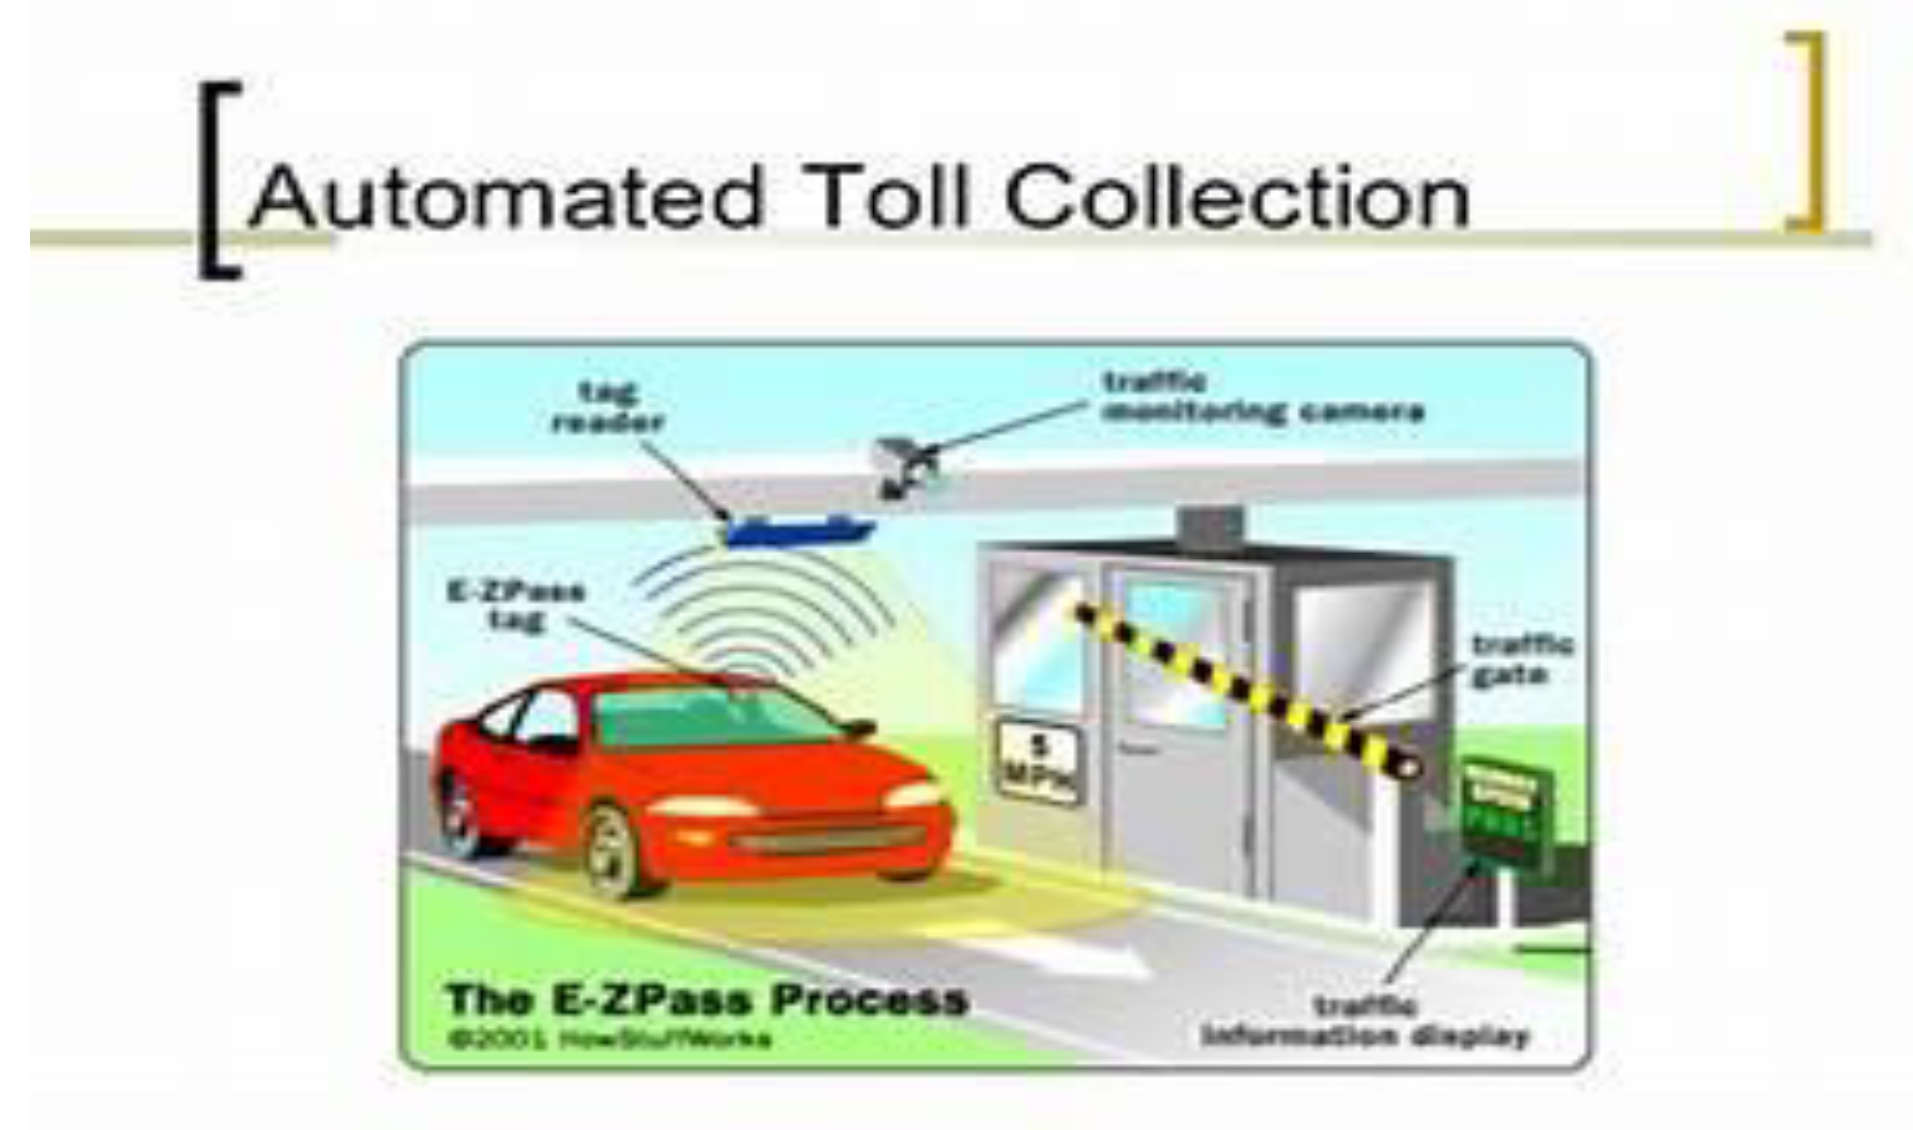
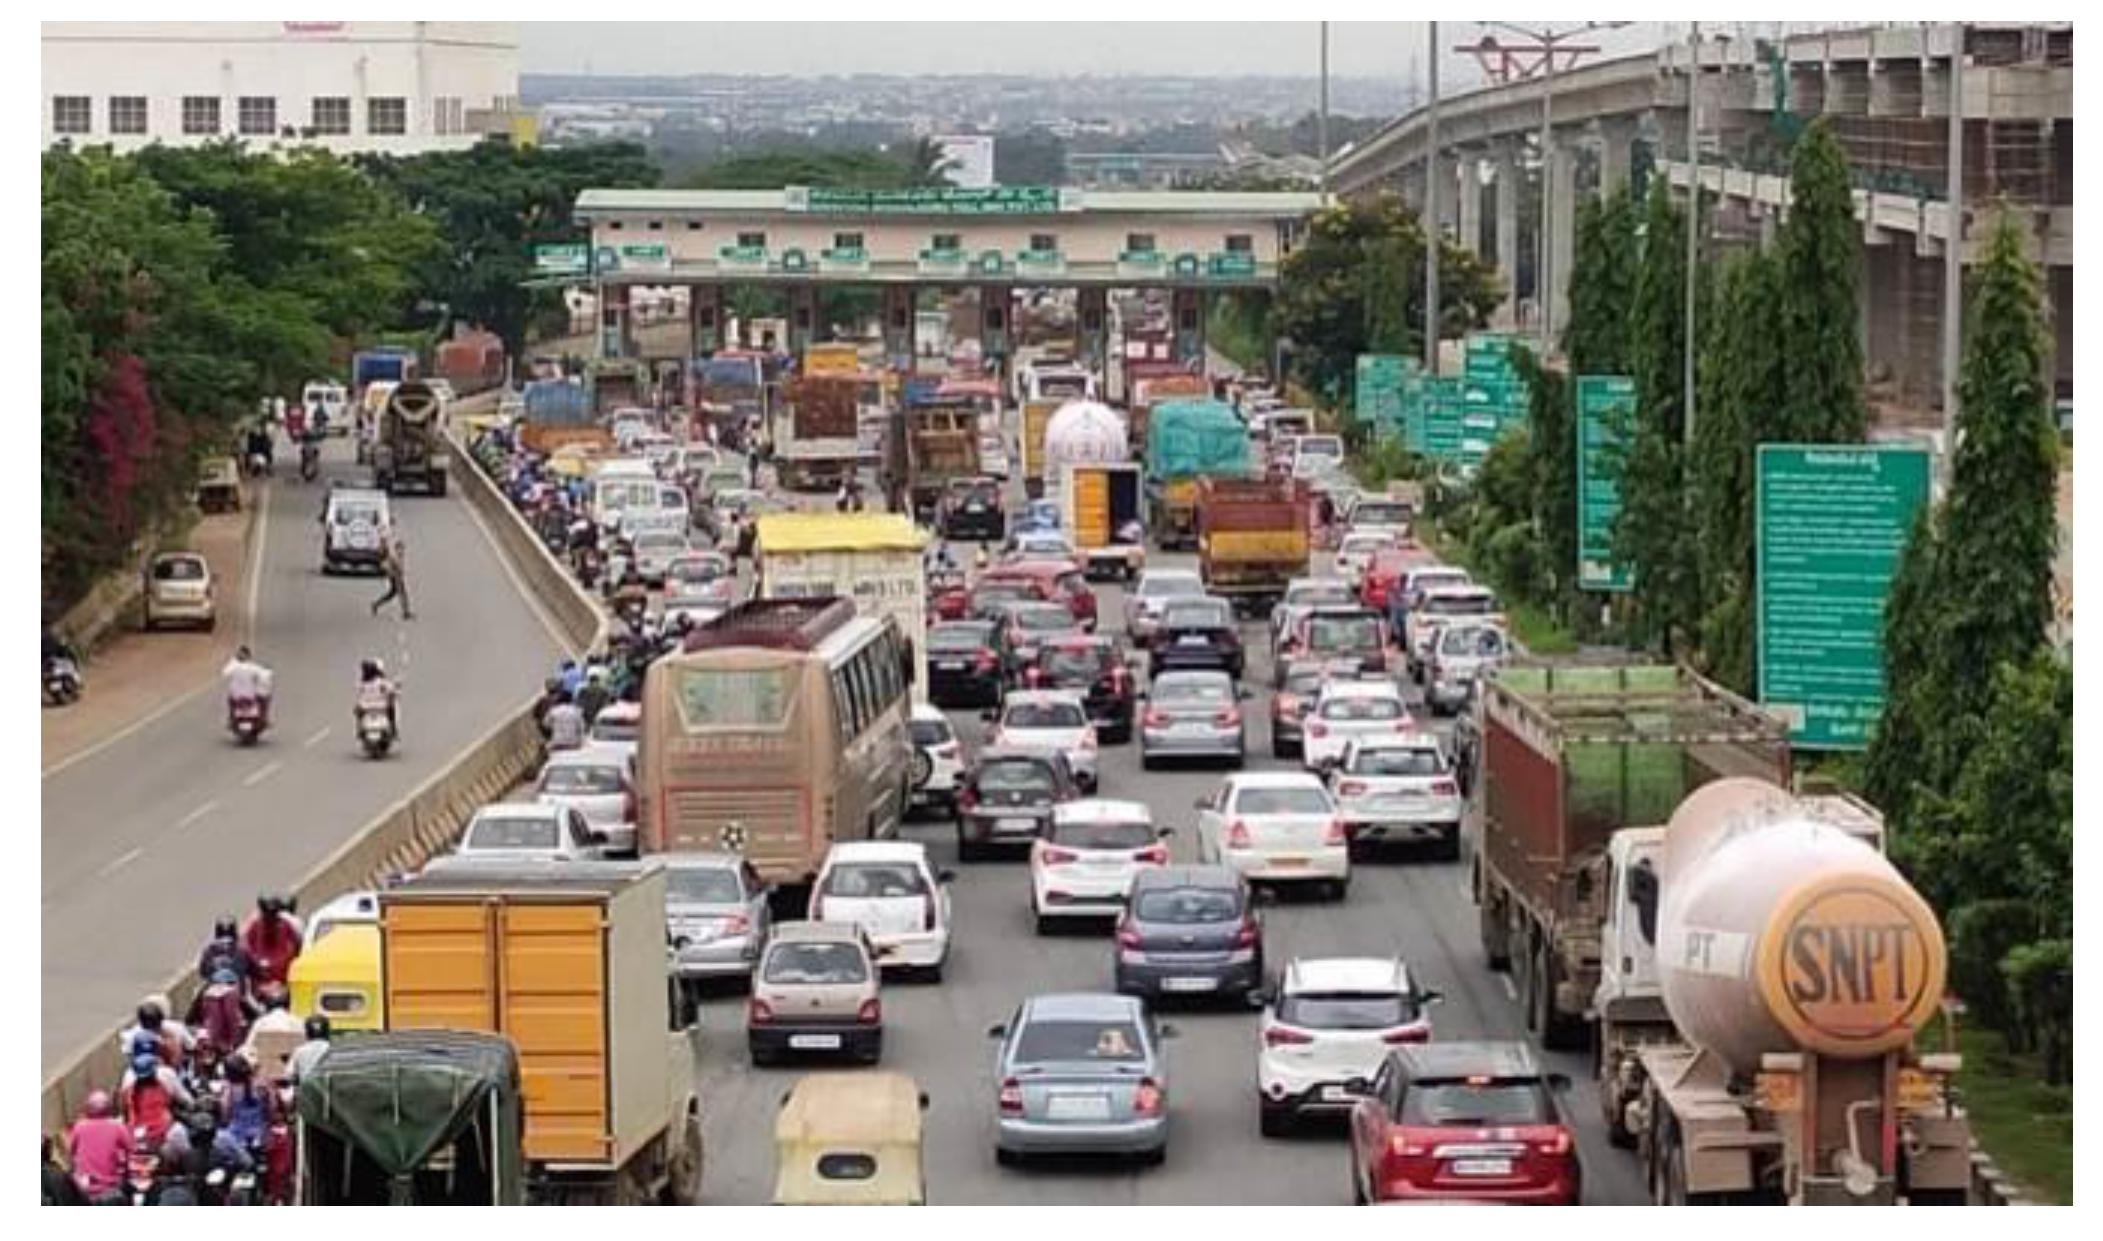
While the implementation of RFID-enabled toll payment systems offers numerous advantages, certain drawbacks persist, particularly during peak hours. During these times, vehicles queue up to access toll booths, and after making their payments, drivers often face delays as they jostle for position when multiple lanes merge back into the original road width near the toll plaza. A study conducted at two toll plazas—Hosur and Neelmangala—located in the urban area of Bengaluru, Karnataka, provides insights into these challenges (refer to Figure 2). The analysis suggests that implementing this technology can save an estimated 7 minutes of travel time per vehicle, potentially benefiting over 10 vehicles per minute. Additionally, this optimization could support the removal of one toll gate and the adjacent service lane area running parallel to the highway, further streamlining traffic flow.
1.2. Background
The mismatch between the number of toll gates and vehicle volume, coupled with slow processing speeds, the absence of dedicated lanes for different vehicle types, and reliance on human supervision, leads to congestion and significant delays at toll plazas. On average, vehicles spend 15–20 minutes passing through toll plazas on national highways. During peak hours, this delay increases, with toll plazas on the Bengaluru–Hosur NH and Neelmangala NH recording average wait times of 20–30 minutes.
To tackle these inefficiencies, solutions such as real-time notifications of waiting times and the allocation of dedicated lanes for specific vehicle categories can enhance traffic flow. These initiatives reduce waiting times without necessitating additional workforce or constructing new toll gates. Moreover, these enhancements help conserve fuel, improve traffic management, and minimize delays. Incorporating technology into existing toll plaza infrastructure enables the creation of smart transportation solutions that collect real-time data to optimize operations and address congestion proactively.
This research identifies the critical challenges in toll plaza operations and proposes strategies to streamline vehicle movement, reduce queuing times, and enhance operational efficiency. A case analysis explores how freight transportation can be improved by optimizing existing road and highway infrastructure to alleviate long queues at toll plazas on state highways (SH) and national highways (NH).
The purpose of toll plazas should go beyond fee collection to minimize drivers' travel time on highways. However, toll plazas frequently impede the throughput and capacity of the roads they serve, particularly during peak traffic hours. This study presents actionable solutions to mitigate these adverse effects and enhance the overall efficiency of highway operations.
- Scope of Study
In this study, an effort has been made to analyze the operational dynamics of toll plazas and identify the key physical and virtual elements that influence toll operations. The research involves collecting data on the geometric attributes of toll plazas, vehicle arrival patterns at merging areas, and the progression of vehicles through queuing zones and service areas.
Toll plazas have become a critical means of revenue generation for the Ministry of Transport, India, supporting the National Highways Authority and State Highway Transportation Authorities. Elevated and express highways, as well as private highways, have recently integrated with the FASTag system for seamless toll fee collection. Understanding queuing patterns is vital to developing methods for optimizing toll plaza layouts and operations. This includes improving service rates at toll booths, increasing capacity, and reducing long vehicle queues.
- Doddakarenahalli
- (Neelmangala) (BOT (Toll))
- Doddakarenahalli
- Km 32.600 – NH-75 in Karnataka
- Doddakarenahalli
- Stretch: Neelmangala Junction to Devihalli Tollable
- Doddakarenahalli
- Length : 40.131 Km(s)
Figure 4.
Neelmangala Toll Plaza Live Traffic Monitoring.
1.5. Methodology
Toll plazas are designed to efficiently collect tolls, manage traffic, and maintain road infrastructure while ensuring transparency and compliance with regulations. The adoption of electronic toll collection (ETC) systems, such as FASTag, has enhanced the speed and convenience of toll collection for both operators and road users. The methodology for toll plaza operations encompasses the following key components:
- Toll Collection Booths:
- Toll collection is facilitated through a combination of toll collectors for manual payments, and ETC systems like FASTag for automated processing.
- Toll Rates:
- Toll charges are determined based on:
- The type of vehicle (e.g., passenger car, bus, truck).
- Vehicle size and number of axles.
- The distance traveled on the toll road.
- Toll Collection Methods:
- Cash Payment: Toll collectors manually accept cash payments, issue receipts, and provide change if needed.
- FASTag (ETC): A widely used electronic toll collection system in India that facilitates seamless toll processing and reduces waiting times at toll plazas.
- Vehicle Classification:
- Vehicles are categorized into distinct classes based on:
- The number of axles.
- Vehicle dimensions.
- Vehicle purpose (e.g., passenger or commercial).
- Each classification corresponds to a specific toll rate, ensuring fairness and consistency.
- Toll Booth Infrastructure:
- Toll booths are equipped with essential features such as barriers or gates to regulate vehicle entry and exit.
- Lane Management:
- Dedicated lanes are provided for:
- Passenger vehicles, buses, and trucks.
- Separate lanes for ETC users (e.g., FASTag) and cash payments to optimize traffic flow and reduce delays.
- Traffic Management:
- Smooth traffic flow is ensured through:
- Traffic management personnel.
- Clear signage to direct drivers to appropriate lanes.
- Display boards with information on toll rates and payment methods.
- Security Measures:
- Security is enforced to prevent toll evasion and unauthorized access:
- CCTV cameras for real-time monitoring.
- Security personnel stationed at key points.
- Use of barriers and automatic gates to control vehicle access.
- Record Keeping:
- Detailed records are maintained for:
- Toll collections.
- Vehicle counts.
Other operational data to ensure transparency, enable audits, and support data-driven decision-making.
This comprehensive methodology ensures toll plazas operate efficiently while maintaining compliance, enhancing road user convenience, and reducing operational inefficiencies. The integration of ETC systems like FASTag plays a pivotal role in modernizing toll collection and minimizing congestion at toll plazas.
Chapter 2: Literature Review
2.1. General
A literature review on queuing models encompasses a wide-ranging, multidisciplinary domain with applications across diverse fields such as operations research, computer science, telecommunications, and transportation. These models are pivotal in analyzing and optimizing systems that involve waiting lines or queues. Below is an overview of some essential concepts and key literature around queuing models: The M/M/1 queue is a foundational model in queuing theory, characterized by a single server, Poisson arrival processes, and exponential service times. Its simplicity and versatility make it a cornerstone in the study of queueing systems and provide a basis for more advanced models. The M/M/c queue extends the M/M/1 model by incorporating multiple servers, allowing for the analysis of systems with more complex service structures and improved performance metrics.
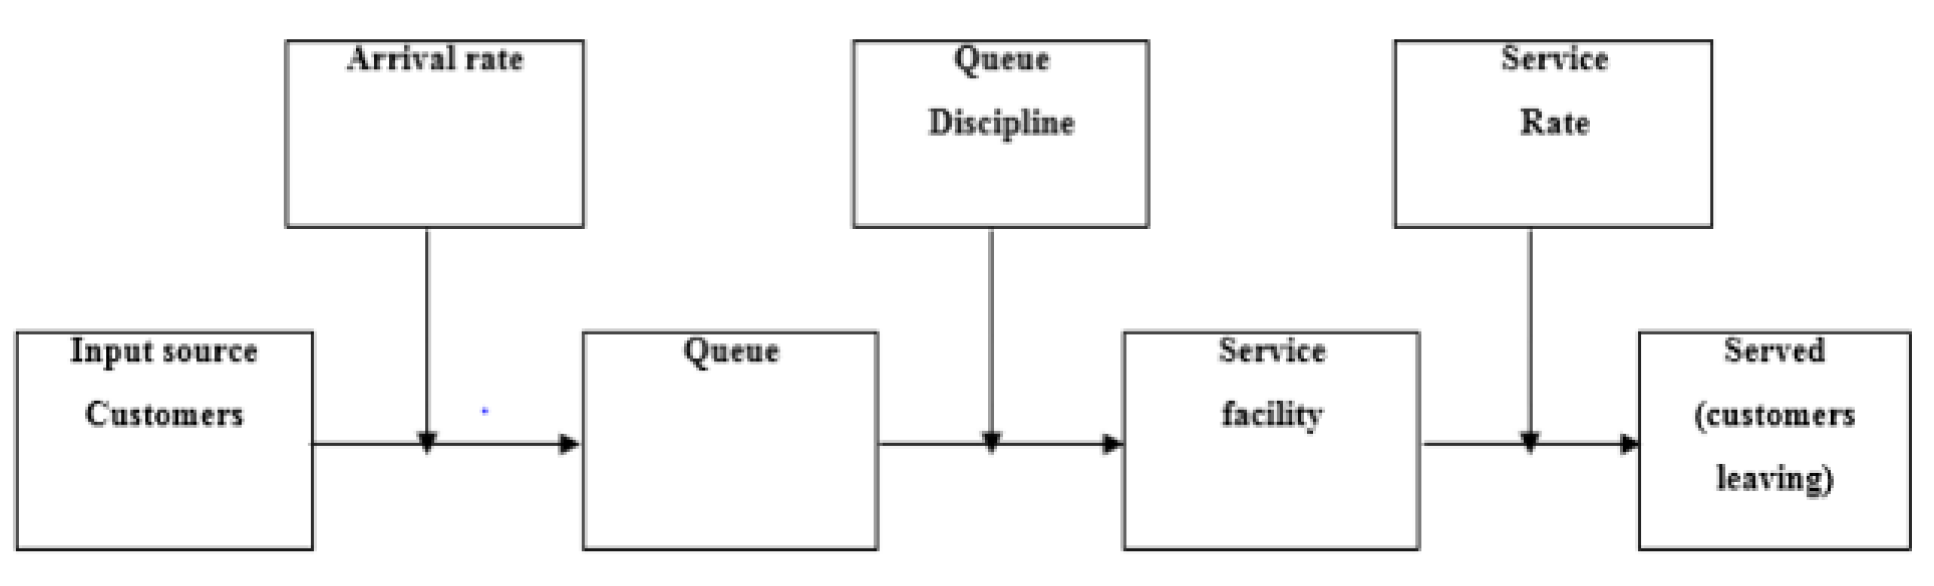
2.2. Characteristics of Queuing System
Understanding and managing the key characteristics of queuing systems is essential for optimizing performance and ensuring efficient customer service across various sectors, including transportation, healthcare, telecommunications, and manufacturing. The following are the primary characteristics of queuing systems:
- Arrival Rate (λ): The rate at which customers or entities arrive at the queue. This rate can be modeled using different probability distributions, such as Poisson or deterministic arrivals.
- Interarrival Time: The time between consecutive arrivals, often following a specific statistical distribution.
- Service Rate (μ): The rate at which customers are served by the system. Service times can follow various probability distributions, depending on the nature of the service.
- Service Time: The duration required to serve a customer.
- FIFO (First-In-First-Out): In FIFO systems, the first customer to arrive is the first to be served, adhering to the "first come, first served" principle.
- Priority Queuing: Some systems prioritize certain customers based on predefined criteria. For example, high-priority customers may be served before low-priority ones.
- Queue Length (L): The number of entities currently waiting in the queue. This metric fluctuates over time and is crucial for assessing system congestion.
- Queue Capacity: The maximum number of entities the queue can accommodate. When the queue reaches capacity, new arrivals may either be rejected or managed differently.
- Utilization (ρ): The ratio of the arrival rate (λ) to the service rate (μ). Utilization measures system efficiency, and when ρ > 1, it indicates that the system is overloaded.
- Waiting Time (W): The time customers spend waiting in the queue before being served, encompassing both physical and virtual (invisible) queue times.
- Service Time Variability: The degree to which service times fluctuate. High variability can result in longer waiting times and reduced system efficiency.
- Queue Length Variability: The extent to which the queue length fluctuates over time. Greater variability can lead to unpredictable waiting times.
- Service Channels (Servers): The number of servers available to manage customers. Queuing systems may have one or multiple servers, influencing system capacity and performance.
Figure 5.
Queueing System.
2.3. Equation
The M/M/1 queuing model is one of the most fundamental models used to describe systems with a single server, Poisson arrivals, and exponentially distributed service times. It is widely applied across fields such as telecommunications, computer systems, and operations research. The notation M/M/1 refers to the following parameters:
"M": Represents Poisson arrivals, meaning that customer arrivals follow a Poisson process, occurring randomly and independently over time.
"M": Represents exponential service times, indicating that the time required to serve a customer follows an exponential distribution.
"1": Denotes a single server in the system.
A key characteristic of the M/M/1 model is that customers arrive randomly and independently, with service occurring on a first-come, first-served basis.
The arrival rate is denoted by λ (lambda), while the service rate of the server is represented by μ (mu).
The utilization factor (ρ), which is the ratio of the arrival rate to the service rate, plays a crucial role in analyzing the system's performance.
The central equation for the M/M/1 model is Little’s Law, which relates the average number of customers in the system (L), the average time a customer spends in the system (W), and the arrival rate (λ):
𝐿=𝜆 ×𝑊
Additionally, the utilization factor (ρ) is calculated as:
𝜌=𝜆𝜇
The average number of customers in the system (L) and the average time a customer spends in the system (W) can be derived from the following formulas:
𝐿=𝜆𝜇−𝜆
𝑊=1𝜇−𝜆
These equations are essential for analyzing and optimizing the performance of a single-server queuing system with Poisson arrivals and exponentially distributed service times. They offer insights into key performance metrics, such as queue length and waiting time, and help to understand the relationship between system utilization and overall performance.
2.4. Theory Applied in Queuing Model Poisson distribution.
The Poisson distribution is a fundamental tool in queuing theory and many other fields where random arrivals or events occur independently over time. It offers a probabilistic framework for describing and analyzing such processes, making it an indispensable component of queuing models and related applications.
In queuing models, the Poisson distribution is commonly used to model the arrival process of customers or entities into a system. Specifically, it describes the random and independent arrival of customers over time. Here is how the Poisson distribution is applied in queuing models:
Arrival Rate (λ): In many queuing systems, customer arrivals are assumed to follow a Poisson process. The parameter λ (lambda) represents the average arrival rate per unit of time. For example, in a queuing system at a service center, λ might represent the average number of customers arriving per hour.
Interarrival Times: The Poisson distribution allows for the calculation of the probability of a specific number of arrivals within a given time. The interarrival times—the time between successive arrivals—are assumed to follow an exponential distribution, which is the continuous counterpart of the Poisson distribution.
2.5. Probability Mass Function (PMF)
The PMF of the Poisson distribution calculates the probability of observing exactly k arrivals in a fixed time interval, given the average arrival rate λ. The formula for the PMF is:
𝑃(𝑋=𝑘)=𝜆𝑘𝑒−𝜆𝑘!
Where:
P(X = k) is the probability of k arrivals occurring,
λ is the average arrival rate,
k! is the factorial of k, and
e is Euler's number (approximately 2.71828).
Overall, the Poisson distribution is critical in providing a probabilistic approach to analyzing queuing systems and other stochastic processes, offering valuable insights into the behavior of systems with random arrivals and independent events over time.
P(X = k) = (e^(-λ) * λ^k) / k!
Where:
P(X = k) is the probability of k arrivals.
e is the base of the natural logarithm (approximately 2.71828).
λ is the average arrival rate.
k is the number of arrivals.
Queueing Analysis: In queuing theory, the Poisson distribution is commonly used to model the arrival process of customers into a queue. For instance, in the analysis of a single-server queue (M/M/1), it is assumed that arrivals follow a Poisson process with an average arrival rate of λ. This assumption enables the calculation of key performance metrics such as average queue length, waiting time, and system utilization, all of which are crucial for optimizing system performance.
Traffic Engineering: In telecommunications and network engineering, the Poisson distribution is employed to model the arrival of packets or calls in communication networks. By assuming that traffic follows a Poisson process, engineers can effectively dimension network resources, optimize routing protocols, and analyze network performance under various traffic conditions, ensuring smooth operation even during peak load periods.
Inventory Management: The Poisson distribution is also widely applied in inventory management to model the random arrival of customer orders or product demand. This application aids in determining optimal safety stock levels, reorder points, and inventory replenishment strategies, allowing businesses to maintain a balance between meeting customer demand and minimizing excess stock.
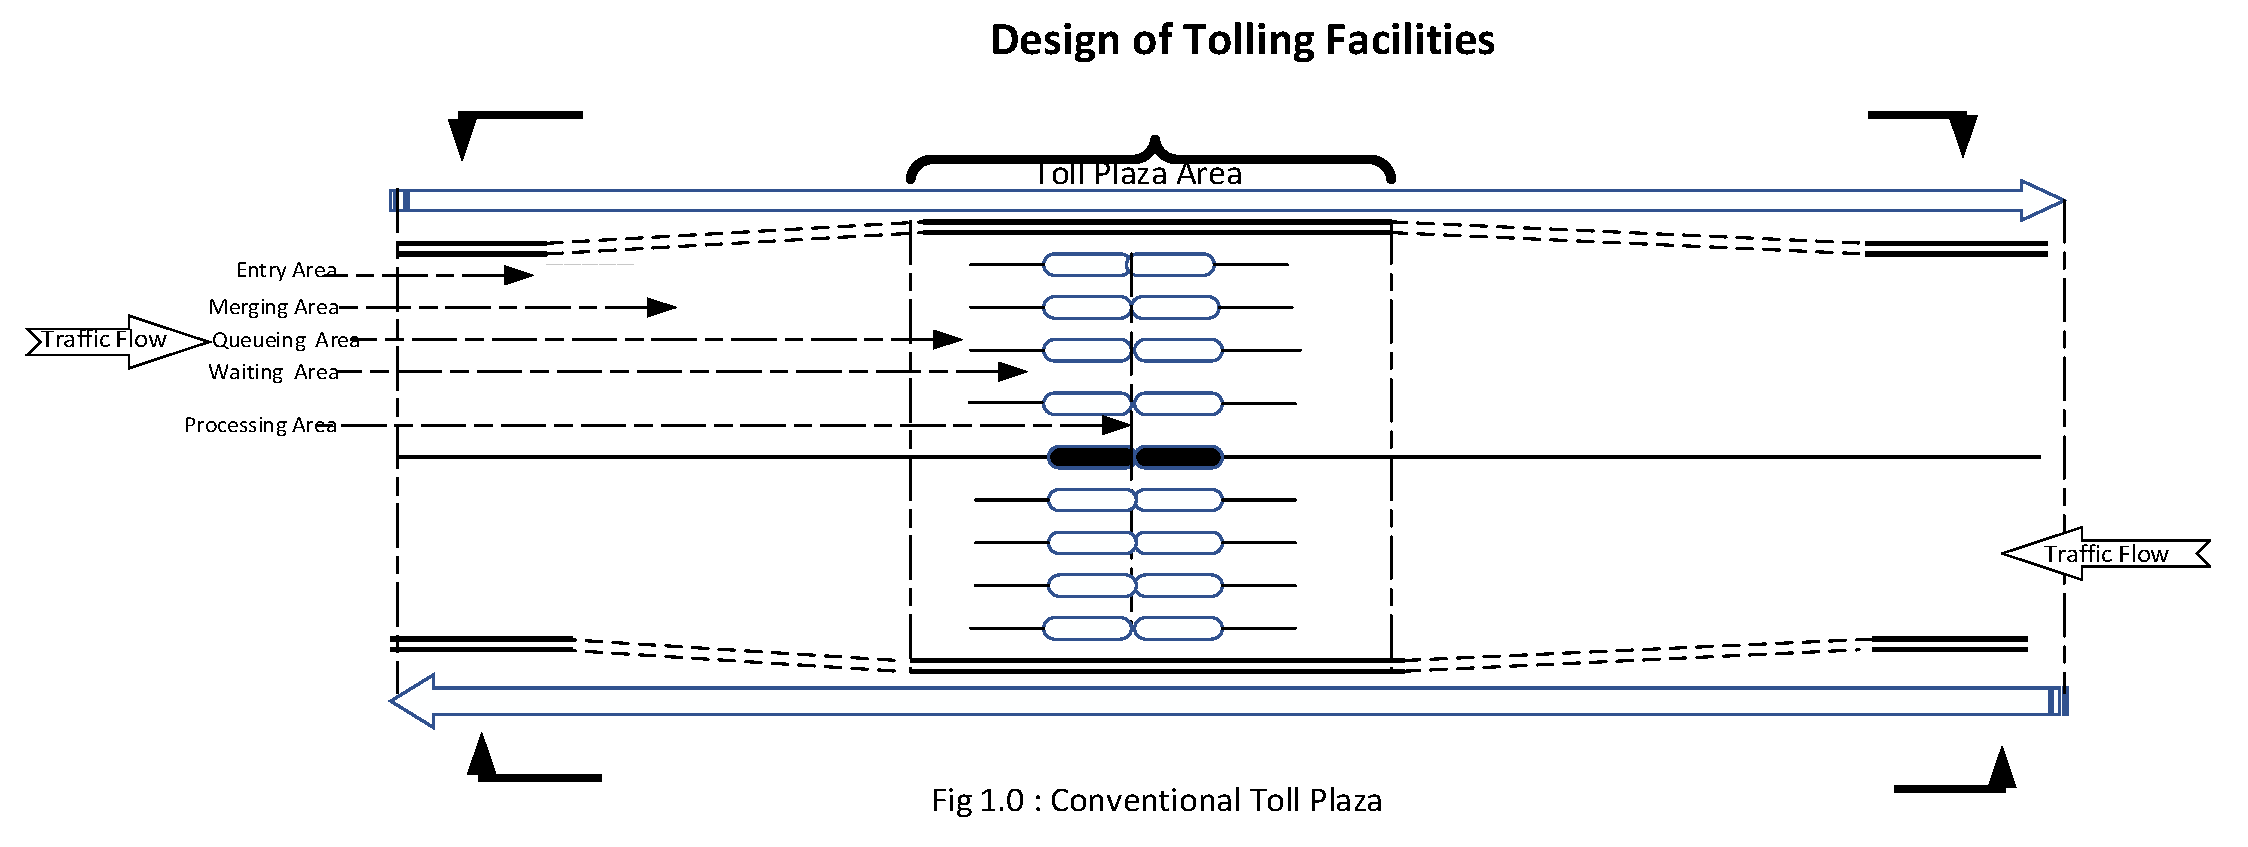
2.6. The Toll Plaza
The specific type of toll plaza encountered by drivers can vary based on the road network, region, and government policies. With the increasing adoption of electronic toll collection systems like FASTag, India has been transitioning toward more efficient and cashless toll collection methods to reduce traffic congestion and waiting times at toll plazas.
Figure 6.
General Layout of the Toll Plaza.
Toll collection systems vary in design and functionality, and they can be categorized into several types:
Conventional Toll Plaza: This is the traditional toll plaza setup featuring multiple toll booths or lanes where vehicles must stop to pay toll fees. Cash payments are accepted, and toll collectors issue receipts and provide change as needed.
Electronic Toll Collection (ETC) Plaza: ETC plazas are equipped with lanes dedicated to electronic toll collection systems like FASTag. Vehicles with FASTag RFID tags can pass through these lanes without stopping, as toll charges are automatically deducted from their prepaid accounts.
FASTag-Only Plaza: Some toll plazas, particularly in India, are exclusively dedicated to FASTag transactions. These plazas do not have cash payment lanes, and all vehicles must use FASTag for toll payments.
Hybrid Toll Plaza: Hybrid toll plazas combine conventional toll booths, and ETC lanes, allowing drivers to choose between paying in cash or using an electronic toll collection system, depending on their preference.
Closed Toll System: In a closed toll system, vehicles are issued a token upon entry, and toll fees are paid when exiting the road. This system is typically found on expressways and state highways, where the toll fee is based on the distance traveled.
Open Toll System: In an open toll system, vehicles pay a fixed toll-free at a booth or plaza located before entering a tolled road or highway. This fee is typically for a specific stretch of road and once paid, vehicles can travel freely along that segment.
Manual Toll Collection with Barriers: These toll plazas use physical barriers or gates to control vehicle entry and exit. Vehicles stop at the toll booth, and the barrier is raised after payment is made.
Manual Toll Collection without Barriers: Some toll plazas do not use physical barriers but rely on manual toll collection methods. Toll collectors issue receipts and record vehicle details manually, without any physical obstruction to entry.
Specialized Toll Plazas: Certain toll plazas are designed to cater to specific types of vehicles, such as dedicated lanes for commercial trucks or buses, ensuring smooth and efficient processing.
Integrated Toll Plazas: These toll plazas combine multiple toll booths from different agencies or authorities at a unique location, streamlining the toll collection process for users.
Toll Plazas at Entry/Exit Points: Toll plazas are often strategically located at entry and exit points of national highways, expressways, and state highways, ensuring proper management of toll collection at these critical junctures.
Open Toll System (Alternative): In an open toll system, vehicles are not always required to pay tolls at each plaza. This system is typically placed outside metropolitan areas, offering toll collection for specific routes or areas.
Closed Toll System (Alternative): In a closed toll system, customers pay tolls based on the number of miles traveled and the type of vehicle. Upon entering the system, they are issued a ticket and pay at the exit, where the toll fee is calculated according to the distance traveled and the vehicle type.
Each toll collection system is designed to meet specific operational needs and facilitate efficient traffic management while balancing convenience and cost-effectiveness.
Figure 7.
Automate Toll Collection.
2.7. Approaching the Toll Plaza
Approaching the Neelmangala Toll Plaza in Karnataka, India, typically depends on your starting point and the direction you are traveling. The Neelmangala Toll Plaza is located on National Highway 4 (NH4), which is a major highway connecting Bengaluru to other cities like Tumakuru and Pune. Here are some general directions on how to approach the Neelmangala Toll Plaza from different starting points:
From Bengaluru City Center:
- Start from the city center of Bengaluru, depending on your location.
- Head north on Tumakuru Road (NH4) towards Neelmangala.Continue NH4, and you will eventually reach the Neelmangala Toll Plaza.
- From Tumakuru: If you are coming from Tumakuru, start by heading south on NH4 towards Bengaluru. Continue NH4, and you will eventually reach the Neelmangala Toll Plaza.
- From Pune or Mumbai: If you are traveling from Pune or Mumbai, follow NH4 eastward. Pass through cities like Pune, Solapur, and Bijapur until you reach Karnataka Continue on NH4 until you reach the Neelmangala Toll Plaza.
- Using Navigation Apps: For real-time directions and traffic updates, it is advisable to use navigation apps such as Google Maps, Waze, or a GPS device. These apps can provide you with the most accurate and up-to-date information on your route to the Neelmangala Toll Plaza, considering current traffic conditions and road closures.
Paying Toll at Neelmangala Toll Plaza: When you approach the toll plaza, follow the designated lanes for your type of vehicle (e.g., passenger car, commercial vehicle) and payment method (cash or electronic toll collection).
Please note that road conditions and toll rates may change over time, so it is a clever idea to check for the latest information and plan your journey accordingly. Additionally, obey traffic rules and drive safely while approaching and passing through toll plazas.
Queue Analysis at Toll and Parking Exit Plazas: A Comparison of Multi-server Queuing Models and Traffic Simulation," Given arrival rates, server counts, and service rates, multi-server queuing analysis can be used to estimate the typical wait durations and queue lengths at toll and parking exit plazas. These queuing models come close to accurately representing the performance of multiple queue queuing systems. The queuing equations are helpful in situations when there are several servers, but they do not accurately describe how a toll plaza operates because cars can pile into multiple lines and switch lanes.
A traffic simulation model that considers the stated vehicle arrival and service rates and allows for various channel arrivals was applied to several parking exit plaza designs to acquire an understanding of how such a system will function. This study analyzes the outcomes of the two approaches and details how the estimates compared to data on waiting times and lines that were gathered at exit plazas that were in use. The application of the analytical queuing model along with traffic simulation in parking exit plazas at four different airports—Ronald Regan Washington National Airport, Dulles International Airport, Salt Lake City International Airport, and Atlanta Hartsfield International Airport—was the basis for the analysis presented in this paper. The average and maximum waiting delay as well as the average and maximum queue length were utilized as effectiveness indicators to assess the model's performance.
In addition, the simulation model's anticipated throughput volume and output values were contrasted with data gathered from the field. The study demonstrates that simulation offers a more thorough comprehension of the toll plaza's functioning, enabling a more in-depth examination of its performance. Simulation should be employed for planning, design, operation, and management of toll and exit plaza facilities even though basic queuing models could be used as an initial, often more conservative estimation in the initial stages of planning.
In "Application of Queuing Theory to Vehicular Traffic Queuing theory is the mathematical study of waiting lines, or queues, which occur when there is a demand for a service or a resource that exceeds the capacity to provide it. Queuing theory can be applied to various aspects of vehicular traffic, such as traffic lights, toll plazas, intersections, bottlenecks, and congestion. Some of the applications of queuing theory to vehicular traffic are:
Traffic lights: Queuing theory can help determine the optimal cycle length and green time for each phase of a traffic light, based on the arrival rate and service rate of vehicles from different directions. The objective is to minimize the average waiting time and queue length of vehicles at the intersection while ensuring a fair allocation of green time to each phase. A basic model of vehicular traffic based on queuing theory is described in this paper.
Toll plazas: Queuing theory can help design and evaluate the performance of toll plazas, based on the number and type of toll lanes, the payment methods, the arrival rate and service rate of vehicles, and the traffic conditions. The objective is to minimize the average waiting time and queue length of vehicles at the toll plaza while maximizing the revenue and efficiency of the toll system. A case study of applying queuing theory to a toll plaza in India is presented in this paper.
Signalized intersections: Queuing theory can help analyze the impact of signalized intersections on vehicular traffic flow, based on the arrival rate and service rate of vehicles from different approaches, the signal timing and coordination, the lane configuration, and the traffic demand. The objective is to minimize the delay and queue spillback of vehicles at the intersection while maximizing the throughput and safety of the traffic system. A case study of applying queuing theory to a signalized intersection in Ghana is presented in this paper.
Queuing theory can also be used to study other aspects of vehicular traffic, such as material transportation systems1, traffic accidents2, network congestion3, and more. Queuing theory can provide useful insights and solutions for improving the efficiency and reliability of vehicular traffic systems.
In "A Queuing Based Traffic Flow Model," A link queue model of network traffic flow by Li et al.2, develops a deterministic queueing model of network traffic flow, in which traffic on each link is considered as a queue. The authors use the model to study the effects of link capacity, link length, and turning ratio on the network performance and stability.
Chapter 3: Field Study
3.1. General
To understand the theory behind queuing a toll plaza has been selected in the present study which is located on NH-75 in Karnataka Stretch Neelmangala Junction to Devihalli Tollable near Doddakarenahalli (Neelmangala). Field studies like road inventory, traffic volume, space mean speed, time headway, arrival rate, and service pattern have been carried out.
3.2. Road Inventory
The road inventory of Devihalli Toll near Doddakarenahalli (Neelmangala) is as follows:
- The Devihalli Tollable is a part of the NH-75 highway that connects Neelmangala Junction to Devihalli in Karnataka.
- The tollable length of the Devihalli Tollable is 40.131 km.
- The toll plaza for the Devihalli Tollable is located at km 32.600 near Doddakarenahalli (Neelmangala).
- The toll plaza is operated by M/s Lanco Devihalli Highways Ltd.
- The fee effective date for the toll plaza is 01-Apr-2023 and the due date of toll revision is 31-Mar-2024.
- The fee notification date for the toll plaza is 27-Apr-2011 and the commercial operation start date is 23-Jun-2012.
- The fee rule for the toll plaza is 1997.
- The project capital cost for the Devihalli Tollable is Rs. 736 crores.
- The traffic on the Devihalli Tollable as of 02-Dec-2015 was 29,348 PCU/day and the design capacity was 57,707 PCU/day.
- The target traffic on the Devihalli Tollable as of 31 January 2018 was 25,292 PCU/day.
- The toll rates for diverse types of vehicles are given in the table below:

3.3. The Pavement Structure
of Devihalli Tollable near Doddakarenahalli (Neelmangala) is as follows:
- The Devihalli Tollable is a four-lane divided carriageway with a median of 4.5 m width.
- The pavement structure consists of the following layers:
- Bituminous Concrete (BC): 40 mm thick
- Dense Bituminous Macadam (DBM): 60 mm thick
- Wet Mix Macadam (WMM): 250 mm thick
- Granular Subbase (GSB): 200 mm thick
- -
- Subgrade: 500 mm thick
- The pavement design is based on the traffic projection of 25,292 PCU/day for the year 2018.
- The design life of the pavement is 15 years.
- The pavement performance is monitored by the concessionaire through periodic surveys and tests.
3.4. The Queuing Area
Devihalli Tollable near Doddakarenahalli (Neelmangala) is the area where vehicles must wait in line to pay the toll fee at the toll plaza. The queuing area is designed to accommodate the expected traffic volume and reduce the waiting time for the users. The queuing area has the following features.
- The queuing area is located at km 32.600 on the NH-75 highway near Doddakarenahalli (Neelmangala).
- The queuing area has eight lanes for each direction of traffic, with four lanes dedicated to FASTag users and four lanes for cash users.
- The queuing area has a length of 200 m and a width of 28 m for each direction of traffic.
- The queuing area has a paved surface with a bituminous concrete layer of 40 mm thickness.
- The queuing area has signboards, lane markings, traffic signals, and CCTV cameras to guide and monitor the traffic flow.
- The queuing area has a capacity of 1600 PCU/hour for each direction of traffic, which is sufficient to manage the peak hour traffic of 1200 PCU/hour as per the traffic projection for the year 2018.
3.5. The Traffic Volume:
Traffic flow at the Devihalli Tollable, near Doddakarenahalli (Neelmangala), refers to the number of vehicles passing through the toll plaza per hour or day. This flow is influenced by various factors, including time of day, day of the week, season, weather conditions, road quality, and travel demand. The traffic flow can be measured using several methods, such as manual counting, automatic counting, or video analysis. As of December 2, 2015, the traffic at Devihalli Tollable was recorded at 29,348 PCU/day, while the design capacity was 57,707 PCU/day. PCU (Passenger Car Unit) is a standardized unit used to represent the impact of different vehicle types on traffic flow, with one PCU equivalent to the effect of one car. For example, a bus might be considered equivalent to three PCUs, while a motorcycle is equivalent to 0.5 PCUs. The target traffic for Devihalli Tollable as of January 31, 2018, was projected at 25,292 PCU/day, indicating that the actual traffic in 2015 was higher than projected but lower than the 2018 forecast. This discrepancy can be attributed to factors such as changes in economic conditions, population growth, shifting travel preferences, or the availability of alternative routes. Traffic flow at the toll plaza is variable throughout the day. It is typically higher during peak hours—morning and evening—and lower during off-peak times such as midday and night. Additionally, weekdays generally see higher traffic volumes compared to weekends, as weekday travel is often linked to work or educational purposes. The queuing area at Devihalli Tollable has a capacity of 1,600 PCU/hour in each direction. If traffic flow exceeds this capacity, congestion and delays may occur. To mitigate these issues, the concessionaire has implemented various facilities, including FASTag lanes, cash lanes, signboards, lane markings, traffic signals, and CCTV cameras, all designed to streamline and monitor traffic flow. The concessionaire is also responsible for maintaining the road conditions and pavement structure of the tollable stretch to ensure safe and efficient travel for users.
3.6. The Traffic Flow on Both the Directions of the National Highway 75 (NH-75)
Traffic flow on a highway refers to the number of vehicles that pass through a specific point per hour or per day. It is influenced by several factors, including the time of day, day of the week, season, weather conditions, road quality, and overall travel demand. Traffic flow can be measured using various methods, such as manual counting, automatic counting systems, or video analysis.
NH-75, according to Wikipedia, is a major national highway in India that passes through the states of Karnataka, Andhra Pradesh, and Tamil Nadu. It connects the port city of Mangaluru on the west coast to the city of Vellore in the east. The highway spans a total length of 533 km (331 mi) and traverses all three geographical regions of Karnataka: Karavali, Malenadu, and Bayaluseeme. NH-75 also bypasses key towns such as Hassan and Kunigal.
To visualize the traffic flow in both directions of NH-75, I have used Google Maps with the traffic layer enabled to provide an accurate representation of the current traffic conditions. The map below illustrates the real-time traffic data for this highway:
The map displays the current traffic conditions on NH-75 as of Wed, 27 Sep 2023, 16:23:52 GMT+05:30. In the map, the green color indicates smooth traffic flow, while red indicates congestion or delays. You can zoom in or out for more detailed views or switch between satellite and terrain modes for a better perspective. As observed from the map, the traffic flow varies across different sections of NH-75. Some areas experience heavier traffic than others, which can be attributed to factors such as road width, number of lanes, toll plazas, junctions, bridges, curves, and gradients. For instance, areas near Bengaluru, Kolar, and Vellore show higher traffic densities compared to regions near Bantwal, Sakleshpura, or Hassan, where traffic is comparatively lighter. According to IIT Bombay, for the design of flexible pavements, such as bituminous roads, the traffic flow should primarily consider the total number of commercial vehicles in both directions. This is because commercial vehicles contribute significantly to pavement wear and deterioration compared to passenger vehicles. Additionally, the traffic flow should be projected for a design life of 15 years or more to ensure the durability of the pavement.
3.7. The Flexible Pavements
The Devihalli Tollable, located near Doddakarenahalli (Neelmangala), features a flexible pavement design, which is more resilient and durable than rigid pavements due to its ability to bend and deflect under traffic loads. Flexible pavements are constructed in layers, each serving a specific function to ensure long-lasting performance. The key components of flexible pavement include:
Subgrade: The natural soil or rock layer that forms the foundation for the pavement. It provides stability and drainage and must be properly compacted and graded before the installation of the overlying layers.
Subbase: An optional granular layer placed over the subgrade to enhance strength, drainage, and uniformity. It also acts as a cushion to reduce stress on the subgrade.
Base: The primary load-bearing layer, designed to distribute the traffic load to the underlying layers. Typically made of crushed stone, gravel, or stabilized soil, the base layer is crucial for withstanding traffic and climate impacts. It must be well-compacted and sufficiently thick to ensure durability.
Surface: The topmost layer in direct contact with traffic, usually made of asphalt concrete, a mixture of bitumen and aggregates. This layer provides a smooth, skid-resistant, and waterproof surface, while also protecting the lower layers from moisture and weathering.
The Devihalli Tollable is part of NH-75, connecting Neelmangala Junction to Devihalli in Karnataka. The tollable stretch spans a length of 40.131 km, and its pavement structure is designed with the following layers:
- Bituminous Concrete (BC): 40 mm thick
- Dense Bituminous Macadam (DBM): 60 mm thick
- Wet Mix Macadam (WMM): 250 mm thick
- Granular Subbase (GSB): 200 mm thick
- Subgrade: 500 mm thick
The pavement design was based on a traffic projection of 25,292 PCU/day for the year 2018. PCU (Passenger Car Unit) is used to quantify the effect of different vehicle types on traffic flow. One PCU is equivalent to one car, with buses typically counted as three PCUs and motorcycles as 0.5 PCUs.The pavement has a design life of 15 years, and its performance is regularly monitored by the concessionaire through periodic surveys and tests to ensure its durability and safety.
3.8. Space Mean Speed
The Devihalli Tollable, located near Doddakarenahalli (Neelmangala), is part of NH-75, which connects Neelmangala Junction to Devihalli in Karnataka. The tollable stretch spans 40.131 km. As of 02-Dec-2015, the traffic volume at the Devihalli Tollable was 29,348 PCU/day, while the design capacity was 57,707 PCU/day. PCU (Passenger Car Unit) is a standardized unit used to quantify the impact of various vehicle types on traffic flow. One PCU is equivalent to one car, with a bus accounting for three PCUs and a motorcycle for 0.5 PCUs. To estimate the space mean speed on the Devihalli Tollable, we can use the following simplified formula:
Space Mean Speed = (Total distance traveled by all vehicles) / (Total time taken by all vehicles)
- Assuming uniform traffic distribution throughout the day and no congestion at the toll plaza, the formula simplifies as follows:
- Space Mean Speed = (Tollable length × Traffic volume) / (24 hours × 3600 seconds)
- Substituting the values:
- Space Mean Speed = (40.131 km × 29,348 PCU/day) / (24 hours × 3600 seconds)
- Space Mean Speed ≈ 13.4 km/h
This means that, on average, a vehicle traveling on the Devihalli Tollable would cover the 40.131 km in approximately 3 hours.
However, this estimate is based on several assumptions and simplifications. The actual space mean speed can vary due to factors such as road width, number of lanes, toll booths, junctions, bridges, curves, gradients, and other dynamic elements like traffic congestion, vehicle load intensity, weather conditions, and pavement characteristics.
To obtain a more accurate estimate of the space mean speed, advanced techniques like manual counting, automatic counting, or video analysis can be employed to account for real-time traffic conditions and other variables.
Chapter 4 Analysis of Field Data
4.1. General
The delay and waiting time of drivers in toll plazas depends on service time and arrival rate. The quick service time and number of toll booths can reduce the time wasted in the queue. The wasted time can be calculated and minimized by analysis of the observed data. By calculating the wasted time, the performance of the servers can be analyzed and the delay in overall travel time can be found.
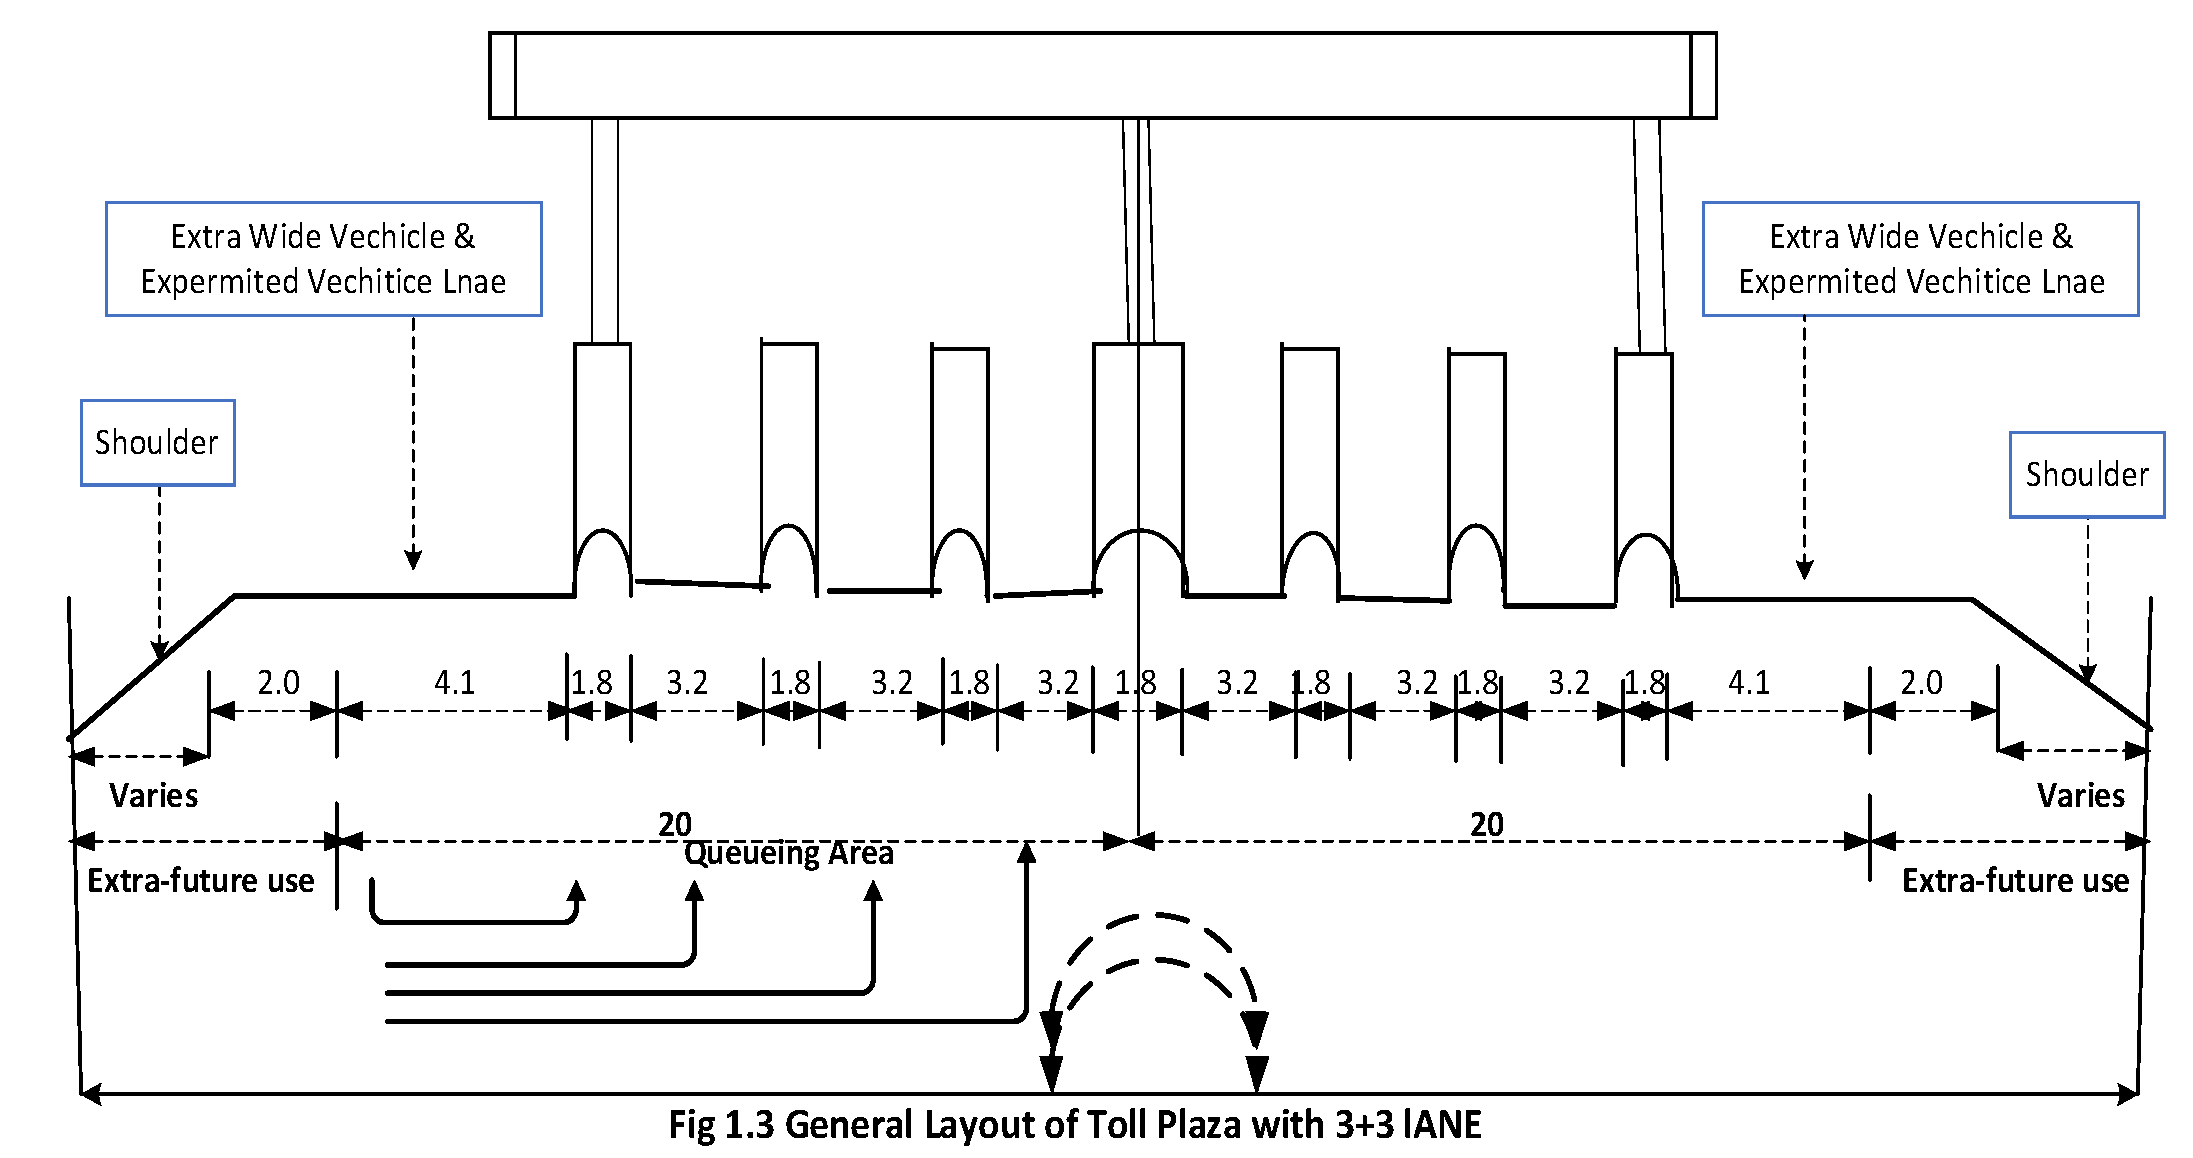
4.2. Road Inventory
The road inventory reveals that the number of incoming lanes is two and it diverges into five lanes within the queuing area of the toll plaza. The pavement structure before the toll plaza is divided into flexible pavement. The number of lanes is four of width is 9m and the median width is 2.5m. The type of shoulder is earthen, and the shoulder width is 1.5m. The queuing area is of rigid pavement. The width of the pavement is 30m, and the length of pavement on arrival and merging side is 250m. The number of toll booths on each side is 5, the length of the toll booth is 2.4m and the width is 3.6m.
4.3. Traffic Volume
In the present study the traffic count census is done as per IRC: 9-1972 “Traffic census on Non-Urban Roads”. To consider the randomness, the traffic volume study was carried out in short intervals (4 hours) at different hours of the day and on different days. The average traffic flow rate from Hassan to Bengaluru is 375veh/hr. The average traffic flow rate from Bengaluru to Hassan is 345 veh/hr.
4.4. Space Mean Speed
In the present study the space mean speed is found out as per IRC: 108-1996 "Guidelines for Traffic Prediction on Rural Highways". The drivers slow down their vehicles before the toll plaza to judge the lanes and select the lanes so that they spend less time in the queue. If the traffic flow rate increases the space mean speed decreases. The space mean speed of vehicles approaching near the toll booth from Hassan to Bengaluru is 21 km/hr. And from Bengaluru to Hassan is 14 km/hr. The space mean speed of vehicles at a certain distance away from the queuing area in both directions was found to be 34km/hr. And 26 km/hr., respectively.
4.5. Time Headway
Time headway is the difference between the time the front wheel of a vehicle arrives at a point on the highway and the time the front wheel of the next vehicle arrives at the same point. Time headway can be used to predict the flow rate of vehicles on a section of roadway the field data observed shows that the inter-arrival time between vehicles was found out to be 10.5s (Bengaluru to Hassan) and 10.2s (Hassan to Bengaluru). Both directions have equal headway indicating equal flow of vehicles in both directions. Hence this might be one of the reasons for having an equal number of booths in both directions (i.e., 5 on each side).
4.6. Arrival Rate
The data obtained from the arrival rate was analyzed using Poisson distribution. The observed frequency (598) is equal to the theoretical frequency (597) as per the Poisson distribution. Hence vehicles arriving at a section of a highway simply follow Poisson distribution. Hence for any future studies for finding out arrival rate, Poisson distribution can be made use of.
4.7. Service Rate
In the present study, the average service time from Hassan to Bengaluru is 18.02 seconds and from Bengaluru to Hassan is 17.06 seconds. The observed data reveals the service rate to be almost equal and hence service rate can be considered as general (G).
4.8. Traffic Flow
Theory One of the most important equations in traffic flow theory is given between traffic flow (q), traffic density (k), and speed.
(s). q=k*s
In the present study, graphs are plotted to show the behavior of vehicles on the road section. In the present study, the queuing theory was modeled on M/G/1. M represents the arrival pattern following Poisson distribution; G represents the service pattern considered general and 1 represents a single booth selected for the analysis.
The M/G/1 queueing model is a widely used mathematical model in queueing theory. In the context of traffic and transportation, it can be used to analyze a single lane of traffic at a toll plaza, for example.
In the M/G/1 model:
"M" stands for Markovian arrivals, which means that vehicles arrive at the toll plaza following a Poisson process (random arrivals).
"G" stands for a general service time distribution, meaning the time it takes to process a vehicle at the toll booth can follow any general probability distribution.
"1" indicates a single server (toll booth) in this case.
The speed-density relationship, in this context, is used to understand how vehicle speed and traffic density (the number of vehicles on the road) are related. The speed-density relationship can vary depending on the specific road, traffic conditions, and other factors.
To collect speed-density data for an M/G/1 model at a toll plaza, you would typically need to conduct field studies or simulations.
Here is a simplified way to approach this:
Data Collection: Collect data on vehicle arrivals and service times. Measure the number of vehicles arriving at the toll plaza per unit time and the time it takes to process each vehicle at the toll booth. This data can be used to estimate the arrival rate (λ) and the service rate (μ).
Calculate Traffic Density: Calculate the traffic density by dividing the arrival rate (λ) by the vehicle speed. The traffic density (ρ) is a dimensionless quantity representing the number of vehicles per unit length of the road.
ρ = λ / V
Where:
ρ is the traffic density.
λ is the arrival rate of vehicles.
V is the average speed of vehicles.
Analyze Speed-Density Relationship
Analyze the data to understand how changes in traffic density affect vehicle speed. You can plot the speed-density relationship, which can take various forms depending on the specific conditions. Please note that real-world traffic is more complex than the simple M/G/1 queueing model, and other factors like lane merging, vehicle types, and driver behavior can influence the speed-density relationship. Traffic engineering professionals and researchers often use more advanced models and data collection techniques to understand and manage traffic flow effectively.
Funding Statement
This research was conducted without any external funding. The authors declare that no financial support was received from any organization or institution for the completion of this study
References
- A Queueing Based Traffic Flow Model, Author - Nico Vandaele, Ref URL https://www.researchgate.net/publication/222190921_A_Queueing_Based_Traffic_Flow_Model. 2221.
- Traffic Stream Models, Author- Prof. Tom V. Mathew, Ref URL - https://www.civil.iitb.ac.in/tvm/nptel/513_TrStream/web/web.html.
- Speed–density functional relationship for heterogeneous traffic data: a statistical and theoretical investigation, Author- Hari Krishna Gaddam & K. Ramachandra Rao, https://link.springer.com/article/10.1007/s40534-018-0177-7.
- Toll Plaza Information,https://tis.nhai.gov.in/TollInformation?TollPlazaID=116.
- Toll Operation -https://tis.nhai.gov.in/.
- 6. Waiting Line Models, Author- Joos Korstanje, Ref URL - https://towardsdatascience.com/waiting-line-models-d65ac918b26c.
- Queueing Models with Multiple Waiting Lines, Author- I.J.B.F. Adan, Ref URL - https://link.springer.com/article/10.1023/A:1011040100856.
- M/M/1 Queuing System, https://in.mathworks.com/help/simevents/ug/m-m-1-queuing-system.html.
- A queueing-based traffic flow model, Author - Nico Vandaele, Ref URL - https://www.sciencedirect.com/science/article/abs/pii/S1361920999000280.
- A QUEUEING-BASED TRAFFIC FLOW MODEL. Ref URL - https://www.iitg.ac.in/nselvaraju/ma597_2007/Assignments/06212319-original%20paper.pdf.
- K. Elissa, “Title of paper if known,” unpublished.
- R. Nicole, “Title of paper with only first word capitalized,” J. Name Stand. Abbrev., in press.
- Traffic Stream Models Auth - Prof. Tom V. Mathew Ref URL https://www.civil.iitb.ac.in/tvm/nptel/513_TrStream/web/web.html.
- M. Young, The Technical Writer’s Handbook. Mill Valley, CA: University Science, 1989.
- PoissonDistributionCalculator , Author- Bogna Szyk and Jakub Janus, - https://www.omnicalculator.com/statistics/poisson-distribution.
Figure 2.
Modern toll facilities, such as NH 648 Hosur and 748 Nelamngala, Bengaluru, Karnataka, India.
Figure 2.
Modern toll facilities, such as NH 648 Hosur and 748 Nelamngala, Bengaluru, Karnataka, India.
Figure 3.
Neelmangala Toll Plaza Approach Road NH.
Disclaimer/Publisher’s Note: The statements, opinions and data contained in all publications are solely those of the individual author(s) and contributor(s) and not of MDPI and/or the editor(s). MDPI and/or the editor(s) disclaim responsibility for any injury to people or property resulting from any ideas, methods, instructions or products referred to in the content. |
© 2024 by the authors. Licensee MDPI, Basel, Switzerland. This article is an open access article distributed under the terms and conditions of the Creative Commons Attribution (CC BY) license (http://creativecommons.org/licenses/by/4.0/).
Copyright: This open access article is published under a Creative Commons CC BY 4.0 license, which permit the free download, distribution, and reuse, provided that the author and preprint are cited in any reuse.


