Preprint
Review

This version is not peer-reviewed.

Methods and Approaches for User Engagement and User Experience Analysis based on Electroencephalography Recordings: A Systematic Review

A peer-reviewed article of this preprint also exists.

Submitted:

09 December 2024

Posted:

10 December 2024

You are already at the latest version

Abstract

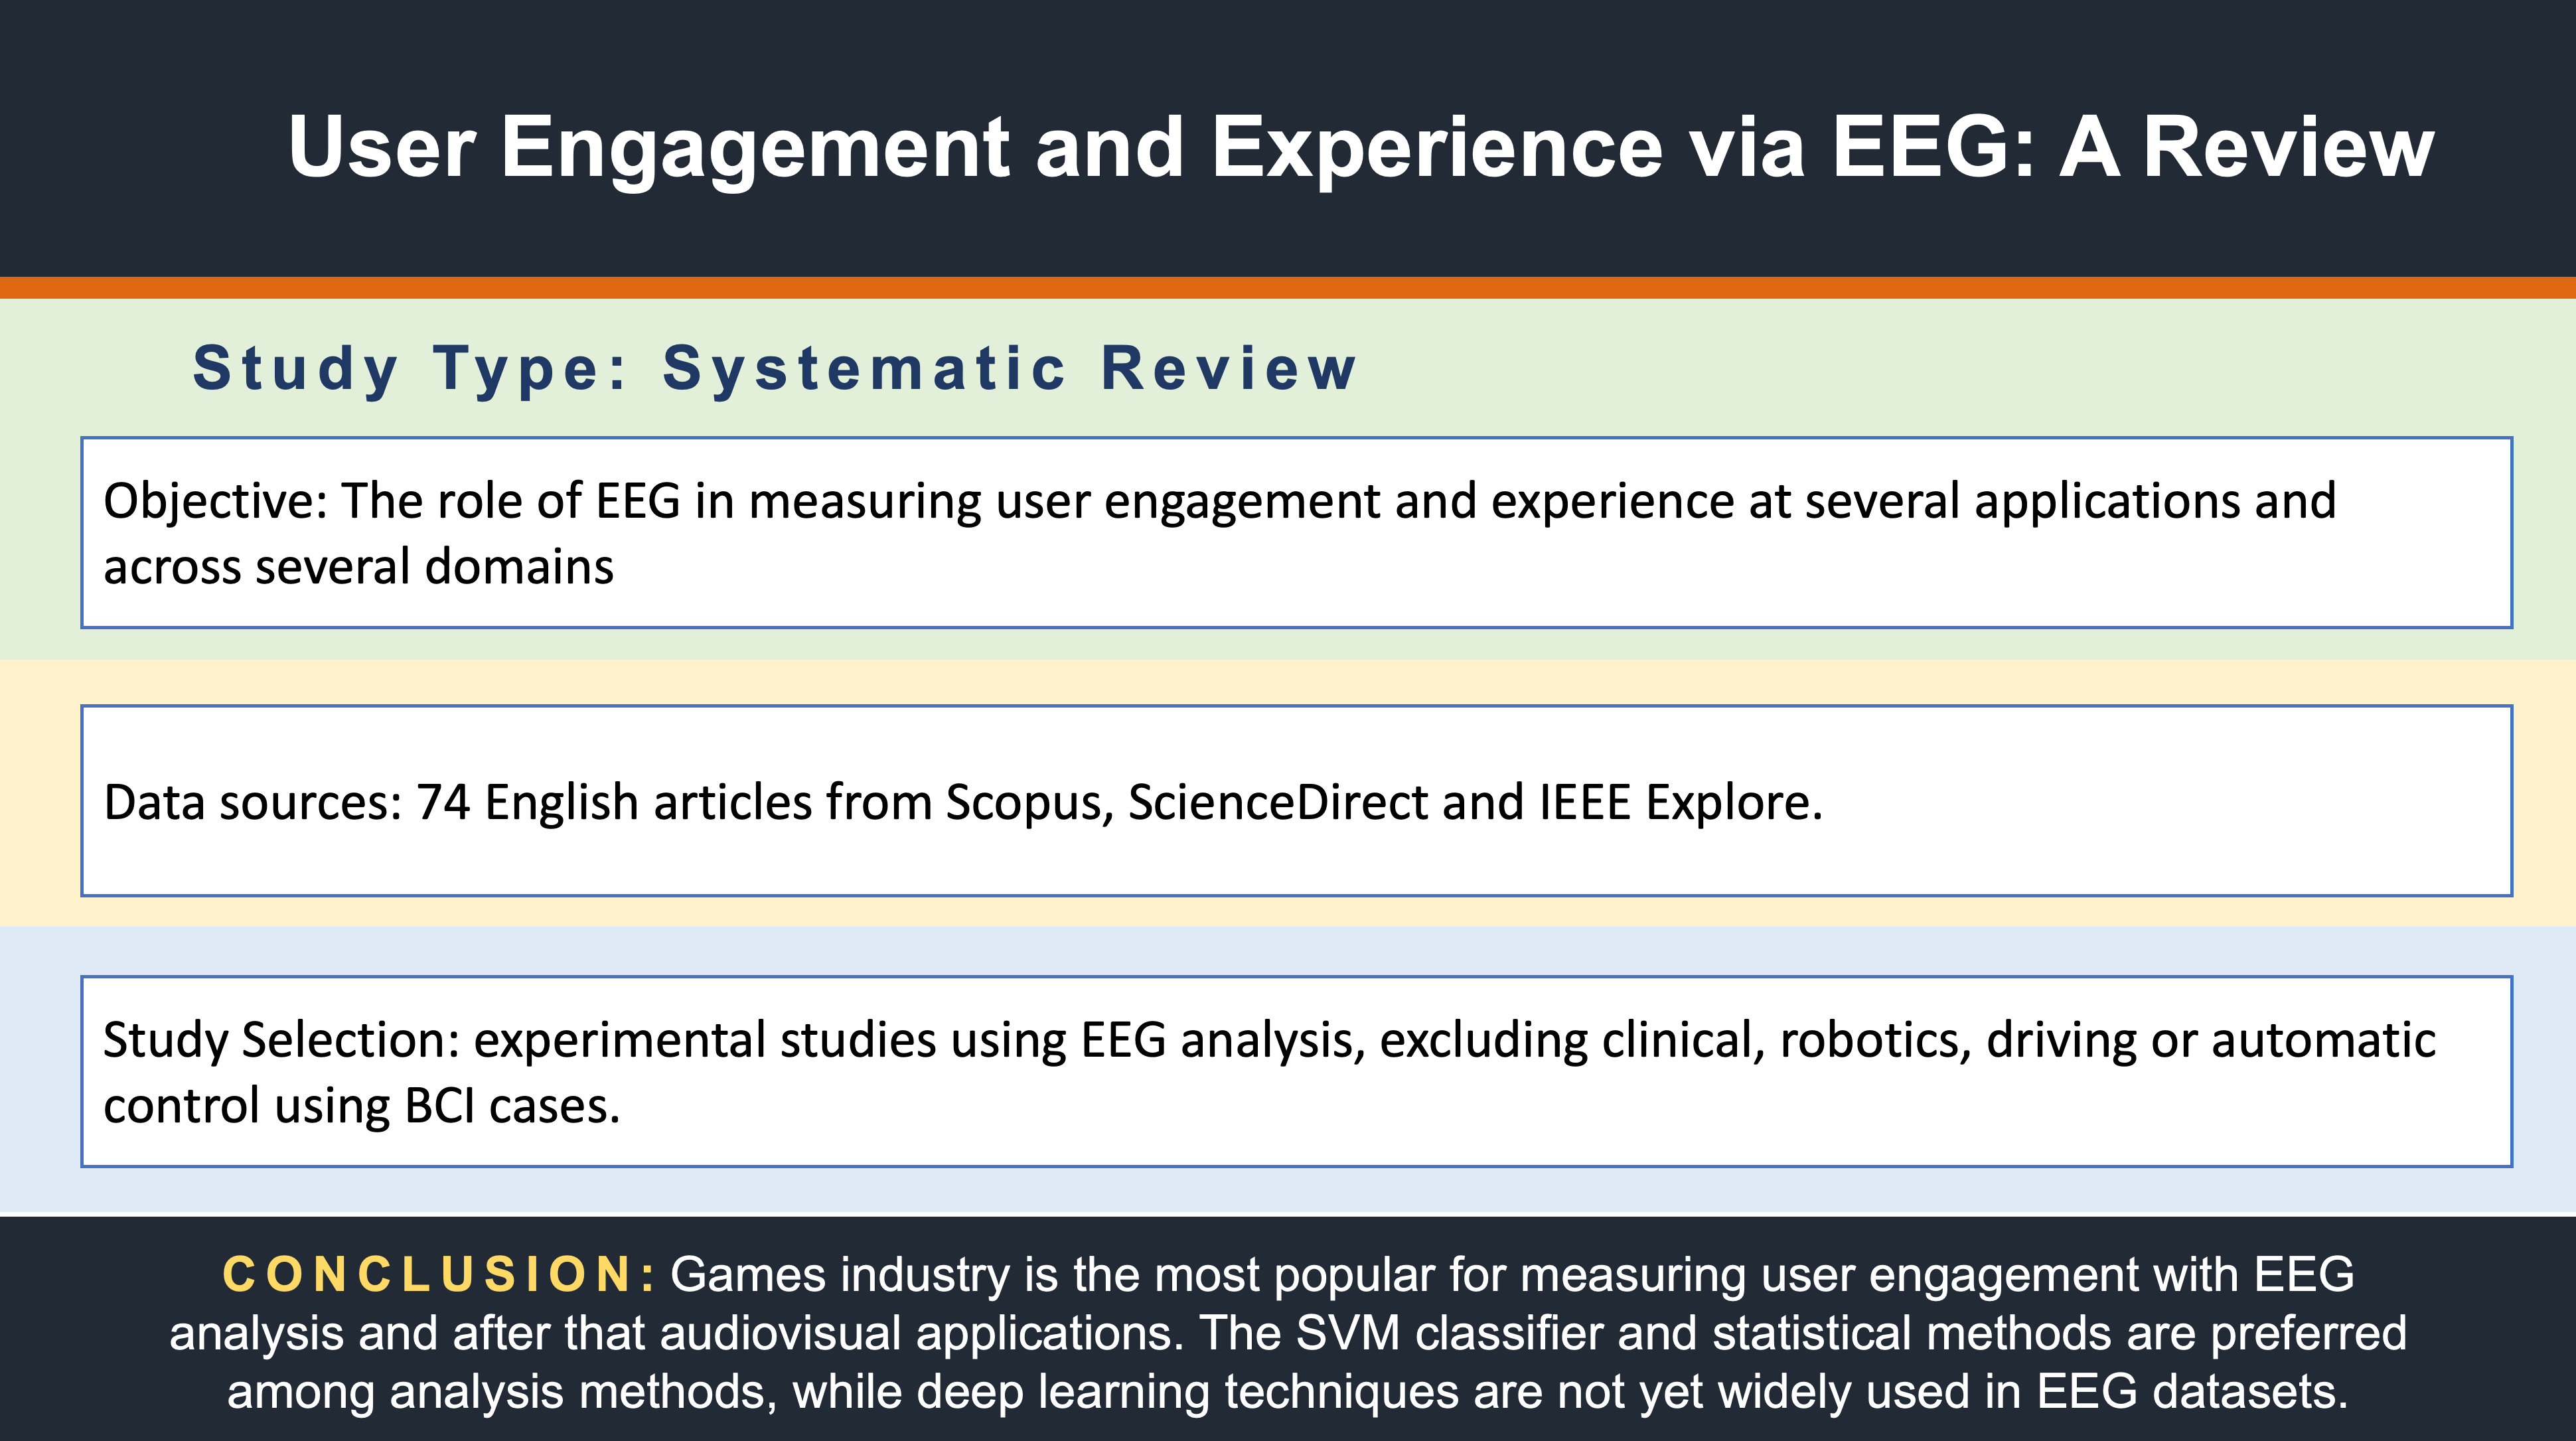
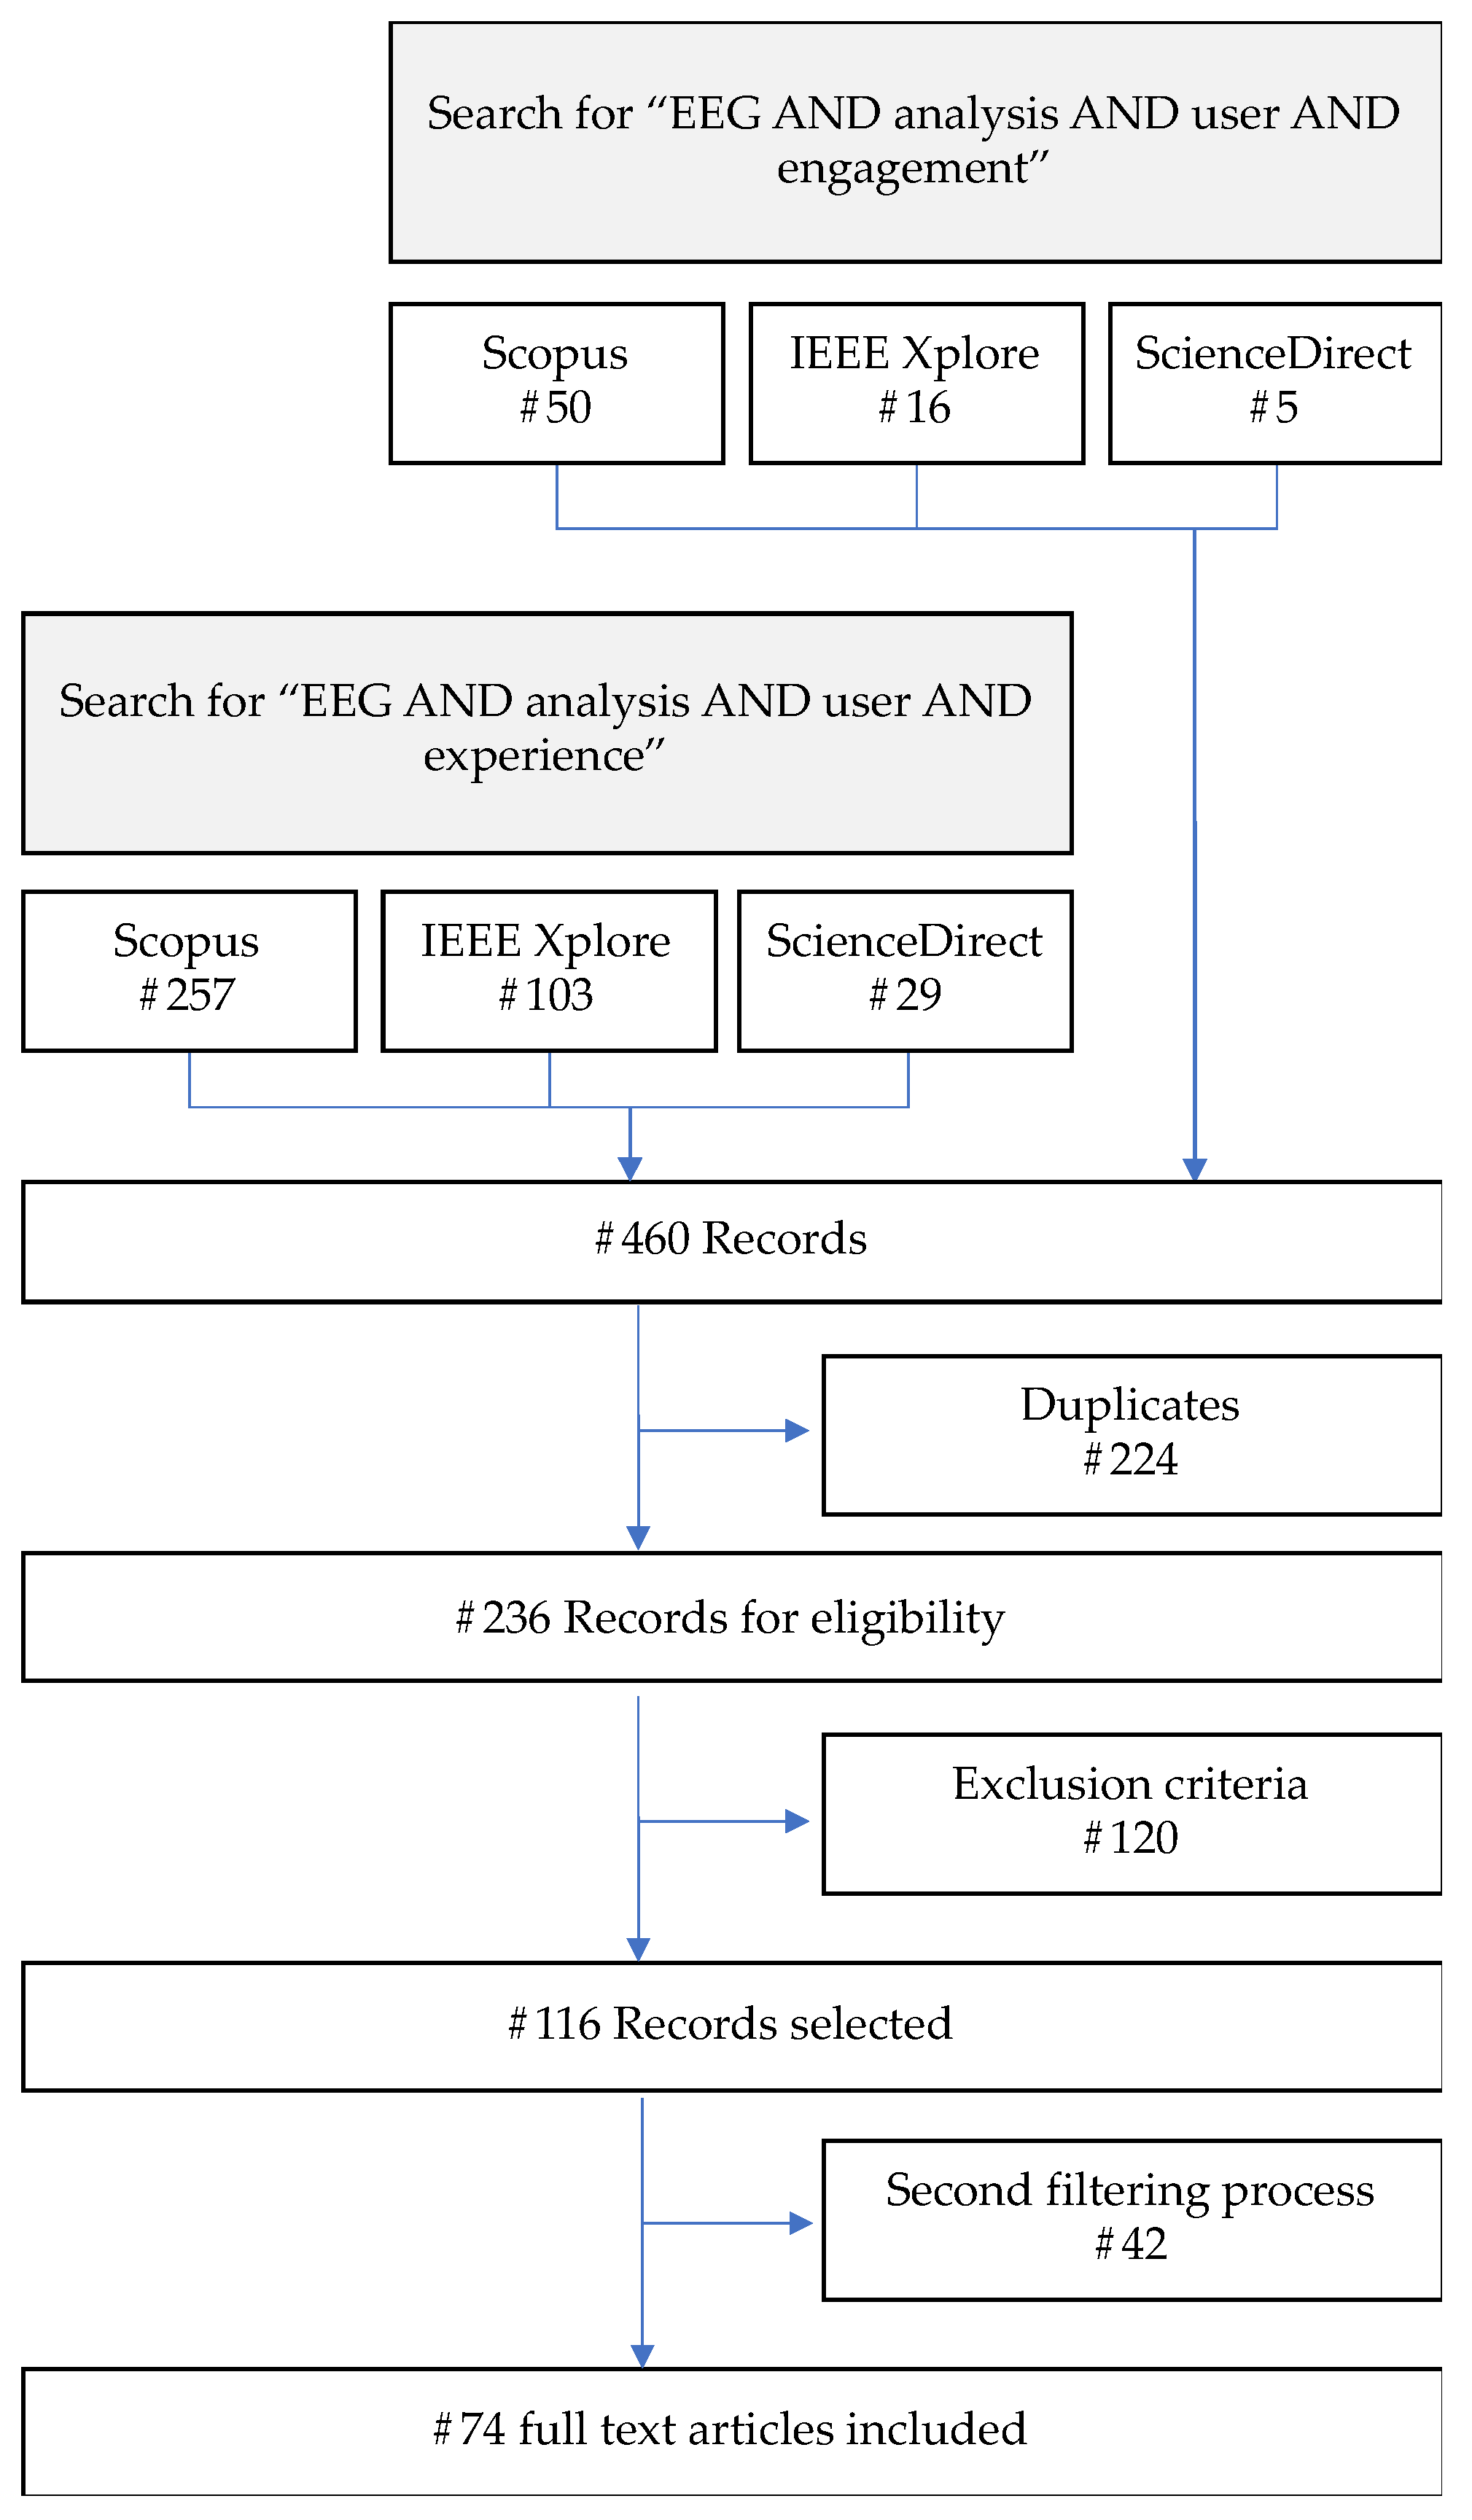
This review paper explores the intersection of user engagement and user experience studies with Electroencephalography (EEG) analysis by investigating the existing literature in this field. User engagement describes the immediate, session-based experience of using interactive products and is commonly used as a metric to assess the success of games, online platforms, applications, and websites, while user experience encompasses the broader and longer-term aspects of user interaction. This review focuses on the use of EEG as a precise and objective method to gain insights into user engagement. EEG recordings capture brain activity as waves, which can be categorized into different frequency bands. By analyzing patterns of brain activity associated with attention, emotion, mental workload, and user experience, EEG provides valuable insights into user engagement. The review follows the PRISMA statement. The search process involved an extensive exploration of multiple databases, resulting in the identification of 74 relevant studies. The review encompasses the entire information flow of the experiments, including data acquisition, pre-processing analysis, feature extraction, and analysis. By examining the current literature, this review provides a comprehensive overview of various algorithms and processes utilized in EEG-based systems for studying user engagement and identifies potential directions for future research endeavors.

Keywords: 
;  ;  ;  ;  ;  ;  ;  

1. Introduction

User engagement (UE) shares a close connection with User Experience (UX) [1]. In [2], UE, after an extensive, critical multi-disciplinary literature review and an exploratory study, is defined as "a quality of UX characterized by attributes of challenge, positive affect, endurability, aesthetic and sensory appeal, attention, feedback, variety/novelty, interactivity, and perceived user control". This definition emphasizes the multidimensional nature of UE, encompassing cognitive, affective, and interactive aspects of the UX with technology. On the other hand, UX, within the framework of UE, encompasses the holistic set [3] of perceptions, emotions, and interactions that users have with technology.
Thus, UE focuses on the attraction of individuals to interactive products within a session and highlights how well-designed UE enhances the immediate, session-based experience, making it both exciting and enjoyable. This concept is closely tied to affect and mood. It is the measure of how much an individual is involved and interested in a particular activity, product, service or experience. It is often used as a metric to assess the success of online platforms, applications, and websites. Cognition and emotions play a critical role in UE. Cognition refers to the mental processes involved in understanding, processing, and remembering information. Emotions, on the other hand, refer to the subjective feelings that arise in response to internal or external stimuli.
UX includes UE but goes beyond, addressing the comprehensive perspective of why individuals choose and sustain the use of a specific design across numerous sessions and even over extended periods. Influenced more profoundly by memory and motivation, UX extends beyond the immediate, session-based encounter. In essence, UE pertains to the immediate, session-based aspects of interactive product usage, while UX encompasses the broader and longer-term dimensions of user interaction and experience. Creating engaging UX and User Engagement UE is a complex and dynamic process that involves the interplay of three primary attributes: emotional, cognitive, and behavioral [2]. These attributes are interrelated and can often overlap.
Emotional engagement refers to the affective or emotional response of the user to the technology. It includes attributes such as positive affect, endurability, aesthetic and sensory appeal, and attention. Cognitive engagement refers to the user's cognitive or mental involvement with the technology. It includes attributes such as challenge, feedback, variety/novelty, and perceived user control. Behavioral engagement refers to the user's observable actions or behaviors related to the technology. It includes attributes such as interactivity and sustained use.
Positive emotions can increase engagement, as extensively discussed in [1]: When users feel happy, satisfied, or excited about a product or service, they are more likely to engage with it. For example, if a user has a positive experience while using a mobile app, they may be more likely to spend more time in the app or to recommend it to others. On the other hand, negative emotions can decrease engagement [1]: Negative emotions, such as frustration, anger, or disappointment, can lead to disengagement or even abandonment of a product or service. If a user has a bad experience with a product, they may be less likely to use it again in the future or to recommend it to others. Although positive emotions have the potential to enhance UE, they do not consistently result in high engagement levels. As O'Brien outlines in [2], engagement is a multifaceted process encompassing various attributes, including challenge, positive affect, endurability, aesthetic and sensory appeal, attention, feedback, variety/novelty, interactivity, and perceived user control. While positive emotions like enjoyment and satisfaction can play a role in fostering engagement, they are not the sole determinants. Instances exist where users may encounter positive emotions yet disengage due to factors such as fatigue, boredom, or lack of interest. Conversely, users may experience negative emotions and still maintain high engagement if they are motivated to overcome challenges or achieve goals. Therefore, although positive emotions contribute to engagement, they do not invariably lead to heightened levels of engagement.
Emotional engagement is often seen as a key driver of user behavior and emotions can also influence user behavior. When users feel a strong emotional connection to a product or service, they are more likely to engage with it repeatedly and recommend it to others. This emotional connection can be built through various means, such as personalized messaging, interactive content, and social features. For example, users who feel anxious or stressed may be more likely to abandon a checkout process, while users who feel excited or curious may be more likely to explore a new feature or product offering. In this context, emotional design can improve engagement: Emotions can also be deliberately designed into a product or service to improve engagement. For example, a mobile game may use bright colors, fun animations, and humorous characters to create a sense of joy and excitement that encourages users to keep playing [4,5].
Cognitive engagement is also important for sustained UE. This can be achieved by providing users with content that is relevant to their interests, challenges their thinking, and encourages them to learn new things. On the other hand, behavioral engagement highlights the importance of dialogue between the user and the reference point to achieve a purpose. It also emphasizes the role of interaction in promoting novelty, interest, aesthetics, and the potential to fulfill task-oriented or experiential goals, all of which contribute to user engagement.
Electroencephalography (EEG) is a technique that measures the electrical activity in the brain through electrodes placed on the scalp. The electrical activity is recorded as waves, which can be categorized into different frequency bands. Overall, EEG is considered as the most aaccurate [6] and objective method that can provide valuable insights into UE by measuring patterns of brain activity associated with attention, emotion, mental workload, and UX. The main frequency bands of EEG waves are:
  • Delta Waves (0.5-4 Hz) that are associated with deep sleep and unconsciousness, and their presence during wakefulness can indicate a brain injury. Therefore, they are not usually associated with engagement or emotions.
  • Theta Waves (4-8 Hz) that are associated with drowsiness, daydreaming, and meditative states. They are also associated with emotional processing and memory formation. An increase in theta waves has been linked to positive emotions, such as happiness and relaxation.
  • Alpha Waves (8-13 Hz) that are associated with relaxation, calmness, and focused attention. They are also associated with a decrease in sensory processing and a reduction in distractibility. An increase in alpha waves is often observed when individuals are engaged in activities that they find enjoyable or calming.
  • Beta Waves (13-30 Hz) that are associated with focused attention, concentration, and cognitive processing. An increase in beta waves is often observed when individuals are engaged in tasks that require high levels of concentration, such as problem-solving or decision-making.
  • Gamma Waves (30-100 Hz) that are associated with high levels of cognitive processing, perception, and attention. They are also associated with peak emotional experiences, such as excitement, happiness, and joy.
Research has shown that different emotions and levels of engagement can be correlated with specific patterns of EEG waves [3,4]. For example, positive emotions, such as happiness and relaxation, are associated with an increase in theta and alpha waves, while negative emotions, such as fear and anxiety, are associated with an increase in beta and gamma waves. Additionally, engagement in a task is often associated with an increase in beta waves [5].
It's important to note that the interpretation of EEG waves and their correlation with emotions and engagement is still an active area of research [6], and there is ongoing debate about the exact relationships between brain activity and emotions. However, EEG is a useful tool for studying the brain's response [7] to different emotional and cognitive states and has the potential to inform the development of emotion recognition systems.
Measuring and assessing UE and UX with EEG signals involves recording brain activity in response to specific stimuli, processing and extracting features from the EEG signals, and using machine learning algorithms to classify [8,9] the features into different emotional and cognitive states. The basic steps involved in measuring and assessing UE and UX with EEG signals are 1) stimulus presentation, such as images, sounds, or videos are presented to the participant, 2) EEG signals are recorded from the participant’s scalp using sensors attached to the scalp, 3) the raw EEG signals are pre-processed to remove noise and artifacts [10], and to extract features that are relevant to emotion and cognitive detection, 4) feature extraction, where various features, such as frequency bands, event-related potentials (ERPs), and time-domain features, are extracted from the pre-processed EEG signals, 5) emotion and cognitive classification using machine learning algorithms, such as support vector machines (SVM) or deep learning models to classify the extracted features into different emotional states, such as happiness, sadness, fear, or anger, 6) evaluate the performance of the classification model using metrics such as accuracy, precision, recall, and F1-score.
Figure 1. Structured summary of the proposed systematic review.
Preprints 142315 g001
This paper reports studies including methods and approaches for analysing UE and UX based on EEG data. This systematic review focuses on a comprehensive and objective presentation of the studies following the entire information flow of the experiments, from the EEG recordings, the pre-processing, the feature extraction and the analysis, which can be either statistical analysis or classification or even clustering. The methodological approach adopted to locate relevant studies meticulously adheres to the rigorous guidelines outlined in the Preferred Reporting Items for Systematic Reviews and Meta-Analyses (PRISMA) statement. PRISMA, renowned for its systematic review and meta-analysis reporting standards, was deliberately selected to not only validate but also augment the credibility of our literature review. This strategic choice also serves to refine the scope of our review, ensuring that our objectives remain tightly focused on the core research questions at hand. By aligning with PRISMA, we are following a well-established protocol that promotes transparency, thoroughness, and methodological rigor in the identification, selection, and analysis of research records. The broad acceptance of PRISMA within the academic community underscores its reliability and effectiveness in facilitating systematic reviews, thereby enhancing the trustworthiness and impact of our study's findings.
This document is organized as follows: Section 1 presents an introduction of the topic, with an overview of UE and its relation to emotions classification and EEG recordings. Section 2 presents the research methodology that was followed, based on the PRISMA statement. Section 3 analyzes the components of our research and presents the studies. It is being categorized in several subsections, following the methodology of the review, including study of the papers according to ther application field, study design and used instruments for data acquisition, pre-processing methods, feature extraction and feature selection algorithms and analysis of EEG recordings. Section 4 features the conclusions for this survey and further discussion.

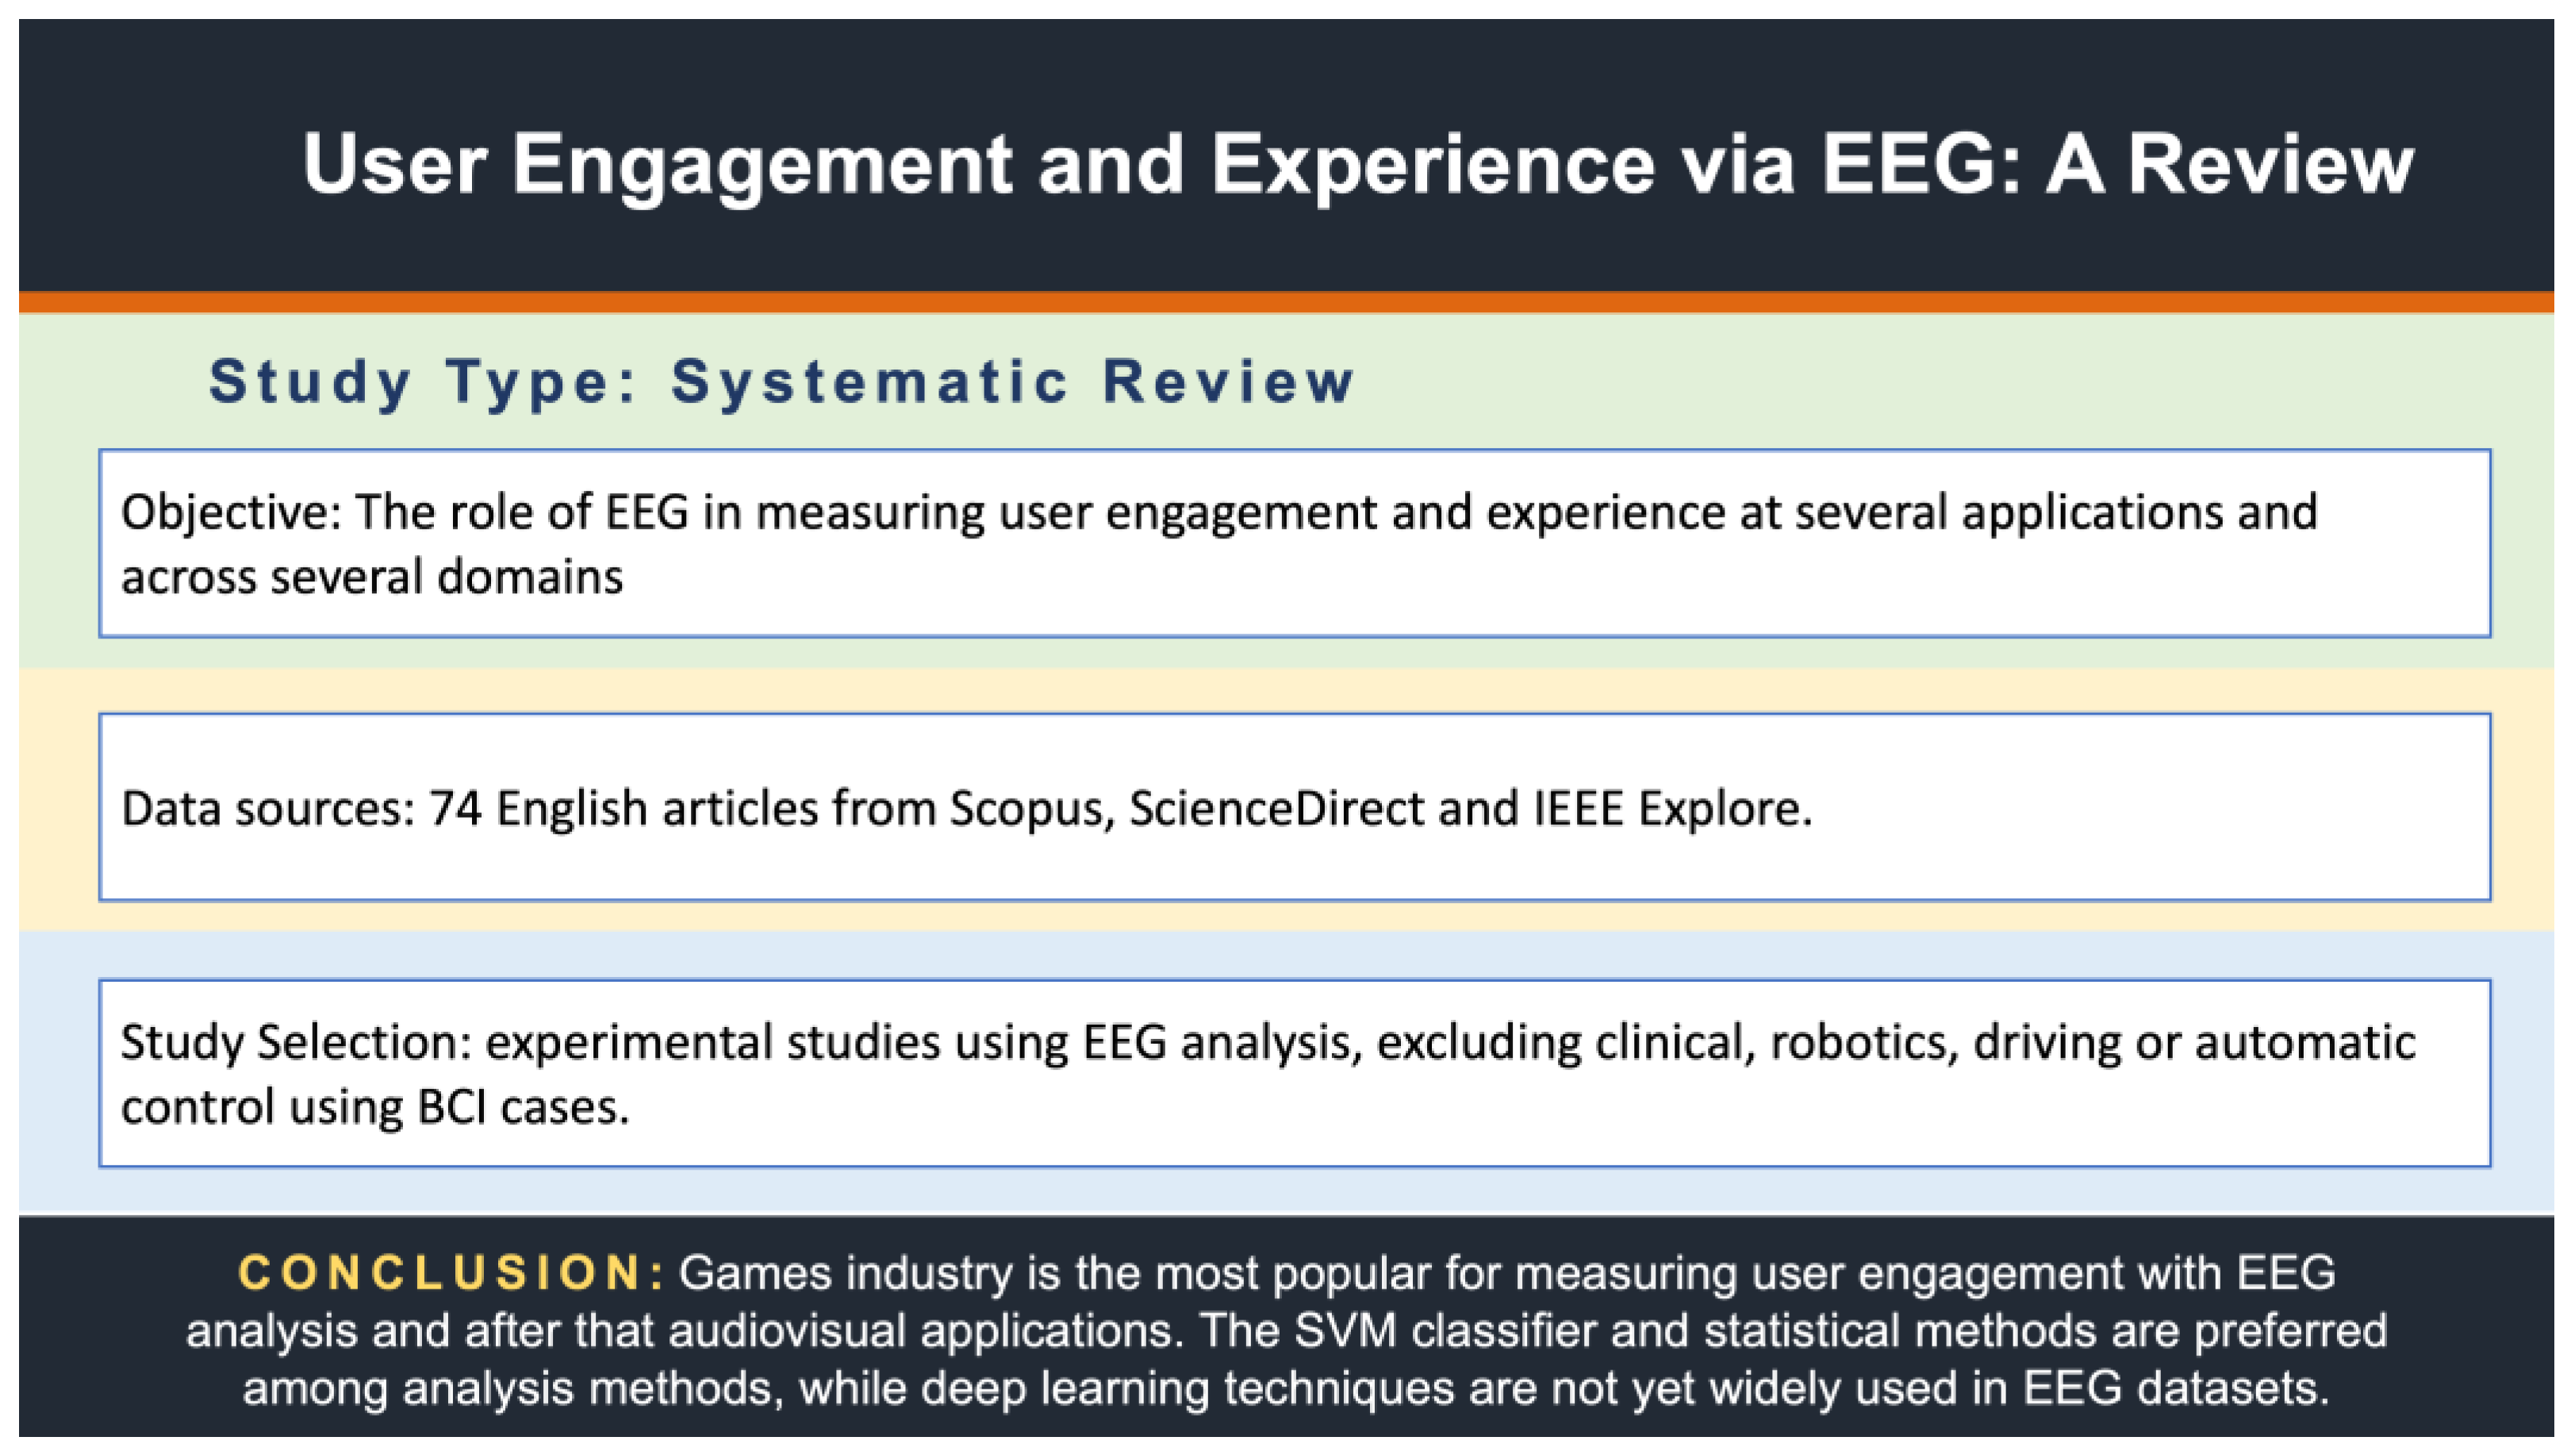
2. Research Methodology

The literature search was performed on August 2024 using the most popular and comprehensive search engines for scientific articles: Elsevier’s Scopus, IEEE Xplore and Elsevier’s ScienceDirect. The search was not limited to a specific time and focused exclusively on EEG analysis in non-clinical and non-automatic control cases. Therefore, only studies containing the keywords “EEG analysis” and “User engagement” or “User experience” in the title or abstract of the paper were included. On the other hand, studies containing the keywords “rehabilitation”, “robotics”, “driving”, “automatic control” in the paper’s title or abstract and in general all studies including patients were excluded. Papers that included those terms were not relevant to our objectives, because they focused on the results of engagement in the specific domain they were involved, without further details about the methods of EEG analysis.
After the first search results, during the screening phase, theoretical studies such as systematic Reviews, Books and Book Chapters of nonexperimental studies were excluded. Articles written in a language other than English were also removed.
In the final stage, eligibility criteria are applied. Initially the paper’s title and abstract were read and then specific sections of the paper (i.e., Methodology and Discussion), wherever needed to clarify the objective and the methodology of the paper. Then, we reported the main aspects of the experimental papers in a data extraction sheet. For each experimental study all the 27 items listed in the PRISMA statement are extracted and organized into the following groups:
  • Study objectives, where the overall aim and objectives are being examined.
  • Study population, including the number of subjects or reporting the EEG open database that is used.
  • Experimental protocol, describing the experiment that was used for EEG data acquisition.
  • Methodology, including the preprocessing step, the feature extraction, the classification/statistical analysis.
  • Results and conclusion, including the findings from the study.
Then, the data extraction sheet was studied, and papers were included or excluded based on the criteria that were specified. Studies meeting one or more of the following criteria were excluded:
  • Using EEG for automatic control (Brain Computer Interface).
  • Subjects of the experimental protocol including patients, disabled people, infants, and drivers.
  • Application of the EEG study to rehabilitation, Intensive Care Unit, and surgery.
  • Application of the EEG study to meditation.
Afterwards, a second filtering process was applied and theoretical studies, such as Review papers were excluded, as well as studies that are not in English language and studies that do not present details for preprocessing, feature extraction and/or analysis of EEG signal.

3. Results

From the three search engines that were used (Elsevier’s Scopus, IEEE Xplore and Elsevier’s ScienceDirect) we identified 460 in total. The exact query that was applied in all three search engines was the following: “EEG AND analysis AND user AND engagement” OR “EEG AND analysis AND user AND experience” and was applied in the title and abstract of the papers. Then, using the Rayyan tool (an AI Powered Tool for Systematic Literature Reviews tool), 224 duplicate records were detected and removed, resulting to 236 papers that were proceed to the first evaluation phase.
Finally, exclusion criteria were applied and eventually 116 papers were selected for thorough examination. The exclusion criteria are reported in Section 2. After applying the second filtering process, the number of papers were limited to 74. The flowchart in Figure 2 follows the PRISMA statement where at the chart’s top, the research query is presented. This is important, since following the PRISMA guidelines contributes to the credibility and reliability of systematic reviews and meta-analyses, benefiting the scientific community and informing evidence-based practice.
Then, the various stages of the systematic literature review are displayed, showing the number of records detected, evaluated, and excluded as well as the reasons why the records were restricted.
The papers are categorized based on their application field, while are analysed and studied based on their experimental data acquisition protocol details (participants in the study, EEG device used and EEG channels) and their methodology of analysis including the preprocessing steps, feature extraction methods, and EEG analysis including either classification or statistical analysis, as depicted in Figure 3.

3.1. Application Field

The analysis that was conducted of several studies, resulted in the categorization of studies based on their application field, as indicated in Table 1.
This categorization allowed for a deeper understanding of the diverse range of contexts in which the studies were conducted and the specific domains to which they contributed. The studies were carefully examined and grouped according to their primary application areas, such as architecture design, media (advertisements and in general audiovisual stimuli), games, aesthetic and usability of interface and product design, learning and education field, virtual reality navigation and immersion and applications in workplace. Within each category, key themes and trends emerged, shedding light on the unique challenges and opportunities associated with UE research in different fields. By categorizing the studies based on their application field, researchers and practitioners can gain insights into the specific contexts in which UE is relevant and tailor their approaches and interventions accordingly. Additionally, this categorization enables cross-domain comparisons and the identification of potential transferable findings or methodologies that could benefit multiple application areas. Overall, the categorization of studies based on their application field enhances the understanding and applicability of UE research, fostering advancements in various domains and facilitating targeted interventions and innovations.

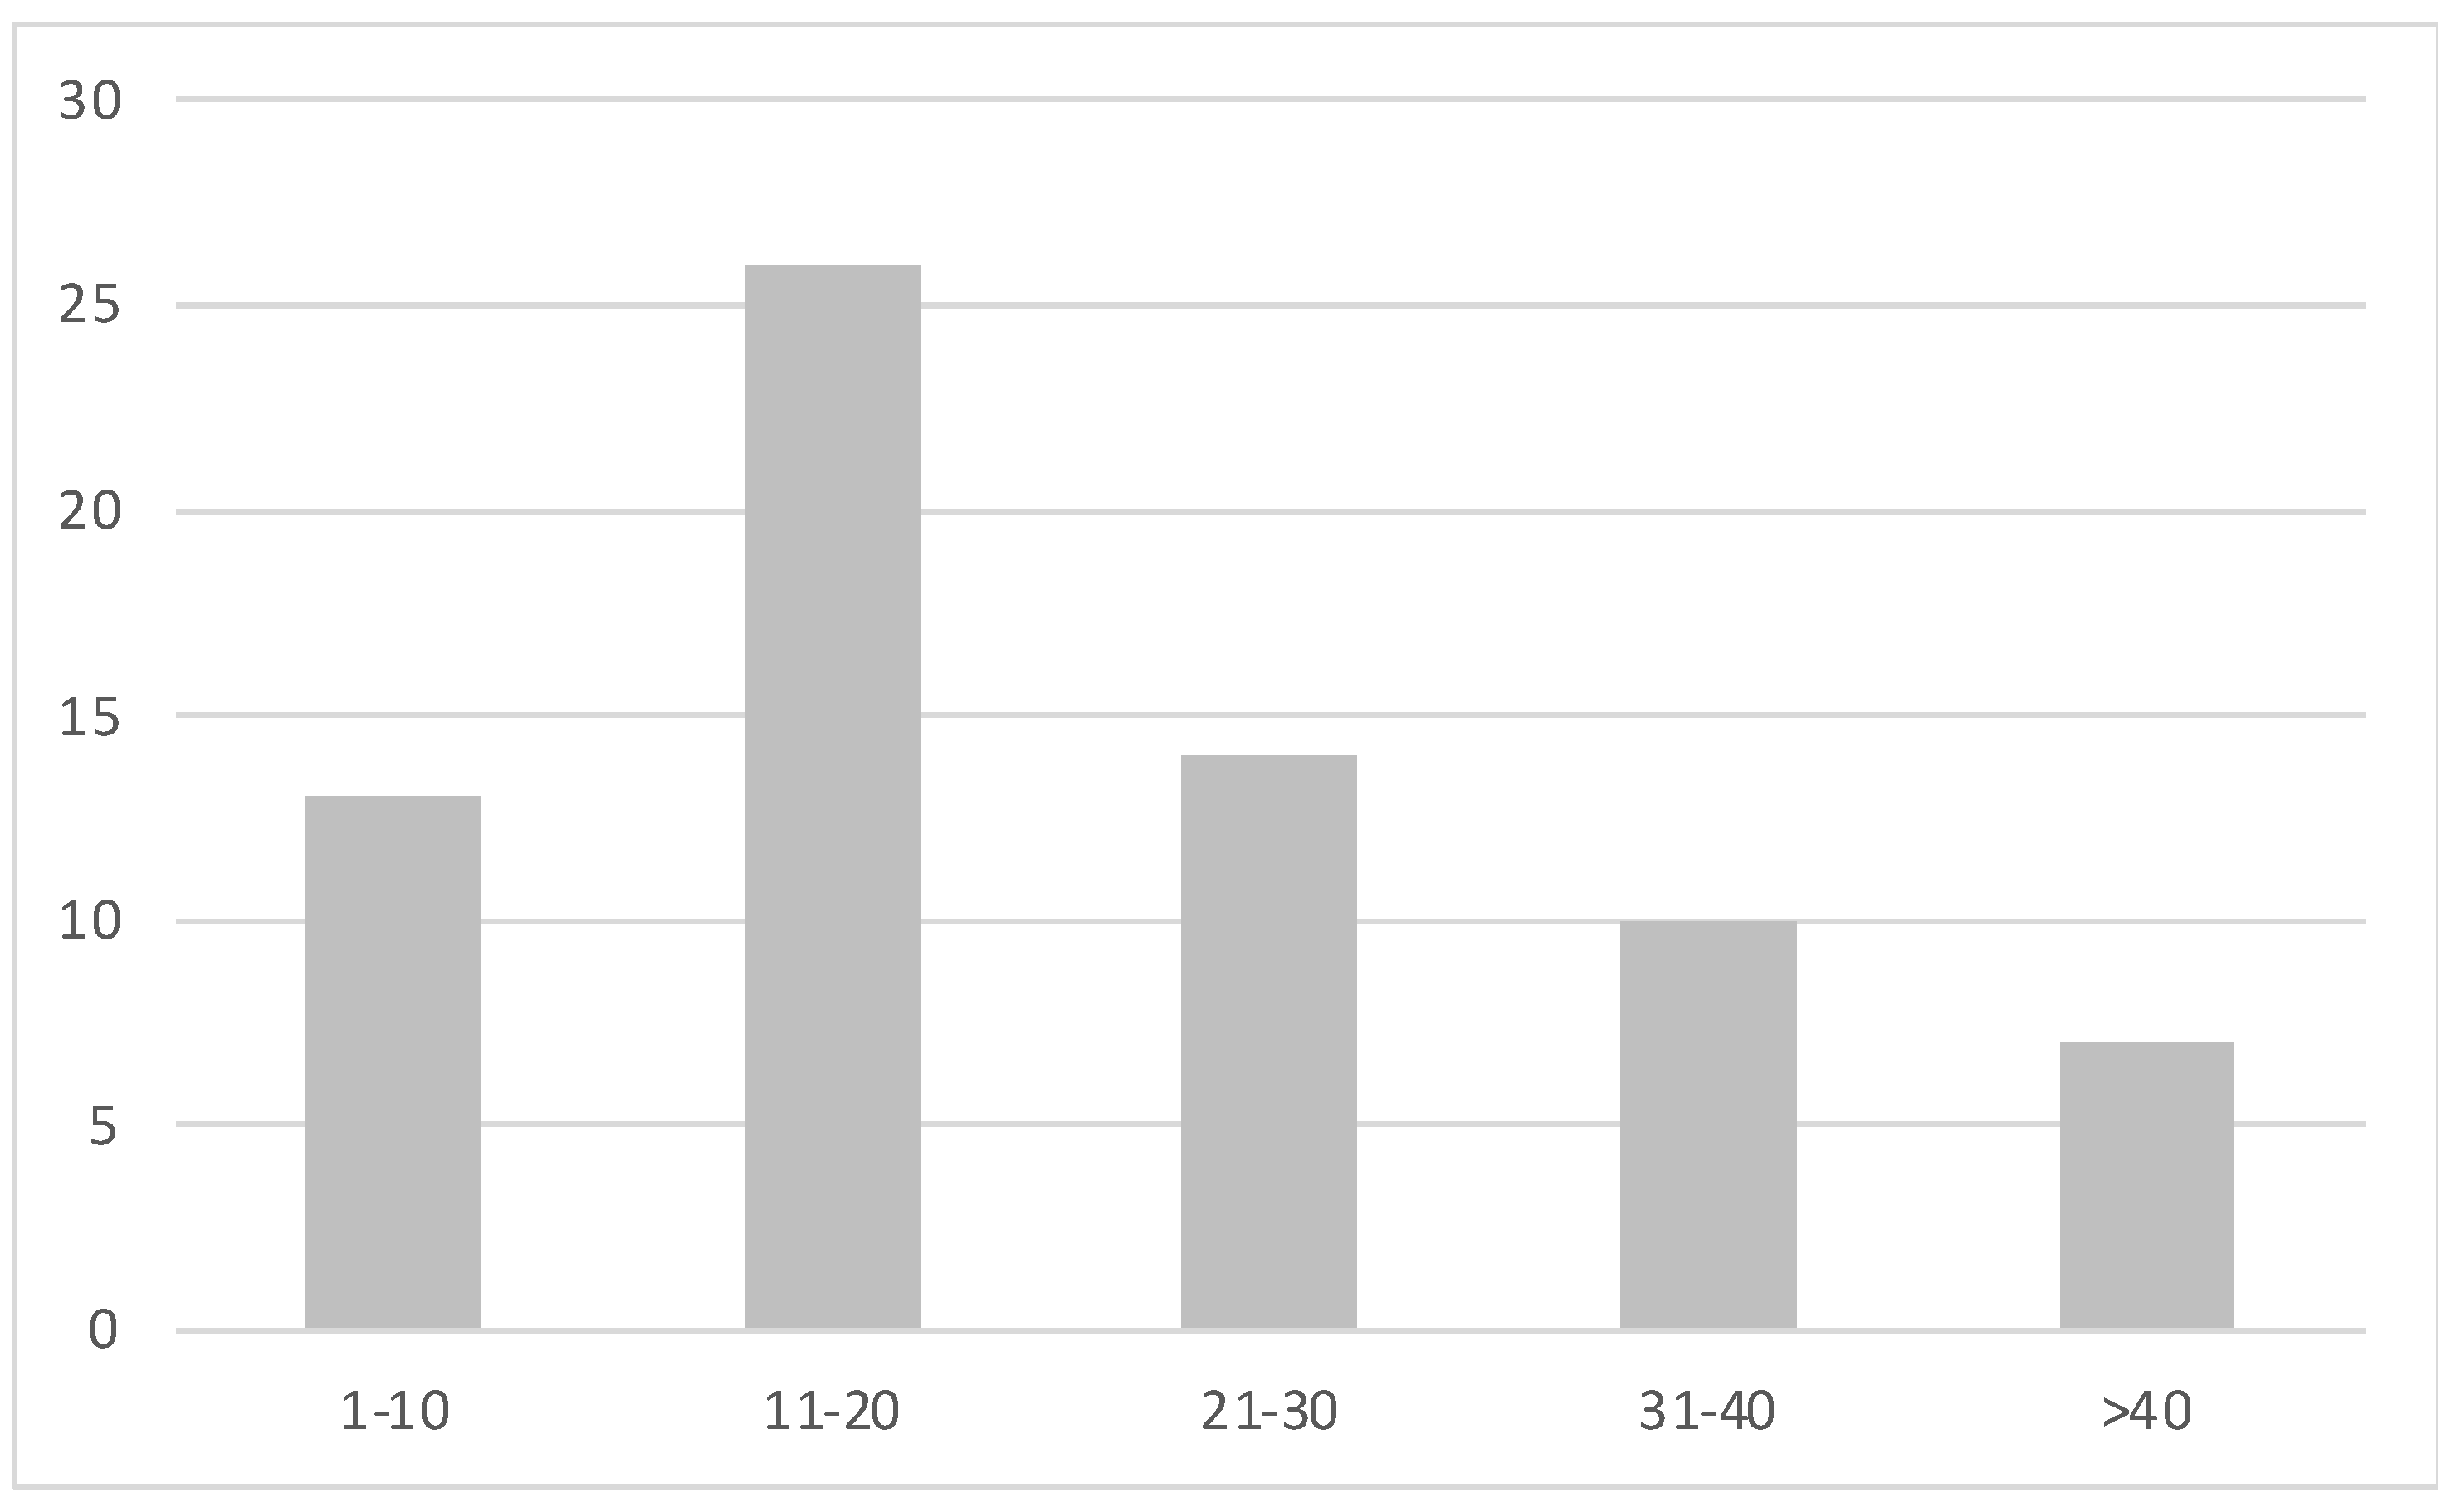
3.2. Study Design and Instruments for Data Acquisition

The different works that have been studied can, also, be categorized based on the number of participants that were recruited towards data acquisition (Table 2). This categorization provides valuable insights into the sample sizes and participant characteristics across various studies in the field. The number of participants is a critical factor in research as it influences the statistical power, generalizability, and reliability of the findings. By examining the studies within different participant size categories, patterns and trends related to sample sizes can be identified. Some studies may have focused on small-scale investigations with a limited number of participants, as an experimental setup testing or as a first step towards a future and larger study. On the other hand, larger-scale studies with larger participant cohorts may have aimed to establish more robust statistical relationships or capture broader population characteristics. Categorizing the works based on participant numbers facilitates a comprehensive understanding of the research landscape, highlighting the variations in sample sizes and their implications for data interpretation and research outcomes. Additionally, it can guide researchers in selecting appropriate sample sizes for future studies and provide insights into the feasibility and practicality of different research designs. Overall, the categorization based on the number of participants contributes to a nuanced perspective on the research findings and methodology employed in UE studies.
Most of the studies have used their own dataset, with participants that were recruited in the framework of the study and EEG data were collected. This approach allows researchers to have full control over the experimental design, participant selection, and data collection procedures, ensuring that the data aligns closely with the specific research objectives. By utilizing their own dataset, researchers can tailor the data acquisition process to capture the necessary information relevant to their study's focus. This includes designing specific experimental paradigms, controlling environmental factors, and customizing the EEG recording setup to meet the study's requirements. Additionally, researchers can directly collaborate with participants, ensuring clear communication and informed consent throughout the data collection process.
Alternatively, there are also public datasets, like the DEAP with EEG data that have been used in studied works, like in [18,21,27,29,30], but also the public datasets published in ACMMM 2015 [91], Kaggle [79] and AMIGOS [39,40]. Public datasets enable researchers to validate their findings on independent datasets, promote transparency and reproducibility, and facilitate comparisons and benchmarking of different analysis methods. Public datasets also encourage collaboration and knowledge sharing within the research community, allowing researchers to build upon existing work and explore novel research directions. The use of public datasets alongside proprietary datasets contributes to a comprehensive understanding of UE in EEG-based studies, drawing from a variety of data sources and ensuring the robustness and generalizability of research findings.
This systematic review highlights the diverse range of EEG devices utilized in various studies for experiment setup and data acquisition, as indicated in Table 3. Researchers have employed EEG devices with varying numbers of channels and different levels of installation complexity to suit the specific research objectives and experimental requirements. Some studies have utilized EEG devices with a limited number of channels, focusing on capturing activity from specific brain regions of interest. These devices are often lightweight and portable, allowing for flexibility in experimental settings and participant comfort. On the other hand, other studies have employed high-density EEG systems with a large number of channels, enabling more comprehensive coverage of the scalp and capturing activity from multiple brain regions simultaneously. These systems typically require meticulous placement of numerous electrodes and may involve more complex calibration and setup procedures.
The choice of EEG device depends on the specific research goals, the desired spatial resolution, and the trade-off between measurement accuracy and experimental practicality. Researchers must carefully consider the balance between the number of channels, the spatial coverage, and the level of participant burden during the experimental sessions. Additionally, the selection of EEG devices may be influenced by factors such as budget constraints, availability, and compatibility with existing data analysis pipelines. By documenting the variety of EEG devices used across different studies, this systematic review sheds light on the methodological considerations and technical aspects involved in EEG-based UE research. It also provides researchers with insights into the range of available options when planning their own experimental setups and data acquisition protocols.

3.3. Pre-Processing Analysis

Preprocessing is important for EEG signal analysis because it helps to improve the quality and reliability of the data, making it easier to detect and analyze the underlying neural activity. EEG signals are often contaminated by various types of noise and artifacts, such as power line interference, electrode drift, and muscle activity. Preprocessing techniques such as filtering, artifact removal, and baseline correction can help to remove or reduce these sources of noise and artifacts. Also, these signals are often weak and buried in noise. Preprocessing techniques such as filtering and artifact removal can help to enhance the signal-to-noise ratio, making it easier to detect and analyze the underlying brain activity. In addition, preprocessing is an important step towards standardization of data. More specifically, EEG data can be recorded using different systems, settings, and electrode placements. Preprocessing techniques such as referencing and downsampling can help to standardize the data and ensure that it is comparable across different participants and experiments.
Table 4. Pre-processing steps of EEG Signals.
Step References
Filtering [11,12,14,15,16,17,18,19,22,23,24,25,26,27,30,33,34,35,43,45,47,49,51,54,58,60,61,62,63,65,66,68,70,78,81,82,84,87,88,90]
Artifact removal [12,16,19,23,24,25,26,30,43,44,45,49,51,52,54,55,57,61,65,66,68,70,75,81,84,86,90]
Epoching [15,16,23,51,52,58,61,65,78,81,86,87]
Independent Component Analysis [12,15,16,24,34,43,51,58,61,62,63,65,68,70,87,88,90]
Referencing [15,16,17,24,30,34,49,51,58,61,65,81,87,90]
Baseline correction [14,24,28,33,51,58,62,65,68,78,82,84,88]
Downsampling [18,30,34,43,49,61,68]
Furthermore, since EEG data is typically recorded continuously over a period of time, some techniques, such as epoching, can help to segment the data into smaller segments that correspond to specific events or stimuli, making it easier to analyze the data.
Thus, preprocessing includes several steps that can be applied to EEG signals. The specific preprocessing steps used will depend on the research question and the characteristics of the EEG data being analyzed, including:

3.3.1. Filtering

Various types of noise, such as power line interference, muscle artifact, and electrode drift, is usually included in capturing EEG signals. Filtering techniques such as high-pass, low-pass, band-pass, and notch filters can be used to remove these noise sources and enhance the signal-to-noise ratio of the EEG. Filtering is being used in almost all publications that have been studies in this systematic review by usually applying a band pass filter.
The choice of filter will depend on the specific research question and the characteristics of the EEG signal being analyzed. However, notch filters and high-pass filters are among the most commonly used filters for EEG preprocessing. Notch filters are used to remove power line interference at 50 or 60 Hz, which is a common source of noise in EEG recordings. Since power line interference is a ubiquitous source of noise in EEG data, it is often necessary to apply a notch filter to remove it. High-pass filters are used to remove low-frequency drifts and noise from the EEG signal and are an important step in EEG preprocessing. The specific cutoff frequency for the high-pass filter will depend on the characteristics of the data being analyzed and the research question, but commonly used cutoff frequencies range from 0.1 Hz to 1 Hz. The Butterworth filter is also used in several studies, which is a type of infinite impulse response (IIR) filter, which is a category of digital filters. The Butterworth filter is a type of low-pass filter that provides a maximally flat passband, meaning that it has a very smooth frequency response without any ripples or oscillations in the passband. The Butterworth filter is commonly used in EEG signal processing for noise and artifact removal, as well as for extracting specific frequency bands of interest.
In addition to these filters, other preprocessing techniques can be used to remove artifacts from the EEG signal, including Independent Component Analysis (ICA), which can be used to separate out independent components corresponding to different sources in the signal and will be studied independently due to its significance.

3.3.2. Artifact Removal

Even after filtering, EEG signals can still contain artifacts that may affect the interpretation of the data. Artifacts can be caused by eye movements, muscle activity, and other sources. Techniques such as wavelet denoising can be used to identify and remove artifacts from the EEG.
It is a method of artifact removal that uses wavelet transforms to decompose the EEG signal into different frequency bands. The wavelet transform is a mathematical technique that allows the decomposition of a signal into different scales and frequencies, which can then be selectively filtered or modified. Wavelet denoising can be used to remove a variety of different types of artifacts from EEG data, including line noise, muscle artifacts, and other types of high-frequency noise. The specific wavelet transforms and denoising algorithm used will depend on the characteristics of the EEG data being analyzed and the specific research question.
While wavelet denoising can be an effective method for removing artifacts from EEG data, it is important to note that it is not a substitute for proper preprocessing techniques such as filtering and artifact rejection. These techniques should be used in combination with wavelet denoising to ensure the best possible signal quality and to minimize the risk of introducing bias or artifacts into the analysis.

3.3.3. Epoching

EEG signals are typically recorded over a long period of time. In order to analyze the data, the signal is often segmented into smaller segments or epochs, typically with a duration of a few hundred milliseconds to a few seconds. The purpose of epoching is to isolate specific events or time periods of interest in the EEG signal, such as the presentation of a stimulus, the onset of a cognitive process in response to specific stimuli or events.
By segmenting the EEG signal into epochs, it becomes easier to analyze specific features of the signal, such as the timing, amplitude, or frequency content of EEG events. Additionally, epoching can help to reduce the impact of noise and artifact on the analysis, as these can be more easily identified and removed or corrected on a per-epoch basis.
Epoching can be performed manually, using software tools that allow the researcher to visually inspect the continuous EEG signal and select specific time periods of interest. Alternatively, automated methods can be used to detect and segment EEG epochs based on predefined criteria, such as amplitude thresholds, event markers, or statistical features of the signal. The Hanning window, widely used in preprocessing, can be considered as part of the epoching step in EEG pre-processing, but it can also be used as a stand-alone pre-processing step for spectral analysis. In the context of EEG analysis, epoching involves dividing the continuous EEG signal into small segments or "epochs" of equal duration. Each epoch is then windowed with a Hanning window or another type of window function before performing a Fourier transform or other spectral analysis.

3.3.4. Independent Component Analysis (ICA)

ICA typically applied as a separate step in the preprocessing of EEG signals, after the initial steps of filtering, artifact removal, and epoching have been performed. ICA is a blind source separation technique that separates the EEG signal into a set of statistically independent components, each of which represents a different neural or non-neural source of activity. ICA is typically applied after the initial preprocessing steps of filtering, artifact removal, and epoching. Once the EEG signal has been filtered to remove noise and artifacts, and segmented into epochs corresponding to different experimental conditions, ICA can be used to further separate out the neural and non-neural sources of activity. The independent components that are identified by ICA can be further inspected and evaluated to determine which components are related to neural activity and which components are related to non-neural sources of activity, such as eye movements, muscle activity, or environmental noise. The non-neural components can then be removed from the EEG data, leaving behind a cleaned EEG signal that is more representative of the underlying neural activity.

3.3.5. Referencing

A reference electrode is usually used in capturing EEG signals. However, the choice of reference can affect the interpretation of the data. Common reference choices include linked mastoids, average reference, and reference-free methods. The goal of referencing is to eliminate the common noise that is present in all EEG channels by subtracting a reference signal from each channel. This helps to reduce the influence of common noise sources such as environmental electrical fields, electrode drifts, and amplifier offsets. Average referencing is the most common referencing method used in EEG data analysis. In this method, the signal at each electrode is referenced to the average of all the electrodes. This method is simple to implement and is widely used in EEG research. However, it is important to note that the choice of referencing method should be carefully considered based on the specific research question, the characteristics of the EEG data, and the goals of the analysis. Some studies may require alternative referencing methods such as Laplacian or common average referencing, depending on the nature of the experimental design and the EEG signals being recorded. The choice of referencing method will depend on the specific research question, the characteristics of the EEG data, and the goals of the analysis. In general, it is important to carefully consider the referencing method and to use a consistent referencing method across all participants and conditions in the study.

3.3.6. Baseline Correction

EEG signals often contain baseline fluctuations that can be attributed to changes in the participant's arousal or attention. Baseline correction involves subtracting the mean or median amplitude of the baseline period from each epoch.
This can be done to correct for drift, remove low-frequency noise, or normalize the signal prior to further analysis. The choice of baseline correction method in EEG analysis depends on the specific characteristics of the EEG signal and the goals of the analysis. Thus, mean subtraction and linear detrending may be appropriate for correcting for drift in stationary signals, while high-pass filtering, and wavelet-based methods may be more appropriate for removing low-frequency noise or baseline drift in non-stationary signals. Polynomial fitting may be useful for removing more complex trends or baseline artifacts.

3.3.7. Downsampling

EEG signals are often sampled at a high rate to capture high-frequency components of the signal. However, high sampling rates can lead to large data files and computational complexity. Downsampling involves reducing the sampling rate of the EEG signal while preserving its information content.
The most common way to downsample an EEG signal is to apply a low-pass filter with a cutoff frequency below half of the new sampling rate, followed by discarding the unwanted samples. This filtering step is necessary to prevent aliasing, which is a distortion of the signal that can occur when the sampling rate is insufficient to capture the high-frequency content of the signal. Once the signal has been low pass filtered, it can be decimated by removing the unwanted samples, resulting in a lower sampling rate. The amount of downsampling required will depend on the specific requirements of the analysis and the processing power available, as higher levels of downsampling can lead to faster processing times but may also result in a loss of information in the signal.

3.4. Feature Extraction and Selection

Feature extraction and selection are important steps in EEG signal analysis that involve identifying and extracting relevant features from the EEG data and selecting the most informative features for subsequent analysis.
Feature extraction is the process of identifying and extracting relevant features from the EEG data. These features can be derived from various aspects of the EEG signal, such as the amplitude, frequency, phase, and time-domain characteristics. Some common features that are extracted from EEG signals include spectral power, coherence, cross-correlation, and event-related potentials (ERPs). The choice of features to extract will depend on the research question and the characteristics of the EEG data being analyzed. Table 5 summarizes the most common methods of feature extraction methods that have found in the studied works. The references regarding the frequency domain methods are split, due to their high presences in studies, to PSD, FFT and Other methods, including Discrete wavelet transform (DWT), Discrete Fourier transform (DFT) and Welch method.

3.4.1. Time-Domain Methods

These are popular methods to analyze the amplitude and temporal characteristics of the EEG signal. The Event-related potential (ERP) analysis is one of the most common time-domain methods used for EEG signal analysis. The ERP waveform is obtained by averaging the EEG signals time-locked to a specific stimulus or event, typically over multiple trials. The resulting waveform is characterized by several temporal features such as peak latency, amplitude, and duration, which can provide insights into the neural mechanisms underlying cognitive processes such as perception, attention, and memory. ERP analysis is widely used in both clinical and research settings to investigate various aspects of brain function, such as sensory processing, cognitive control, and language processing, among others. Other common time-domain features include peak-to-peak amplitude, root mean square (RMS), zero-crossing rate, and waveform morphology descriptors such as slope, curvature, and asymmetry. Time-domain methods are computationally efficient and can capture fast temporal changes in the signal, but they may not capture frequency-specific information.

3.4.2. Frequency-Domain Methods

These methods analyze the spectral content of the EEG signal by decomposing it into its frequency components. Common frequency-domain features include spectral power, spectral entropy, peak frequency, and coherence between different frequency bands. Frequency-domain methods can capture frequency-specific information and are often used to investigate EEG oscillations related to different brain functions, such as alpha, beta, and gamma oscillations. The power spectral density (PSD) analysis is a powerful and common method for investigating brain activity using EEG signals. PSD analysis provides information about the frequency content of the EEG signal, which can be useful for identifying specific frequency bands of interest, such as alpha, beta, theta, and delta. This can help in understanding the underlying neural processes associated with different cognitive or behavioral states. It is non-invasive, since EEG signals can be easily and non-invasively recorded from the scalp and a relatively simple method that involves calculating the power spectrum of the EEG signal, which can be easily implemented using software packages such as MATLAB or Python. PSD analysis can be used to compare the spectral power between different groups, such as patients and healthy controls, or between different experimental conditions. This can help in identifying differences in neural processing between groups or conditions. Finally, it can be used for real-time monitoring of brain activity, which can be useful in applications such as neurofeedback or brain-computer interfaces. Another popular frequency domain method is the Fast Fourier Transform (FFT), which is a mathematical algorithm used to transform a time-domain signal into a frequency-domain signal. In EEG signal analysis, FFT is commonly used to extract frequency-domain features such as power spectra, coherence, and phase locking. These features can provide information about the distribution of energy across different frequency bands, which can be used to investigate various aspects of brain function, such as arousal, attention, and cognitive processing.

3.4.3. Time-Frequency-Domain Methods

Time-frequency-domain methods analyze both the temporal and spectral characteristics of the EEG signal. Common time-frequency features include spectrograms, wavelet transform coefficients, and Hilbert-Huang transform coefficients. Time-frequency methods can capture frequency-specific information and temporal changes in the signal and are often used to investigate event-related spectral perturbations (ERSPs) or event-related synchronization and desynchronization (ERS/ERD) related to specific cognitive or motor tasks. Another time-frequency domain method commonly used in EEG signal analysis is the Short-Time Fourier Transform (STFT). It is a modification of the Fourier Transform that allows us to analyze the frequency content of a signal as it changes over time. The STFT involves breaking down the signal into overlapping segments and applying the Fourier Transform to each segment. The resulting spectrum at each time point reflects the frequency content of the signal over that segment of time. The STFT is often used to extract time-frequency domain features from EEG signals, such as power spectra, ERS/ERD, and phase-locking. These features can provide important information about the temporal dynamics of neural activity, and how they relate to specific cognitive or behavioral processes.

3.4.4. Spatial-Feature Based Methods

These methods analyze the spatial distribution of the EEG signal by extracting features from different electrode locations or brain regions. Common spatial features include scalp potential maps, current density maps, and inter-electrode coherence. Spatial-feature based methods can capture the topographic distribution of the EEG signal and are often used for source localization and functional connectivity analysis.

3.4.5. Feature Selection Methods

On the other hand, feature selection is the process of selecting the most informative features from the extracted set of features. The goal of feature selection is to reduce the dimensionality of the feature space, and to identify the most relevant features that are most informative for the EEG analysis.
There are various techniques for feature selection, such as filter methods, wrapper methods, and embedded methods. Filter methods involve ranking the features based on their statistical significance and selecting the top-ranked features. The correlation-based feature selection (CFS) can be considered a type of filter method for feature selection [44]. CFS specifically uses the correlation between features and the target variable, as well as the redundancy between features, to select the most informative subset of features. Other filter methods may use different statistical measures to rank the relevance of features, such as t-tests or ANOVA (see Table 6).
Wrapper methods involve evaluating the performance of a model using different subsets of features, and selecting the subset that gives the best performance. Embedded methods, like the least absolute shrinkage and selection operator (LASSO) [74]. involve selecting features as part of the model-building process, such as in a regularized regression model. The choice of feature selection method will depend on the size of the feature space, the number of samples, and the goals of the analysis. Feature selection can help to improve the performance of subsequent analyses, such as classification or clustering of the EEG data.

3.5. Analysis of EEG Recordings

Feature extraction involves identifying and extracting relevant features from the raw EEG signal, which can then be used for further analysis, such as classification, clustering, or correlation analysis to gain insights into the patterns and relationships in the EEG data. These analyses are typically performed on the extracted features or on the raw EEG data itself. They can be used to identify differences in neural activity between conditions or groups, classify EEG data into different categories, identify subgroups of individuals with similar patterns of neural activity, examine the relationship between EEG data and other variables, or identify network-level changes in neural activity.
There are several types of analyses that can be performed on EEG data, based on the available features and the outcome that should be reached. In general, the different methods are presented in Table 6, along with their references to the studied works, and can be categorized into the following categories: statistical analysis, machine learning and graph theory.

3.5.1. Statistical Analysis

Statistical analysis can be useful for identifying differences in neural activity that are associated with different cognitive states or clinical conditions. It includes several methods and metrics spanning from basic descriptive statistics, such as mean and, up to more advanced like correlation analysis that examines the relationship between EEG data and other variables, such as behavioral measures or other physiological signals. Correlation analysis can be useful for identifying neural correlates of behavior or other physiological processes. More specifically, Pearson correlation is a statistical method used to assess the relationship between two variables, and it can be applied to EEG data to study the relationship between different brain regions or between EEG signals and behavioral performance. Pearson correlation can be used to quantify the strength and direction of the relationship between two variables, and to assess the significance of the correlation using hypothesis testing.
Other popular methods are regression analysis that involves modeling the relationship between EEG signals and other variables, such as behavioral data and hypothesis testing identifying whether there is a difference between two groups of subjects. The most popular hypothesis testing method is ANOVA, which can be used to compare means between two or more groups of EEG data to determine if there are significant differences in activity between these groups.
Traditional statistical analysis methods may be preferred over machine learning methods in EEG data analysis for certain applications or domains where the data are relatively simple, or the research questions are well-defined. For example, in studies of cognitive processes such as attention or memory, researchers may use traditional statistical methods such as ANOVA or regression to analyze the relationship between EEG signals and behavioral performance. Similarly, in studies of sensory processing or perception, researchers may use traditional statistical methods such as signal averaging or spectral analysis to analyze the EEG data.
Due to the high frequency of ANOVA presence in the studied works, that statistical analysis methods in Table 6 are divided in ANOVA-like methods and rest of statistical tests, mainly the Pearson Correlation [15,21,29,33,43,65,73,83,90] and the t-test [14,20,29,44,45,61,69,73,83].
In some cases, traditional statistical methods may also be preferred for applications that involve a small number of participants or a relatively simple experimental design. For example, in studies of media engagement or virtual reality, researchers may use traditional statistical methods to analyze the EEG data and identify patterns of brain activity associated with specific stimuli or tasks.

3.5.2. Machine Learning

This category includes more advanced methods that are all included in the same row of Table 6, like i) classification of EEG data into different categories or groups. Classification analysis can be useful for identifying patterns of neural activity that are associated with different cognitive tasks or clinical conditions, mainly using Support Vector Machines (SVM), Random Forest and k-Nearest Neighbors (k-NN) [20,27,30,32,44,52,53,66,75,76,80,84,85] or using a Bayesian classifier [22,44]. Classification is a type of supervised learning where a model is trained to predict the class or category of a given input, based on the features extracted from that input. ii) Clustering to group EEG data into clusters based on their similarity [17,66,68] all using the k-means algorithm. Clustering analysis can be useful for identifying subgroups of individuals with similar patterns of neural activity. iii) Deep learning to analyze the EEG data and identify complex patterns. Deep learning is a subset of machine learning that involves training deep neural networks to learn and represent complex patterns in the data. Mainly, convolutional Neural Networks (CNN) are used In EEG analysis [18,21,40,62] to automatically learn features from the EEG data, without the need for manual feature engineering. Deep learning models can also be used for classification tasks, where the model learns to predict the class or category of a given EEG signal, but here are considered as a separate category due to its significance. iv] Model predictions, using shapley additive explanation (SHAP) values [12] or other algorithms like Random Forests [50,74]. SHAP values are used to estimate the contribution of each feature to the final prediction of a machine learning model. They provide a way to understand the importance of individual features in the model and how they contribute to the final prediction. This can be useful for identifying which features are most important in a task and for identifying potential issues with the model.
Overall, machine learning methods are particularly useful in EEG data analysis when dealing with large and complex datasets and when traditional statistical analysis methods may not be sufficient to capture the complex relationships between brain activity and cognitive variables. In addition, machine learning methods can be useful even in applications where traditional statistical methods are typically used. For example, machine learning methods are used to identify patterns or clusters of EEG activity that may be difficult to detect using traditional statistical methods, or to classify EEG data into different categories or groups based on complex features or variables. Main applications of machine learning methods include:
  • Brain-Computer Interface (BCI): Machine learning methods are widely used in BCI applications to classify EEG signals and decode user intentions. These methods can be used to analyze EEG data in real-time and make predictions based on the user's brain activity, which can be used to control external devices or applications.
  • Cognitive Neuroscience: Machine learning methods are increasingly used in cognitive neuroscience research to analyze EEG data and identify patterns of brain activity associated with different cognitive processes or tasks. These methods can be used to model the complex relationships between brain activity and cognitive variables, such as attention, memory, or decision-making.
  • Clinical Neurology: Machine learning methods are also used in clinical neurology applications, such as diagnosis and treatment of neurological disorders, such as epilepsy, Alzheimer's disease, or depression. These methods can analyze EEG data to identify biomarkers and predict disease progression or treatment outcomes.
  • Neuromarketing: Machine learning methods are used in neuromarketing research to analyze EEG data and identify patterns of brain activity associated with consumer preferences and decision-making. These methods can be used to optimize marketing strategies and product designs based on the user's brain activity.

3.5.3. Graph Theory

This type of analysis involves examining the properties of the neural networks that are inferred from EEG data. Graph theory analysis can be useful for identifying network-level changes in neural activity that are associated with different cognitive states or mainly clinical conditions.
Indeed, graph theory analysis is often used to identify patterns of abnormal connectivity in EEG data from patients with epilepsy and assess their relationship with seizures or other clinical outcomes or even to study changes in the functional connectivity and topology of brain networks with age and their relationship with cognitive decline or neurodegenerative disorders such as Alzheimer's disease.
Overall, graph theory analysis is preferred in EEG data analysis when the research question is focused on the functional connectivity and topology of brain networks, and when the data can be represented as a complex network.

4. Discussion and Conclusions

In recent years, there has been a growing interest in EEG analysis and EEG-based user engagement analysis and applications in several fields, which has had a significant impact on the field of computing. The development of cost-effective EEG devices with improved usability has spurred numerous research studies in this area.
This article provides a comprehensive review of various algorithms and processes involved in EEG-based systems. These include: (1) Data acquisition, (2) pre-processing analysis, (3) feature extraction and selection and (4) EEG recordings analysis including classification and clustering techniques. To conduct this review, we conducted an extensive search across multiple databases, identifying 74 relevant studies conducted from a computer science perspective. This allowed us to gain insights into the current state of the art and identify potential directions for future research endeavors. Most of the studies are recent, published in the last 5 years, as depicted in Figure 4.
To the best of our knowledge, there is presently no comprehensive systematic review in the existing literature dedicated specifically to this area. Covering a diverse timeframe, this review primarily highlights research carried out on general population and healthy subjects. It encompasses the broadest range of studies and incorporates the largest volume of articles within this domain. Moreover, it functions as an extensive resource for neuroscience researchers, providing a thorough overview of experimental procedures, including participant numbers, stimuli, frequency band ranges, data preprocessing, feature extraction and EEG signal analysis.
Our review reveals that there is currently a lack of standardized computational methods for different applications in EEG-based user engagement analysis. Researchers are actively exploring new solutions and continuously introducing novel methods and implementations. On the other hand, the data scarcity problem can be solved with data augmentation techniques [92]. Other data related challenges remain the the inter-subject variability of emotion-related EEG signals [93] and the fact that emotions are unstable and discrete during an extended period [94]. We anticipate that many of the existing challenges, specifically those regarding data, will be resolved in the near future since there are cur-rently a lot of steps forward [92,93,94], opening up a wide range of potential applications for EEG-based accurate UE measurement.

4.1. Summary of Literature Review Findings

As it occurs from our review study, the Games industry is a domain that measuring UE and UX through EEG devices has gained significant popularity the last years, since the accurate measurement of UE in games is of significant importance. Other domains that EEG-based research is extensively used are interface and product design as well as audiovisual related applications, like media and advertisements (see Figure 5). Specifically in the Games industry, understanding and quantifying UE can provide valuable insights for game developers, researchers, and marketers in terms of game improvement, player retention, gaining insights into the effectiveness of various design elements and identify areas for improvement as well as monetization and business decisions.
Towards this direction, analysis of EEG data in the context of gameplay can provide an accurate and objective method towards a deeper understanding of the cognitive and emotional states of players, which can be directly related to their engagement levels. A significant asset towards traditional techniques of measuring UE, like self-assessment questionnaires, is that EEG can enable real-time monitoring of player engagement during gameplay. By continuously recording and analyzing EEG signals, researchers can detect fluctuations in cognitive states and emotional responses, providing a dynamic view of engagement levels. This can help identify critical moments in the game where engagement increases or decreases and inform design decisions to optimize the gaming experience.
In addition, based on Table 2 findings, most studies have recruited 11-20 participants in their experiments (see Figure 6, where N/D are the studies that do not have details for the number of recruited participants). There are some studies that have used existing datasets, like the DEAP [18,21,27,29,30], but most of the researchers have designed their own recruitment protocol and experiments. In these EEG data acquisition experiments, the different types of Emotiv devices seem to gain popularity, probably because of their compact size and cost-effective solution.
Although various methodological approaches have been suggested, a literature review reveals a predominant common approach employed in most studies. This approach consists of signal pre-processing, feature extraction, and EEG analysis using either statistical methods or classification or clustering techniques.
Preprocessing plays a crucial role in the analysis of EEG signals as it serves to enhance the data's quality and reliability, facilitating the detection and analysis of the underlying neural activity. EEG signals often suffer from contamination by various types of noise and artifacts, such as power line interference, electrode drift, and muscle activity. To address these issues, preprocessing techniques like filtering, artifact removal, and baseline correction are employed to diminish or eliminate these sources of noise and artifacts.
Moreover, EEG signals are frequently weak and embedded within noise. Preprocessing techniques such as filtering and artifact removal can improve the signal-to-noise ratio, thereby enhancing the detectability and analysis of the underlying brain activity. Additionally, preprocessing plays a pivotal role in standardizing the data. EEG data can be recorded using diverse systems, settings, and electrode placements, leading to potential inconsistencies. By applying preprocessing techniques such as referencing and downsampling, the data can be standardized, ensuring comparability across different participants and experiments.
Feature extraction and selection play crucial roles in EEG-based systems and are constantly evolving. These components require a deep understanding of the brain's biology and physiology. The exploration of novel features holds great potential for enhancing the performance of emotion recognition systems. For example, time-domain features can be combined with frequency, time-frequency characteristics, channel location, and connectivity criteria. The development of innovative feature extraction methods involves uncovering asymmetry patterns in different brain regions, identifying informative electrode locations, modeling channel connectivity, and investigating correlations that aid in understanding brain functionality.
These evolving features highlight the relationship between EEG signals, their frequency bands, and various functional and connectivity considerations. Future research should focus on advancing our understanding of the connections between EEG and biological or psycho-emotional elements. By improving feature extraction, we can capture individual emotion dynamics more accurately and establish correlations across individuals and sessions.
One particularly intriguing trend in feature extraction is the utilization of deep neural networks. These systems leverage raw data to avoid the loss of valuable information and harness the power of neural networks to automatically extract relevant features. This approach holds promise for improving the effectiveness of feature extraction in EEG analysis.

4.2. Soft and Full Emerging Technologies

Another remark that can be derived from the current study is that several studies, specifically recent studies, include technologies that can be classified to "soft" and "full" emerging, based on their level of innovation. However, it's important to note that the categorization may not be universally accepted or standardized, since the terms "soft" and "full" emerging are not commonly used in technology classification frameworks. In the soft emerging technologies, we would include mobile apps, which have been around for some time, but new and innovative apps continue to emerge, leveraging advancements in mobile technology and user experience [59,95]. In the full emerging technologies, we would include Virtual Reality (VR) technology that is continuously advancing and finding applications in various fields, such as gaming, education, and training [11,12,13,14,45,46,51,80,81,82,83,86,87,88] or even CAVE experimental setup [15].

4.3. Comparative Study

Numerous attempts have been undertaken in the literature to examine works related to UE and UX. Nevertheless, a limited number of these endeavors have focused their efforts on examining UE and UX through the analytical perspective of EEG. Moreover, the number of systematic investigations in this specific intersection of UE, UX, and EEG remains notably scarce.
The field of emotion recognition using EEG has garnered significant attention, resulting in several comprehensive review papers [96,97,98,99] exploring the research in this domain. There is no review study (see Table 7) exploring the works regarding EEG signal analysis (including pre-processing, feature extraction, analysis and classification as in the current study) in UE and UX field. These reviews delve into the methods and algorithms employed for EEG analysis and classification of emotional states, shedding light on the most commonly used feature extraction and classification methods in this rapidly evolving field. It is evident from these reviews that decoding EEG signals and associating them with specific emotions presents a complex challenge. Affective states do not exhibit a straightforward mapping to distinct brain structures, as different emotions can activate overlapping brain regions, while a single emotion can engage multiple structures simultaneously.
In the context of feature extraction analysis, researchers have employed various methods, including time domain analysis, frequency domain analysis, and time-frequency domain analysis, to capture the relevant information from EEG signals. On the other hand, classification approaches have leveraged machine learning algorithms such as Support Vector Machine (SVM), k-Nearest Neighbor (KNN), and Naive Bayes (NB), yielding classification accuracies ranging from 57.50% to 95.70%. Additionally, deep learning algorithms, including Neural Network (NN), Long and Short-Term Memory (LSTM), and Deep Belief Network (DBN), have demonstrated their efficacy in classification, achieving accuracy rates between 63.38% and 97.56%. These methods and techniques hold promise for advancing our understanding of emotion recognition using EEG and finding interdisciplinary applications for this rapidly growing field.
In a study by Hernández-Cuevas et al. [96], the focus is on exploring the existing research related to physiological-based mobile educational systems. The authors investigate the integration of EEG and other physiological signals into mobile learning (m-learning) applications.
Another research paper by Marochko et al. [97] examines the applications of virtual reality (VR) in Event-Related Potential (ERP) research. The authors analyze the current approaches for combining Head-Mounted Displays (HMD) with EEG headsets to facilitate ecologically valid experiments. In a systematic review conducted by Ferreira et al. [98], the objective is to explore research concerning the learning process with (Serious) Business Games utilizing EEG or Eye tracking signals for data collection. Torres et al. [99] conduct a comprehensive survey of scientific literature published between 2015 and 2020. The survey focuses on identifying trends and performing a comparative analysis of algorithm applications in new implementations from a computer science perspective. The survey covers various aspects, including datasets, emotion elicitation methods, feature extraction and selection, classification algorithms, and performance evaluation.

Author Contributions

Conceptualization, C.B. and M.T.; methodology, C.B., A.T. and M.T.; investigation, C.B., G.S. and K.S.; writing—original draft preparation, C.B.; writing—review and editing, G.S. and K.S.; supervision, A.T. and M.T.; project administration, M.T. All authors have read and agreed to the published version of the manuscript.

Funding

This research received no external funding.

Conflicts of Interest

The authors declare no conflicts of interest.

References

  1. Sutcliffe, A. Designing for User Experience and Engagement. in Why Engagement Matters. Springer, Springer International Publishing, 2016. [CrossRef]
  2. O’Brien, E.G.; H.L.; Toms, “What is User Engagement? A Conceptual Framework for Defining User Engagement with Technology. Journal of the American Society for Information Science & Technology 2008, 59, 938–955.
  3. van der Linden, D.; Tops, M.; Bakker, A.B. Go with the flow: A neuroscientific view on being fully engaged. European Journal of Neuroscience 2021, 53, 947–963. [Google Scholar] [CrossRef] [PubMed]
  4. Moënne-Loccoz, R.C.V.C.; Hernández, A.; Larraguibel, C.; Lam, G.; Lorca-Ponce, E.; Montefusco-Siegmund, R.; Maldonado, P. Effects of the self-perceived sensorimotor demand and immersion during video gaming on visual-attention skills. European Journal of Neuroscience 2023, 57, 1870–1891. [Google Scholar] [CrossRef]
  5. Ki, J.J.; Parra, L.C.; Dmochowski, J.P. Visually evoked responses are enhanced when engaging in a video game. European Journal of Neuroscience 2020, 52, 4695–4708. [Google Scholar] [CrossRef]
  6. Halderman, L.K.; Finn, B.; Lockwood, J.R.; Long, N.M.; Kahana, M.J. EEG Correlates of Engagement During Assessment. ETS Research Report Series 2021, 2021, 1–17. [Google Scholar] [CrossRef]
  7. X., W.; Liu, T.Z.B.; Guo, J.; Chen, C.L.P. X. W.; Liu, T.Z.B.; Guo, J.; Chen, C.L.P. Fine-grained Interpretability for EEG Emotion Recognition: Concat-aided Grad-CAM and Systematic Brain Functional Network. IEEE Trans Affect Comput. [CrossRef]
  8. Li, Y.; et al. GMSS : Graph-Based Multi-Task Self-Supervised Learning for EEG Emotion Recognition. 1–14.
  9. Shen, Y.-P. ; Yi-Wei; Lin, “Cross-Day Data Diversity Improves Inter-Individual Emotion Commonality of Spatio-Spectral EEG Signatures Using Independent Component Analysis. IEEE Trans Affect Comput. [CrossRef]
  10. Y., Z.; Wang, S.C.C.X.; Wang, D.; Gao, X. Y. Z.; Wang, S.C.C.X.; Wang, D.; Gao, X. Enhancing EEG-Based Decision-Making Performance Prediction by Maximizing Mutual Information Between Emotion and Decision-Relevant Features. IEEE Trans Affect Comput. [CrossRef]
  11. Xu, Y.; et al. AMDET : Attention based Multiple Dimensions EEG Transformer for Emotion Recognition. 1–10.
  12. Zhang, Y.; Pan, Y.; Zhang, Y.; Li, L.; Zhang, L. Unsupervised Time-Aware Sampling Network with Deep Reinforcement Learning for EEG-Based Emotion Recognition. 1–12.
  13. Ding, Y.; Member, S.; Robinson, N.; Zhang, S. TSception : Capturing Temporal Dynamics and Spatial Asymmetry From EEG for Emotion Recognition. IEEE Trans Affect Comput 2023, 14, 2238–2250. [Google Scholar] [CrossRef]
  14. Zhou, R.; Zhang, Z.; Fu, H.; Zhang, L.; Li, L. PR-PL : A Novel Transfer Learning Framework with Prototypical Representation based Pairwise Learning for EEG-Based Emotion Recognition. 1–12, 2022.
  15. Shemesh, A.; Leisman, G.; Bar, M.; Grobman, Y.J. The emotional influence of different geometries in virtual spaces: A neurocognitive examination. J Environ Psychol 2022, 81, 101802. [Google Scholar] [CrossRef]
  16. Zou, Z.; Ergan, S. Evaluating the effectiveness of biometric sensors and their signal features for classifying human experience in virtual environments. Advanced Engineering Informatics 2021, 49. [Google Scholar] [CrossRef]
  17. Kim, S.; Park, H.; Choo, S. Article effects of changes to architectural elements on human relaxation-arousal responses: Based on vr and eeg. Int J Environ Res Public Health 2021, 18, 4305. [Google Scholar] [CrossRef]
  18. Ergan, S.; Radwan, A.; Zou, Z.; Tseng, H.-A.; Han, X. Quantifying Human Experience in Architectural Spaces with Integrated Virtual Reality and Body Sensor Networks. Journal of Computing in Civil Engineering 2019, 33. [Google Scholar] [CrossRef]
  19. Vecchiato, G.; Jelic, A.; Tieri, G.; Maglione, A.G.; De Matteis, F.; Babiloni, F. Neurophysiological correlates of embodiment and motivational factors during the perception of virtual architectural environments. Cogn Process 2015, 16, 425–429. [Google Scholar] [CrossRef] [PubMed]
  20. Li, Z.; Geng, B.; Tao, X.; Duan, Y.; Gao, D.; Hu, S. Video Quality Measurement For Buffering Time Based On EEG Frequency Feature. in 2021 IEEE International Conference on Image Processing (ICIP), 2021, 1424–1428. [CrossRef]
  21. Geng, B.; et al. A Novel EEG Based Directed Transfer Function for Investigating Human Perception to Audio Noise. in 2020 International Wireless Communications and Mobile Computing, IWCMC 2020, 2020, 923–928. [Google Scholar] [CrossRef]
  22. Fonnegra, R.D.; Campáz-Usuga, P.; Osorno-Castillo, K.; Díaz, G.M. Emotion Recognition from Time-Frequency Analysis in EEG Signals Using a Deep Learning Strategy. Communications in Computer and Information Science, 2020; 1154 CCIS, 297–311. [Google Scholar] [CrossRef]
  23. Arapakis, I.; Barreda-Angeles, M.; Pereda-Banos, A. Interest as a Proxy of Engagement in News Reading: Spectral and Entropy Analyses of EEG Activity Patterns. IEEE Trans Affect Comput 2019, 10, 100–114. [Google Scholar] [CrossRef]
  24. Raheel, A.; Majid, M.; Anwar, S.M. A study on the effects of traditional and olfaction enhanced multimedia on pleasantness classification based on brain activity analysis. Comput Biol Med 2019, 114, 103469. [Google Scholar] [CrossRef]
  25. Moon, S.-E.; Jang, S.; Lee, J.-S. Evaluation of preference of multimedia content using deep neural networks for electroencephalography. in 2018 10th International Conference on Quality of Multimedia Experience, QoMEX 2018, 2018. [CrossRef]
  26. Deja, J.A.; Cabredo, R. Using EEG emotion models in viewer experience design: An exploratory study. in ACM International Conference Proceeding Series, 2018, 82–88. [CrossRef]
  27. Zheng, Y.; Zhao, G. Natural interaction in video image investigation and its evaluation. Lecture Notes in Computer Science (including subseries Lecture Notes in Artificial Intelligence and Lecture Notes in Bioinformatics), 2018; 10906 LNAI, 520–532. [Google Scholar] [CrossRef]
  28. Abromavičius, V.; Gedminas, A.; Serackis, A. Detecting sense of presence changes in EEG spectrum during perception of immersive audiovisual content. 2017 Open Conference of Electrical, Electronic and Information Sciences, eStream 2017 - Proceedings of the Conference, 2017. [Google Scholar] [CrossRef]
  29. Meza-Kubo, V.; Morán, A.L.; Carrillo, I.; Galindo, G.; García-Canseco, E. Assessing the user experience of older adults using a neural network trained to recognize emotions from brain signals. J Biomed Inform 2016, 62, 202–209. [Google Scholar] [CrossRef]
  30. Liang; Liu, H. ; Mak, J.N. Detection of media enjoyment using single-channel EEG. in Proceedings - 2016 IEEE Biomedical Circuits and Systems Conference, BioCAS 2016, 2016, 516–519. [CrossRef]
  31. Samara, A.; Menezes, M.L.R.; Galway, L. Feature Extraction for Emotion Recognition and Modelling Using Neurophysiological Data. in 2016 15th International Conference on Ubiquitous Computing and Communications and 2016 International Symposium on Cyberspace and Security (IUCC-CSS), 2016, 138–144. [CrossRef]
  32. Kroupi, E.; Hanhart, P.; Lee, J.-S.; Rerabek, M.; Ebrahimi, T. Modeling immersive media experiences by sensing impact on subjects. Multimed Tools Appl 2016, 75, 12409–12429. [Google Scholar] [CrossRef]
  33. Gupta, R.; Falk, T.H. Affective state characterization based on electroencephalography graph-theoretic features. in International IEEE/EMBS Conference on Neural Engineering, NER, 2015, 577–580. [CrossRef]
  34. Daimi, S.N.; Saha, G. Classification of emotions induced by music videos and correlation with participants’ rating. Expert Syst Appl 2014, 41, 6057–6065. [Google Scholar] [CrossRef]
  35. Reiter, U.; De Moor, K. Content categorization based on implicit and explicit user feedback: Combining self-reports with EEG emotional state analysis. in 2012 4th International Workshop on Quality of Multimedia Experience, QoMEX 2012, 2012, 266–271. [Google Scholar] [CrossRef]
  36. Petrantonakis, P.C.; Hadjileontiadis, L.J. Emotion recognition from EEG using higher order crossings. IEEE Transactions on Information Technology in Biomedicine 2010, 14, 186–197. [Google Scholar] [CrossRef]
  37. Al-Juboori, S.; Mkwawa, I.-H.; Sun, L.; Ifeachor, E. , Modeling the relationships between changes in EEG features and subjective quality of HDR images. 2020. [CrossRef]
  38. Hwang, J.; Moon, S.-E.; Lee, J.-S. On the Repeatability of EEG-Based Image Quality Assessment. in 2018 IEEE International Conference on Systems, Man, and Cybernetics (SMC), 2018, 1785–1788. [CrossRef]
  39. Yan, S.; et al. Exploring audience response in performing arts with a brain-adaptive digital performance system. ACM Trans Interact Intell Syst, 2017; 7. [Google Scholar] [CrossRef]
  40. Niu, Y.; Di, K.; Zeng, G.; Wei, T.; Zhang, Y.; Wu, X. Towards better video services: An EEG-based interpretable model for functional quality of experience evaluation. Displays 2024, 82. [Google Scholar] [CrossRef]
  41. Bosse, S.; et al. Using Steady-State Visual Evoked Potentials and Spatio-Spectral Decomposition. IEEE Transactions on Circuits and Systems for Video Technology 2018, 28, 1694–1706. [Google Scholar] [CrossRef]
  42. Acqualagna, L.; et al. EEG-based classification of video quality perception using steady state visual evoked potentials (SSVEPs). J Neural Eng 2015, 12, 26012. [Google Scholar] [CrossRef] [PubMed]
  43. Sharma, P.; Dubey, S.; Ranjan, A.K. , et al. Neural correlates of affective content: application to perceptual tagging of video. Neural Comput Appl 2023, 35, 7925–7941. [Google Scholar] [CrossRef]
  44. Sharma, P.; Dubey, S.; Ranjan, A.K. , et al. A deep perceptual framework for affective video tagging through multiband EEG signals modelling. Neural Comput Appl, 2023. [Google Scholar] [CrossRef]
  45. Lin, Y.L.; Chien, S.Y.; Su, W.C.; Hsiao, S.I. Coding peekaboom: a gaming mechanism for harvesting programming concepts. Educ Inf Technol (Dordr), 2022. [Google Scholar] [CrossRef]
  46. Tiwari, A.; Pachori, R.B.; Sanjram, P.K. Dorsal-ventral visual pathways and object characteristics: Beamformer source analysis of EEG. Computers, Materials and Continua 2022, 70, 2347–2363. [Google Scholar] [CrossRef]
  47. Jao, P.-K.; Chavarriaga, R.; Dell’agnola, F.; Arza, A.; Atienza, D.; Millán, J.D.R. EEG Correlates of Difficulty Levels in Dynamical Transitions of Simulated Flying and Mapping Tasks. IEEE Trans Hum Mach Syst 2021, 51, 99–108. [Google Scholar] [CrossRef]
  48. Hafeez, T.; Saeed, S.M.U.; Arsalan, A.; Anwar, S.M.; Ashraf, M.U.; Alsubhi, K. EEG in game user analysis: A framework for expertise classification during gameplay. PLoS One 2021, 16. [Google Scholar] [CrossRef]
  49. Paranthaman, P.K.; Bajaj, N.; Solovey, N.; Jennings, D. Comparative Evaluation of the EEG Performance Metrics and Player Ratings on the Virtual Reality Games. in IEEE Conference on Computatonal Intelligence and Games, CIG, 2021. [CrossRef]
  50. Xu, W.; Liang, H.N.H.-N.; Zhang, Z.; Baghaei, N. Studying the Effect of Display Type and Viewing Perspective on User Experience in Virtual Reality Exergames. Games Health J 2020, 9, 405–414. [Google Scholar] [CrossRef]
  51. Cano, S.; Araujo, N.; Guzman, C.; Rusu, C.; Albiol-Pérez, S. Low-cost assessment of user experience through EEG signals. IEEE Access 2020, 8, 158475–158487. [Google Scholar] [CrossRef]
  52. Giannakos, M.N.; Sharma, K.; Niforatos, E. Exploring EEG signals during the different phases of game-player interaction. in 2019 11th International Conference on Virtual Worlds and Games for Serious Applications, VS-Games 2019 - Proceedings, 2019, p. 1DUUMY. [CrossRef]
  53. Labonte-Lemoyne, E.; Courtemanche, F.; Louis, V.; Fredette, M.; Sénécal, S.; Léger, P.-M. Dynamic threshold selection for a biocybernetic loop in an adaptive video game context. Front Hum Neurosci 2018, 12. [Google Scholar] [CrossRef]
  54. Doumbouya, R.; Benlamine, M.S.; Dufresne, A.; Frasson, C. Game scenes evaluation and player’s dominant emotion prediction. Lecture Notes in Computer Science (including subseries Lecture Notes in Artificial Intelligence and Lecture Notes in Bioinformatics), 2018; 65. [Google Scholar] [CrossRef]
  55. Hou, G.; Dong, H.; Yang, Y. Developing a Virtual Reality Game User Experience Test Method Based on EEG Signals. in Proceedings - 2017 5th International Conference on Enterprise Systems: Industrial Digitalization by Enterprise Systems, ES 2017, 2017, 227–231. [Google Scholar] [CrossRef]
  56. Berta, R.; Bellotti, F.; De Gloria, A.; Pranantha, D.; Schatten, C. Electroencephalogram and physiological signal analysis for assessing flow in games. IEEE Trans Comput Intell AI Games 2013, 5, 164–175. [Google Scholar] [CrossRef]
  57. Plotnikov, A.; et al. Exploiting real-time EEG analysis for assessing flow in games. in Proceedings of the 12th IEEE International Conference on Advanced Learning Technologies, ICALT 2012, 2012, 688–689. [Google Scholar] [CrossRef]
  58. Baumeister, J.; Reinecke, K.; Cordes, M.; Lerch, C.; Weiß, M. Brain activity in goal-directed movements in a real compared to a virtual environment using the Nintendo Wii. Neurosci Lett 2010, 481, 47–50. [Google Scholar] [CrossRef]
  59. Arslan, R.B.; Filiz, E. Enhancement of Player Experience in Video Games Using EEG Based Dynamic Difficulty Adjustment. 16th International Conference on INnovations in Intelligent SysTems and Applications, INISTA 2022, 2022, 1–4. [Google Scholar] [CrossRef]
  60. Lin, Y.L.; Chien, S.Y.; Su, W.C.; Hsiao, S.I. Coding peekaboom: a gaming mechanism for harvesting programming concepts. Educ Inf Technol (Dordr) 2023, 28, 3765–3785. [Google Scholar] [CrossRef]
  61. Hazarika, R. ; Dasgupta, “Neural correlates of action video game experience in a visuospatial working memory task. Neural Comput Appl 2020, 32, 3431–3440. [Google Scholar] [CrossRef]
  62. Ding, M.; Ding, T.; Chen, X.; Shi, F. Using event-related potentials to identify user’s moods induced by product color stimuli with different attributes. Displays 2022, 74. [Google Scholar] [CrossRef]
  63. Zhou, C.; Yuan, F.; Huang, T.; Zhang, Y.; Kaner, J. The Impact of Interface Design Element Features on Task Performance in Older Adults: Evidence from Eye-Tracking and EEG Signals. Int J Environ Res Public Health 2022, 19. [Google Scholar] [CrossRef]
  64. Ren, H.; Zhang, C.; Zhang, N. Research on EEG-based graphic user interface kansei design evaluation. in E3S Web of Conferences, 2020. [CrossRef]
  65. Ding, Y.; Cao, Y.; Qu, Q.; Duffy, V.G. An Exploratory Study Using Electroencephalography (EEG) to Measure the Smartphone User Experience in the Short Term. Int J Hum Comput Interact 2020, 36, 1008–1021. [Google Scholar] [CrossRef]
  66. Baig, M.Z.; Kavakli, M. Classification of user competency levels using EEG and convolutional neural network in 3D modelling application. Expert Syst Appl 2020, 146. [Google Scholar] [CrossRef]
  67. Mangion, R.S.; Garg, L.; Garg, G.; Falzon, O. Emotional Testing on Facebook’s User Experience. IEEE Access 2020, 8, 58250–58259. [Google Scholar] [CrossRef]
  68. Van Camp, M.; De Boeck, M.; Verwulgen, S.; De Bruyne, G. EEG technology for UX evaluation: A multisensory perspective. Advances in Intelligent Systems and Computing 2019, 775, 337–343. [Google Scholar] [CrossRef]
  69. Park, W.; Kim, D.-H.; Kim, S.-P.; Lee, J.-H.; Kim, L. Gamma EEG Correlates of Haptic Preferences for a Dial Interface. IEEE Access 2018, 6, 22324–22331. [Google Scholar] [CrossRef]
  70. Jimenez-Molina, A.; Retamal, C.; Lira, H. Using psychophysiological sensors to assess mental workload during web browsing. Sensors (Switzerland) 2018, 18. [Google Scholar] [CrossRef]
  71. Chen, X.J.; Niu, Y.F.; Ding, F.Q.; Xue, C.Q. Application of electroencephalogram physiological experiment in interface design teaching: A case study of visual cognitive errors. Kuram ve Uygulamada Egitim Bilimleri 2018, 18, 2306–2324. [Google Scholar] [CrossRef]
  72. Aleksander, B.A.I.; Fuglerud, K.S. Method for semi-automated evaluation of user experience using brain activity. Stud Health Technol Inform 2018, 256, 811–820. [Google Scholar] [CrossRef]
  73. Stefancova, E.; Moro, R.; Bielikova, M. Towards detection of usability issues by measuring emotions. Communications in Computer and Information Science 2018, 909, 63–70. [Google Scholar] [CrossRef]
  74. Liu, Y.; Ritchie, J.M.; Lim, T.; Kosmadoudi, Z.; Sivanathan, A.; Sung, R.C.W. A fuzzy psycho-physiological approach to enable the understanding of an engineer’s affect status during CAD activities. CAD Computer Aided Design 2014, 54, 19–38. [Google Scholar] [CrossRef]
  75. Kim, J.-Y.; Yoon, M.-Y. The Use of EEG to Measure Emotional Response to Tactile Sensation in Evaluation of DSLR Camera Usability. Communications in Computer and Information Science, 2014; 434 PART I, 351–356. [Google Scholar] [CrossRef]
  76. Lu, P.; Li, L.; Ma, L. Online Service Quality Measurement Utilizing Psychophysiological Responses. Advances in Intelligent Systems and Computing 2020, 965, 347–352. [Google Scholar] [CrossRef]
  77. Pireva, K.; Tahir, R.; Imran, A.S.; Chaudhary, N. Evaluating learners’ emotional states by monitoring brain waves for comparing game-based learning approach to pen-and-paper. in Proceedings - Frontiers in Education Conference, FIE, 2019. [CrossRef]
  78. Giannakos, M.N.; Sharma, K.; Pappas, I.O.; Kostakos, V.; Velloso, E. Multimodal data as a means to understand the learning experience. Int J Inf Manage 2019, 48, 108–119. [Google Scholar] [CrossRef]
  79. Ogino, M.; Mitsukura, Y. Portable drowsiness detection through use of a prefrontal single-channel electroencephalogram. Sensors (Switzerland) 2018, 18. [Google Scholar] [CrossRef] [PubMed]
  80. Sandhu, V.; Wai, A.A.P.; Ho, C.Y. Evaluation of learning performance by quantifying user’s engagement investigation through low-cost multi-modal sensors. in 2017 International Conference on Orange Technologies (ICOT), 2017, 180–183. [CrossRef]
  81. Oliveira, I.; Grigore, O.; Guimarães, N.; Duarte, L. Relevance of EEG input signals in the augmented human reader. in ACM International Conference Proceeding Series, 2010. [CrossRef]
  82. Kang, T.; Chen, Y.; Fazli, S.; Wallraven, C. Predicting what you remember from brain activity: EEG-based decoding of long-term memory formation. Lecture Notes in Computer Science (including subseries Lecture Notes in Artificial Intelligence and Lecture Notes in Bioinformatics), 2018; 10727 LNCS, 63–73. [Google Scholar] [CrossRef]
  83. Nair, R.K.; S. A.L.; Megalingam, “Human attention detection system using deep learning and brain–computer interface. Neural Comput Appl 2024, 36, 10927–10940. [Google Scholar] [CrossRef]
  84. Kamińska, D.; Zwoliński, G.; Laska-Leśniewicz, A. Usability Testing of Virtual Reality Applications—The Pilot Study. Sensors 2022, 22. [Google Scholar] [CrossRef] [PubMed]
  85. Athif, M.; et al. Using Biosignals for Objective Measurement of Presence in Virtual Reality Environments. In Proceedings of the Annual International Conference of the IEEE Engineering in Medicine and Biology Society, EMBS, 3035–3039. 2020. [Google Scholar] [CrossRef]
  86. Dey, A.; Chatburn, A.; Billinghurst, M. Exploration of an EEG-Based Cognitively Adaptive Training System in Virtual Reality. in 2019 IEEE Conference on Virtual Reality and 3D User Interfaces (VR), Mar. 2019, 220–226. [CrossRef]
  87. Fabroyir, H.; Teng, W.C. Navigation in virtual environments using head-mounted displays: Allocentric vs. egocentric behaviors. Comput Human Behav 2018, 80, 331–343. [Google Scholar] [CrossRef]
  88. Kroupi, E.; Yazdani, A.; Vesin, J.-M.; Ebrahimi, T. EEG correlates of pleasant and unpleasant odor perception. ACM Transactions on Multimedia Computing, Communications and Applications, 2014; 11. [Google Scholar] [CrossRef]
  89. Perez, J.; Delechelle, E. On the measurement of image quality perception using frontal EEG analysis. in 2013 International Conference on Smart Communications in Network Technologies, SaCoNeT 2013, 2013. [CrossRef]
  90. Kober, S.E.; Kurzmann, J.; Neuper, C. Cortical correlate of spatial presence in 2D and 3D interactive virtual reality: An EEG study. International Journal of Psychophysiology 2012, 83, 365–374. [Google Scholar] [CrossRef]
  91. Yue, K.; et al. Investigate the Neuro Mechanisms of Stereoscopic Visual Fatigue. IEEE J Biomed Health Inform, 2022. [Google Scholar] [CrossRef]
  92. Sun, W.; Huang, M.; Yang, R.; Han, J.; Yue, Y. Mental Workload Evaluation of Virtual Object Manipulation on WebVR: An EEG Study. in 2021 14th International Conference on Human System Interaction (HSI), 2021, 1–6. [CrossRef]
  93. Kosmyna, N.; Maes, P. AttentivU: A Biofeedback Device to Monitor and Improve Engagement in the Workplace. In Proceedings of the Annual International Conference of the IEEE Engineering in Medicine and Biology Society, EMBS, Annu Int Conf IEEE Eng Med Biol Soc, 1702–1708., Jul. 2019. [Google Scholar] [CrossRef]
  94. Mijović, P.; et al. Communicating the user state: Introducing cognition-aware computing in industrial settings. Saf Sci 2019, 119, 375–384. [Google Scholar] [CrossRef]
  95. Perrin, A.-F.N.M.; Xu, H.; Kroupi, E.; Řeřábek, M. Multimodal Dataset for Assessment of Quality of Experience in Immersive Multimedia. In in In Proceedings of the 23rd ACM international conference on Multimedia (MM ’15). Association for Computing Machinery, New York, NY, USA, 1007–1010. [Online]. Available:; 2015; pp. 1007–1010. [Google Scholar] [CrossRef]
  96. Zhang, Z.; Zhong, S.; Liu, Y. GANSER : A Self-supervised Data Augmentation Framework for EEG-based Emotion Recognition”.
  97. Shen, X.; Liu, X.; Hu, X.; Zhang, D.; Song, S. Contrastive Learning of Subject-Invariant EEG Representations for Cross-Subject Emotion Recognition. 1–23.
  98. T. Q.; Zhang, Q.Z.Y.; Liu, H.; Zhang, D.; Chen, X. EEG-Based Emotion Recognition With Emotion Localization via Hierarchical Self-Attention. IEEE Trans Affect Comput 2023, 14, 2458–2469. [Google Scholar] [CrossRef]
  99. Al-Juboori, S.; Mkwawa, I.H.; Sun, L.; Ifeachor, E. Investigation of relationships between changes in EEG features and subjective quality of HDR images. Proc (IEEE Int Conf Multimed Expo), 2017; 91–96. [Google Scholar] [CrossRef]
  100. Hernández-Cuevas, B.Y.; Crawford, C.S. A Literature Review of Physiological-Based Mobile Educational Systems. IEEE Transactions on Learning Technologies 2021, 14, 272–291. [Google Scholar] [CrossRef]
  101. Marochko, V.; Reilly, R.; McDonnell, R.; Longo, L. A Survey on the Application of Virtual Reality in Event-Related Potential Research. Lecture Notes in Computer Science (including subseries Lecture Notes in Artificial Intelligence and Lecture Notes in Bioinformatics), 2022; 13480 LNCS, 256–269. [Google Scholar] [CrossRef]
  102. Ferreira, C.P.; González-González, C.S.; Adamatti, D.F. Business simulation games analysis supported by human-computer interfaces: A systematic review. Sensors, 2021; 21. [Google Scholar] [CrossRef]
  103. Torres P, E.P.; Torres, E.A.; Hernández-Álvarez, M.; Yoo, S.G. EEG-based BCI emotion recognition: A survey. Sensors (Switzerland) 2020, 20, 1–36. [Google Scholar] [CrossRef]
  104. Houssein, E.H.; Hammad, A.; Ali, A.A. , Human emotion recognition from EEG-based brain–computer interface using machine learning: a comprehensive review 34, no. 15. Springer London, 2022. [CrossRef]
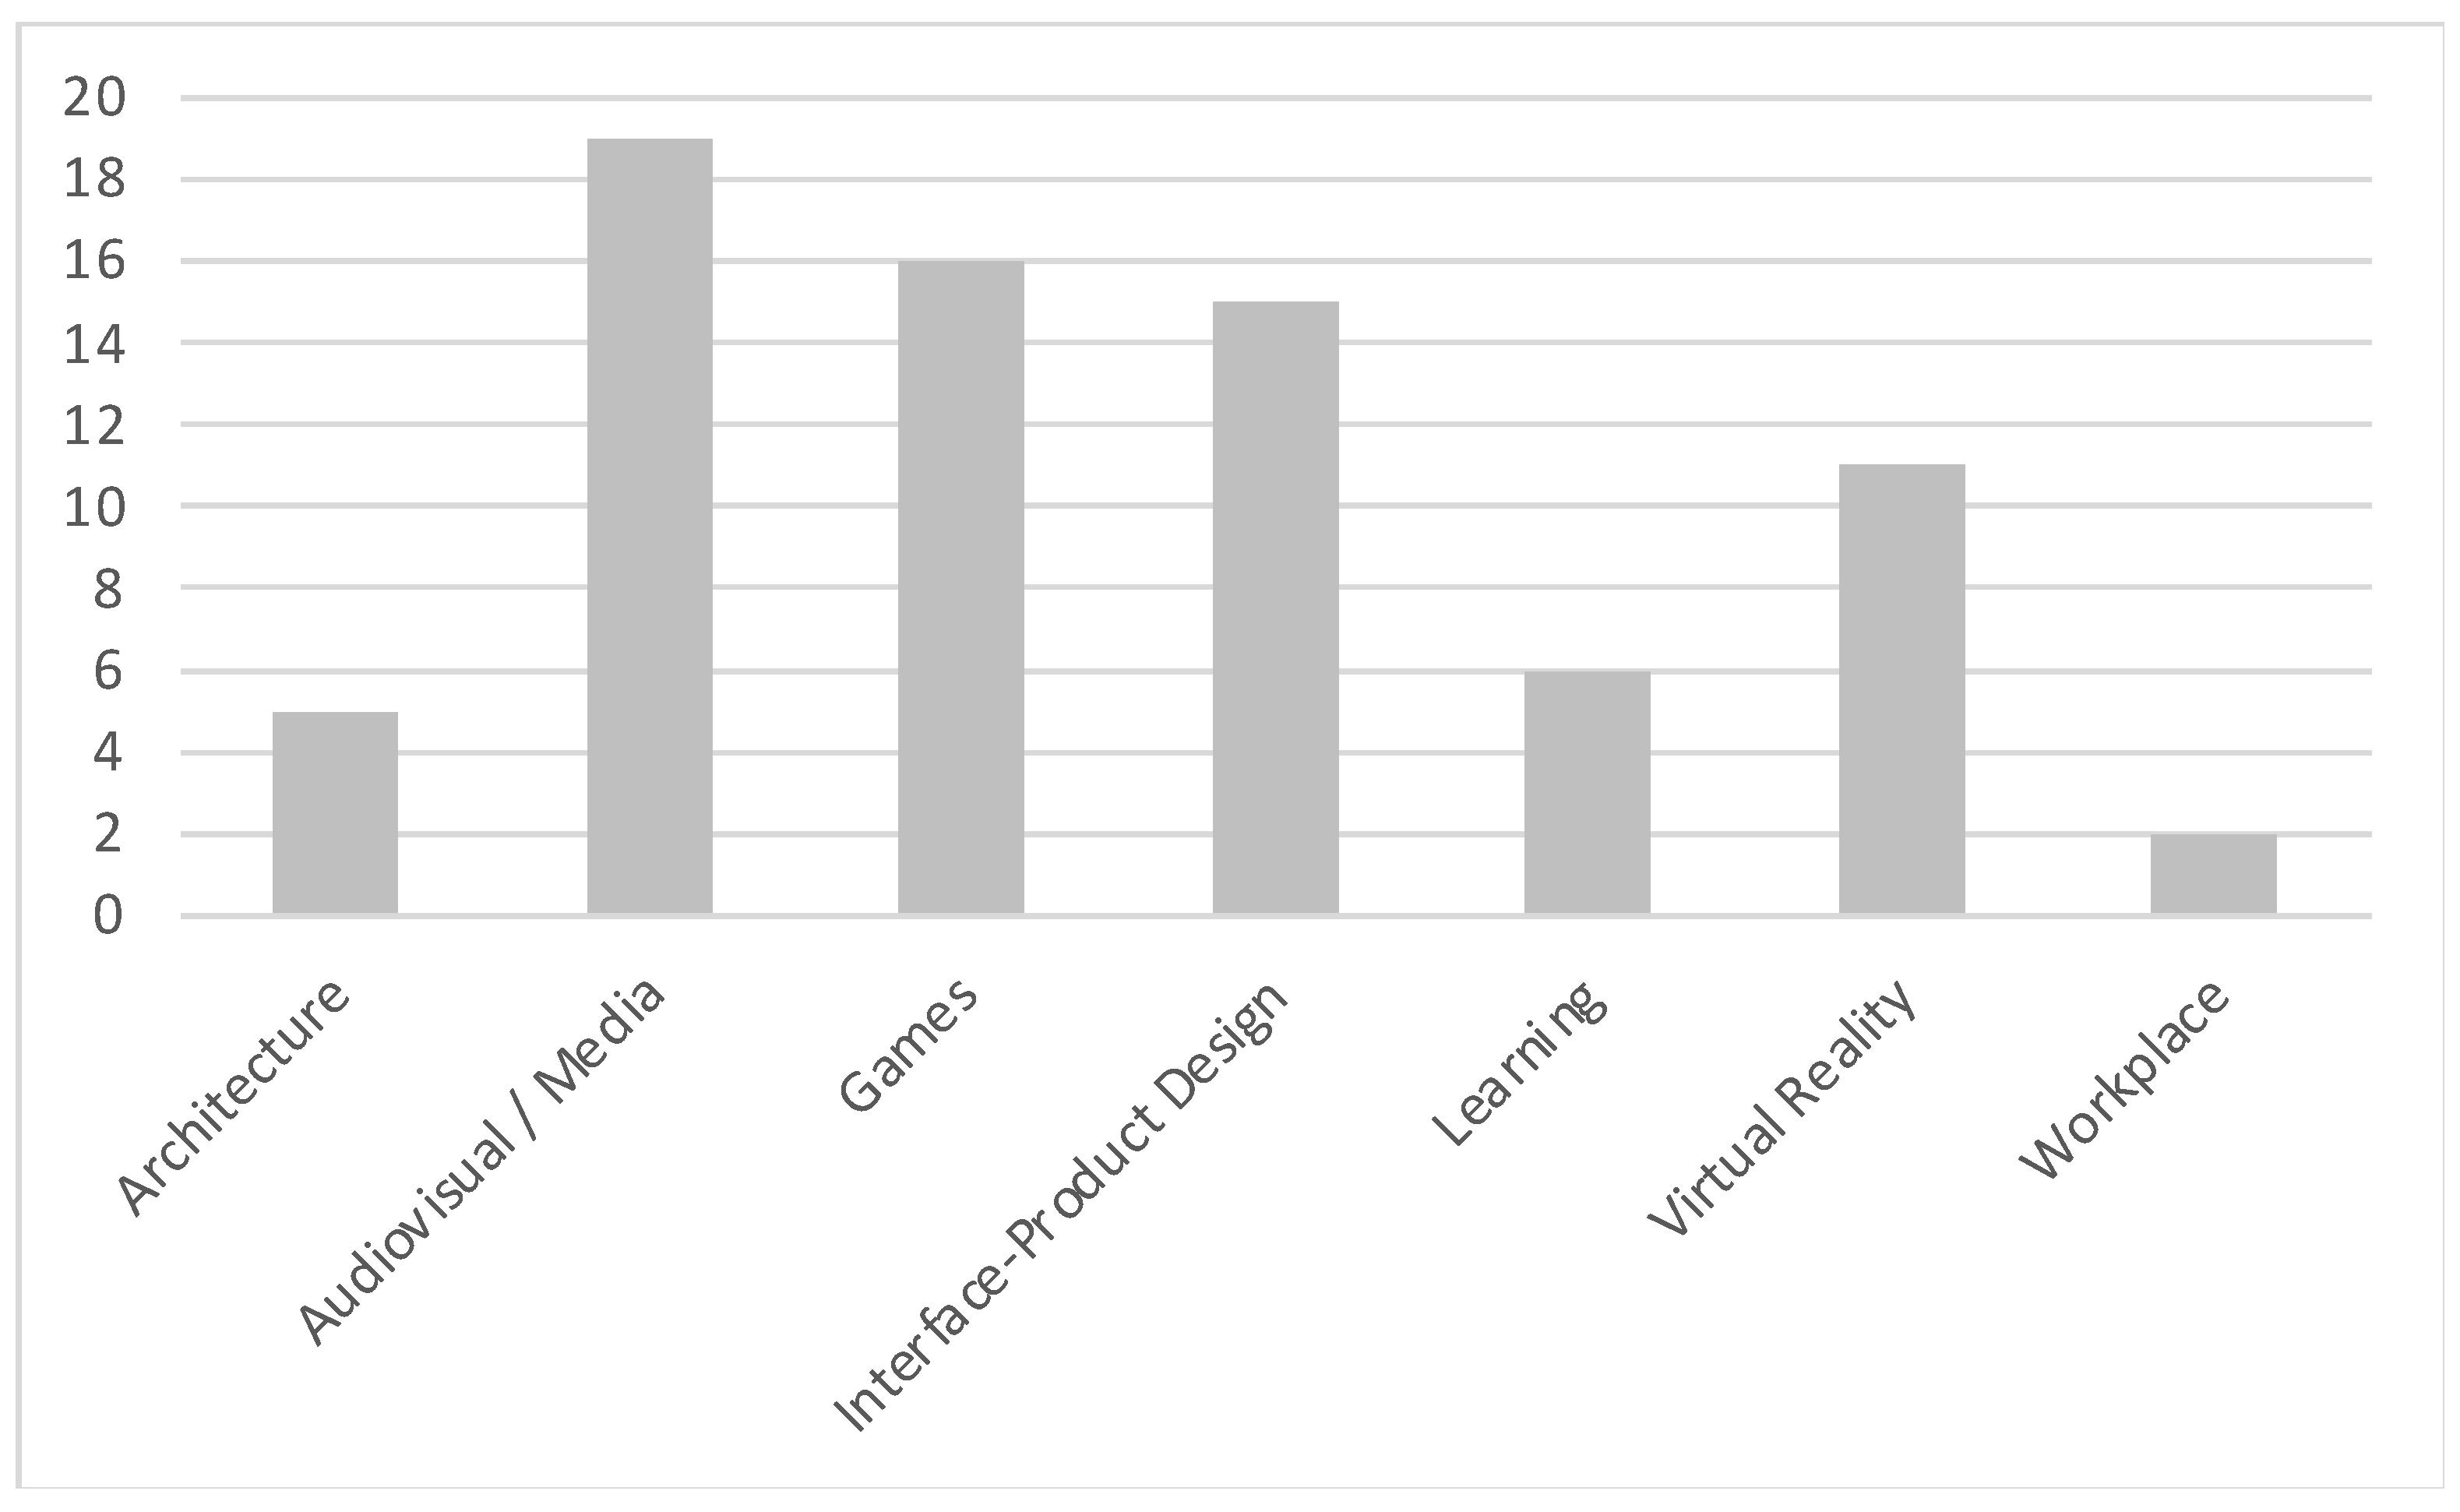
Figure 2. Literature review flowchart according to PRISMA statement.
Preprints 142315 g002
Figure 3. The steps towards EEG data analysis that are studied in this paper.
Preprints 142315 g003
Figure 4. Publications per year included in the current review study.
Preprints 142315 g004
Figure 5. Publications per application field included in the current study.
Preprints 142315 g005
Figure 6. Number of participants recruited in the studies.
Preprints 142315 g006
Table 1. Different Application Fields of studies.
Application Field References
Architecture [11,12,13,14,15]
Audiovisual / Media [16,17,18,19,20,21,22,23,24,25,26,27,28,29,30,31,32,33,34,35,36,37,38,39,40]
Games [41,42,43,44,45,46,47,48,49,50,51,52,53,54,55,56,57]
Interface-Product Design [58,59,60,61,62,63,64,65,66,67,68,69,70,71,72]
Learning [73,74,75,76,77,78,79]
Virtual Reality [14,51,80,81,82,83,84,85,86,87,88]
Workplace [89,90]
Table 2. Number of participants used in data collection studies.
No. of Participants References
1-10 [16,26,34,44,47,53,54,64,68,76,78,84,88]
11-20 [15,17,20,24,28,32,45,48,49,59,60,62,63,65,67,71,72,74,78,80,81,82,85,87,89,90]
21-30 [23,25,31,33,43,51,52,58,61,69,70,73,75,86]
31-40 [13,14,18,21,22,27,29,30,46,83]
>40 [11,12,19,35,41,42,66]
Table 3. Pre-processing steps of EEG signals.
Device EEG Channels References
BEmicro, Ebneuro 24 [15]
BIOPAC MP 150 6 [71]
Biosemi 32 / 64 [29,34,43,65]
BrainAmps 32 / 64 [16,17,49,78]
BrainCo Focus 1 [89]
Emotiv 16 [51,55]
Emotiv EPOC+ 14 [19,25,31,35,42,44,45,62,66,69,88]
Emotiv Insight 5 [22,73]
SMARTING (mBrainTrain) 24 [90]
EEGO 24 [67]
EGI’s Geodesic EEG System (GES) 300 256 [28,84]
ElectroCap Inc. 19 [54]
Elemaya Visual Energy Tester 4 [52,53]
ENOBIO 20 [48,74]
g.GAMMAcap2 32 [81]
HeadCoach™, Alpha-Active Ltd 2 [33]
Liveamp EEG cap 32 [82]
Looxid Link Package for VIVE Pro 6 [80]
MindSet-1000 16 [77]
MindWave Mobile 1 [26,75,85]
Muse 4 [68,76]
NeurOne Bittium 32 [58]
Neuroscan 32 / 64 [23,60,61]
NeXus-32 Mindmedia 24 [70]
OPENBCI 8 [47]
QUASAR EEG headset 21 [64]
Table 5. Feature Extraction methods of EEG Signals.
Method References
Time-domain methods [21,23,55,58,67,74,78,87,90]
Frequency-domain methods - PSD [15,16,18,19,47,52,61,63,65,75,77,84,89,90]
Frequency-domain methods - FFT [12,13,14,25,35,44,47,51,52,54,61,70,86,90]
Frequency-domain methods – Other [20,22,34,44,45,57,60,69,74]
Time-frequency-domain methods [18,26,30,51,58,65,66,82,88]
Spatial-feature based methods [23,43,62]
Table 6. Methods for analysis of EEG Signals.
Method References
Statistical Analysis - ANOVA [16,19,23,24,28,31,33,35,43,46,48,51,53,54,58,59,65,67,71,77,78,86,87,89]
Statistical Analysis – other tests [11,13,14,15,21,29,33,41,43,45,49,50,61,63,65,69,73,82,83,88,90]
Machine Learning [12,17,18,20,21,22,25,26,27,30,32,34,44,52,53,55,62,68,70,71,74,75,76,77,80,84,90]
Graph theory [29]
Table 7. Comparative Study with Review papers.
Study Review Study Year Range Articles Included Main Objective Sub-Categories
Our Study Systematic 2012-2023 74 explores the intersection of user engagement and user experience studies with EEG General population
Analysis of EEG
[96] Literature 2014-2019 30 m-learning applications and relation to educational engagement with EEG analysis physiological-based
mobile computing
[97] Survey 2014-2022 39 Analysing virtual reality experience with EEG headsets Virtual reality
event-related potentials
Head-Mounted Displays
[98] Systematic 2010-2021 19 Studying the learning process and user experience with serious games and EEG Serious games
Eye tracking signals
skills and competencies
[99] Survey 2015-2020 31 Studying the algorithms and processes of EEG based BCI emotion recognition systems Emotion elicitation
signal acquisition
feature extraction, selection and classification performance evaluation
[100] Comprehensive 2015-2021 82 Reviews emotion recognition methods provides an overview of the datasets and methods used to elicit emotional states (feature extraction, feature selection/reduction, machine learning and deep learning methods)
Disclaimer/Publisher’s Note: The statements, opinions and data contained in all publications are solely those of the individual author(s) and contributor(s) and not of MDPI and/or the editor(s). MDPI and/or the editor(s) disclaim responsibility for any injury to people or property resulting from any ideas, methods, instructions or products referred to in the content.
Copyright: This open access article is published under a Creative Commons CC BY 4.0 license, which permit the free download, distribution, and reuse, provided that the author and preprint are cited in any reuse.
Prerpints.org logo

Preprints.org is a free preprint server supported by MDPI in Basel, Switzerland.

Subscribe

Disclaimer

Terms of Use

Privacy Policy

Privacy Settings

© 2025 MDPI (Basel, Switzerland) unless otherwise stated