
Submitted:
07 December 2024
Posted:
09 December 2024
You are already at the latest version
Abstract
Background/Objectives: Studies have detailed the variation in food content to work/school demands suggesting changes in food preferences across the week. Despite the variation in food composition in the population, there is no evidence identifying differences in food intake times and composition across the days of the week in urban/rural locations. Thus, the study’s aim was to identify weekday vs weekend differences in food intake times and composition (calories) between urban and rural areas. Methods: Data from 5,770 participants were analyzed from the National Household Budget Survey (POF-IBGE) consisting of two distinct food diaries records (weekday + weekend) per individual, including area (urban or rural) information. Results: During weekdays, the time of the first food intake was significantly earlier, and the last food intake time was significantly later compared to weekends, resulting in a longer eating window on weekdays in both urban and rural areas. People living in urban areas exhibited delayed first and last food intake times, resulting in later caloric and eating midpoints compared to people living in rural areas. Periodogram analysis detected weekly rhythmicity (7 days) in the time of the first food intake and the length of the eating window in urban residents. Conclusions: These findings show that people living in urban areas will be exposed to the consequences of inappropriate food intake times, such as overweight/obesity, along with circadian misalignment. Our study demonstrates that urbanization contributes to delayed food intake times and the maintenance of a rhythmic 7-day pattern, which was not observed in rural areas.
Keywords:
Chrononutrition
; Meal time
; Urbanization
; Circadian Misalignment
; POF
1. Introduction
The timing of meals (chrononutrition) and its metabolic consequences has received enhanced research interest in recent years [1,2]. Knowledge about “when we eat” combined with the substantial literature about “what we eat” across the 24-hour day has contributed to understanding the factors driving overweight and obesity in the population [3,4,5]. Evidence from chrononutrition studies has revealed the potential of unhealthy dietary habits to influence circadian rhythms and metabolic health involving bidirectionality between the main circadian pacemaker in the brain (located in the hypothalamic suprachiasmatic nuclei, SCN) and the peripheral clocks located in organs involved in food intake and metabolism [3,6,7]. Studies have shown that the timing of food intake has the potential to impact nutritional and metabolic health such as body weight [8,9], hormonal balance [10,11], glycemic and lipid metabolism [12], and sleep quality [13,14,15].
Weekend-weekday differences in the timing of food depends on rural/urban living. Variability in food content has been associated with positive and negative metabolic outcomes in the population [16,17]. Indeed, weight gain and obesity has been associated with breakfast skipping behavior [1,18,19]. Eating breakfast has been associated with a healthy metabolic status including positive outcomes after breakfast intake on glucose, insulin, ghrelin, and hunger [1,20,21]. Furthermore, a high-calorie breakfast together with an opposite low-calorie dinner seems to be effective to treat overweight/obesity and other metabolic disturbances [3]. Other recent studies have found that eating late is also a behavior associated with weight gain and obesity, suggesting a relationship between eating late and higher energy intake from total fats, cholesterol, and carbohydrates [1,20]. During the nighttime, fat oxidation is compromised as well as overall metabolism becomes less efficient due to reduced glucose tolerance [1]. In addition, societal routines and pressures such as work/school demands have explained the late eating behavior leading people to prefer an unhealthy food [22]. Therefore, not only does the quality and quantity of meals exert a crucial role on health but also food intake times need to be considered.
The aim of the current study was to investigate differences in food intake times between people living in urban and rural areas, as well as between weekdays and weekends, in a representative Brazilian sample. We expected to identify a weekly pattern with an early food intake time in the rural population as well as during the weekdays compared to weekends. Additionally, we hypothesized that the eating window would be extended during weekends due to the delayed food intake patterns in both rural and urban residents.
2. Materials and Methods
This study included data from the National Dietary Survey (INA), a section of the Family Budget Survey (POF) database specifically focusing on food habits and consumption of the Brazilian population [48]. The survey gathered information about the types and quantities of foods consumed, frequency and timing of food intake, and even cooking methods for certain items like meats and vegetables. It consisted of a nationally representative sample of 34,003 residents over 10 years old [48].
The survey was conducted over a year, from May 2008 to May 2009. Participants documented their food intake for two non-consecutive days within a week using self-reported food diaries [48]. This was important to minimize memory bias as recording occurred in real-time. Data were collected across all Brazilian states and the Federal District, using weighted sampling to ensure a representative sample [48]. To account for potential deviations from the overall population, the POF sampling weights considered some criteria: family size, selection probability, response rate, geographical and social strata distribution, and other statistical adjustments [49].
The POF (2008-2009) utilized a multi-stage sampling design in which census sector clusters served as the foundation for stratification within each stratum. Stratification was determined by government administrative divisions, urban or rural locale, and income levels as per the 2000 IBGE Census data [48,49]. From the initial sample (34,003) only data from adult residents were selected for this study (aged 18-59 years) which excluded 12,983 individuals. To ensure an accurate representation of both weekday and weekend eating habits, we further refined the sample by excluding individuals with missing food diaries completion dates (n=398, remaining: 20,622). Additionally, we only included participants who provided two distinct food diaries entries, one from a weekday and one from a weekend. This resulted in the exclusion of 14,852 individuals, leaving a final sample size of 5,770 participants with complete dietary data for both weekdays and weekends.
This study focused on the temporal aspects of food intake, which we have termed chrononutritional variables. The specific timing-related variables included: First Food Intake Time, Last Food Intake Time, Eating Midpoint, Caloric Midpoint, and Eating Window. We defined First Food Intake Time as any consumption occurring after 05:00 h, and Last Food Intake Time was considered up to 04:00 h. The Eating Midpoint was calculated as the average time between the first and last intake times, using the following formula: Eating Midpoint = (Last Food Intake time – First Food Intake time / 2) + First Food Intake time. For example, an individual who consumed their first meal at 08:00 h and their last meal at 20:00 h has a 12-hour eating window, resulting in an Eating Midpoint of 14:00 hours. The Caloric Midpoint was calculated as the time at which 50% of each individual's daily calories were consumed. The Eating Window was based on the time between the first and last food intake.
2.1. Statistical Analysis
To characterize the data, we calculated descriptive statistics (proportions and confidence intervals) for sociodemographic data between Brazil’s areas (urban and rural). The chrononutritional variables were described through means and confidence intervals related to the weekday vs. weekend comparison and the urban/rural areas. For categorical variables presented in the sociodemographic proportions, we employed a chi-squared test to assess potential differences in frequencies, whereas a two-way ANOVA was used to explore the influence of the weekday vs. weekend comparison and the urban vs rural areas on the chrononutritional variables. Following the significant interactions identified by the two-way ANOVA, post-hoc comparisons were conducted using the Sidak correction.
Analysis of the time series derived from the two non-consecutive days of food diaries was conducted using Lomb-Scargle periodograms (LSP) to detect potential rhythmic patterns in the chrononutritional variables. The "lomb" R package, specifically the "lsp" function, was employed for computing Lomb-Scargle periodograms, chosen for its suitability in handling time series with irregular sampling intervals [50]. This method is widely utilized in chronobiology due to its robustness in addressing unevenly spaced time series, along with its ability to provide statistical significance levels for each peak identified in the periodogram [50,51]. The irregularity in our samples’ time series stems from incomplete data, attributed to sporadic missing observations occurring throughout the data collection period spanning 2008 to 2009.
Both descriptive and inferential analyses were adjusted for the samples’ complex design, which accounted for the potential clustering of participants within specific groups. This involved utilizing either the "svy" commands in Stata 16 or the "survey" package in R 4.2.1 throughout the data analysis [52]. A significance level of p < 0.05 was adopted for all analyses.
3. Results
The sociodemographic variables are described in Table 1 comprising the total sample (n=5,770) and stratified by the areas (urban and rural). This study consisted of 76.2% people living in urban areas, whereas 23.8% lived in rural areas. Most of the frequencies of the sociodemographic variables differed between urban and rural areas. There was a slight predominance of females in urban areas (50.5% vs. 49.5% of males); the opposite pattern was observed in the rural areas comprising a male predominance (54.4% vs. 45.6% of females). In addition, people reporting 0-10 years of education were in a slight majority in the urban areas (51.3% vs. 48.7% reporting more than 11 years of education). On the other hand, the frequency of people reporting 0-10 years of education was higher (80.6%) than people reporting more than 11 years of education (19.4%) in the rural areas. Most people declared themselves white (51.1%) in the urban areas followed by black/brown declarations (47.9%). An opposite pattern was observed in the rural areas with most people declared black/brown (67.1%) followed by white (31.3%).
The comparison between weekdays and weekends revealed significant main effects in three chrononutritional variables (Table 2). The first food intake time occurred earlier on the weekdays (07:42 h) compared to weekends (07:53 h; p < 0.001). However, the last food intake time showed an opposite pattern occurring later in the weekdays (20:07 h) compared to the weekends (19:59 h; p = 0.04). Although these differences seem small, they result in a significant difference in the length of the eating window with an increased duration during the weekdays (12.42 h) compared to the weekends (12.09 h, p < 0.001). On the other hand, both the eating and caloric midpoints did not vary between the weekdays and the weekends.
The urban/rural area where the participants lived influenced the food intake time on most of the chrononutritional variables. In urban areas the first food intake time occurred later than in the rural areas (07:57 h vs. 07:17 h respectively; p < 0.001), while the last food intake time followed the same pattern, occurring later in urban areas compared to rural areas (20:12 h vs. 19:39 h respectively; p < 0.001) regardless of the day of the week. These outcomes led to differences in the eating and caloric midpoints between urban and rural areas. Both of these chrononutritional variables occurred later in the urban areas than in the rural areas (urban: 14:04 h and 13:36 h vs. rural: 13:28 h and 12:59 h; p < 0.001 in both). No statistical differences in the chrononutritional variables were observed in the interactions between weekday vs. weekend comparison x urban/rural area.
Analysis of the time series (365 days) considering the areas separately (urban and rural) detected a weekly rhythmic pattern in both the time of first food intake (7 days) and the eating window (6.98 days) only in the urban area (Figure 1). The other chrononutritional variables (last food intake time, eating midpoint, and caloric midpoint) did not show significant peaks in their periodograms in either of the areas (Supplementary Material, Figures S1-S3).
4. Discussion
This is the first report to describe a weekly rhythm (7 days) in food intake times in urban or rural living environments and compare food intake times between weekends and weekdays. Firstly, our study demonstrates a weekly rhythm exclusively in urban areas. There is no significant weekly rhythm in food intake times in rural areas, suggesting the absence of a strong social determinant distinguishing weekends from workdays. Secondly, when comparing urban and rural areas, we found that individuals residing in urban areas had significantly later first food intake times compared to those living in rural areas. The same pattern was observed for the last food intake, with urban dwellers also having later last food intake times. Thus, urban residents had both later eating and caloric midpoints. Thirdly, our results indicate weekday/weekend differences in the temporal aspects of food intake as a main effect. We show that the first food intake times during weekdays were significantly earlier than on weekends, regardless of the areas where the participants lived. By contrast, the last food intake times were later during weekdays than on weekends. These findings demonstrate a longer duration eating window on weekdays compared to weekends, which was similar to a recent cross-sectional Chinese study [23].
Some studies have investigated differences in food consumption between weekday vs. weekend demonstrating both increased eating episodes and preference for snacks during the weekdays compared to weekends [24,25,26,27]. Moreover, eating either during the daytime or in the evening was reduced on weekends [28]. However, data from NHANES (2003-2012) have found an opposite effect, showing increased total energy intake and a less healthy diet during weekends compared to weekdays. This highlights the role of fast foods in contributing to the high-calorie intake and poorer diet on weekends [22]. Considering our results, we can infer that these differences are specific to urban areas, as no weekly pattern was observed among rural dwellers, suggesting they tend to maintain the same eating times on both weekends and weekdays.
The longer working hours and commutes tend to delay sleep and the food intake times routine in people living in urbanized cities [29,30,31], leading to later first and last food intake times, as well as the later eating and caloric midpoints found in our study. Breakfast skipping is a common practice in urbanized cities [20,32], thus individuals delay their first food intake time and swop this high-quality meal for ultra-processed snacks [33,34]. Furthermore, the increased opportunity for social activities in urban areas gives access to several food options (e.g. food delivery services and convenience stores) after an extended work journey or social event; this scenario thus contributing to activities late into the night, delaying the last food intake times [1,10]. This phenomenon usually develops into a chronic circadian rhythm delay, not just affecting food intake times but also disrupting other circadian-oriented behaviors as the sleep/wake cycle [14,35].
People living in urban areas have societal routines/pressures mentioned above as well as other specific conditions related to circadian biology. Reduced exposure to natural daylight in work/school settings alters circadian rhythms influencing food intake times across the days. A laboratory study conducted under constant routine conditions demonstrated that meal times synchronize peripheral oscillators [37], which helps explain the recognized correlation between the circadian system and food intake. Thus, the 7-day rhythmic pattern detected in this study suggests that individuals living in urban areas exhibit weekly variations in food intake times that align with their other weekly-oriented circadian rhythms, such as the sleep/wake cycle. This relationship suggests that the weekly irregularity of food intake times may be a pivotal factor contributing to the social jetlag in the weekly sleep/wake cycle [36,37]. Urban residents are thus prone to experience delayed food intake times and a longer eating window during weekdays which drives both health and well-being impairments due to circadian misalignment [19,38]. On the other hand, exposure to natural daylight in people living in rural areas is reflected in both regular food intake times and sleep/wake times during both weekdays and weekends [39].
By contrast, a few studies conducted in both low-income and high-income countries have reported increased risk for overweight/obesity in rural populations [40,41]. The authors have suggested that preservation food methods (e.g. salting and smoking) when there is a restricted electricity might be an explanation for these findings [20,42]. Moreover, a population-based study conducted by Trivedi and colleagues in the USA (NHANES 1999-2006) identified poor meal habits in rural populations which were characterized by a higher consumption of sugary beverages and lower intakes of fiber and fruits, highlighting a higher propensity for obesity in rural than in urban areas [40].
The forces influencing work and school routines in urbanized societies have been related to consistent food consumption patterns during the week [20]. A pivotal population-based study undertaken in Brazil using the same sample as this study (POF 2008-2009) found that daily energy intake was higher during weekends [26]. In addition, carbohydrates were the main components of this energy intake during weekdays, in contrast to the total, saturated, and trans fats identified more frequently during weekends [26]. During the weekends (when the eating window was shorter) the total energy intake was higher than on weekdays due to social activities that could change food intake favoring the consumption of fast foods and ultra-processed foods leading to low-quality food consumption [26]. Through the lens of chrononutrition it is possible to visualize a potential factor for overweight and obesity in the Brazilian population [26]: namely the reduced eating window observed on weekends in our study. This occurred at the same time as the higher calorie intake identified during this period [26]. This situation highlights a concern about the weekly variation in eating behavior and the potential role of social activities in driving these irregular meal time patterns.
Despite the lack of studies demonstrating a variation in meal times during the week, results with data from one of the most important national population-based surveys was published recently [43]. Evidence from the National Health and Nutrition Examination Survey (NHANES 2017-2018, United States) corroborates our findings showing an early first food intake time and a late last food intake time during weekdays of the whole sample [43]. In addition, these findings revealed a longer eating window during weekdays similar to our study. However, the study did not analyze the weekly rhythmic pattern of urban and rural samples, nor did it compare them.
Previous studies have shown that the influence of the workplace during the weekdays and social obligations during weekends may be responsible for the common pattern of more meals and snacks during the weekdays compared to weekends [26,44,45]. There is a survey that recorded the main meals in the evening relative to weekdays in the US population [45] that highlighted the potential effect of work, study, and other obligations [30,31] to spread meal times over a longer period during weekdays. In addition, the length of the commute is a critical factor that affects meal times in populations residing in urban cities [30] which contributes to an extended eating window during weekdays. Conversely, the free time available during the nonwork days on weekends allows food intake at more favorable times and includes less breakfast skipping and less ingestion of multiple snacks throughout the day [45].
This study has some limitations. This is a cross-sectional study, and while we conducted analyses to adjust for potential confounding factors, this study design inherently limits the ability to establish causal relationships, with reverse causality being a concern. The instrument used to gather information on food consumption, although validated and widely used in scientific studies, is subjective and relies on the motivation of the interviewed participants. In addition, the reduced sample size may have affected the statistical analyses although it was essential to ensure an accurate representation of both weekday/weekend eating habits including only individuals with complete food diaries data (details in the Methods section). Reduction of the sample size in complex sampling designs may increase the chance of producing bias due to not accurately representing the population distribution within each stratum [46,47].
5. Conclusions
This study provides novel insights into the influence of the day of the week and residential area (urban/rural) on the timing of food intake in a population-based sample. Our study demonstrates that urbanization contributes to delayed food intake times and the maintenance of a rhythmic 7-day pattern, which was not observed in rural areas. These findings help to explain why people living in urban environments face the negative consequences of unhealthy eating schedules, such as being overweight, with an increased risk of obesity, and circadian misalignment. Additionally, the results highlight that during weekdays, the first food intake occurred significantly earlier and the last food intake occurred significantly later than on weekends, leading to a longer eating window. These insights will be valuable for healthcare professionals and policymakers in promoting healthier food intake schedules, taking into account both the days of the week (weekdays and weekends) and the participants’ place of residence (urban or rural).
Supplementary Materials
The following supporting information can be downloaded at the website of this paper posted on Preprints.org. Figure S1: Lomb-Scargle periodograms from the last food intake time by the geographic areas (urban and rural zones); Figure S2: Lomb-Scargle periodograms from the eating midpoint by the geographic areas (urban and rural zones); Figure S3: Lomb-Scargle periodograms from the caloric midpoint by the geographic areas (urban and rural zones).
Author Contributions
Conceptualization, J.S.S., D.J.S., C.A.C. and C.R.d.C.M.; Methodology, J.S.S., D.J.S., C.A.C. and C.R.d.C.M.; Formal analysis, J.S.S., D.J.S., C.A.C. and C.R.d.C.M.; Data curation, J.S.S., D.J.S., C.A.C. and C.R.d.C.M.;Writing—original draft, J.S.S. and C.R.d.C.M.;Writing—review & editing, J.S.S., D.J.S., C.A.C. and C.R.d.C.M.; Project administration, C.A.C. and C.R.d.C.M. All authors have read and agreed to the published version of the manuscript.
Funding
This research was funded by the PostDoc Fellowship provided by Conselho Nacional de Desenvolvimento Científico e Tecnológico-CNPq (151501/2022-0). Claudia R.C. Moreno is a fellowship recipient of CNPq 307875/2022-9 and Fundação de Amparo à Pesquisa do Estado de São Paulo – FAPESP 2022/01985-0. Cibele A. Crispim is a fellowship recipient of CNPq 401761/2022-3 and received a fellowship from the IAS/ University of Surrey.
Institutional Review Board Statement
Not applicable.
Informed Consent Statement
Not applicable.
Data Availability Statement
Available upon request to the corresponding author.
Acknowledgments
This work was supported by the Fundação de Amparo à Pesquisa do Estado de São Paulo (FAPESP), the Conselho Nacional de Desenvolvimento Científico e Tecnológico (CNPq) and the Institute of Advanced Studies (IAS) of the University of Surrey.
Conflicts of Interest
The authors declare no conflict of interest.
References
- Crispim, C.A.; Mota, M.C. New Perspectives on Chrononutrition. Biol Rhythm Res 2019, 50, 63–77. [Google Scholar] [CrossRef]
- Oike, H.; Oishi, K.; Kobori, M. Nutrients, Clock Genes, and Chrononutrition. Curr Nutr Rep 2014, 3, 204–212. [Google Scholar] [CrossRef]
- Ahluwalia, M.K. Chrononutrition—When We Eat Is of the Essence in Tackling Obesity. Nutrients 2022, 14, 5080. [Google Scholar] [CrossRef]
- Spence, C. Explaining Diurnal Patterns of Food Consumption. Food Qual Prefer 2021, 91, 104198. [Google Scholar] [CrossRef]
- Raatz, S.K.; Conrad, Z.; Johnson, L.A.K.; Picklo, M.J.; Jahns, L. Relationship of the Reported Intakes of Fat and Fatty Acids to Body Weight in US Adults. Nutrients 2017, 9, 1–13. [Google Scholar] [CrossRef] [PubMed]
- Oosterman, J.E.; Kalsbeek, A.; la Fleur, S.E.; Belsham, D.D. Impact of Nutrients on Circadian Rhythmicity. American Journal of Physiology-Regulatory, Integrative and Comparative Physiology 2014, 308, R337–R350. [Google Scholar] [CrossRef] [PubMed]
- Maury, E. Off the Clock: From Circadian Disruption to Metabolic Disease. Int J Mol Sci 2019, 20, 1597. [Google Scholar] [CrossRef] [PubMed]
- Dashti, H.S.; Scheer, F.A.J.L.; Saxena, R.; Garaulet, M. Timing of Food Intake: Identifying Contributing Factors to Design Effective Interventions. Advances in Nutrition 2019, 10, 606–620. [Google Scholar] [CrossRef]
- Dashti, H.S.; Gómez-Abellán, P.; Qian, J.; Esteban, A.; Morales, E.; Scheer, F.; Garaulet, M. Late Eating Is Associated with Cardiometabolic Risk Traits, Obesogenic Behaviors, and Impaired Weight Loss. Am J Clin Nutr 2021, 113, 154–161. [Google Scholar] [CrossRef] [PubMed]
- Meléndez-Fernández, O.H.; Liu, J.A.; Nelson, R.J. Circadian Rhythms Disrupted by Light at Night and Mistimed Food Intake Alter Hormonal Rhythms and Metabolism. Int J Mol Sci 2023, 24, 3392. [Google Scholar] [CrossRef]
- Coll, A.P.; Farooqi, I.S.; O’Rahilly, S. The Hormonal Control of Food Intake. Cell 2007, 129, 251–262. [Google Scholar] [CrossRef] [PubMed]
- Nakamura, K.; Tajiri, E.; Hatamoto, Y.; Ando, T.; Shimoda, S.; Yoshimura, E. Eating Dinner Early Improves 24-h Blood Glucose Levels and Boosts Lipid Metabolism after Breakfast the next Day: A Randomized Cross-over Trial. Nutrients 2021, 13, 2424. [Google Scholar] [CrossRef] [PubMed]
- Luz, C.S. da S. ; da Fonseca, A.E.T.P.; Santos, J.S.; Araujo, J.F.; Duarte, L.L.; Moreno, C.R. de C. Association of Meal Timing with Sleep Quality and Anxiety According to Chronotype: A Study of University Students. Clocks Sleep 2024, 6, 156–169. [Google Scholar] [CrossRef]
- Crispim, C.A.; Zimberg, I.Z.; Reis, B.G.; Diniz, R.M.; Tufik, S.; Mello, M.T. Relationship between Food Intake and Sleep Pattern in Healthy Individuals. Journal of Clinical Sleep Medicine 2011, 7, 659–664. [Google Scholar] [CrossRef] [PubMed]
- Chaput, J.P.; McHill, A.W.; Cox, R.C.; Broussard, J.L.; Dutil, C.; da Costa, B.G.G.; Sampasa-Kanyinga, H.; Wright, K.P. The Role of Insufficient Sleep and Circadian Misalignment in Obesity. Nat Rev Endocrinol 2023, 19, 82–97. [Google Scholar] [CrossRef] [PubMed]
- Pot, G.K.; Hardy, R.; Stephen, A.M. Irregular Consumption of Energy Intake in Meals Is Associated with a Higher Cardiometabolic Risk in Adults of a British Birth Cohort. International Journal of Obesity 2014 38:12 2014, 38, 1518–1524. [Google Scholar] [CrossRef]
- Pot, G.K.; Almoosawi, S.; Stephen, A.M. Meal Irregularity and Cardiometabolic Consequences: Results from Observational and Intervention Studies. Proceedings of the Nutrition Society 2016, 75, 475–486. [Google Scholar] [CrossRef] [PubMed]
- Crispim, C.A.; Rinaldi, A.E.M.; Azeredo, C.M.; Skene, D.J.; Moreno, C.R.C. Is Time of Eating Associated with BMI and Obesity? A Population-Based Study. Eur J Nutr 2023, 63, 527–537. [Google Scholar]
- Dashti, H.S.; Scheer, F.A.J.L.; Saxena, R.; Garaulet, M. Timing of Food Intake: Identifying Contributing Factors to Design Effective Interventions. Advances in Nutrition 2019, 10, 606–620. [Google Scholar] [CrossRef] [PubMed]
- Pot, G.K. Sleep and Dietary Habits in the Urban Environment: The Role of Chrono-Nutrition. Proceedings of the Nutrition Society 2018, 77, 189–198. [Google Scholar] [CrossRef] [PubMed]
- Spence, C. Explaining Seasonal Patterns of Food Consumption. Int J Gastron Food Sci 2021, 24, 100332. [Google Scholar] [CrossRef]
- An, R. Weekend-Weekday Differences in Diet among U. S. Adults, 2003–2012. Ann Epidemiol 2016, 26, 57–65. [Google Scholar] [CrossRef]
- Tang, R.; Wang, J.; Zhang, W.; Fu, W.; Zhuo, L.; Yang, J.; Wang, Q. ; Kun Yang Eating Window and Eating Habits of Adults in China: A Cross-Sectional Study. Heliyon 2023, 9. [Google Scholar] [CrossRef]
- Esposito, F.; Sanmarchi, F.; Marini, S.; Masini, A.; Scrimaglia, S.; Adorno, E.; Soldà, G.; Arrichiello, F.; Ferretti, F.; Rangone, M.; et al. Weekday and Weekend Differences in Eating Habits, Physical Activity and Screen Time Behavior among a Sample of Primary School Children: The “Seven Days for My Health” Project. Int J Environ Res Public Health 2022, 19, 4215. [Google Scholar] [CrossRef] [PubMed]
- Pellegrini, C.A.; Conroy, D.E.; Phillips, S.M.; Pfammatter, A.F.; McFadden, H.G.; Spring, B. Daily and Seasonal Influences on Dietary Self-Monitoring Using a Smartphone Application. J Nutr Educ Behav 2018, 50, 56–61e1. [Google Scholar] [CrossRef] [PubMed]
- Monteiro, L.S.; Hassan, B.K.; Estima, C.C.P.; Souza, A. de M. ; Junior, E.V.; Sichieri, R.; Pereira, R.A. Food Consumption According to the Days of the Week – National Food Survey, 2008-2009. Rev Saude Publica 2017, 51, 1–11. [Google Scholar] [CrossRef]
- Ali, S.H.; Gu, Y.; Yan, S.; Craig, H.C.; Adams, L.; Poirier, L.; Park, R.; Gunen, B.; Gittelsohn, J. Healthy Mondays or Sundays? Weekday Preferences for Healthy Eating and Cooking among a Food Insecure Population in a U.S. Urban Environment. J Hunger Environ Nutr 2022, 17, 14–31. [Google Scholar] [CrossRef]
- Peters, B.; Vahlhaus, J.; Pivovarova-Ramich, O. Meal Timing and Its Role in Obesity and Associated Diseases. Front Endocrinol (Lausanne) 2024, 15, 1359772. [Google Scholar] [CrossRef] [PubMed]
- Nabdi, S.; Boujraf, S.; Benzagmout, M. Evaluation of Rural-Urban Patterns in Dietary Intake: A Descriptive Analytical Study – Case Series. Annals of Medicine and Surgery 2022, 84. [Google Scholar] [CrossRef]
- Dunlop, B.; Garcia, R.W.D. Práticas e Comportamento Alimentar No Meio Urbano: Um Estudo No Centro Da Cidade de São Paulo. Cad Saude Publica 1997, 13, 455–467. [Google Scholar] [CrossRef]
- Collaço, J.H.L. Um Olhar Antropológico Sobre o Hábito de Comer Fora. CAMPOS - Revista de Antropologia Social 2003, 4. [Google Scholar] [CrossRef]
- Forkert, E.C.O.; De Moraes, A.C.F.; Carvalho, H.B.; Manios, Y.; Widhalm, K.; González-Gross, M.; Gutierrez, A.; Kafatos, A.; Censi, L.; De Henauw, S.; et al. Skipping Breakfast Is Associated with Adiposity Markers Especially When Sleep Time Is Adequate in Adolescents. Sci Rep 2019, 9, 1–10. [Google Scholar] [CrossRef]
- Canella, D.S.; Louzada, M.L. da C. ; Claro, R.M.; Costa, J.C.; Bandoni, D.H.; Levy, R.B.; Martins, A.P.B. Consumption of Vegetables and Their Relation with Ultra-Processed Foods in Brazil. Rev. Saúde Pública 2018, 52, 50. [Google Scholar]
- Andrade, G.C.; Gombi-Vaca, M.F.; Louzada, M.L.D.C.; Azeredo, C.M.; Levy, R.B. The Consumption of Ultra-Processed Foods According to Eating out Occasions. Public Health Nutr 2020, 23, 1041–1048. [Google Scholar] [CrossRef] [PubMed]
- Lopes, T. do V. C.; Borba, M.E.; Lopes, R. do V.C.; Fisberg, R.M.; Paim, S.L.; Teodoro, V.V.; Zimberg, I.Z.; Crispim, C.A. Eating Late Negatively Affects Sleep Pattern and Apnea Severity in Individuals With Sleep Apnea. Journal of Clinical Sleep Medicine 2019, 15, 383–392. [Google Scholar] [CrossRef]
- Arab, A.; Karimi, E.; Garaulet, M.; Scheer, F.A.J.L. Journal Pre-Proof Social Jetlag and Dietary Intake: A Systematic Review. 2023. [CrossRef]
- Wittmann, M.; Dinich, J.; Merrow, M.; Roenneberg, T. Social Jetlag: Misalignment of Biological and Social Time. Chronobiol Int 2006, 23, 497–509. [Google Scholar] [CrossRef]
- McHill, A.W.; Phillips, A.J.K.; Czeisler, C.A.; Keating, L.; Yee, K.; Barger, L.K.; Garaulet, M.; Scheer, F.A.J.L.; Klerman, E.B. Later Circadian Timing of Food Intake Is Associated with Increased Body Fat. Am J Clin Nutr 2017, 106, 1213–1219. [Google Scholar] [CrossRef] [PubMed]
- Pilz, L.K.; Levandovski, R.; Oliveira, M.A.B.; Hidalgo, M.P.; Roenneberg, T. Sleep and Light Exposure across Different Levels of Urbanisation in Brazilian Communities. Scientific Reports 2018 8:1 2018, 8, 1–11. [Google Scholar] [CrossRef] [PubMed]
- Trivedi, T.; Liu, J.; Probst, J.; Merchant, A.; Jones, S.; Martin, A.B. Obesity and Obesity-Related Behaviors among Rural and Urban Adults in the USA. Rural Remote Health 2015, 15. [Google Scholar] [CrossRef]
- Maddah, M.; Rashidi, A.; Mohammadpour, B.; Vafa, R.; Karandish, M. In-School Snacking, Breakfast Consumption, and Sleeping Patterns of Normal and Overweight Iranian High School Girls: A Study in Urban and Rural Areas in Guilan, Iran. J Nutr Educ Behav 2009, 41, 27–31. [Google Scholar] [CrossRef] [PubMed]
- Mayén, A.L.; Marques-Vidal, P.; Paccaud, F.; Bovet, P.; Stringhini, S. Socioeconomic Determinants of Dietary Patterns in Low- and Middle-Income Countries: A Systematic Review. Am J Clin Nutr 2014, 100, 1520–1531. [Google Scholar] [CrossRef]
- Teixeira, G.P.; Da Cunha, N.B.; Azeredo, C.M.; Rinaldi, A.E.M.; Crispim, C.A. Eating Time Variation from Weekdays to Weekends and Its Association with Dietary Intake and BMI in Different Chronotypes: Findings from National Health and Nutrition Examination Survey (NHANES) 2017–2018. British Journal of Nutrition 2024, 131, 1281–1288. [Google Scholar] [CrossRef]
- De Castro, J.M. Weekly Rhythms of Spontaneous Nutrient Intake and Meal Pattern of Humans. Physiol Behav 1991, 50, 729–738. [Google Scholar] [CrossRef] [PubMed]
- An, R. Weekend-Weekday Differences in Diet among U. S. Adults, 2003–2012. Ann Epidemiol 2016, 26, 57–65. [Google Scholar] [CrossRef] [PubMed]
- Faber, J.; Fonseca, L.M. How Sample Size Influences Research Outcomes. Dental Press J Orthod 2014, 19, 27–29. [Google Scholar] [CrossRef] [PubMed]
- Tracy, P.E.; Carkin, D.M. Adjusting for Design Effects in Disproportionate Stratified Sampling Designs Through Weighting. Crime Delinq 2014, 60, 306–325. [Google Scholar] [CrossRef]
- Instituto Brasileiro de Geografia e Estatística - IBGE Pesquisa de Orçamentos Familiares 2008-2009: Análise Do Consumo Alimentar Pessoal No Brasil; IBGE - Coordenação de Trabalho e Rendimento: Rio de Janeiro, 2011; ISBN 9788524041983.
- Instituto Brasileiro de Geografia e Estatística - IBGE Pesquisa de Orçamentos Familiares 2008-2009: Despesas, Rendimentos e Condições de Vida; IBGE - Coordenação de Trabalho e Rendimento: Rio de Janeiro, 2010; ISBN 9788524041310.
- Ruf, T. The Lomb-Scargle Periodogram in Biological Rhythm Research: Analysis of Incomplete and Unequally Spaced Time-Series. Biol Rhythm Res 1999, 30, 178–201. [Google Scholar] [CrossRef]
- Díez-Noguera, A. Methods for Serial Analysis of Long Time Series in the Study of Biological Rhythms. J Circadian Rhythms 2013, 11. [Google Scholar] [CrossRef]
- Lumley, T. Analysis of Complex Survey Samples. J Stat Softw 2004, 9, 1–19. [Google Scholar] [CrossRef]
Figure 1.
Lomb-Scargle periodograms from both the first food intake time and eating window by the areas (urban and rural zones). The first peak is represented by the p-value followed by the period in days (text on the figure top). The second and third peaks are represented by days.
Figure 1.
Lomb-Scargle periodograms from both the first food intake time and eating window by the areas (urban and rural zones). The first peak is represented by the p-value followed by the period in days (text on the figure top). The second and third peaks are represented by days.
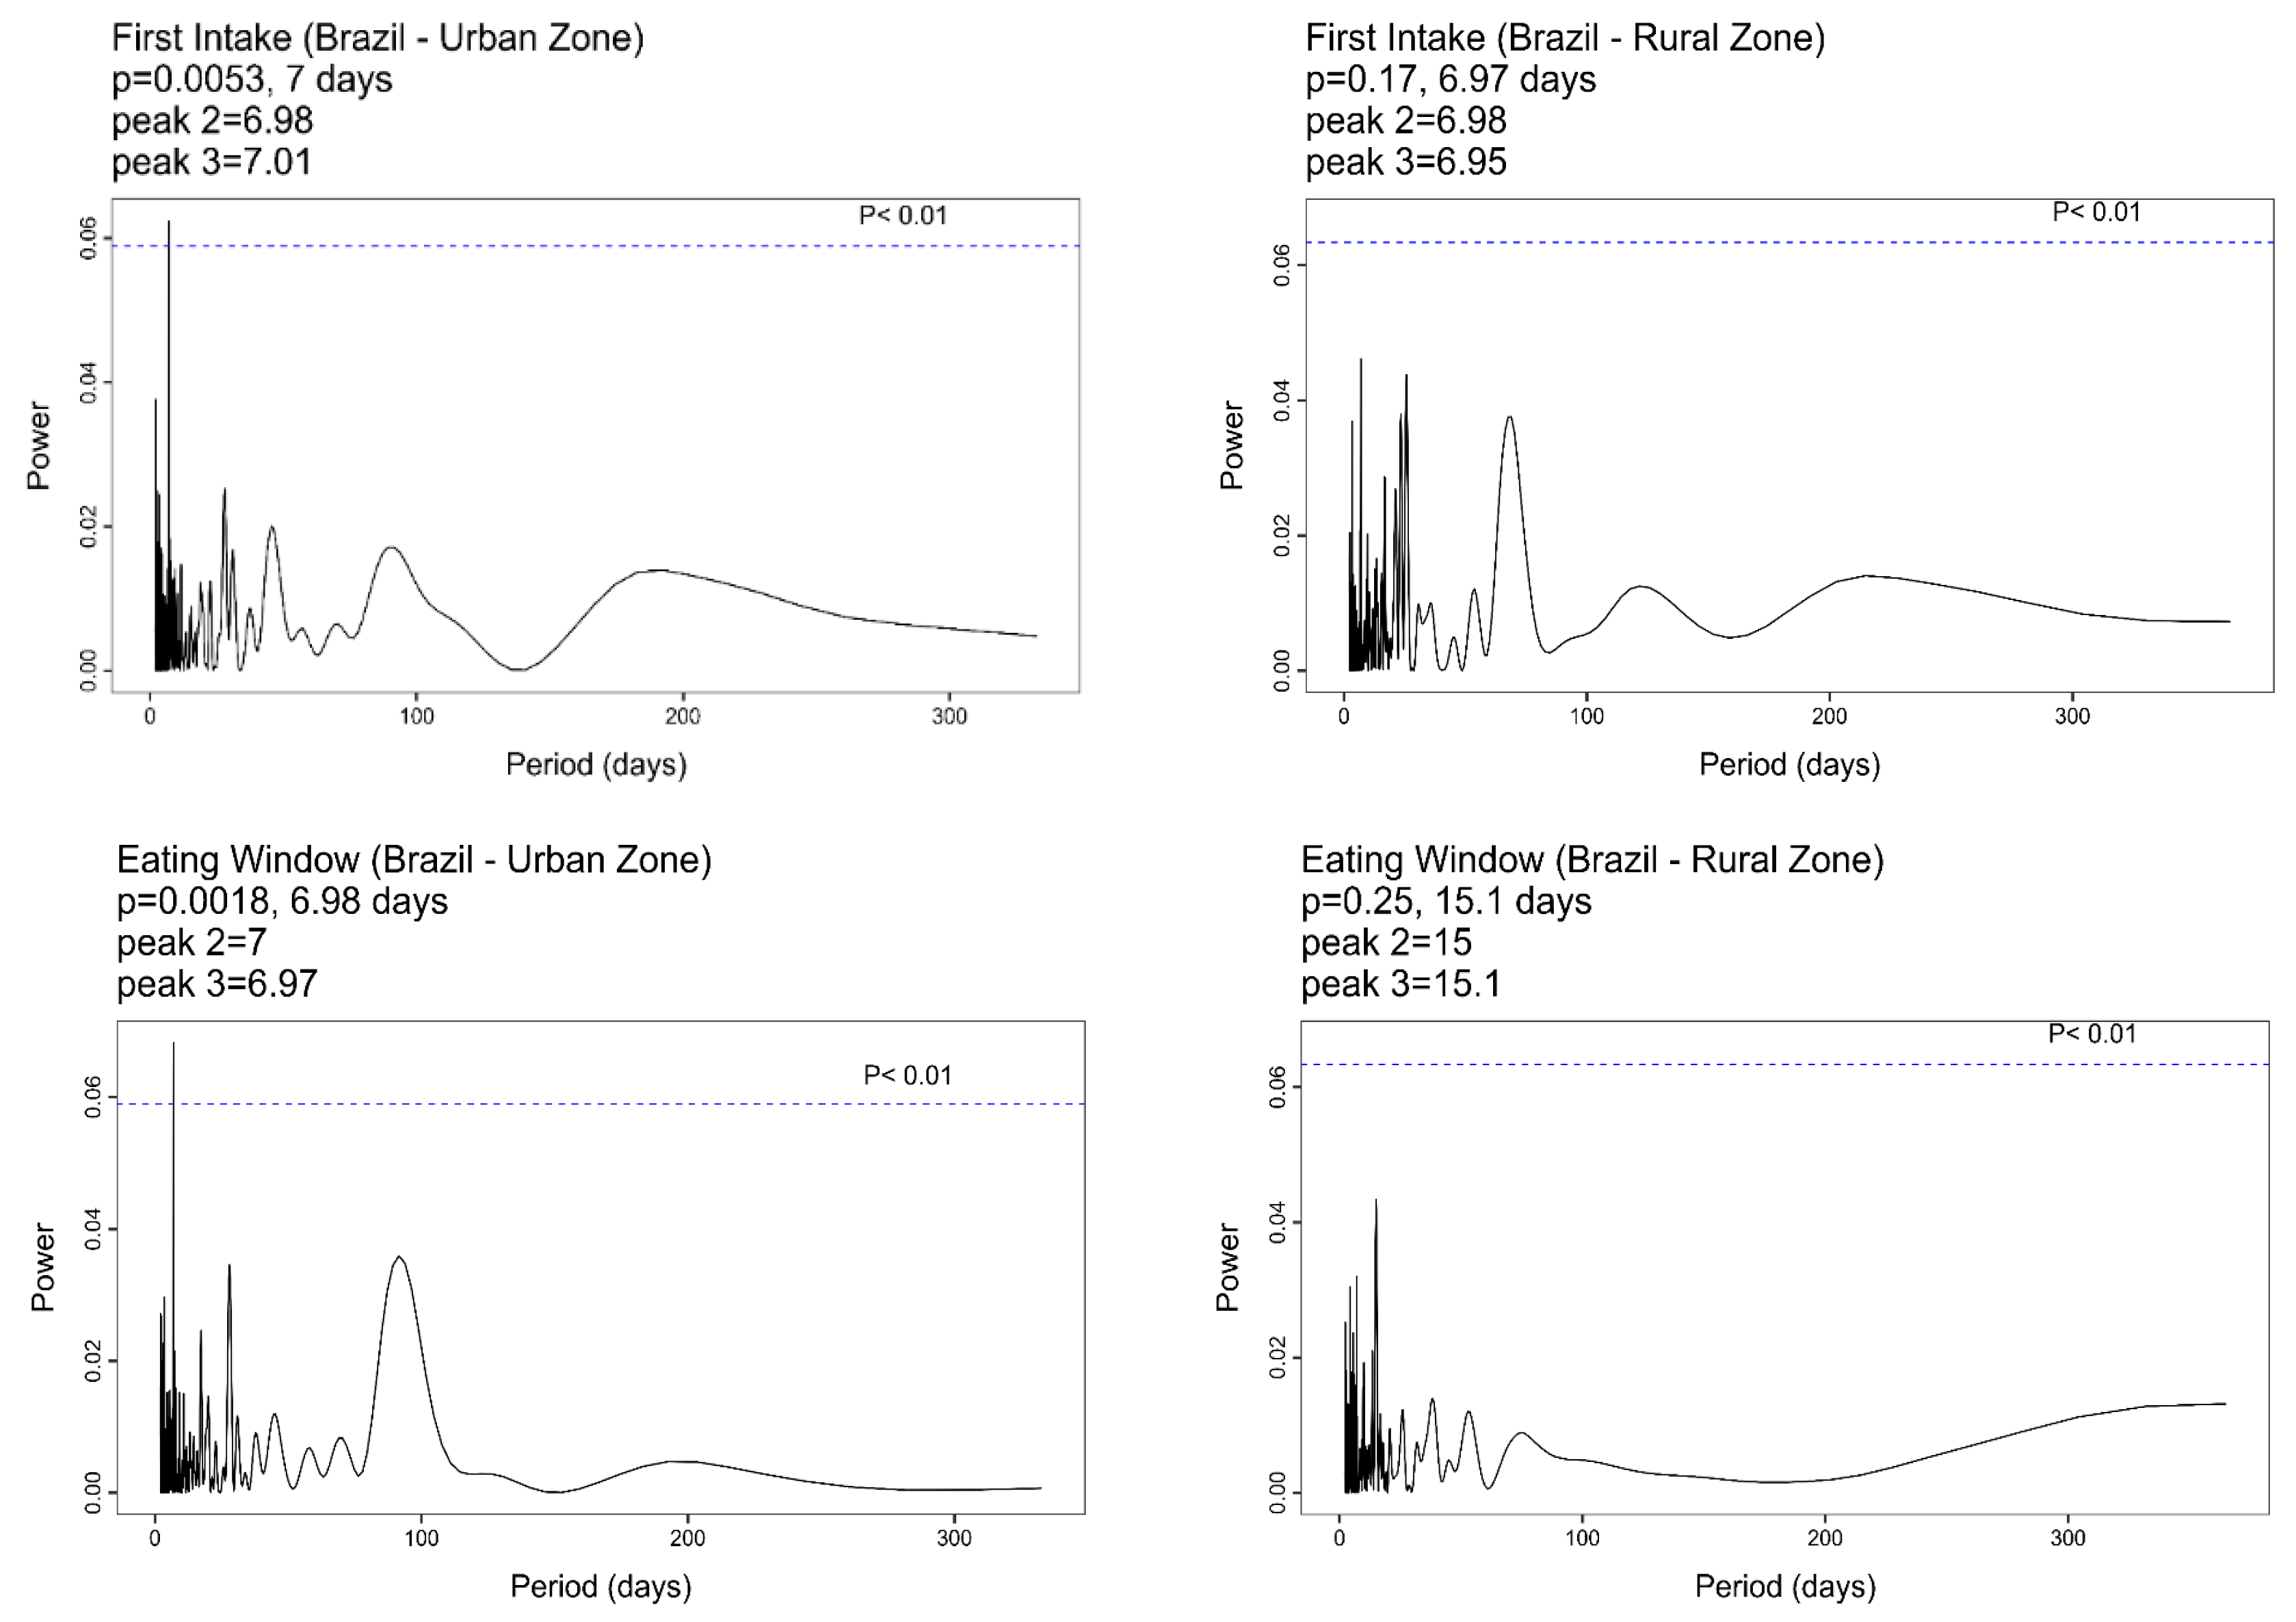

Table 1.
Sociodemographic characteristics of the sample according to the areas.
| Areas | |||
| Brazil (n=5,770) |
Urban (n=4,400) |
Rural (n=1,370) | |
| Sociodemographic variables | % (95% CI) |
% (95% CI) |
% (95% CI) |
| Sex Male Female |
50.4 (49.0-51.7) 49.6 (48.2-51.0) |
49.5* (47.9-51.1) 50.5* (48.9-52.1) |
54.4* (52.0-56.8) 45.6* (43.2-48.0) |
| Age (years) 18-25 26-35 36-45 45-59 |
21.3 (19.8-22.9) 28.1 (26.2-30.0) 26.1 (24.3-27.8) 24.5 (22.8-26.2) |
21.1 (19.3-22.9) 28.3 (26.1-30.4) 26.1 (24.1-28.1) 24.5 (22.6-26.4) |
22.4 (19.3-25.5) 27.2 (23.7-30.7) 25.9 (22.6-29.3) 24.5 (21.2-27.7) |
| Years of education 0-10 >11 |
56.6 (54.4-56.7) 43.4 (41.3-45.6) |
51.3* (48.8-53.7) 48.7* (46.2-51.2) |
80.6* (77.8-83.5) 19.4* (16.5-22.2) |
| Race/ethnicity White Black/Brown Asian/Indigenous Do not know |
47.5 (45.3-49.6) 51.5 (49.2-53.5) 0.7 (0.4-1.1) 0.3 (0.1-0.6) |
51.1* (48.5-53.6) 47.9* (45.4-50.5) 0.6* (0.3-1.0) 0.4* (0.1-0.6) |
31.3* (27.1-35.4) 67.1* (62.8-71.5) 1.3* (0.2-2.4) 0.3* (0.0-0.7) |
| BMI (kg/m2) < 24.9 25-29.9 > 30 |
54.4 (52.5-56.3) 32.2 (30.5-33.9) 13.4 (12.1-14.7) |
53.4* (51.2-55.6) 32.9* (30.9-34.8) 13.7* (12.2-15.2) |
58.7* (55.4-62.0) 29.3* (26.2-32.3) 12.0* (9.4-14.6) |
National Household Budget Survey (POF/IBGE 2008-2009). * Chi-squared test: p < 0.05 in bold. Data indicated by the frequency (%) and the confidence interval (95% CI).
Table 2.
Isolated and interaction effects according to the weekday vs. weekend and area comparison related to the chrononutritional variables.
Table 2.
Isolated and interaction effects according to the weekday vs. weekend and area comparison related to the chrononutritional variables.
| Weekday vs. Weekend | Area | Effects/Interaction | |||||
| Weekday | Weekend | Urban | Rural | Weekday vs. Weekend | Area | Weekday vs. Weekend x Area | |
| Chrononutritional variables | Mean (95% CI) |
Mean (95% CI) |
Mean (95% CI) |
Mean (95% CI) |
F (P-value) |
F (P-value) |
F (P-value) |
| First Food Intake Time (h:min) Last Food Intake Time (h:min) Eating Midpoint (h:min) Caloric Midpoint (h:min) Eating Window (decimal hour) |
07:42 (07:37-07:46) 20:07 (20:02-20:12) 13:54 (13:51-13:58) 13:29 (13:22-13:35) 12.42 (12.32-12.53) |
07:53 (07:48-07:58) 19:59 (19:53-20:04) 13:56 (13:52-13:59) 13:21 (13:15-13:28) 12.09 (11.96-12.23) |
07:57 (07:51-08:03) 20:12 (20:05-20:18) 14:04 (14:00-14:09) 13:36 (13:29-13:43) 12.25 (12.12-12.38) |
07:17 (07:10-07:25) 19:39 (19:30-19:47) 13:28 (13:22-13:34) 12:59 (12:48-13:10) 12.30 (12.15-12.45) |
36.04 (<0.001*) 4.11 (0.04*) 2.72 (0.09) 3.77 (0.05) 30.05 (<0.001*) |
64.43 (<0.001*) 36.03 (<0.001*) 87.64 (<0.001*) 31.77 (<0.001*) 0.86 (0.35) |
0.38 (0.54) 3.55 (0.06) 3.17 (0.07) 0.01 (0.96) 1.66 (0.20) |
Two-way ANOVA (factors: weekday vs. weekend; urban vs rural). Statistical significance (p < 0.05) in bold.
Disclaimer/Publisher’s Note: The statements, opinions and data contained in all publications are solely those of the individual author(s) and contributor(s) and not of MDPI and/or the editor(s). MDPI and/or the editor(s) disclaim responsibility for any injury to people or property resulting from any ideas, methods, instructions or products referred to in the content. |
© 2024 by the authors. Licensee MDPI, Basel, Switzerland. This article is an open access article distributed under the terms and conditions of the Creative Commons Attribution (CC BY) license (http://creativecommons.org/licenses/by/4.0/).
Copyright: This open access article is published under a Creative Commons CC BY 4.0 license, which permit the free download, distribution, and reuse, provided that the author and preprint are cited in any reuse.


