
Submitted:
06 December 2024
Posted:
09 December 2024
You are already at the latest version
Abstract
This paper is focussed on obtaining of some mathematical models for the data collected from a wind farm. This is a current subject to find appropriate methods to have renewable energies under statistical control aiming to integrate the power production into the general energetic system. In this context, a series of distributions of normal, lognormal, Weibull and Rayleigh types has been determined, tested and verified. By using appropriate statistical tests, some normal, lognormal, and Rayleigh models have been proven for daily, weekly or monthly means. The results have been demonstrated to be superior to those proposed by involving time series techniques.
Keywords:
statistical control
; wind energy production
; normal distribution
; lognormal distribution
; Rayleigh distribution
; statistical test
MSC: 60-08; 60-11; 60E05; 62M10; 62P12; 62P30; 62G30; 62G32
1. Introduction
Mathematical models for wind farm production are an important and continuously new subject when take into account the evaluation of this extended type of renewable energy and the integration of the production into general electrical systems. To have this huge process under control together with forecasting possibilities represent a complex and multidisciplinary work of special importance.
In wind power generation a lot of problems appear, and a large pallet of mathemati-cal models is needed to have the processes under control and optimization. When we take into account the evolved issues, we remark the involment of complex instruments in optimal wind turbine placement as multi-objective mathematical models like in [1] or siting and sizing of distribution networks as the paper [2] provides. A conversion system for wind energy including wind turbines together with proper test systems is proposed in the work [3], while wind energy conversion systems are discussed in [4].
Integrative systems involving mathematical optimization models for generating the necessary energy power combined with minimizing the cost of energy are presented in [5]. Wind power forcasting obtained via meteorological predictions often appeals to variational problems when Euler equation (elliptic partial differential equation) combined with boundary value conditions as the paper [6] proves. Physical methods, statistical methods, hybrid methods over different time-scales are investigated in works [7,8,9].
A subject permanently current can be considered the forcasting of wind farm production. One can mention here some complicated mathematical models involving meteo-rological information integrated in a comprehensive prediction system as also statistical methods to draw conclusion related to the power generation. Concerning the statistical approaches, one can mention time series techniques that can be found in papers [10,11,12,13,14,15], while probability density functions are an important powerfull instrument as in papers [16,17,18,19,20,21,22,23,24,25,26,27,28,29,30,31,32] was shown.
In this paper, some distribution models have been proposed, tested and verified for a series of the data provided from the Romanian wind farm system system for which time series methods were used by the first author in paper [10].
2. Materials and Methods
One searches for some mathematical models for the data taken from a wind farm in Romania which is analyzed representing the notified active power [MW] measured hourly from February 7 to December 31, 2014. It is very important to find a predictive mathematical (statistical) model for these data in order to integrate production into the national energy system. Considering the very large volume of data, the analysis started on the data from February 2014. This is a preliminary study that integrates the results of descriptive statistics and tries to find an appropriate distribution for some of the collected data. In the following, we analyze and seek to integrate this entire volume of data into appropriate models by involving several distribution models.
2.1. Presentation of the Data Used in Preliminary Statistical Analysis
2.1.1. The Data Selected
A preliminary processing of the data considered was done for the hourly measurements made during February 2014, for which the daily means of the first 22 days are represented in Figure 1.
We have taken these means for data presentation since the hourly measurements present excessive fluctuations which decreased the possibility of being statistically controlled. Even using these averages, if we consider their time series, this is strongly discontinuous, hence we direct our research towards other mathematical methods.
The elements of descriptive statistics for the hourly data of this period are presented in Table 1.
2.1.2. Methods
The histogram of the frequencies for the measured values of the active power [MW] can be seen in Figure 2. We try to model these data using the lognormal distribution. With the values from the above table, we have:
The lognormal distribution with θ = 2.46 and ω = 1.47 (the value determined above), i.e. the repartition of these analyzed data can follow the probability density function:
The random variable lognormally distributed with θ = 2.46 and ω = 1.47 has the cumulative distribution function:
For these data we also try to validate Weibull distribution as a model of their repartition. We use the method of smallest squares to determine the parameters β and δ of this distribution in case of the considered data. Use the seven values (the middles of the intervals from the histogram) and the values of the cumulated relative frequencies obtained when the histograms were realized. Supposing that the considered data follow a distribution of Weibull type, it results that the cumulative distribution function of this random variable is:
which is mapped to the seven considered values,
Natural logarithm is mapped:
or, equivalent,
Apply the logarithm once again:
Use the notations:
and write the relation from (9) under the form of the equation of a straight line:
To determine the parameters α and β apply the method of smallest squares, i.e. we search for the pair (α, β) such that:
which is the minimum point of the function:
Apply the calculation method to determine the minimum point for a real function with two real variables and obtain:
We find in this manner:
From the relation: it results:
and thus:
and the probability density function is:
2.2. Presentation of the Data Used in the Main Statistical Analysis
2.2.1. The Data Used
In the following, we find some models considering as data: daily, weekly and monthly means. The model of data is an important factor for the understanding the way they behave, taking into account the random variable P [MW] representing them. The values involved in the next study, represented in the graphs from the Figure 3, Figure 4 and Figure 5, are firstly described by the analysis of the elements of descriptive statistics (obtained in EXCEL) shown in Table 2, Table 3 and Table 4.
2.2.2. Methods and Models
In this sub-section, the parameters for the normal, lognormal, Weibull and Rayghleigh distributions are obtained for these three types of data considered in the previous subsection.
For the normal model, in the three cases under study, we consider the random variable P ~ N(m, σ) for which we determine the values by using the maximum likelihood method. We determine the likelikood function in all the three situations and then we calculate the maximim likelihood estimators as maximum points of this function, and
where is the sample mean, actually the arithmetical average of the values of the selection,
is the population variance,
Therefore, we obtained the normal distributions N(18.06, 16.41) for the 328 daily means, N(17.61, 10.57) for the 47 weekly means and for the 11 monthly means, N(17.38, 7.38).
For the lognormal model, the same steps have been followed where instead of the daily, weekly and monthly means their natural logarithms are involved. For the random variable ln P we used the normal distribution having the parameters given by the formulae:
In a manner similar to the previous used, via the maximum likelihood method, we found the normal distributions for ln P:
N(2.89, 0.91), N(2.87, 0.60), N(2.86, 0.43).
We continue to obtain the parameters of Weibull distribution for the considered sets of values. Starting from the first of the three sets of data considered, we determined the parameters of the Weibull distribution by using the method of smallest squares described above and obtain for the daily means:
hence the corresponding cumulative distribution function is
while the probability distribution function is
For the weekly means we obtain the parameters:
β = 0.023 and δ = 1.043.
We have in this manner the cumulative distribution function of the random variable:
and the probability density function is:
For the last set of values, that of monthly means, we obtained the parameters:
β = 0.012 and δ = 1.02.
Such a random variable has the cumulative distribution function:
and the probability density function is:
The last calculation is referred to the parameters of Rayleygh distribution in the three situations considered. To determine the parameter σ of Rayleygh distribution,
the maximum likelihood method is used and then the expression of the maximum likelihood estimator – the maximum point of the likelihood function:
For the three types of means, daily, weekly and monthly, the computed values of the parameter are:
305.42, 209.63 and 175.8 respectively.
So, we obtained the following distributions of Rayleygh type for daily means:
for weekly means:
and for monthly means:
3. Results
In this section, the validation or rejection of the models proposed in the previous section is presented together with the computations that sustain the solutions drawn in the following.
3.1. First analysis
Use now a statistical test to determine if the random variable X representing the data (the 528 hourly measurements in 22 days) considered follows, indeed, the distribution of Weibull type proposed at Section 2.1.2. Consider the significance level of the test α = 0.05. Number of the degrees of freedom is 8 (i.e. the number of the established classes for the histogram), hence the quantile is , 2 representing the number of the parameters of Weibull distribution (β and δ).

Table 5.
The classes and the frequences to verify the Weibull model.
| Class interval | Observed frequences, oi | Expected frequences, Ei |
| X < 5 | 115 | 527.75 |
| 5 ≤ X < 15 | 191 | 0.25 |
| 15 ≤ X < 25 | 80 | 0.012 |
| 25 ≤ X < 35 | 57 | 0.0029 |
| 35 ≤ X < 45 | 44 | 0.0005 |
| 45 ≤ X < 55 | 19 | 0.0002 |
| 55 ≤ X < 65 | 11 | 5.95079E-05 |
| 65 ≤ X | 11 | 5.08606E-05 |
| Total | 528 | 528 |
Ei = npi = nP(ai-1 ≤ X ≤ ai), where n = 528, and
F being the cumulative distribution function of X and f its probability density function.
We test the null hypothesis that the data under study are Weibull distributed with the parameters β = 0.294 and δ = 0.005 while the alternative hypothesis contradicts this assertion. Such a null hypothesis is tested with the statistic:
and the critical region is:
The computed value of the statistic is χ2 = 572.43, so χ2 ∈ Rcr, hence reject the null hypothesis and accept that alternative. In this manner, the considered data do not follow that Weibull distribution.
3.2. Main Analyses
In this subsection all the models previously proposed are verified by using a corresponding statistical test in the three cases of the considered means to see if, indeed, the data verify them.
3.1.1. Normal Model
Now, considering the three normal distributions previously determined, search to prove that they are, indeed, the distributions of the three types of data under study. This thing will be realized by using an approproate statistical test.
Consider the significance level of the test α = 0.05. The number of the degrees of freedom is 8 (from the number of the classes established for the histogram), hence the quantil is , 2 representing the number of parameters of normal distribu-tion (m and σ2).
where n = 328 or 47 or 11, and
Ei = npi = nP(ai-1 ≤ P ≤ ai),
F being the cumulative distribution function of P ~ N(18.06, 16.41), N(17.61, 10.57) or N(17.38, 7.38) respectively and f the probability density function corresponding to each repartition.
The values of the cummulative distribution function of the random variable normally distributed with N(m, σ) are calculated in EXCEL using NORM.DIST, accordingly replacing m and σ and by taking “cumulative” to obtain their values.
For the cases two and three one makes the calculus with related replacements in the formulae of the considered distributions. All the results are presented in the Table 6, Table 7 and Table 8.
The statistical test has the null hypothesis: the random variable representing the data under study follow one of the normal distributions N(18.06, 16.41), N(17.61, 10.57), N(17.38, 7.38) respectively. The alternalive hypothesis concerns the oposite situation. Such a null hypothesis is tested with the statistic:
The critical region is defined as follows: 1
The calculated value of the three statistics χ2 are:
hence only the last statistic is not in the critical region and then the normal model N(17.38, 7.38) is verified for monthly means.
χ2 = 119.16, χ2 = 84.35, χ2 = 1.57,
3.1.2. Lognormal Model
To test the lognormal model, a statistical test similar to that used above has been used. The results of the calculations are presented in the following three tables and the same formulae to calculate the probabilities p1 – p8 involved in obtaining the expected frequencies E1 – E8 for each case.
Table 9.
Logarithms for daily means.
| Class interval | Observed frequences, oi | Expected frequences, Ei |
|---|---|---|
| lnP < 1.61 | 57 | 27.21 |
| 1.61 ≤ lnP < 2.71 | 118 | 109.02 |
| 2.71 ≤ lnP < 3.22 | 67 | 69.51 |
| 3.22 ≤ lnP < 3.56 | 34 | 43.34 |
| 3.56 ≤ lnP < 3.81 | 19 | 26.63 |
| 3.81 ≤ lnP < 4.02 | 13 | 16.44 |
| 4.01 ≤ lnP < 4.17 | 14 | 9.65 |
| 4.17 ≤ lnP | 6 | 26.21 |
| Total | 328 | 328 |
Table 10.
Logarithms of weekly means.
| Class interval | Observed frequences, oi | Expected frequences, Ei |
|---|---|---|
| lnP < 1.61 | 1 | 1.77 |
| 1.61 ≤ lnP < 2.71 | 20 | 16.21 |
| 2.71 ≤ lnP < 3.22 | 12 | 13.99 |
| 3.22 ≤ lnP < 3.56 | 8 | 6.65 |
| 3.56 ≤ lnP < 3.81 | 3 | 3.86 |
| 3.81 ≤ lnP < 4.02 | 2 | 2.33 |
| 4.01 ≤ lnP < 4.17 | 1 | 1.54 |
| 4.17 ≤ lnP | 0 | 0.65 |
| Total | 47 | 47 |
Table 11.
Logarithms of monthly means.
| Class interval | Observed frequences, oi | Expected frequences, Ei |
|---|---|---|
| lnP < 1.61 | 0 | 0.02 |
| 1.61 ≤ lnP < 2.71 | 5 | 3.98 |
| 2.71 ≤ lnP < 3.22 | 4 | 4.79 |
| 3.22 ≤ lnP < 3.56 | 2 | 1.64 |
| 3.56 ≤ lnP < 3.81 | 0 | 0.42 |
| 3.81 ≤ lnP < 4.02 | 0 | 0.11 |
| 4.01 ≤ lnP < 4.17 | 0 | 0.03 |
| 4.17 ≤ lnP | 0 | 0.01 |
| Total | 11 | 11 |
The effective testing was done by considering the null hypothesis that the random variable lnP follows one of the three normal distributions presented in relation (24) for the logarithms of the daily, weekly and monthly means respectively, while the alternative hypothesis is referred to the oposite situation. Use the statistic (46) and the critical region is defined by the relation (47), while the quantil has been previously established. We obtain:
so only for the weekly and monthly means the computed values of the statistic are not contained in the critical region, and the lognormal models with ln P ~ N(2.87, 0.60), N(2.86, 0.43) are validated for these last two types of data respectively.
χ2 = 59.66, χ2 = 2.78, χ2 = 1.06,
3.1.3. Weibull Model
We firstly test the null hypothesis that the daily means follow the Weibull distribution with the parameters β = 0.294 and δ = 0.005 (obtained above), while the alternative hypothesis represents the oposite situation. To calculate the statistic (46) use the data from the next Table 12.
The expression of the critical region is given by the relation (47), where is found the calculated value of the statistic, hence the daily means do not follow the considered Weibull distribution.
For the weekly means test the null hypothesis that the Weibull distribution having the parameters β = 0.023 and δ = 1.043, while the alternative hypothesis contradicts this. For the calculus of the statistic (46) the frequencies are displayed in the following Table 13.
The relation (46) for the statistic computation gives a value in the critical region (47), so the null hypothesis is rejected, then the weekly means do not follow the proposed Weibull distribution.
For the monthly means test the null hypothesis that the Weibull distribution having the parameters β = 0.012 and δ = 1.02, while the alternative hypothesis contradicts this. For the calculus of the statistic (46) the frequencies are displayed in the following Table 14.
The relation (46) for the statistic computation gives a value in the critical region (47), so the null hypothesis is rejected, then the weekly means do not follow the proposed Weibull distribution. The computed values of the last three statistics are:
χ2 = 214.21, χ2 = 121.5, χ2 = 23.85.
3.1.4. Rayleigh Model
We apply a statistical test to verify the last three models proposed in the previous Section 2. The values of the frequencies – observed and expected are presented in the Table 15, Table 16 and Table 17. The values of σ2 are presented in relation (36) and the corresponding expressions of probability density functions and cumulative distribution functions are given in relations (37)-(39) respectively.
The calculated values using the elements of these three tables of the statistic are:
χ2 = 327.3; 4.98; 3.66.
The first value is in the critical region, while the last two are out of this. Hence the Rayleygh model was validated for weekly and monthly means.
4. Discussion
One can remark that the results are relatively poor when we take into account the huge volume of work. This searching effort has a role firstly since the tested models were some which have been validated for other situations for wind farms, as can be seen in many studies for which they work and as we shown in our state of the art in the domain.
It is possible that the tested models to be validated also in case of our data (especially for the daily means for which only one model was found) if these data are smoothed and furthermore, if we do not imply only the daily, weekly and monthly means, but we apply to them the moving average with an appropriate step (established, for instance, using ORIGIN program) to obtain adequate models, which represent another quite extensive study.
Finally, the relatively low success of creating such models demonstrates the strength of time series as a modeling tool in the case of huge volumes of data that appear at regular intervals of time, as shown in the paper [10].
5. Conclusions
This paper searched for appropriate models for production of a wind farm starting from data hourly measured of active power [MW] in a Romanian eolian plant. Such an approach is novel for these data, since we tried to analyse them in another paper via time series techniques, while here several distributions have been verified.
The study started by considering the 528 hourly measured data observed in the first 22 days from the considered period for which the lognormal distribution with θ = 2.46 and ω = 1.47 was loosely validated.
The normal model N(17.38, 7.38) has been proven for the monthly means when consider the random variable P[MW] representing the produced active power, and also the lognormal models having ln P ~ N(2.87, 0.60), N(2.86, 0.43) are validated for the considered data – the weekly and monthly means respectively.
Weibull model was not validated, while Rayleigh model has been verified for weekly and monthly means with parameter values 209.63 and 175.8 respectively. A proposal for new research is to use smoothed data by involving proper step of moving average before the calculation of the parameters of tested distributions.
Author Contributions
Conceptualization, I.M.; methodology, I.M.; software, I.M. and G.C.L.; validation, I.M., G.C.L.; investigation, I.M., G.C.L.; resources, G.C.L.; writing—original draft preparation, I.M.; writing—review and editing, I.M.; visualization, I.M., G.C.L.; supervision, I.M., G.C.L.; funding acquisition, G.C.L. All authors have read and agreed to the published version of the manuscript.
Funding
This work was supported by a grant of the Ministry of Research, Innovation and Digitalization, project number PNRR-C9-I8-760089/23.05.2023, code CF31/14.11.2022.
Data Availability Statement
The data presented in this study are available on request from the corresponding author. The data are not publicly available due to privacy reasons.
Acknowledgments
This work was supported by a grant of the Ministry of Research, Innovation and Digitalization, project number PNRR-C9-I8-760089/23.05.2023, code CF31/14.11.2022.
Conflicts of Interest
The authors declare no conflict of interest.
References
- Li, G.; Chen, T.-C. Multi-objective mathematical model for optimal wind turbine placement in wind farm under uncertainty. J. Eng. Res. 2024. [Google Scholar] [CrossRef]
- Alizadeh, S.M.; Sadeghipour, S.; Ozansoy, C.; Kalam, A. Developing a Mathematical Model for Wind Power Plant Siting and Sizing in Distribution Networks. Energies 2020, 13, 3485. [Google Scholar] [CrossRef]
- da Silva, L.T.F.W.; Tomim, M.A.; Barbosa, P.G.; de Almeida, P.M.; da Silva Dias, R.F. Modeling and Simulating Wind Energy Generation Systems by Means of Co-Simulation Techniques. Energies 2023, 16, 7013. [Google Scholar] [CrossRef]
- Prostean, O.; Szeidert, I.; Budisan, N.; Prostean, G.; Vasar, C. Mathematical models of specific elements of wind energy conversion systems based on induction generator. Symposium on Electrotehnics and Energetics, Romanian Academy, Timisoara Branch, Academia Days, May 26-27, 2005, Politehnica University of Timisoara, Romania.
- Sánchez, M.G.; Macia, Y.M.; Gil, A.F.; Castro, C.; Nuñez González, S.M.; Yanes, J.P. A Mathematical Model for the Optimization of Renewable Energy Systems. Mathematics 2021, 9, 39. [Google Scholar] [CrossRef]
- Cheng, H.; Mu, X.; Jiang, H.; Wei, M.; Liu, G. Green’s Function for Static Klein–Gordon Equation Stated on a Rectangular Region and Its Application in Meteorology Data Assimilation. Atmosphere 2021, 12, 1602. [Google Scholar] [CrossRef]
- Wang, X.; Guo, P.; Huang, X. A Review of Wind Power Forecasting Models. Energy Procedia 2011, 12, 770–778. [Google Scholar] [CrossRef]
- Chang, W.Y. A literature review of wind forecasting methods. J. Power Energy Eng. 2014, 2, 161–168. [Google Scholar] [CrossRef]
- Ye, H.; Yang, B.; Han, Y.; Li, Q.; Deng, J.; Tian, S. Wind Speed and Power Prediction Approaches: Classifications, Methodologies, and Comments. Front. Energy Res. 2022, 10, 901767. [Google Scholar] [CrossRef]
- Meghea, I. Comparison of Statistical Production Models for a Solar and a Wind Power Plant. Mathematics 2023, 11, 1115. [Google Scholar] [CrossRef]
- Borowski, S.; Sołtysiak, A.; Migawa, K.; Neubauer, A. Simple mathematical model to predict the amount of energy produced in wind turbine - preliminary study. MATEC Web of Conferences 332, 01004, 19th International Conference Diagnostics of Machines and Vehicles (2021).
- Ding, Y.-t. Mathematical modelling and simulation of wind turbine generator. Int. J. Mechatron. Appl. Mech. 2018, 4, 166–169. [Google Scholar]
- Milligan, M.; Schwartz, M.; YWan, Y. Statistical wind power forecasting models: Results for U.S. wind farms. In Proceedings of the WINDPOWER 2003, Austin, TX, USA, 18–21 May 2003. [Google Scholar]
- Ekström, J.; Koivisto, M.; Mellin, I.; Millar, R.J.; Lehtonen, M. A Statistical Modeling Methodology for Long-Term Wind Generation and Power Ramp Simulations in New Generation Locations. Energies 2018, 11, 2442. [Google Scholar] [CrossRef]
- Guilizzoni, M.; Eizaguirre, P.M. Trend Lines and Japanese Candlesticks Applied to the Forecasting of Wind Speed Data Series. Forecasting 2022, 4, 165–181. [Google Scholar] [CrossRef]
- Teyabeen, A.A.; Akkari, F.R.; Jwaid, A.E. Mathematical Modelling of Wind Turbine Power Curve. International Journal of Simulation: Systems, Science Technology 2018, 15.1–15.13. [Google Scholar] [CrossRef]
- Bidaoui, H.; El Abbassi, I.; El Bouardi, A.; Darcherif, A. Wind speed data analysis using Weibull and Rayleigh distribution functions, case study: Five cities Northern Morocco. Procedia Manuf. 2019, 32, 786–793. [Google Scholar] [CrossRef]
- Ahmad, M.I. Wind speed prediction analysis using Rayleigh distribution. Int. J. Stat. Appl. Math. 2020, 5, 24–27. [Google Scholar]
- Akpinar, E.K.; Akpinar, S.; Balpetek, N. Statistical analysis of wind speed distribution of Turkey as regional. JETAS 2018, 3, 35–55. [Google Scholar] [CrossRef]
- Arikan, Y.; ARSLAN, Ö.P.; ÇAM, E. The analysis of wind data with Rayleigh distribution and optimum turbine and cost analysis in Elmadağ, Turkey. IU-JEEE 2015, 15, 1907–1912. [Google Scholar]
- Woldegiyorgis, T.A.; Terefe, E.A. Wind Energy potential Estimation Using Weibull and Rayleigh Distribution Models and surface measured data at Debre Birehan, Ethiopia. Appl. J. Envir. Eng. Sci. 2020, 6, 244–262. [Google Scholar]
- Islam, K.D.; Chaichana, T.; Dussadee, N.; Intaniwet, A. Statistical distribution and energy estimation of the wind speed at Saint Martin’s Island, Bangladesh. Int. J. Renew. Energy Res. 2017, 12, 77–88. [Google Scholar]
- Al Buhairi, M.H. A statistical analysis of wind speed data and an assessment of wind energy potential in Taiz-Yemen. Ass. Univ. Bull. Environ. Res. 2006, 9, 21–33. [Google Scholar]
- Zhou, S.; Yang, Y.; Gao, Z.; Xi, X.; Duan, Z.; Li, Y. Estimating vertical wind power density by using tower observation and empirical models over varied desert steppe terrain in northern China. Atmos. Meas. Tech. 2021, 15, 757–773. [Google Scholar] [CrossRef]
- Chiodo, E.; Pio Di Noia, L. Stochastic Extreme Wind Speed Modeling and Bayes Estimation under the Inverse Rayleigh Distribution. Appl. Sci. 2020, 10, 5643. [Google Scholar] [CrossRef]
- Shahirinia, A.; Hajizadeh, A.; Yu, D.C. Bayesian Predictive Models for Rayleigh Wind Speed. Proceedings of 2017 IEEE 17th International Conference on Ubiquitous Wireless Broadband (ICUWB).
- Maina, A.W.; Kamau, J.N.; Timonah, S.; Saoke, C.O.; Nishizawa, Y. Correlation of wind patterns using Weibull and Rayleigh models for St. Xavier secondary school, Naivasha and Jkuat sites. In Proceedings of the The 2015 JKUAT Scientific Conference, Water, Energy, Environment and Climate, Juja, Kenya, 13–16 November 2015; pp. 289–307. [Google Scholar]
- Pobocikova, I.; Sedliackova, Z.; Simon, J. Statistical analysis of wind data based on Weibull and Rayleigh distributions. Communications 2014, 16, 136–141. [Google Scholar] [CrossRef]
- Serag, S.; Ibaaz, K.; Echchelh, A. Statistical study of wind speed variations by Weibull parameters for Socotra Island, Yemen. E3S Web Conf. 2021, 234, 00045. [Google Scholar] [CrossRef]
- Dokur, E.; Ceyhan, S.; Kurban, M. Analysis of Wind Speed Data Using Finsler, Weibull, and Rayleigh Distribution Functions. Electrica 2022, 22, 52–60. [Google Scholar] [CrossRef]
- Parajuli, A. A Statistical Analysis of Wind Speed and Power Density Based on Weibull and Rayleigh Models of Jumla, Nepal. Energy Power Eng. 2016, 8, 271–282. [Google Scholar] [CrossRef]
- Shi, H.; Dong, Z.; Xiao, N.; Huang, Q. Wind Speed Distributions Used in Wind Energy Assessment: A Review. Front. Energy Res. 2021, 9, 769920. [Google Scholar] [CrossRef]
| 1 | The quantil was established above in accordance with the general theory. |
Figure 1.
Daily means of data collected in February 2014.
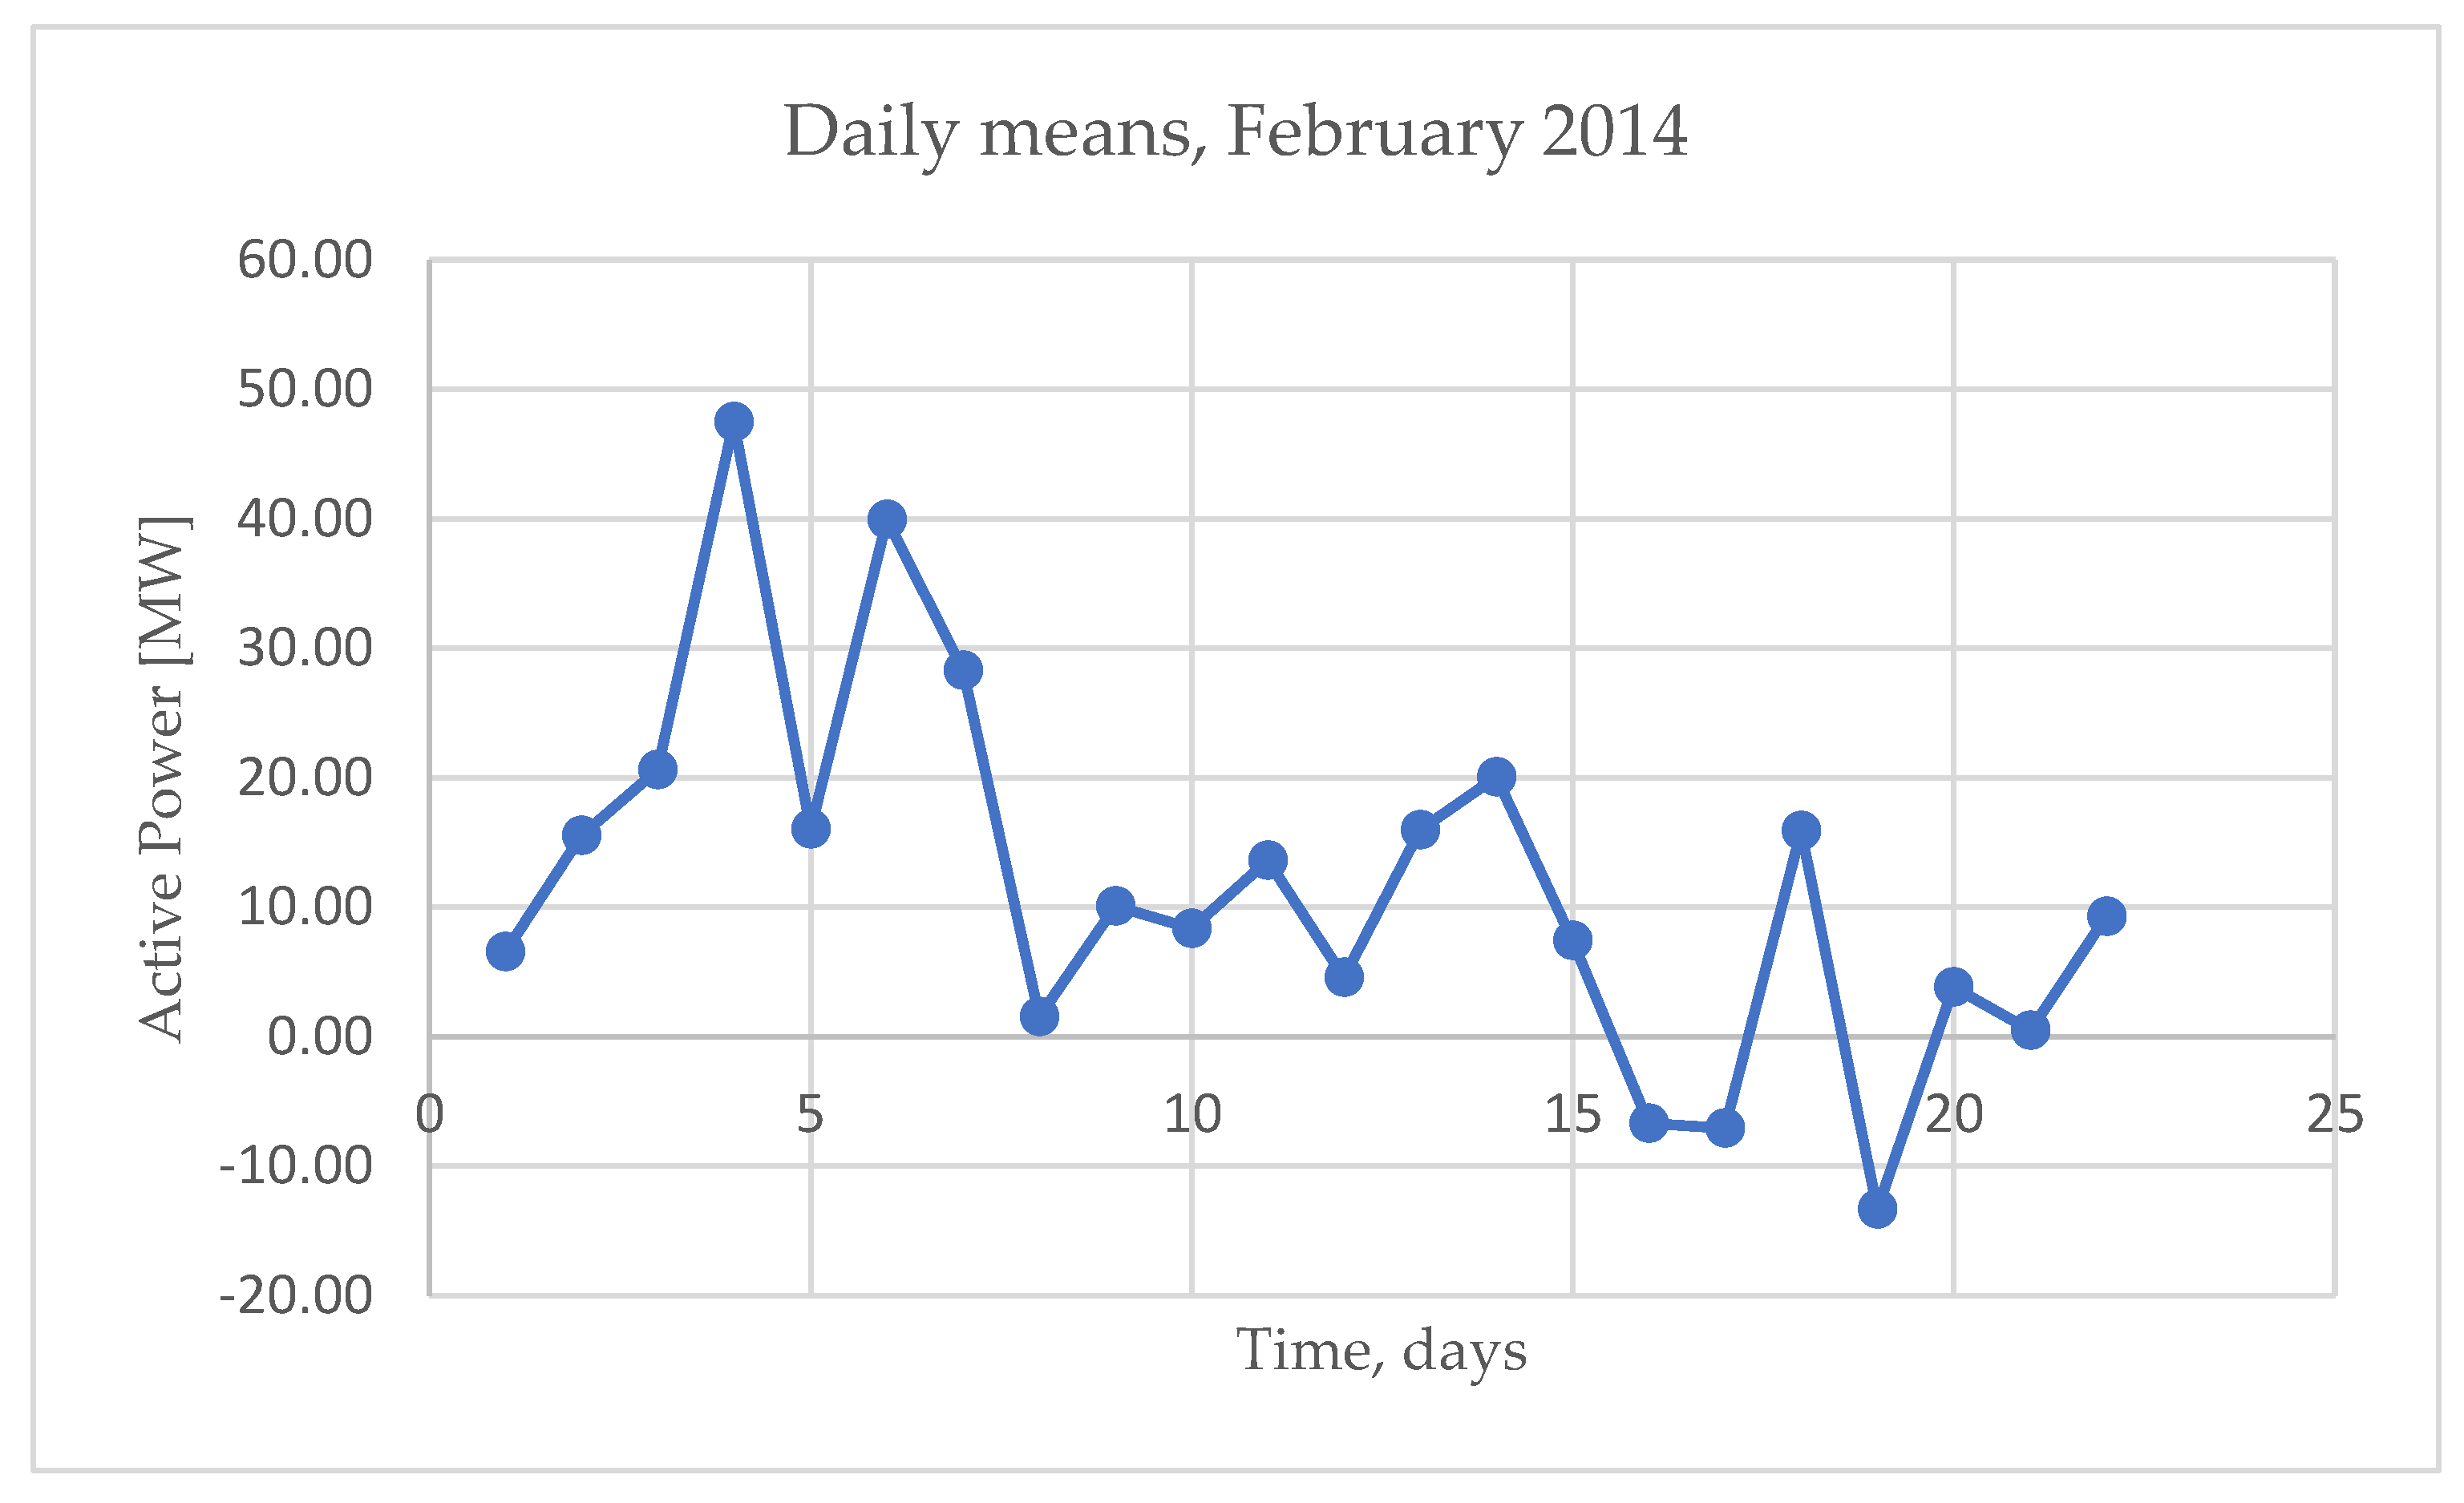
Figure 2.
Histogram of frequencies of data collected in February 2014.
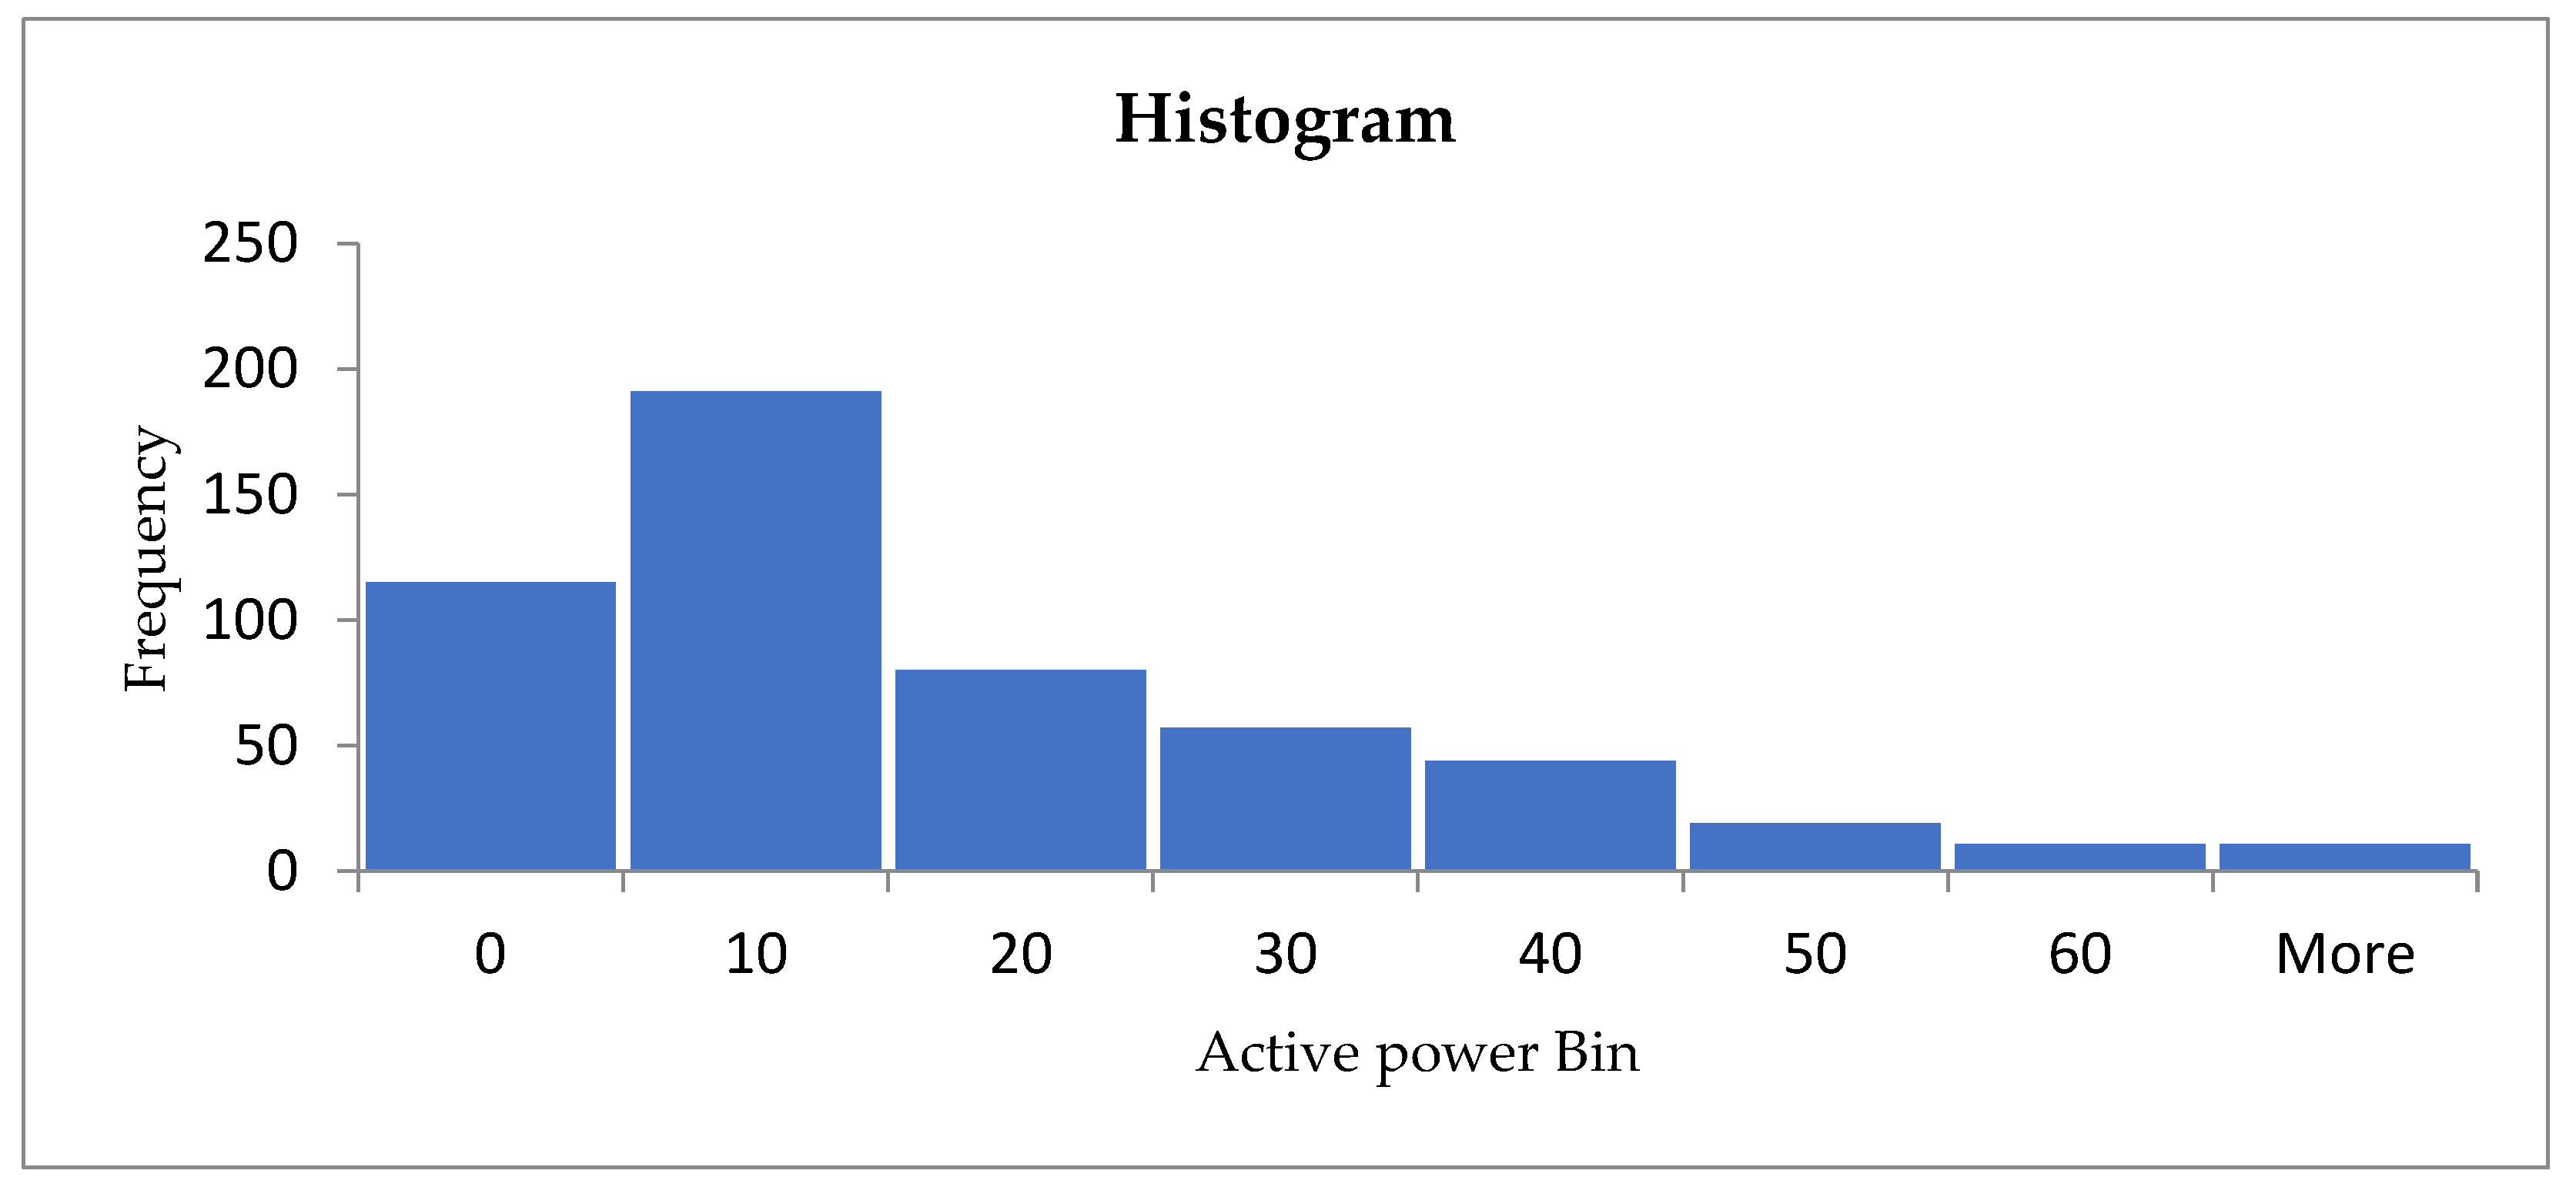
Figure 3.
Daily means of measured data.
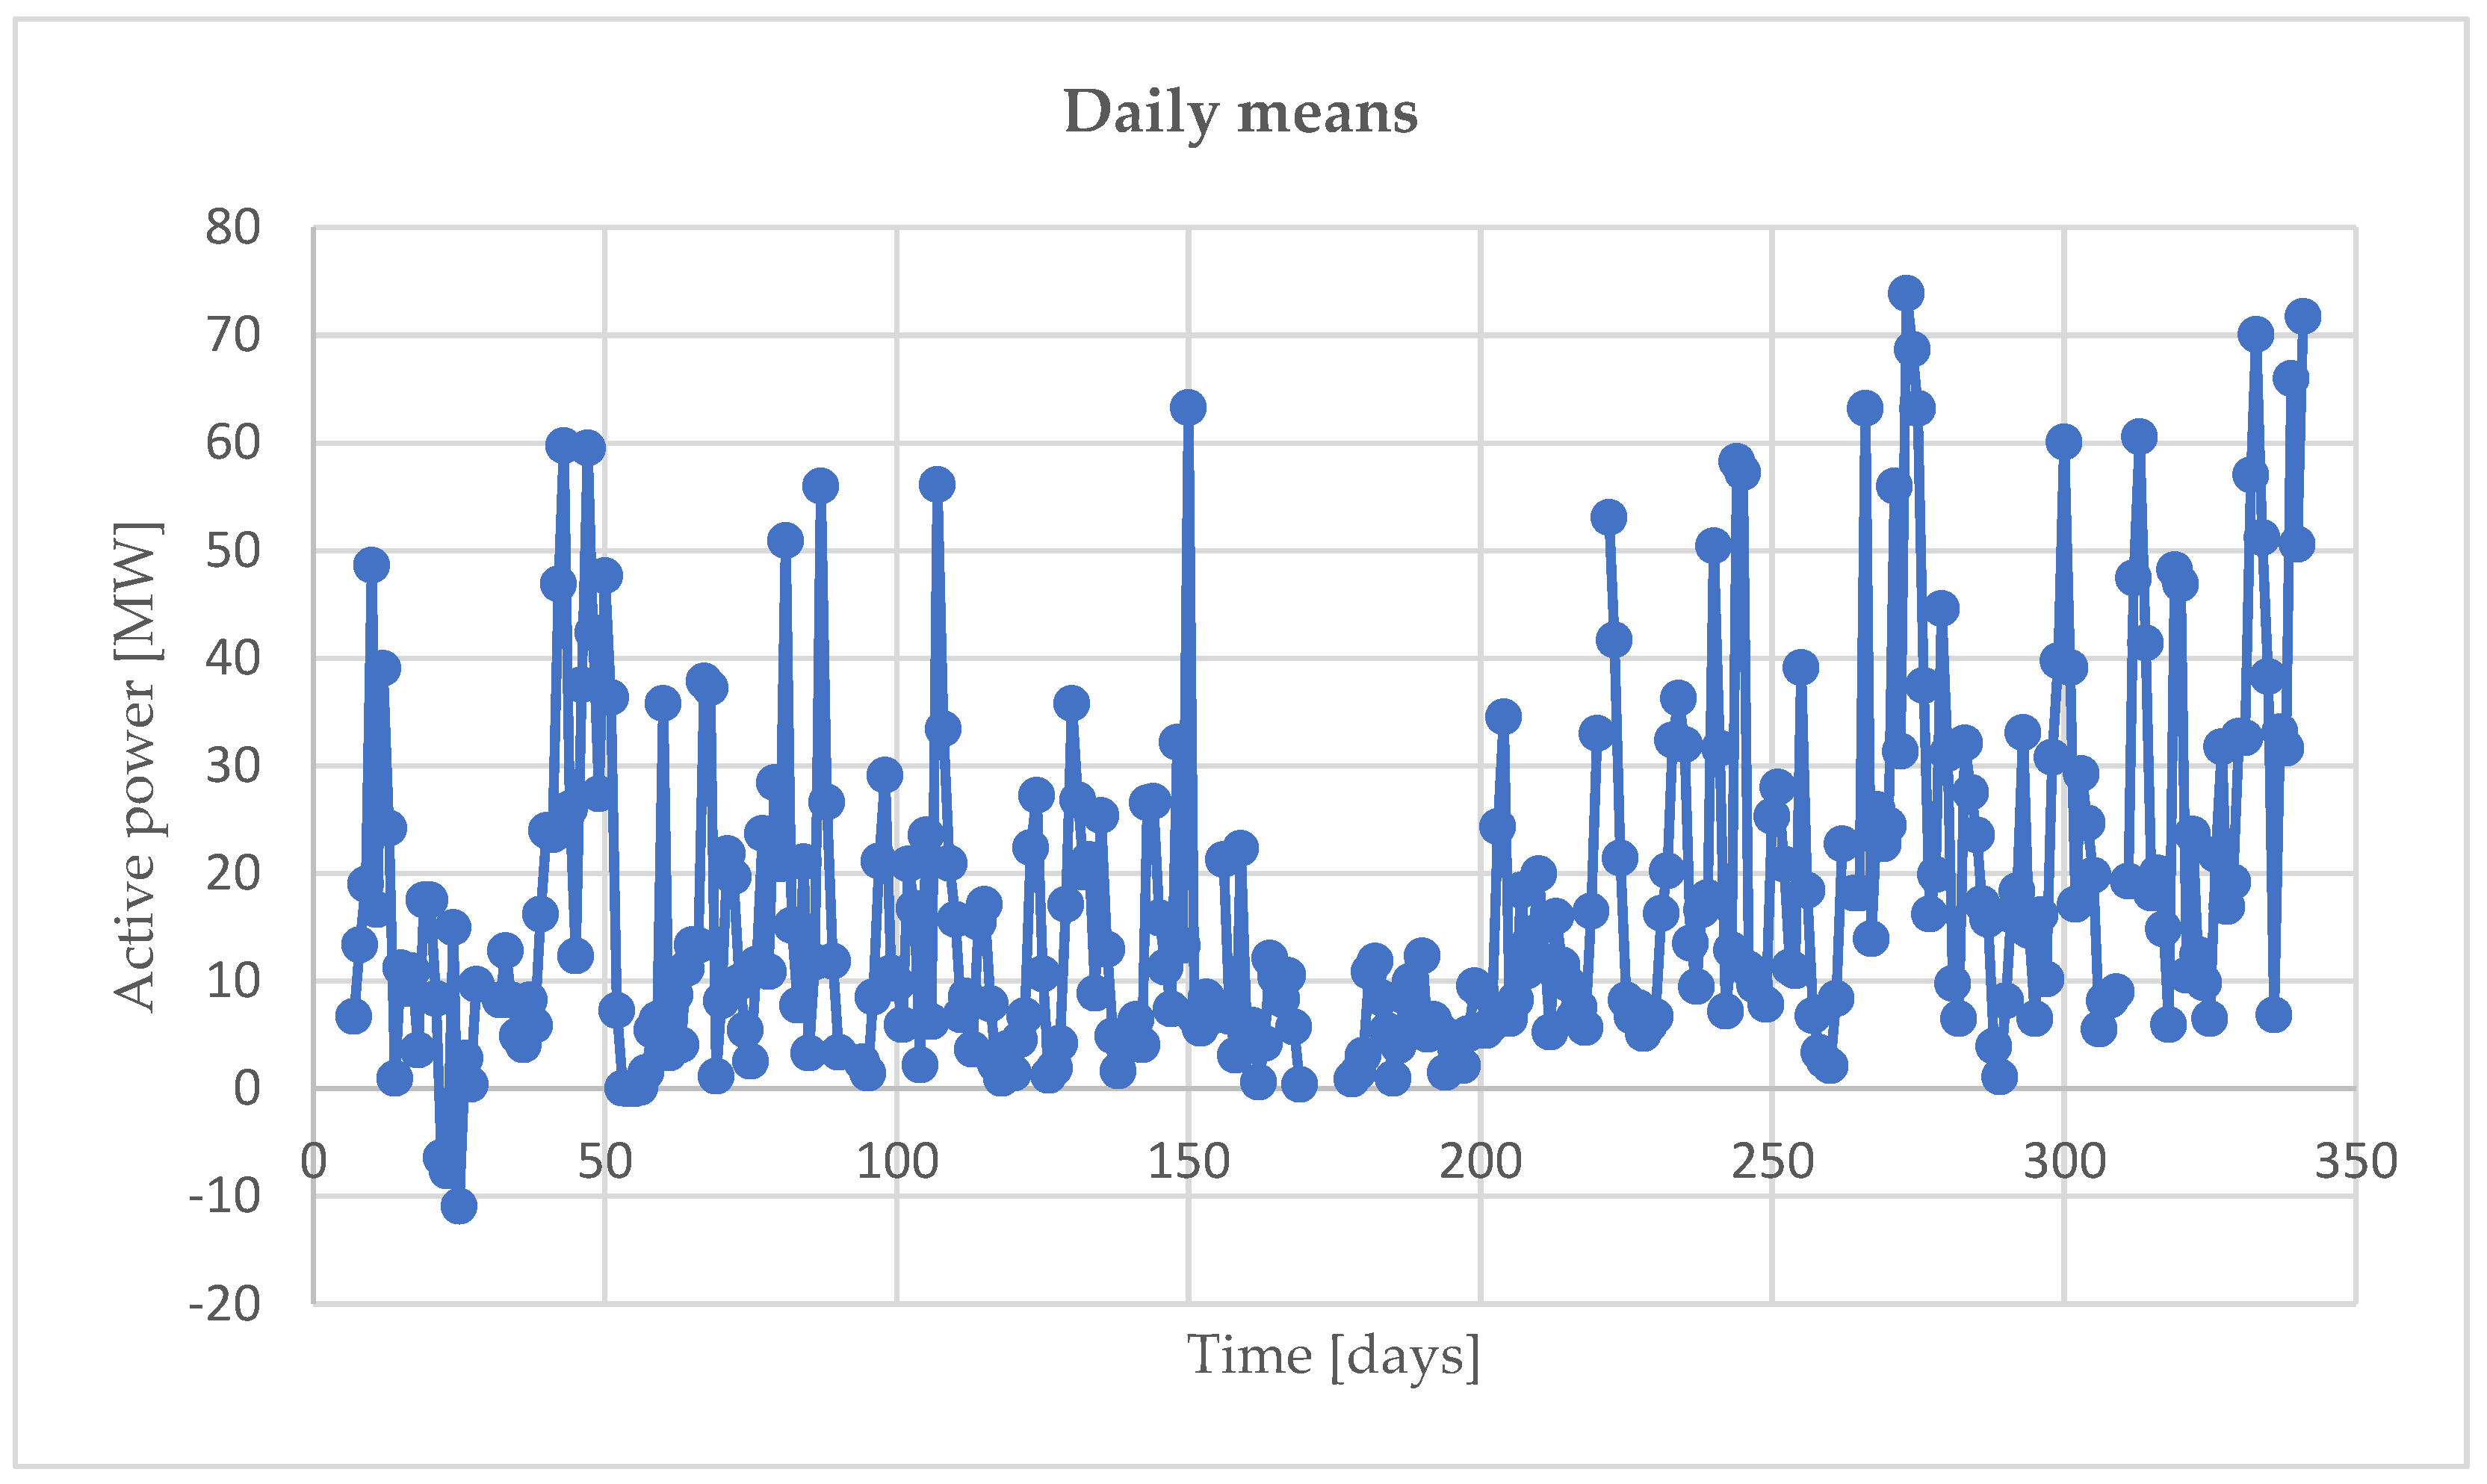
Figure 4.
Weekly means of measured data.
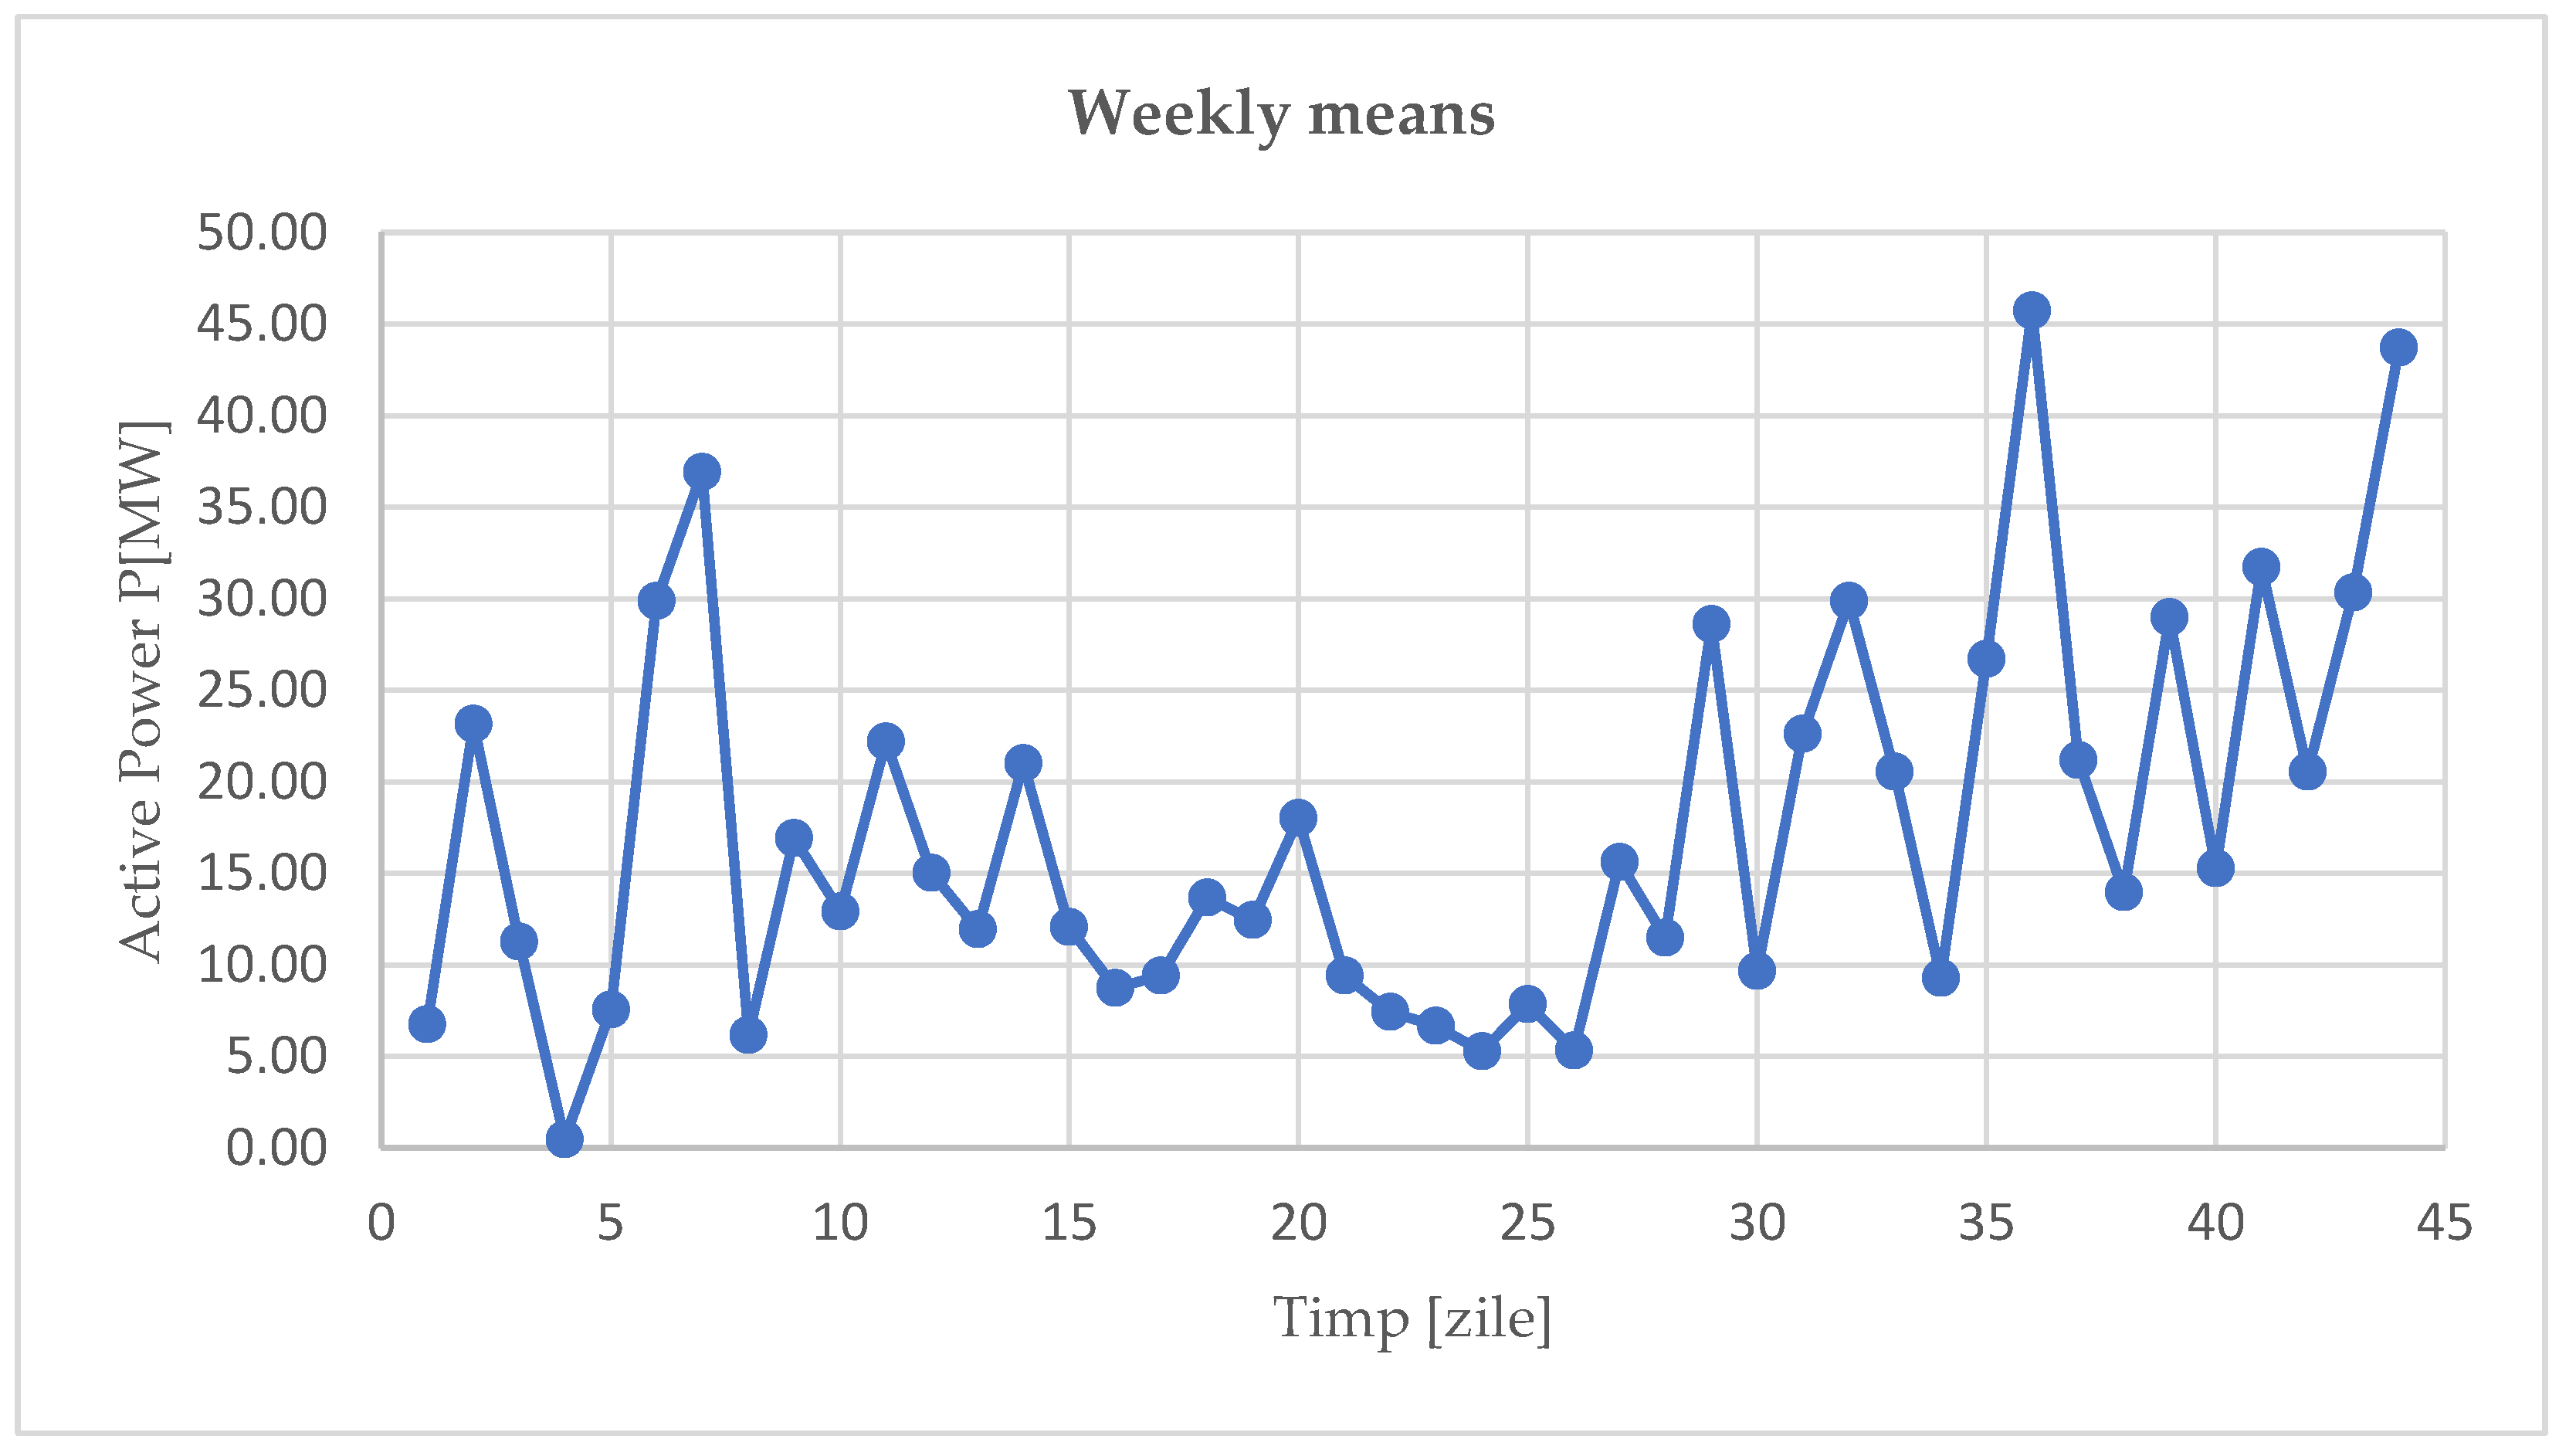
Figure 5.
Monthly means of measured data.
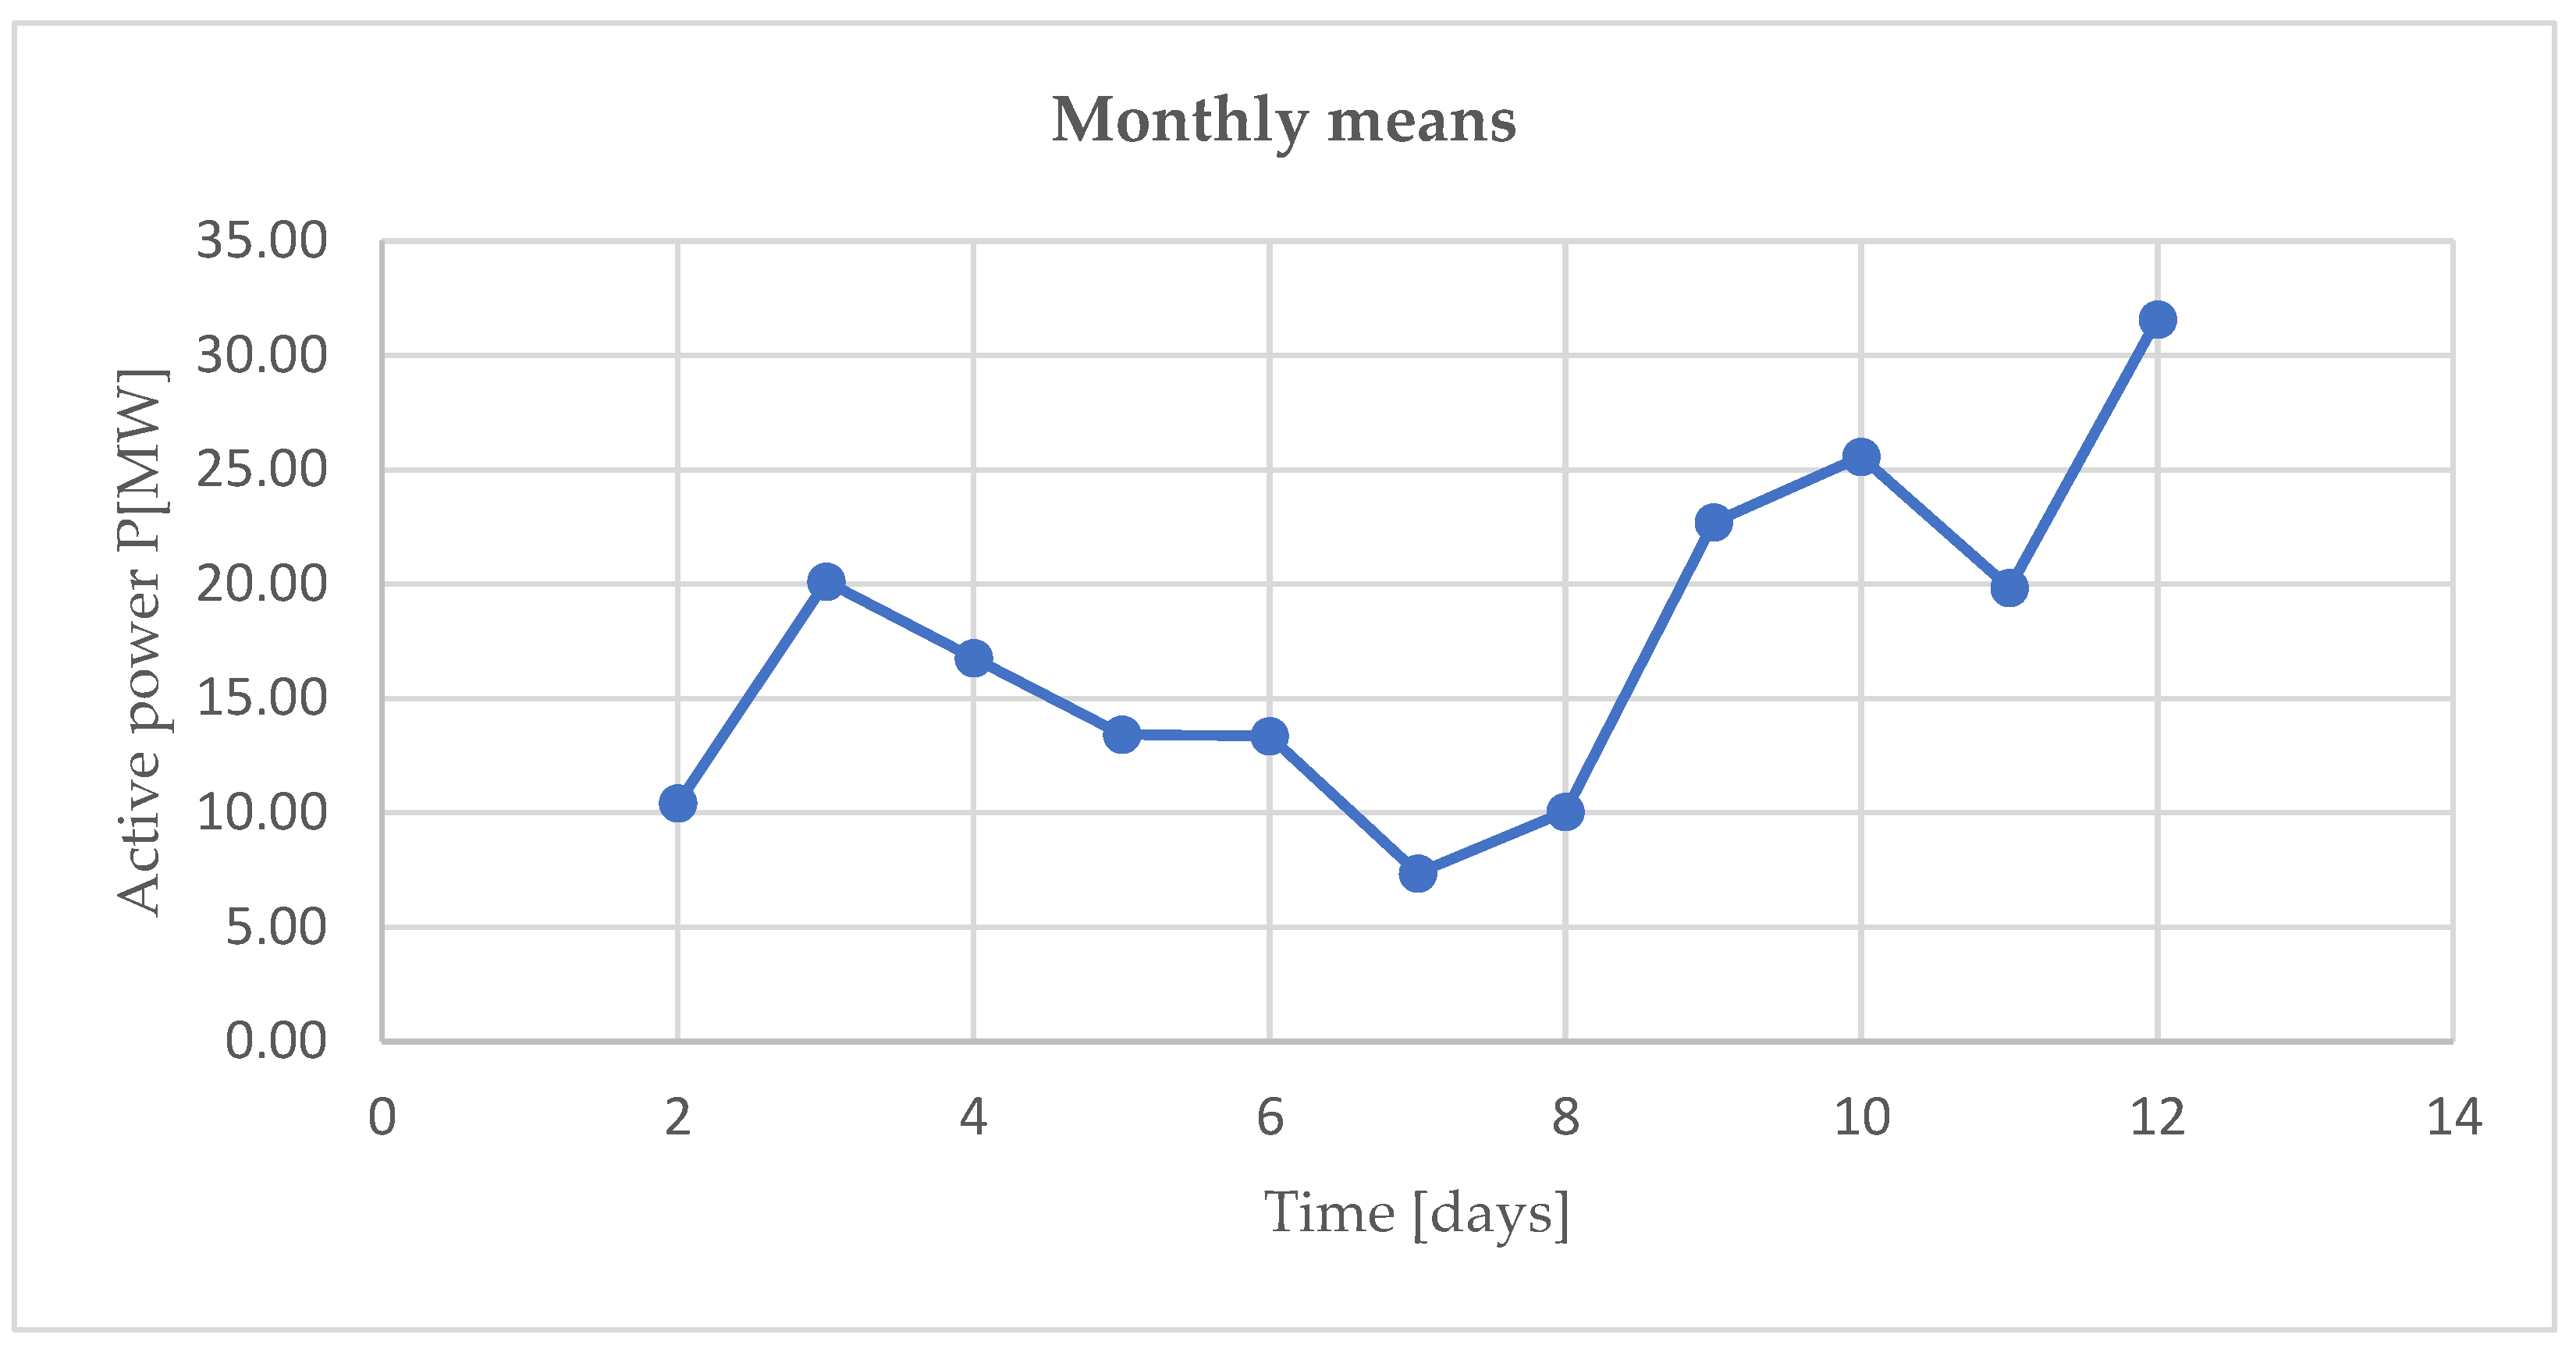
Table 1.
Descriptive statistics for hourly data of February 2014.
| February data | |
| Mean | 11.74 |
| Standard Error | 0.75 |
| Median | 6.54 |
| Mode | 0 |
| Standard Deviation | 17.22 |
| Sample Variance | 296.44 |
| Kurtosis | 0.92 |
| Skewness | 0.90 |
| Range | 95.15 |
| Minimum | -31.11 |
| Maximum | 64.04 |
| Sum | 6198.40 |
| Count | 528 |
| Largest (1) | 64.04 |
| Smallest (1) | -31.11 |
| Confidence Level (95.0%) | 1.48 |
Table 2.
Elements of descriptive statistics of daily means.
| Daily means | |
| Mean | 18.06 |
| Standard Error | 0.92 |
| Median | 12.30 |
| Mode | 0 |
| Standard Deviation | 16.41 |
| Sample Variance | 269.36 |
| Kurtosis | 1.287 |
| Skewness | 1.32 |
| Range | 84.79 |
| Minimum | -10.84 |
| Maximum | 73.95 |
| Sum | 5707.38 |
| Count | 328 |
| Largest(1) | 73.95 |
| Smallest(1) | -10.84 |
| Confidence Level (95.0%) | 1.82 |
Table 3.
Elements of descriptive statistics of weakly means.
| Weekly means | |
| Mean | 17.61 |
| Standard Error | 1.61 |
| Median | 15.002 |
| Mode | 9.39 |
| Standard Deviation | 10.57 |
| Sample Variance | 111.64 |
| Kurtosis | 0.31 |
| Skewness | 0.87 |
| Range | 45.28 |
| Minimum | 0.47 |
| Maximum | 45.74 |
| Sum | 757.34 |
| Count | 47 |
| Largest(1) | 45.74 |
| Smallest(1) | 0.47 |
| Confidence Level(95.0%) | 3.25 |
Table 4.
Elements of descriptive statistics of monthly means.
| Monthly means | |
| Mean | 17.38 |
| Standard Error | 2.23 |
| Median | 16.76 |
| Mode | #N/A |
| Standard Deviation | 7.38 |
| Sample Variance | 54.51 |
| Kurtosis | -0.35 |
| Skewness | 0.53 |
| Range | 24.23 |
| Minimum | 7.36 |
| Maximum | 31.59 |
| Sum | 191.18 |
| Count | 11 |
| Largest(1) | 31.59 |
| Smallest(1) | 7.36 |
| Confidence Level (95.0%) | 4.96 |
Table 6.
Case of daily means.
| Class interval | Observed frequences, oi | Expected frequences, Ei |
|---|---|---|
| P < 5 | 57 | 68.33 |
| 5 ≤ P < 15 | 118 | 68.30 |
| 15 ≤ P < 25 | 67 | 77.14 |
| 25 ≤ P < 35 | 34 | 58.53 |
| 35 ≤ P < 45 | 19 | 35.80 |
| 45 ≤ P < 55 | 13 | 14.05 |
| 55 ≤ P < 65 | 14 | 4.18 |
| 65 ≤ P | 6 | 1.67 |
| Total | 328 | 328 |
Table 7.
Case of weekly means.
| Class interval | Observed frequences, oi | Expected frequences, Ei |
|---|---|---|
| P < 5 | 1 | 5.01 |
| 5 ≤ P < 15 | 20 | 12.30 |
| 15 ≤ P < 25 | 12 | 15.28 |
| 25 ≤ P < 35 | 8 | 8.27 |
| 35 ≤ P < 45 | 3 | 2.94 |
| 45 ≤ P < 55 | 2 | 1.20 |
| 55 ≤ P < 65 | 1 | 1.01 |
| 65 ≤ P | 0 | 6.01 |
| Total | 47 | 47 |
Table 8.
Case of monthly means.
| Class interval | Observed frequences, oi | Expected frequences, Ei |
|---|---|---|
| P < 5 | 0 | 0.51 |
| 5 ≤ P < 15 | 5 | 3.59 |
| 15 ≤ P < 25 | 4 | 5.23 |
| 25 ≤ P < 35 | 2 | 1.57 |
| 35 ≤ P < 45 | 0 | 0.09 |
| 45 ≤ P < 55 | 0 | 0.001 |
| 55 ≤ P < 65 | 0 | 1.89E-06 |
| 65 ≤ P | 0 | 6.05E-10 |
| Total | 11 | 11 |
Table 12.
Case of daily means.
| Class interval | Observed frequences, oi | Expected frequences, Ei |
|---|---|---|
| P < 5 | 57 | 203.4 |
| 5 ≤ P < 15 | 118 | 1.6 |
| 15 ≤ P < 25 | 67 | 1.3 |
| 25 ≤ P < 35 | 34 | 1.2 |
| 35 ≤ P < 45 | 19 | 1.1 |
| 45 ≤ P < 55 | 13 | 1.1 |
| 55 ≤ P < 65 | 14 | 2.1 |
| 65 ≤ P | 6 | 115.1 |
| Total | 328 | 328 |
Table 13.
Case of weekly means.
| Class interval | Observed frequences, oi | Expected frequences, Ei |
|---|---|---|
| P < 5 | 1 | 27.75 |
| 5 ≤ P < 15 | 20 | 0.40 |
| 15 ≤ P < 25 | 12 | 0.19 |
| 25 ≤ P < 35 | 8 | 1.12 |
| 35 ≤ P < 45 | 3 | 1.09 |
| 45 ≤ P < 55 | 2 | 1.07 |
| 55 ≤ P < 65 | 1 | 1.06 |
| 65 ≤ P | 0 | 14.32 |
| Total | 47 | 47 |
Table 14.
Case of weekly means.
| Class interval | Observed frequences, oi | Expected frequences, Ei |
|---|---|---|
| P < 5 | 0 | 7.031 |
| 5 ≤ P < 15 | 5 | 0.053 |
| 15 ≤ P < 25 | 4 | 0.025 |
| 25 ≤ P < 35 | 2 | 0.016 |
| 35 ≤ P < 45 | 0 | 0.012 |
| 45 ≤ P < 55 | 0 | 0.010 |
| 55 ≤ P < 65 | 0 | 0.008 |
| 65 ≤ P | 0 | 3.844 |
| Total | 11 | 11 |
Table 15.
Case of daily means.
| Class interval | Observed frequences, oi | Expected frequences, Ei |
|---|---|---|
| P < 5 | 57 | 12.47 |
| 5 ≤ P < 15 | 118 | 85.59 |
| 15 ≤ P < 25 | 67 | 106.46 |
| 25 ≤ P < 35 | 34 | 74.54 |
| 35 ≤ P < 45 | 19 | 34.82 |
| 45 ≤ P < 55 | 13 | 9.69 |
| 55 ≤ P < 65 | 14 | 3.07 |
| 65 ≤ P | 6 | 1.35 |
| Total | 328 | 328 |
Table 16.
Case of weekly means.
| Class interval | Observed frequences, oi | Expected frequences, Ei |
|---|---|---|
| P < 5 | 1 | 2.49 |
| 5 ≤ P < 15 | 20 | 15.37 |
| 15 ≤ P < 25 | 12 | 15.46 |
| 25 ≤ P < 35 | 8 | 7.37 |
| 35 ≤ P < 45 | 3 | 2.97 |
| 45 ≤ P < 55 | 2 | 1.31 |
| 55 ≤ P < 65 | 1 | 1.03 |
| 65 ≤ P | 0 | 1.35 |
| Total | 47 | 47 |
Table 17.
Case of monthly means.
| Class interval | Observed frequences, oi | Expected frequences, Ei |
|---|---|---|
| P < 5 | 0 | 0.75 |
| 5 ≤ P < 15 | 5 | 2.42 |
| 15 ≤ P < 25 | 4 | 3.94 |
| 25 ≤ P < 35 | 2 | 1.52 |
| 35 ≤ P < 45 | 0 | 0.30 |
| 45 ≤ P < 55 | 0 | 0.03 |
| 55 ≤ P < 65 | 0 | 2.07 |
| 65 ≤ P | 0 | 0.00 |
| Total | 11 | 11 |
Disclaimer/Publisher’s Note: The statements, opinions and data contained in all publications are solely those of the individual author(s) and contributor(s) and not of MDPI and/or the editor(s). MDPI and/or the editor(s) disclaim responsibility for any injury to people or property resulting from any ideas, methods, instructions or products referred to in the content. |
© 2024 by the authors. Licensee MDPI, Basel, Switzerland. This article is an open access article distributed under the terms and conditions of the Creative Commons Attribution (CC BY) license (http://creativecommons.org/licenses/by/4.0/).
Copyright: This open access article is published under a Creative Commons CC BY 4.0 license, which permit the free download, distribution, and reuse, provided that the author and preprint are cited in any reuse.


