
Submitted:
08 December 2024
Posted:
09 December 2024
You are already at the latest version
Abstract
The aim of the study was to evaluate the geochemistry of the Winchos Gabbro and its association with magnetite mineralization at the Winchospunta prospect located in Carhuamayo-Junin, Peru. The methodology included systematic sampling of 24 rock and mineralization samples, petrographic and geochemical laboratory analyses using X-ray diffraction and inductively coupled plasma mass spectrometry (ICP-MS), with emphasis on the mineralogical composition and geochemistry of major elements (Fe₂O₃, SiO₂, MgO), trace elements (V, Cr, Cu), and rare earth elements (LREE and HREE). The results indicated that the Winchos Gabbro contains 12–16% Fe₂O₃, while the Mitu Group volcanics contain 16–23%, in contrast with the massive magnetite in the region, which reaches Fe₂O₃ concentrations between 69% and 87%. These observations suggest a strong genetic connection between the Winchos Gabbro, the Mitu volcanics, and the formation of magnetite, reinforced by the association of trace elements such as V, Cr, and Cu, typical of magmatic and hydrothermal processes. Principal component analysis showed clear groupings, where elements like Cu and U are associated with hydrothermal phases, while Fe and Zn exhibit affinities with metal oxides. These results confirm that the magnetite mineralization in Winchospunta formed under conditions of hydrothermal-magmatic interaction, with differential contributions of elements from the intrusive and volcanic rocks, consolidating its potential as a significant mineral deposit.
Keywords:
Geochemistry
; Mineralization
; Magnetite
; Gabbro Winchos
; Hydrothermal processes
1. Introduction
Geology and magnetite mineralization constitute a highly relevant area of research worldwide, particularly for understanding the geochemical processes that influence the formation of iron deposits and their association with igneous rocks [1]. Recent studies have shown that the characterization of trace elements and the mineralogy of the present mineral phases are fundamental for understanding the genesis and spatial variability of these deposits [2]. The identification of the geochemical and tectonic processes affecting the formation and variability of magnetite deposits presents significant challenges globally. Research such as that of Zulliger [3] have highlighted the importance of geochemical analysis to identify complex mineralogical associations in porphyry and skarn-type deposits, which are also applicable to magnetite mineralization contexts. Furthermore, studies such as those by Hennig [4] and Li [5] demonstrate that changes in tectonic conditions and oxygen pressure affect iron mineralization, emphasizing the need for detailed trace element characterization to enhance the understanding of these processes and optimize exploration models. The growing demand for metallic resources has driven detailed research on iron formations, including skarn and IOCG (Iron Oxide Copper Gold) deposits, which exhibit diverse geochemical and mineralogical signatures depending on the formation conditions. [2]. However, limited exploration in some regions hinders the development of effective exploration models, restricting the exploitation and understanding of mineral resources.
Various studies have shown that geochemical analysis is essential for understanding the formation of magnetite deposits and other metals. In the Austral-Magallanes Basin in Argentina, advanced techniques have been used to relate the chemical compositions of rocks to tectonic and subduction processes, allowing for inferences about the tectonic and magmatic history of the deposits [6]. These studies have revealed how the interactions between subduction and magma composition influence mineralization, providing key information for understanding the genesis of magnetite-rich deposits and other valuable metals. Boothe [2] analyzed the geochemistry of IOCG-type deposits, highlighting the importance of trace elements for understanding their formation. Chen [7] demonstrated how changes in the chemical composition of hydrothermal fluids influence the genesis of iron deposits, emphasizing the complexity of the processes involved. Mangum [1] conducted an exhaustive analysis of the magnetite mineralization patterns in skarn deposits, which allowed the identification of different formation stages and their geochemical characteristics—essential information for improving mineral exploration strategies worldwide.
In Peru, research on magnetite and skarn deposits has been fundamental for understanding their formation. A relevant study is the research conducted on the Coastal Batholith of Peru, where advanced geochemical methods have been applied to study the relationships between the chemical compositions of rocks and tectonic processes. Martínez-Ardila [8]. This approach has allowed the identification of specific mineralization patterns that are crucial for iron exploration in active subduction contexts and to understand how tectonic events control the location and quality of the deposits. Hennig [4] demonstrated that changes in tectonic regimes, such as compression and extension phases, have a significant impact on magnetite mineralization, affecting both the concentration and quality of these deposits. These findings are essential for developing more precise mineral exploration strategies in Peru, as they help to understand how regional tectonic forces influence mineralization. Li [5] focused on how variations in oxygen pressure and fugacity during magmatic cooling processes directly influence the mineralogy of magnetite deposits. The results of this study highlight the importance of controlling the physicochemical conditions at the time of formation, as these variables determine the quality and purity of iron mineralization. This type of analysis is fundamental for optimizing extraction processes and ensuring consistent quality in the exploited deposits. Zulliger [3] conducted a detailed study on mineralization in the Pinaya mineral district, showing the importance of the interaction between hydrothermal fluids and host rocks in the formation of skarn-type deposits. The results suggest that geochemical variations of these fluids play a key role in the concentration of valuable elements, providing an important guide for future explorations in similar contexts. Corrino [9] analyzed the influence of geological structure and fluid migration on the formation of magnetite deposits at the Cerro Millo prospect. Their findings indicate that regional fractures and faults act as major conduits for mineralizing fluids, which has significant implications for identifying new areas with mining potential. These Peruvian studies highlight the importance of detailed trace element and mineralogical characterization to better understand mineralogical associations and evaluate the potential for extracting valuable metals within the geological context of the country.
In the Winchospunta prospect, Junín (Peru), understanding the relationship between the gabbro and magnetite mineralization presents a particular challenge. This research was initiated to investigate the geological processes underlying this relationship, aiming to enhance our understanding of the mineralization patterns in the region. Determining whether the origin of magnetite is magmatic or hydrothermal is crucial for enhancing exploration methods and accurately assessing the economic potential of these resources [7]. The main challenge lies in identifying the precise geochemical signatures of the associated minerals, such as the inclusion of certain trace elements that can be used as indicators to define the formation processes. This differentiation is key to optimizing mining exploration plans and avoiding environmental and social conflicts in the region. The association of gabbro geochemistry and magnetite mineralization requires the use of both major and minor elements for a comprehensive characterization of the formation processes [10]. Major elements, such as iron, calcium, and magnesium, allow the identification of the main mineral phases and the general conditions of the magmatic or hydrothermal environment [11]. On the other hand, minor and trace elements, such as titanium, vanadium, and cobalt, are fundamental for determining the specific conditions of pressure, temperature, and fluid chemistry that influence the formation of mineralization [12]. Associating the geochemistry of gabbro with magnetite mineralization through the analysis of these elements allows not only a better understanding of the genesis of the deposits but also the construction of more precise and effective predictive models for mineral exploration, maximizing recovery and minimizing environmental impacts. This association can be further refined through detailed analysis, such as principal component analysis (PCA), which allows for the identification of underlying patterns in the geochemical data of major and minor elements. The use of PCA helps to synthesize complex information and uncover significant correlations that might go unnoticed in a unidimensional analysis, improving predictive capabilities and the identification of areas with high mineral potential.
Principal component analysis (PCA) is an efficient statistical tool that allows the synthesis of large volumes of geochemical data, making it essential for exploring associations between major and trace elements in complex systems like Winchospunta. Previous studies have demonstrated that multivariate techniques such as PCA are useful for identifying mineralization patterns that would otherwise go unnoticed due to sample heterogeneity. In this context, PCA not only facilitates the visualization of these patterns but also allows for the construction of more robust predictive models, improving the precision in identifying areas with mineral potential. The central objective of this research is to analyze the geochemistry of the Winchos Gabbro and its association with magnetite mineralization in the Winchospunta prospect, located in Carhuamayo, Junín, using principal component analysis to characterize and evaluate the mineral potential of the region. This evaluation aims not only to contribute to the understanding of the genesis of these resources in the Pucará Group belt but also to promote the development of exploration models that consider the geological particularities and the environmental and social implications of mineral extraction in sensitive areas of Peru.
2. Materials and Methods
2.1. Location of the Study Area
The Winchospunta prospect is located 178 km northeast of Lima in a straight line, 3.5 km northeast of the district of Carhuamayo, province and department of Junín. Its central UTM coordinates are 385,200 E and 8,795,300 N, at an elevation of 4,400 m.s.n.m. Figure 1).
2.2. Local Geology
Geologically, the area presents clastic sequences composed of quartzites, sandstones, and interbedded shales, occasionally accompanied by quartz conglomerates, belonging to the Carboniferous Ambo Group [13]. These sequences are followed by sandstones with interbedded gray shales and an absence of limestones from the Tarma-Copacabana Group, as defined by Dunbar and Newell [14]. Above them, red sandstones, siltstones, and conglomerates with intercalations of Permian volcanic rocks from the Mitú Group (Permian-Triassic) [15] are observed. Additionally, a package of carbonate rocks from the Pucará Group (Triassic-Jurassic), which Mégard [16] divides into the Chambará, Aramachay, and Condorsinga formations, is present. The sequences exhibit a NW-SE Andean orientation, with a prominent local fault system predominantly oriented NW-SE and N-S. The Winchos Gabbro, of mafic composition, stands out as an intrusive body with a medium-grained granular texture, primarily composed of calcic plagioclase, pyroxenes, and minor proportions of opaque minerals such as magnetite [17]. Its association with magmatic and hydrothermal processes in the local context highlights its importance in the genesis of magnetite mineralization in the region.
The structural geology of the area is dominated by reverse faults and folds. The carbonate sedimentary package of the Pucará Group forms a large monocline oriented N130°-150°W, with dips of 35°-60°W, corresponding to the western flank of an eroded anticline. Northeast-oriented dextral structures influenced the sedimentation and paleogeomorphology of the Pucará Group and Mitu Group facies. The faults are grouped into three families according to their orientation: NW-SE faults, which are reverse faults belonging to the Campanagaga-Yuragaga System, where the Aramachay Formation overrides the Chambará Formation; NE-SW faults, which are of local character and exhibit dextral or sinistral movements with a vertical component, indicating more recent deformation; and NNE-SSW faults, which are strike-slip faults and many of them gravitational, formed to accommodate fractured blocks due to present tectonic stresses. The Ulcumayo-San Rafael and Yanacocha-Quilcatacta faults, east of the prospect, follow a parallel structural pattern.
In the study area, recent Quaternary deposits of alluvial origin predominate, formed by the erosion of Permian and Jurassic sequences. These deposits, restricted to elevated areas, are composed of heterogeneous clasts of limestones, siltstones, and fragments of intrusive rocks such as gabbro and andesite, contained in a matrix of silt, clay, and abundant organic material.
Figure 2.
geological map – a) magnetite mineralization, b) local geological map.
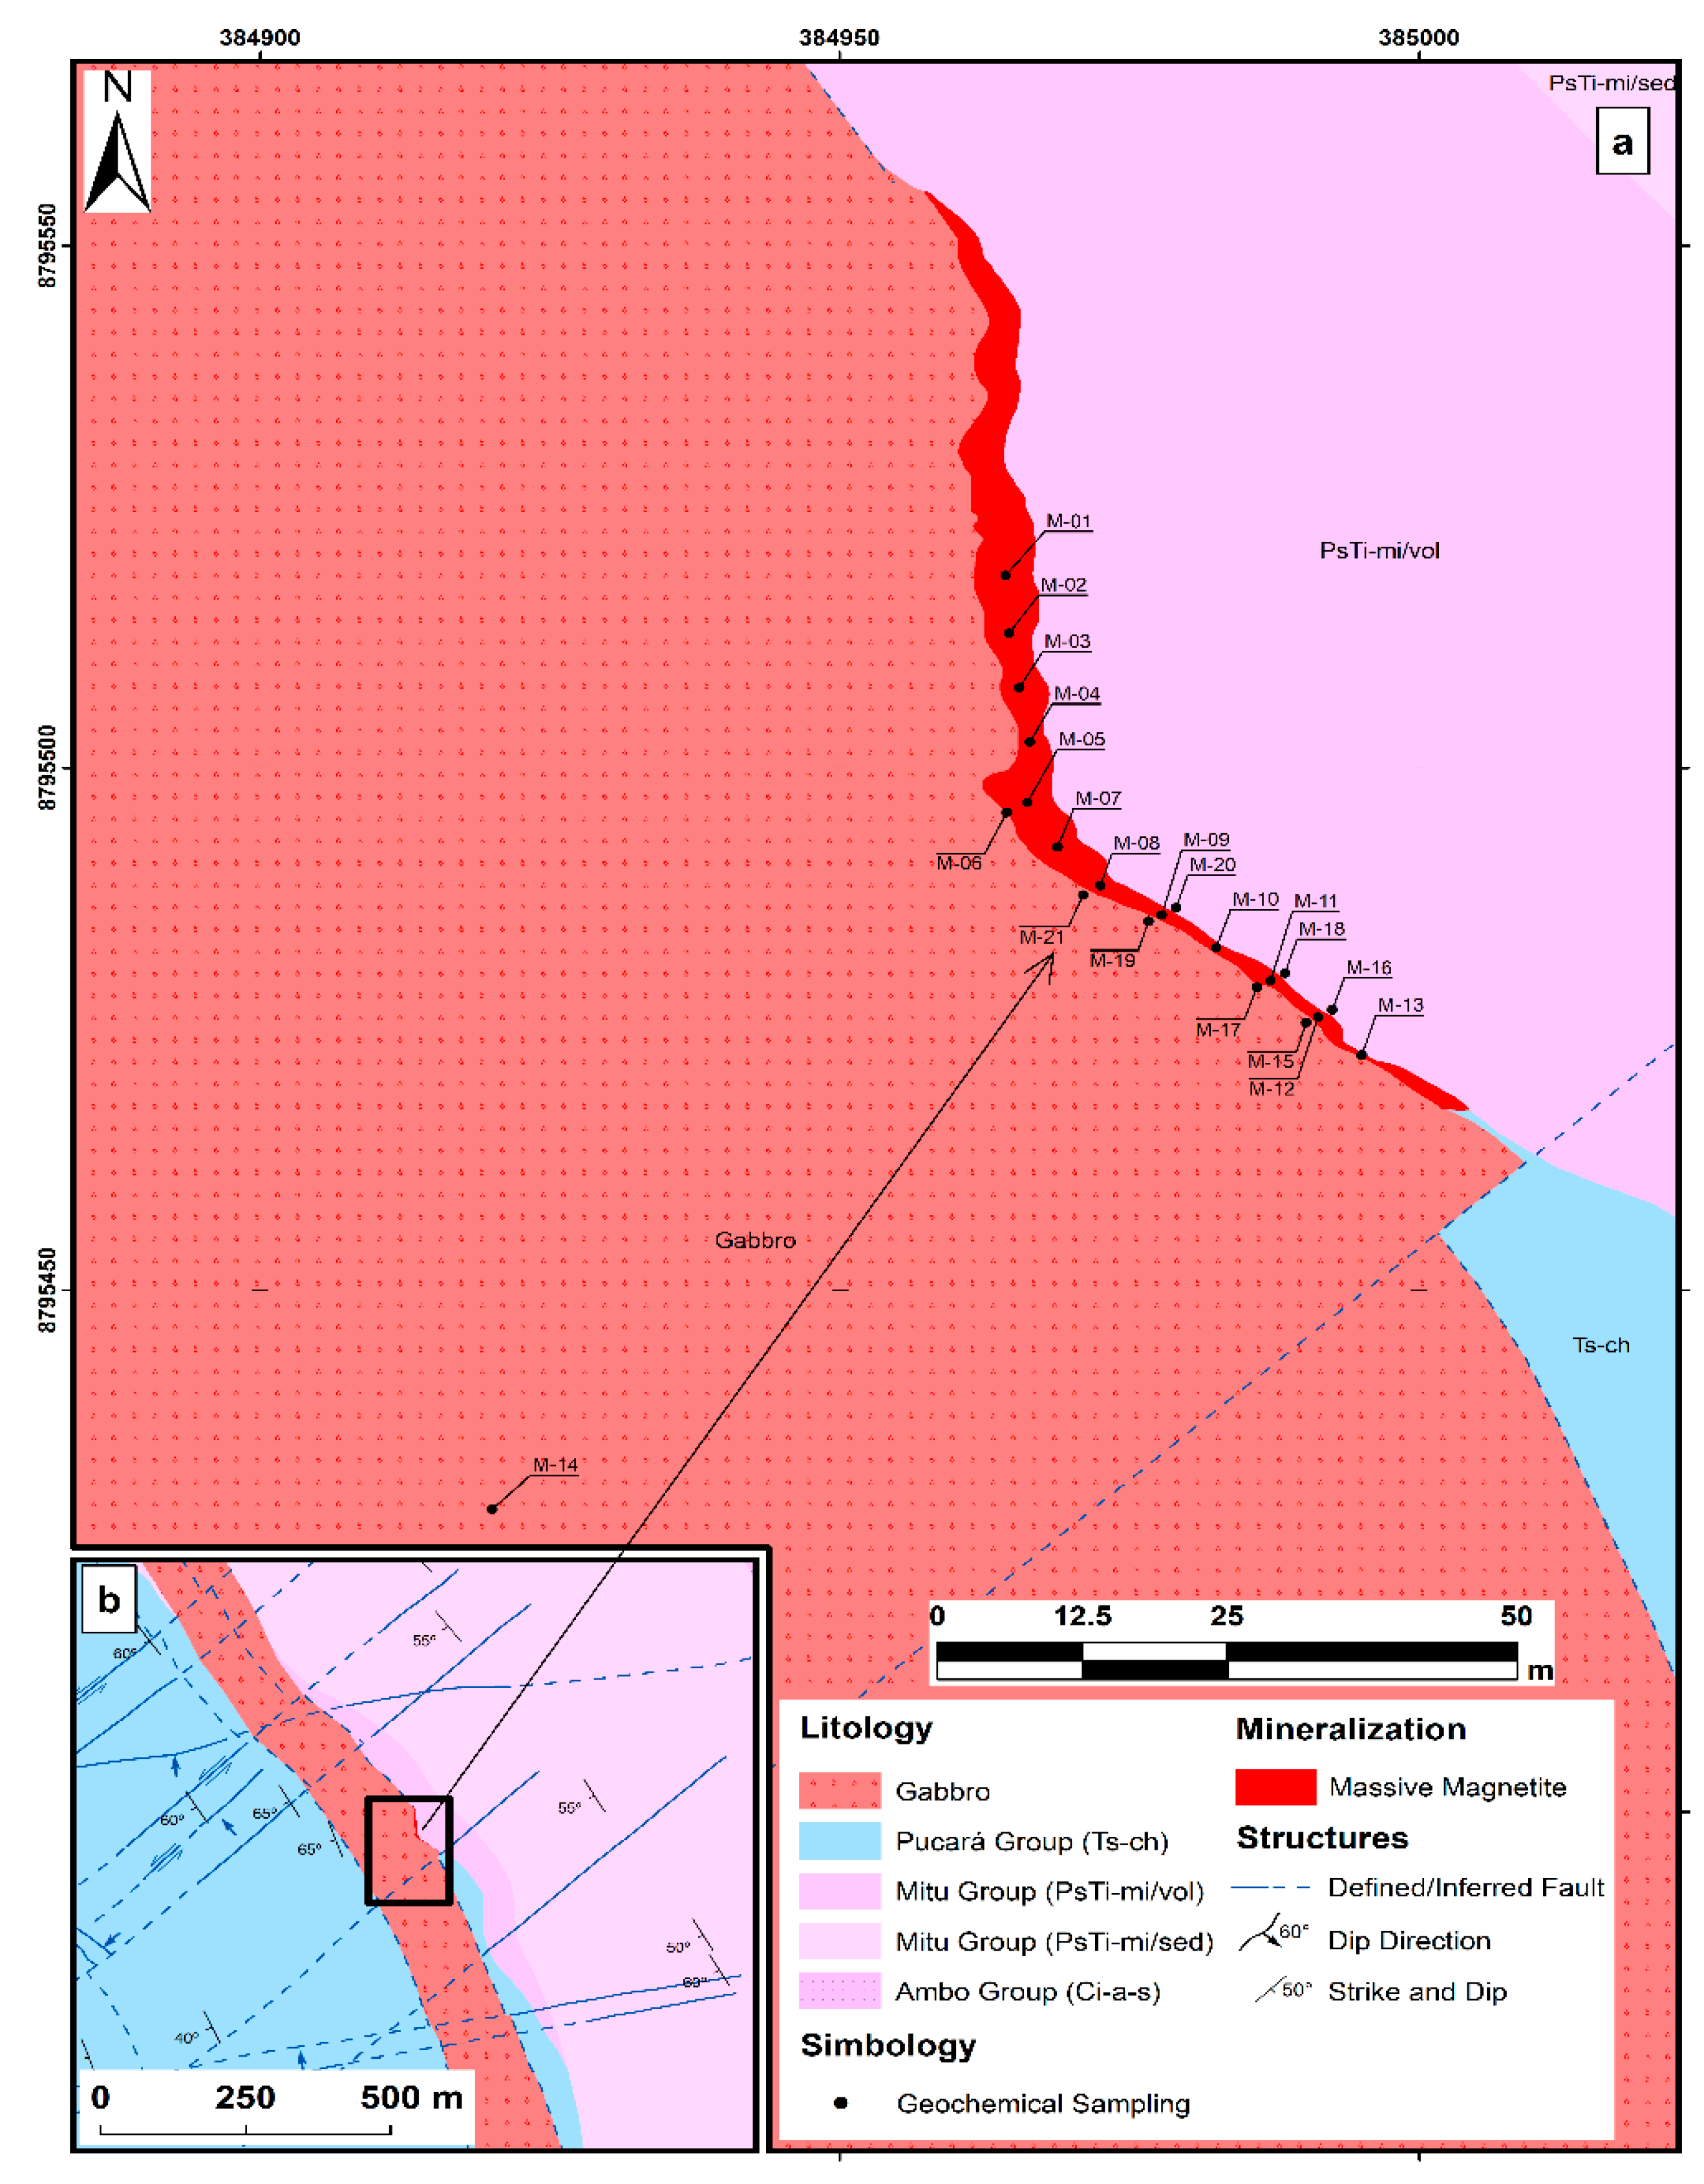
2.3. Mineralization
The studied area presents an iron (Fe) replacement body, which manifests in stratiform, lenticular, and irregularly massive forms, distributed across two main areas and predominantly oriented in the N130°-150° direction with a dip of 50°-60° to the southeast. The mineralization varies in length between 15 and 100 meters, with thicknesses of up to less than three meters (see Figure 3), and contains iron content reaching up to 60%. The mineralogy is mainly composed of magnetite, pyrite, traces of pyrrhotite, hematite, goethite, and pyrolusite. Magnetite (Fe₃O₄) completely replaces limestone and forms granular aggregates that vary from euhedral to anhedral shapes, which are progressively surrounded and replaced by gangue minerals through microfractures and grain boundaries. Pyrite (FeS₂) occurs in a disseminated form with small crystals, some surrounding the magnetite, while pyrrhotite is present in smaller amounts with crystals of similar size. Hematite (Fe₂O₃) and goethite (FeO(OH)) result from the oxidation and alteration of other iron minerals, filling fractures in the veins, and pyrolusite (MnO₂) is distinguished by its dark gray color and dendritic form in the marble of the area. These minerals give distinctive characteristics to the veins, forming a mineralogical assemblage typical of the recognized zones so far.
2.4. Alteration
Hydrothermal alteration in the study area primarily affected the gabbro intrusive, manifesting as moderate propylitization and sericitization that altered its structure, and to a lesser extent, the limestones of the Chambará Formation, which showed recrystallization, weak granular silicification, and hematization in thin layers. The effects of these alterations on the limestones were difficult to perceive due to the accentuation of previous alterations, although generalized bleaching was observed in the walls of the structures with the presence of serpentine. In the propylitic alteration zone, the characteristic minerals were chlorite, calcite, and augite, with a decrease in disseminated pyrite; sericitization produced finegrained green sericite that destroyed the original rock texture and was associated with magnetite mineralization. Marbleization, observable on the periphery of the district more than 150 meters from the intrusives, was the weakest alteration and represented the recrystallization of limestone to marble. Hematization, often related to high-temperature magnetite mineralization, indicated a low sulfur partial pressure in the mineralizing solutions and a redistribution of iron due to oxidation (Figure 4).
2.5. Sample Selection
Between April and May 2023, 24 samples of approximately 2 kg each were collected through convenience sampling, selected based on rock type, texture, mineralization, and alteration, mainly from the mineralized zone of the Winchos Gabbro, volcanic rocks of the Mitu Group, and some sedimentary rocks at the Winchospunta prospect. Due to extensive vegetation coverage, it was not possible to carry out an exhaustive systematic sampling, so representative samples of the study area were selected. Thin and polished sections of selected samples were prepared for petrographic analysis using optical microscopy, focusing on characterizing the mineralogy and textures of magnetite. The samples, including massive magnetite (n=15), gabbro (n=6), volcanic rocks (n=3), and limestone (n=1), were sent to ALS Geochemistry Peru for advanced geochemical analyses. Analytical methods used included ME-ICP06 for major and minor elements by ICP-AES, ME-IR08 for total carbon and sulfur content by infrared spectroscopy, ME-MS81 and ME-MS42 for trace element detection by ICP-MS, and ME-MS61 for base metal determination by four-acid digestion and ICP-MS. Some samples showed sums of major elements outside the acceptable range (100% ± 1.5%), so they were normalized to 100%, considering loss on ignition (LOI).
2.6. Laboratory Analysis
Various analytical techniques were used to obtain a comprehensive understanding of the geochemistry of the studied samples. The ME-ICP06 method, using inductively coupled plasma atomic emission spectroscopy (ICP-AES), determined the concentrations of major and minor elements in whole rocks [18], while ME-IR08 precisely measured the total content of carbon and sulfur using infrared spectroscopy. For the detection of trace elements at ultra-trace levels, the ME-MS81 and ME-MS42 methods were implemented, both based on ICP-MS and recognized for their high sensitivity and precision [19]. Additionally, four-acid digestion and ICP-MS analysis using the ME-MS61 method was essential for determining base metals, providing detailed results on the elemental composition of the samples [20].
2.7. Statistical Analysis
2.7.1. Box-Plot Graphs
A box and whisker diagram (Box-Plot) is a graphical representation that shows the distribution of a data set through its quartiles. This type of graph provides information on the median, quartiles, and outliers, allowing for effective comparison between different data sets [21]. To describe the symmetry and dispersion of the data, the points and extremes of the box-plot are crucial. In this study, box and whisker diagrams were used as a visual tool to summarize and analyze the distribution of the data before conducting multivariate statistical analysis.
2.7.2. Kolmogorov-Smirnov Test
The Kolmogorov-Smirnov normality test, according to [22], was first developed by Kolmogorov in 1933 and modified and proposed as a test by Smirnov in 1948. It is a statistical test that belongs to the subclass of Empirical Distribution Function Statistics, which is based on comparing the population distribution function F(x) with the empirical distribution function F(x) n. A data set is considered normal when it has a significant value greater than or equal to 0.05 (r ≥ 0.05).
2.7.3. Shapiro-Wilk Test
The Shapiro-Wilk test is a normality test proposed by Samuel Sandford Shapiro and Martin Wilk in 1965. The test is based on the correlation between the data and their normal scores [23]. The null hypothesis of this test is accepted if the significance value (p-value) is greater than 0.05 (p ≥ 0.05).
2.7.3. Factor Analysis
Factor analysis (FA) using the principal component analysis method as the extraction criterion was employed in the Statistical Package environment to analyze the collected data set to uncover correlations between the elements [24]. Principal component analysis (PCA) is an unsupervised technique in which the multidimensional axes of the normalized data space are rotated to incorporate the maximum possible variance of the data into the smallest possible number of axis directions [25]. The weakness of this approach in this context is that the directions in the data space that explain the most variance are not necessarily the best directions for separating the categories of interest (sample locations) [25]. To associate the geochemical and mineralogical signatures at the study site, principal component analysis (PCA) was applied using analytical tools from the Python pandas packages [1]. In all cases, we used normalized data (z-score) to prevent the algorithms from being unduly influenced by variables with larger numbers.
3. Results
3.1. Multi-Element Geochemistry
The comparison of minor elements in the three types of rocks massive magnetite, Winchos Gabbro, and Mitu volcanic rocks—reveals distinctive geochemical patterns that reflect their formation environments and potential mineralization. The massive magnetite (Figure 5a) is characterized its high Fe₂O₃ content, ranging from 68.8% to 87.3%, and in V concentration (up to 294 ppm), typical of vanadiferous magnetite de-posits. The presence of Zn (98–278 ppm) is also significant, although relatively low, while Cu (2.8–53.5 ppm) and Pb (1.9–25.4 ppm) exhibit variability, suggesting specific mineral associations and the possible inclusion of minor phases or hydrothermal alter-ation processes that enrich these zones in copper and lead. The Winchos gabbro (Figure 5b) exhibits a low to moderate Fe₂O₃ content (11.6–16.1%), indicating its mafic nature. This type of rock displays anomalies in Cu concentrations, ranging from 8.1 to 210 ppm, which can be considered sub-economic or prospectively interesting depending on the geological context and exploration potential, and Pb reaching up to 179 ppm, re-flecting an affinity with these elements within the mafic matrix. V concentration in the gabbro shows anomalies, reaching up to 305 ppm, which may be associated with min-erals like magnetite and titanomagnetite, typical of vanadium-rich Gabbros, suggest-ing an anomalous enrichment in the area. This enrichment could be of prospectively interesting for further exploration. The levels of Zn (up to 107.5 ppm) and U (up to 2.99 ppm) suggest that the Winchos gabbro may also contain minor phases of zinc and uranium, without reaching the anomalies detected in the volcanics. The Mitu volcanic rocks (Figure 5c) present significant anomalies in Cu, with concentrations ranging from 280 to 529 ppm, and in U, reaching up to 10.85 ppm, suggesting a formation environment that may have included hydrothermal processes responsible for these anomalies in copper and uranium. This behavior contrasts with Zn levels (29.3–57.3 ppm) and Fe₂O₃ (15.5–23.4%), which are common in volcanic rocks of intermediate to felsic composition. These patterns suggest that the Mitu volcanic rocks have significant potential for copper and uranium exploration, while the massive magnetite is promising for iron and vanadium exploitation, and the Winchos gabbro shows potential in copper, lead, and vanadium, reflecting its mafic composition.
Table 1 summarizes the concentrations of trace elements in massive magnetite, Winchos gabbro, and Mitu volcanics, showing clear differences that reflect their metallogenic potentials and formation environments. Massive magnetite is characterized by a mean copper (Cu) of 32.85 ppm, with values ranging from 1.9 to 53.5 ppm, and a median of 12 ppm, indicating a moderate concentration with variability in some samples. Vanadium (V) shows a high mean of 187.21 ppm and reaches a maximum of 294 ppm, confirming its affinity with the magnetite structure, while zinc (Zn) has a median of 238.5 ppm, indicating a significant presence compared to lead (Pb), which has a median of 4.75 ppm. In the Winchos gabbro, Cu shows a high mean of 110.93 ppm and a range of 13.2 to 210 ppm, with a median of 101.25 ppm, suggesting a uniform distribution and greater capacity to host copper. Pb in the gabbro has a mean of 47.95 ppm and reaches up to 107.5 ppm, indicating possible compatibility with mafic phases. V, with a mean of 237.83 ppm and a median of 242.5 ppm, is also prominent, similar to magnetite. The Mitu volcanics are notable for strong Cu enrichment, with a mean of 299.83 ppm and a maximum of 529 ppm, reflecting significant potential for copper mineralization, while uranium (U) reaches a mean of 9.367 ppm and a maximum of 10.85 ppm, possibly associated with hydrothermal processes. Zn has a median of 56 ppm, and V has a relatively low mean of 130.33 ppm. Therefore, massive magnetite is particularly rich in V and Zn, Winchos gabbro in Cu and Pb, and Mitu volcanics in Cu and U, suggesting that the latter are especially promising for copper and uranium exploitation, while magnetite and gabbro are potential sources of vanadium, zinc, and lead.
Figure 6 presents the concentrations of major elements in three rock types: massive magnetite, Winchos gabbro, and Mitu volcanics, expressed as percentages. This analysis reveals significant compositional variations that reflect the formation environments of each rock type and their mineralogical potentials. In the massive magnetite (Figure 6a), the Fe₂O₃ content is predominantly high, ranging from 68.76% to 87.30%, which confirms its nature as an iron deposit. The silica (SiO₂) content is low, with values between 3.81% and 16.60%, indicating that the magnetite is not significantly contaminated with other silicates. The other oxides present lower concentrations; Al₂O₃ ranges from 0.77% to 2.33%, while TiO₂, CaO, Na₂O, and K₂O are present in minimal concentrations (generally below 0.1%), reflecting the relative purity of the massive magnetite and the limited inclusion of accessory minerals. The Winchos gabbro (Figure 6b) shows a more complex and diversified composition compared to massive magnetite. Fe₂O₃ in this type of rock is significantly lower, ranging between 11.55% and 15.55%, which is characteristic of mafic rocks and reflects its lower total iron content. However, the concentrations of SiO₂ are much higher (46.69% to 51.42%), which is typical of gabbros. Al₂O₃ reaches up to 17.78%, and TiO₂ ranges between 2.18% and 3.28%, suggesting the presence of aluminum- and titanium-rich mineral phases, such as feldspars and possibly ilmenite. MgO and CaO are also significant, with maxima of 12.07% and 7.78%, respectively, indicative of the presence of mafic minerals such as pyroxenes and calcic plagioclase. In the Mitu volcanics (Figure 6c), Fe₂O₃ shows an intermediate range of concentrations (15.5% to 23.44%), reflecting a moderate iron content compared to gabbro and magnetite. SiO₂ in these volcanic rocks ranges from 39.01% to 41.49%, suggesting an andesitic or basaltic composition. Al₂O₃ values are similar to those in gabbro (13.5% to 18.29%), while TiO₂ is lower (0.74% to 0.97%), which is consistent with the composition of intermediate volcanic rocks. Additionally, CaO reaches up to 18.19%, and MgO and P₂O₅ are present in notable concentrations (up to 8.17% and 0.59%, respectively), indicating the presence of calcic phases and phosphates, typical of volcanic contexts. Each rock type exhibits a unique composition: massive magnetite is rich in Fe₂O₃ and poor in silicates; Winchos gabbro contains high levels of SiO₂, Al₂O₃, TiO₂, and CaO, reflecting its mafic character; and Mitu volcanics possess an intermediate composition with elevated levels of Fe₂O₃, SiO₂, and CaO, indicating a volcanic environment with potential for forming calcic minerals and phosphates.
Table 2 presents descriptive statistics of the major elements in three rock types: massive magnetite, Winchos gabbro, and Mitu volcanics, showing significant compositional variations. In massive magnetite, Fe₂O₃ dominates with an average of 79.08%, ranging from 68.76% to 87.33%, reflecting its high iron content. SiO₂ has a low average of 9.97%, with values between 3.81% and 16.60%, suggesting a low presence of silicates. Al₂O₃ ranges from 0.38% to 2.33%, with an average of 1.60%, while TiO₂, CaO, Na₂O, and K₂O are nearly absent (generally <0.1%), indicating high iron purity. In the Winchos gabbro, Fe₂O₃ is significantly lower, with an average of 14.29% and a range of 11.55% to 16.13%, typical of mafic rocks. SiO₂ reaches an average of 48.36%, with a maximum of 51.42%, reflecting the siliceous nature of gabbro. Al₂O₃ shows an average of 15.60%, with values reaching 17.78%, while TiO₂ ranges from 2.09% to 3.28%, suggesting the presence of aluminum- and titanium-rich minerals such as ilmenite and feldspars. MgO and CaO are significant, with averages of 9.56% and 5.24%, respectively, indicating mafic mineralogy. In the Mitu volcanics, Fe₂O₃ has an average of 18.49%, ranging from 15.53% to 23.44%, indicating an intermediate composition. SiO₂ has an average of 43.97%, with a maximum of 51.42%, typical of volcanic rocks of andesitic to basaltic type. Al₂O₃ ranges from 13.50% to 18.29% (average of 16.52%), while TiO₂ is low, with an average of 0.88%. High CaO values (average of 7.02%, maximum of 18.19%) and MgO (average of 11.16%, maximum of 16.84%) suggest the presence of calcic phases and mafic minerals, characteristic of volcanic environments. In conclusion, massive magnetite is extremely rich in Fe₂O₃, Winchos gabbro shows high levels of SiO₂ and Al₂O₃ with mafic characteristics, and Mitu volcanics have an intermediate composition with elevated CaO and MgO, highlighting their lithological diversity and mineralogical potential.
3.2. Genesis of Magnetite Mineralization
La Figure 7 shows the concentrations of major oxides in various lithologies, including massive magnetite, Winchos gabbro, Mitu volcanics, and the Tapo Massif [26], adjusted to 100% with the loss on ignition (LOI) considered, providing an accurate view of the mineralogical content in the context of carbonates and alteration processes. The massive magnetite (Figure 7a) is notable for its high Fe₂O₃ concentration, ranging from 68.75% to 87.32%, indicating a very pure iron deposit associated with the replacement of magnetite in marbles of the Chambará Formation. This suggests that Fe₂O₃ was released and available for mobilization in the hydrothermal system, favoring the formation of iron mineralization in contact with carbonates. The Mitu volcanics (Figure 7b) show Fe₂O₃ contents ranging from 15.53% to 23.44%, indicating that these igneous bodies may have contributed iron to the hydrothermal system, aiding magnetite mineralization in areas of interaction with limestones. Additionally, SiO₂ in the Mitu volcanics presents high values (39.01% to 51.41%), suggesting an intermediate to felsic composition that could facilitate the transport of Fe via magmatic fluids. The presence of other oxides, such as Al₂O₃ (13.50% to 18.29%) and CaO (up to 18.19%), supports the role of the Mitu volcanics as sources of elements in the system. The Winchos gabbro (Figure 7c) presents Fe₂O₃ in the range of 11.55% to 16.13%, implying a complementary contribution of iron to the mineralization system, possibly through the gradual release of Fe during hydrothermal alteration of mafic minerals present in the gabbro. Furthermore, the CaO content in the gabbro, with values up to 7.78%, reinforces its interaction with carbonates in replacement environments. Massive magnetite mineralization is not an isolated event but is influenced by iron contributions from both the Mitu volcanics and the Winchos gabbro, where Fe₂O₃ from these units was mobilized and incorporated into areas of interaction with carbonates, such as the marbles of the Chambará formation. The geological configuration suggests that the replacement of magnetite in the marble is a process linked to a Fe-enriched hydrothermal system, with diverse sources enriching the host rock and facilitating the formation of magnetite deposits.
The rare earth element (REE) profile normalized to chondrite for the volcanic rocks of the Mitu Group and the ultramafic rocks of the Tapo Massif shows a similar concentration in heavy rare earth elements (HREE) (Figure 8). At the same time, there is an increase in light rare earth elements (LREE) in the volcanic rocks of the Mitu Group compared to the ultramafic rocks of the Tapo Massif. This REE geochemical behavior can be explained by considering that the fissure magmatism of the Mitu Group intruded and assimilated the ultramafic rocks of the Tapo Massif at depth. The increase in LREE can be explained by the fact that these elements behave as highly incompatible in the magma due to their large atomic radius, which prevents them from fitting into the mineral structure, leading to their enrichment during the fissure magmatism of the Mitu Group. On the other hand, the HREE have sufficiently small radii that allow them to fit into the mineral structure. The REE profile of the Winchos gabbro and the Mitu Group rocks exhibits a similar geochemical behavior for HREE and LREE. This behavior could indicate a comagmatic event, where the fissure emission centers correspond to the emplacement of the Winchos gabbro and laterally to the volcanic rocks of the Mitu Group. The REE profile of the marble from the Chambará Formation and the massive magnetite shows similar geochemical behavior for both HREE and LREE. This behavior could be explained by the massive magnetite inheriting its REE geochemical behavior from the marble of the Chambará Formation during the replacement process.
Having an understanding of major elements, trace elements, rare earth elements, and microscopic petrography allows for defining the evolution and mineralization of the magnetite in the Winchospunta-Carhuamayo prospect. Regarding the evolution of massive magnetite, there is evidence of the similarity in the REE profile with the marble of the Chambará Formation, which indicates the replacement of magnetite in the Chambará Formation marble. This is corroborated by microphotographs. Additionally, the concentration of major ferric oxide elements in the Mitu volcanic rocks and Winchos gabbro shows the availability of ferric oxide for the formation of massive magnetite. (Figure 9).
3.3. Statistical Analysis
3.3.1. Kolmogorov- Smirnov test and shapiro wilk test
Table 3 shows the results of the Kolmogorov-Smirnov and Shapiro-Wilk normality tests for trace elements in massive magnetite, Winchos gabbro, and Mitu volcanics, where significance values below 0.05 indicate a non-normal distribution. In massive magnetite, Cu, Pb, Zn, Cd, and As do not meet normality in both tests, with significance values of 0.000, 0.002, 0.035, 0.003, and 0.028 in Shapiro-Wilk, respectively. This pattern suggests an asymmetric distribution and high variability in the concentration of these elements, likely influenced by hydrothermal alteration processes. In the Winchos gabbro, Zn and V also do not meet normality in Kolmogorov-Smirnov, with significance values of 0.021 and 0.083, although Zn is significant at the 0.05 level, indicating some heterogeneity in its distribution, possibly due to magmatic differentiation. In the Mitu volcanics, all elements meet normality in both tests, although the reduced sample size limits the robustness of this analysis. These results suggest that the distribution of trace elements in massive magnetite is more irregular, possibly due to specific geological influences, whereas Winchos gabbro and Mitu volcanics present greater homogeneity, with slight exceptions. This is relevant for understanding geochemical variability and formation processes in each rock type.
La Table 4 presents the results of the Kolmogorov-Smirnov and Shapiro-Wilk normality tests applied to major elements in massive magnetite, Winchos gabbro, and Mitu volcanics, where significance values below 0.05 indicate deviation from a normal distribution. In massive magnetite, CaO and K₂O do not meet normality, with significance values of 0.000 in Shapiro-Wilk for both, indicating an anomalous distribution of these oxides that may reflect variability in mineralogical composition or alteration processes. In Winchos gabbro, all elements meet normality, except for SiO₂, which has a value of 0.048 in Shapiro-Wilk, suggesting slight heterogeneity in its distribution that could be associated with variations in silicate crystallization. In Mitu volcanics, TiO₂ and CaO also do not meet normality, with significance values of 0.013 and 0.000 in Shapiro-Wilk, respectively, indicating an irregular distribution of these elements in this volcanic unit, possibly linked to titanium and calcium enrichment processes in certain geological contexts. The major elements in Winchos gabbro are the most homogeneous in distribution, whereas massive magnetite and Mitu volcanics show greater variability in some of their major oxides. This is important for understanding compositional heterogeneity and the geological processes affecting each lithology.
3.3.2. Correlation Analysis
Table 5 shows the Pearson correlation analysis for trace elements, highlighting significant correlations (r ≥ 0.50) in bold. A strong positive correlation is observed between Cu and U (r = 0.885, p < 0.01), suggesting that these elements may be associated with the same type of mineralization or geological precipitation conditions. Similarly, Pb shows significant correlations with Cu (r = 0.655, p < 0.01) and Cd (r = 0.729, p < 0.01), indicating a possible co-occurrence of lead and cadmium, common in sulfide minerals. Cd also has a moderate correlation with As (r = 0.432, p < 0.05), which may indicate a geochemical affinity between these elements in certain mineralogical phases. On the other hand, Zn shows significant negative correlations with Cu (r = -0.554, p < 0.01) and U (r = -0.641, p < 0.01), suggesting that zinc may be distributed in mineralogical phases or formation environments different from those of copper and uranium. A negative correlation is also observed between Sn and Pb (r = -0.499, p < 0.05) and between Sn and Cd (r = -0.509, p < 0.05), which may indicate that tin is not commonly associated with these elements in the same mineralizations
Table 6 presents the Pearson correlation analysis for major elements, highlighting significant correlations (r ≥ 0.50) in bold. A strong positive correlation is observed between SiO₂ and TiO₂ (r = 0.890, p < 0.01), Al₂O₃ (r = 0.857, p < 0.01), Na₂O (r = 0.824, p < 0.01), K₂O (r = 0.866, p < 0.01), and P₂O₅ (r = 0.807, p < 0.01), suggesting an association of these elements with silicates or silica- and aluminum-rich mineral phases, typical in igneous and sedimentary rocks. In contrast, Fe₂O₃ shows strong negative correlations with SiO₂ (r = -0.924, p < 0.01), TiO₂ (r = -0.932, p < 0.01), Al₂O₃ (r = -0.795, p < 0.01), Na₂O (r = -0.831, p < 0.01), K₂O (r = -0.846, p < 0.01), and P₂O₅ (r = -0.827, p < 0.01), indicating that iron tends to be found in minerals other than silicates, possibly in iron oxides such as magnetite and hematite. Additionally, CaO has significant correlations with TiO₂ (r = 0.714, p < 0.01), Na₂O (r = 0.610, p < 0.01), and P₂O₅ (r = 0.628, p < 0.01), suggesting its association with calcic mineral phases such as feldspars or apatite. The moderate correlation of MgO with TiO₂ (r = 0.554, p < 0.01) and negative correlation with Fe₂O₃ (r = -0.599, p < 0.01) indicate that magnesium is found in minerals other than iron oxides, possibly in mafic silicates such as olivine or pyroxene. These correlations highlight the dominant mineralogical associations and provide an understanding of the geological processes that control the distribution of major elements in the studied context
3.3.3. Factor Analysis
La Table 7 shows the results of the principal component analysis (PCA) applied to the data of major and trace elements, detailing the total variance explained for each principal component in terms of eigenvalues, percentage of variance, and cumulative percentage. In the initial eigenvalues column, the first principal component has an eigenvalue of 19890.774 and explains 66.609% of the total variance, suggesting that this principal component represents a large proportion of the variability in the dataset, likely capturing the dominant associations of certain major or trace elements with high covariation. The second component explains an additional 18.251% of the variance, reaching a cumulative 84.861%, which indicates that the first two components together explain a substantial portion (more than 80%) of the variability in the data. The third component adds 11.704% of the variance, achieving a cumulative 96.564%, implying that the first three principal components cover nearly all the significant variance in the dataset, allowing effective dimensional reduction without losing essential information. From the fourth component onward, the contribution of variance is minimal, with values below 3% and a cumulative contribution that quickly reaches 100% by the tenth component. The first three principal components capture approximately 96.56% of the total variance in the dataset, which is sufficient to explain the main relationships among the analyzed elements
Table 8 of the unrotated component matrix from the principal component analysis reveals clear patterns of association among elements, providing key information on the mineralogical phases and underlying geological processes. In Component 1, high positive loadings for Cu (0.970) and U (0.745) stand out, indicating a strong correlation suggesting a common source or process, possibly related to hydrothermal mineralization; in contrast, Zn shows a considerable negative loading (-0.684), which suggests that its distribution and origin differ from those of Cu and U, likely associating with distinct mineral phases. Component 2 exhibits high loadings for Pb (0.319), Al₂O₃ (0.363), and P₂O₅ (0.376), suggesting a possible association of lead with secondary aluminous or phosphate minerals, which tend to form in alteration contexts. In Component 3, high negative loadings are observed for Sn (-0.710) and Fe₂O₃ (-0.544), while Al₂O₃ shows a positive loading (0.480), indicating a separation between elements such as tin and iron from aluminum-rich phases, which could reflect their concentration in specific iron and tin minerals rather than aluminous minerals. Together, these results suggest three principal groupings: a first component associated with Cu and U mineralization, possibly hydrothermal, with Zn distributed in an opposing manner; a second component that associates Pb with aluminous and phosphate phases; and a third component showing a negative relationship between Sn and Fe versus Al, helping to clarify the different formation environments and mineralogical associations in the geochemical dataset analyzed.
Table 9 of the VARIMAX-rotated component matrix from the principal component analysis facilitates the identification of key geochemical associations among elements. Component 1 shows high negative loadings for Zn (-0.572), Sn (-0.801), and Fe₂O₃ (-0.695), in contrast with significant positive loadings for SiO₂ (0.699) and Al₂O₃ (0.635), suggesting a differentiation between silicate phases and elements associated with specific iron and sulfide minerals. In Component 2, the high loadings of Cu (0.863) and Pb (0.833) indicate a strong association typical in hydrothermal sulfide mineralizations of copper and lead, with a possible secondary relationship with phosphates, as indicated by the P₂O₅ loading (0.691). Component 3 stands out with high loadings for Zn (0.811) and V (0.875), suggesting an affinity of these elements in specific zinc and vanadium phases, possibly in oxides or vanadium minerals. These groupings of elements reflect mineralogical associations and allow us to infer different formation environments in the analyzed geochemical context: Component 1 is associated with silicate phases in opposition to minerals rich in Zn, Sn, and Fe; Component 2 is related to sulfide mineralizations of Cu and Pb and possible phosphates; while Component 3 indicates a relationship between Zn and V, relevant in vanadium or zinc minerals
Table 10 presents the component transformation matrix in a principal component analysis (PCA). Each value in the matrix represents the correlation between the rotated components and the original axes, facilitating the interpretation of how the components are oriented in the transformed space. In this matrix, Component 1 has a high correlation with the third original axis (0.951), suggesting that most of the variance explained by this component is primarily aligned with the characteristics of the third axis. Component 2 shows significant correlation with both the second original axis (0.639) and the first (0.291), indicating a distribution of variance between these axes. Component 3, on the other hand, has a high correlation with the second original axis (0.712) and a considerable negative correlation with the first axis (-0.688), suggesting that this component captures variance in an opposing or opposite direction to the first axis, relative to the second. Together, this transformation matrix helps to understand how each derived principal component is associated with the original directions in the data space, thereby facilitating the interpretation of variability patterns and dimensional reduction in the geochemical data analysis.
The Figure 10 shows the three-dimensional plot of the rotated components in a principal component analysis (PCA), where the groupings and directions of major and trace elements are visualized in the space defined by Components 1, 2, and 3. In this plot, each point represents an element, and its position in the space reflects its association or affinity with different components, highlighting possible patterns and groupings that suggest the existence of mineralogical and geochemical associations. Component 1 (horizontal axis in the plot) is negatively associated with elements like Fe₂O₃, Zn, and Sn, indicating that these elements behave oppositely to those that are further in the positive direction of the same component, such as Cu and P₂O₅. This separation suggests that Cu and phosphates could be linked to mineralization environments different from those of Fe, Zn, and Sn, which are possibly concentrated in specific oxide or iron sulfide phases. Component 2 (vertical axis) shows a strong association with elements like Cu, P₂O₅, U, and Al₂O₃, while Fe₂O₃ and Zn are positioned further in the negative direction, suggesting that elements at the top of this axis are more related to hydrothermal phases or aluminous and phosphate minerals, whereas Fe and Zn could be found in more metallic phases or in less oxidizing alteration environments. Component 3 separates elements like SiO₂ and Al₂O₃, which are located at the top of the plot, indicating an association with silicate and aluminous phases, while other elements such as V and MnO are positioned at the bottom, suggesting their link to oxide minerals or more mafic phases. The positioning of Pb, Cd, and CaO in the central region of the plot indicates a possible intermediate relationship of these elements, partially associating with alteration environments or sulfide-type deposits. The three-dimensional plot clearly shows a differentiation between elements associated with hydrothermal or silicate phases (Cu, P₂O₅, SiO₂, Al₂O₃) and those linked to metallic oxides and sulfides (Fe₂O₃, Zn, Sn). This analysis allows for the inference of possible formation environments and element concentrations in the studied samples, providing a deeper understanding of element distribution in the analyzed geological context
4. Discussion
In this discussion, we will explore the geochemical and mineralogical patterns observed in three types of rocks: massive magnetite, Winchos gabbro, and Mitu volcanic rocks. We will compare our findings with various studies on mineral deposits and related geological formations. The reviewed articles cover a wide range of geological environments and hydrothermal and magmatic processes, which allows us to contextualize our results and understand their mineralogical and metallogenic relevance. To address each aspect in more detail, we have divided the discussion into several sections.
The analyzed massive magnetite presents a high Fe₂O₃ content, ranging between 68.8% and 87.3%, along with a significant concentration of vanadium (V) of up to 294 ppm. This enrichment in iron and vanadium is indicative of the geological environment and the processes that influenced the formation of the magnetite. Its similarity to the magnetite from skarn deposits described by Peng [27], where several types of magnetite associated with skarn deposits at different stages of mineralization and enrichment in V, Cr, and Ti are identified, suggests that the origin of these elements could be linked to complex magmatic and metasomatic processes. In the case of the Huanggang skarn deposit in China, the late-stage magnetite shows partial replacement by hematite, a characteristic that could also apply to some hydrothermal alteration phases observed in the massive magnetite of the Winchospunta-Carhuamayo prospect. This hydrothermal alteration could be responsible for the compositional variability in our samples. Additionally, studies like that of Sun [28] indicate that the enrichment in Fe and V may be related to the interaction of neutral hydrothermal fluids under low-grade metamorphism conditions. This suggests that prolonged interaction with hydrothermal fluids was key to the mobilization and concentration of vanadium in the crystalline structures of magnetite, favoring the formation of mineralogical associations typical of active metasomatic environments.
Furthermore, the variability in the concentration of Fe₂O₃ and V could indicate multiple fluid events that enriched the mineralization at different stages. This would have contributed not only to the growth of magnetite but also to the inclusion of minor phases of elements such as Zn, Cu, and Ti, as observed in comparative studies of skarn deposits. The study by Corrino [9] demonstrates that the replacement dynamics in vanadium-enriched magnetites are closely linked to the availability of fluids with variable compositions during the metasomatic process, supporting the hypothesis that the massive magnetite of Winchospunta could have formed in a geological context with multiple pulses of enriched fluids. These interactions are comparable to those documented by Chen [7], where the hydrothermal alteration process in skarn systems shows the relationship between chemical changes and the mineralogy associated with the late stages of mineral replacement.
The Winchos gabbro is characterized by a lower Fe₂O₃ content, between 11.6% and 16.1%, and presents elevated concentrations of copper (Cu) and lead (Pb). This could be related to hydrothermal processes responsible for skarn mineralization in similar gabbros. For example, in the case of the Zhangmatun gabbro, a genetic linkage between mafic intrusives and iron skarn mineralization is observed due to the exsolution of Fe-rich fluids from the gabbro during the retrograde alteration stage. This suggests that the Winchos gabbro could have acted as a local source of Fe, Cu, and Pb, providing key elements in subsequent hydrothermal processes. Additionally, the high concentration of vanadium in the Winchos gabbro, similar to that reported by Samal [29] for V- and Nb-rich garnets formed in acidic hydrothermal environments, reinforces the idea that these mafic phases were subject to significant metasomatism. It is important to note that the mobilization of metals in gabbros subjected to metasomatic processes has been widely documented in studies on skarns and IOCG-type deposits, such as the study by Wang [30], which identifies the role of Fe-rich fluids and their influence on the chemistry of the deposits.
Studies like that of Hennig [4] have demonstrated that the interaction between hydrothermal fluids and mafic rocks can lead to the redistribution of base metals and the precipitation of metallic sulfide phases in metasomatic contexts, which is directly relevant to the behavior of the Winchos gabbro. Xie (31) research on the formation of mafic deposits in China also offers an interesting parallel, where acid metasomatism processes contribute to the enrichment in elements such as Cu and Pb, aligning with observations made in the Winchos gabbro.
The Mitu volcanic rocks stand out for their high levels of copper (280–529 ppm) and uranium (up to 10.85 ppm), suggesting an active hydrothermal environment conducive to the concentration of these metals. This behavior is similar to that observed in the Cu and Au deposits of the Pinaya district in Peru, where porphyry-type intrusives contain quartz-chalcopyrite veins with a strong association to potassic alteration. Additionally, the formation environment of the Mitu volcanic rocks, with high contents of CaO and MgO, is similar to that of skarns in the Andahuaylas-Yauri belt. There, a transition from flat subduction to normal subduction is observed, favoring the emission of metal-enriched fluids. This parallelism allows us to propose that the Mitu volcanic rocks could represent a regional analogue for exploring Cu and U mineralizations in the region.
Additional studies, such as that of Zulliger [3], suggest that the association of skarns with magmatic events in the southern extension of the Andahuaylas-Yauri belt could be linked to tectonic evolution and the subduction regime, providing a broader context for mineralization in the Mitu volcanic rocks. The work by Hu [32] offers a valuable perspective on the influence of subduction processes in the genesis of copper deposits in volcanic contexts, demonstrating how different subduction conditions affect the composition of fluids and, consequently, the enrichment in elements such as Cu and U. This approach is complemented by the findings of Lima [33] on volcanic deposits in the Peruvian altiplano, where the flow of hydrothermal fluids during tectonic events significantly contributed to metal concentration.
The rare earth element (REE) profile of the three analyzed rocks shows consistent behavior, with an enrichment of light REEs (LREEs) in the massive magnetite, similar to that observed in BIF deposits of the North China Craton. According to Sun [28], these deposits are formed mainly from the desilicification of banded iron formations through the action of metamorphic hydrothermal fluids. The REE patterns observed in the massive magnetite indicate a similar process of desilicification and chemical exchange with neutral fluids, which would align with the concentration of V and Zn observed in this study. Moreover, the study by Liang [34] demonstrates that the formation of high-grade iron deposits can be related to processes of migration of REE-rich fluids and their interaction with host rocks, which could be relevant for interpreting the results obtained in the massive magnetite.
Li [5] also describes how fluid migration and desilicification affect rare earth patterns in skarn deposits, observing a preferential enrichment of LREEs associated with the interaction between carbonate host rocks and acidic hydrothermal fluids. This results in the precipitation of REE minerals in the contact zones, similar to what we observe in the deposits studied in this work. Additionally, Mei [35] points out that the concentration of LREEs in skarn systems can be influenced by the temperature and chemical composition of the fluids, implying that variations in these parameters could explain the differences in the REE profiles observed among the different types of analyzed rocks.
5. Conclusions
The massive magnetite, Winchos gabbro, and Mitu volcanics mineralization in the Winchospunta-Carhuamayo prospect reflects a highly dynamic hydrothermal system, controlled by tectono-magmatic processes and significant interaction with carbonates of the Chambará Formation. Geochemical analyses show enrichment in Fe₂O₃, V, Cu, and U, with REE profiles suggesting a geochemical inheritance from both magmatic sources and the hydrothermal environment. Comparisons with skarn and IOCG deposits, such as those described by Boothe [2] and Chen [7], indicate a convergence of typical characteristics of magmatic and hydrothermal systems, reinforcing the role of tectonics and fluids in the concentration of economically valuable elements. The similarity between the REE profiles of massive magnetite and marbles confirms geochemical transfer in metasomatic replacement environments. On the other hand, the lithological differentiation between gabbros and volcanics highlights local variability and its influence on the distribution of trace elements. These results underscore the potential of Winchospunta to host strategic metallic resources, while also highlighting the need for integrated research that combines geochemistry, isotopes, and tectonic modeling to optimize its exploration and development.
Author Contributions
Investigation, Redaction - Writing - original draft (T.P-I.); Data curation (N.M-F.).; Methodology - Supervision (J.C-F.); Conceptualization (T.A-A.); Formal analysis (R.M-C.); Software (F-M-O) and (R.R.-F.); Visualization (J.H); Validation (E.R-M.); Project administration (J.M-A).
Funding
This research received no external funding.
Institutional Review Board Statement
Not applicable.
Informed Consent Statement
Not applicable.
Data Availability Statement
The data are available after the first revision.
Conflicts of Interest
The authors declare no conflicts of interest.
References
- Mangum, A.L.; Carling, G.T.; Bickmore, B.R.; Webb, N.; Leifi, D.L.; Brahney, J.; Fernandez, D.P.; Rey, K.A.; Nelson, S.T.; Burgener, L.; et al. Characterizing variability in geochemistry and mineralogy of western US dust sources. Aeolian Res. 2024, 70-71, . [CrossRef]
- Boothe, T.J.; Mitchell, S.F.; Lentz, D.R. Magnetite geochemistry and mineralogy of iron skarn in the southern Wag Water Belt, Jamaica: Implications for ore genesis. J. Geochem. Explor. 2023, 254, . [CrossRef]
- Zulliger, G.A.; Florez, K. Geology and geochronology of the Pinaya mineral district: Magmatism and porphyry-style mineralization in the southern extension of the Andahuaylas-Yauri belt, Southern Peru. J. South Am. Earth Sci. 2023, 130, . [CrossRef]
- Hennig, D.; Lehmann, B.; Burgess, R.; Tak, M.A.N. Geology, geochemistry and 40Ar/39Ar ages of the Cerro Millo epithermal high-sulfidation gold prospect, southern Peru. Ore Geol. Rev. 2008, 34, 304–316, . [CrossRef]
- Li, R.; Chen, H.; Xia, X.; Yang, Q.; Danyushevsky, L.V.; Lai, C. Using integrated in-situ sulfide trace element geochemistry and sulfur isotopes to trace ore-forming fluids: Example from the Mina Justa IOCG deposit (southern Perú). 2018, 101, 165–179, . [CrossRef]
- Odino-Barreto, A.L.; Gómez-Peral, L.E.; Richiano, S.; Grande, M.M.; Borya, A.; Poiré, D.G.; Bahniuk, A.M.; Cury, L.F. Geochemical and mineralogical evidence of an offset in the Andean arc recorded in the Upper Cretaceous marine deposits of the Austral-Magallanes basin, Argentina. J. South Am. Earth Sci. 2021, 111, 103426, . [CrossRef]
- Chen, N.; Mao, J.; Zhang, Z.; Duan, Z.; Santos, A.; Li, H. Arc magmatic evolution and porphyry copper deposit formation under compressional regime: A geochemical perspective from the Toquepala arc in Southern Peru. Earth-Science Rev. 2023, 240, . [CrossRef]
- Martínez-Ardila, A.M.; Pompe, L.; Clausen, B.L.; Paterson, S.R.; Holk, G.J.; Luffi, P. A synthesis of the Peruvian Coastal Batholith: An exploration of temporal histories, causes of compositional diversity, and tectonomagmatic links in arcs. Lithos 2023, 456-457, . [CrossRef]
- Carrino, T.A.; Crósta, A.P.; Toledo, C.L.B.; Silva, A.M. Unveiling the hydrothermal mineralogy of the Chapi Chiara gold prospect, Peru, through reflectance spectroscopy, geochemical and petrographic data. Ore Geol. Rev. 2015, 64, 299–315, . [CrossRef]
- Thiéblemont, D.; Pascual, E.; Stein, G. Magmatism in the Iberian Pyrite Belt: petrological constraints on a metallogenic model. Miner. Deposita 1997, 33, 98–110, . [CrossRef]
- Moghadam AR, Lotfi M, Jafari MR, Ardalan AA, Moghaddam MP, Yazdi A. Economic Geology, Petrology and Environmental of Copper Ore Deposits of Chagho in South West Karaj. Rev Geoaraguaia. 2021;11(1):7–26.
- Sánchez-Beristain F, Simon K, Pérez-Cruz L, García-Barrera P, López-Esquivel Kranksth L, Urrutia-Fucgauchi J, et al. The use of LA-ICP-MS in a pilot study for determining the concentration of selected trace elements in rudist shells. Boletín Geológico y Min. 2015;126(1):159–68.
- Zapata Montes AA, Sánchez Fernández AW, Carrasco Viza SR, Cardona Molina A, Galdos Huaco J, Cerrón Zeballos F, et al. The Lower Carboniferous of the western edge of Gondwana in Peru and Bolivia: distribution of sedimentary basins and associated magmatism. 2005;
- Martínez Valladares W, Monge Miguel RW. Estratigrafía del Paleozoico de la Cordillera Oriental al sureste del Perú, frontera Perú-Bolivia. 2000;
- Quispe Cangana JL, Carlotto Caillaux VS, Rodríguez Mejía R, Huanacuni Mamani D. Informe sobre la metalogenia del Perú central-norte. 2007;
- Rosas S, Ritterbush K, Bottjer D, Corsetti F, West J, Berelson W, et al. Profundización sedimentaria solo en la parte de la cuenca Pucará (Perú Central) durante el Hetangiano Sinemuriano. In: Resúmenes del XVIII Congreso Peruano de Geología, Sociedad Geológica del Perú, Lima. 2016. p. 1–4.
- Ramos Canales S. Almacenamiento de dióxido de carbono (CO2) en rocas ofiolíticas de composición máficas (gabro y basalto) bajo condiciones controladas-Lima, 2018. 2018;
- Rollinson HR. Using geochemical data: evaluation, presentation, interpretation. Routledge; 2014.
- Jenner, G.; Longerich, H.; Jackson, S.; Fryer, B. ICP-MS — A powerful tool for high-precision trace-element analysis in Earth sciences: Evidence from analysis of selected U.S.G.S. reference samples. 2003, 83, 133–148, . [CrossRef]
- Eggins, S.M.; Woodhead, J.D.; Kinsley, L.P.J.; Mortimer, G.E.; Sylvester, P.; McCulloch, M.T.; Hergt, J.M.; Handler, M.R. A simple method for the precise determination of ≥ 40 trace elements in geological samples by ICPMS using enriched isotope internal standardisation. Chem. Geol. 1997, 134, 311–326, . [CrossRef]
- Cortés JJG, Ramírez RH. Estadística descriptiva. Trillas; 1999.
- Das, K.R.; Imon, A.H.M.R. A Brief Review of Tests for Normality. Am. J. Theor. Appl. Stat. 2016, 5, 5, . [CrossRef]
- ztuna D, Elhan AH, Tüccar E. Investigation of four different normality tests in terms of type 1 error rate and power under different distributions. Turkish J Med Sci. 2006;36(3):171–6.
- Sunkari, E.D.; Nkansah, J.; Adams, S.J. Geochemical exploration for tantalum in coltan-rich pegmatites at Bewadze-Mankoadze area of the Kibi-Winneba Belt, southern Ghana: Constraints from exploratory data analysis. Heliyon 2024, 10, e38176, . [CrossRef]
- Davis JC, Sampson RJ. Statistics and data analysis in geology. Vol. 646. Wiley New York; 1986.
- Tassinari, C.C.; Castroviejo, R.; Rodrigues, J.F.; Acosta, J.; Pereira, E. A Neoproterozoic age for the chromitite and gabbro of the Tapo ultramafic Massif, Eastern Cordillera, Central Peru and its tectonic implications. J. South Am. Earth Sci. 2011, 32, 429–437, . [CrossRef]
- Peng H, Hou L, Sun C, Zou H, Wang T-R, Ma Z-Z. Geochemistry of magnetite from the Hongniu–Hongshan Cu skarn deposit in Yunnan Province, SW China. Ore Geol Rev. 2021;136:104237.
- Sun, X.-H.; Tang, H.-S.; Luan, Y.; Chen, J.-H. Geochronological constraints on the genesis of high-grade iron ore in the Gongchangling BIFs from the Anshan-Benxi area, North China Craton. Ore Geol. Rev. 2020, 122, 103504, . [CrossRef]
- Samal, A.K.; Srivastava, R.K.; Upadhyay, D. Major, Trace, and Rare-Earth Element Geochemistry of Nb-V Rich Andradite-Schorlomite-Morimotoite Garnet from Ambadungar-Saidivasan Alkaline Carbonatite Complex, India: Implication for the Role of Hydrothermal Fluid-Induced Metasomatism. Minerals 2021, 11, 756, . [CrossRef]
- Wang, Y.; Zhu, X.; Tang, C.; Mao, J.; Chang, Z. Discriminate between magmatic- and magmatic-hydrothermal ore deposits using Fe isotopes. Ore Geol. Rev. 2021, 130, . [CrossRef]
- de Oliveira SB, Johnson CA, Juliani C, Monteiro LVS, Leach DL, Caran MGN. Geology and genesis of the Shalipayco evaporite-related Mississippi Valley-type Zn–Pb deposit, Central Peru: 3D geological modeling and C–O–S–Sr isotope constraints. Miner Depos. 2021;56:1543–62.
- Hu, X.; Xiao, B.; Jiang, H.; Huang, J. Magnetite texture and trace element evolution in the Shaquanzi Fe-Cu deposit, Eastern Tianshan, NW China. Ore Geol. Rev. 2023, 154, . [CrossRef]
- Mendes, T.L.; Leão-Santos, M.H.; Tabosa, L.F.C.; Borges, W.R.; Alves, C.d.S.; Suita, M.T.d.F. Airborne geophysics, petrophysics, geochemistry and geology of Ni-Cu (Co-Au-PGE) footprints to define exploration targets in mafic-ultramafic rocks. J. South Am. Earth Sci. 2023, 133, . [CrossRef]
- Liang, P.; Wu, C.; Hu, X.; Xie, Y. Textures and geochemistry of magnetite: Indications for genesis of the Late Paleozoic Laoshankou Fe-Cu-Au deposit, NW China. 2020, 124, 103632, . [CrossRef]
- Mei W, Lü X, Wang X, Jiang M, Fan X, Wang S, et al. Geochemistry of magnetite from the Huanggang skarn iron–tin polymetallic deposit in the southern Great Xing’an Range, NE China. Geol J. 2018;53(3):1200–1.
Figure 1.
Location map of study area.
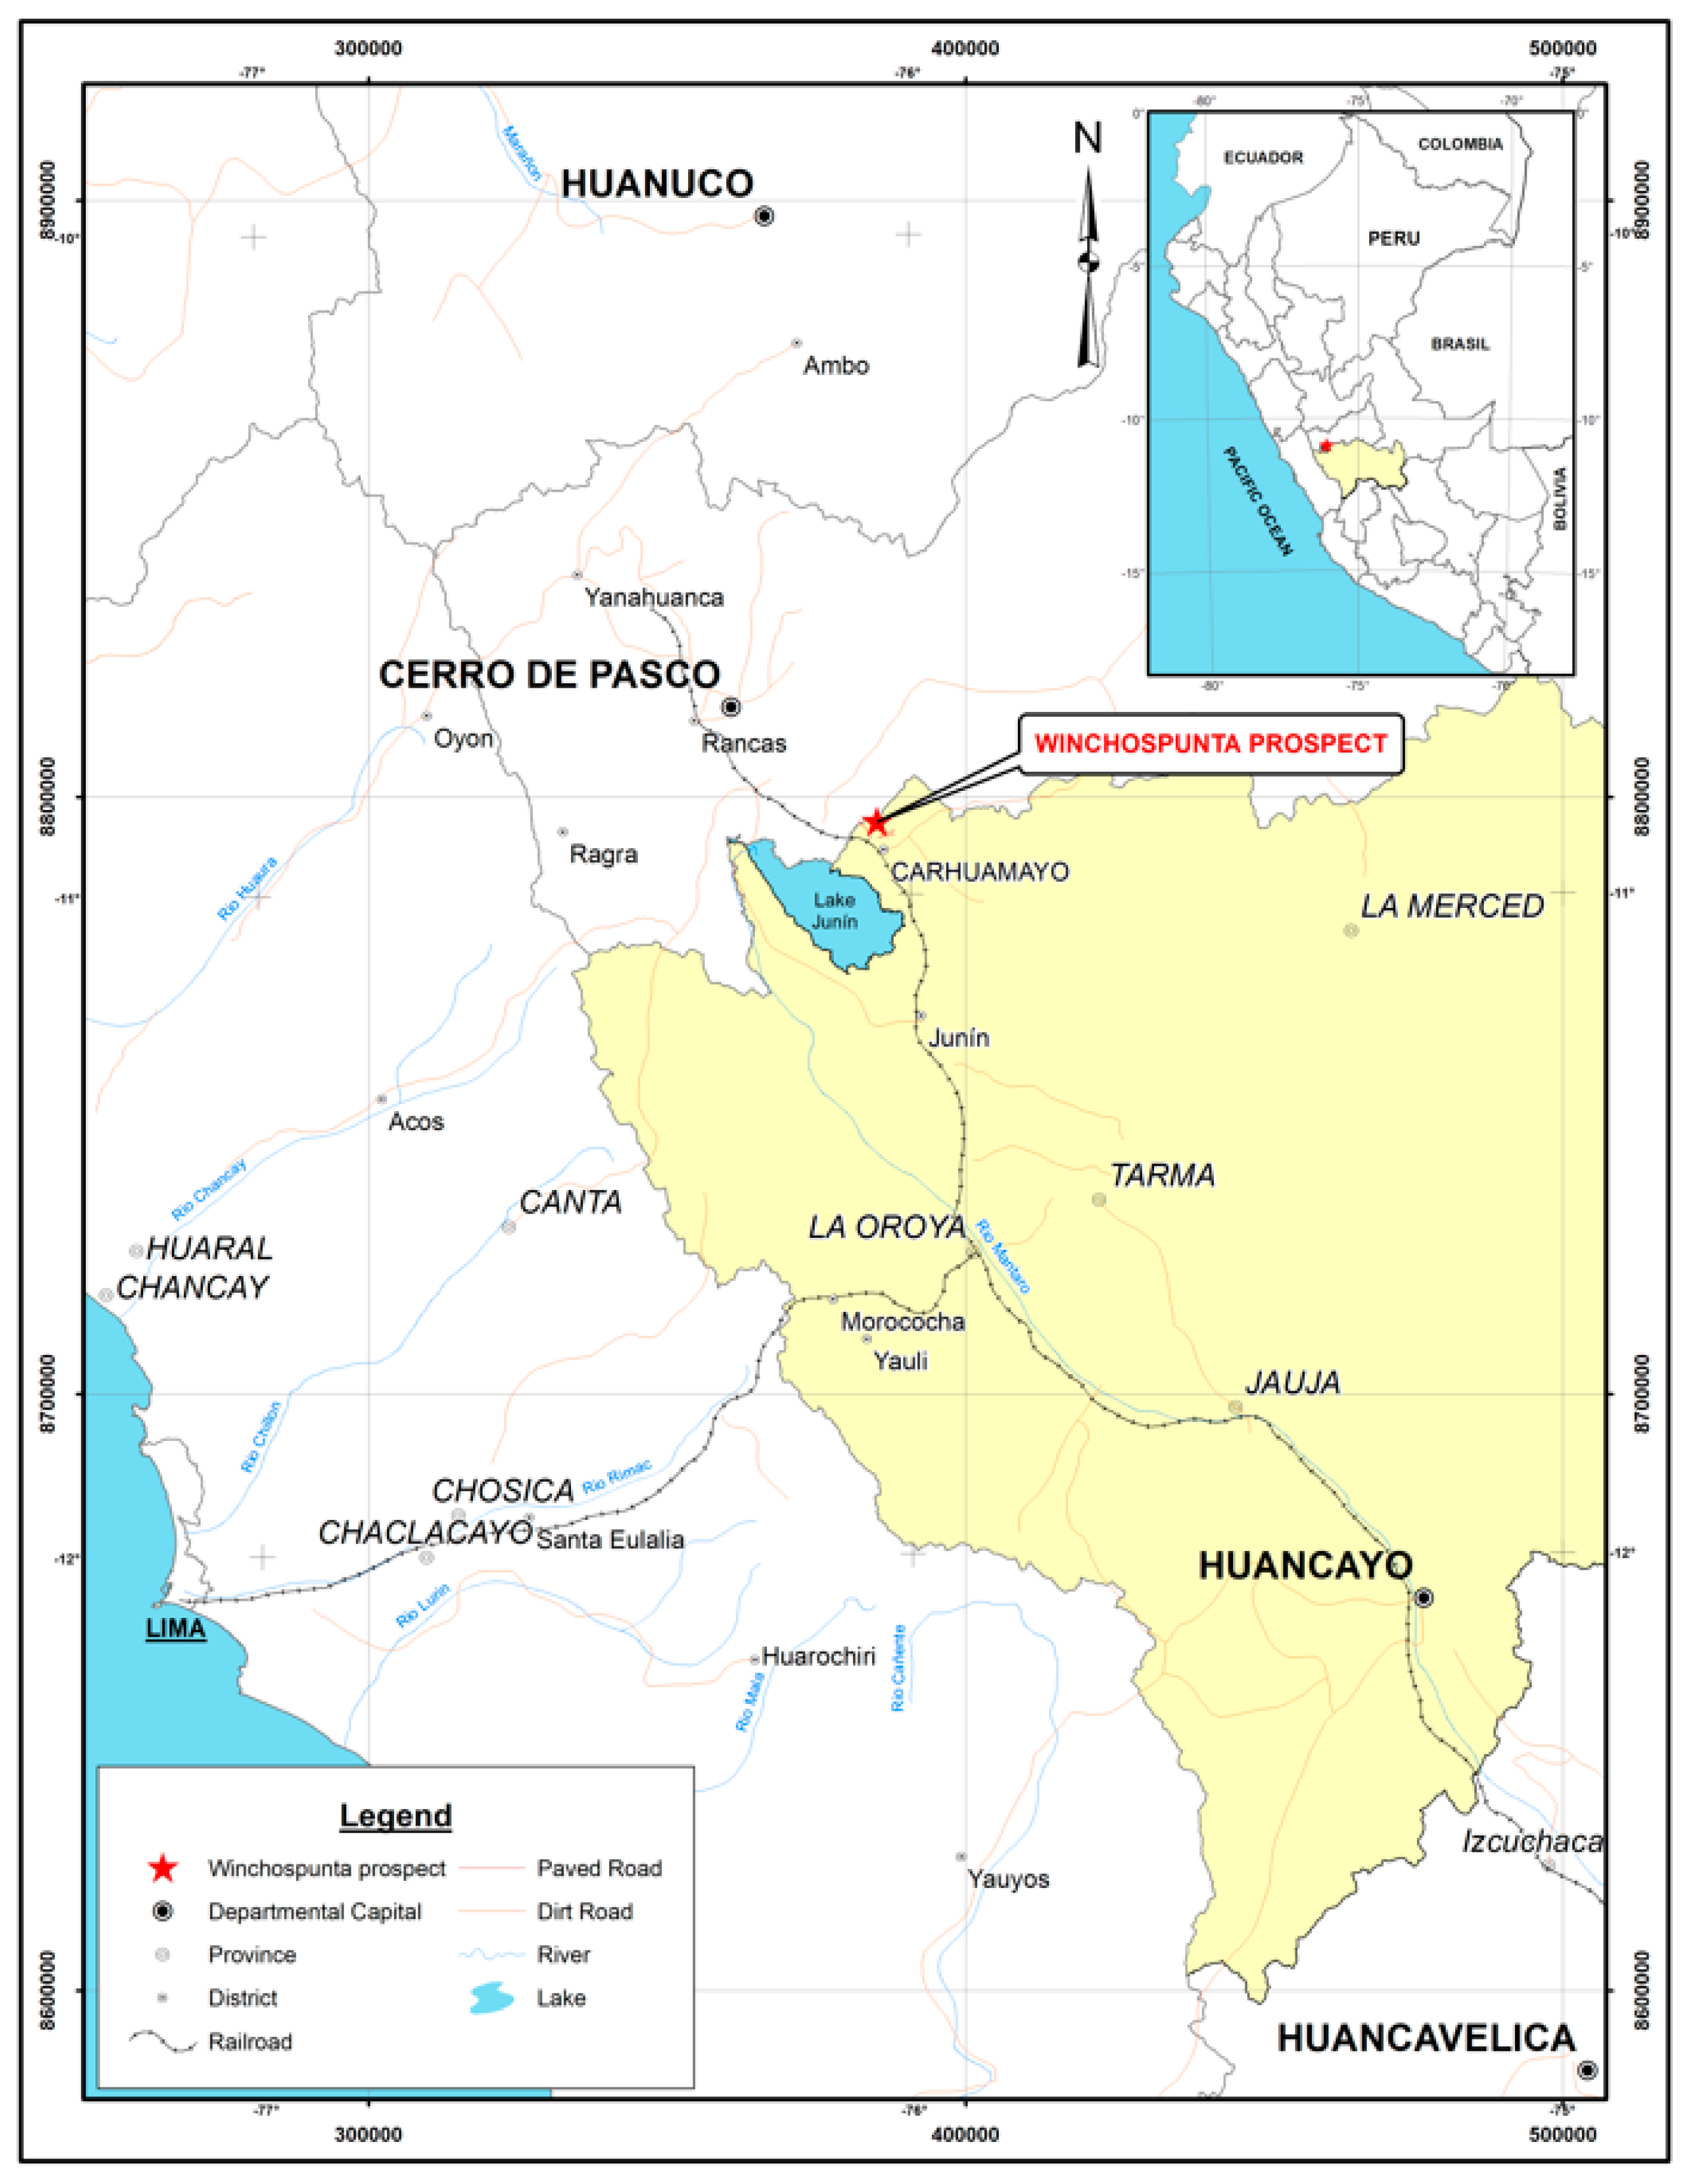
Figure 3.
a. Massive magnetite of Fe oxides. In contact with gabbro. Looking south; b. Massive magnetite with impregnations of Fe oxides; c. Massive magnetite with calcite relics; d. Massive magnetite of Fe oxides, in contact with gabbro and limestone. Looking north; e. Marble with pyrite points, quartz, magnetite patches; f. Jarosite, goethite, and hematite oxides.
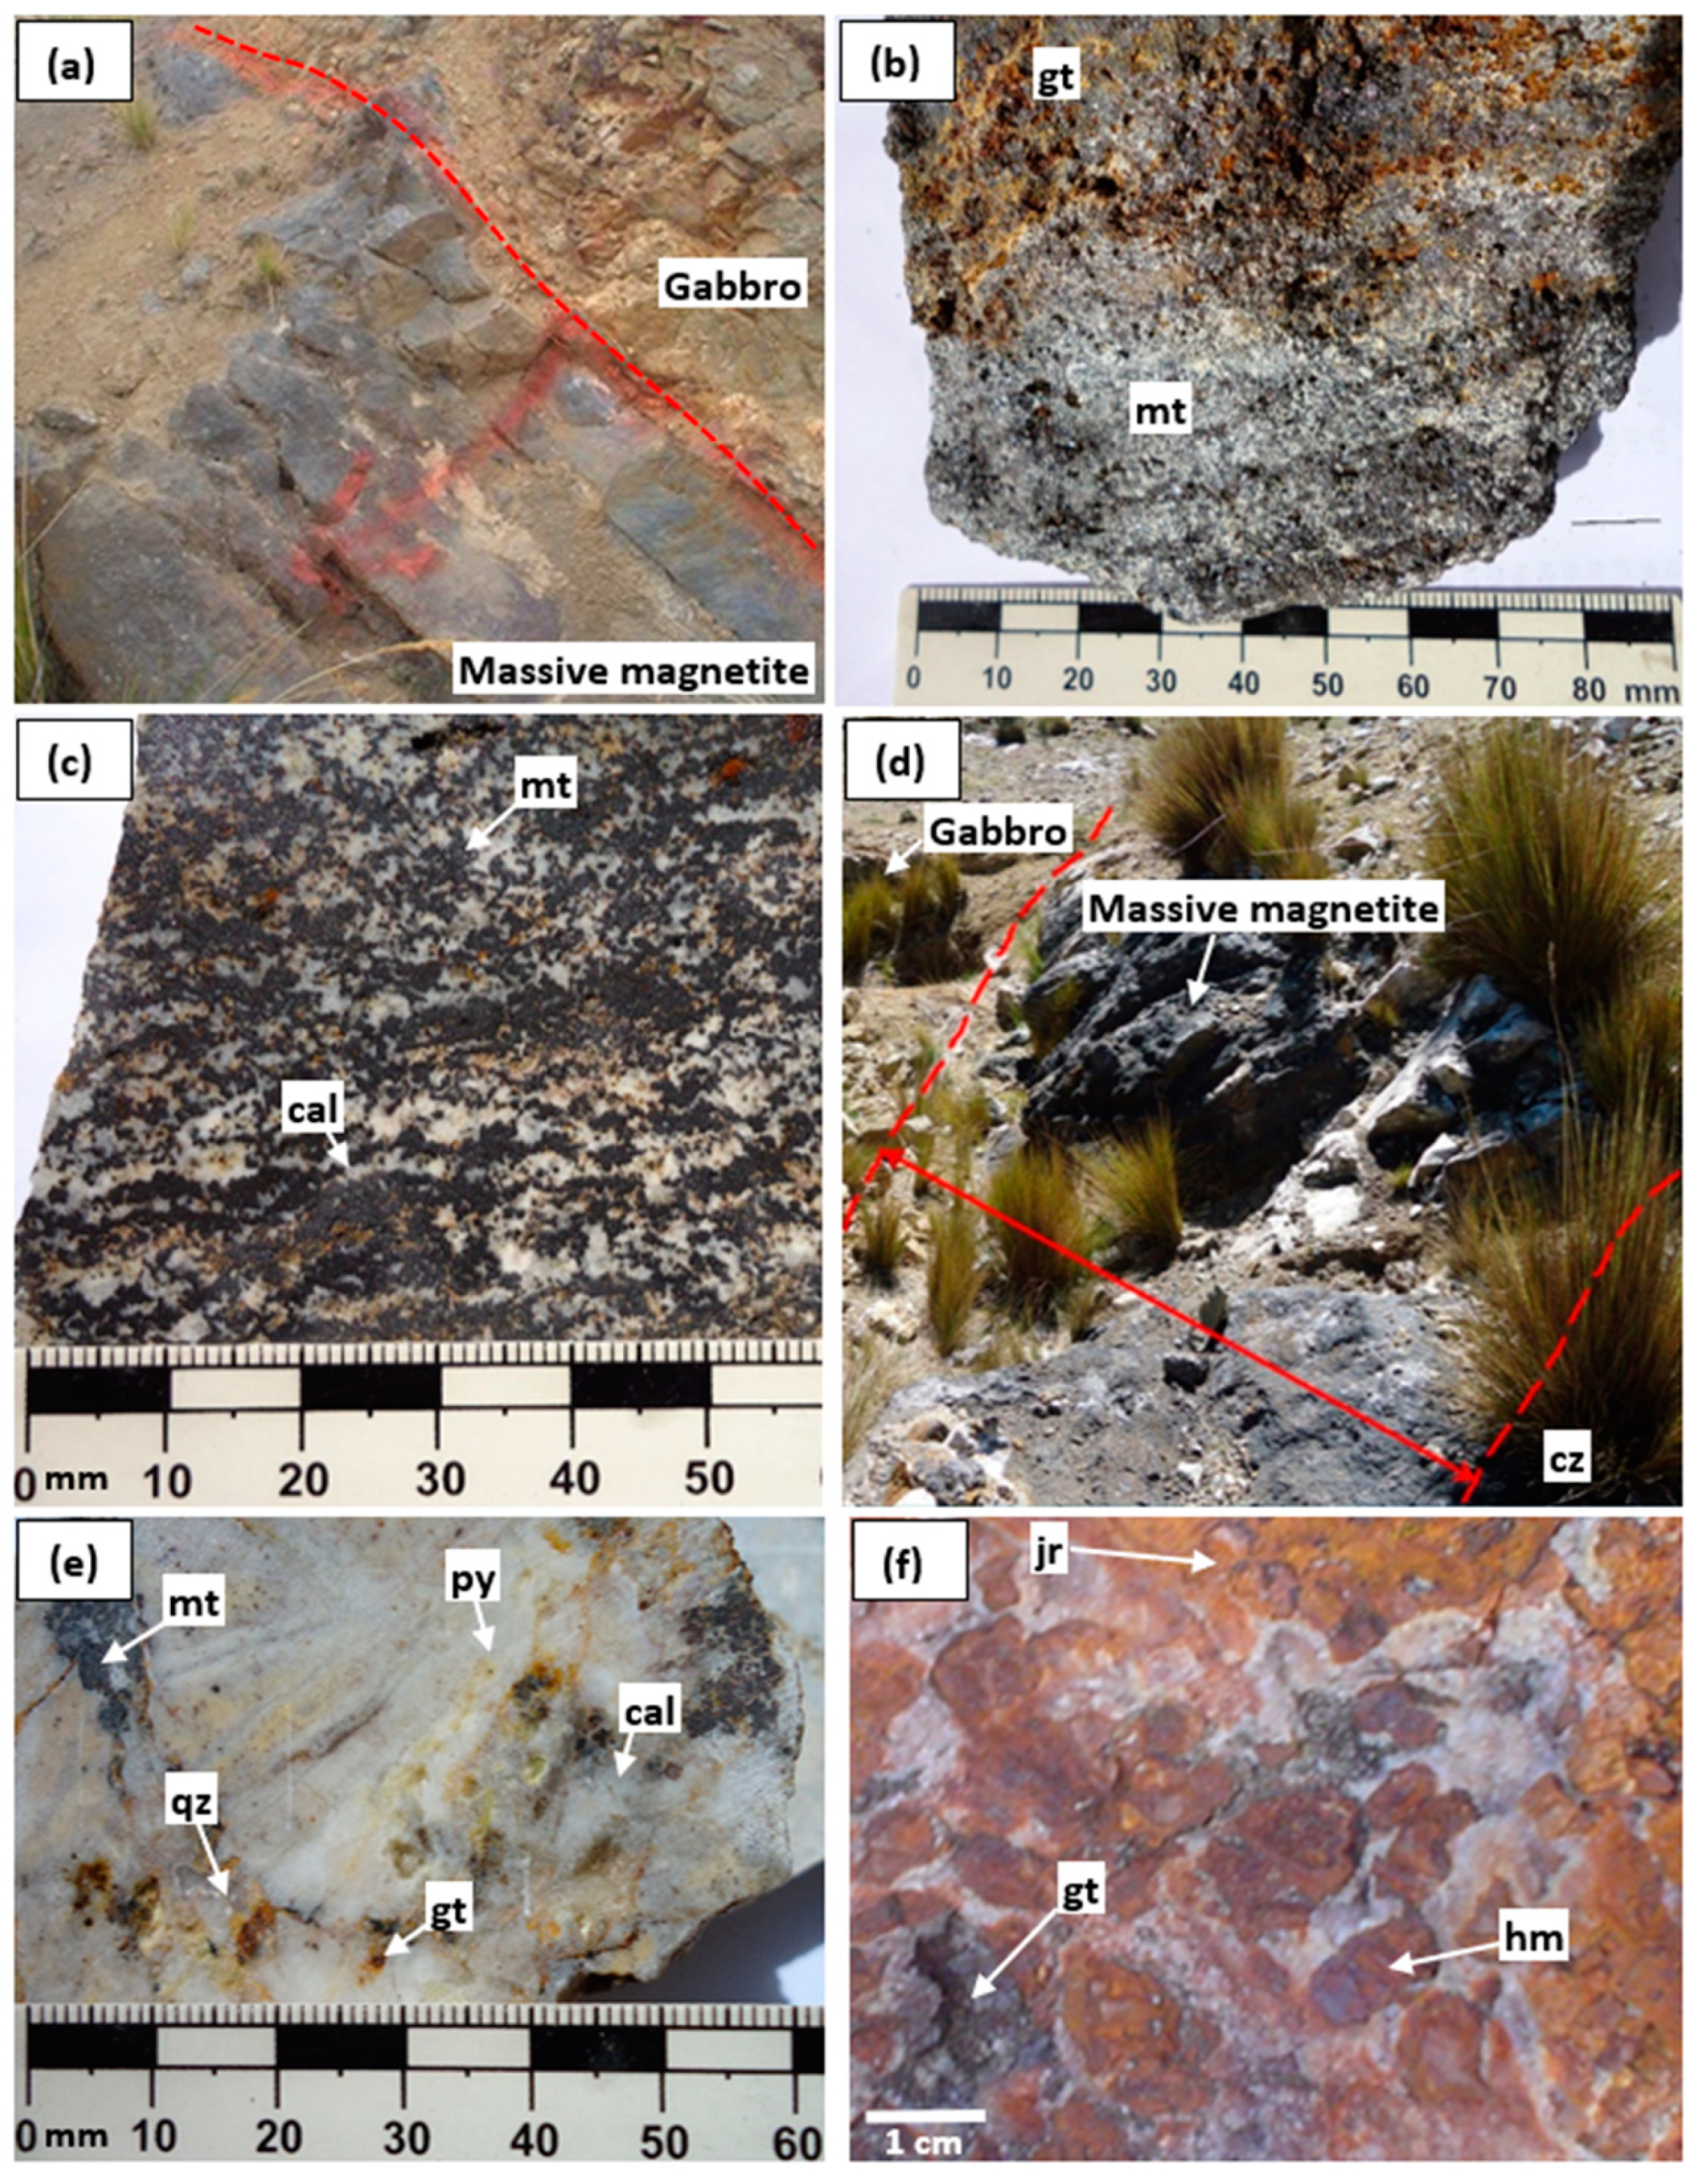
Figure 4.
a. Moderate propylitization in gabbro; b. Sericitization and moderate propylitization; c and d. Recrystallized limestone; e. Serpentine; f. Marble with pyrolusite impregnations.
Figure 4.
a. Moderate propylitization in gabbro; b. Sericitization and moderate propylitization; c and d. Recrystallized limestone; e. Serpentine; f. Marble with pyrolusite impregnations.
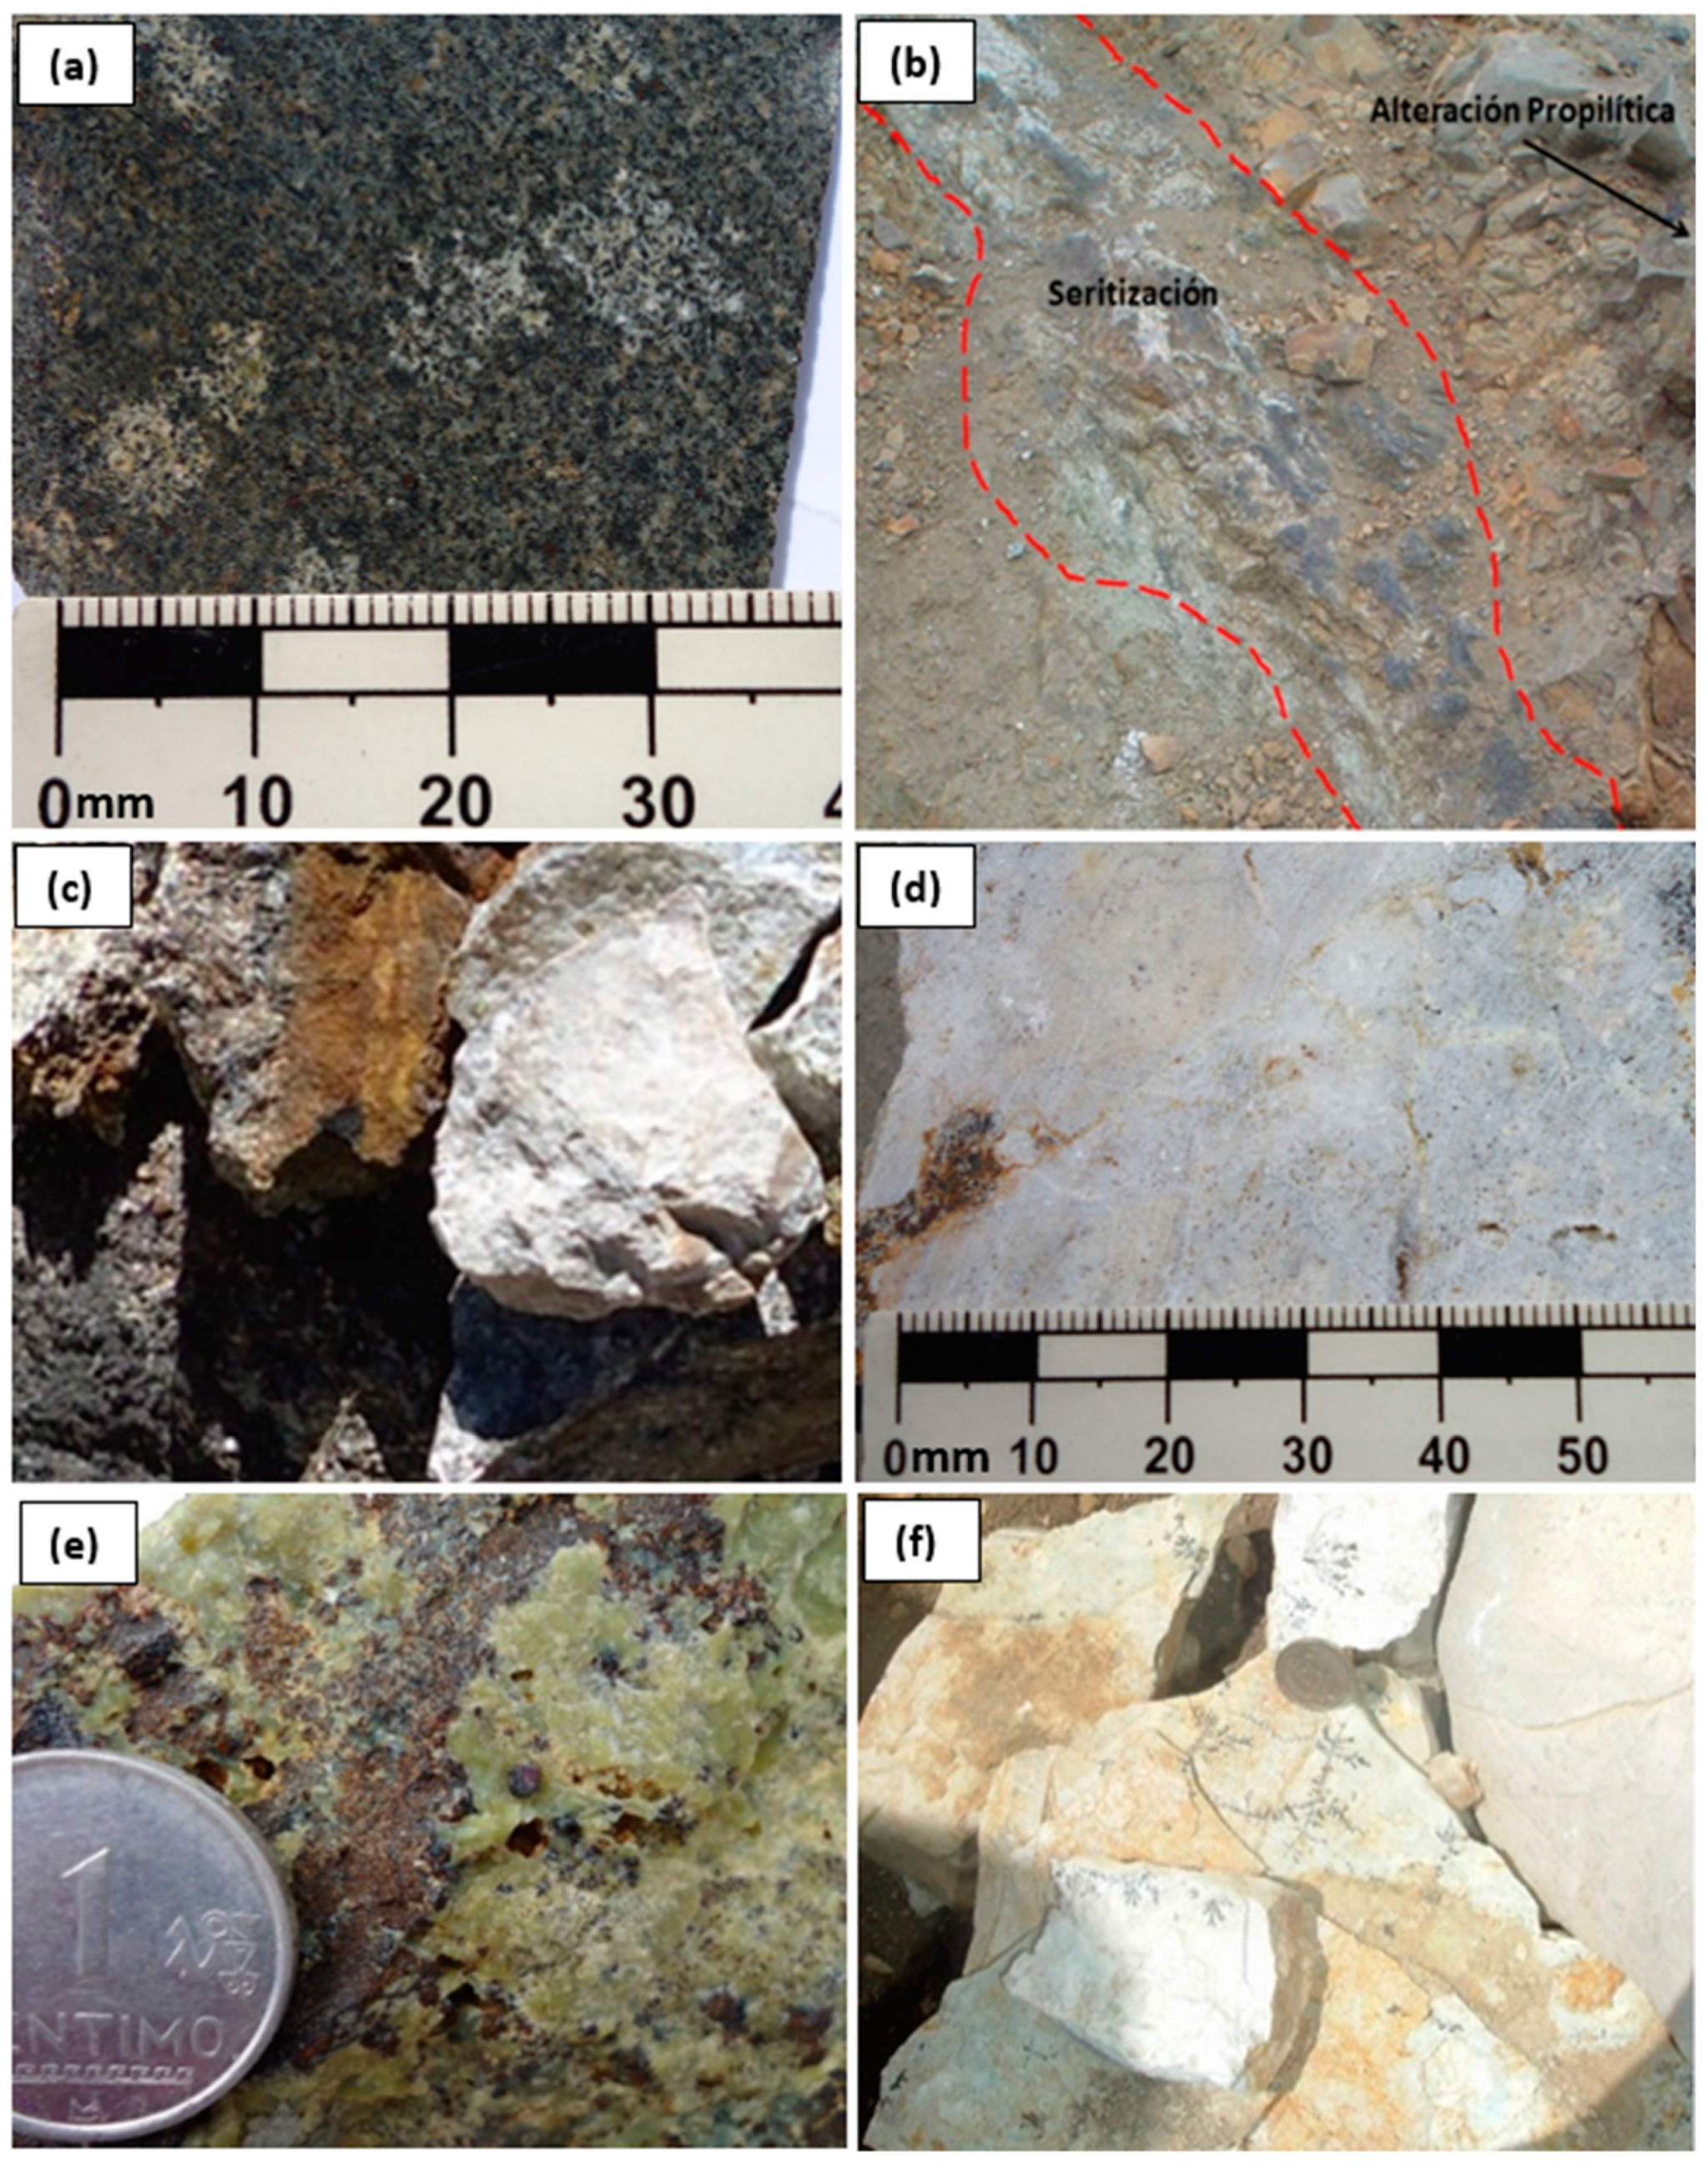
Figure 5.
Box plot showing minor elements concentrations from geochemical analysis; a. Massive Magnetite; b. Winchos Gabbro; c. Mitu Volcanics; d. Geological Environment.
Figure 5.
Box plot showing minor elements concentrations from geochemical analysis; a. Massive Magnetite; b. Winchos Gabbro; c. Mitu Volcanics; d. Geological Environment.

Figure 6.
Box plot showing major elements concentrations from geochemical analysis; a. Massive Magnetite; b. Winchos Gabbro; c. Mitu Volcanics; d. Geological Environment.
Figure 6.
Box plot showing major elements concentrations from geochemical analysis; a. Massive Magnetite; b. Winchos Gabbro; c. Mitu Volcanics; d. Geological Environment.
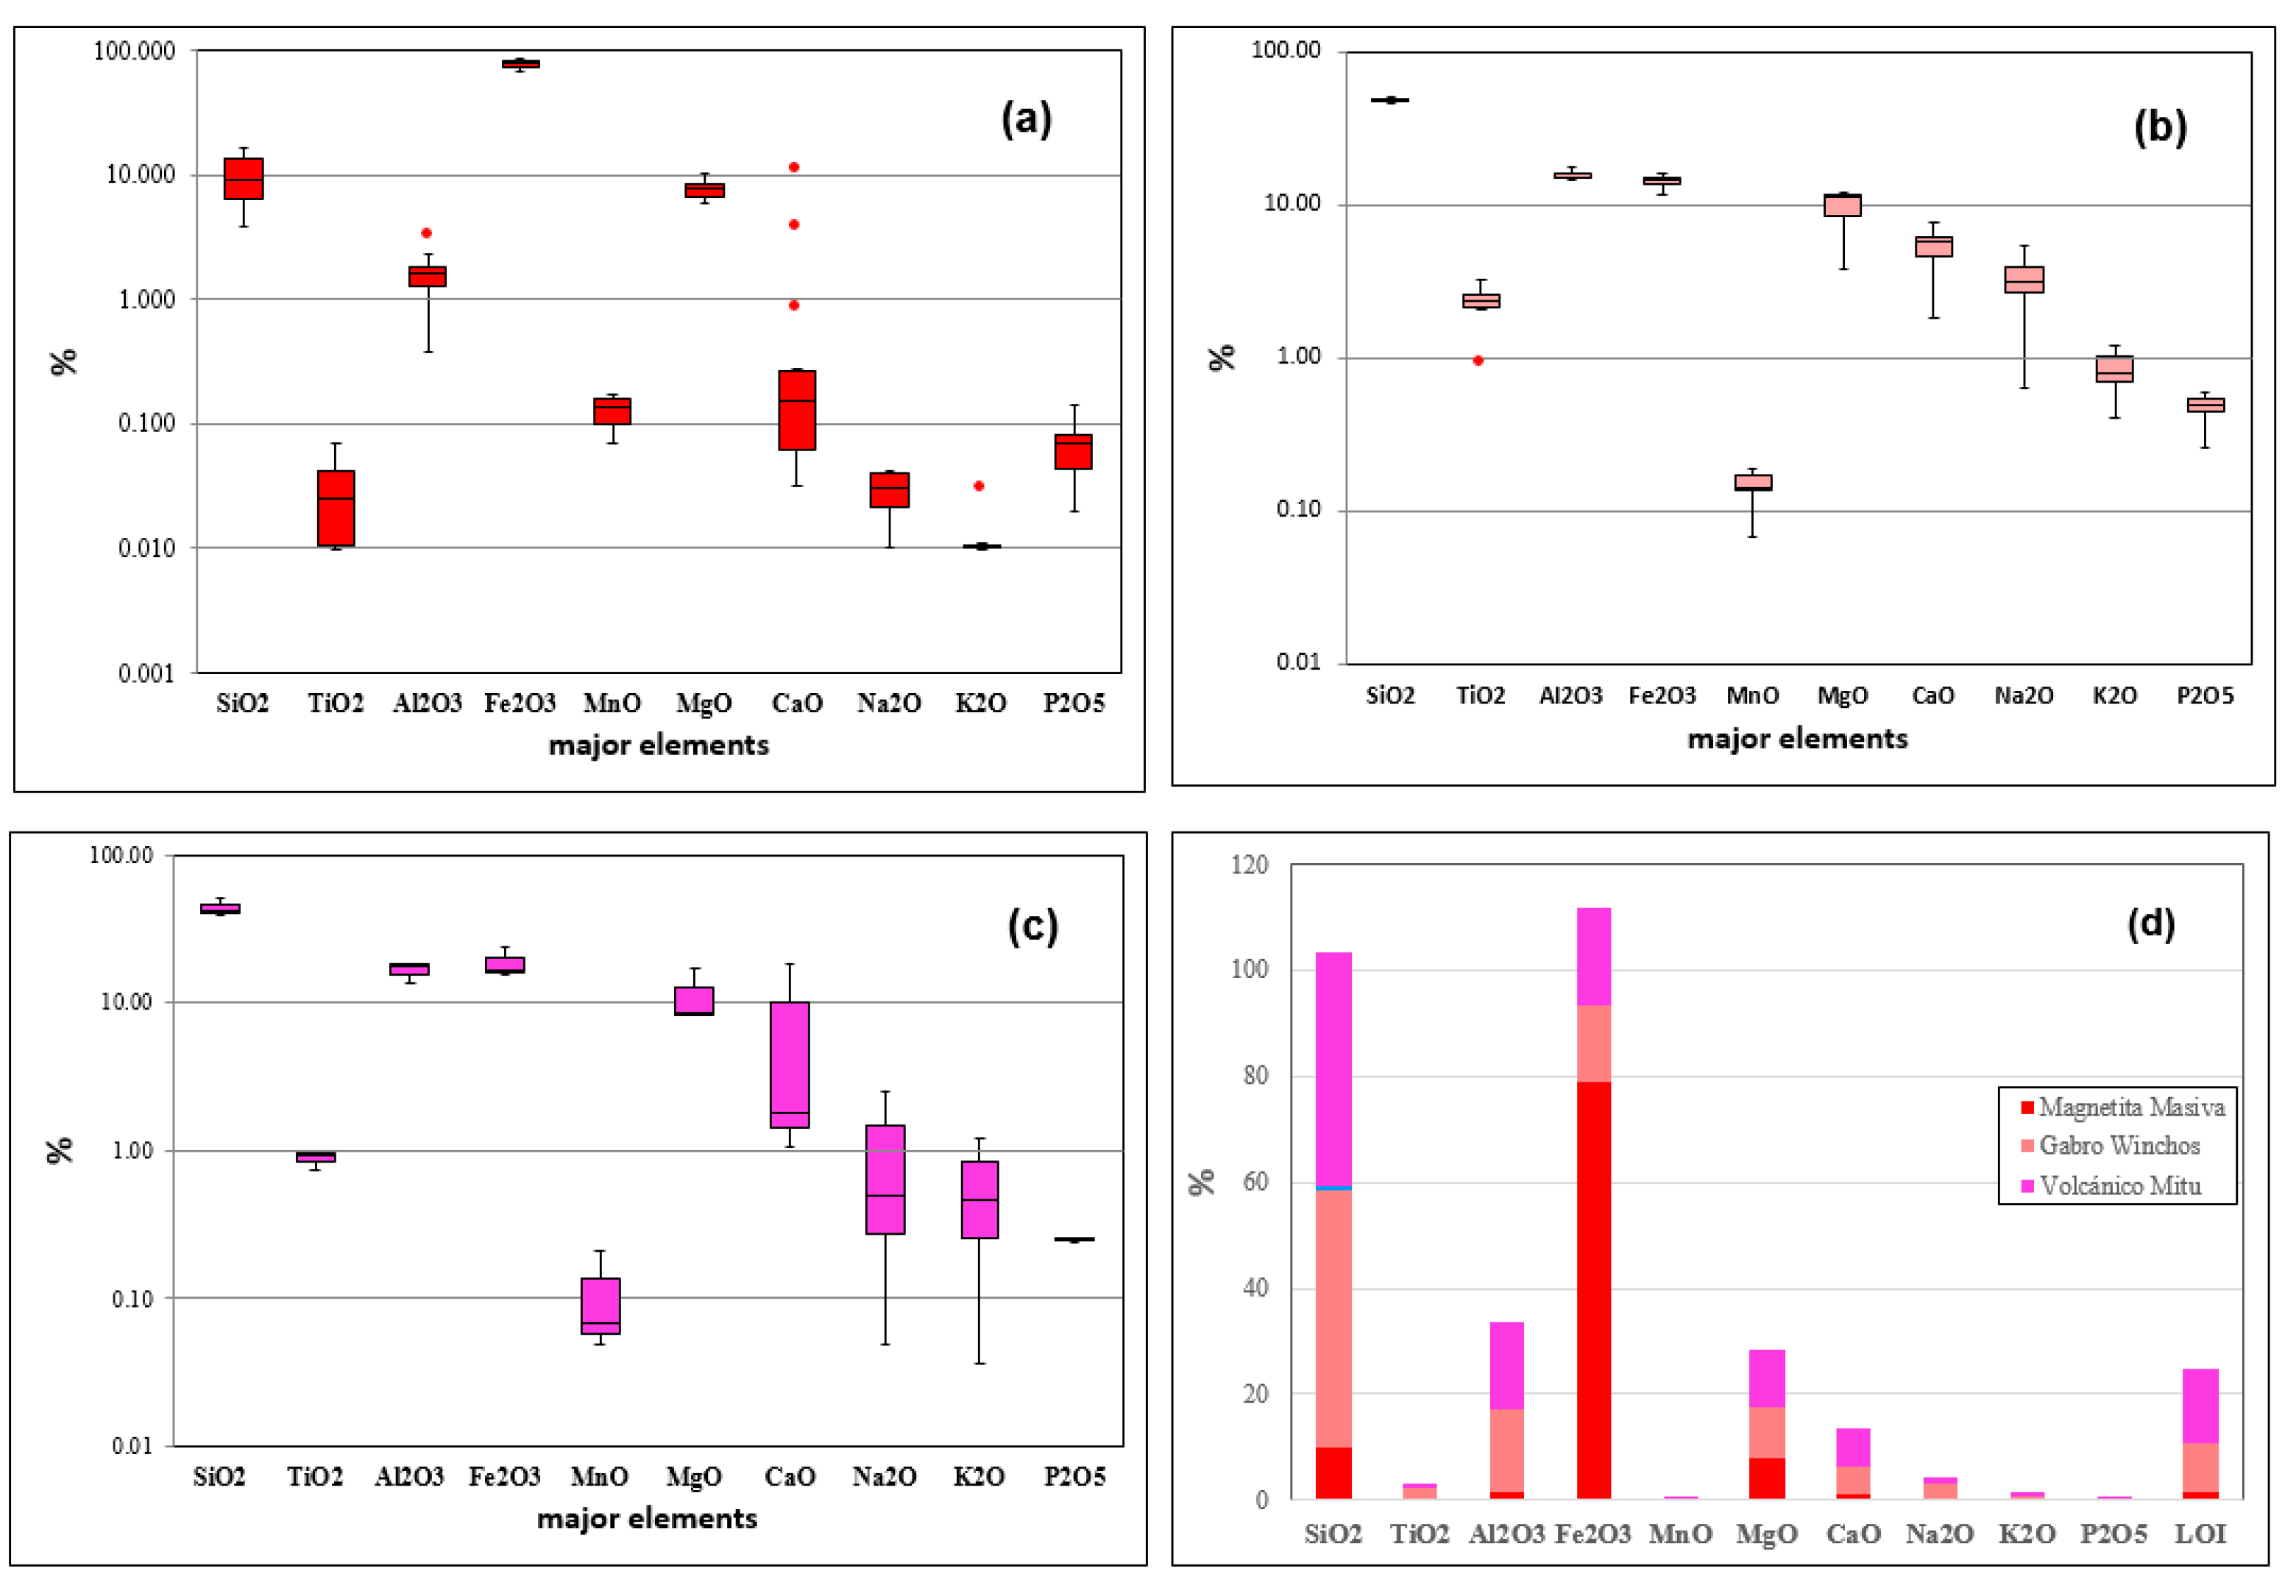
Figure 7.
(%) Carbonates; a. Massive Magnetite; b. Winchos Gabbro; c. Mitu Volcanics; d. Geological Environment.
Figure 7.
(%) Carbonates; a. Massive Magnetite; b. Winchos Gabbro; c. Mitu Volcanics; d. Geological Environment.
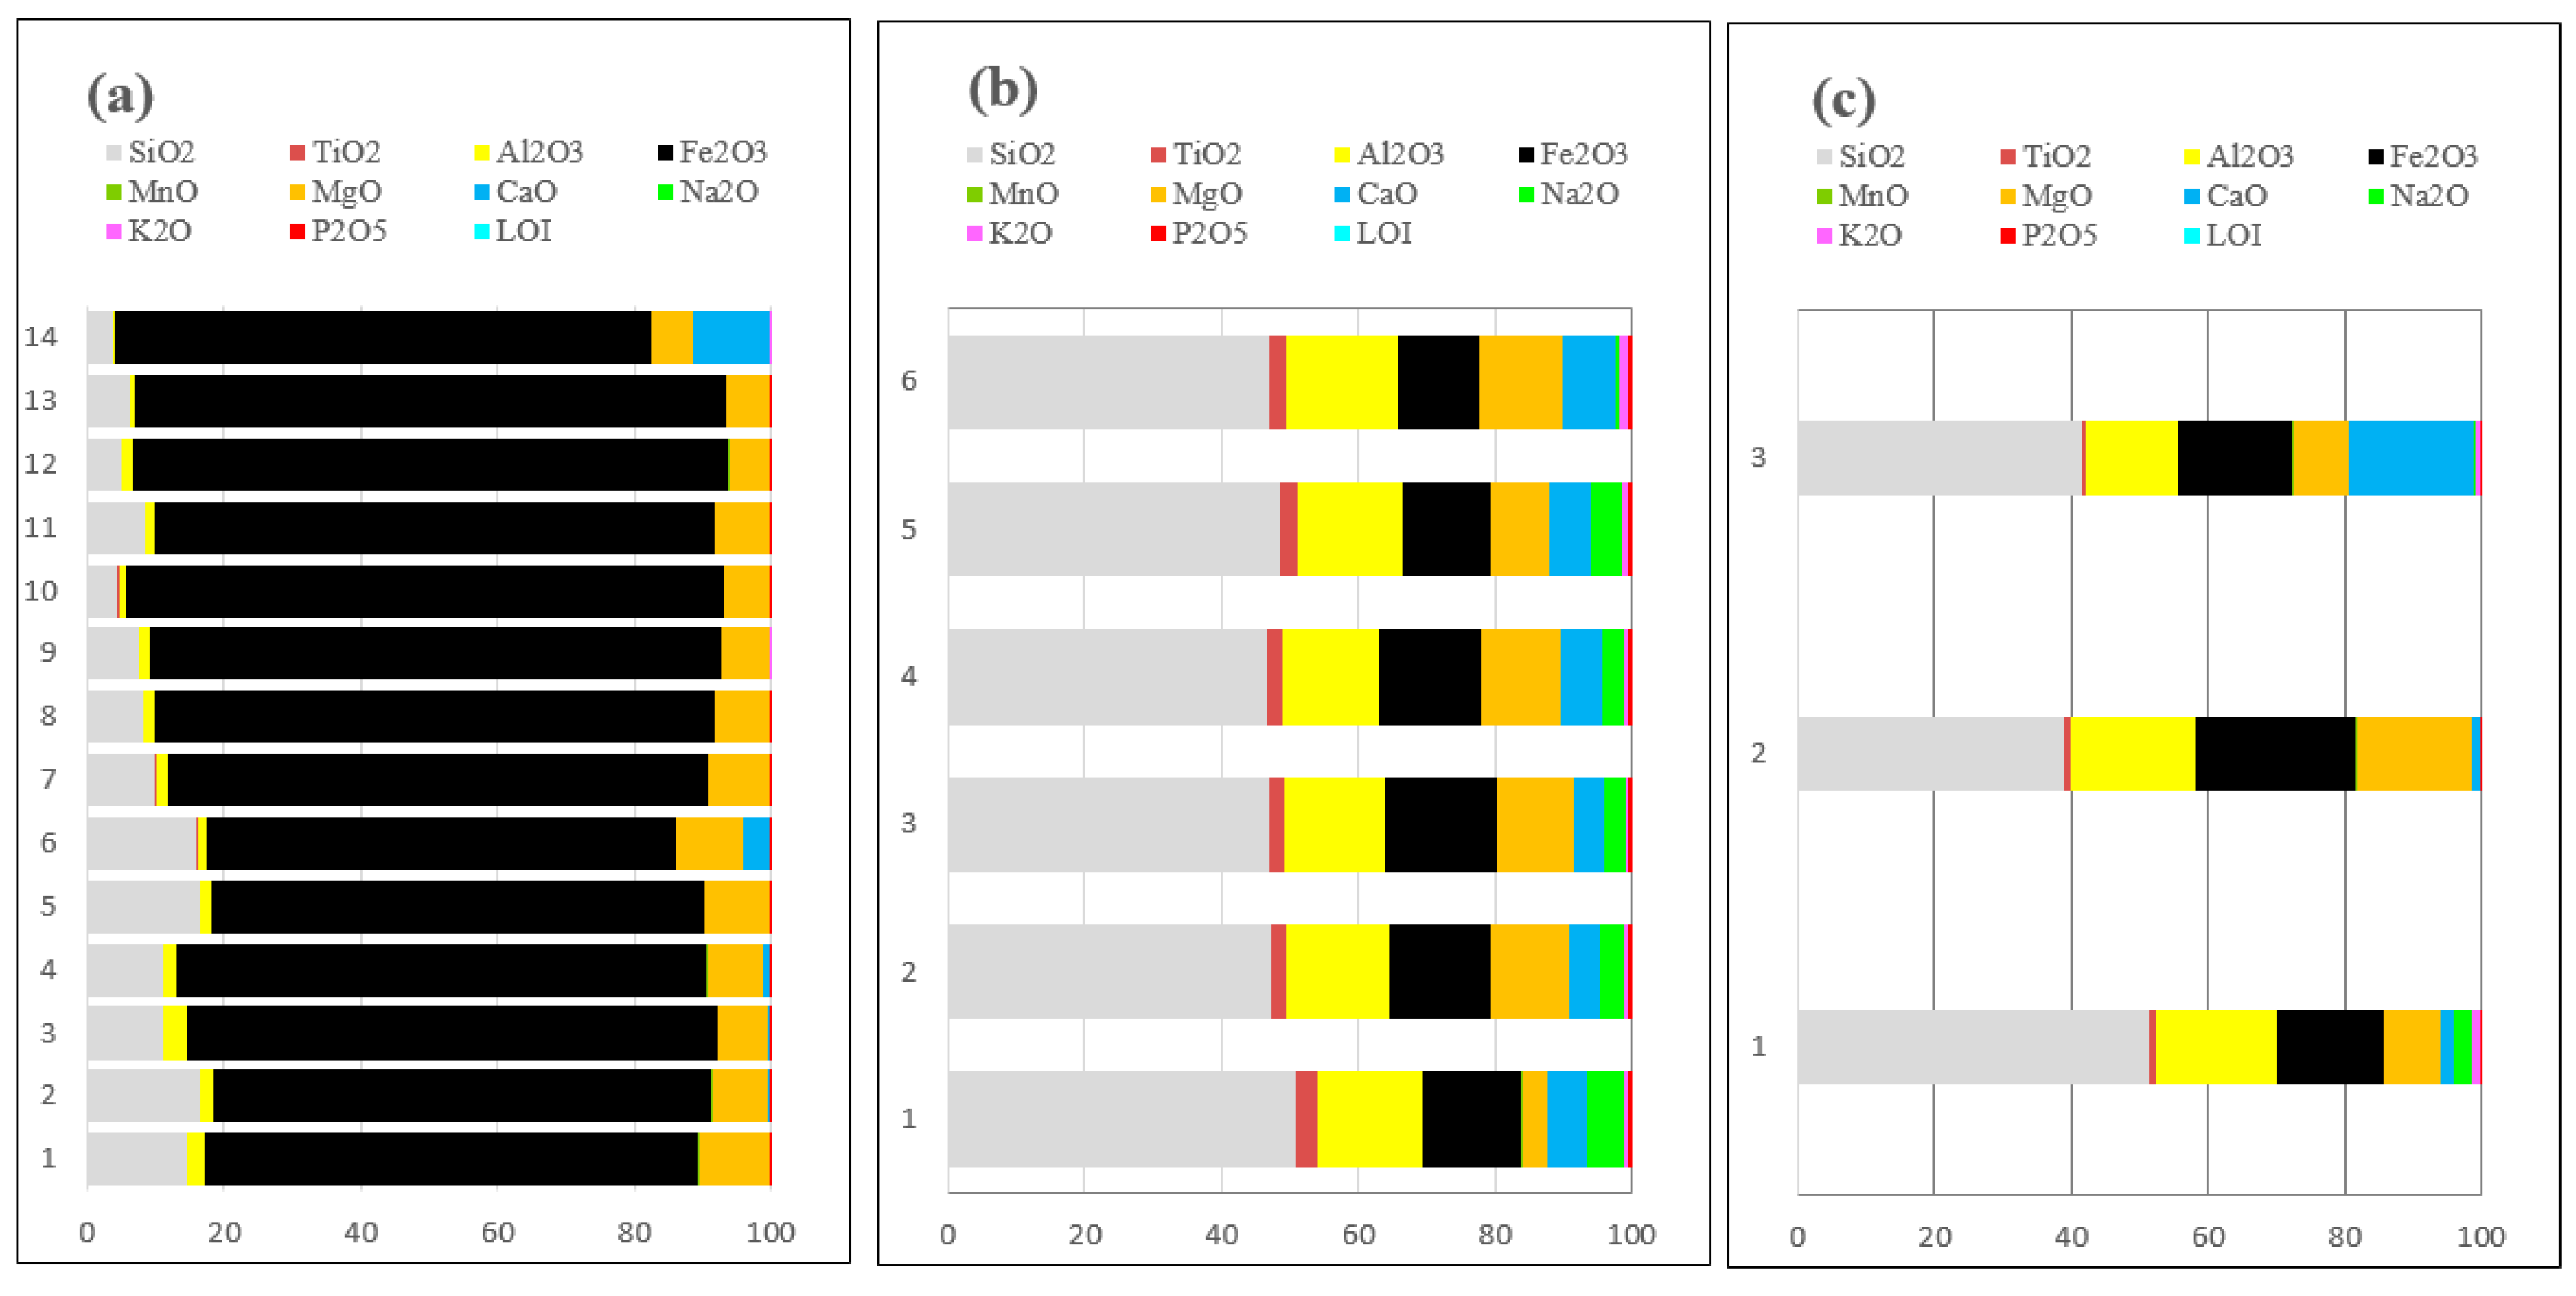
Figure 8.
Chondrites; a. Concentration Profiles of Minor and Trace Elements of the Rocks from the Winchospunta-Carhuamayo Prospect; b. Rare Earth Element (REE) concentration profiles of the Gabbro normalized to chondrite values.
Figure 8.
Chondrites; a. Concentration Profiles of Minor and Trace Elements of the Rocks from the Winchospunta-Carhuamayo Prospect; b. Rare Earth Element (REE) concentration profiles of the Gabbro normalized to chondrite values.
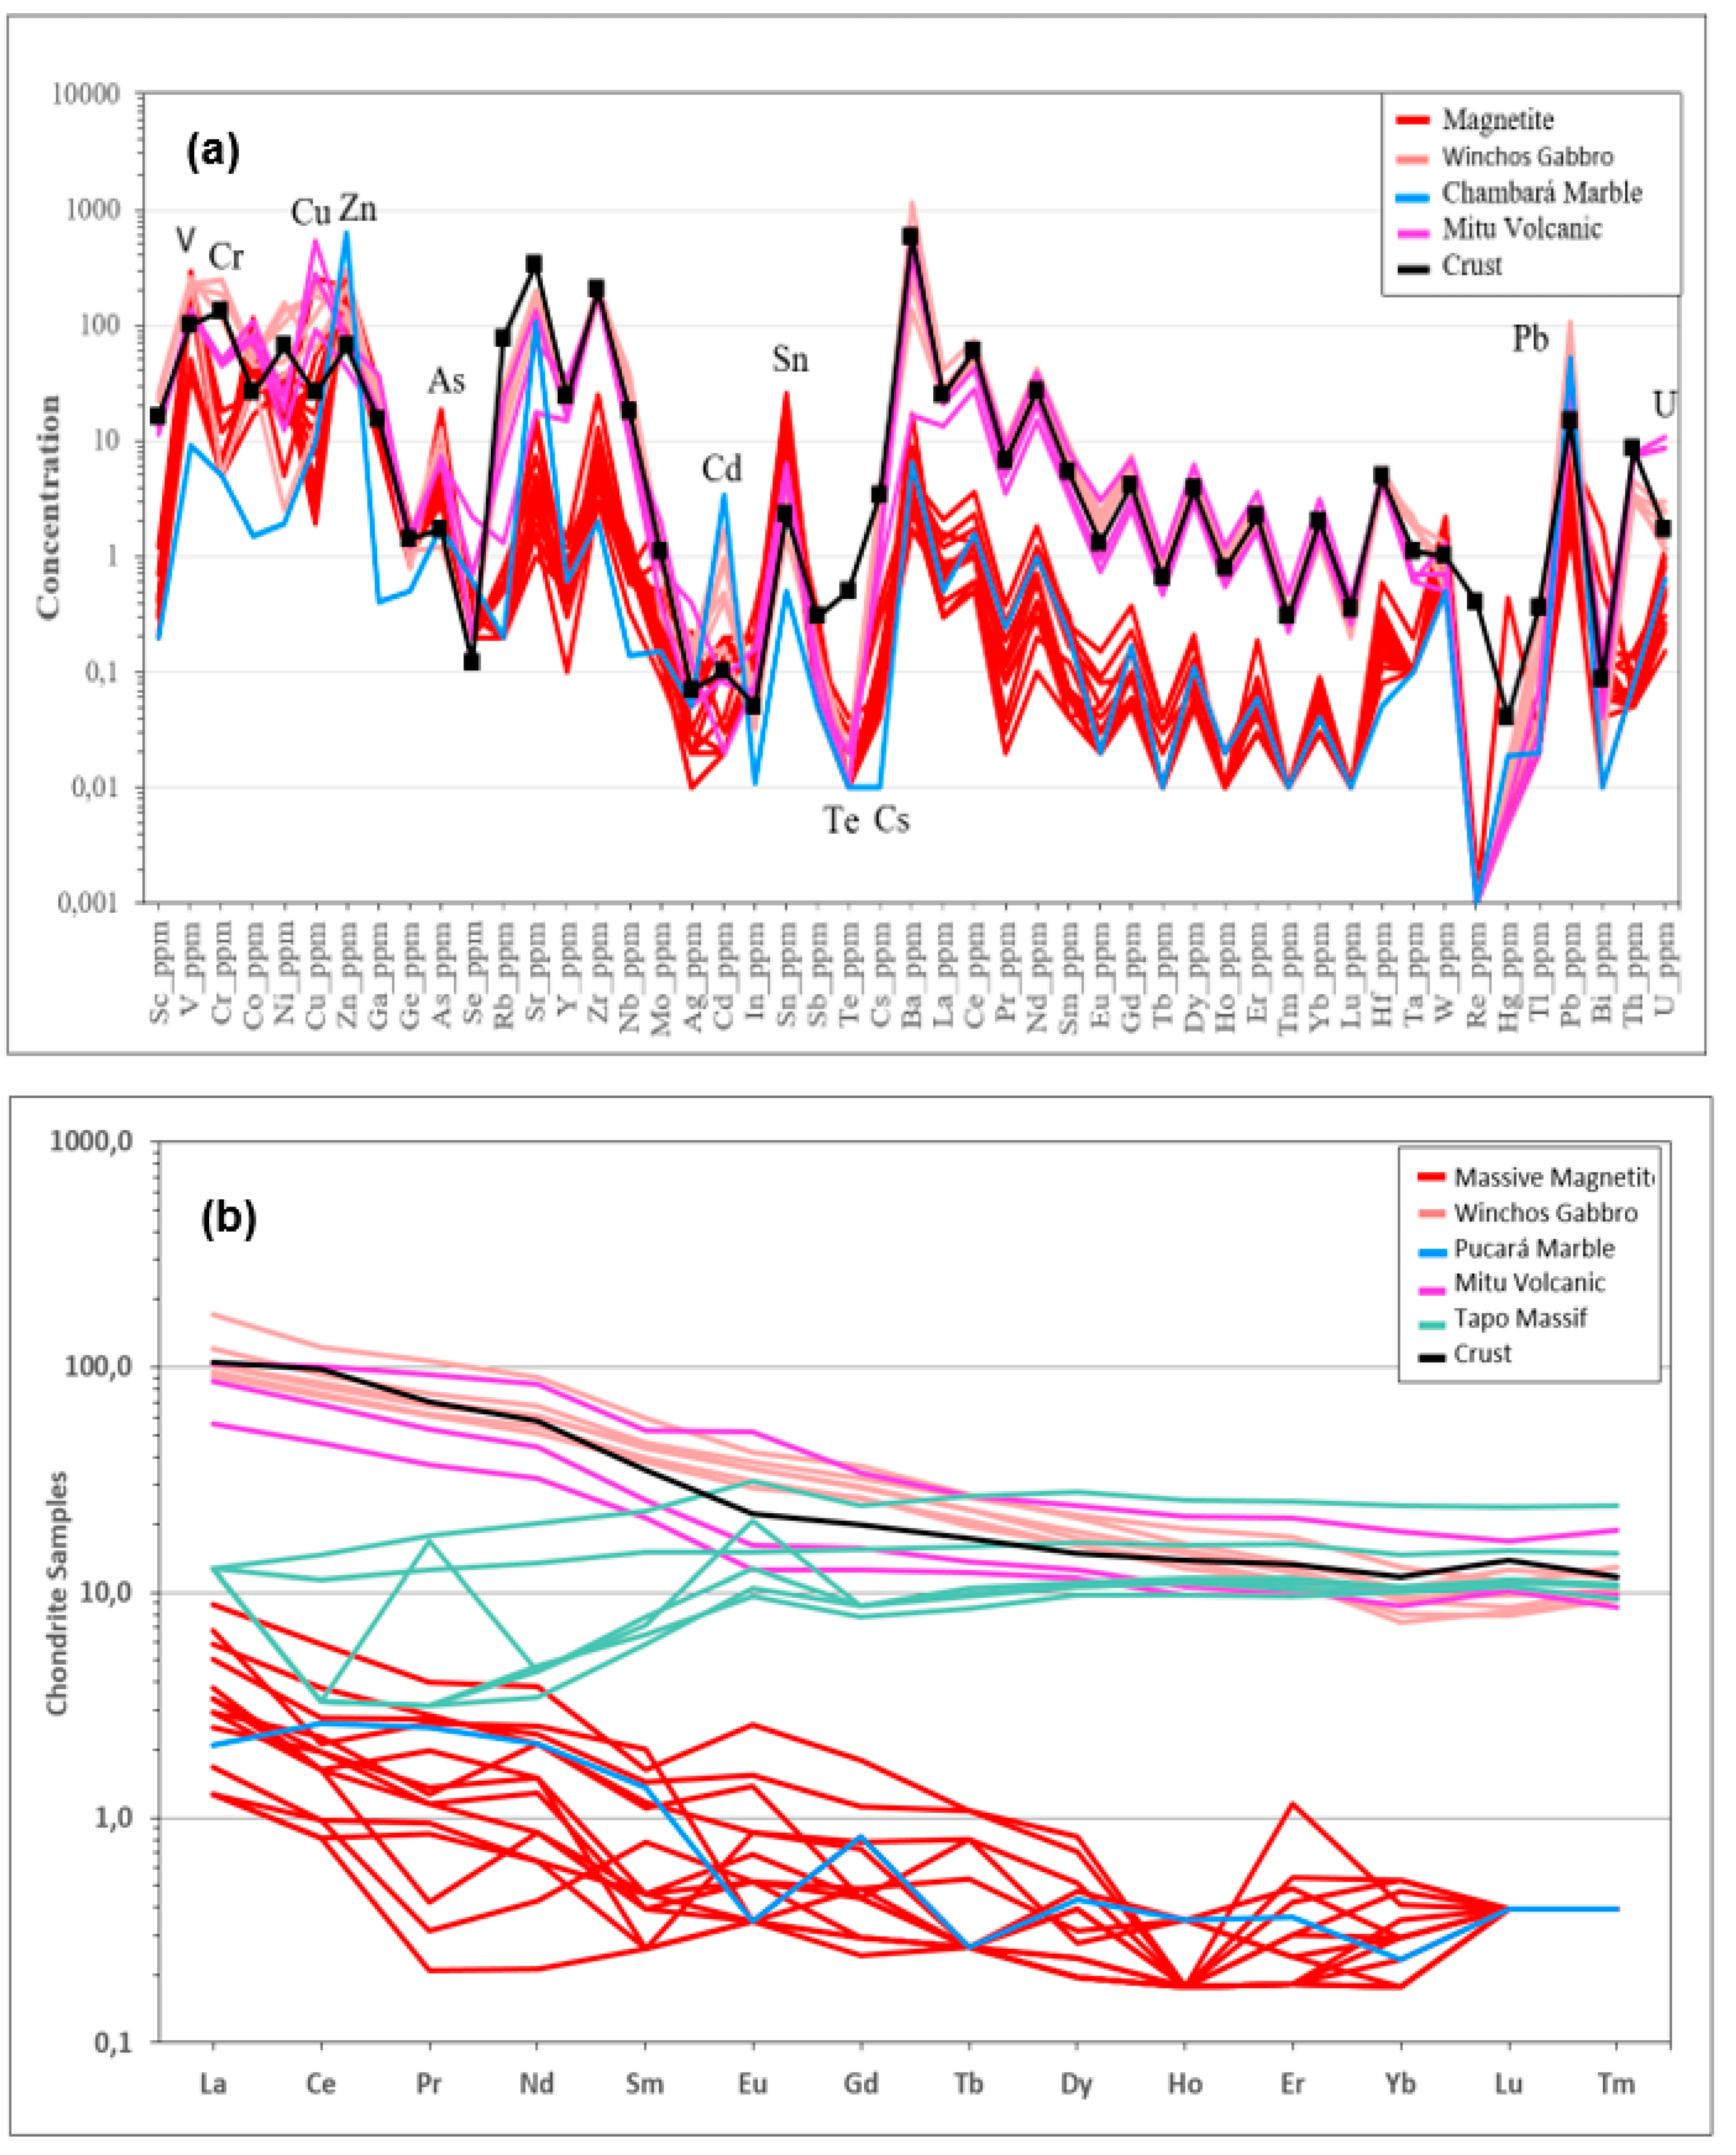
Figure 9.
a. Magnetite minerals 30%, pyrite traces, pyrrhotite traces, chalcopyrite traces, hematite 10%, goethite 0.05%, and gangue minerals 59.95%. b. Microphotographs (100X) show colloform aggregates of goethite (gt) enclosing some anhedral magnetite (mt) crystals, which originated from alteration. c. Microphotographs (100X) irregular magnetite (mt) surface showing cleavage and microfractures, through which alteration to hematite (hm) has occurred. D. Microphotographs (100X) granular aggregates of magnetite (mt) showing alteration to hematite (hm) along cleavage planes and microfractures, (e) Anhedral crystals of magnetite intergrown with lamellar ilmenite and altered to hematite (mt+il+hm), which occurs from their cleavage; they are surrounded by carbonated gangue (GGs). 200X. (f) Granular aggregates of magnetite (mt) altered to hematite (hm), with interstices filled by goethite (gt), which has originated from the alteration of these. 200X.
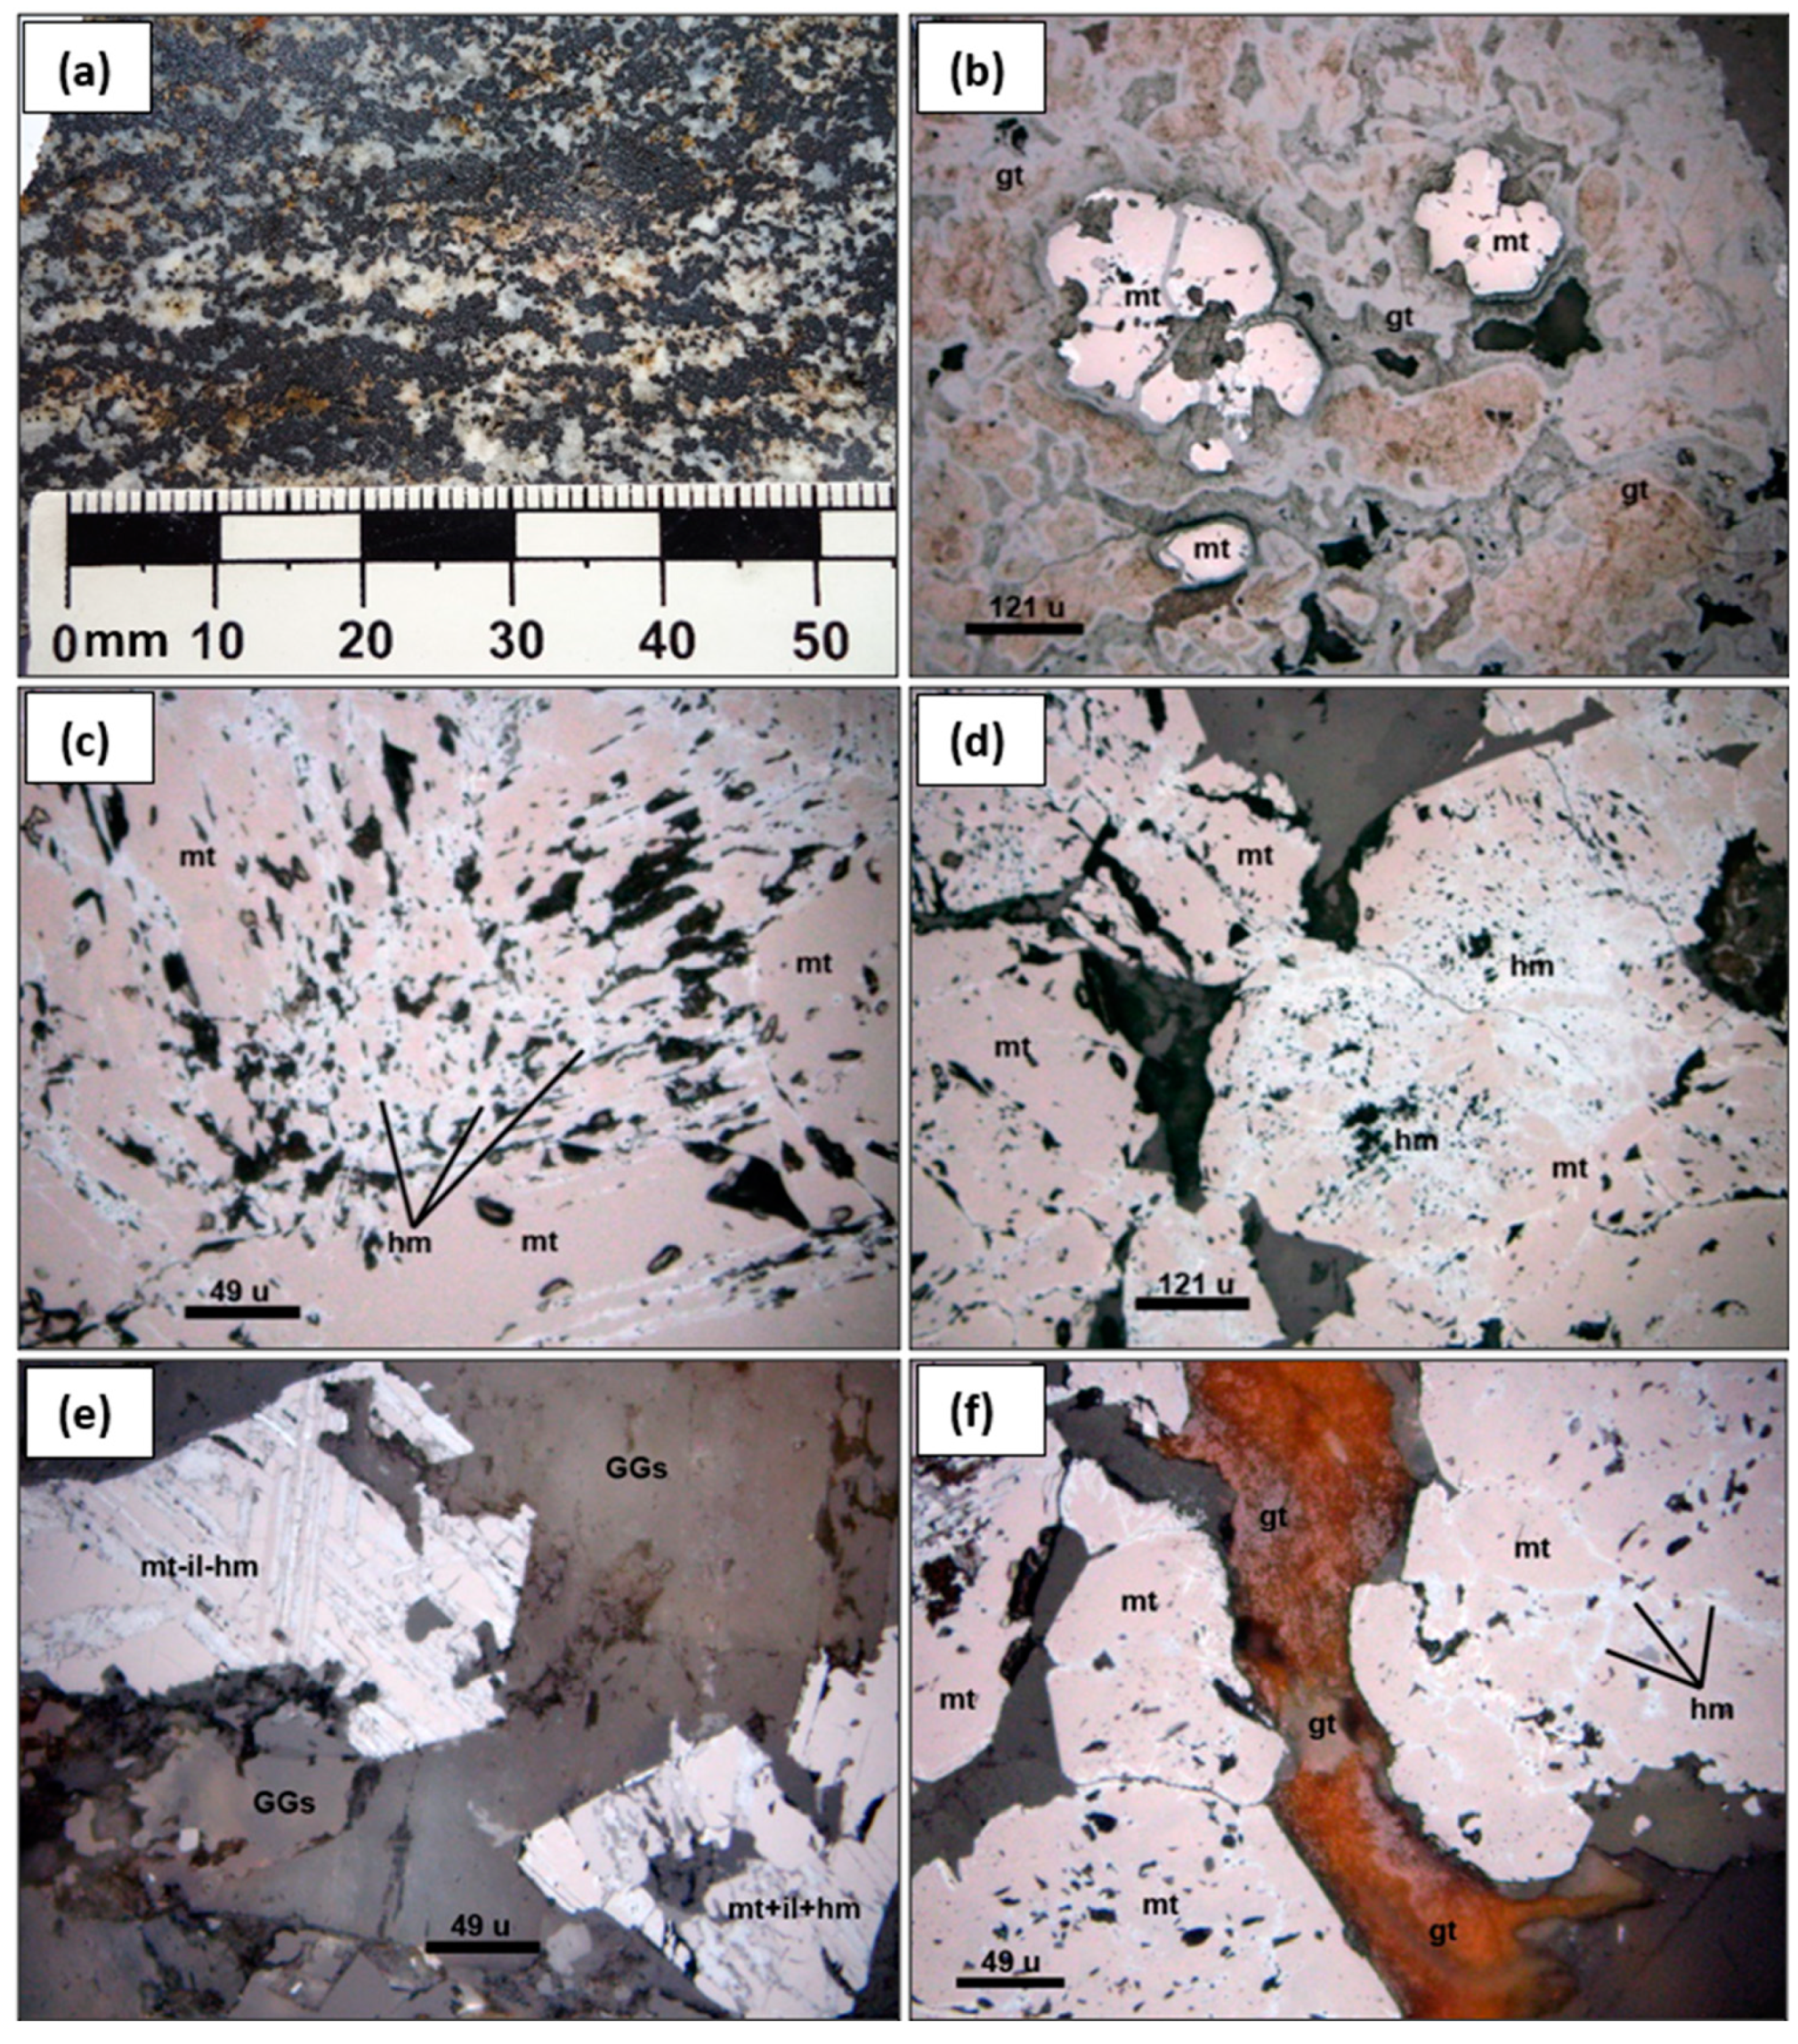
Figure 10.
Three-Dimensional Plot of Principal Components Associated with Major and minors Elements.
Figure 10.
Three-Dimensional Plot of Principal Components Associated with Major and minors Elements.
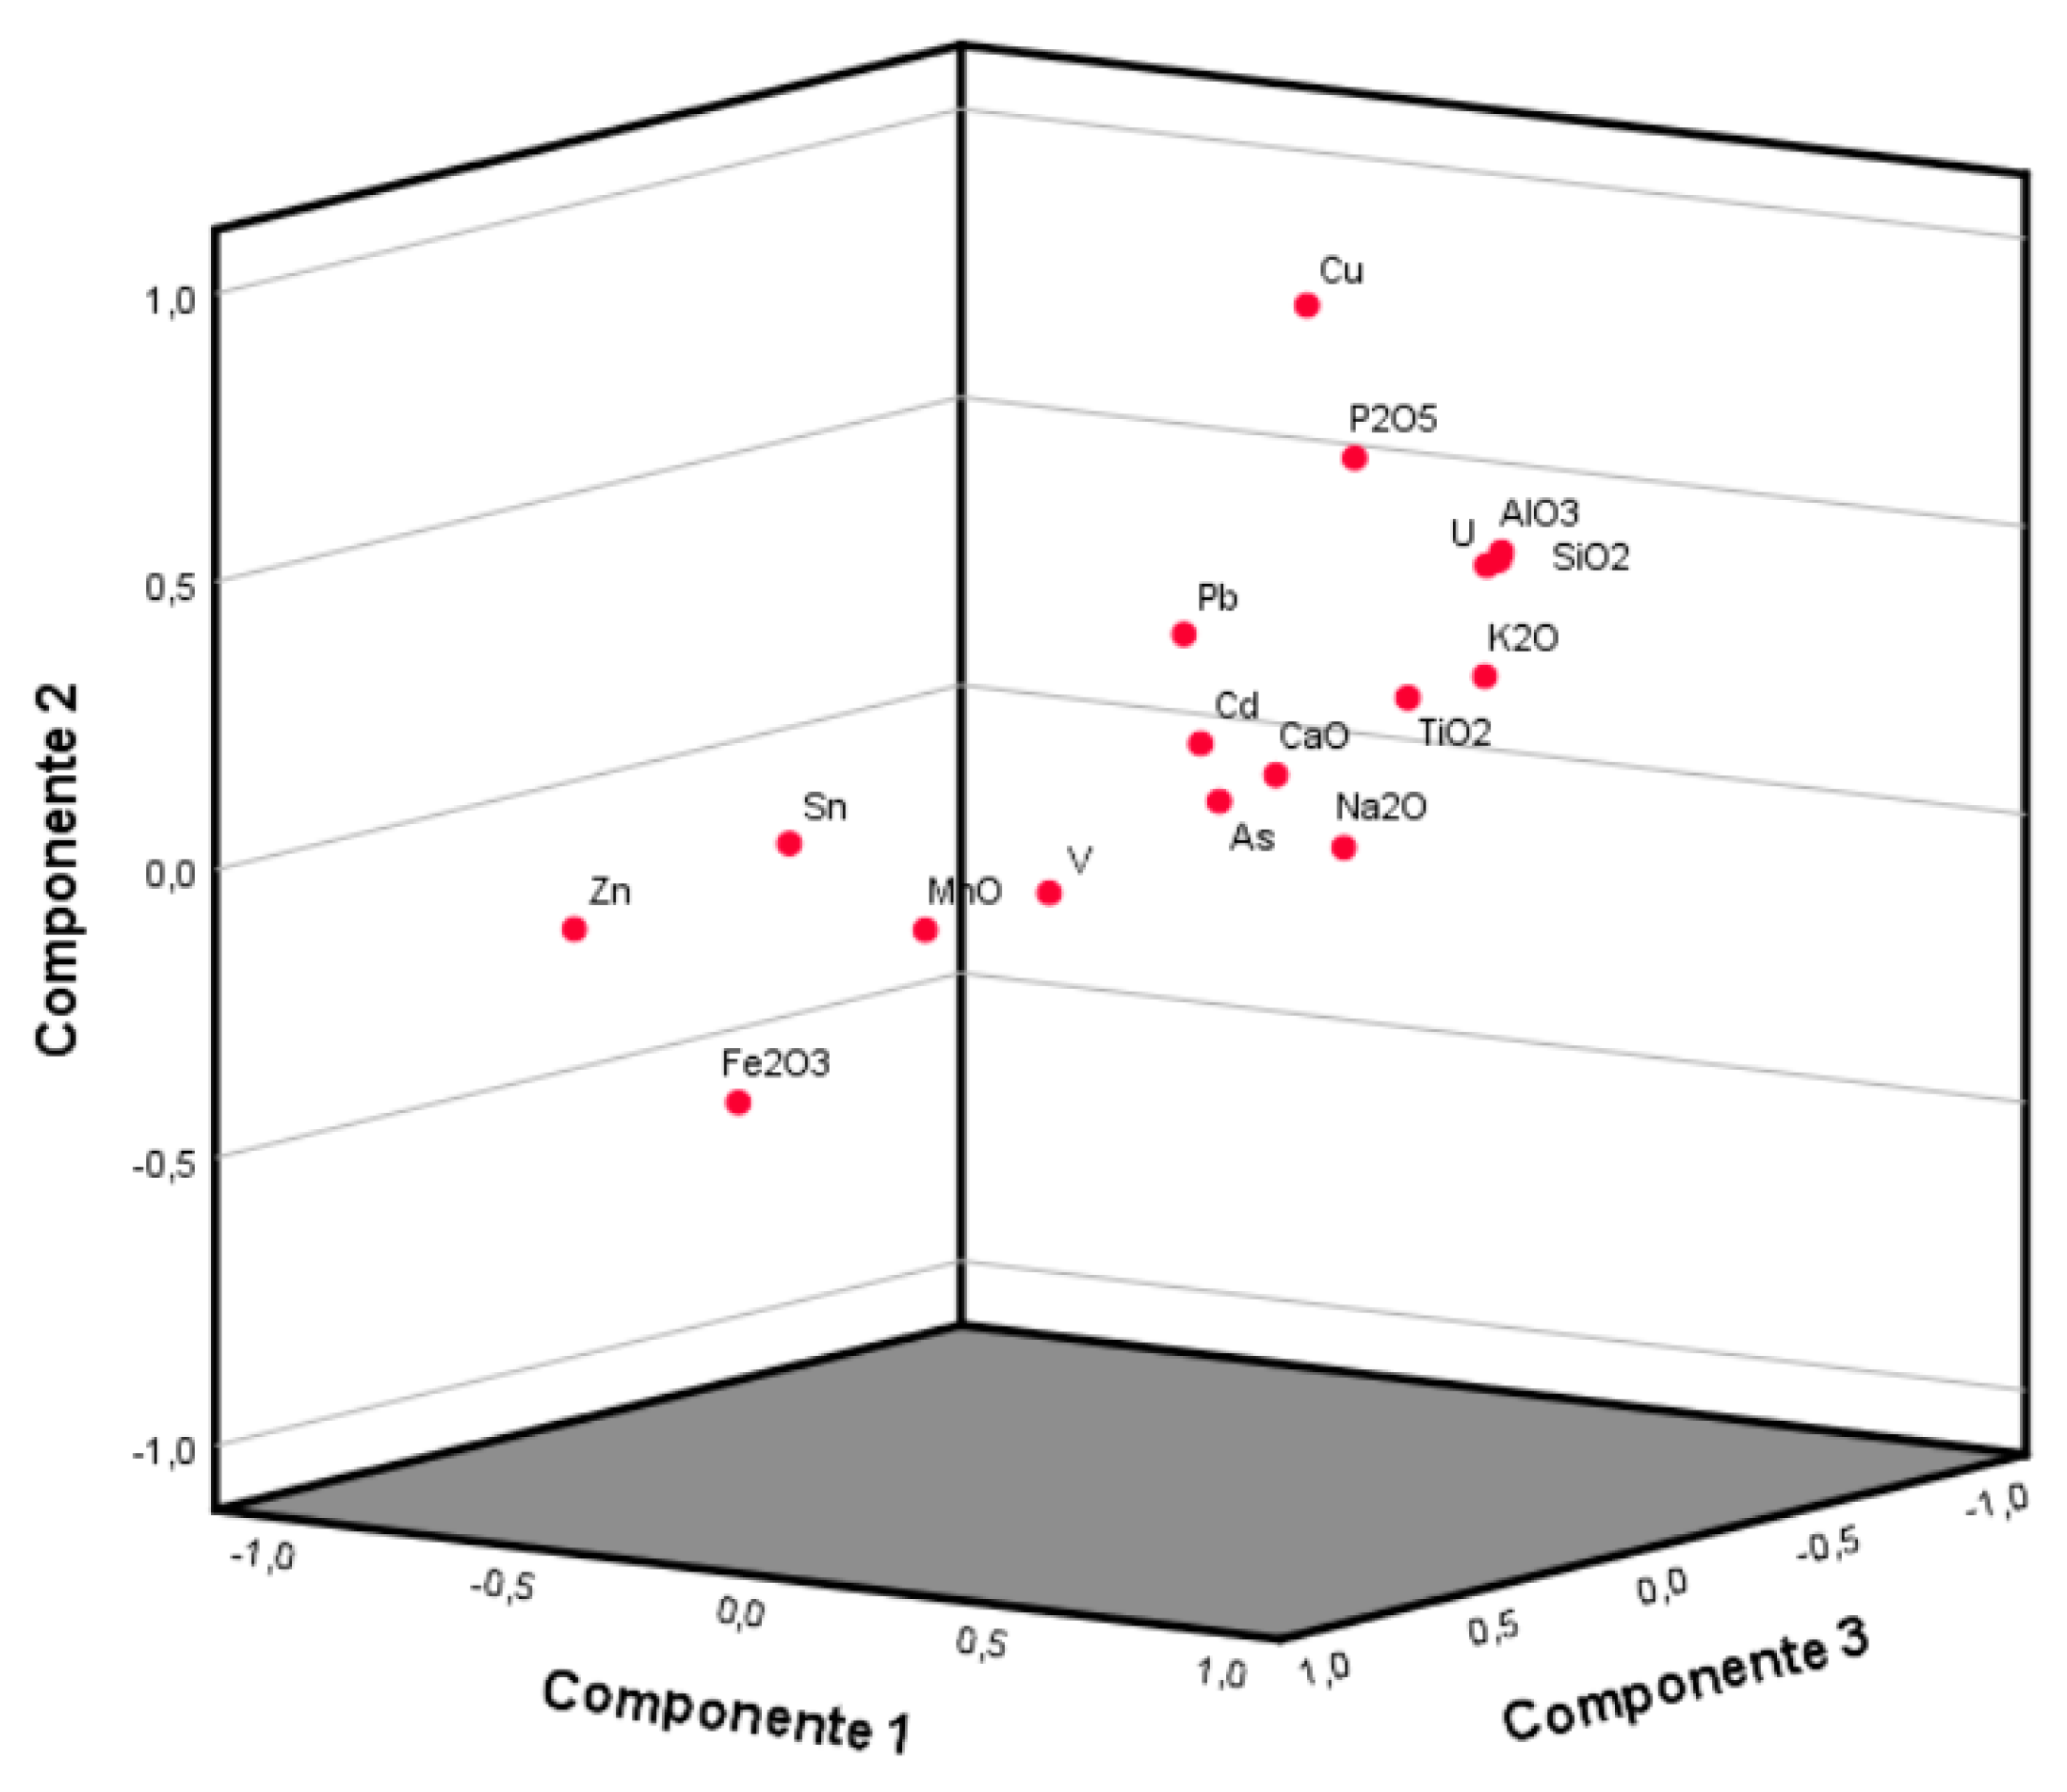

Table 1.
Summary Statistics of the Minor-Element Geochemical Data Collected (All Concentrations are in ppm).
Table 1.
Summary Statistics of the Minor-Element Geochemical Data Collected (All Concentrations are in ppm).
| Category | Descriptive | Cu | Pb | Zn | Sn | V | U | Cd | As |
| Massive Magnetite | Min | 1,9 | 1,6 | 152 | 5,3 | 37 | 0,15 | 0,02 | 2,8 |
| Q1 | 4,4 | 2,75 | 204 | 7,4 | 164,25 | 0,2725 | 0,02 | 3,5 | |
| Median | 12 | 4,75 | 238,5 | 10,2 | 214 | 0,49 | 0,035 | 5,8 | |
| Q3 | 29 | 7,63 | 247,75 | 13,83 | 240,75 | 0,64 | 0,14 | 8,28 | |
| Max | 53,5 | 14,9 | 278 | 25,4 | 294 | 1,16 | 0,2 | 18,4 | |
| Mean | 32,85 | 8,18 | 218,43 | 11,31 | 187,21 | 0,53 | 0,08 | 6,91 | |
| Winchos Gabbro | Min | 13,2 | 13 | 109 | 1,5 | 215 | 1,1 | 0,16 | 1,2 |
| Q1 | 65,925 | 22,1 | 131,5 | 2,775 | 219,5 | 1,475 | 0,44 | 7,3 | |
| Median | 101,25 | 45,35 | 134,5 | 3,15 | 242,5 | 2,13 | 0,69 | 10,3 | |
| Q3 | 164,63 | 57,95 | 196 | 3,6 | 255 | 2,4625 | 0,94 | 12,4 | |
| Max | 210 | 107,5 | 305 | 3,7 | 256 | 2,99 | 1,73 | 12,8 | |
| Mean | 110,93 | 47,95 | 171,67 | 3,28 | 237,83 | 2,03 | 0,77 | 9 | |
| Mitu Volcanics | Min | 90,5 | 14,6 | 42 | 5 | 123 | 8,61 | 0,02 | 6,8 |
| Q1 | 185,25 | 18,95 | 56 | 5,5 | 126,5 | 8,625 | 0,05 | 6,9 | |
| Median | 280 | 23,3 | 70 | 6 | 130 | 8,64 | 0,08 | 7 | |
| Q3 | 404,5 | 26,3 | 71,5 | 6,15 | 134 | 9,745 | 0,085 | 7,15 | |
| Max | 529 | 29,3 | 73 | 6,3 | 138 | 10,85 | 0,09 | 7,3 | |
| Mean | 299,83 | 22,4 | 61,67 | 5,77 | 130,33 | 9,367 | 0,06 | 7,03 |
Table 2.
Summary Statistics of the Maior-Element Geochemical Data Collected (All Concentrations are in %).
Table 2.
Summary Statistics of the Maior-Element Geochemical Data Collected (All Concentrations are in %).
| Category | Descriptive | SiO2 | TiO2 | Al2O3 | Fe2O3 | MnO | MgO | CaO | Na2O | K2O | P2O5 |
| Massive Magnetite | Min | 3,81 | 0,01 | 0,38 | 68,76 | 0,07 | 5,90 | 0,03 | 0,01 | 0,01 | 0,02 |
| Q1 | 6,48 | 0,01 | 1,28 | 74,06 | 0,10 | 6,73 | 0,06 | 0,02 | 0,01 | 0,04 | |
| Median | 9,22 | 0,03 | 1,60 | 78,79 | 0,14 | 7,88 | 0,16 | 0,03 | 0,01 | 0,07 | |
| Q3 | 13,80 | 0,04 | 1,84 | 83,20 | 0,16 | 8,60 | 0,27 | 0,04 | 0,01 | 0,08 | |
| Max | 16,60 | 0,07 | 2,33 | 87,33 | 0,17 | 10,22 | 0,27 | 0,04 | 0,01 | 0,14 | |
| Mean | 9,97 | 0,03 | 1,60 | 79,08 | 0,13 | 7,83 | 1,24 | 0,03 | 0,01 | 0,07 | |
| Winchos Gabbro | Min | 46,69 | 2,09 | 14,37 | 11,55 | 0,07 | 3,78 | 1,82 | 0,64 | 0,40 | 0,26 |
| Q1 | 46,93 | 2,13 | 14,96 | 13,65 | 0,14 | 8,57 | 4,59 | 2,71 | 0,69 | 0,44 | |
| Median | 47,27 | 2,36 | 15,26 | 14,65 | 0,14 | 11,16 | 5,78 | 3,10 | 0,78 | 0,49 | |
| Q3 | 49,65 | 2,59 | 15,95 | 15,19 | 0,17 | 11,38 | 6,05 | 3,95 | 1,02 | 0,53 | |
| Max | 51,42 | 3,28 | 17,78 | 16,13 | 0,19 | 12,07 | 7,78 | 5,43 | 1,22 | 0,59 | |
| Mean | 48,36 | 2,29 | 15,60 | 14,29 | 0,14 | 9,56 | 5,24 | 3,21 | 0,83 | 0,47 | |
| Mitu Volcanics | Min | 39,01 | 0,74 | 13,50 | 15,53 | 0,05 | 8,17 | 1,07 | 0,05 | 0,04 | 0,24 |
| Q1 | 40,25 | 0,83 | 15,64 | 16,01 | 0,06 | 8,33 | 1,44 | 0,27 | 0,25 | 0,25 | |
| Median | 41,49 | 0,92 | 17,78 | 16,50 | 0,07 | 8,48 | 1,82 | 0,49 | 0,47 | 0,25 | |
| Q3 | 46,45 | 0,95 | 18,04 | 19,97 | 0,14 | 12,66 | 10,00 | 1,50 | 0,84 | 0,25 | |
| Max | 51,42 | 0,97 | 18,29 | 23,44 | 0,21 | 16,84 | 18,19 | 2,51 | 1,22 | 0,26 | |
| Mean | 43,97 | 0,88 | 16,52 | 18,49 | 0,11 | 11,16 | 7,02 | 1,02 | 0,57 | 0,25 |
Table 3.
Kolmogorov-Smirnov and Shapiro-Wilk test for normality using untransformed minor element data (values in red did not pass the test because they are less than the p-value of 0.05).
Table 3.
Kolmogorov-Smirnov and Shapiro-Wilk test for normality using untransformed minor element data (values in red did not pass the test because they are less than the p-value of 0.05).
| Minors Elements | Kolmogorov-Smirnova | Shapiro-Wilk | |||||
| Estadístico | gl | Sig. | Estadístico | gl | Sig. | ||
| Cu | Massive Magnetite | 0,374 | 15 | 0,000 | 0,479 | 15 | 0,000 |
| Winchos Gabbro | 0,157 | 6 | ,200* | 0,969 | 6 | 0,885 | |
| Mitu Volcanics | 0,203 | 3 | 0,994 | 3 | 0,851 | ||
| Pb | Massive Magnetite | 0,277 | 15 | 0,003 | 0,769 | 15 | 0,002 |
| Winchos Gabbro | 0,219 | 6 | ,200* | 0,906 | 6 | 0,410 | |
| Mitu Volcanics | 0,215 | 3 | 0,989 | 3 | 0,798 | ||
| Zn | Massive Magnetite | 0,209 | 15 | 0,076 | 0,871 | 15 | 0,035 |
| Winchos Gabbro | 0,350 | 6 | 0,021 | 0,803 | 6 | 0,062 | |
| Mitu Volcanics | 0,354 | 3 | 0,822 | 3 | 0,168 | ||
| Sn | Massive Magnetite | 0,154 | 15 | ,200* | 0,933 | 15 | 0,299 |
| Winchos Gabbro | 0,209 | 6 | ,200* | 0,954 | 6 | 0,773 | |
| Mitu Volcanics | 0,301 | 3 | 0,912 | 3 | 0,424 | ||
| V | Massive Magnetite | 0,167 | 15 | ,200* | 0,898 | 15 | 0,090 |
| Winchos Gabbro | 0,306 | 6 | 0,083 | 0,789 | 6 | 0,047 | |
| Mitu Volcanics | 0,184 | 3 | 0,999 | 3 | 0,927 | ||
| U | Massive Magnetite | 0,201 | 15 | 0,103 | 0,870 | 15 | 0,034 |
| Winchos Gabbro | 0,186 | 6 | ,200* | 0,956 | 6 | 0,786 | |
| Mitu Volcanics | 0,381 | 3 | 0,760 | 3 | 0,022 | ||
| Cd | Massive Magnetite | 0,254 | 15 | 0,010 | 0,792 | 15 | 0,003 |
| Winchos Gabbro | 0,202 | 6 | ,200* | 0,926 | 6 | 0,552 | |
| Mitu Volcanics | 0,337 | 3 | 0,855 | 3 | 0,253 | ||
| As | Massive Magnetite | 0,181 | 15 | 0,199 | 0,864 | 15 | 0,028 |
| Winchos Gabbro | 0,254 | 6 | ,200* | 0,858 | 6 | 0,184 | |
| Mitu Volcanics | 0,219 | 3 | 0,987 | 3 | 0,780 | ||
Table 4.
Kolmogorov-Smirnov and Shapiro-Wilk test for normality using untransformed maior element data (values in red did not pass the test because they are less than the p-value of 0.05).
Table 4.
Kolmogorov-Smirnov and Shapiro-Wilk test for normality using untransformed maior element data (values in red did not pass the test because they are less than the p-value of 0.05).
| Maior Elements | Kolmogorov-Smirnova | Shapiro-Wilk | |||||
| Estadístico | gl | Sig. | Estadístico | gl | Sig. | ||
| SiO2 | Massive Magnetite | 0,137 | 14 | ,200* | 0,917 | 14 | 0,202 |
| Winchos Gabbro | 0,281 | 7 | 0,100 | 0,807 | 7 | 0,048 | |
| Mitu Volcanics | 0,314 | 3 | 0,893 | 3 | 0,363 | ||
| TiO2 | Massive Magnetite | 0,242 | 14 | 0,026 | 0,832 | 14 | 0,013 |
| Winchos Gabbro | 0,249 | 7 | ,200* | 0,921 | 7 | 0,474 | |
| Mitu Volcanics | 0,307 | 3 | 0,904 | 3 | 0,398 | ||
| Al2O3 | Massive Magnetite | 0,160 | 14 | ,200* | 0,937 | 14 | 0,387 |
| Winchos Gabbro | 0,274 | 7 | 0,120 | 0,880 | 7 | 0,224 | |
| Mitu Volcanics | 0,350 | 3 | 0,829 | 3 | 0,185 | ||
| Fe2O3 | Massive Magnetite | 0,134 | 14 | ,200* | 0,944 | 14 | 0,467 |
| Winchos Gabbro | 0,250 | 7 | ,200* | 0,928 | 7 | 0,532 | |
| Mitu Volcanics | 0,344 | 3 | 0,840 | 3 | 0,215 | ||
| MnO | Massive Magnetite | 0,218 | 14 | 0,071 | 0,887 | 14 | 0,074 |
| Winchos Gabbro | 0,225 | 7 | ,200* | 0,921 | 7 | 0,474 | |
| Mitu Volcanics | 0,343 | 3 | 0,842 | 3 | 0,220 | ||
| MgO | Massive Magnetite | 0,099 | 14 | ,200* | 0,956 | 14 | 0,664 |
| Winchos Gabbro | 0,281 | 7 | 0,102 | 0,816 | 7 | 0,059 | |
| Mitu Volcanics | 0,374 | 3 | 0,777 | 3 | 0,060 | ||
| CaO | Massive Magnetite | 0,410 | 14 | 0,000 | 0,455 | 14 | 0,000 |
| Winchos Gabbro | 0,200 | 7 | ,200* | 0,936 | 7 | 0,605 | |
| Mitu Volcanics | 0,371 | 3 | 0,783 | 3 | 0,074 | ||
| Na2O | Massive Magnetite | 0,208 | 14 | 0,103 | 0,858 | 14 | 0,028 |
| Winchos Gabbro | 0,179 | 7 | ,200* | 0,965 | 7 | 0,856 | |
| Mitu Volcanics | 0,323 | 3 | 0,879 | 3 | 0,322 | ||
| K2O | Massive Magnetite | 0,534 | 14 | 0,000 | 0,297 | 14 | 0,000 |
| Winchos Gabbro | 0,218 | 7 | ,200* | 0,918 | 7 | 0,451 | |
| Mitu Volcanics | 0,238 | 3 | 0,976 | 3 | 0,703 | ||
| P2O5 | Massive Magnetite | 0,177 | 14 | ,200* | 0,943 | 14 | 0,460 |
| Winchos Gabbro | 0,250 | 7 | ,200* | 0,903 | 7 | 0,353 | |
| Mitu Volcanics | 0,175 | 3 | 1,000 | 3 | 1,000 | ||
Table 5.
Minor element correlation analysis (r ≥ 0.50, all values greater than 0.5 are in bold).
| Cu | Pb | Zn | Sn | V | U | Cd | As | |
| Cu | 1,000 | |||||||
| Pb | ,655** | 1,000 | ||||||
| Zn | -,554** | -0,277 | 1,000 | |||||
| Sn | -0,290 | -,499* | 0,386 | 1,000 | ||||
| V | -,476* | -0,078 | ,426* | -0,277 | 1,000 | |||
| U | ,885** | ,620** | -,641** | -,486* | -0,406 | 1,000 | ||
| Cd | ,436* | ,729** | -0,149 | -,509* | 0,119 | 0,395 | 1,000 | |
| As | ,512* | 0,182 | -0,206 | -0,087 | -0,319 | ,432* | 0,237 | 1,000 |
*. The correlation is significant at the 0.05 level (two-tailed). **. The correlation is significant at the 0.01 level (two-tailed).
Table 6.
Maior element correlation analysis (r ≥ 0.50, all values greater than 0.5 are in bold).
| SiO2 | TiO2 | Al2O3 | Fe2O3 | MnO | MgO | CaO | Na2O | K2O | P2O5 | |
| SiO2 | 1,000 | |||||||||
| TiO2 | ,890** | 1,000 | ||||||||
| Al2O3 | ,857** | ,834** | 1,000 | |||||||
| Fe2O3 | -,924** | -,932** | -,795** | 1,000 | ||||||
| MnO | -0,105 | -0,023 | -0,147 | 0,007 | 1,000 | |||||
| MgO | ,537** | ,554** | ,506* | -,599** | -0,158 | 1,000 | ||||
| CaO | ,608** | ,714** | ,520** | -,805** | 0,072 | 0,357 | 1,000 | |||
| Na2O | ,824** | ,836** | ,719** | -,831** | 0,136 | ,445* | ,610** | 1,000 | ||
| K2O | ,866** | ,844** | ,866** | -,846** | -0,062 | 0,399 | ,667** | ,809** | 1,000 | |
| P2O5 | ,807** | ,849** | ,807** | -,827** | 0,163 | ,525** | ,628** | ,830** | ,825** | 1,000 |
*. The correlation is significant at the 0.05 level (two-tailed). **. The correlation is significant at the 0.01 level (two-tailed).
Table 7.
Total variance explained for the transformed dataset.
| Component | Initial Eigenvalues | Rotated Eigenvalues | ||||
| Total | % Variance | % Accumulated | Total | % Variance | % Accumulated | |
| 1 | 19890,774 | 66,609 | 66,609 | 19890,774 | 66,609 | 66,609 |
| 2 | 5450,093 | 18,251 | 84,861 | 5450,093 | 18,251 | 84,861 |
| 3 | 3494,961 | 11,704 | 96,564 | 3494,961 | 11,704 | 96,564 |
| 4 | 860,302 | 2,881 | 99,445 | 860,302 | 2,881 | 99,445 |
| 5 | 124,316 | 0,416 | 99,862 | 124,316 | 0,416 | 99,862 |
| 6 | 18,265 | 0,061 | 99,923 | 18,265 | 0,061 | 99,923 |
| 7 | 9,825 | 0,033 | 99,956 | 9,825 | 0,033 | 99,956 |
| 8 | 9,051 | 0,030 | 99,986 | 9,051 | 0,030 | 99,986 |
| 9 | 2,200 | 0,007 | 99,993 | 2,200 | 0,007 | 99,993 |
| 10 | 1,424 | 0,005 | 99,998 | 1,424 | 0,005 | 99,998 |
| 11 | 0,436 | 0,001 | 100,000 | 0,436 | 0,001 | 100,000 |
| 12 | 0,086 | 0,000 | 100,000 | 0,086 | 0,000 | 100,000 |
| 13 | 0,026 | 8,797E-05 | 100,000 | 0,026 | 8,797E-05 | 100,000 |
| 14 | 0,012 | 4,044E-05 | 100,000 | 0,012 | 4,044E-05 | 100,000 |
| 15 | 0,007 | 2,183E-05 | 100,000 | 0,007 | 2,183E-05 | 100,000 |
| 16 | 0,000 | 9,397E-07 | 100,000 | 0,000 | 9,397E-07 | 100,000 |
| 17 | 8,075E-05 | 2,704E-07 | 100,000 | 8,075E-05 | 2,704E-07 | 100,000 |
a. When analyzing a covariance matrix, the initial eigenvalues are the same between the rescaled and pure solutions.
Table 8.
Unrotated Component Matrix.
| Elements | Pure Component | Rescaled Component | ||||
| 1 | 2 | 3 | 1 | 2 | 3 | |
| Cu | 124,059 | 26,079 | -16,765 | 0,970 | 0,204 | -0,131 |
| Pb | 6,625 | 8,005 | 1,033 | 0,264 | 0,319 | 0,041 |
| Zn | -51,503 | 26,508 | -47,748 | -0,684 | 0,352 | -0,634 |
| Sn | -0,305 | -2,386 | -4,111 | -0,053 | -0,412 | -0,710 |
| V | -37,004 | 61,068 | 22,069 | -0,492 | 0,812 | 0,294 |
| U | 2,247 | -0,083 | 0,922 | 0,745 | -0,028 | 0,306 |
| Cd | 0,038 | 0,126 | 0,069 | 0,093 | 0,305 | 0,167 |
| As | 1,047 | -1,104 | -0,006 | 0,258 | -0,271 | -0,002 |
| SiO2 | 10,617 | 8,822 | 10,298 | 0,551 | 0,458 | 0,535 |
| TiO2 | 0,293 | 0,469 | 0,561 | 0,264 | 0,424 | 0,507 |
| AlO3 | 4,454 | 2,663 | 3,584 | 0,608 | 0,363 | 0,489 |
| Fe2O3 | -17,161 | -13,459 | -17,495 | -0,534 | -0,419 | -0,544 |
| MnO | -0,015 | 0,009 | -0,005 | -0,387 | 0,227 | -0,127 |
| CaO | 0,338 | 0,601 | 0,756 | 0,126 | 0,225 | 0,282 |
| Na2O | 0,462 | -0,004 | 1,144 | 0,146 | -0,001 | 0,362 |
| K2O | 0,668 | 0,586 | 0,981 | 0,390 | 0,342 | 0,573 |
| P2O5 | 0,283 | 0,217 | 0,097 | 0,620 | 0,476 | 0,213 |
Table 9.
VARIMAX-Rotated Component Matrix.
| Pure Component | Rescaled Component | |||||
| 1 | 2 | 3 | 1 | 2 | 3 | |
| Cu | 4,668 | 110,379 | -64,393 | 0,036 | 0,863 | -0,503 |
| Pb | 4,007 | 9,592 | 0,995 | 0,160 | 0,383 | 0,040 |
| Zn | -43,100 | -6,921 | 61,070 | -0,572 | -0,092 | 0,811 |
| Sn | -4,635 | -0,614 | -0,906 | -0,801 | -0,106 | -0,157 |
| V | 34,871 | 6,394 | 65,794 | 0,464 | 0,085 | 0,875 |
| U | 1,089 | 1,308 | -1,736 | 0,361 | 0,434 | -0,576 |
| Cd | 0,107 | 0,089 | 0,053 | 0,258 | 0,216 | 0,129 |
| As | -0,217 | 0,048 | -1,505 | -0,053 | 0,012 | -0,370 |
| SiO2 | 13,474 | 10,434 | -2,484 | 0,699 | 0,542 | -0,129 |
| TiO2 | 0,700 | 0,356 | 0,053 | 0,633 | 0,322 | 0,048 |
| AlO3 | 4,651 | 3,916 | -1,677 | 0,635 | 0,534 | -0,229 |
| Fe2O3 | -22,355 | -16,120 | 4,706 | -0,695 | -0,501 | 0,146 |
| MnO | -0,004 | -0,004 | 0,018 | -0,096 | -0,098 | 0,445 |
| CaO | 0,930 | 0,419 | 0,089 | 0,347 | 0,156 | 0,033 |
| Na2O | 1,135 | 0,015 | -0,483 | 0,359 | 0,005 | -0,153 |
| K2O | 1,173 | 0,585 | -0,182 | 0,686 | 0,342 | -0,106 |
| P2O5 | 0,185 | 0,316 | -0,054 | 0,406 | 0,691 | -0,118 |
Table 10.
VARIMAX-Rotated Component Matrix.
| Component | 1 | 2 | 3 |
| 1 | 0,105 | 0,718 | -0,688 |
| 2 | 0,291 | 0,639 | 0,712 |
| 3 | 0,951 | -0,275 | -0,142 |
Disclaimer/Publisher’s Note: The statements, opinions and data contained in all publications are solely those of the individual author(s) and contributor(s) and not of MDPI and/or the editor(s). MDPI and/or the editor(s) disclaim responsibility for any injury to people or property resulting from any ideas, methods, instructions or products referred to in the content. |
© 2024 by the authors. Licensee MDPI, Basel, Switzerland. This article is an open access article distributed under the terms and conditions of the Creative Commons Attribution (CC BY) license (http://creativecommons.org/licenses/by/4.0/).
Copyright: This open access article is published under a Creative Commons CC BY 4.0 license, which permit the free download, distribution, and reuse, provided that the author and preprint are cited in any reuse.


