1. Introduction
Human Activity Recognition (HAR) has emerged as a critical area of research within the domain of computer vision and machine learning, owing to its vast potential applications in healthcare, smart surveillance, and human-computer interaction. HAR aims to identify and classify human activities based on sensor data or video streams, thereby enabling machines to interpret and respond to human actions in real-time. HAR systems can provide valuable insights for various intelligent applications. This technology has been widely applied in fields such as home behaviour analysis, video surveillance, gait analysis, and gesture recognition.
HAR systems relied on data from active sensors or passive sensors. Active sensors emit energy in the form of electromagnetic waves or sound to detect objects or measure environmental conditions. The sensors then analyze the reflected signals to gather data. On the other hand, Passive sensors do not emit their own signals but instead detect natural energy or signals present in the environment. These sensors measure ambient conditions or capture data from external sources of energy, such as light or sound. Examples of Active sensors are accelerometer, gyroscope, radar, lidar and Kinect sensors. While optical cameras, infrared cameras, microphones and environmental sensors are considered examples of passive sensors.
Due to the rapid development of sensor technology and ubiquitous computing, sensor-based HAR has gained popularity, offering the advantage of privacy protection. Active sensor-based methods have demonstrated considerable success but often require users to wear multiple sensors, which can be inconvenient and intrusive. Moreover, active sensor-based approaches are susceptible to issues like sensor misalignment and varying sensitivity, which can impact the accuracy of activity recognition. The discomfort associated with wearing sensors and the inherent limitations of sensor power necessitate the exploration of alternative methods. Passive sensor-based methods are considered the most comfortable HAR method, since there is not direct interaction with humans. However, passive sensors may provide less precise or detailed data compared to active sensors, which can be a limitation in applications requiring high accuracy or detailed analysis.
HAR technologies can be broadly categorised into two types according to their location: approaches based on fixed sensors and mobile-based approaches.
Fixed sensor-based methods obtain information from sensors mounted at a specified position, including acoustic sensors, radars, and other ambient-based sensors. Among these, camera-based methods are the most popular, employing techniques such as background subtraction, optical flow, and energy-based segmentation to extract features. For example, image processing methods based on Kinect sensors can acquire depth image features of moving targets. Although these activity monitoring methods can provide high recognition accuracy, they are not suitable for many indoor environments, especially where privacy is a concern.
The other category of activity recognition methods involves using mobile sensors. In these methods, information from various behaviours is collected using dedicated body-worn motion sensors, such as accelerometers, gyroscopes, and magnetometers. These sensors detect changes in acceleration and angular velocity corresponding to human motion, allowing for the inference of activities. The miniaturisation and flexibility of sensors enable individuals to wear or carry mobile devices embedded with various sensing units, distinguishing this approach from fixed sensor-based methods. Mobile sensors are characterised by low cost, low power consumption, high capacity, miniaturisation, and reduced dependence on surroundings. Consequently, activity recognition based on mobile sensors has garnered widespread attention due to its portability and high acceptance in daily life. However, activity recognition using mobile sensors faces challenges such as high-power consumption, user comfort issues, and privacy concerns. Environmental interference, inconsistent sensor placement, and lack of contextual awareness further affect accuracy. Large data volumes and sensor calibration issues also pose difficulties. Ongoing research is needed to improve reliability and user acceptance through advanced algorithms and integration with additional data sources. These limitations underscore the necessity for ongoing research to enhance the accuracy, reliability, and user acceptance of mobile sensor-based activity recognition systems by integrating additional data sources, advancing sensor technology, and developing sophisticated algorithms.
Recognising the limitations of traditional sensor-based methods, researchers have turned to deep learning techniques to improve the performance and robustness of HAR systems. Deep learning techniques have revolutionised HAR by leveraging raw data from video streams captured by surveillance cameras. These methods utilise Convolutional Neural Networks (CNNs) or Recurrent Neural Networks (RNNs) to automatically extract and learn features from video data, eliminating the need for manual feature engineering. This approach has proven particularly effective in recognising complex activities and distinguishing between normal and anomalous behaviours, making it highly applicable in areas such as elderly care, autism monitoring, and public safety. The automatic feature extraction capability of deep learning models significantly reduces the dependency on domain experts, noisy data and enhances the scalability of HAR systems.
Despite the advancements brought by deep learning, challenges remain in effectively capturing the spatial and temporal relationships inherent in human activities. Recognising human activities from video data requires understanding not only the individual frames but also the transitions between frames, which encode crucial temporal information.
In this research, we propose a novel HAR system that integrates graph structures and deep neural networks to address these challenges. By representing human joint movements as a graph, where each node corresponds to a joint and edges represent the connections between them, the system can capture the intricate patterns of human motion more comprehensively. This graph-based representation allows for a more nuanced understanding of the spatial relationships and temporal dynamics involved in human activities which is of paramount importance for any HAR system.
The primary objective of this research is to investigate the effectiveness of using graph structures derived from human joint 3D trajectories in enhancing HAR. The system will be implemented using OpenPose algorithm, to determine the optimal approach for recognising actions. OpenPose is state-of-the-art method for human pose estimation that provide precise joint location data, which can be used to construct the graph representations of human activities. By focusing on the spatial-temporal dynamics of joint movements, this research aims to contribute a robust and efficient method for HAR, paving the way for more intuitive and less invasive activity recognition solutions.
Furthermore, the proposed system aims to address several key challenges in HAR, such as recognising activities in naturalistic environments, handling occlusions, and differentiating between similar actions. By leveraging the graph structure, the system can maintain the spatial integrity of joint positions, even in the presence of occlusions, and distinguish between activities that may appear similar in individual frames but differ in their overall movement patterns. The integration of graph structures with deep neural networks represents a promising advancement in HAR, offering improved accuracy and applicability in real-world scenarios. This research not only aims to enhance the technical aspects of activity recognition but also to contribute to the development of intelligent systems that can seamlessly integrate into daily life, providing safety and support without compromising user comfort or privacy. By providing reliable and efficient HAR solutions, the outcomes of this research have the potential to impact various domains, including healthcare monitoring, smart home systems, and public safety.
2. Literature Review
The primary goal of HAR is to accurately identify and classify human activities based on data collected from various sensors. As mentioned before, HAR have largely relied on active or passive sensor-based methods, which involve the use of fixed or mobile sensors to imitate human movements. These methods have paved the way for understanding the complexities of human activity but come with their own set of limitations.
With the advancement of deep learning techniques, the field of HAR has witnessed a paradigm shift. Deep learning models, particularly CNNs and RNNs, have demonstrated remarkable success in learning complex feature representations from raw sensor data. These models have significantly improved the accuracy and robustness of HAR systems.
2.1. Active Sensor-Based HAR
In the early days of human activity recognition research, the field was primarily carried out through manual observation, where researchers would closely monitor and meticulously document the activities of study participants. This manual method, though direct, required significant time and effort from the researchers and was prone to subjectivity and inconsistencies inherent in human observation. The emergence of wearable sensor technologies in the late 20th century represented a pivotal moment in the evolution of this research area, enabling a more objective and quantifiable approach to activity recognition.
The introduction of devices like accelerometers, radars, lidars and gyroscopes allowed researchers to capture detailed data on movement and orientation, providing a new lens through which to analyze human behaviors. The first sensor designed for this purpose is introduced in (Makikawa & Iizumi, 1995). The authors discuss the development of a device designed to record physical activity data in an ambulatory setting. This device is capable of tracking and storing various movements throughout the day, which can then be analyzed to categorize different types of actions in daily life. The waveforms produced by the sensors contain hidden information about the character's activity. As a result, researchers often use signal processing techniques to uncover the latent features embedded in these waveforms. The data is first preprocessed using filters and, generally, windowing technique is used to perform feature extraction. Then, a signal transformation technique is applied for HAR systems such as Fourier transform (Amer & Ji, 2021; Zhuang et al., 2019), wavelet transform (Dharejo et al., 2022; Jana et al., 2021; Zhuang et al., 2020), and discrete cosine transformation (Alazeb et al., 2023; Xu et al., 2023). The extracted features were initially utilized with early methods that were primarily heuristic-based. These approaches involved developing rules and applying statistical methods to classify activities (Preece et al., 2009).
It is noteworthy that most often the majority of sensor-based human activity recognition systems have been extensively applied within Internet of Things (IoT) environments (Alazeb et al., 2023; Aziz et al., 2023; Dharejo et al., 2022; Ketu et al., 2020; Khaled et al., 2023). This prevalence is driven by the growing demand for intelligent and responsive systems capable of monitoring and interpreting human activities in real time.
While sensor-based Human Activity Recognition (HAR) systems offer numerous advantages, they also come with several limitations. Sensor accuracy and reliability can vary depending on environmental factors, sensor placement, and quality, leading to potential errors in activity detection. Battery life and energy consumption are also critical issues, particularly for wearable devices, which require regular charging and maintenance. These limitations highlight the need for careful consideration in the design and implementation of sensor-based HAR systems.
2.2. Passive Sensor-Based HAR
Unlike active sensors that require active participation or feedback from users, passive sensors gather data without explicit user input, thereby providing a more seamless and unobtrusive experience. These methods rely on sensors that monitor environmental changes without actively emitting signals, thus preserving user privacy and comfort. Passive sensors used in human activity recognition include various types, such as surveillance cameras, ambient light sensors, and barometric pressure sensors.
One common passive sensor used in HAR is the surveillance camera. Cameras capture visual data that can be analyzed to identify and classify various activities based on body movements, posture, and interactions with objects (Mishra, 2023). This visual data, when processed using computer vision algorithms, provides detailed insights into complex activities, such as distinguishing between different types of physical exercises or detecting abnormal behaviors. Moreover, HAR systems that incorporate data from cameras can revolutionizing education, health monitoring, sports and security (Verma et al., 2023).
Another type of passive sensor commonly utilized in HAR systems is the ambient light sensor. These sensors detect changes in lighting conditions within an environment, which can be indicative of certain activities. For instance, a sudden change in light levels might suggest someone entering or leaving a room, or the start and end of different tasks based on lighting patterns. This type of data can complement visual data from cameras, providing a more comprehensive understanding of the context in which activities occur (Mohmed et al., 2020; Natani et al., 2021).
Despite the advantages of passive sensor-based HAR systems, several challenges remain. One major concern is the variability in data quality due to environmental factors, such as lighting changes, weather conditions, and obstructions that can affect sensor readings. For example, the use of cameras raises significant privacy concerns and requires substantial data storage and computational resources to process the visual information efficiently (Narayanan et al., 2023). As a result, future research in passive sensor-based HAR should focus on the ethical implications of using passive sensors, particularly regarding privacy concerns and the potential for misuse in surveillance (Zhang et al., 2023).
3. Proposed Methodology
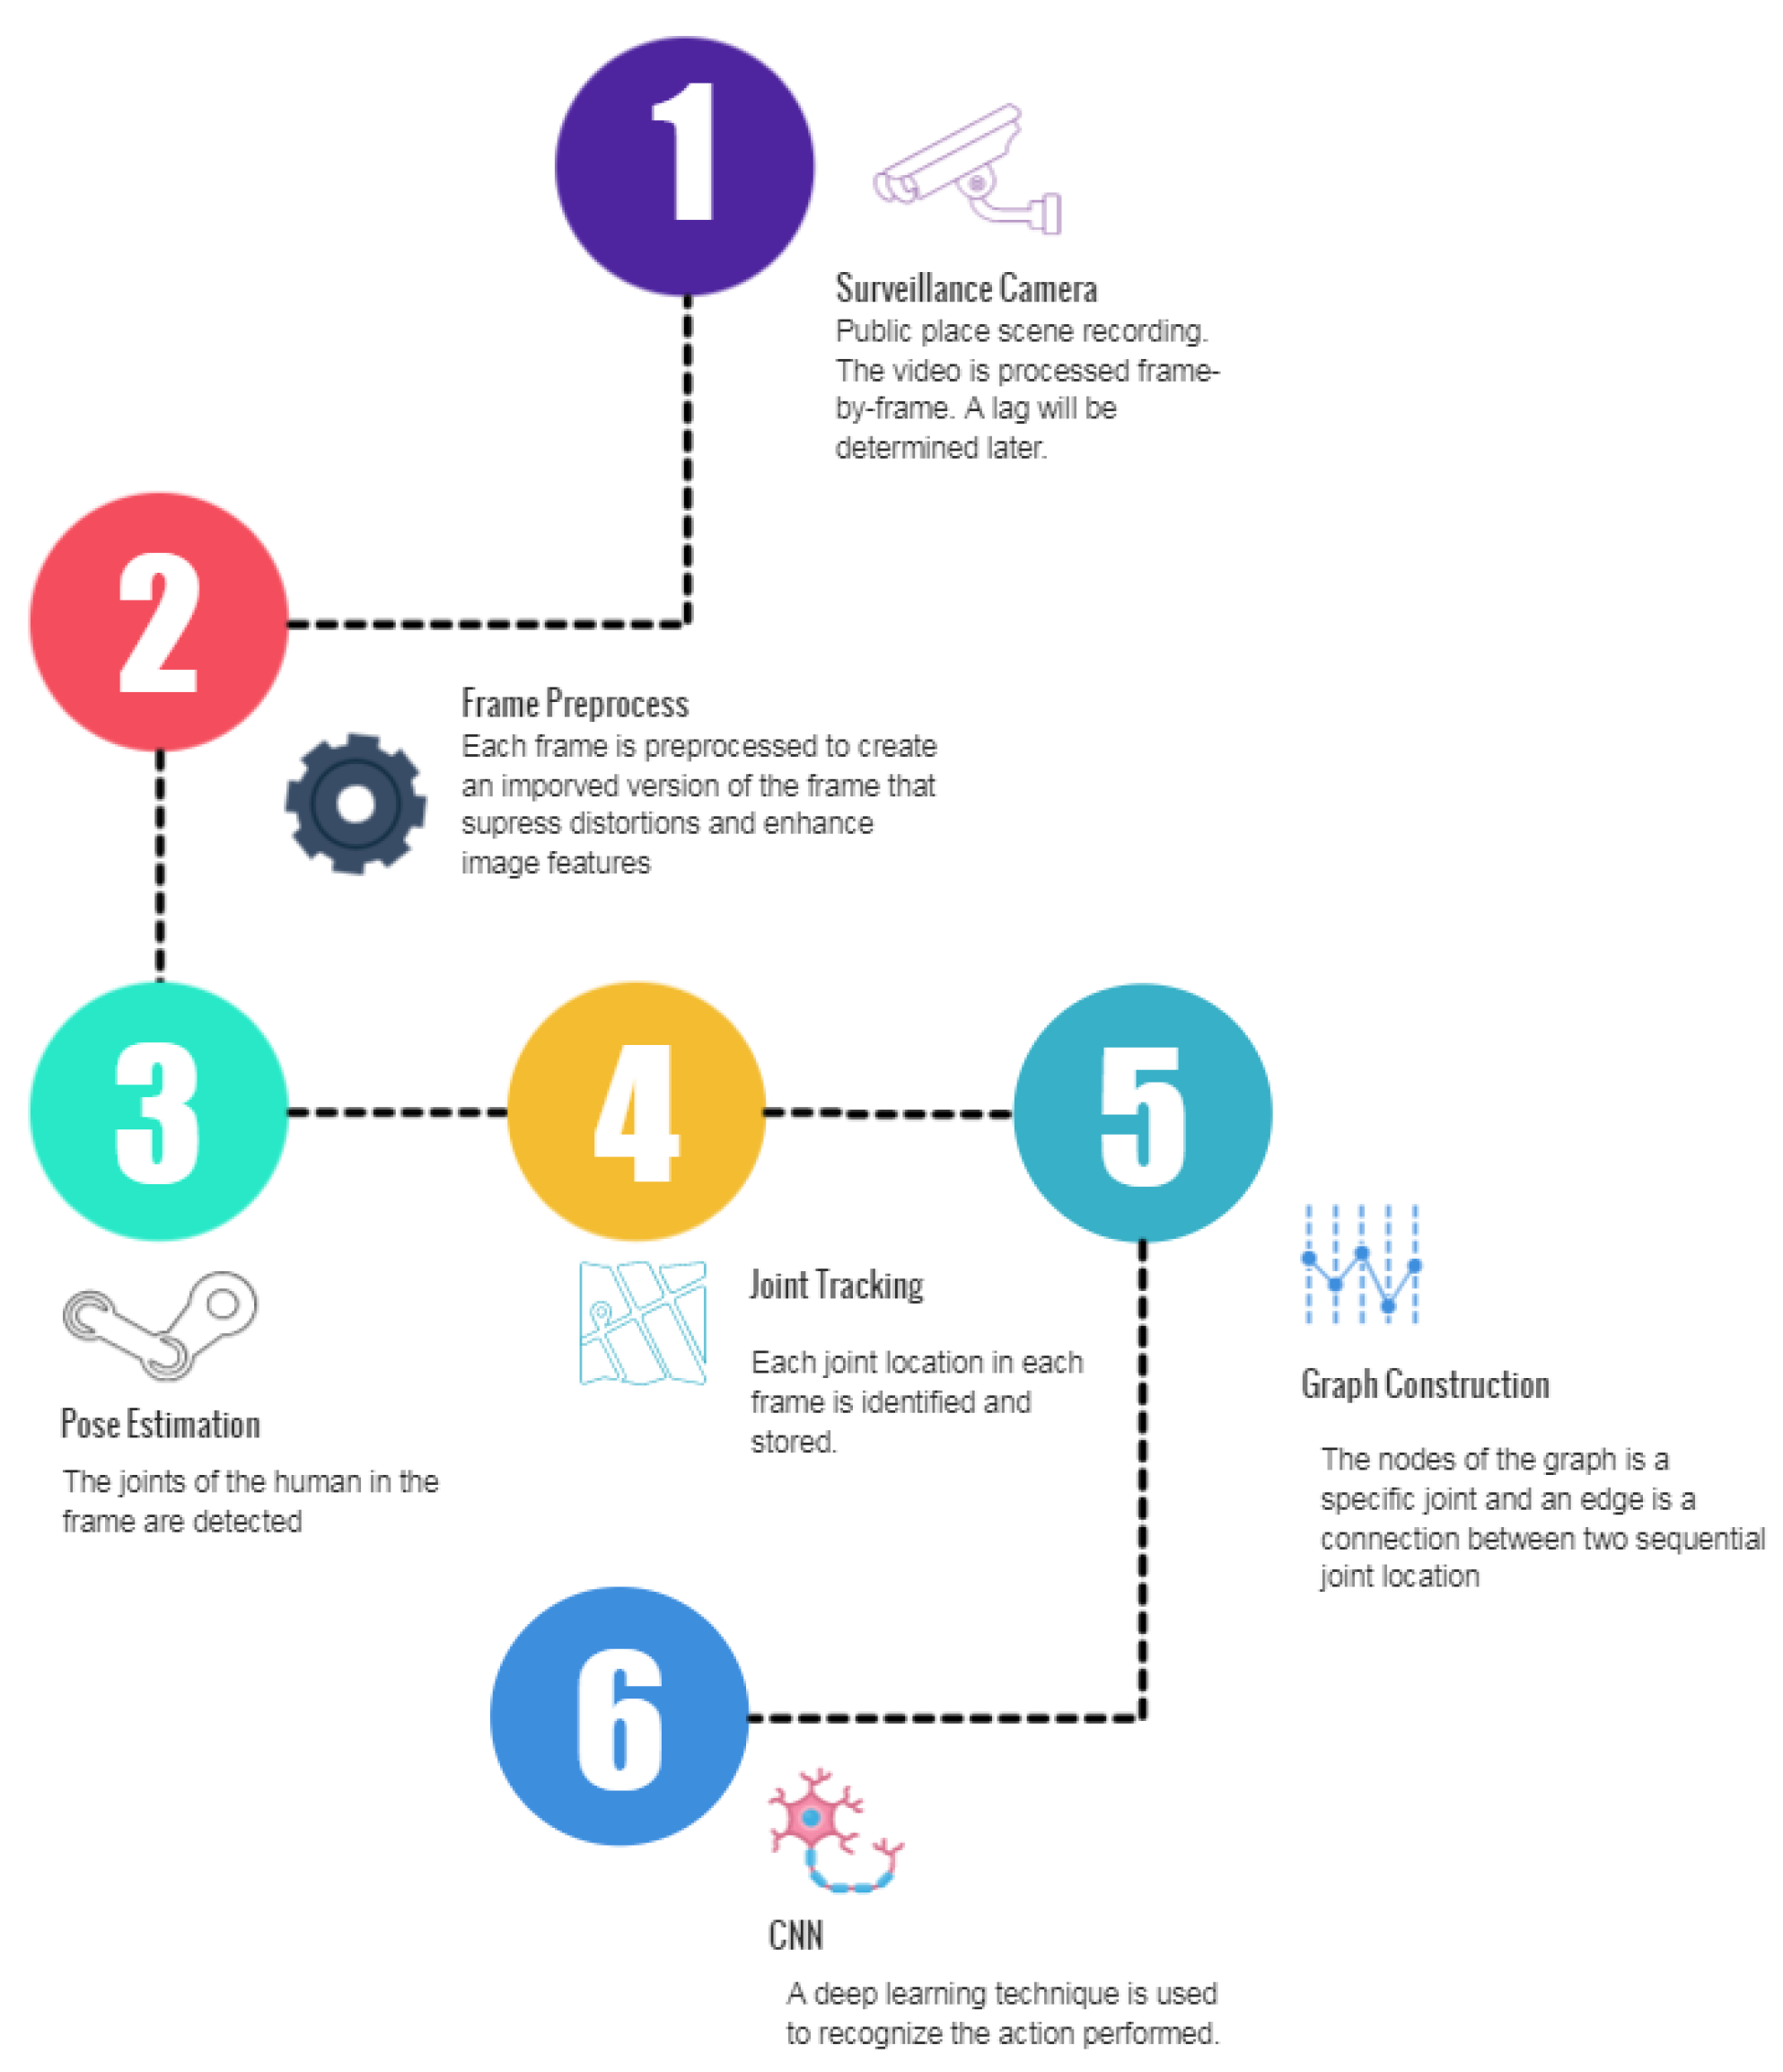
The proposed Human Activity Recognition (HAR) system, as illustrated in
Figure 1, is structured to process data from input to output through a series of specialized components. The process begins with a surveillance camera that captures video footage from public spaces. This video is then processed frame-by-frame in the frame preprocessing stage, where each frame is enhanced to suppress distortions and improve image clarity. Following preprocessing, the system uses pose estimation techniques to detect human joints, identifying key points on the body such as the head, shoulders, and knees. These joints are then tracked across consecutive frames to monitor their positions over time, which is essential for analyzing the dynamics of human activities.
Subsequently, the system constructs a graph from the detected joints in each frame, where a node represents a specific joint, and edges denote the connections between the same joint in two consecutive frames. This graph-based representation encapsulates both spatial relationships and temporal dynamics, offering a detailed understanding of human movement. Finally, a Convolutional Neural Network (CNN) is employed to analyze these graphs. The CNN, trained on various patterns in the graph data, classifies the observed activities by interpreting the spatial-temporal dynamics inherent in the joint movements. This architecture is designed to efficiently and accurately recognize human activities, making it applicable in fields like public safety, healthcare monitoring, and smart surveillance. By integrating graph structures with deep learning techniques, the system aims to deliver robust and reliable activity recognition, even in complex and dynamic environments.
3.1. Camera Raw Data
The HAR system initiates its process with a surveillance camera that captures video footage from public spaces, providing continuous video streams as the primary input data. For HAR systems, there are mainly two types of datasets: Sensors-based and vision-based datasets. The methodology applied in this research considers vision-based dataset only. Vision-based datasets exist for two types of actions that are static and dynamic actions. In static-actions dataset, a description of the action using orientation and limb position in space can be found, while dynamic action datasets related to videos that describe the movement of static activities (Geng et al., 2022).
Accurate recognition of human actions in videos is challenging due to variations in background, lighting, and the dynamic nature of human movements. To address these challenges and robustly evaluate the performance of action recognition algorithms, leveraging multiple datasets is essential. This research aims to measure the performance of our proposed algorithm by using similar actions from two well-known datasets: UCF101 (Soomro et al., 2012), and Kinetics-400 (Kay et al., 2017). By focusing on common actions across these datasets, we can ensure a fair comparison and comprehensive assessment of our algorithm’s capabilities as well as enhancing the generalizability of the recognition model.
The UCF101 dataset consists of 101 action categories, encompassing 13,320 video clips, mainly sourced from YouTube. It provides a rich variety of sports and everyday activities captured in different environments. The Kinetics dataset, particularly in its Kinetics-400 version, contains 400 action categories and approximately 306,245 video clips from YouTube, offering an extensive collection of action scenarios. These datasets are widely used benchmarks in the field, allowing for rigorous testing and validation of action recognition models.
As illustrated in
Table 1, we identified 59 common actions across UCF101 and Kinetics datasets with a total of 63890 videos. The number of videos used from the UCF101 dataset was 7,864, representing approximately 59% of the dataset, while 56,026 videos were used from the Kinetics-400 dataset, representing approximately 18.3% of the dataset. The selection of 59 common actions between the UCF-101 and Kinetics-400 datasets ensures a consistent basis for evaluating the proposed HAR system's performance across different settings and environments. This approach allows for a comprehensive examination of the system's ability to generalize across datasets and recognize activities with inherent variability.
The decision to use only the 59 common actions shared between the UCF-101 and Kinetics-400 datasets, despite the fact that each dataset contains a greater number of actions, was made to ensure consistency and comparability in the evaluation. Using all the actions from both datasets would have introduced variability and imbalance, as each dataset has many unique activities that are not present in the other. This inconsistency could lead to biases when comparing the model’s performance, making it difficult to establish a fair benchmark. By focusing solely on the common actions, the study maintains a standardized and uniform evaluation framework that allows for a more direct comparison of model effectiveness.
Additionally, limiting the number of actions helps mitigate the risk of overfitting. When training on an excessive and potentially unbalanced set of activities, the model may learn specific patterns that do not generalize well beyond the dataset. Such overfitting is particularly likely when dealing with niche or highly specific actions that are overrepresented in one dataset but absent in the other. By focusing on the common actions, the model is trained on a balanced set of movements that are more likely to generalize well, enhancing the applicability of the HAR system to a broader range of real-world situations.
3.2. Frame Preprocess
Given the diverse range of videos in the dataset used for this research, each frame must undergo preprocessing to standardize the visual quality. This involves adjusting illumination and contrast to ensure consistent frame quality. Preprocessing not only enhances frame quality but also reduces training time and improves model accuracy. In this research, several preprocessing techniques are applied, including mean normalization, histogram equalization, and data rescaling. These techniques help to normalize the data and enhance the overall effectiveness of the HAR system.
3.2.1. Mean Normalization
Mean normalization is a preprocessing technique used to standardize data by adjusting its scale and distribution. The equation for mean normalization is equation (1).
where
x represents the original data point,
μ is the mean of the dataset, and
is the range, calculated as the difference between the maximum and minimum values in the dataset.
This technique is particularly useful in reducing the influence of outliers and ensuring that the data is centered around zero, which can enhance the performance of machine learning models by improving convergence during training.
3.2.2. Histogram Equalization
Histogram equalization is a technique used to enhance the contrast of an image by redistributing its intensity values. The process is mathematically represented by the equation (2).
where
denotes the new intensity value for the
-th pixel in the equalized image. In this equation
, represents the total number of possible intensity levels,
and
are the dimensions of the image, indicating the total number of pixels, and
is the number of pixels with the intensity value
in the original image. The term
calculates the cumulative distribution function (CDF) up to intensity level
. By adjusting the pixel values based on the CDF, histogram equalization spreads out the intensity values over the available range, thus enhancing the contrast of the image. This technique is especially useful for images with poor contrast, allowing more details to be visible by broadening the range of pixel intensities.
3.2.3. Data Rescaling
Data rescaling, commonly referred to as min-max normalization, is a method used to adjust the range of data values to a specific scale, typically between 0 and 1 or -1 and 1. This technique is represented by the equation (3).
where
is the normalized value,
is the original data value, and
and
are the minimum and maximum values of the data set, respectively. By applying this formula, the data is scaled so that the minimum value becomes 0 and the maximum value becomes 1. Min-max normalization is particularly useful in machine learning, as it ensures that different features contribute proportionately to the model's training process, preventing features with larger scales from disproportionately influencing the model's outcomes.
3.3. Pose Estimation
In this research, the OpenPose algorithm (Cao et al., 2017) was employed for pose estimation, a crucial step in understanding and analyzing human activities. OpenPose is a state-of-the-art algorithm designed to detect human poses from images and videos by identifying key points on the human body, such as the head, shoulders, elbows, wrists, hips, knees, and ankles. The algorithm provides a detailed skeleton-like representation for each individual in the scene, capturing the spatial relationships between joints. This capability makes OpenPose particularly suitable for complex scenarios involving multiple individuals or dynamic movements.
The process begins by feeding video frames into the OpenPose system, where each frame is processed independently. OpenPose uses a two-branch multi-stage CNN architecture. The first branch predicts confidence maps for the location of each key point, while the second branch predicts part affinity fields—vector fields that encode the location and orientation of limbs. These outputs are combined to construct a coherent representation of the pose for each person in the image. The system iteratively refines its predictions through several stages, enhancing the accuracy of joint detection and association. This iterative refinement is crucial for ensuring high precision, especially in environments where joints are partially occluded (Cao et al., 2021).
By applying OpenPose, this research achieved a high level of accuracy in pose estimation, which is essential for subsequent stages of analysis. The detailed representation of joint positions and the relationships between them enable a comprehensive understanding of human movement patterns. This data forms the basis for constructing graph-based representations used in the study to analyze and classify activities. The robustness of OpenPose in handling varying scales, orientations, and occlusions makes it a reliable tool for real-world applications, ranging from healthcare monitoring and sports analysis to security and surveillance. The algorithm's ability to work with standard video inputs without the need for specialized equipment further enhances its practicality and accessibility for various research and applications.
3.4. Joint Tracking
Capturing the temporal information in a video is very challenging. However, this can be obtained by tracking the joints. The objective of joint tracking is to continuously monitor and analyze human body movements throughout the video frames. This process involves identifying and following the positions of key body joints—such as the head, shoulders, elbows, hips, knees, and ankles—across consecutive frames in a video sequence. By accurately tracking these joints, the system can map the trajectory of each joint over time, capturing the dynamic aspects of human movement. This temporal information is essential for understanding activities, as it allows the system to differentiate between various actions based on the patterns and sequences of joint movements. Joint tracking also plays a pivotal role in handling occlusions and other visual challenges, as it maintains the continuity of motion data even when some joints are temporarily not visible. This capability is crucial for applications in sports analysis, healthcare monitoring, and surveillance, where precise and reliable tracking of body movements is necessary.
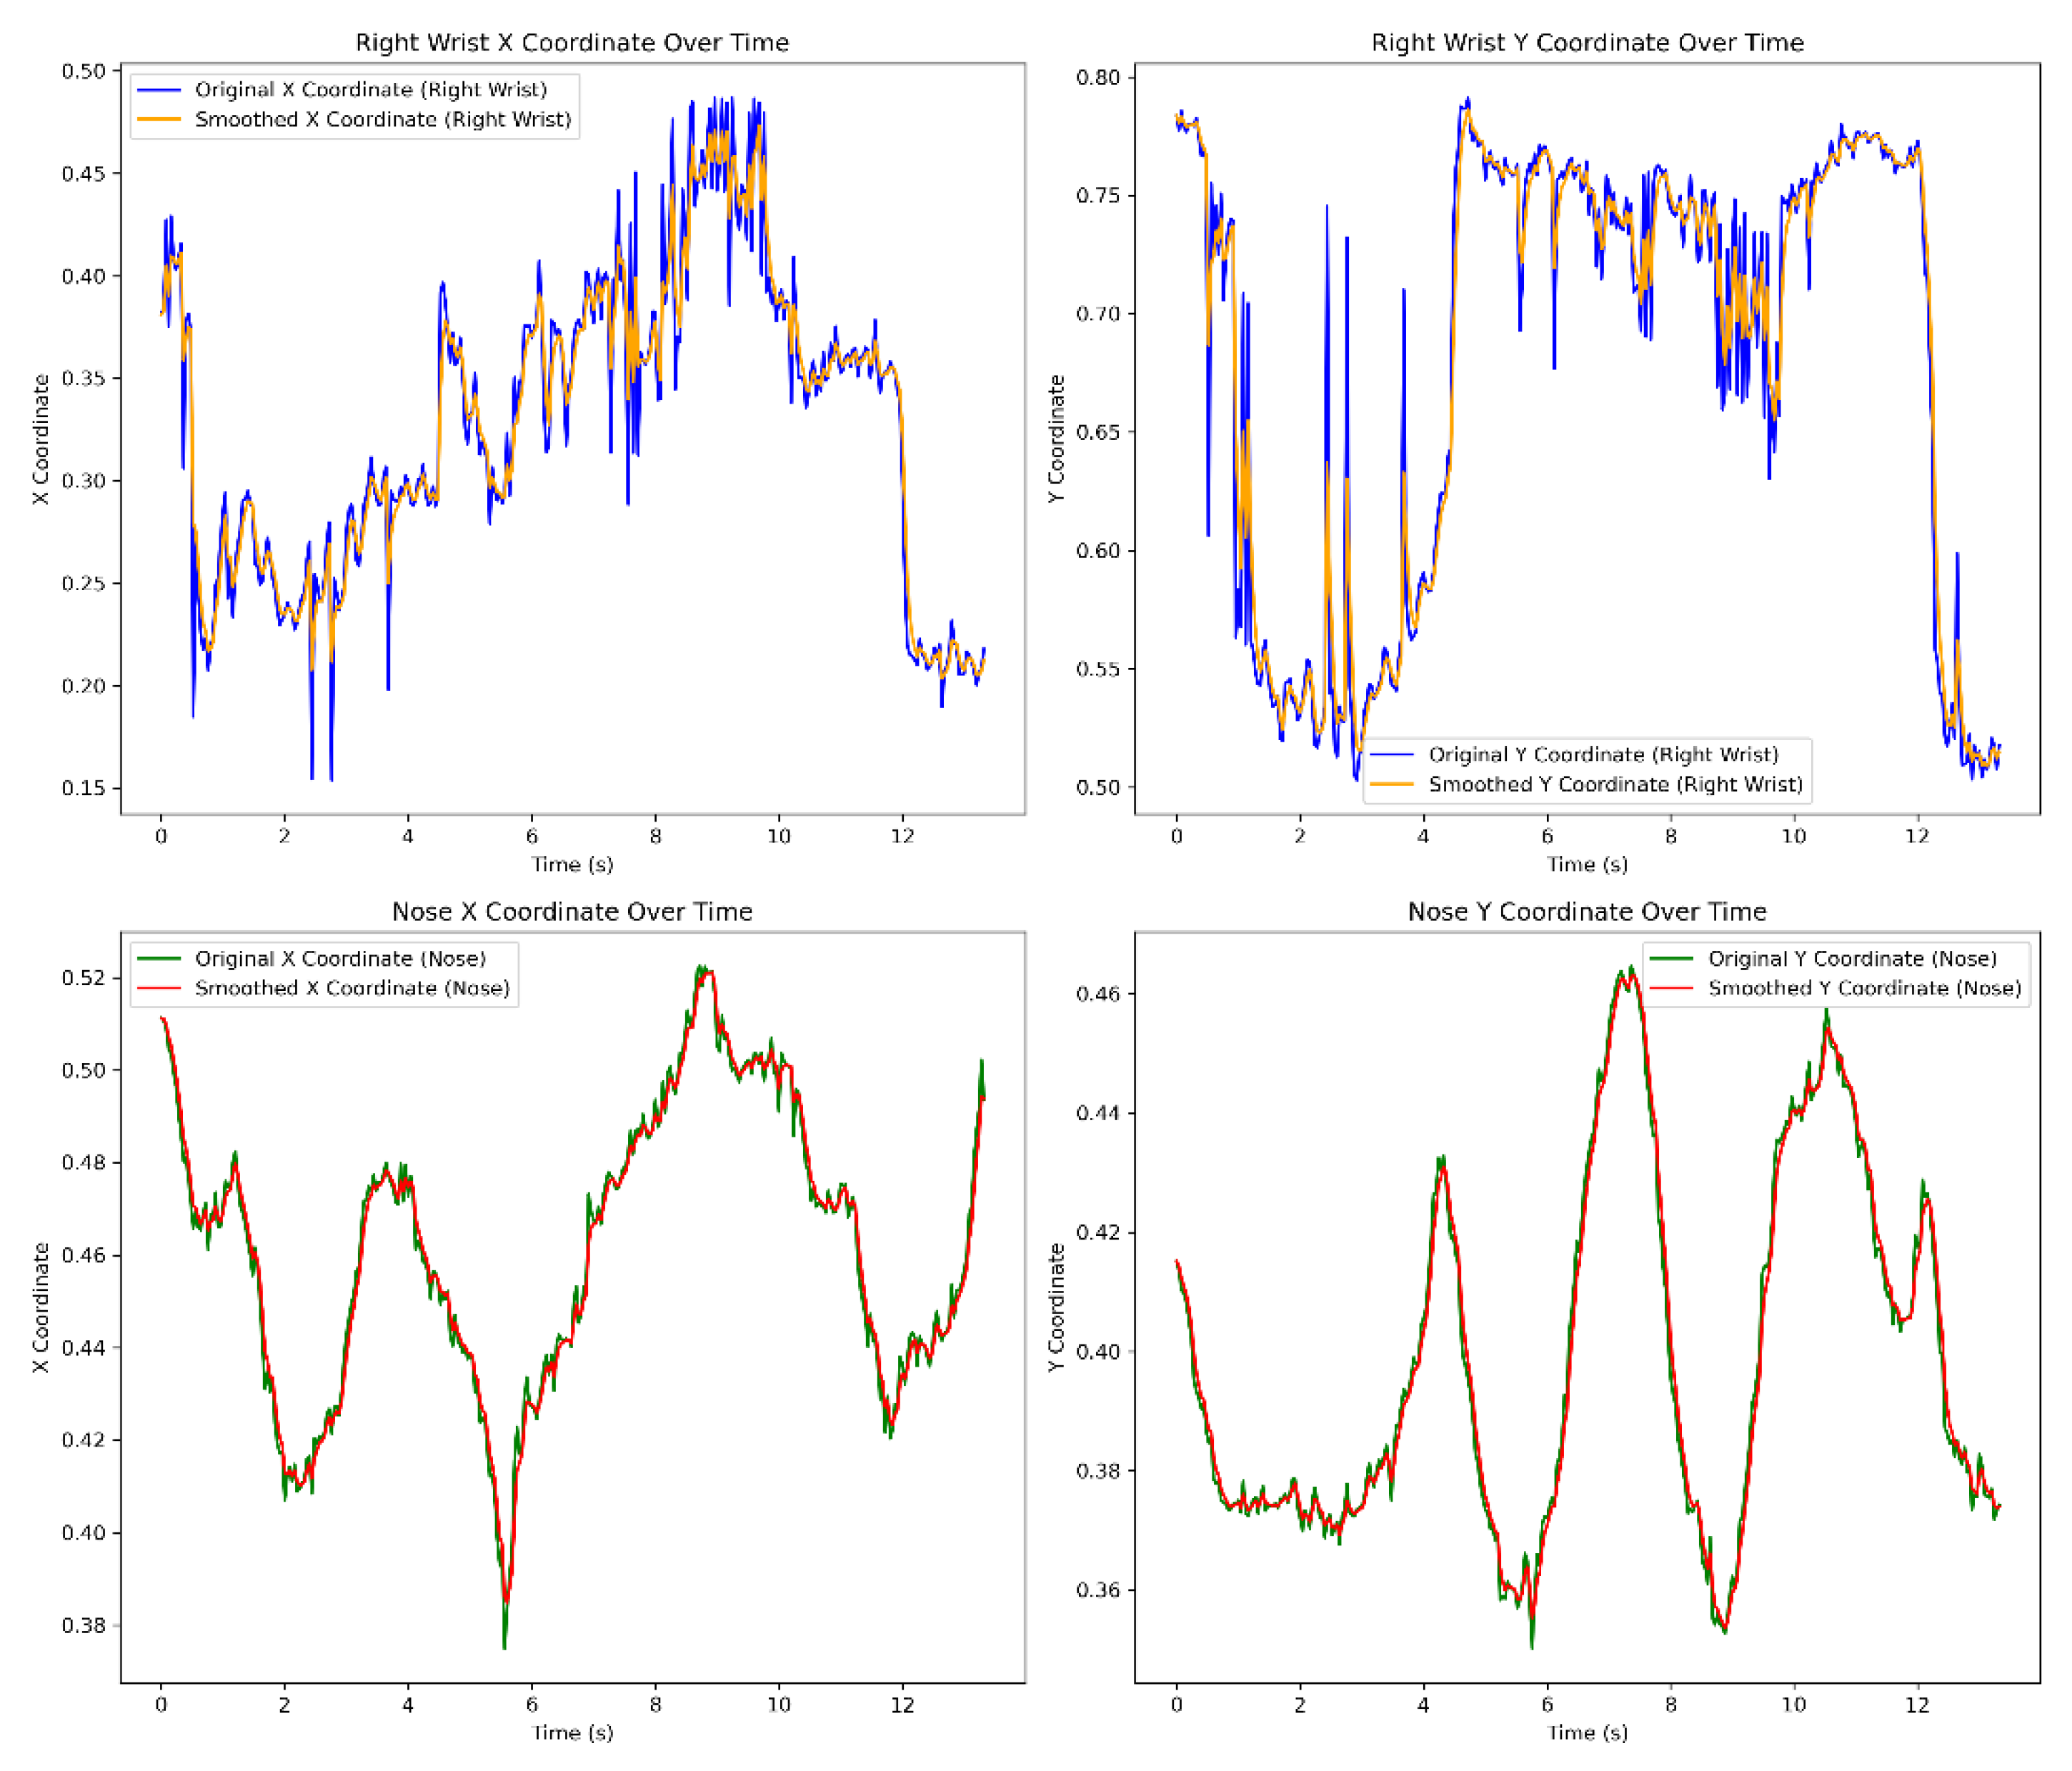
In
Figure 2, the coordinates of the right wrist and nose of a person waving their right hand in a video are illustrated over time. The top left subplot depicts the X coordinate of the right wrist, featuring both the original and smoothed data series. Similarly, the top right subplot shows the Y coordinate of the right wrist. The bottom left and right subplots display the X and Y coordinates of the nose, respectively, also with both original and smoothed data series.
The original data, depicted in the top subplots of
Figure 2, exhibits noticeable variability, indicating potential noise or rapid movements. In contrast, the smoothed version offers a clearer depiction of the overall movement patterns by reducing the influence of noise. This smoothing effect is particularly evident in the right wrist coordinates, where fluctuations are significantly attenuated.
The visualisation effectively communicates the temporal evolution of these coordinates, facilitating the analysis of movement patterns. The distinction between the original and smoothed data underscores the importance of data processing in motion analysis, highlighting the utility of smoothing techniques in revealing underlying trends amidst noisy data.
3.5. Graph Construction
Graph construction is heart of the proposed HAR system, as it involves transforming the spatial and temporal data of human joints into a structured format suitable for deep learning analysis. In this process, each human joint detected in the pose estimation phase is represented as a node in the graph. The connections between these nodes, known as edges, represent the anatomical connections between the joints. These edges capture both the spatial proximity and the sequential movement patterns of the joints throughout the video, providing a comprehensive view of the body's configuration and dynamics.
The graph construction process begins with the definition of nodes and edges. Each node corresponds to a specific joint, such as the head, shoulders, elbows, wrists, hips, knees, or ankles. The edges between nodes are defined based on the natural anatomical connections (e.g., shoulder to elbow, elbow to wrist) and are weighted to reflect the significance or strength of these connections. The weights determine the relative velocity between two joints in the video.
To construct the graph, the joint positions are first normalized to a consistent scale to account for variations in camera angles, distances, and subject sizes. This normalization ensures that the graph accurately represents the relative positions and movements of the joints, regardless of external factors. The nodes and edges are then instantiated, with edges being annotated with weights correspond to relative velocity between two joints to capture temporal dynamics between them during the activity.
To calculate the relative velocity between the joints, we applied equation (4) as follow:
where,
and
are the velocity vectors of the joint
and joint
. The output is a vector that represents how fast and in what direction
is moving relative to
in the video. The velocity vector of a joint is calculated by deriving the first derivative of the position data over time as in equation (5). This provides insights into the speed and movement direction of the joint for all video frames.
where
is the position vector as a function of time
. After finding the relative velocity between two joints, we find the relative velocity magnitude and represent this value as the edge weight between the incorporated joints. The calculation of relative velocity magnitude is found using equation (6) as the function
.
For two joints with positions
and
at time
, and their positions
and
at time
, the relative velocity magnitude can be calculated as,
This calculation shows how the relative position between the two joints changes over the time interval Δt, providing a measure of their relative motion.
The resulting graph encapsulates both the spatial configuration and temporal evolution of the body, allowing for robust recognition and classification of human activities based on complex movement patterns. By utilizing this structured representation, the system can better handle variations in human poses and movements, improving accuracy and robustness in real-world applications. It is noteworthy to mention that in case of occlusions, the magnitude between an existing joint and the occluded joint is set to zero.
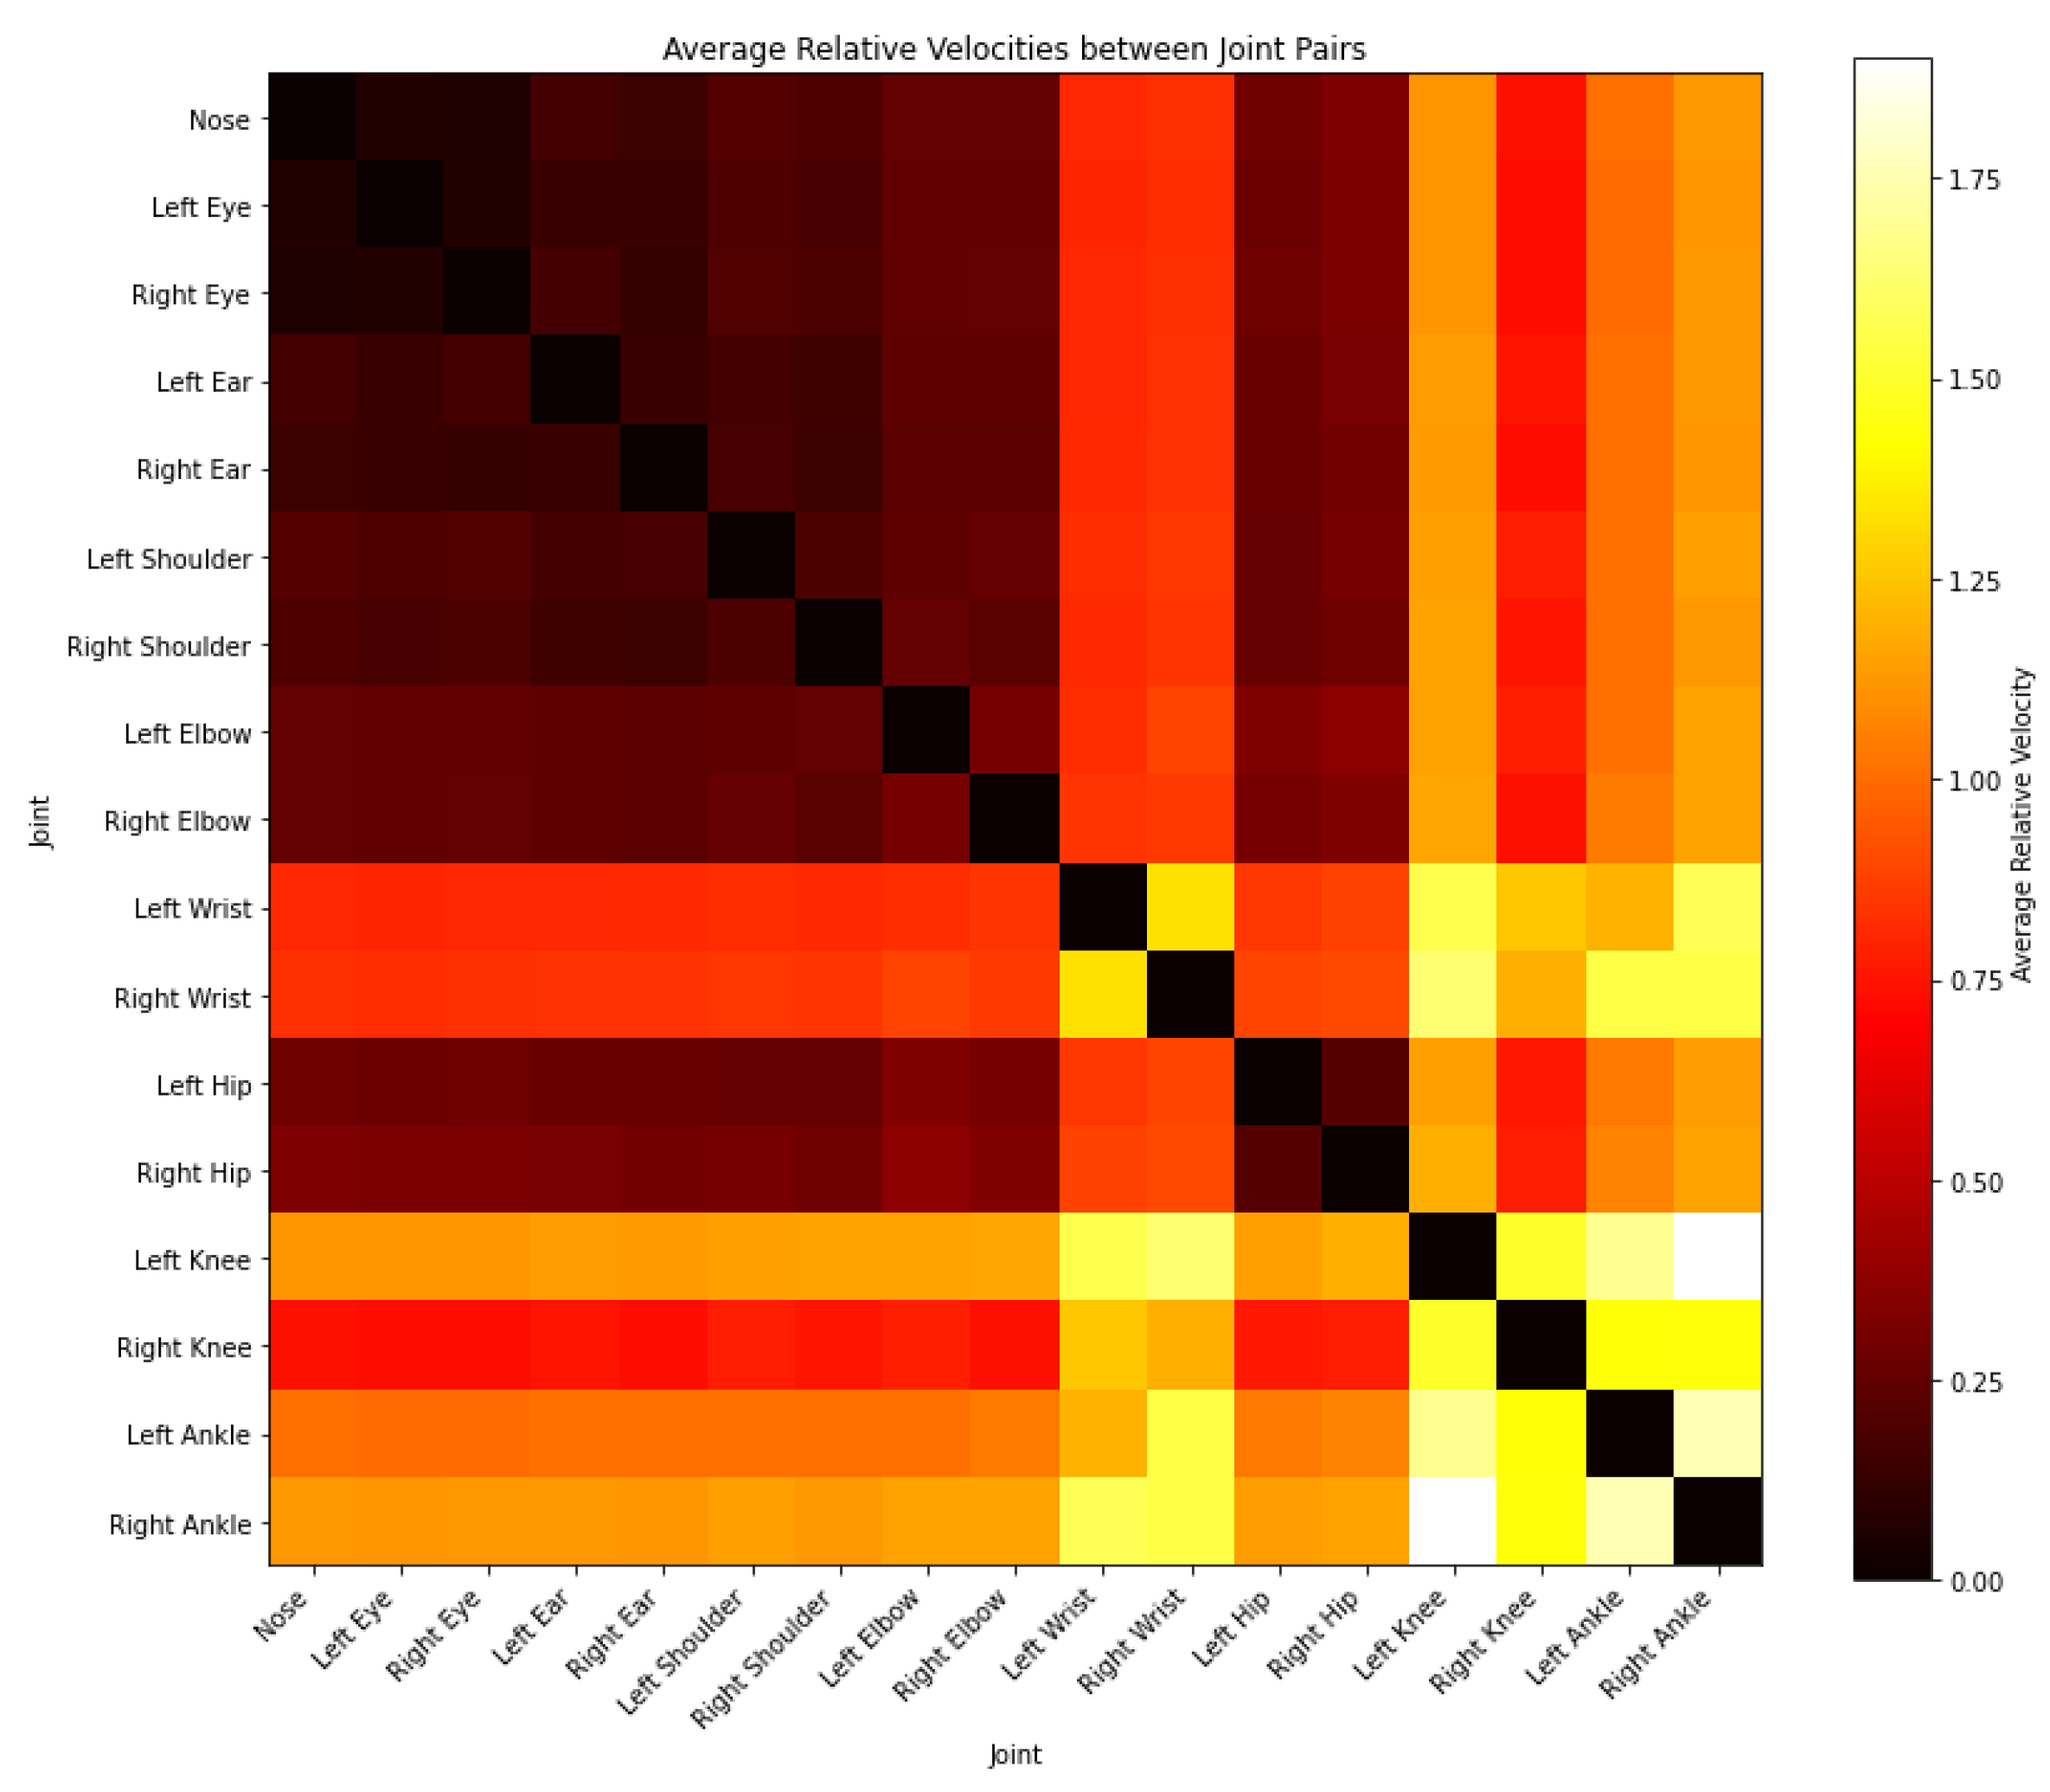
Figure 3 illustrates the graph structure as a heatmap visualizes the average relative velocities between different joint pairs during a human waving their right hand. Using a color gradient from dark red to yellow, where dark red indicates lower relative velocities and yellow indicates higher relative velocities, the heatmap offers a clear depiction of joint activity. The diagonal elements are black, reflecting that the relative velocity of a joint with itself is zero. Notably, the brightest areas (yellow) highlight higher relative velocities between the right shoulder, right elbow, and right wrist, consistent with the waving motion. Conversely, the lower body joints display darker colors, indicating minimal movement. An asymmetry is evident, with higher velocities on the right side of the body, aligning with the right-hand waving action. This heatmap effectively showcases the dynamic coordination between body joints during the activity, providing valuable insights into joint movement and synchronization.
3.6. Convolution Neural Network
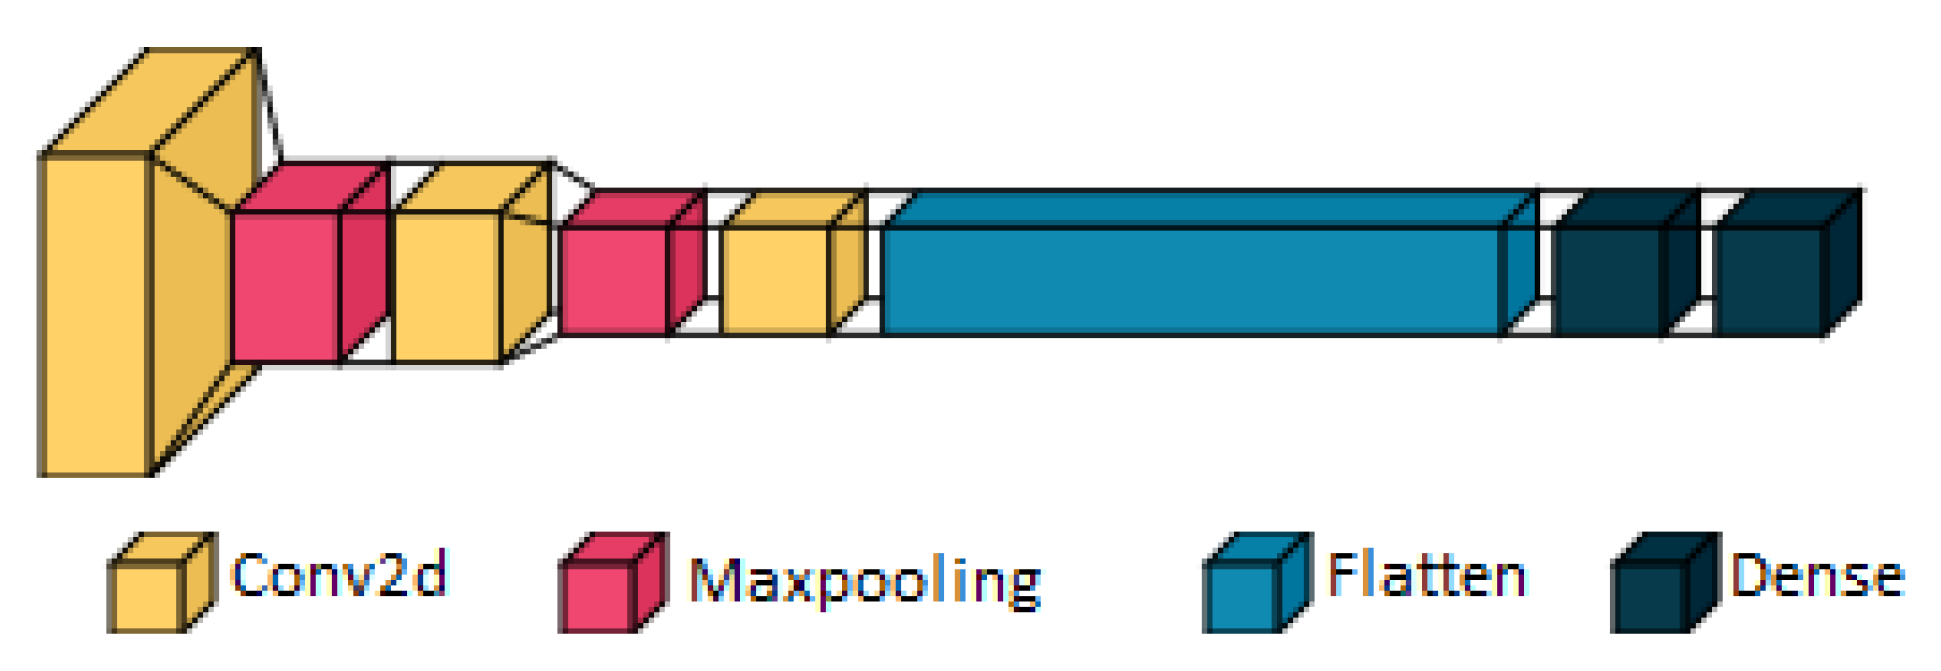
The classification model used in this research starts with an input layer designed to receive 17x17 (17 joints considered in the research) matrix with a single channel that represents the graph structure describe in
Section 3.5.
Figure 4 illustrates the architecture of the CNN model. The input layer feeds into a series of convolutional layers, each followed by a max pooling layer. Equation (7) provides the mathematical formula of a convolution layer, where equation (8) provides the mathematical formula of the max pooling layer. The first convolutional layer consists of 32 filters with a kernel size of 3x3 and uses the ReLU activation function, which introduces non-linearity by outputting the input directly if it is positive and zero otherwise. This layer is followed by a max pooling layer with a 2x2 pool size, which reduces the spatial dimensions of the feature maps by taking the maximum value over each 2x2 block, thus reducing the number of parameters and computation in the network.
where
is the input matrix,
is the convolution kernel,
and
are the dimensions of the kernel.
Next, a second convolutional layer with 64 filters, a 3x3 kernel, and ReLU activation is added. This layer employs 'same' padding to ensure that the output feature map has the same spatial dimensions as the input. Another max pooling layer with a 2x2 pool size follows, further reducing the spatial dimensions of the feature maps. The third convolutional layer comprises 128 filters, also with a 3x3 kernel size and ReLU activation, and uses 'same' padding to maintain the spatial dimensions of the feature maps.
Following the convolutional layers, the feature maps are flattened into a one-dimensional vector, which serves as the input to the fully connected (dense) layers. The first dense layer contains 128 neurons and uses the ReLU activation function to introduce non-linearity. The second dense layer also has a number of neurons (optimized during hyperparameter tuning) and uses the ReLU activation function. The final dense layer is the output layer, containing 5 neurons (corresponding to the number of classes in the dataset), and uses the softmax activation function. The softmax function converts the output scores into probabilities, facilitating the classification of the input images into one of the five classes.
3.7. Hyperparameter Optimization Using Firefly Algorithm
The CNN model described in
Section 3.6 is a traditional architecture with three convolutional layers, where the number of filters increases in each subsequent layer. Specifically, the first convolutional layer uses 32 filters, the second uses 64 filters, and the third uses 128 filters. These filter counts are commonly used in simple CNN models to progressively capture more complex features from the input data and each layer refines the features extracted by the previous layers.
The accuracy of such a model is significantly influenced by the chosen hyperparameters, including the number of filters in each convolutional layer, learning rate, number and size of dense layers, batch size, and the number of neurons in the dense layers. To enhance the performance of the CNN model in this research, hyperparameters were optimized using the Firefly Optimization Algorithm (Yang, 2010).
The Firefly Optimization Algorithm is a metaheuristic optimization technique that simulates the behavior of fireflies, where the attractiveness and movement of fireflies are governed by their brightness. The key idea behind the Firefly Algorithm is that each firefly is attracted to brighter fireflies, with the brightness being proportional to the objective function being optimized.
In this research, the Firefly Algorithm was employed to optimize the hyperparameters of the CNN model, including the number of neurons in the dense layers, learning rate, batch size, and the number of filters in the convolutional layers. The optimization process involved using 10 fireflies over 20 iterations, allowing for effective exploration of the hyperparameter space to find optimal values. The steps of the Firefly Algorithm are as follows:
1. Initialization:
Initialize a population of fireflies with random positions in the search space. Each firefly represents a potential solution. In this research the initial number of fireflies is 10 with 20 iterations.
2. Attractiveness:
The light intensity
of a firefly at a particular location
is determined by the objective function
. The attractiveness
of a firefly is given by equation (9):
where
is the maximum attractiveness,
is the light absorption coefficient, and
is the distance between two fireflies. In this research
is set to 1.0.
3. Distance Calculation
The distance
between two fireflies
and
at positions
and
is calculated using the Euclidean distance as in equation (10):
4. Movement:
A firefly
moves towards a more attractive (brighter) firefly
. The movement is determined by equation (11):
where
is a randomized parameter and is
a random number uniformly distributed between 0 and 1.
The value of used in this research is set to 0.2, where the value of is 0.5. The term ensures that fireflies move towards each other based on their attractiveness, which is stronger for closer and brighter fireflies. The exponential factor ensures that the influence decreases with distance, making distant fireflies less attractive. The term introduces stochastic behavior, preventing the algorithm from getting stuck in local optima and enhancing exploration of the search space.
4. Results
In this section, we present the outcomes of our experiments, demonstrating the effectiveness of our proposed Human Activity Recognition (HAR) system that integrates graph structures and deep neural networks. The evaluation is conducted in comparison with traditional HAR methods, with a focus on several performance metrics: accuracy, precision, recall, and F1-score. These metrics provide a comprehensive view of the algorithm's ability to correctly identify human activities while minimizing false detections.
4.1. Experimental Setup
To evaluate the performance of the proposed HAR system, we utilized two well-known datasets: UCF-101 and Kinetics-400. We selected 59 common actions shared between these datasets to ensure consistency in evaluating our system's ability to generalize across different environments and contexts. The use of only common actions helped in maintaining a balanced training dataset, reducing the risk of overfitting and ensuring a more representative assessment of the model's capabilities.
The experiments were conducted in a controlled environment using a standard computational setup. We applied preprocessing techniques including mean normalization, histogram equalization, and data rescaling to enhance the quality of video frames and facilitate efficient training of the deep learning model. The OpenPose algorithm was used for pose estimation, allowing us to detect and track the 3D trajectories of human joints, which were then represented as graph structures.
To facilitate a more detailed analysis of the results, the 59 selected actions were categorized into four groups based on the movement speed of human joints during the actions: Sports and Athletics, Household and Routine Activities, Musical and Performing Arts and Outdoor and Adventure Activities.
Table 2 illustrates the actions of each group. It is important to note that the model's final layer consists of 59 outputs, with each output corresponding to a specific action. To determine the accuracy for each group, we calculated the average accuracy of all actions within that group.
4.2. Hyperparameter Optimization Using Firefly Algorithm
After designing the initial architecture of the HAR system, the Firefly Optimization Algorithm, as described in
Section 3.7, was applied to fine-tune the model's hyperparameters. The primary objective of this optimization was to enhance the model's overall performance by determining the most effective combination of hyperparameters such as learning rate, batch size, and the number of neurons in the dense layers, which are known to have a significant impact on the model's ability to generalize and accurately classify human activities.
The results before and after optimization are summarized in
Table 3. The application of the Firefly algorithm resulted in a significant improvement in all key performance metrics. The overall accuracy of the system increased from 85.1% to 88.9%, precision improved from 83.3% to 86.4%, recall increased from 84.6% to 87.0%, and the F1-score rose from 83.5% to 86.7%. This demonstrates the effectiveness of the Firefly Optimization Algorithm in fine-tuning the model to achieve higher classification accuracy while maintaining a balanced trade-off between precision and recall.
The hyperparameters tuned during the optimization process are listed in
Table 4. The most significant changes were seen in the learning rate and the number of filters in the convolutional layers and the number of neurons in dense layers. The optimized model with these tuned hyperparameters demonstrated improved learning efficiency and convergence, as reflected in the final performance metrics.
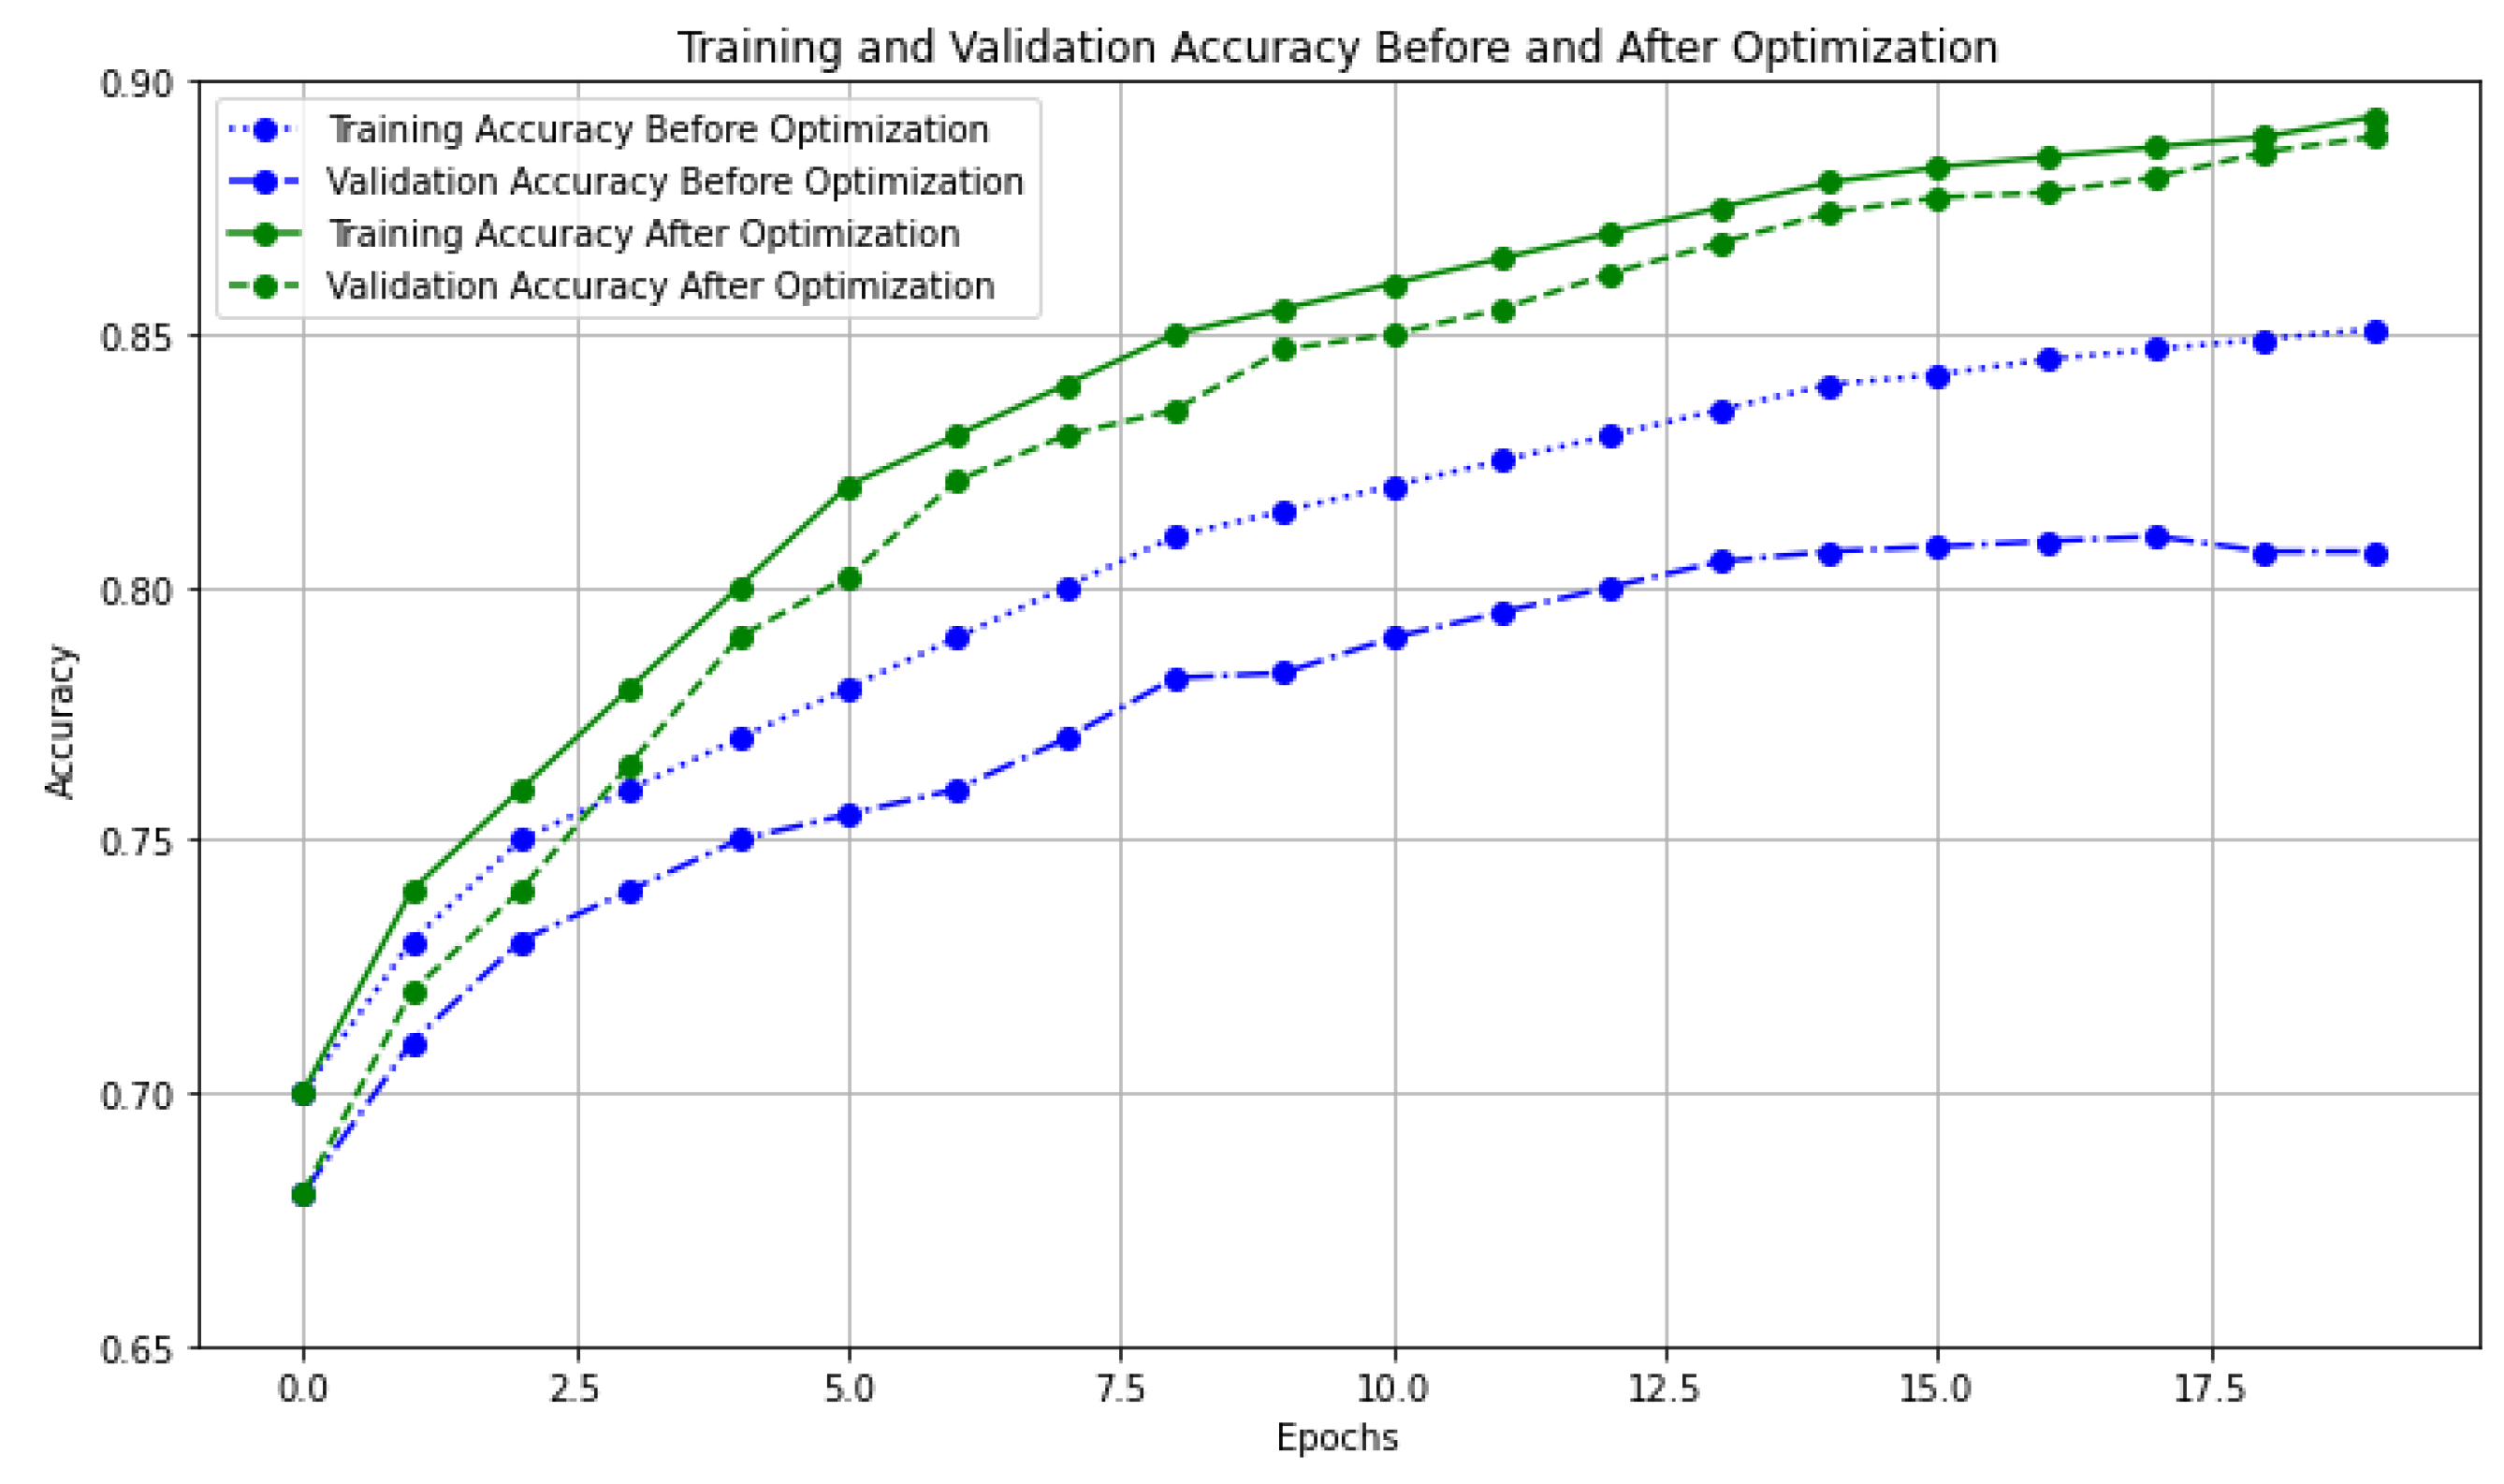
The training and validation before and after the optimization are depicted in
Figure 5. Before optimization, the training accuracy steadily increased and plateaued at around 85.1%, indicating that the model was learning effectively but had reached its performance limit. The validation accuracy, however, reached only about 81.7%, suggesting that the model’s performance on unseen data was weaker compared to the training data. The noticeable gap between training and validation accuracies before optimization indicates that the model was prone to overfitting and had limited generalization capability.
After optimization, the training accuracy improved more rapidly, reaching a final accuracy of 88.9%, demonstrating the significant impact of the optimization process. Similarly, the validation accuracy saw a substantial improvement, rising to 88.8%, closely matching the training accuracy. This indicates that the optimization not only enhanced the model's training performance but also significantly improved its generalization ability. The optimization process successfully boosted both training and validation accuracy, making the model more robust and less prone to overfitting.
4.3. Overall System Performance
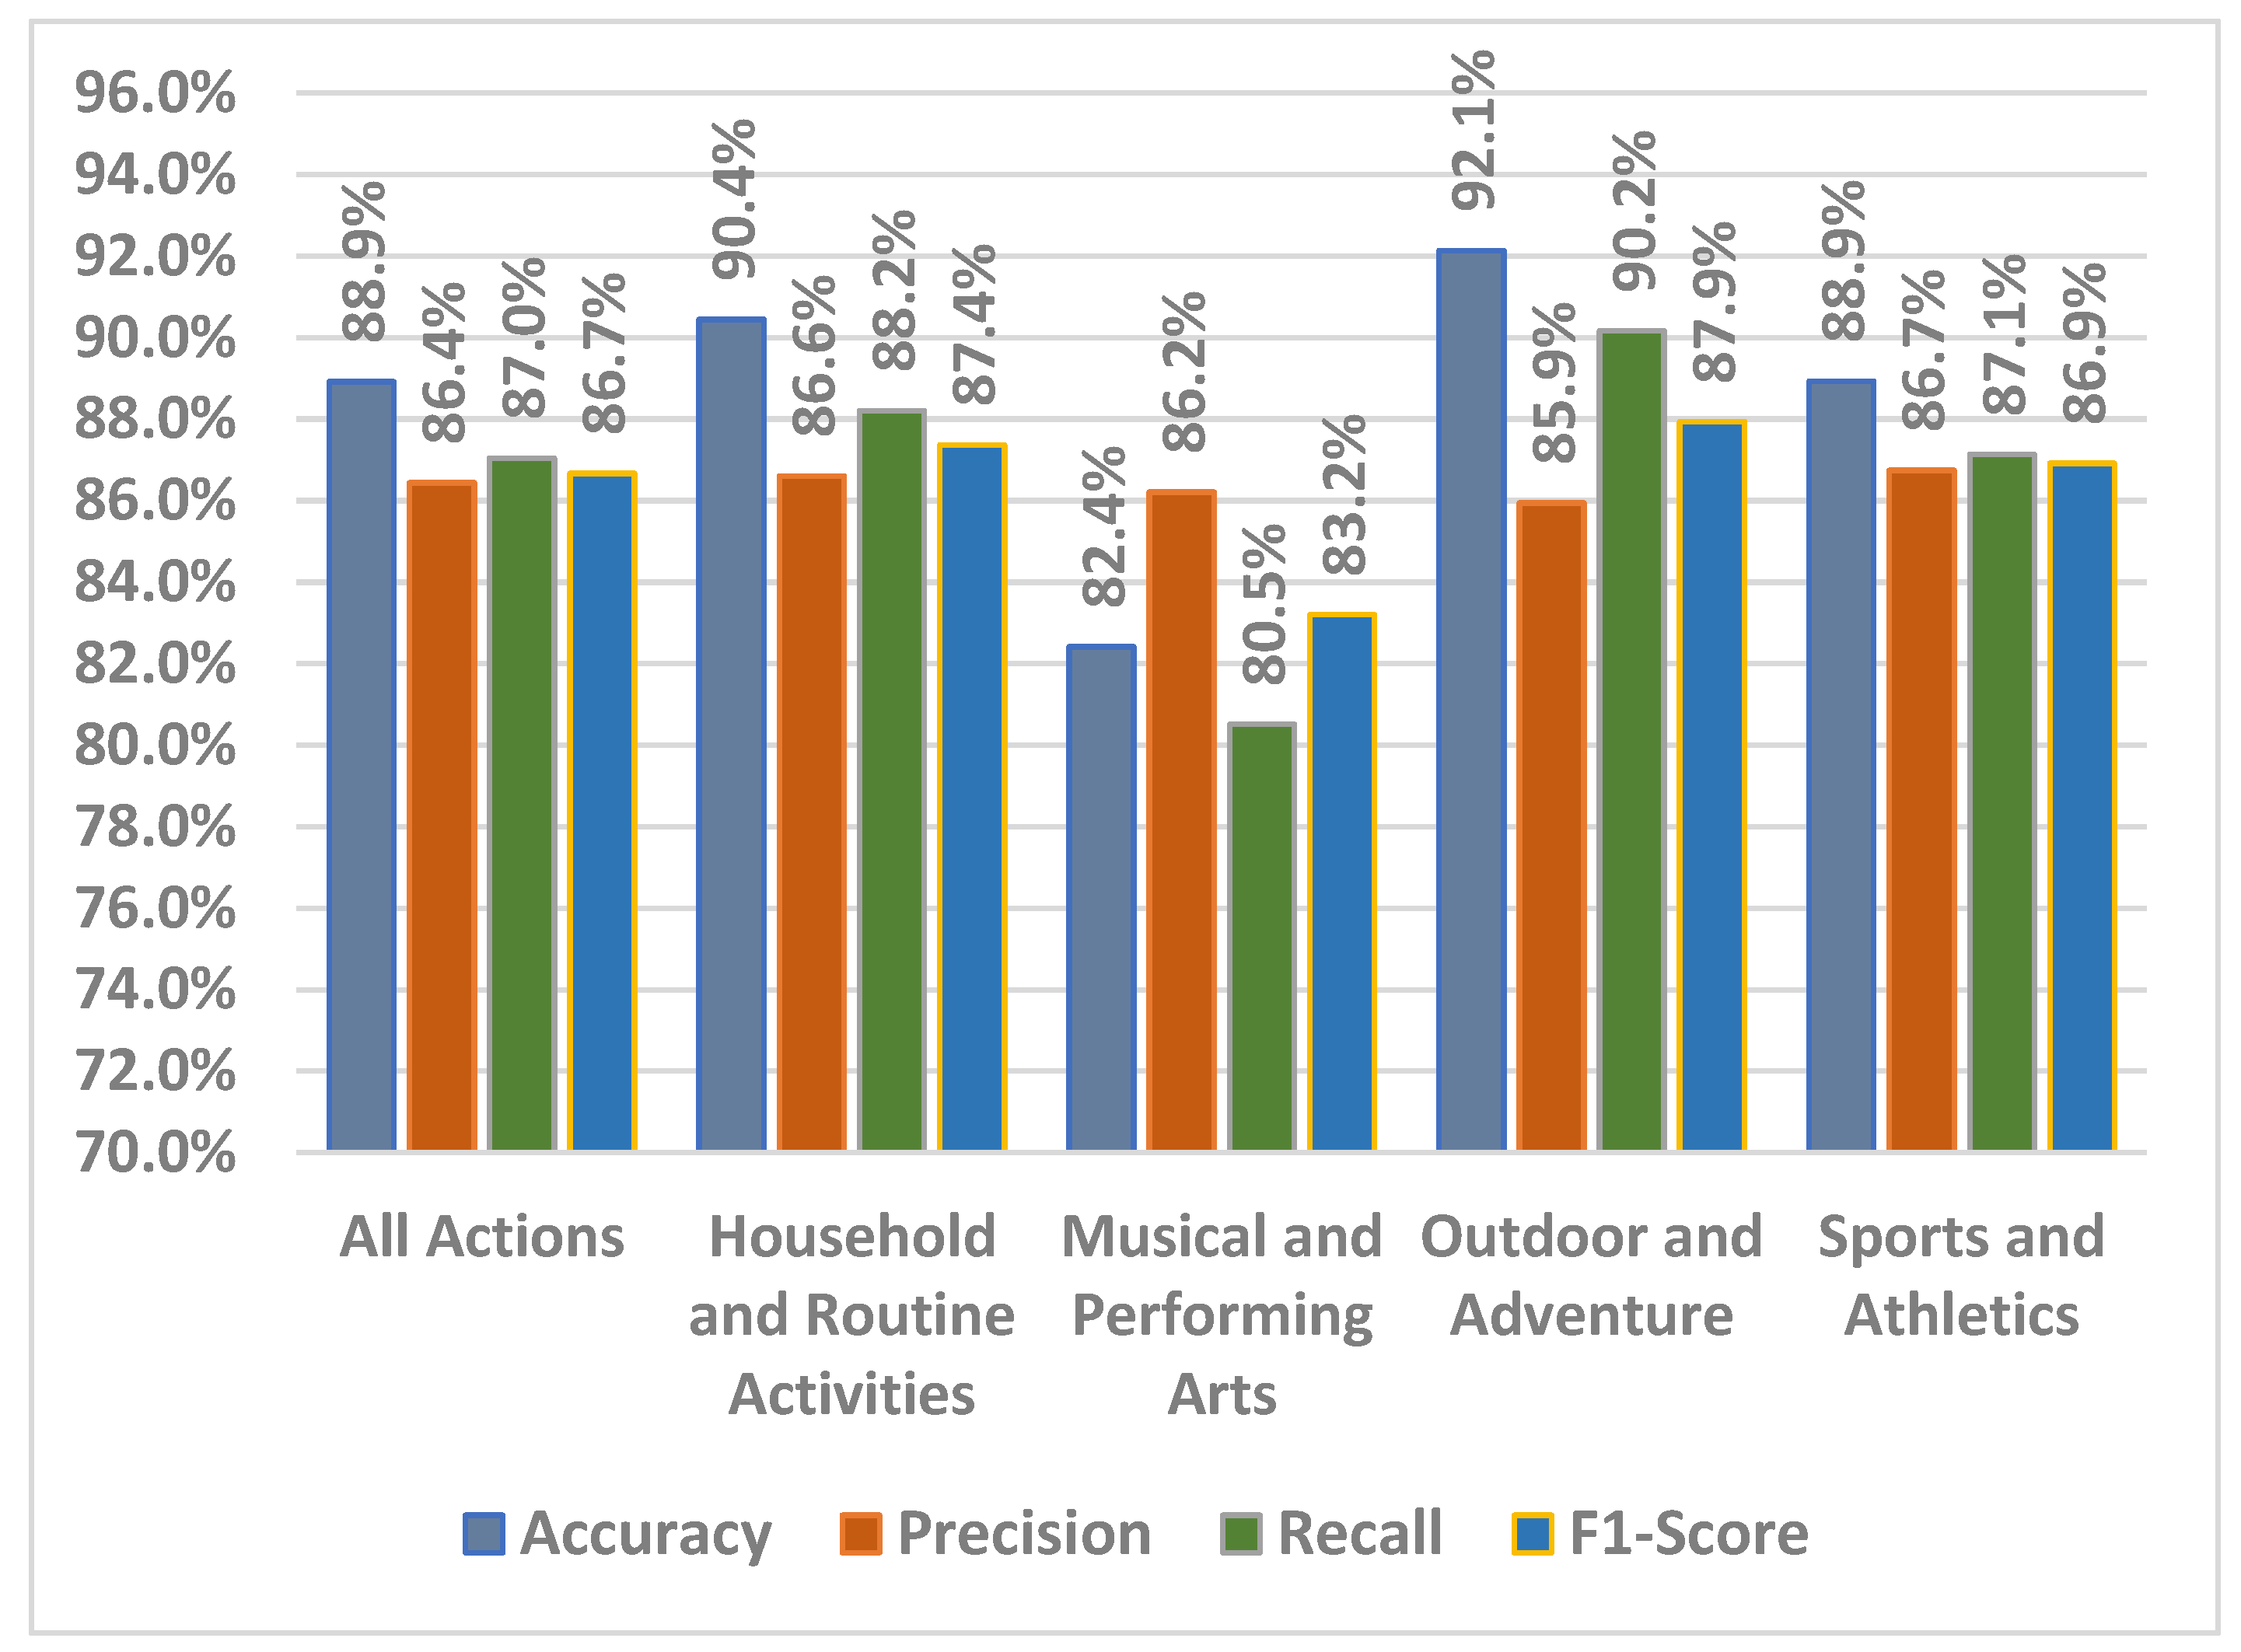
The optimized system’s overall performance was measured using four key metrics: accuracy, precision, recall, and F1-score. As illustrated in
Figure 6, the system achieved an overall accuracy of 88.9% across all actions, demonstrating its effectiveness in recognizing a wide range of human activities.
Precision, which measures the proportion of correctly identified actions out of all predicted actions, was recorded at 86.4%. This indicates that the system was able to avoid a significant number of false positives. The recall, which indicates the system's ability to correctly identify all actual instances of an action, was 87.0%. The F1-score, a harmonic mean of precision and recall, was 86.7%, showing a balanced performance between correctly identifying activities and minimizing false detections and highlights the system's overall reliability in dealing with both complex and simpler activities.
4.4. Performance by Action Category
As mentioned before, we evaluated the system performance across four distinct action categories: Household and Routine Activities, Musical and Performing Arts, Outdoor and Adventure Activities, and Sports and Athletics. The actions in these categories differ significantly in terms of joint dynamics, complexity, and movement patterns, making them ideal for testing the versatility of the system. The system's performance in each category is summarized in
Figure 6.
In this category, which includes actions such as mopping the floor, brushing teeth, and cutting in the kitchen, the system achieved an accuracy of 90.4%, the highest among non-dynamic action categories. The system’s precision was 86.6%, and recall was 88.2%, demonstrating its capability to correctly identify most routine activities with relatively low false positives and false negatives. The F1-score of 87.4% highlights the system’s balanced performance in recognizing routine actions that involve subtle joint movements. This category's strong performance indicates that the system is well-suited to handle less dynamic but repetitive activities.
The system faced more challenges in this category, where actions such as playing cello, guitar, or performing floor gymnastics are characterized by more intricate joint movements. The system achieved an accuracy of 82.4%, the lowest among all categories. Precision was 86.2%, but the recall was lower at 80.5%, reflecting difficulty in detecting all instances of these actions, likely due to the interaction with tools (e.g., musical instruments) complicating joint movement recognition. The F1-score of 83.2% underscores the need for further refinement in handling complex tool-based activities.
The system performed exceptionally well in this category, achieving the highest accuracy of 92.1%. This category includes dynamic activities such as rope climbing, Tai Chi, and skiing, where distinct and large joint movements are common. Precision was 85.9%, and recall was 90.2%, indicating the system’s ability to accurately detect most of these activities with minimal false negatives. The F1-score of 87.9% further emphasizes the system’s robust performance in fast-paced, high-movement actions. The clear distinction in movement patterns for outdoor activities likely contributed to the system’s superior performance in this group.
For actions such as basketball, archery, and weightlifting, the system achieved an accuracy of 88.9%. Precision was 86.7%, and recall was 87.1%, demonstrating consistent performance in recognizing physically intensive sports that involve both upper and lower body coordination. The F1-score of 86.9% highlights the system’s balanced handling of these activities, with only minor challenges in actions involving rapid transitions or simultaneous movements. The system's success in recognizing individual and team sports activities showcases its flexibility and adaptability to a range of athletic actions.
4.5. Comparative Performance Against Baseline Methods
To further assess the effectiveness of the proposed HAR system, we compared its performance with a traditional baseline method, specifically a CNN-based model, which is widely used for HAR tasks. The baseline model used in this comparison is identical to the one described in
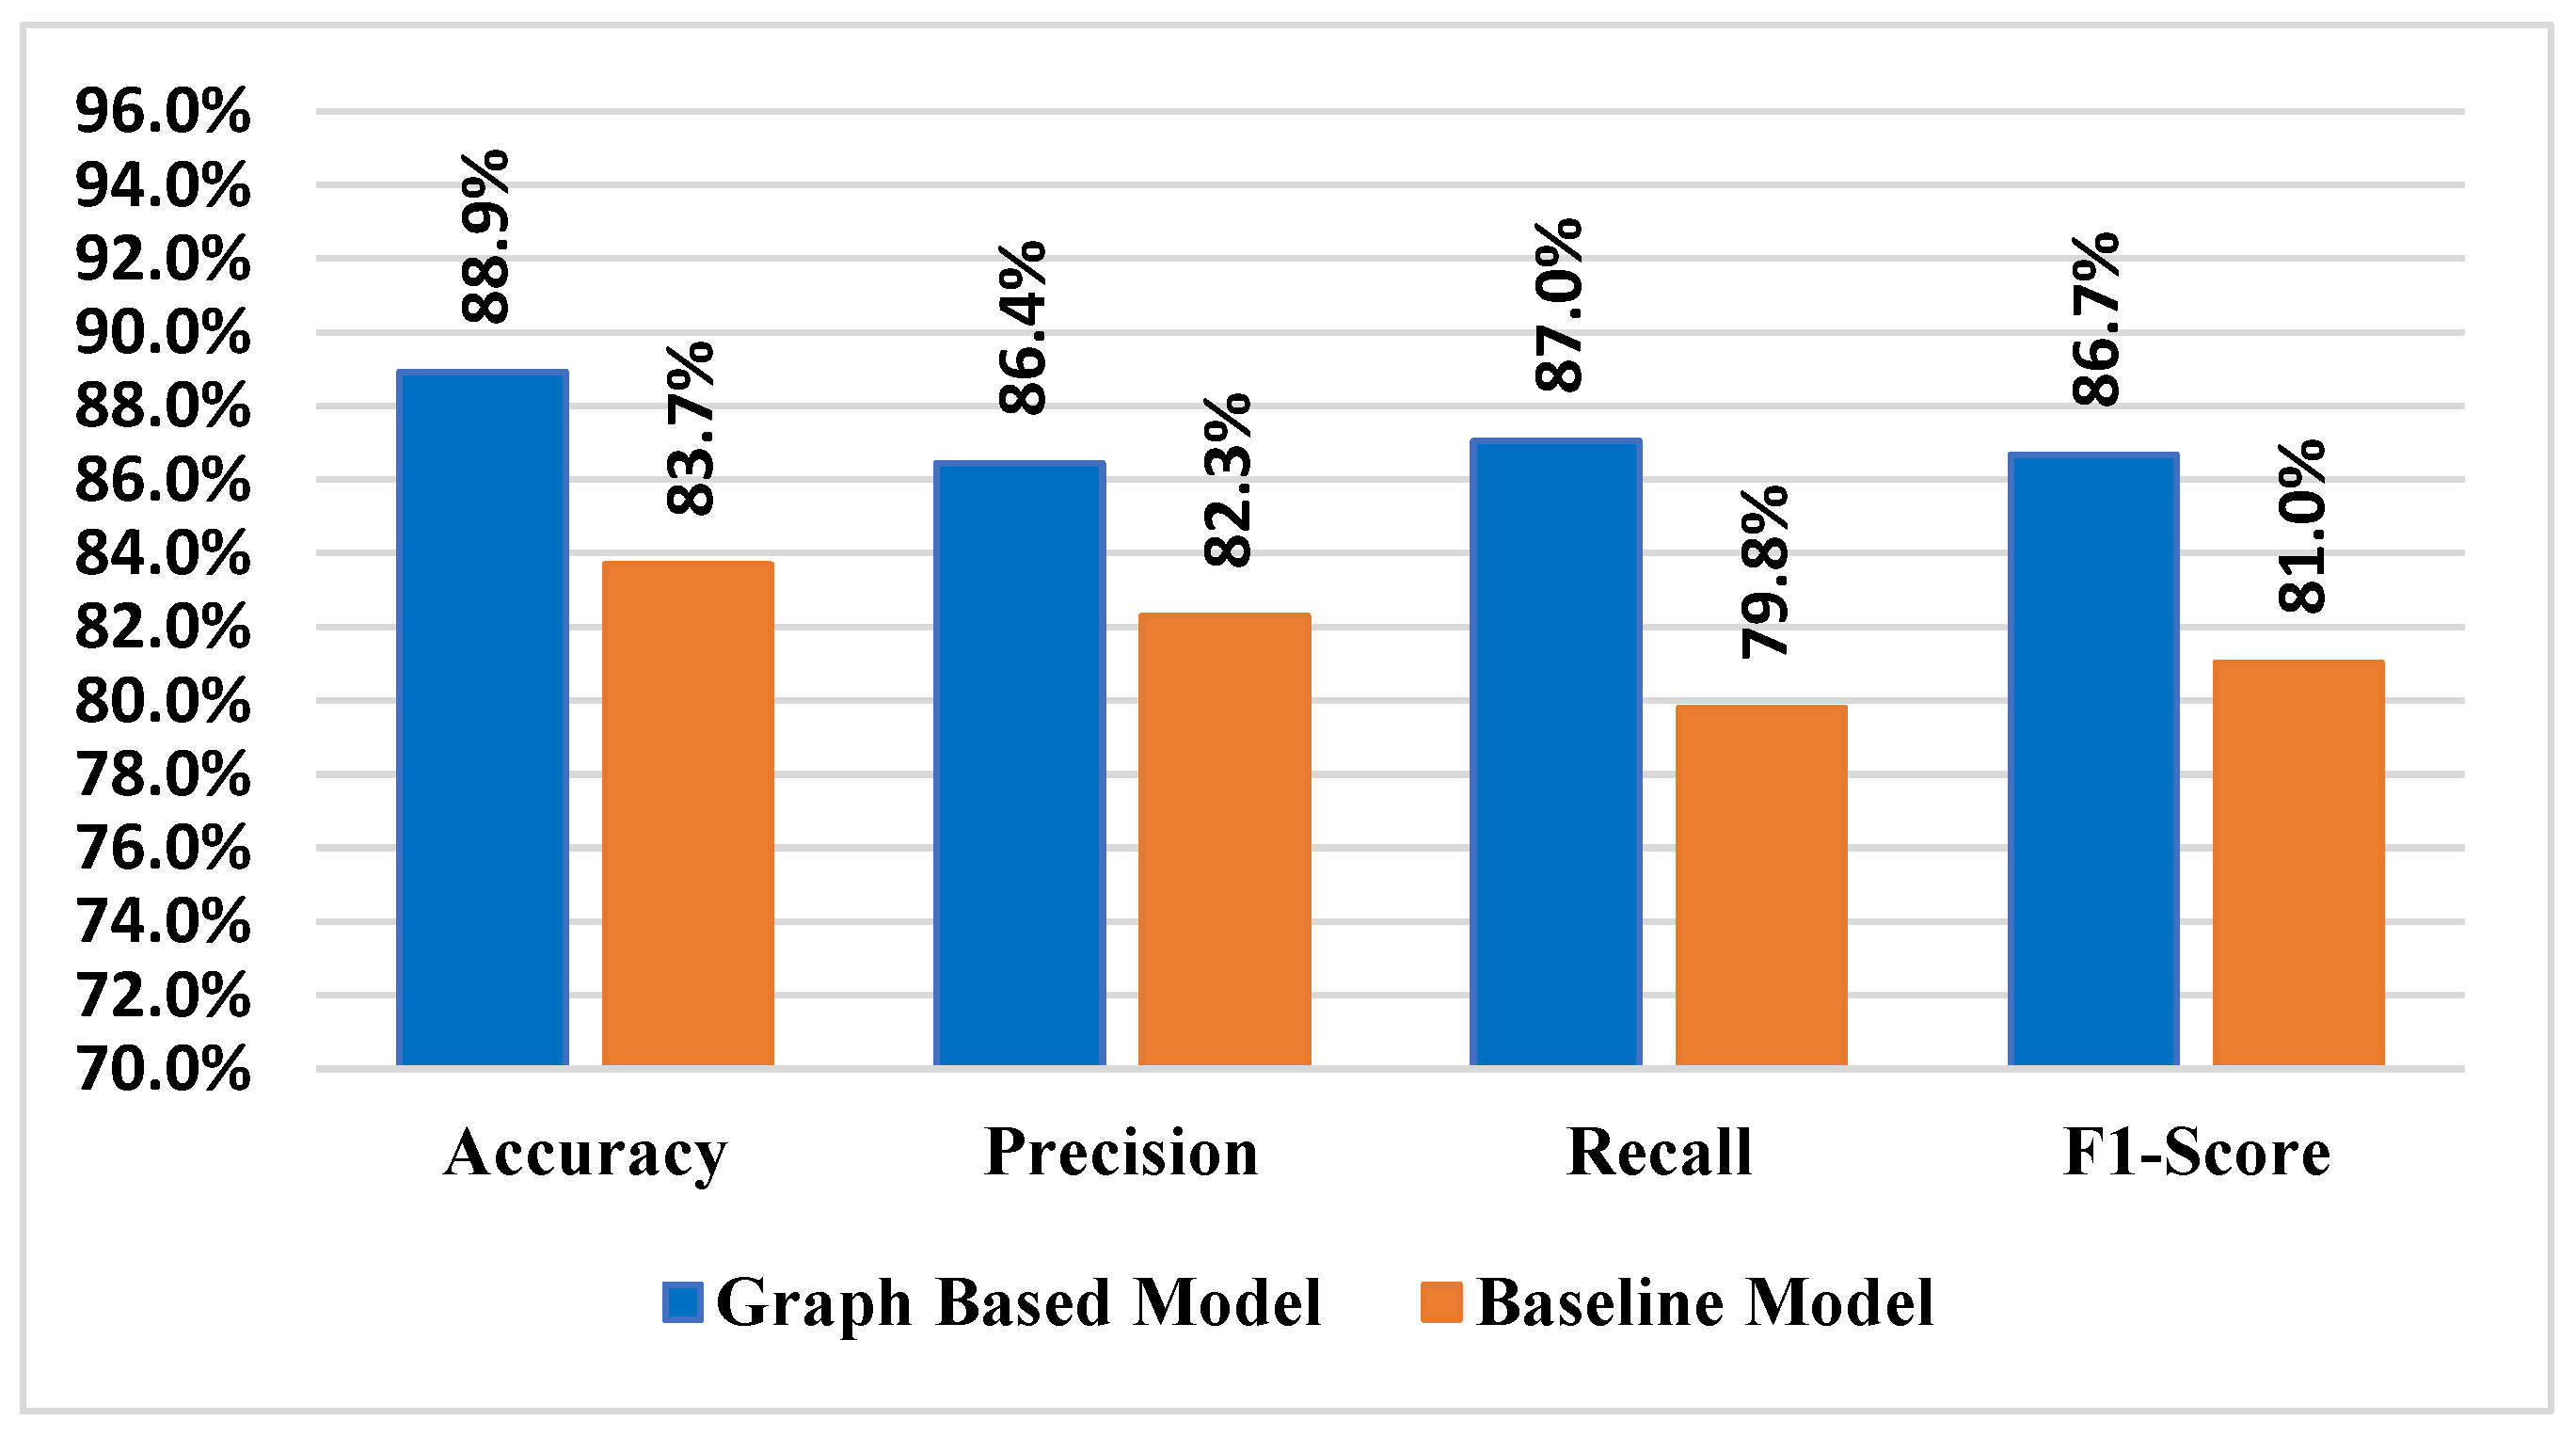
Section 3.6, except for an input layer size of 64x64 to match the dimensions of the processed video frames. The Firefly Optimization Algorithm was applied to fine-tune the hyperparameters of both the baseline CNN model and the graph-based HAR system to ensure a fair comparison. CNN-based models are commonly adopted in HAR due to their ability to automatically extract spatial features from video streams. However, while CNNs excel at capturing spatial relationships within individual frames, they are less effective at modeling the temporal dynamics inherent in videos. The results of the comparison are illustrated in
Figure 7.
In our experiments, the proposed graph-based HAR system outperformed the CNN model across all key performance metrics. The overall accuracy of the graph-based system was 88.9%, which exceeded the CNN-based model’s accuracy of 83.7%. This improvement in accuracy can be attributed to the graph structure’s ability to capture both spatial and temporal relationships between human joints more effectively than traditional models that process video frames sequentially without explicitly modeling these connections.
Precision and recall metrics followed similar trends. The graph-based approach achieved a precision of 86.4% and recall of 87.0%, compared to 83.0% precision and 82.5% recall for the CNN model. These results demonstrate the graph-based system’s enhanced capability to reduce false positives while maintaining a higher recall rate, allowing it to better detect human activities, even in complex scenarios.
The F1-score of 86.7% achieved by the graph-based HAR system also outperformed the CNN’s F1-score of 82.7%. This indicates that the proposed system offers a balanced performance between precision and recall, which is crucial for practical applications where minimizing both false positives and false negatives is important.
A key reason for the superior performance of the proposed system lies in its use of a graph structure to model human joint movements, which enables the capture of both spatial relationships (the position of joints relative to one another) and temporal relationships (the movement of joints over time). This graph-based representation allows the system to better understand and classify complex actions that involve joint transitions, interactions with objects, and multi-step movements, which are challenging for conventional models that treat video frames independently.
5. Conclusion
This research introduced a novel Human Activity Recognition (HAR) system that integrates graph structures and deep neural networks to address the challenges inherent in activity recognition. By leveraging graph representations, we captured both spatial relationships and temporal dynamics of joint movements, resulting in a more nuanced understanding of human activities. The application of the Firefly Optimization Algorithm further enhanced the system's performance by fine-tuning critical hyperparameters, leading to significant improvements in accuracy, precision, recall, and F1-score.
The experimental results demonstrated the effectiveness of the proposed graph-based HAR system, achieving superior performance compared to traditional CNN-based models. Our system achieved an overall accuracy of 88.9%, with robust performance across diverse action categories, including sports, routine activities, and musical performances. The optimized system not only improved training accuracy but also minimized the gap between training and validation performance, highlighting its enhanced generalization ability and reduced overfitting.
Additionally, the categorization of actions revealed that the system performed exceptionally well in dynamic activities such as outdoor sports and adventure, while still maintaining reliable performance in more intricate activities involving tools, such as musical performances. These results emphasize the versatility and adaptability of the proposed approach for real-world applications.
The findings of this research contribute to the growing body of knowledge in the field of HAR by presenting a system that offers both accuracy and robustness. Future work could explore further refinements to the graph-based model, such as incorporating multi-modal data sources or enhancing the handling of occlusions in complex scenarios. With continued development, the proposed HAR system holds the potential to impact various fields, including healthcare monitoring, smart surveillance, and sports analytics, enabling safer, more intuitive, and privacy-preserving activity recognition solutions.
Data Availability Statement
Data sharing does not apply to this article as no datasets were generated or analyzed during the current.
Conflicts of Interest
The authors have no Funding and/or Conflicts of interests/Compet ing interests.
References
- Alazeb, A., Azmat, U., Al Mudawi, N., Alshahrani, A., Alotaibi, S. S., Almujally, N. A., & Jalal, A. Intelligent localization and deep human activity recognition through IoT devices. Sensors 2023, 23(17), 7363. [CrossRef] [PubMed]
- Amer, A., & Ji, Z. Human locomotion activity recognition using spectral analysis and convolutional neural networks. International Journal of Manufacturing Research 2021, 16(4), 350–364. [CrossRef]
- Aziz, A., Mirzaliev, S., & Maqsudjon, Y. Real-time Monitoring of Activity Recognition in Smart Homes: An Intelligent IoT Framework. Journal of Intelligent Systems & Internet of Things 2023, 10(1), 76. Available online: https://search.ebscohost.com/login.aspx?direct=true&profile=ehost&scope=site&authtype=crawler&jrnl=2769786X&AN=178077044&h=NRgGnvKbRZWMiXQTVuuiE3fZa0TYJyZv%2BNI%2Bgl9sybM596bvloBp2u7fQBJ%2FFelMI%2BKxSEXhQh1MbEXHMio8Gw%3D%3D&crl=c.
- Cao, Z., Hidalgo, G., Simon, T., Wei, S.-E., & Sheikh, Y. OpenPose: Realtime Multi-Person 2D Pose Estimation Using Part Affinity Fields. IEEE Trans. Pattern Anal. Mach. Intell. 2021, 43(1), 172–186. [CrossRef] [PubMed]
- Cao, Z., Simon, T., Wei, S.-E., & Sheikh, Y. Realtime multi-person 2d pose estimation using part affinity fields. , 7291–7299. In Proceedings of the IEEE Conference on Computer Vision and Pattern Recognition; 2017; pp. 7291–7299.
- Dharejo, F. A., Zawish, M., Zhou, Y., Davy, S., Dev, K., Khowaja, S. A., Fu, Y., & Qureshi, N. M. F. FuzzyAct: A fuzzy-based framework for temporal activity recognition in IoT applications using RNN and 3D-DWT. IEEE Transactions on Fuzzy Systems 2022, 30(11), 4578–4592. [CrossRef]
- Geng, H., Huan, Z., Liang, J., Hou, Z., … S. L.-I. S., & 2022, undefined. (n.d.). Segmentation and recognition model for complex action sequences. Ieeexplore.Ieee.Org. Retrieved October 2, 2024. Available online: https://ieeexplore.ieee.org/abstract/document/9684457/.
- Jana, G. C., Swetapadma, A., & Pattnaik, P. K. A hybrid method for classification of physical action using discrete wavelet transform and artificial neural network. International Journal of Bioinformatics Research and Applications 2021, 17(1), 25–37. [CrossRef]
- Kay, W., Carreira, J., Simonyan, K., Zhang, B., Hillier, C., Vijayanarasimhan, S., Viola, F., Green, T., Back, T., Natsev, P., Suleyman, M., & Zisserman, A. (2017). The Kinetics Human Action Video Dataset. Available online: https://arxiv.org/abs/1705.06950v1.
- Ketu, S., Technologies, P. M.-A. in E. and C., & 2020, undefined. (2020). Performance analysis of machine learning algorithms for IoT-based human activity recognition. Springer, 672, 579–591. [CrossRef]
- Khaled, H., Abu-Elnasr, O., Elmougy, S., & Tolba, A. S. Intelligent system for human activity recognition in IoT environment. Complex and Intelligent Systems, 2023; 9, 4, 3535–3546. [CrossRef]
- Makikawa, M., & Iizumi, H. Development of an ambulatory physical activity memory device and its application for the categorization of actions in daily life. Medinfo. MEDINFO 1995, 8 Pt 1, 747–750. Available online: http://europepmc.org/abstract/MED/8591316.
- Mishra, R. A review on learning-based algorithms for human activity recognition. International Journal of Data Analysis Techniques and Strategies 2023, 15(4), 339–355. [Google Scholar] [CrossRef]
- Mohmed, G., Lotfi, A., & Pourabdollah, A. Employing a deep convolutional neural network for human activity recognition based on binary ambient sensor data. ACM International Conference Proceeding Series 2020, 412–418. [CrossRef]
- Narayanan, S., Sastry, G. H., Aswal, S., Marriboyina, V., Sankaranarayanan, R., & Varsha. Visible property enhancement techniques of IoT cameras using machine learning techniques. International Journal of Nanotechnology 20(5–10), 569–585. [CrossRef]
- Natani, A., Sharma, A., & Perumal, T. Sequential neural networks for multi-resident activity recognition in ambient sensing smart homes. Applied Intelligence, 2021; 51, 8, 6014–6028. [CrossRef]
- Preece, S. J., Paul, L., Kenney, J., Howard, D., Goulermas, J. Y., & Kenney, L. P. J. A comparison of feature extraction methods for the classification of dynamic activities from accelerometer data. IEEE Transactions on Biomedical Engineering 56(3). [CrossRef] [PubMed]
- Soomro, K., Zamir, A. R., & Shah, M. (2012). UCF101: A Dataset of 101 Human Actions Classes From Videos in The Wild. Available online: http://arxiv.org/abs/1212.0402.
- Verma, U., Tyagi, P., & Kaur, M. Artificial intelligence in human activity recognition: a review. International Journal of Sensor Networks 2023, 41(1), 1. [CrossRef]
- Xu, S., Zhang, L., Tang, Y., Han, C., Wu, H., & Song, A. Channel attention for sensor-based activity recognition: embedding features into all frequencies in DCT domain. IEEE Transactions on Knowledge and Data Engineering 2023, 35(12), 12497–12512. [CrossRef]
- Yang, X. S. Firefly algorithm, stochastic test functions and design optimization. International Journal of Bio-Inspired Computation 2010, 2(2), 78–84. [Google Scholar] [CrossRef]
- Zhang, L., Cui, W., Li, B., Chen, Z., Wu, M., & Gee, T. S Privacy-Preserving Cross-Environment Human Activity Recognition. IEEE Transactions on Cybernetics 2023, 53(3), 1765–1775. [CrossRef] [PubMed]
- Zhuang, W., Chen, Y., Su, J., Wang, B., & Gao, C. Design of human activity recognition algorithms based on a single wearable IMU sensor. International Journal of Sensor Networks 2019, 30(3), 193–206. [CrossRef]
- Zhuang, W., Xu, S., Han, Y., Su, J., Gao, C., & Yang, D. The design and implementation of a wearable human activity recognition system based on IMU. International Journal of Embedded Systems 2020, 13(2), 158–168. [CrossRef]
|
Disclaimer/Publisher’s Note: The statements, opinions and data contained in all publications are solely those of the individual author(s) and contributor(s) and not of MDPI and/or the editor(s). MDPI and/or the editor(s) disclaim responsibility for any injury to people or property resulting from any ideas, methods, instructions or products referred to in the content. |
© 2024 by the authors. Licensee MDPI, Basel, Switzerland. This article is an open access article distributed under the terms and conditions of the Creative Commons Attribution (CC BY) license (http://creativecommons.org/licenses/by/4.0/).