Submitted:
04 February 2025
Posted:
04 February 2025
You are already at the latest version
Abstract
In this study, the causes of vibration and noise reduction occurring in electric compressors for electric vehicles are analyzed and a reduction plan is proposed. First, the impact hammer modal of the electric compressor housing was measured and compared with the ANSYS modal analysis. As there was no significant difference between the modal analysis results and the impact hammer modal measurement results, the modal analysis was judged to be reliable. The noise measurement results showed that the main noise sources of the development were analyzed in the 600-800Hz band, 4,000-5,000Hz band, and 10,000Hz band. From the competitor's analysis of the housing structure and noise measurement results, the 10,000Hz band was able to reduce noise caused by changes in carrier frequency of the motor inverter, and the 4,000-5,000Hz band showed a significant effect by adjusting the clearance during discharge, and it was confirmed that noise in the 600-800Hz band could be reduced to some extent only by changing the housing structure such as rib and mounting reinforcement of the housing and thickness change.
Keywords:
scroll
; low vibration
; modal analysis
; electric vehicles
; electric scroll compressor
1. Introduction
1.1. Electric Scroll Compressor
Since the early 2000s, growing concerns over global warming have necessitated the regulation of carbon dioxide emissions, leading South Korea to establish annual reduction targets after 2020 in accordance with the Paris Agreement, hence requiring a corresponding industrial response. In particular, the automotive industry has faced a relatively high reduction target of 17.4% by 2023, and is witnessing a trend of a decrease in the proportion of hydraulic components, while the development and application of electric components have emerged as a significant challenge.
In terms of automotive air conditioning systems, the electrification of refrigerant compressors for cooling systems is already underway, which implies the fact that as the prevalence of eco-friendly vehicles, including electric vehicles (EVs), increases, further technological development is essentially required. In general, the heating, ventilation, and air conditioning (HVAC) system in vehicle air conditioning is composed of several major components, respectively, Condenser, Compressor, Evaporator, Receiver, and Expansion device. While the HVAC system in conventional gasoline vehicles are powered by the engine, those in EVs operate on motor power driven by electric batteries, due to the absence of the engine as the power source of the vehicle. In regard to a Piston reciprocating compressor of gasoline vehicles are less likely to be favored due to their low compression efficiency, high torque, and significant noise and vibration. Therefore, the electric scroll compressors in EVs, which utilize two-scroll-shaped parts moving relative to each other to compress gas, are preferred within the global trend since their higher compression efficiency and lower power consumption.
1.2. Struture and Working Principle of Electric Scroll Compressor
Electric Scroll compressors can be generally decomposed into three parts: The Compressor Section, the Motor Section, and the Motor Control Section.
Figure 1.
Structure of Electric Scroll Compressors.
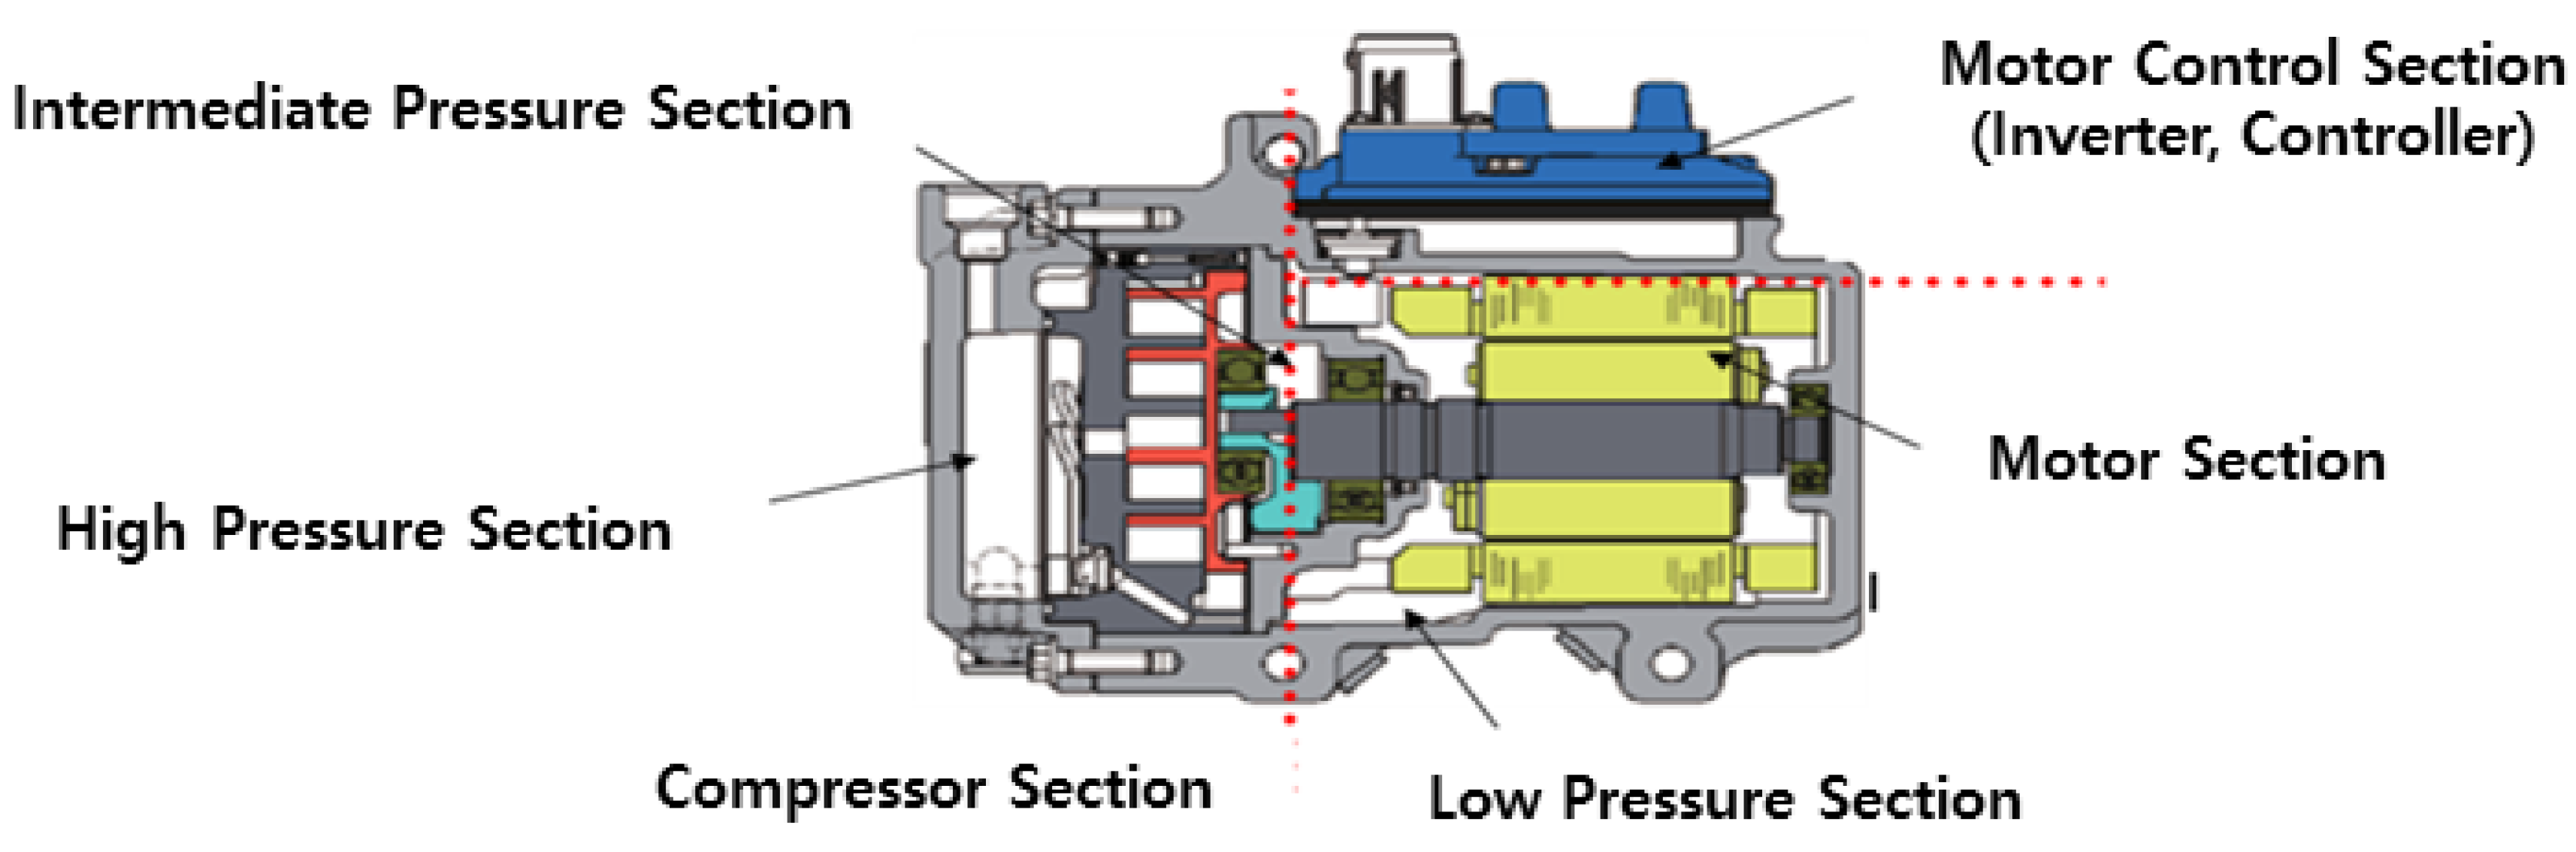
The Compressor Section by interacting two scrolls (fixing, orbiting), compressing the refrigerant through progressively reducing the volume of a crescent-shaped suction space from the outer to the inner edges, thereby increasing pressure and discharging the refrigerant through a central outlet hole. Generally, such Electric Scroll Compressors divided by a Low Pressure Section where the refrigerant is drawn in, a High Pressure Section where the refrigerant is compressed and expelled, and an intermediate Pressure Section which is acting on the back of the orbiting scroll, pushing it tightly against the fixed scroll to ensure an efficient compression.
The Motor Section is composed of the stator (outer) and the rotor (inner). Typically, the rotor is attached to the rotating shaft and has multiple radially embedded permanent magnets, while the stator consists of multiple electromagnets, mainly coils wound around an iron core. These generate magnetic force by periodically getting supplied an alternating current (AC) from an external source. The interaction between such permanent magnets and electromagnets produces torque, which is eventually transmitted to the shaft.
The Motor Control Section, commonly known as an Inverter or controller, converts the direct current (DC) coming from the EV’s battery into AC. Such conversion enables the delivery of this AC to the motor’s Phase for controlling speed, thus it functions as a regulator that adjusts the amount of current in response to the load.
In that, compression, suction, and discharge occur simultaneously and continuously in scroll compressors, resulting in minimal fluctuations in load torque and pressure pulsation, which significantly reduce noise and vibration. Unlike reciprocating compressors type, scroll compressors do not need suction or discharge valves, and the small pressure differential between adjacent compression chambers prevents leakage during compression, resulting in higher efficiency. In addition, the small motion radius of moving parts, limited to just a few millimeters, allows high-speed operation, and scroll compressors are compact and lightweight, with the number of components reduced to roughly one-fourth that of reciprocating compressors.
As a result, the utilization of electric scroll compressors in EVs has emerged as a prominent industrial trend. This has led to the development of proprietary electric scroll compressor models and the production of prototypes that underwent various internal evaluations. These evaluations have confirmed that the compressor's performance, cooling capacity, size, and weight accomplished satisfactory levels compared to competitors’ products. However, the noise levels were found to be slightly inferior to those of competitors' products across the whole range of rotational speeds.
At this stage, an entire redesign or extensive modifications to the compressor would require significant time and cost, thus, this study aims to analyze the causes of noise by conducting modal analysis and impact hammer modal measurements for each housing component, as well as noise measurements of the electric compressor. Furthermore, by comparing the structural design of competitors’ products and referencing previous studies on noise reduction in electric compressors, this study seeks to achieve noise reduction with minimal design modifications.
2. Methodology
2.1. Housing Noise Caused by Natural Frequency Resonance and Pressure Pulsation
The housing of an electric scroll compressor is an external structure meant to protect and support the internal components. Not only does it serve a protective role, but it also prevents the vibration and noise produced during the operation of the electric compressor from being transmitted externally. Therefore, to reduce noise, research on housing design is critically required.
The housing of an electric compressor is subjected to acoustic energy generated by vibrations and fluid pressure pulsations occurring within the system. When the frequency of these vibrations and acoustic energy aligns with the natural frequency of the housing, resonance may occur, leading to a significant amplification of the housing's vibration. Resonance-induced noise is often characterized by its high intensity and sustained duration, contributing considerably to the overall noise level. To mitigate noise resulting from resonance, the natural frequency of the housing can be strategically adjusted during the design phase by altering its thickness and geometric configuration, thereby ensuring it falls outside the resonance frequency range. Furthermore, noise can be effectively reduced through the incorporation of damping materials or the addition of structural reinforcements, such as ribs, to attenuate the transmission of acoustic energy.
The housing of an electric scroll compressor includes inlet and outlet ports for refrigerant flow. During the inlet and outlet processes, the rapid pressure changes in the fluid can generate pulsations, which may serve as a major source of noise. To effectively reduce these pulsations, adjustments to the inlet and outlet flow paths and clearances can be made. For example, smoothing the curvature of the inlet and outlet flow paths or reducing surface roughness can decrease flow resistance, thereby minimizing pressure pulsations. Clearances refer to the gaps between the inlet and outlet ports and the refrigerant flow. Properly designing these clearances ensures a smoother refrigerant flow, further reducing pressure pulsations. By optimizing the flow paths and clearances, noise generation can be significantly minimized.
To determine whether the noise is caused by resonance, it is important to first identify the natural frequencies associated with various housing geometries. These natural frequencies are derived through finite element method (FEM)-based ANSYS modal analysis. However, to ensure the reliability of the ANSYS modal analysis, a comparative analysis with experimental results obtained from impact hammer modal testing will be initially conducted.
2.2. Noise Analysis
Noise analysis is a process that identifies frequency bands with high dB levels based on measured noise data and determining the primary causes of noise within those bands. This process involves analyzing the physical characteristics of noise, such as sound pressure levels, frequency bands, and temporal variations. Throughout frequency analysis, it allows to identify whether the noise falls within low-frequency or high-frequency ranges. This helps determine the noise source, such as low-frequency noise caused by mechanical vibrations or high-frequency noise resulting from the operation of electronic components. Based on the analysis results, effective noise reduction strategies can be developed. For instance, noise caused by resonance can be mitigated by redesigning the housing to avoid resonance frequencies, while noise stemming from pressure pulsations can be reduced by adjusting the design of the inlet and outlet flow paths and clearances.
2. 3. Analysis of Critical Speeds in Rotating Components
The critical speed of a rotating component refers to the rotational speed that matches its natural frequency. When a rotating component operates at or near its critical speed, resonance occurs, leading to a significant amplification of vibration. In that, it can result in performance degradation, mechanical damage, and an increase in noise levels. In other words, operating a rotating component near its critical speed can contribute to noise generation. Hence, this study aims to identify the critical speed of the main shaft in the electric scroll compressor through critical speed analysis of the rotating component, and it also seeks to assess the potential for noise generation caused by the resonance of the main shaft.
2.4. Comparative Analysis of Competitors’ Housing Structures
To achieve noise reduction with minimal design modifications to the housing, the structural designs of housings from four competitors were analyzed.
2.4.1. Winding Arrangement and Inlet Port Structure
The inlet port is designed to ensure that the refrigerant intake does not interfere with the winding section of the motor stator. It plays a key role in motor cooling and overall product performance. The structure of the inlet port varies depending on the arrangement of the windings.
Figure 2 shows the winding arrangements of four competitors. Denso and Hanon use distributed winding, while DooWon and GMB use concentrated winding. Distributed winding is suitable for larger motors, due to its superior cooling performance, while concentrated winding features a simpler and more cost-effective design, making it ideal for smaller motors.
2.4.2. Rear Housing Structure
Figure 3 presents the rear housing structures of the four competitors. In each image, ‘S’ and ‘D’ show the low-pressure and high-pressure sections, respectively. Table 1 provides a comparative analysis of the discharge space volumes.
Denso, Hanon, and GMB products place the suction section on the outer perimeter of the discharge section and secure the seals between the high- and low-pressure sections using O-rings. Hanon features a design where the filter is assembled at the bottom. The discharge space volumes were measured as 70.9 cc for Denso, 77.6 cc for Hanon, and 81.9 cc for GMB.
Doowon’s product is composed solely of a high-pressure section, resulting in a larger discharge space volume compared to the other companies. Additionally, multiple ribs are incorporated to enhance structural rigidity, and it also features a design where the filter is assembled at the bottom. The discharge space volume was measured as 88.9 cc.
2.4.3. Oil Separator Installation Structure
The oil separator is a device that separates refrigerant and oil, returning the oil to the compressor to maintain its efficiency and stability. Figure 4 illustrates the housing structures designed for installing oil separators, and Table 2 provides a comparative analysis of the dimensions of oil separator installation structures among the four competitors. Further optimization of these dimensions is required to minimize flow-induced noise.
3. Methodology
3.1. Validation of Housing Modal Analysis Reliability
To analyze noise caused by resonance in the housing, the natural frequencies of the housing will be derived using modal analysis performed with ANSYS software. Before proceeding, the reliability of the ANSYS modal analysis results will be validated by comparing them with experimental results obtained from impact hammer modal testing. The analysis and experiments will be conducted on the Main Housing of competitors, with additional tests on the Front Housing.
3.1.1. Modal Analysis of Competitors' Housing (GMB)
The housing material used in this study is ADC12 aluminum alloy. This alloy was selected because it simultaneously satisfies the requirements for lightweight properties, durability, and corrosion resistance. The primary material properties of ADC12 are as follows: its density is 2770 kg/m³, its elastic modulus is 71 GPa, and its Poisson's ratio is 0.33. These material properties are applied during the modal analysis to ensure accurate results. The given material properties represent those of ADC12 at room temperature. The operational temperature range of the housing in actual use is at room temperature and does not involve environments with sudden significant temperature changes. Therefore, the material properties of ADC12 do not significantly vary with temperature, and the room-temperature properties were applied in this analysis.

Table 3.
Material Properties of ADC12 Aluminum Alloy.
| Material | Density [kg/m^3] |
Young Modulus [GPa] |
Poisson’s Ratio |
|---|---|---|---|
| ADC12 | 2770 | 71 | 0.33 |
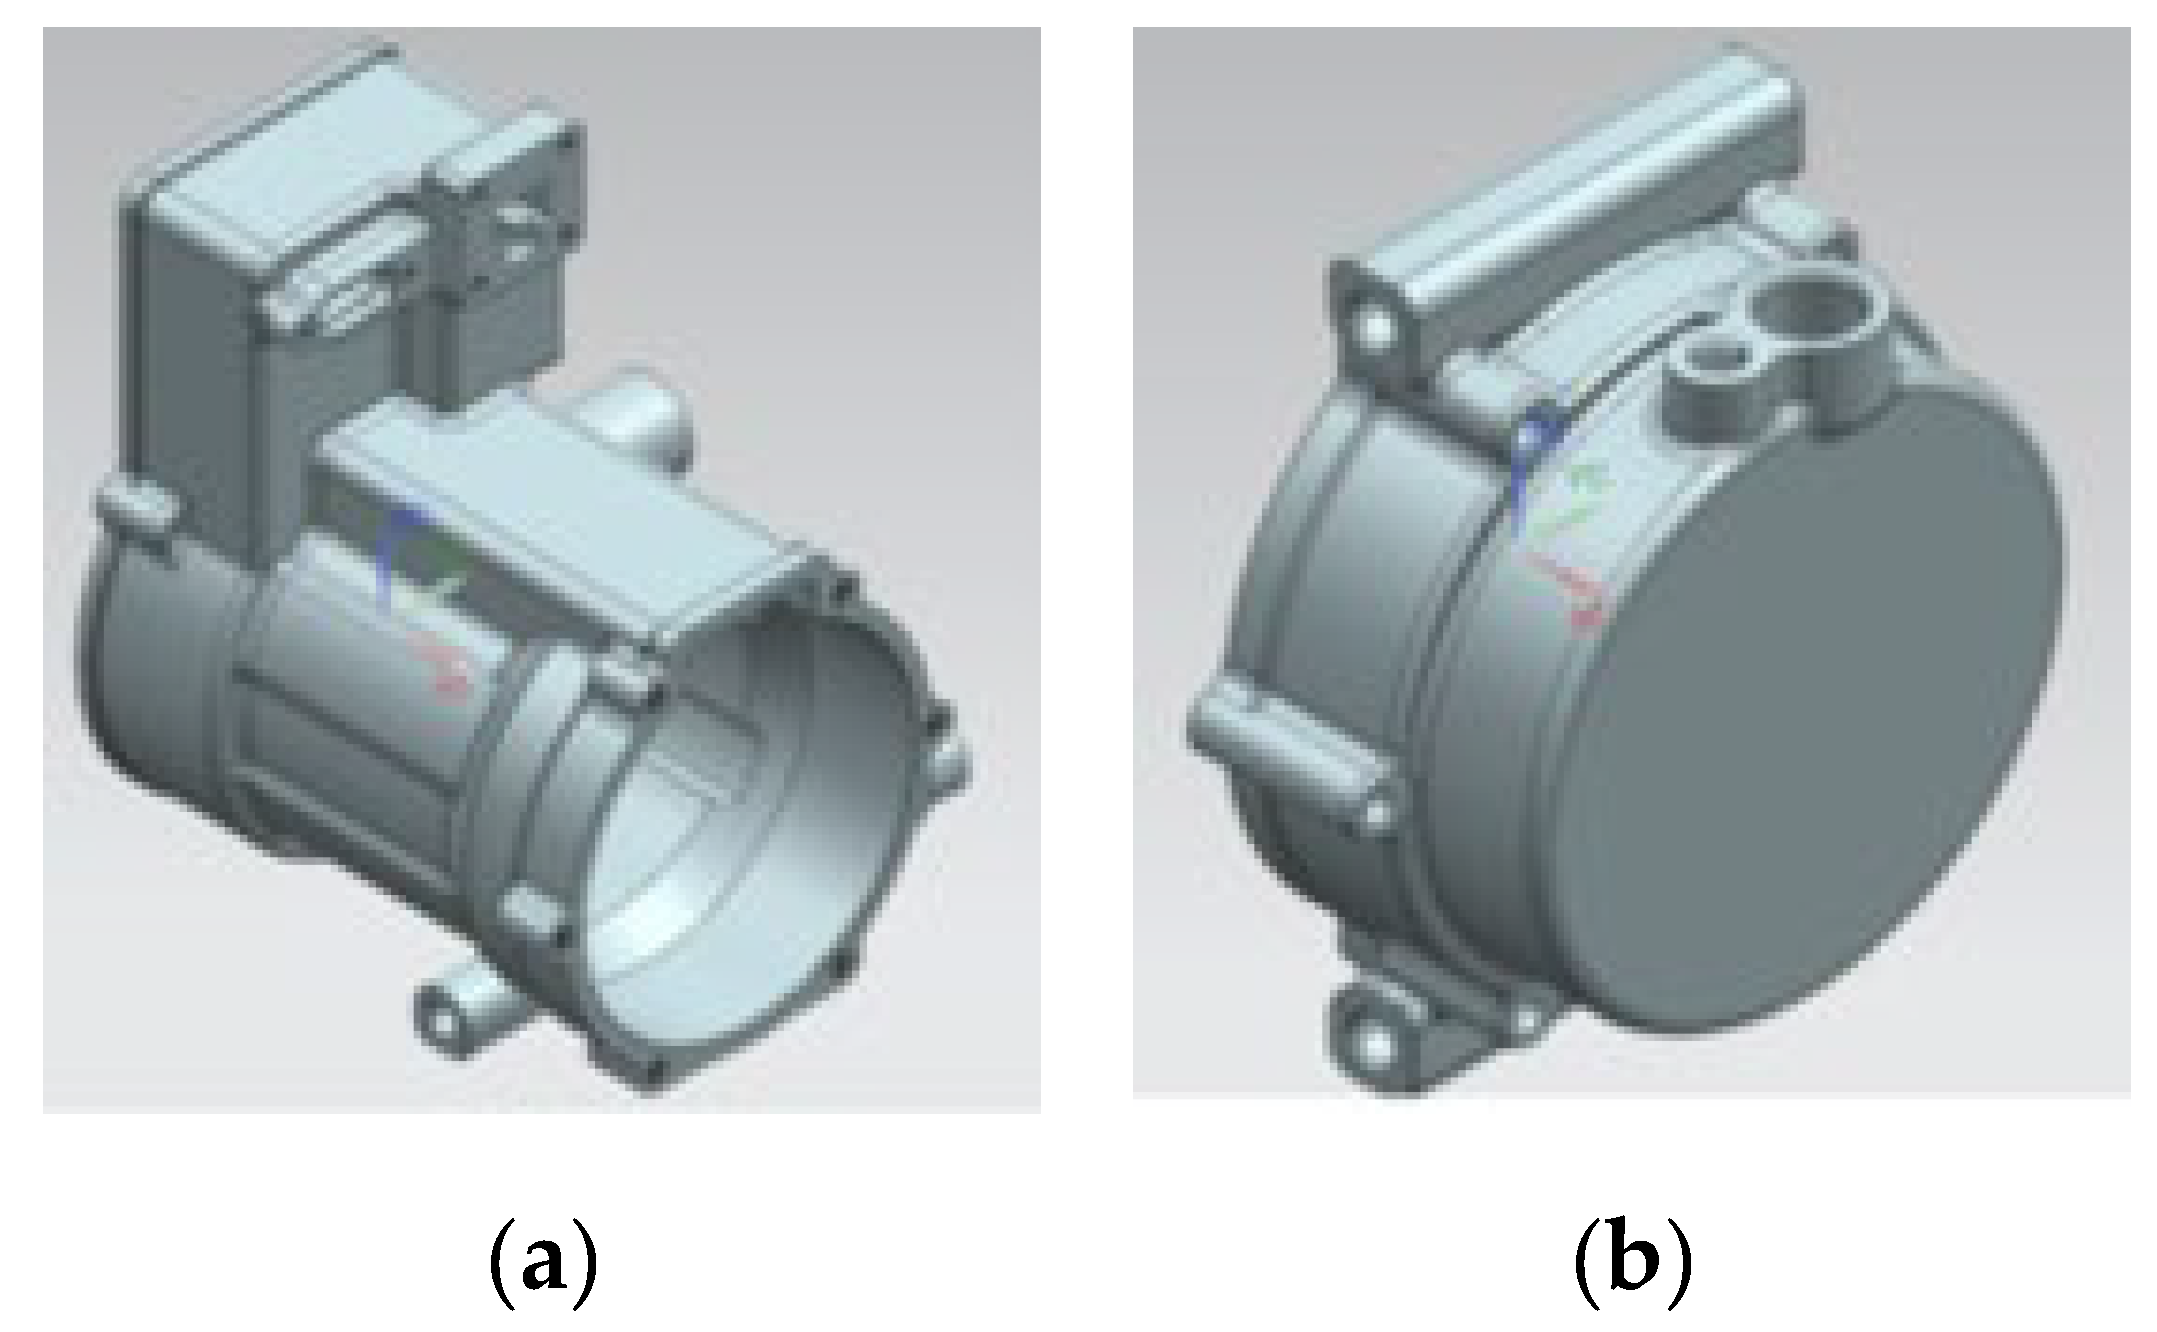
To perform the modal analysis, the Main Housing and Front Housing geometries of competitors(GMB) were used in 3D using CATIA software. The modelling process was performed based on the actual housings and technical drawings of the competitors.
Figure 5.
Modal Analysis of Housing GMB (a) Main Housing; (b) Front Housing.
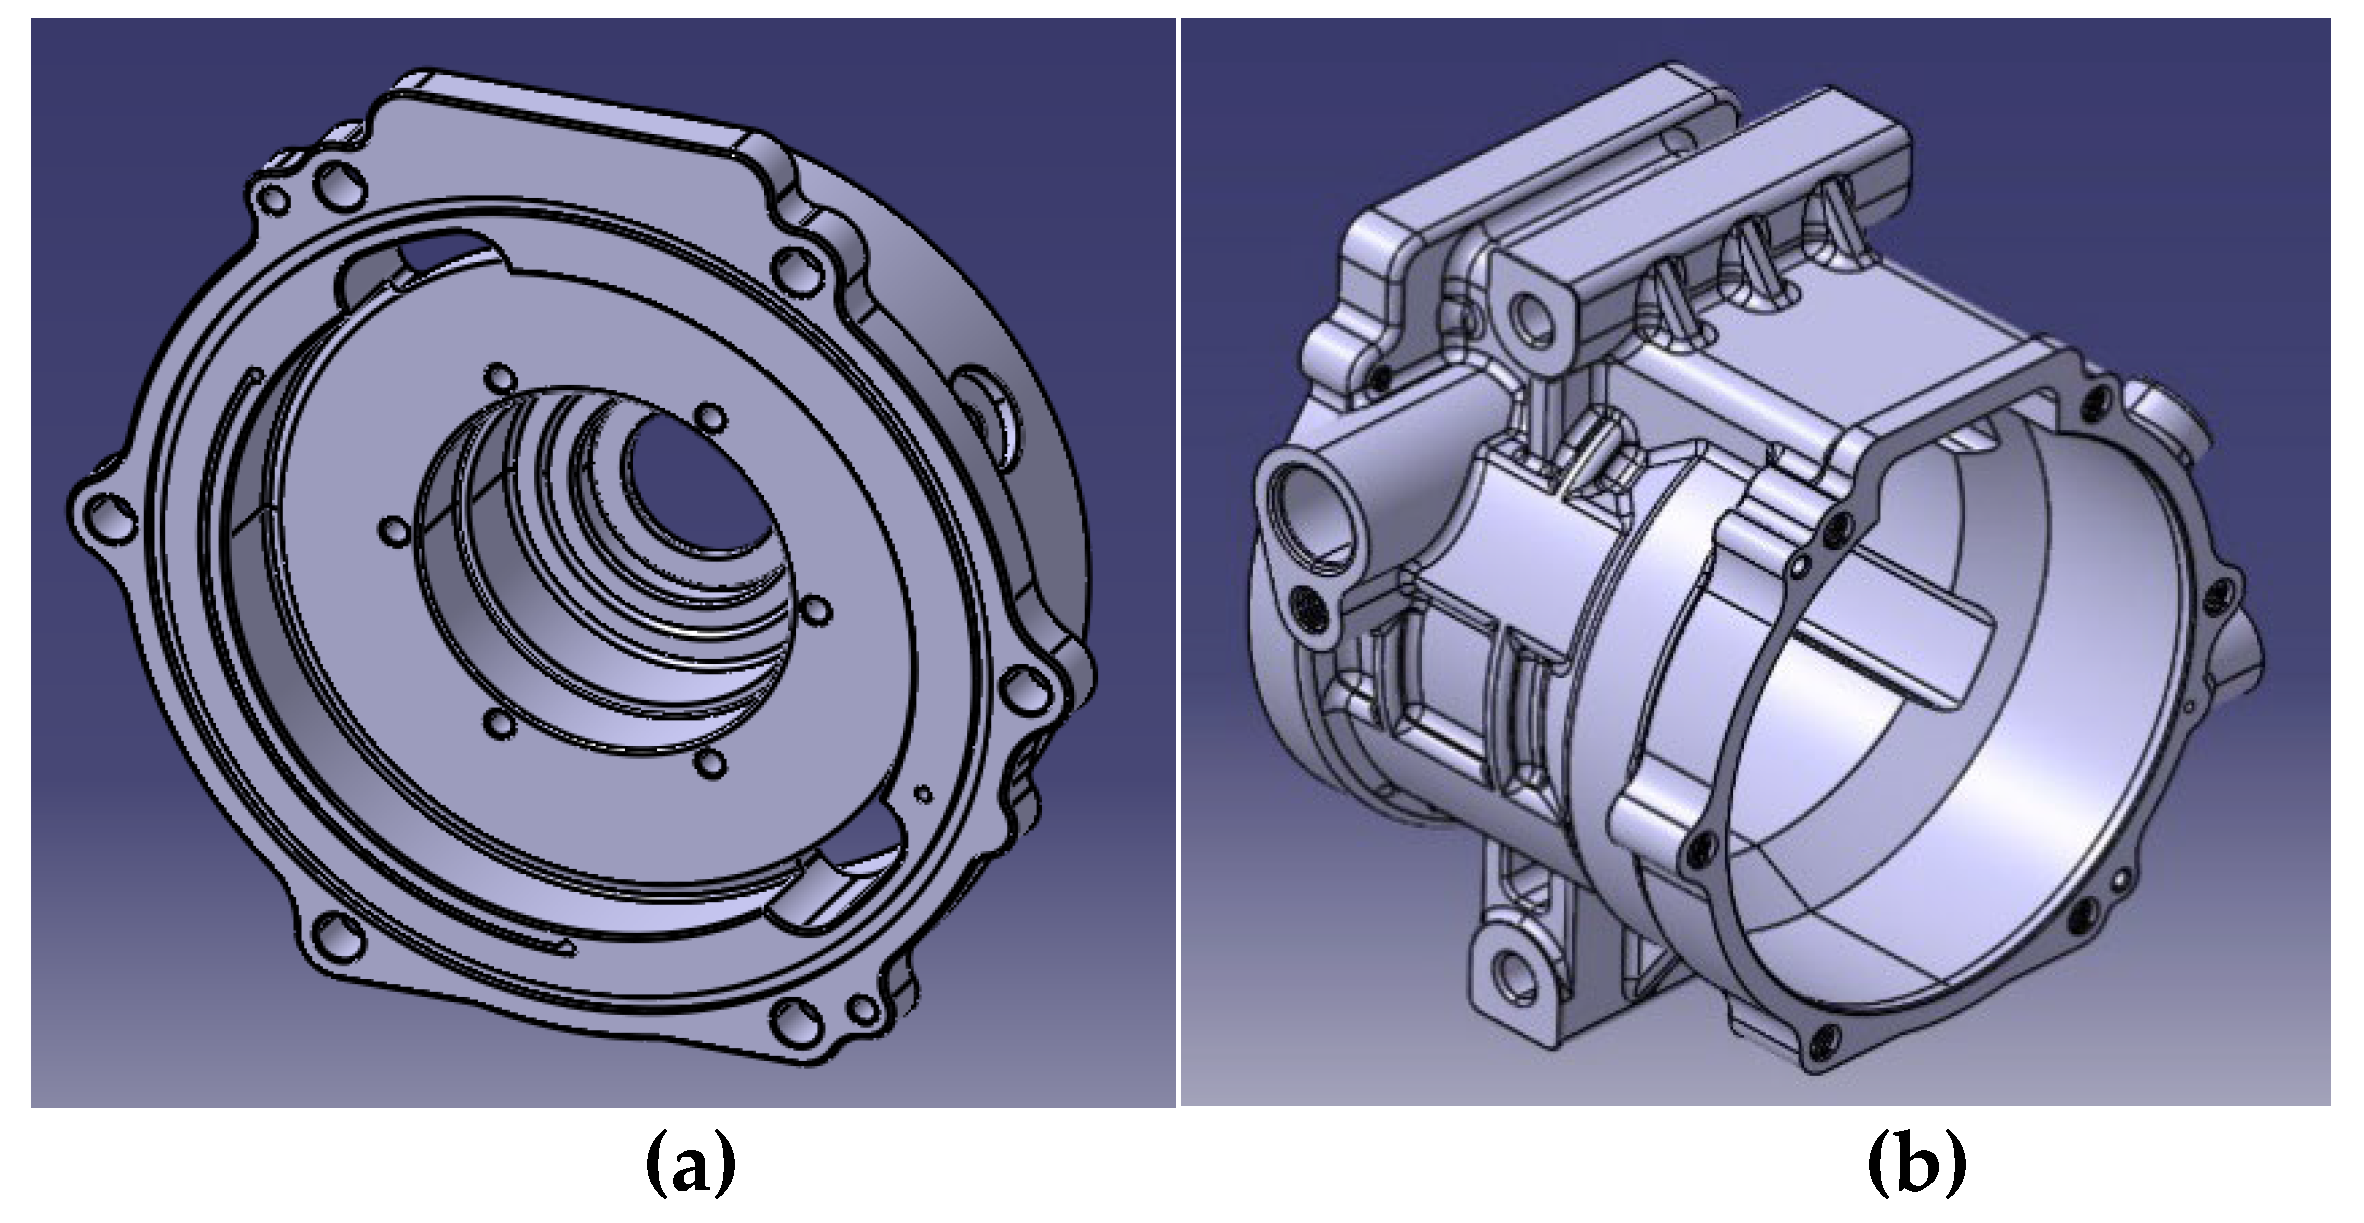
The housing modelled in CATIA was imported into the Modal tool of ANSYS. The material properties of ADC12 aluminum alloy were applied, and the fastening holes were defined as constrained surfaces. Subsequently, modal analysis was performed.
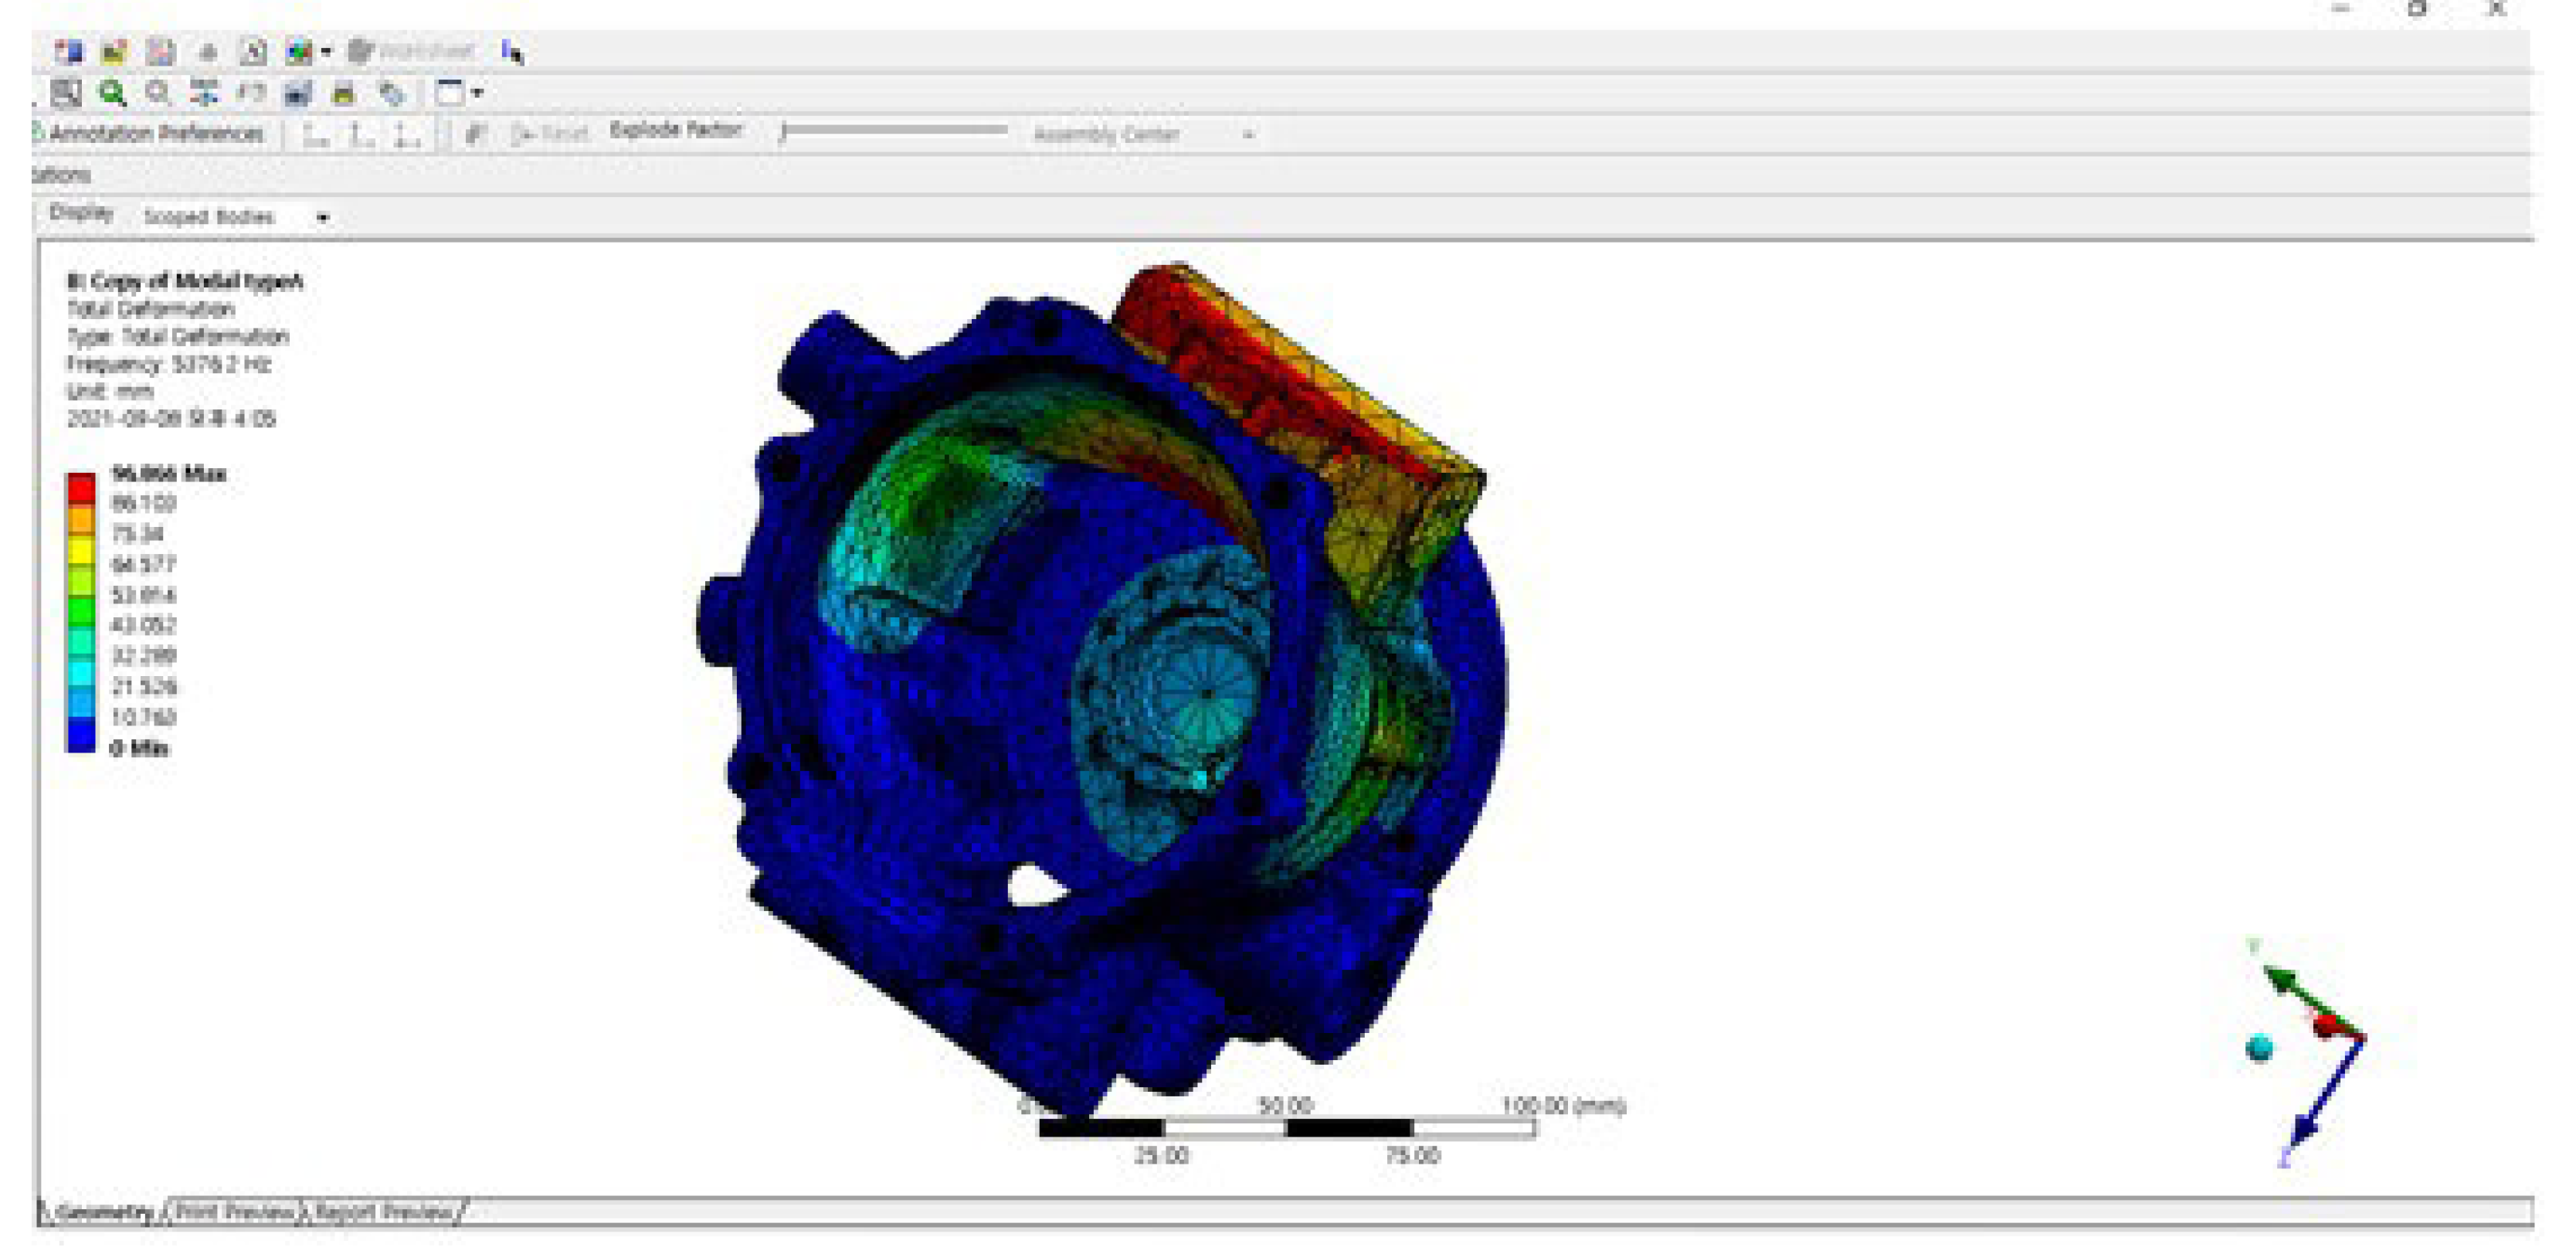
Figure 6.
Modal Analysis of Housing GMB Using ANSYS.
3.1.2. Impact Hammer Modal Testing of Competitors' Housing (GMB)
Impact hammer modal testing experiments were conducted on the competitors' housing. The testing utilized an accelerometer sensor, an impact hammer, and an FFT (Fast Fourier Transform) signal analyzer. During the experiment, an accelerometer sensor was attached to the housing, and an impact hammer was used to apply force to the housing. The accelerometer sensor collected vibration data, which was input into the FFT signal analyzer. The analysis was performed using dedicated experimental software, which processed the collected data and provided the results. To eliminate the effects of external contact during the experiment, the housing was suspended in the air using a string. Multiple measurements were taken to minimize minor errors and ensure accurate results. Additionally, measurements were conducted with the sensor attached at different positions on the housing.
Figure 7.
Impact Hammer Modal Testing Experiment.
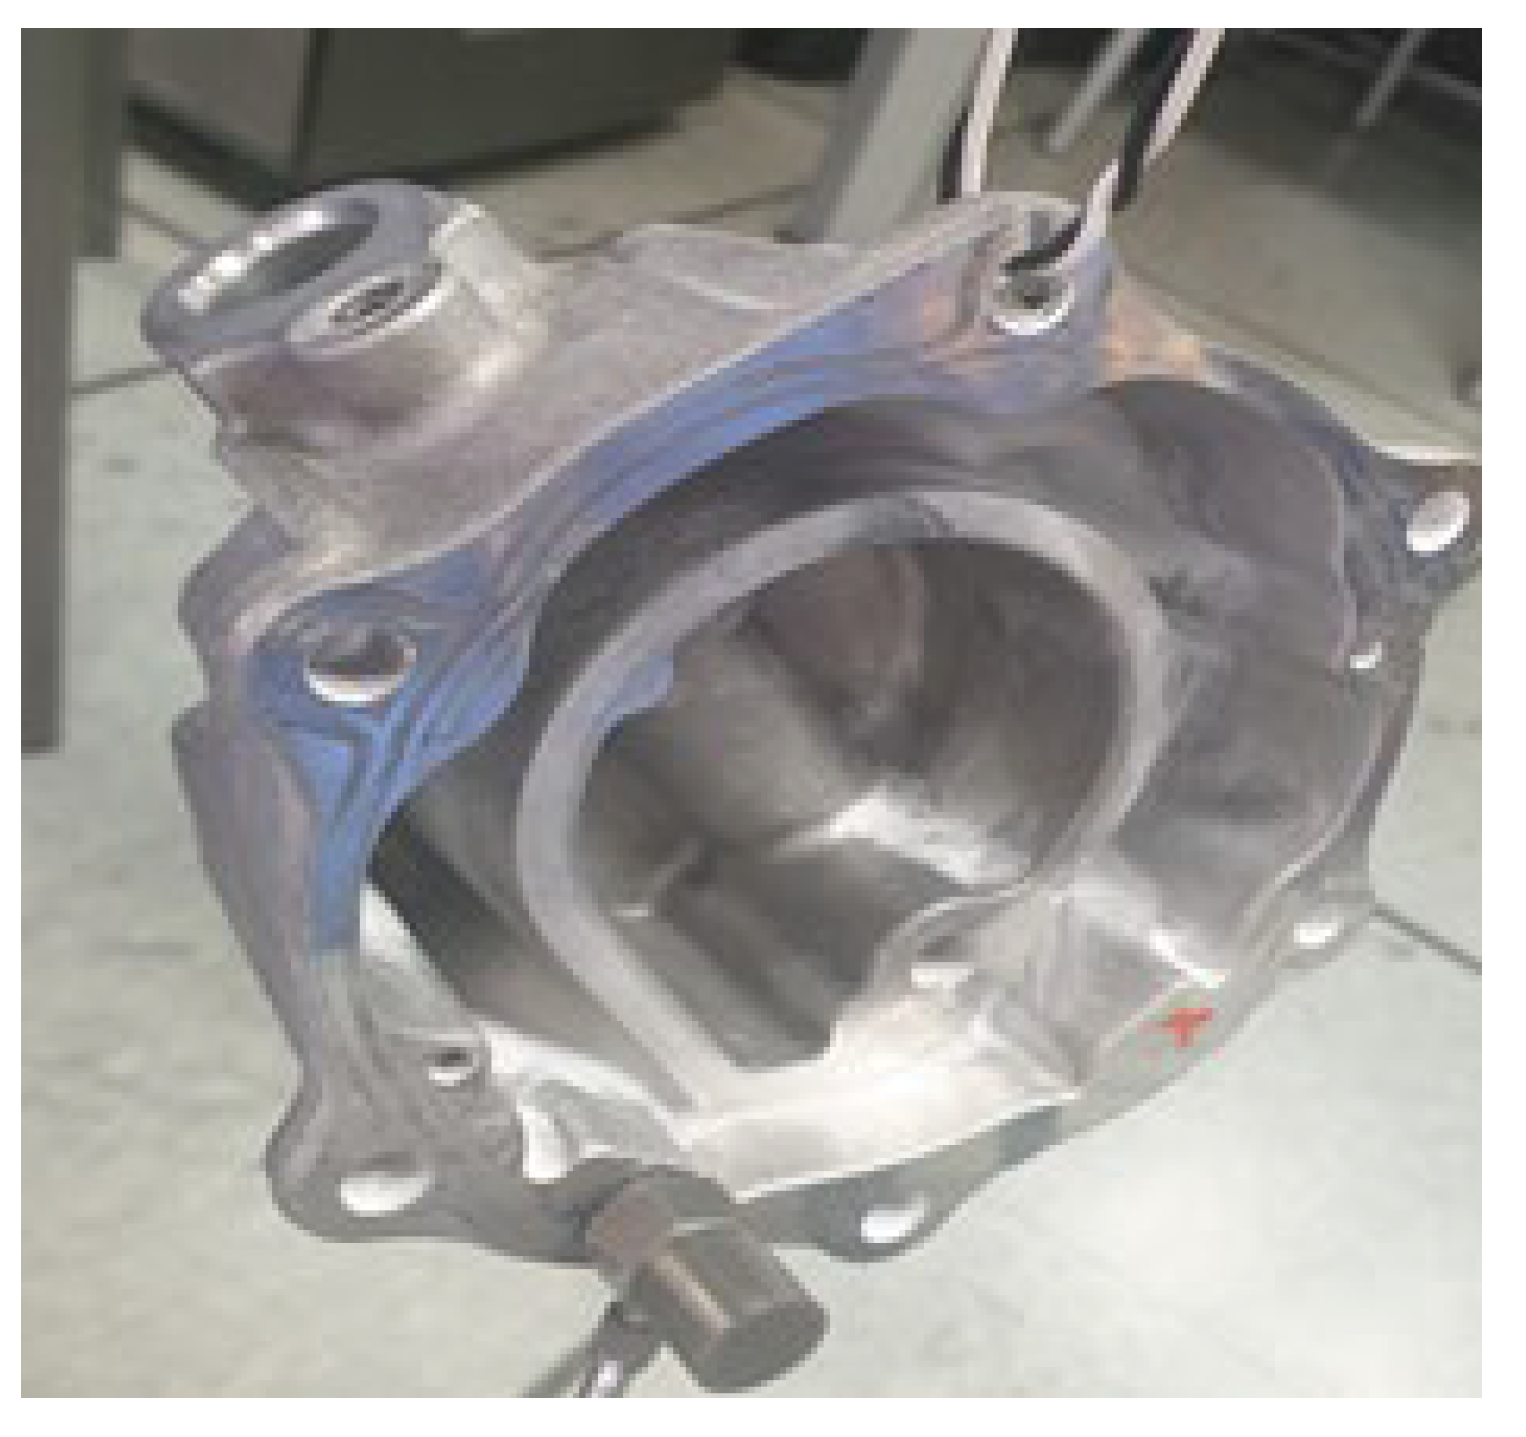
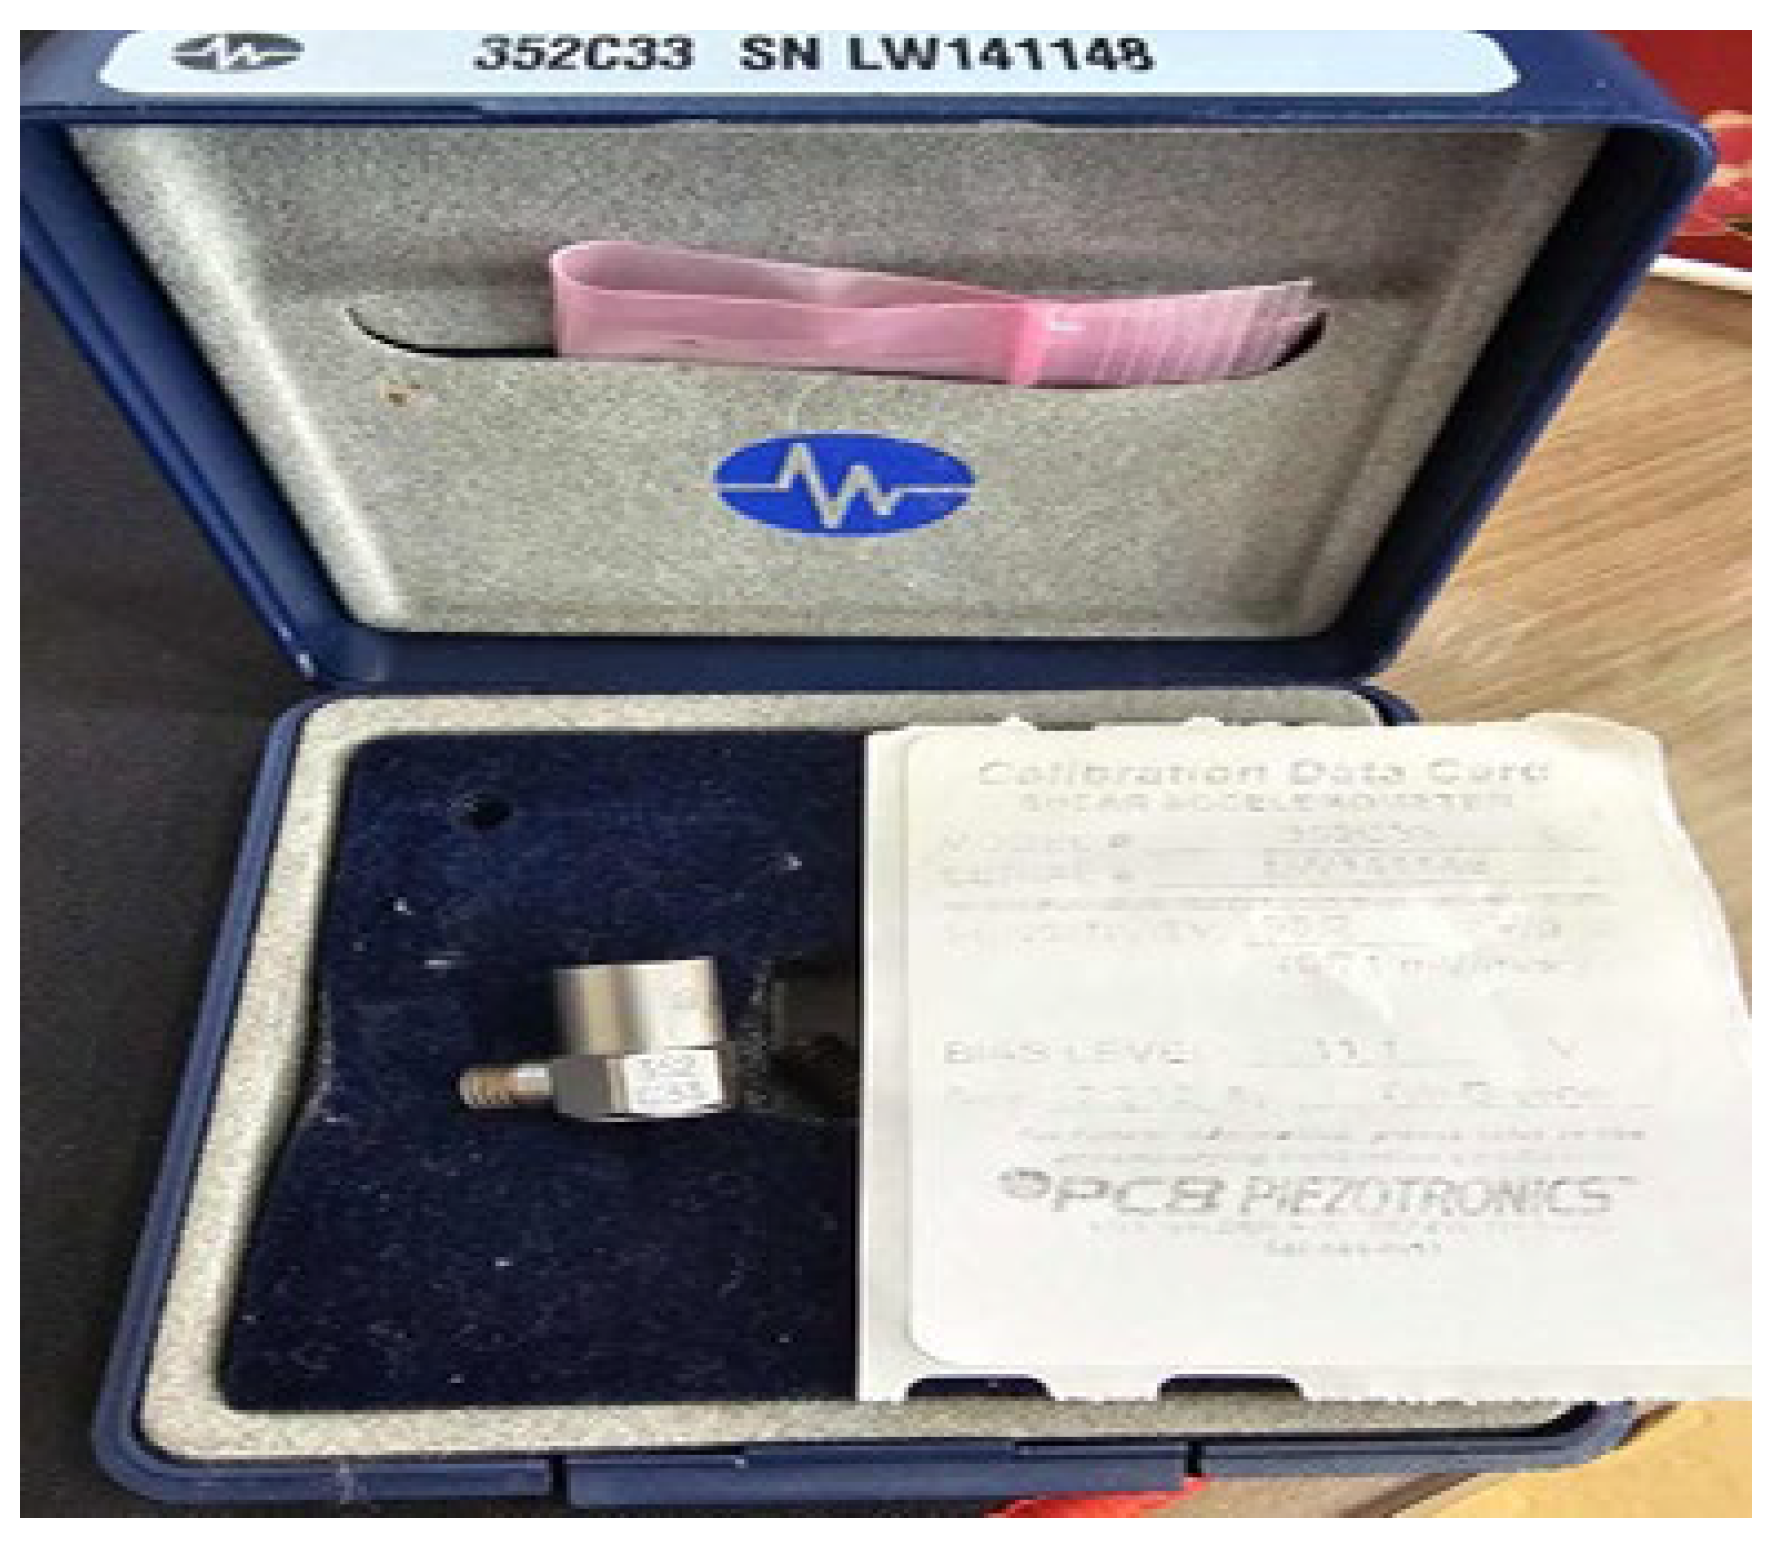
Figure 9 shows the accelerometer sensor used in the experiment. The detailed specifications of the sensor are presented in Table 4. The impact hammer used in the experiment was manufactured by KISTLER, while the FFT signal analyzer was a product of Bruel & Kjaer. The software utilized for data processing was Bruel & Kjaer – PULSE LabShop.
Figure 8.
Impact Hammer and FFT signal analyzer.
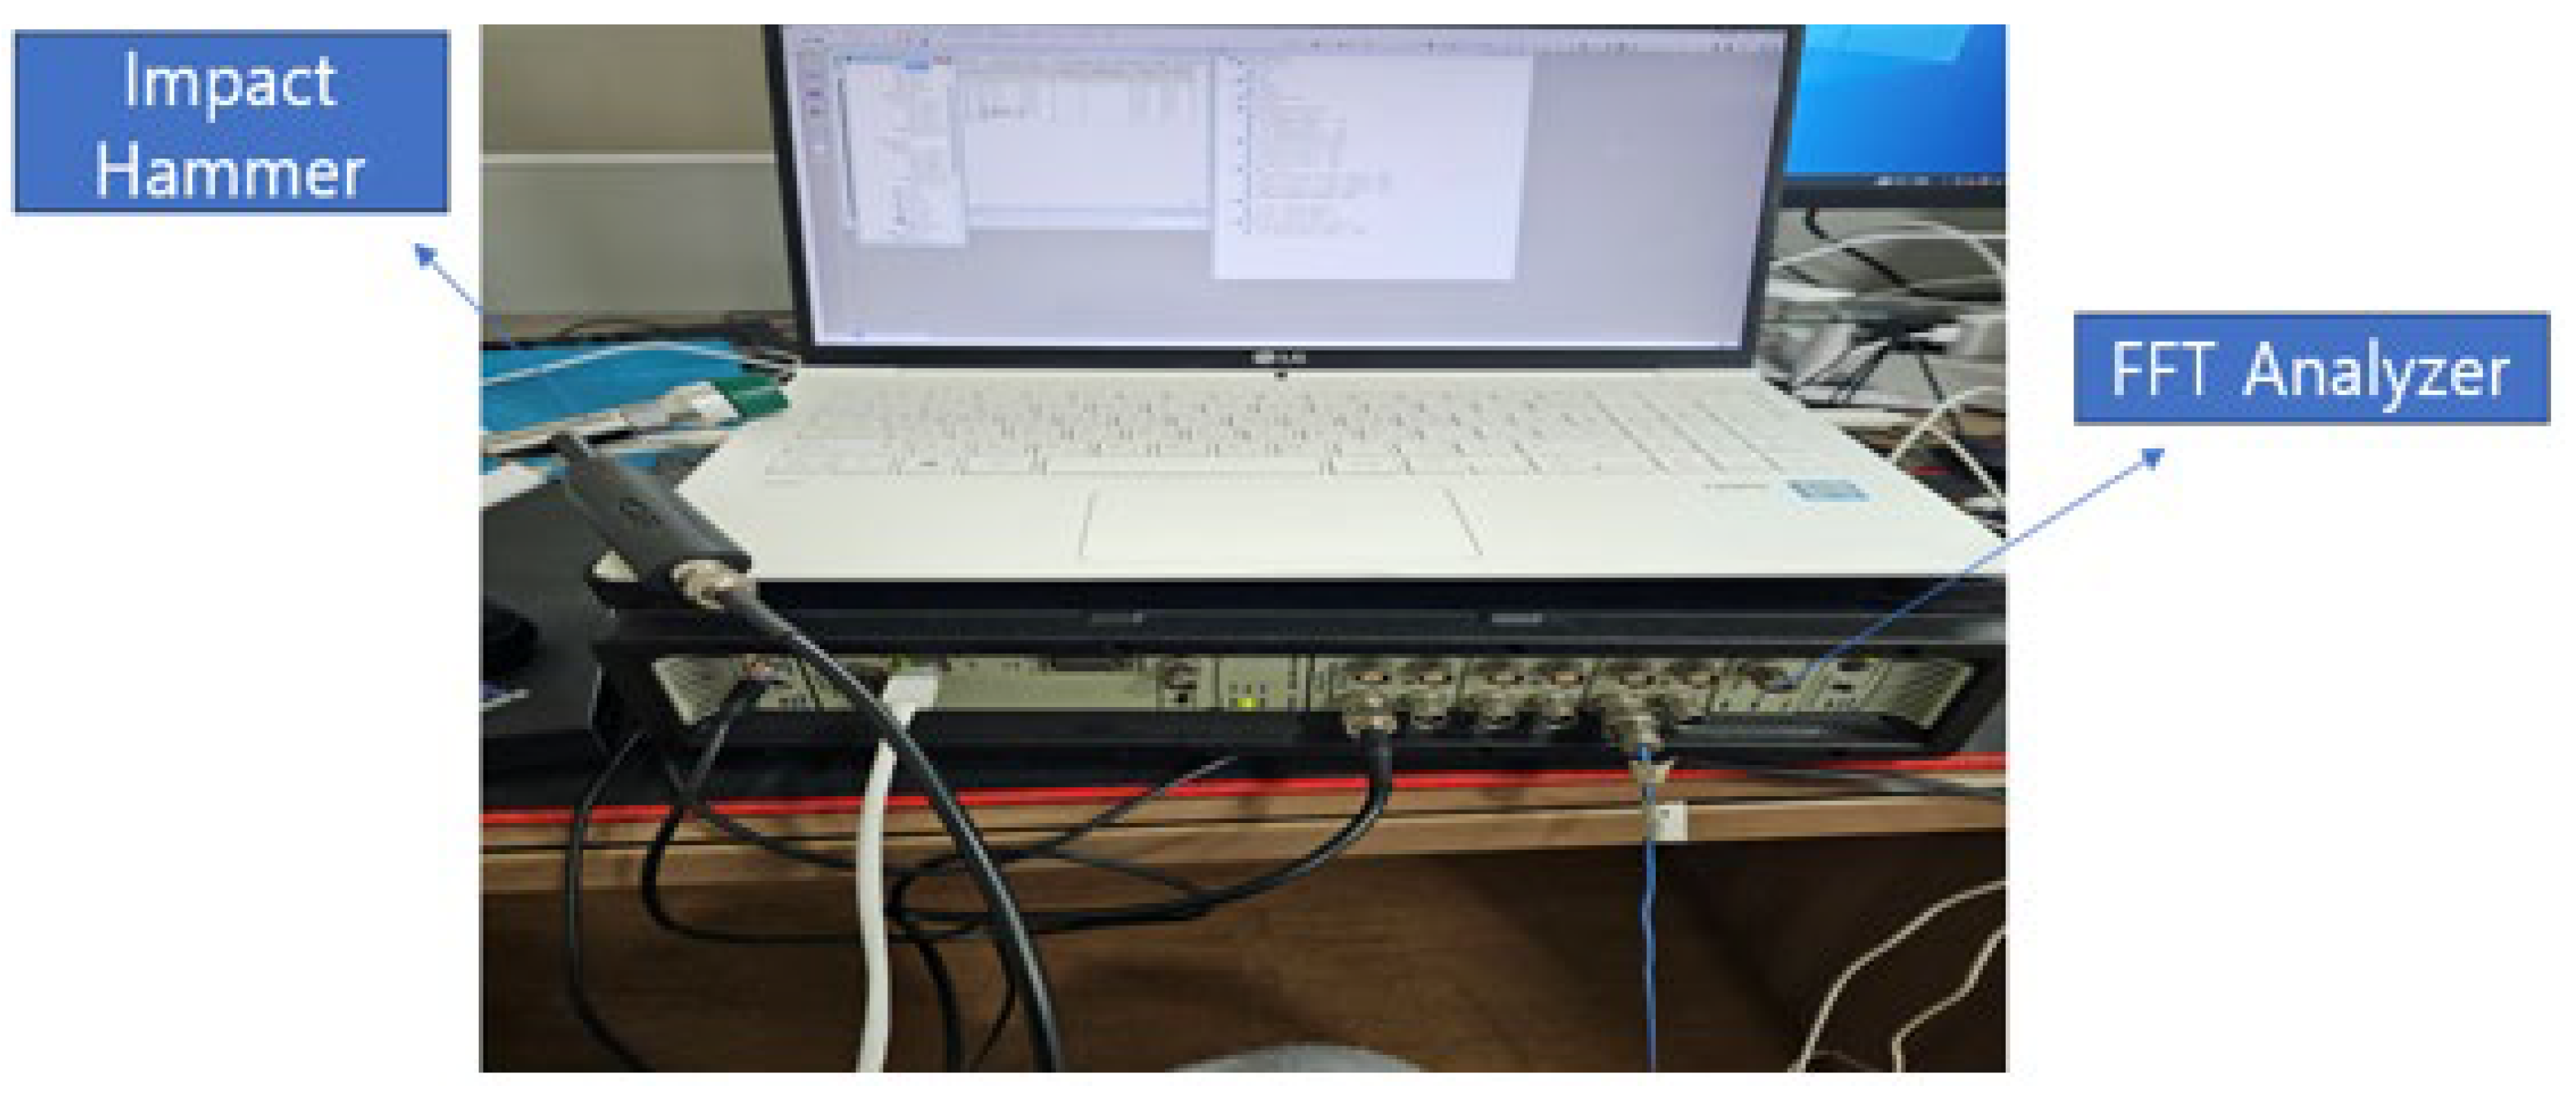
Figure 9.
Accelerometer Sensor.
3.2. Modal Analysis of the Existing Development Housing
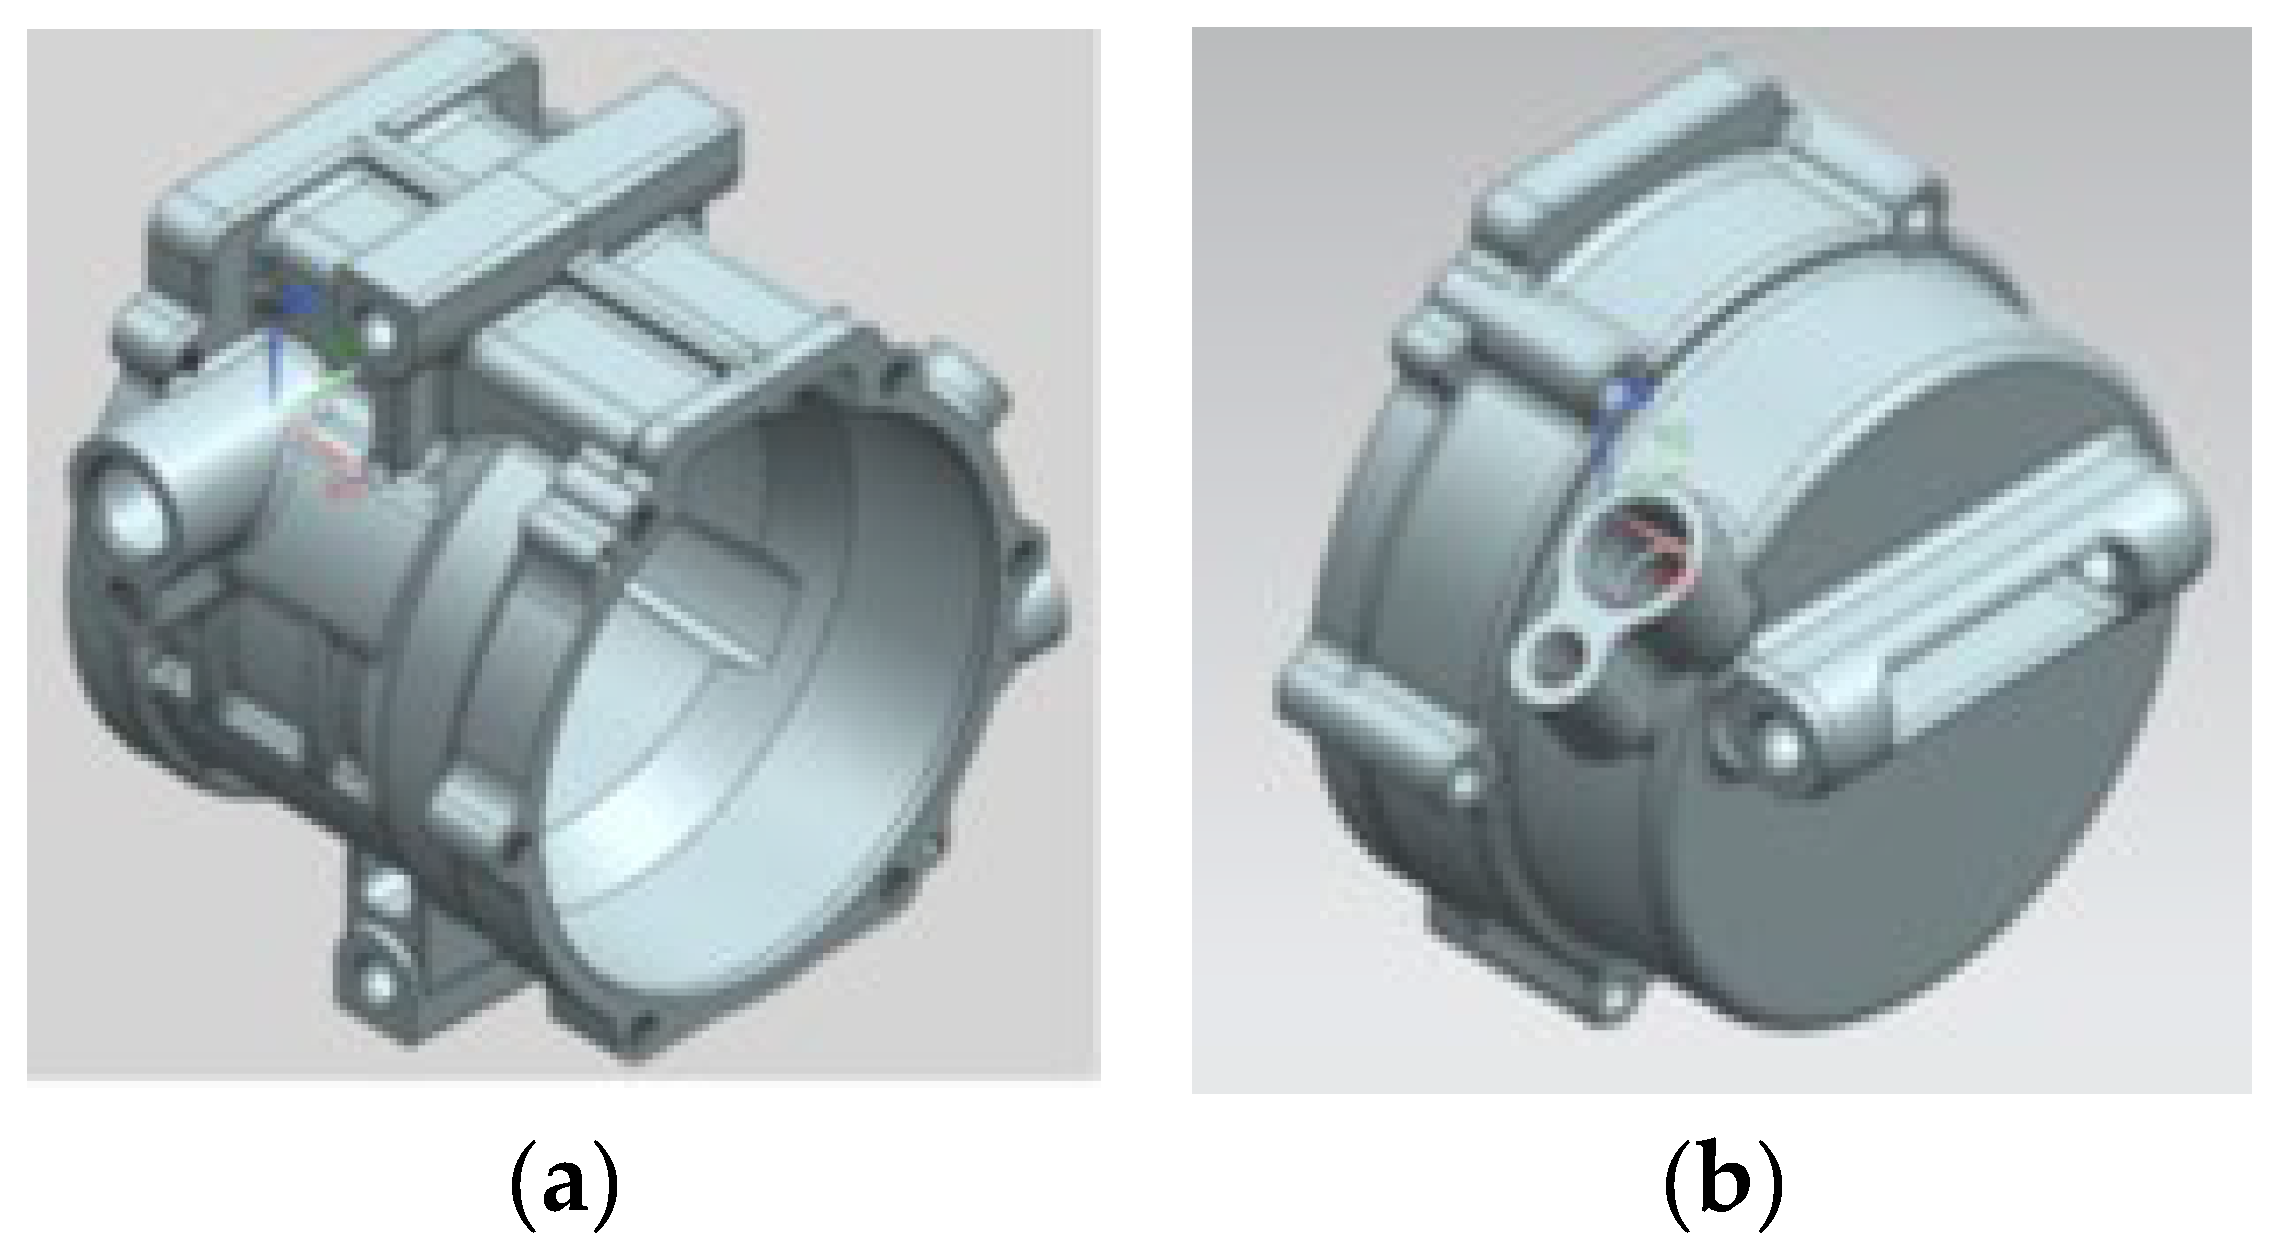
Once the reliability of the ANSYS modal analysis has been validated through a comparative evaluation with the results from the impact hammer modal testing experiments, the modal analysis will be conducted on the housing of the pre-improvement development product to identify its natural frequencies. The modelling was carried out based on technical drawings provided by the company currently developing the product. As with the previous analyses, the material properties of ADC12 were applied, and the fastening holes were defined as constrained surfaces. Modal analysis was performed under these conditions. Since design modifications will be made to the Main Housing and Rear Housing, the modal analysis focused solely on these two components.
Figure 10.
Improved Before Housing (a) Main Housing; (b) Rear Housing.
3.3. Modal Analysis of the Redesigned Development Housing
Modal analysis was conducted on the redesigned housing to determine its natural frequencies, incorporating modifications aimed at suppressing the transmission of vibration and acoustic energy. Ribs, thin and elongated structural features, are added to enhance the structural rigidity of a component. They play a significant role in reducing vibrations and enhancing structural stability. Mounting lugs, protruding components used to mount or secure mechanical components, contributing to increased fastening strength and the dispersion of vibration transmission. For the Main Housing, ribs were added to the side sections of the outer wall, and the inverter installation section was removed to simplify the structure. In addition, the number of mounting lugs was increased from one to two. For the Rear Housing, the outer wall ribs were enhanced, and the thickness of the bottom wall was increased from 4.0 mm to 6.5 mm. As in previous analyses, the material properties of ADC12 were applied, and the fastening holes were defined as constrained surfaces. Modal analysis was then subsequently conducted under these conditions.
Figure 11.
Improved Housing (a) Main Housing; (b) Rear Housing.
3.4. Noise Measurement of the Electric Compressor
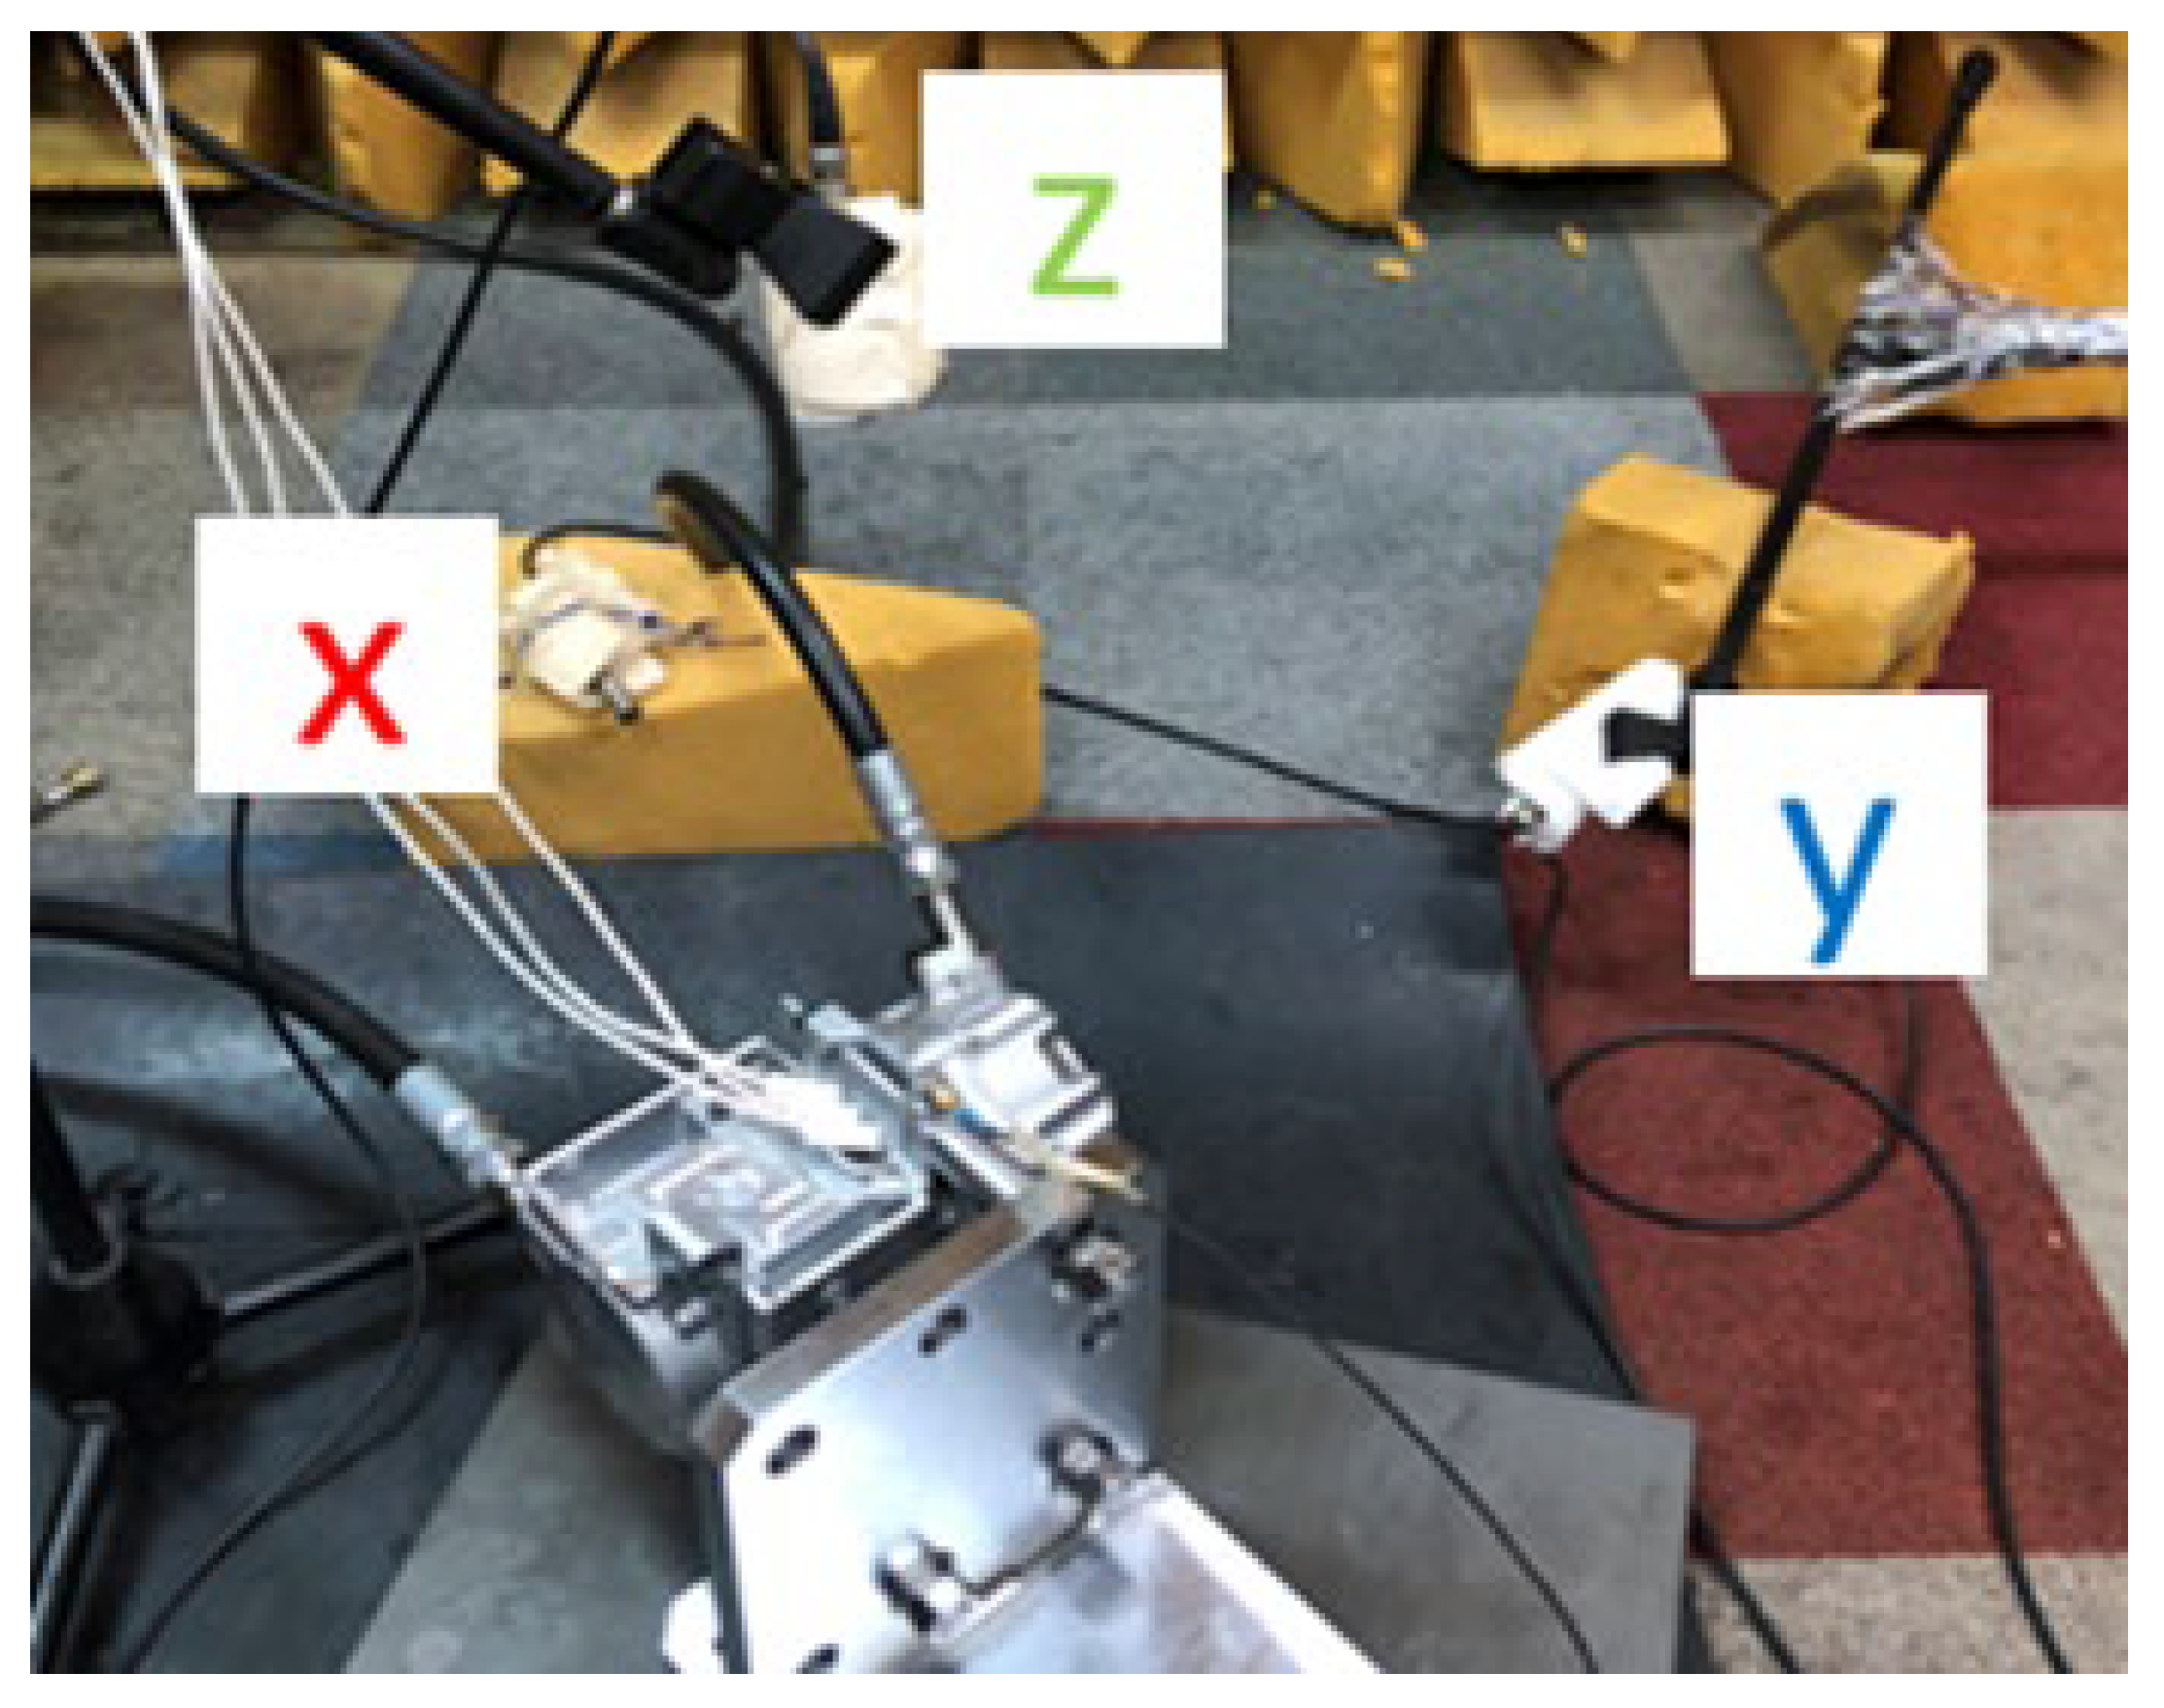
Noise measurements were performed in compliance with international standards such as ISO 3744 or ISO 9614. During the operation of the electric compressor, microphones were positioned along specific x, y, and z-axis locations at a defined distance from the reference electric compressor to capture noise levels. To minimize external noise interference, sound-absorbing materials were placed behind the microphones in the experimental environment.
For the baseline development product, noise measurements were taken to identify the sources of noise across various frequency bands. Subsequently, noise measurements were conducted on competitors’ products, and a comparative analysis was performed to identify strategies for noise reduction. Finally, noise measurements were taken on the redesigned development product, incorporating changes to flow paths and clearances, to validate the proposed noise reduction strategies and assess their effectiveness.
Figure 12.
Noise Measurement.
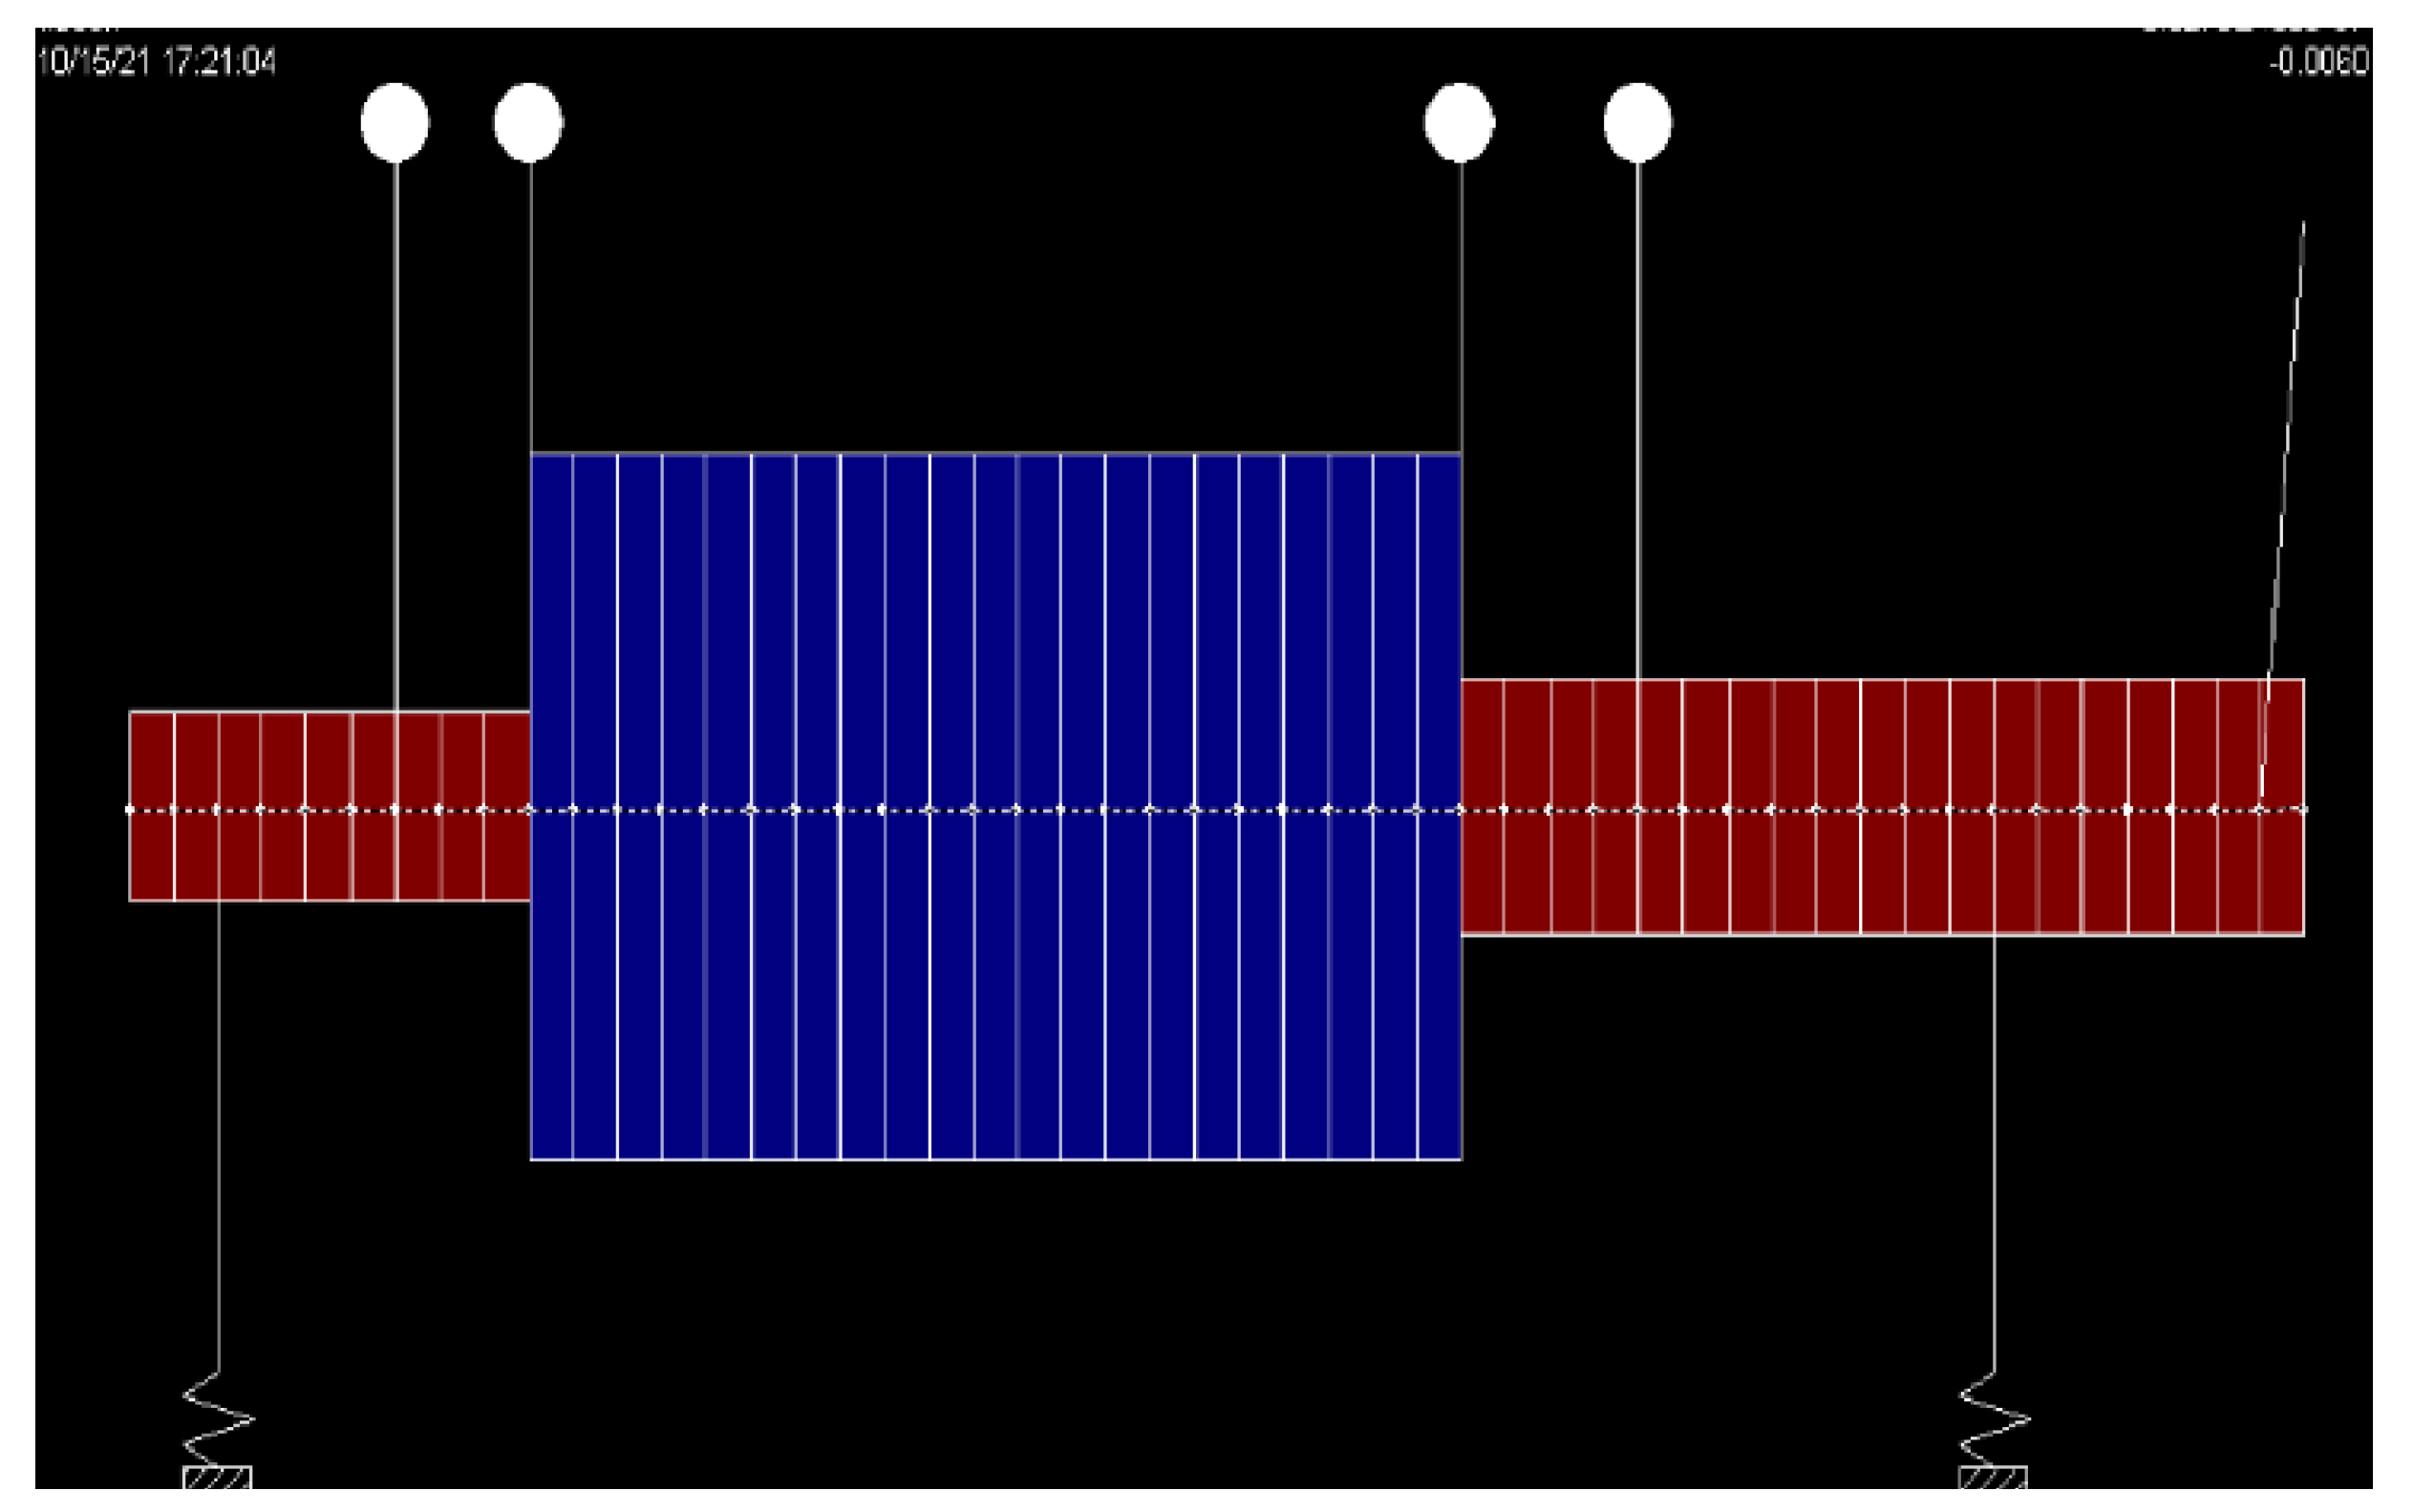
3.5. Critical Speed Analysis of the Rotating Component Using ARMD
To determine whether the noise is caused by vibrations generated during the rotation of the shaft, a critical speed analysis of the main shaft was conducted. The analysis was performed using **ARMD (Advanced Rotating Machinery Dynamics) 5.6 Ver.** software developed by RBTS. The choice of ARMD was based on its proven accuracy and reliability, as validated in prior studies comparing ARMD analyses with experimental results for dynamic stability in rotating machinery. The analysis utilized 49 elements, with each element having a length of 2 mm. A rotational speed of 3000 rpm, corresponding to the operating speed of the electric compressor, was applied during the simulation. This approach aimed to accurately identify critical speeds and evaluate the potential impact of rotational vibrations on noise generation.
Figure 13.
Main Shaft Modeling in ARMD.
4. Results
4.1. Analysis and Experimental Results for Validating the Reliability of Housing Modal Analysis
4.1.1. Modal Analysis Results for Competitors' Housing
The modal analysis of the competitors' **Main Housing** revealed the natural frequencies for modes 1 through 10, as shown in the table below.
Table 5.
Result of Competitors' Main Housing ANSYS Modal Analysis.
| Mode Number | Frequency [Hz] |
|---|---|
| 1 | 0 |
| 2 | 0 |
| 3 | 3.9666E-3 |
| 4 | 350.64 |
| 5 | 516.74 |
| 6 | 2462.3 |
| 7 | 3498.6 |
| 8 | 5130.2 |
| 9 | 6986.3 |
| 10 | 7799 |
The modal analysis of the Front Housing from competitors revealed the natural frequencies for modes 1 through 10, as shown in the table below.
Table 6.
Result of Competitors' Front Housing ANSYS Modal Analysis.
| Mode Number | Frequency [Hz] |
|---|---|
| 1 | 0 |
| 2 | 1.47173E-3 |
| 3 | 4.4004E-3 |
| 4 | 230.92 |
| 5 | 260 |
| 6 | 705 |
| 7 | 1275.1 |
| 8 | 1654.6 |
| 9 | 2010.1 |
| 10 | 2188.6 |
4.1.2. Result of Impact Hammer Modal Testing for Competitors' Housing
The impact hammer modal testing results for the Main Housing, conducted by performing four measurements for each of the two impact positions and two sensor attachment locations, are presented in the table below.
Table 7.
Result of Impact Hammer Modal Testing for Competitors' Main Housing.
| Strike Position Number |
Sensor Position Number |
Ave1 Frequency [Hz] |
Ave2 Frequency [Hz] |
Ave3 Frequency [Hz] |
Ave4 Frequency [Hz] |
Total Ave Frequency [Hz] |
|---|---|---|---|---|---|---|
| 1 | 1 | 3207 | 3431 | 3216 | 3217 | 3257 |
| 2 | 3413 | 3416 | 3417 | 3417 | 3415 | |
| 2 | 1 | 3223 | 3220 | 3219 | 3217 | 3218 |
| 2 | 3418 | 3420 | 3420 | 3420 | 3419 |
The impact hammer modal testing results for the Front Housing, conducted by performing four measurements for each of the two impact positions, are presented in the table below.
Table 8.
Result of Impact Hammer Modal Testing for Competitors' Front Housing.
| Strike Position Number |
Sensor Position Number |
Ave1 Frequency [Hz] |
Ave2 Frequency [Hz] |
Ave3 Frequency [Hz] |
Ave4 Frequency [Hz] |
Total Ave Frequency [Hz] |
|---|---|---|---|---|---|---|
| 1 | - | 1566 | 1565 | 1564 | 1565 | 1565 |
| - | 2040 | 2040 | 2040 | 2040 | ||
| 4181 | 4178 | 4177 | 4177 | 4178 | ||
| 2 | - | 1180 | 1180 | 1180 | 1180 | 1180 |
| 1548 | 1548 | 1548 | 1548 | 1548 | ||
| 2022 | 2022 | 2022 | 2022 | 2022 | ||
| 2862 | 2862 | 2862 | 2862 | 2862 |
4.1.3. Comparison of Competitors' Housing Modal Analysis and Impact Hammer Modal Testing Results
Although slight differences were observed in the measurements due to variations in sensor positions and impact locations, the frequencies obtained from the impact hammer modal testing for the Main Housing were 3200 Hz and 3410 Hz. These values are closest to the Mode 7 frequency of 3498.6 Hz from the ANSYS modal analysis. The frequencies near 0 Hz in the analysis represent rigid body motion and are not relevant to actual vibration analysis. The remaining lower modes are likely to be localized frequencies resulting from the complex geometry of the housing and may not be associated with noise generation. Therefore, Mode 7, which aligns closely with the experimental results, is considered accurate, and the analysis results are deemed reliable.
For the Front Housing, the frequencies obtained from the impact hammer modal testing were 1560 Hz and 2030 Hz. These correspond closely to Mode 8 (1654.5 Hz) and Mode 9 (2010.1 Hz) from the ANSYS modal analysis. For similar reasons, Modes 8 and 9, which closely match the experimental results, are considered accurate. This confirms that the ANSYS modal analysis is reliable.
4.2. Modal Analysis Results of the Existing Development Housing
The modal analysis of the Main Housing from the existing development product revealed the natural frequencies for modes 1 through 10, as shown in the table below.
Table 9.
Results of Existing Development Main Housing ANSYS Modal Analysis.
| Mode Number | Frequency [Hz] |
|---|---|
| 1 | 0 |
| 2 | 5.4056E-3 |
| 3 | 7.5803E-3 |
| 4 | 399.06 |
| 5 | 431.99 |
| 6 | 2519.1 |
| 7 | 4492.8 |
| 8 | 5640.6 |
| 9 | 8766.9 |
| 10 | 9459.3 |
The modal analysis of the Rear Housing from the existing development product revealed the natural frequencies for modes 1 through 10, as shown in the table below.
Table 10.
Results of Existing Development Rear Housing ANSYS Modal Analysis.
| Mode Number | Frequency [Hz] |
|---|---|
| 1 | 0 |
| 2 | 3.9666E-3 |
| 3 | 3.9666E-3 |
| 4 | 2568.3 |
| 5 | 3595.9 |
| 6 | 6708.6 |
| 7 | 7037.6 |
| 8 | 7670.8 |
| 9 | 8788.9 |
| 10 | 9026.2 |
4.3. Modal Analysis Results of the Redesigned Development Housing
For the Main Housing, the outer wall ribs were reinforced, and the inverter installation section was removed to simplify the structure. Additionally, the number of mounting lugs was increased from one to two. The modal analysis of the redesigned development product’s Main Housing revealed the natural frequencies for modes 1 through 10, as shown in the table below.
Table 11.
Results of Redesigned Development Main Housing ANSYS Modal Analysis.
| Mode Number | Frequency [Hz] |
|---|---|
| 1 | 0 |
| 2 | 2.7383E-3 |
| 3 | 4.6278E-3 |
| 4 | 365.14 |
| 5 | 394.98 |
| 6 | 2418.5 |
| 7 | 4114.5 |
| 8 | 5183.5 |
| 9 | 7827.8 |
| 10 | 8666.2 |
For the Rear Housing, the outer wall ribs were reinforced, and the bottom wall thickness was increased from 4.0 mm to 6.5 mm. The modal analysis of the redesigned development product’s Rear Housing revealed the natural frequencies for modes 1 through 10, as shown in the table below.
Table 12.
Results of Redesigned Development Rear Housing ANSYS Modal Analysis.
| Mode Number | Frequency [Hz] |
|---|---|
| 1 | 340.21 |
| 2 | 377.13 |
| 3 | 1385 |
| 4 | 2156 |
| 5 | 3638.2 |
| 6 | 4130.8 |
| 7 | 5245.7 |
| 8 | 6283.8 |
| 9 | 7439 |
| 10 | 8035.8 |
A comparison of the modal analysis results between the existing housing and the redesigned housing revealed that the natural frequencies of the redesigned product were lower.
4.4. Results of Noise Measurement
4.4.1. Noise Analysis Results for the Existing Development Product
The noise analysis of the existing development product suggests that noise above 10,000 Hz is likely related to the operating frequency of the motor inverter. Noise in the 4000–5000 Hz range appears to be caused by pressure pulsations occurring in the discharge or suction flow paths. Additionally, noise in the 600–800 Hz range is presumed to result from resonance, where the natural frequency of a specific component aligns closely with external frequencies. These findings enable the identification of probable noise sources across different frequency bands. By comparing the natural frequencies of the housing, the structural and operational characteristics of competitors’ products, and the noise measurement results, strategies for noise reduction can be developed.
4.4.1. Noise Analysis Results for the Existing Development Product
Figure 14 presents a graph comparing the noise measurements of electric compressors with various specifications from different competitors. The x-axis represents the operating speed of the electric compressors (rpm), while the y-axis shows the noise level (dB). According to the graph, the noise level generally increases with speed across all electric compressors. However, the rate of noise increase varies depending on the system design and carrier frequency conditions. The carrier frequency, commonly used in power electronic devices, refers to the signal frequency generated when driving the electric motor through the inverter.
The GMB compressor showed relatively high noise levels. However, when the carrier frequency was changed from 4000 Hz to 20,000 Hz, a clear noise reduction was observed in the low-speed range. The Hanon compressor used a carrier frequency of 20,000 Hz, but noise increased compared to the 4000 Hz condition, likely due to differences between universal and dedicated controllers. The DENSO compressor used a carrier frequency of 4000 Hz and showed moderate noise levels in the low-speed range. The DooWon compressor, operating with a carrier frequency of 15,000 Hz, demonstrated the lowest noise levels in the low-speed range.
Since the electric compressor under development is expected to operate at 3000 rpm, the DooWon compressor’s noise performance is considered the most favorable. Additionally, the results suggest that higher carrier frequencies are generally advantageous for noise reduction.
4.4.3. Results of Noise Measurement Based on Inverter Carrier Frequency
Figure 15 presents the noise and frequency analysis results for the GMB compressor, comparing the effects of carrier frequencies of 4000 Hz and 20,000 Hz. When operating at a carrier frequency of 4000 Hz, strong harmonics are observed, and the amplitude significantly increases around the 5000 Hz frequency band, leading to a noticeable increase in noise levels. In contrast, with a carrier frequency of 20,000 Hz, the impact of harmonics is reduced, and noise levels show a tendency to be suppressed.
Figure 16 compares the two scenarios, demonstrating that the use of a 20,000 Hz carrier frequency results in lower noise levels across all operating ranges. In the graphs, the blue dotted line represents the results for the 4000 Hz frequency, while the blue solid line represents the results for the 20,000 Hz frequency. This analysis confirms that noise can be effectively reduced by adjusting the inverter carrier frequency, even if 20,000 Hz is not specifically used.
4.4.4. Results of Noise Measurement for the Redesigned Development Product
Figure 17 compares the noise measurement results of the baseline compressor (existing development product) and the redesigned compressor, which incorporated modifications such as stiffness reinforcement, adjustments to flow paths, and clearance changes, aimed at reducing noise.
The Baseline (black solid line) represents the noise measurement results for the existing development product. The M/H Stiffness Reinforcement (red solid line), which involved the addition of ribs and mounting lugs for structural reinforcement, shows a noise trend like the Baseline. When the A+ Flow Channel Expansion was expanded (black dashed line), noise levels increased compared to the Baseline. Conversely, when the A+ flow Channel Contraction was reduced (grey dashed line), the noise trend was like the Baseline. However, when the A+ flow Channel Contraction + O/S Clearance Contraction was also reduced (blue solid line), the noise levels were not only lower than in other conditions but also significantly lower compared to the Baseline compressor. These results indicate that the combination of A+ flow Channel Contraction and O/S Clearance Contraction is the most effective modification for noise reduction.
Figure 18 illustrates a comparison of noise levels between the existing development product, the redesigned development product, and competitors' products. The graph shows that the noise reduction achieved through the design modifications—specifically the A+ flow Channel Contraction + O/S Clearance Contraction —brought the noise levels of the redesigned product closer to those of competitors, indicating significant improvement in noise performance.
4.5. Results of Critical Speed Analysis Using ARMD
The results of the rotating component analysis for the main shaft, conducted using ARMD, are presented below. The analysis indicates that the critical speed of the main shaft is significantly distant from the operating rotational speed of the compressor, which is 50 Hz. Therefore, it can be concluded that noise caused by main shaft vibration is not a contributing factor.
Table 9.
Results of ARMD Critical Speed Analysis for the Main Shaft.
| Mode Number | Frequency [Hz] |
|---|---|
| 1 | 97.23 |
| 2 | 2889.2 |
| 3 | 15911.8 |
| 4 | 31950.3 |
| 5 | 61220 |
| 6 | 829212 |
5. Discussion
In order to validate the reliability of the ANSYS modal analysis, the results from the ANSYS modal analysis were compared with those from impact hammer modal testing. The comparison revealed no significant discrepancies between the two, confirming the reliability of the ANSYS modal analysis. Subsequently, structural elements such as ribs and mounting lugs were incorporated into the housing of the existing development product to suppress the transmission of vibration and acoustic energy. Modal analyses were performed on both the original and redesigned housings using ANSYS, with the natural frequencies of each housing identified. It was observed that the natural frequencies decreased following the design modifications. This indicates suggests that, whenever further design changes are undertaken or concerns about housing resonance-induced noise arise, the natural frequencies of the housing can be assessed through ANSYS modal analysis after the housing modelling.
Noise measurement and analysis of the existing development product revealed that noise above 10,000 Hz is likely estimated to be the operating frequency of the motor inverter. Noise in the 4000–5000 Hz range is presumed to originate from pressure pulsations in the discharge or suction flow Channel and Clearances. Meanwhile, noise in the 600–800 Hz range is thought to result from the resonance of mechanical components.
Noise measurement and analysis of competitors’ compressors demonstrated that using a higher carrier frequency of 20,000 Hz instead of a lower frequency of 4000 Hz significantly reduces noise. This is likely because lower carrier frequencies amplify high-frequency components generated within the motor, which are major contributors to motor vibration and noise. Conversely, higher carrier frequencies suppress these high-frequency components, leading to a reduction in noise levels.
To address noise caused by pressure pulsations, design modifications to the flow channel and clearances were implemented. Noise measurements of the redesigned compressor showed that among the various design changes, such as flow channel expansion, flow channel contraction and clearance contraction, Flow Channel expansion resulted in increased noise. Flow channel contraction alone did not produce significant noise reduction, but the combination of flow path contraction and clearance contraction effectively reduced noise levels. This is attributed to the stabilization of fluid flow and suppression of pressure pulsations and vortices due to reduced clearance.
Additionally, to ascertain whether noise could be attributed to resonance caused by the rotation of the main shaft, a critical speed analysis was conducted using ARMD, a specialized software for rotating component analysis. The analysis demonstrated that the critical speed was significantly higher than the compressor's operating rotational speed of 3000 rpm. Therefore, noise caused by the resonance of the main shaft was excluded as a contributing factor.
6. Conclusions
This study aimed to achieve noise reduction in an existing electric scroll compressor with minimal design modifications. To this end, the natural frequencies of the compressor housing were identified using modal analysis, and noise measurements were conducted to analyze the causes of noise across different frequency bands. The primary sources of noise were determined to be resonance in mechanical components such as the housing, pressure pulsations in the suction and discharge flow paths and clearances, and high-frequency components generated within the motor.
Based on these findings, design modifications, such as reinforcing ribs and adding mounting lugs to the housing, were implemented. Modelling and analysis enabled the identification and evaluation of changes in the housing's natural frequencies resulting from these modifications. Additionally, the effectiveness of noise reduction measures was verified through adjustments to higher inverter carrier frequencies and changes to flow path and clearance designs. These efforts successfully reduced the noise levels to a level comparable to those of competitors’ products. The results of the ARMD-based rotating component analysis confirmed that main shaft vibrations were not a contributing factor to noise.
The redesigned development product not only achieved noise reduction compared to the existing product but also improved structural rigidity and simplified the design, resulting in enhanced lightweight properties and manufacturing efficiency. This study demonstrates that housing natural frequencies can be effectively identified and evaluated through modelling and analysis alone, and that significant noise reduction can be achieved with minimal cost and small-scale design modifications, such as adjustments to the inverter carrier frequency, flow paths, and clearances.
In future research, additional evaluations of manufacturing costs and durability resulting from design changes will be conducted to ensure the product's practicality and readiness for commercialization. Furthermore, additional experiments and studies will be carried out under various operating conditions to further reduce noise and enhance product performance.
References
- B. H. Ahn.; Y. S. Kim. (1999). A Study on Abnormal Noise Reduction of Scroll Compressor. 한국동력기계공학회지 제3권 제4호. 28~35.
- Toyama, T.; Nishikawa, Y.; Yoshida, Y.; Hiodoshi, S.; Shibamoto, Y. (2002). Reduction Of Noise And Over-Compression Loss By Scroll Compressor With Modified Discharge Check Valve. International Compressor Engineering Conference. Paper 1587.
- Yanagisawa, M.; Uematsu, T.; Hiodoshi, S.; Saito, M.; Era, S. (2002). Noise Reduction Technology For Inverter Controlled Scroll Compressors. International Compressor Engineering Conference. Paper 1578.
- Rockwood, W. B. (1998). Noise and Vibration Characterization and Statistical Energy Analysis of a Scroll Compressor. International Compressor Engineering Conference. Paper 1261.
- Jin. Kab. Lee. (2000). Identification of Noise Sources in Scroll Compressor for Air-Conditioner. KSME International Journal, Vol. 14, No. 6, 597~604.
- Motegi, Shuji; Nakashima, Shinji. (1996). A Study on Noise Reduction in a Scroll Compressor. International Compressor Engineering Conference. Paper 1171.
- Chuang. Wang.; Zhen. Wang.; Weiguo. Yan.; Hongkun. Li.; Chunli. Yang. (2021). Study on Characteristics of the Vibration and Noise of High-Power Scroll Compressor. Hindawi Shock and Vibration Volume.
- Calhoun, John; Moore, James; Forni, Ronald. (2016). Stick-Slip Squeal in a Dry Scroll Vacuum Pump. International Compressor Engineering Conference. Paper 2470.
- Justin. Tharp. Moylan. (2015). Sound Reduction of Air Compressor Using a Systematic Approach.
- Miao. Qing.; Men. Yanru.; Wu. Jinxiang.; Gou. Xiang. (2014). Studies on Scroll Compressor Noise Improvement. Mechanics and Materials Vol. 694. 504~508.
Figure 2.
Comparison of Competitors’ Winding Arrangements (a) Denso; (b) Hanon; (c) Doowon; (d) GMB.
Figure 2.
Comparison of Competitors’ Winding Arrangements (a) Denso; (b) Hanon; (c) Doowon; (d) GMB.
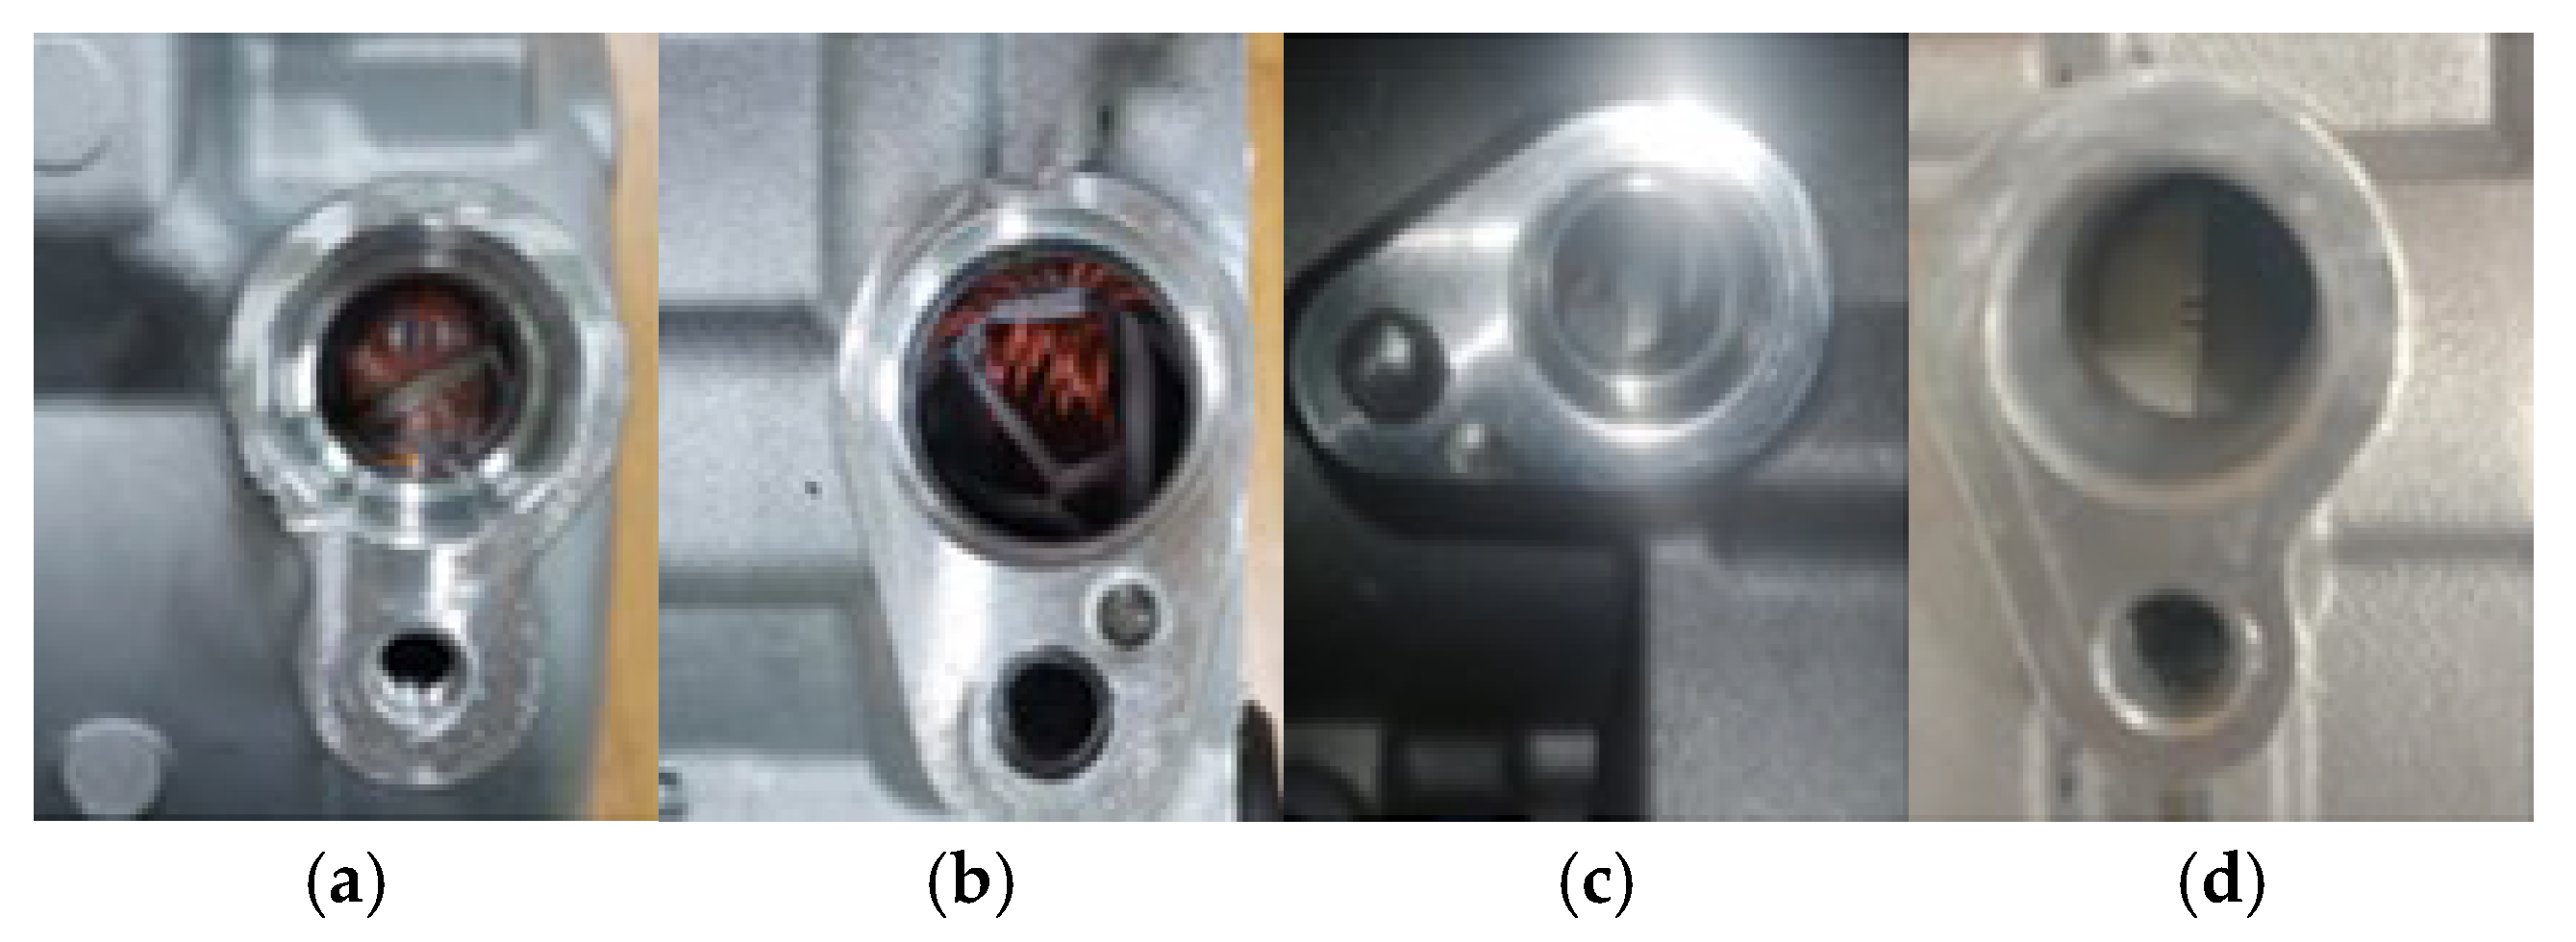
Figure 3.
Rear Housing Structures of Competitors (a) Denso; (b) Hanon; (c) Doowon; (d) GMB.
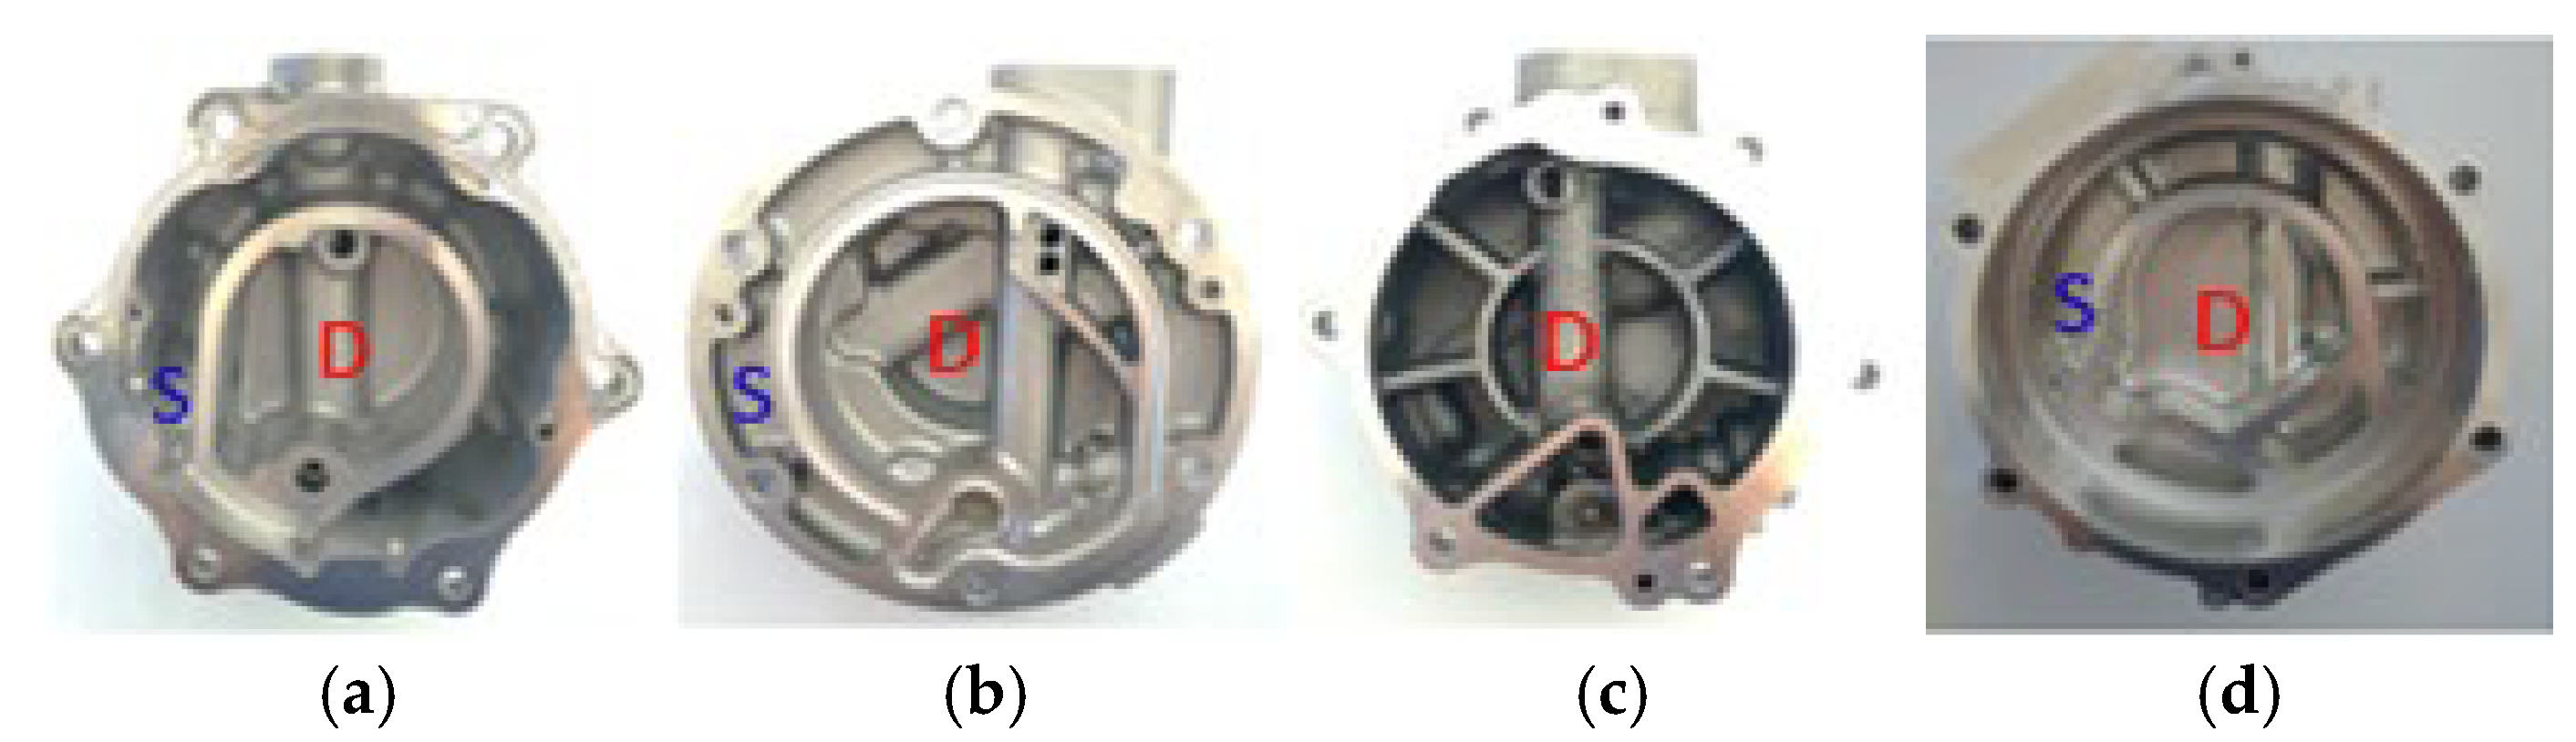
Figure 4.
Structure of Oil Separator.
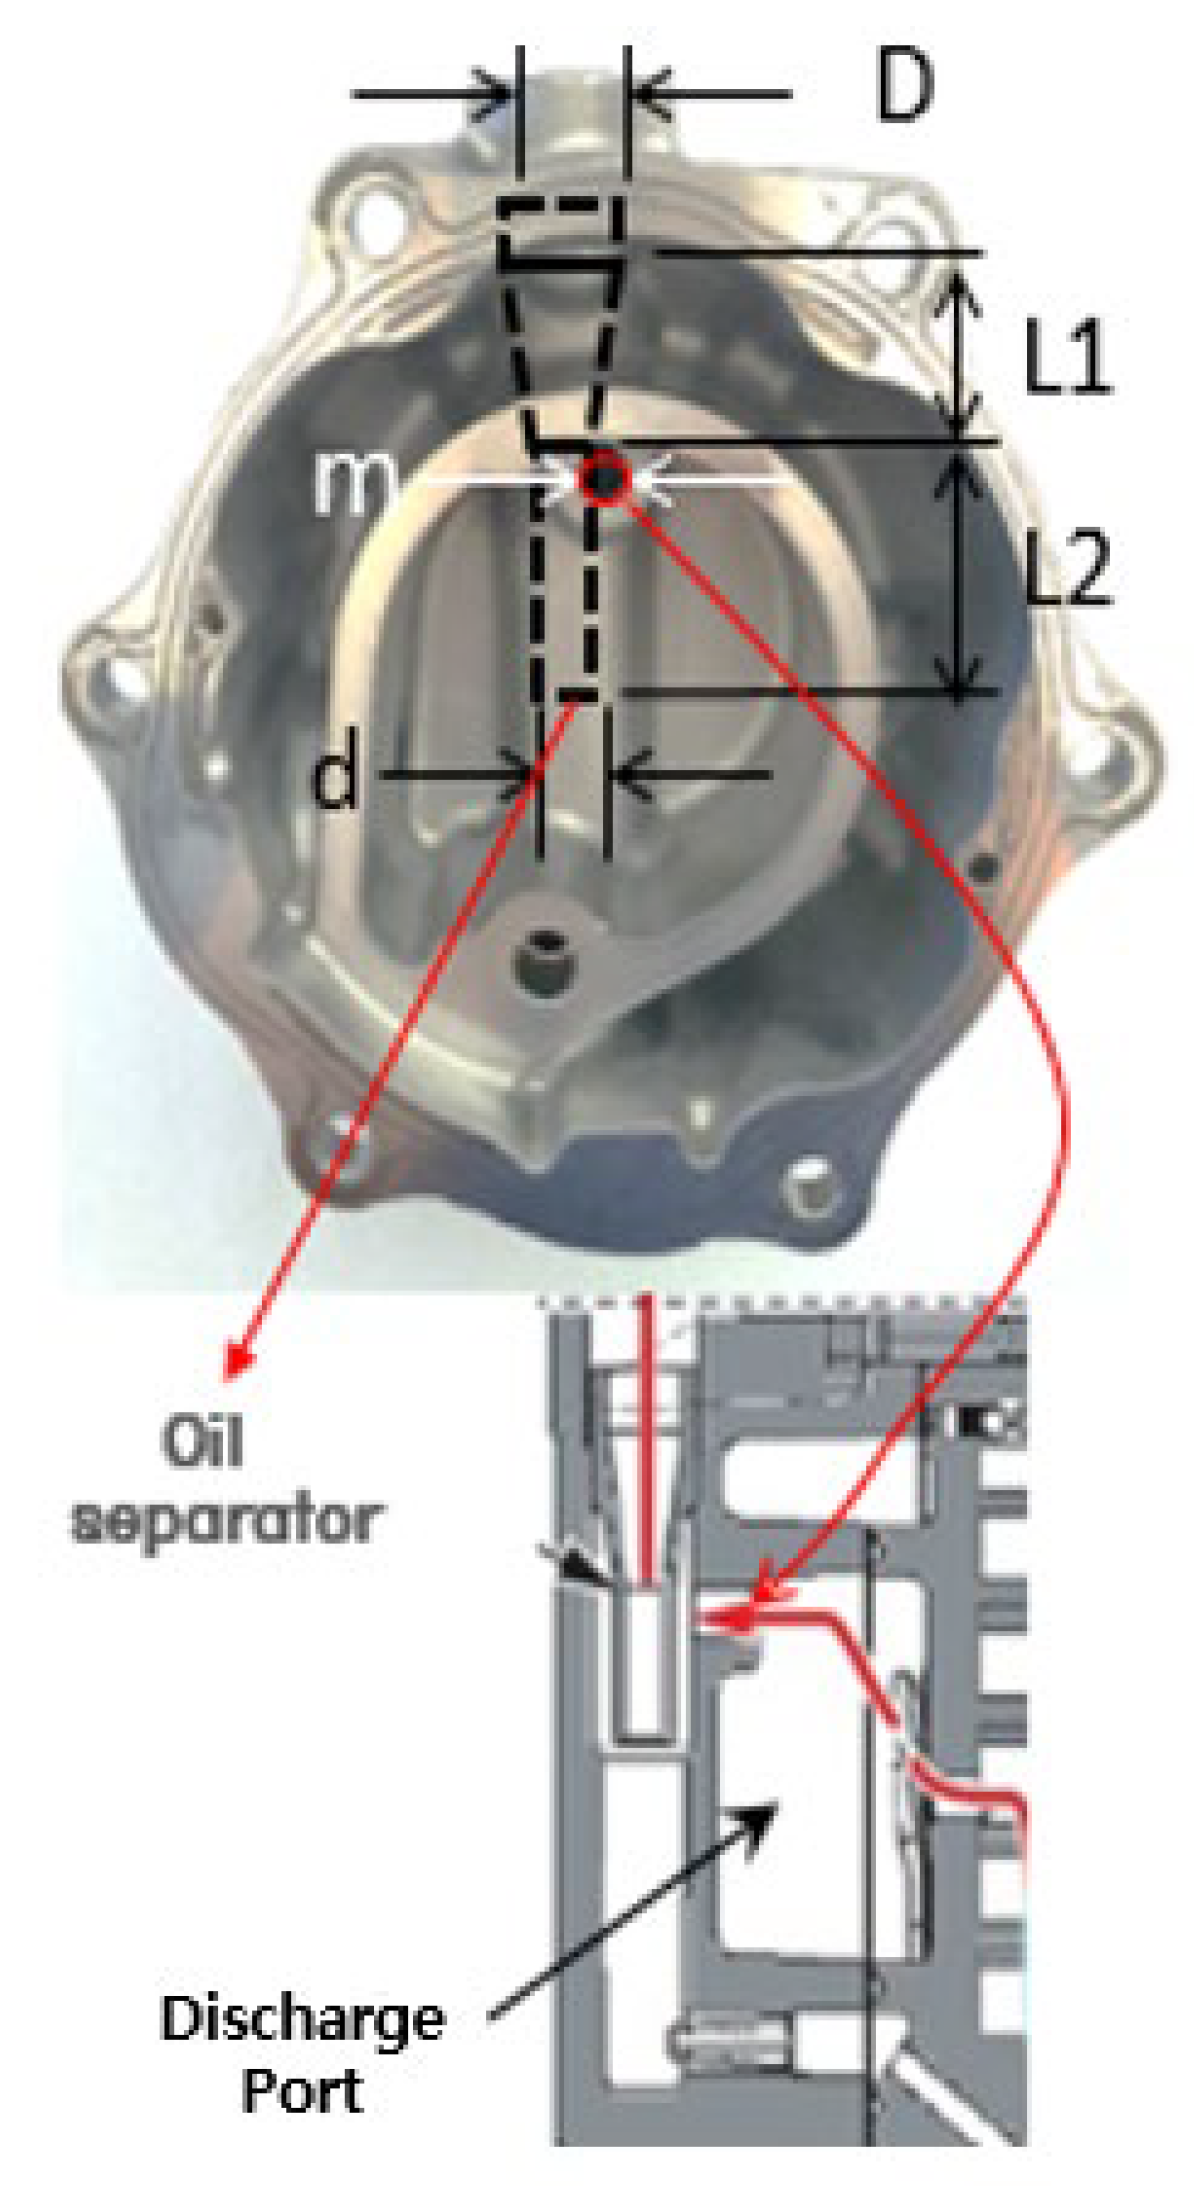
Figure 14.
Results of Competitors’ Noise Measurement.
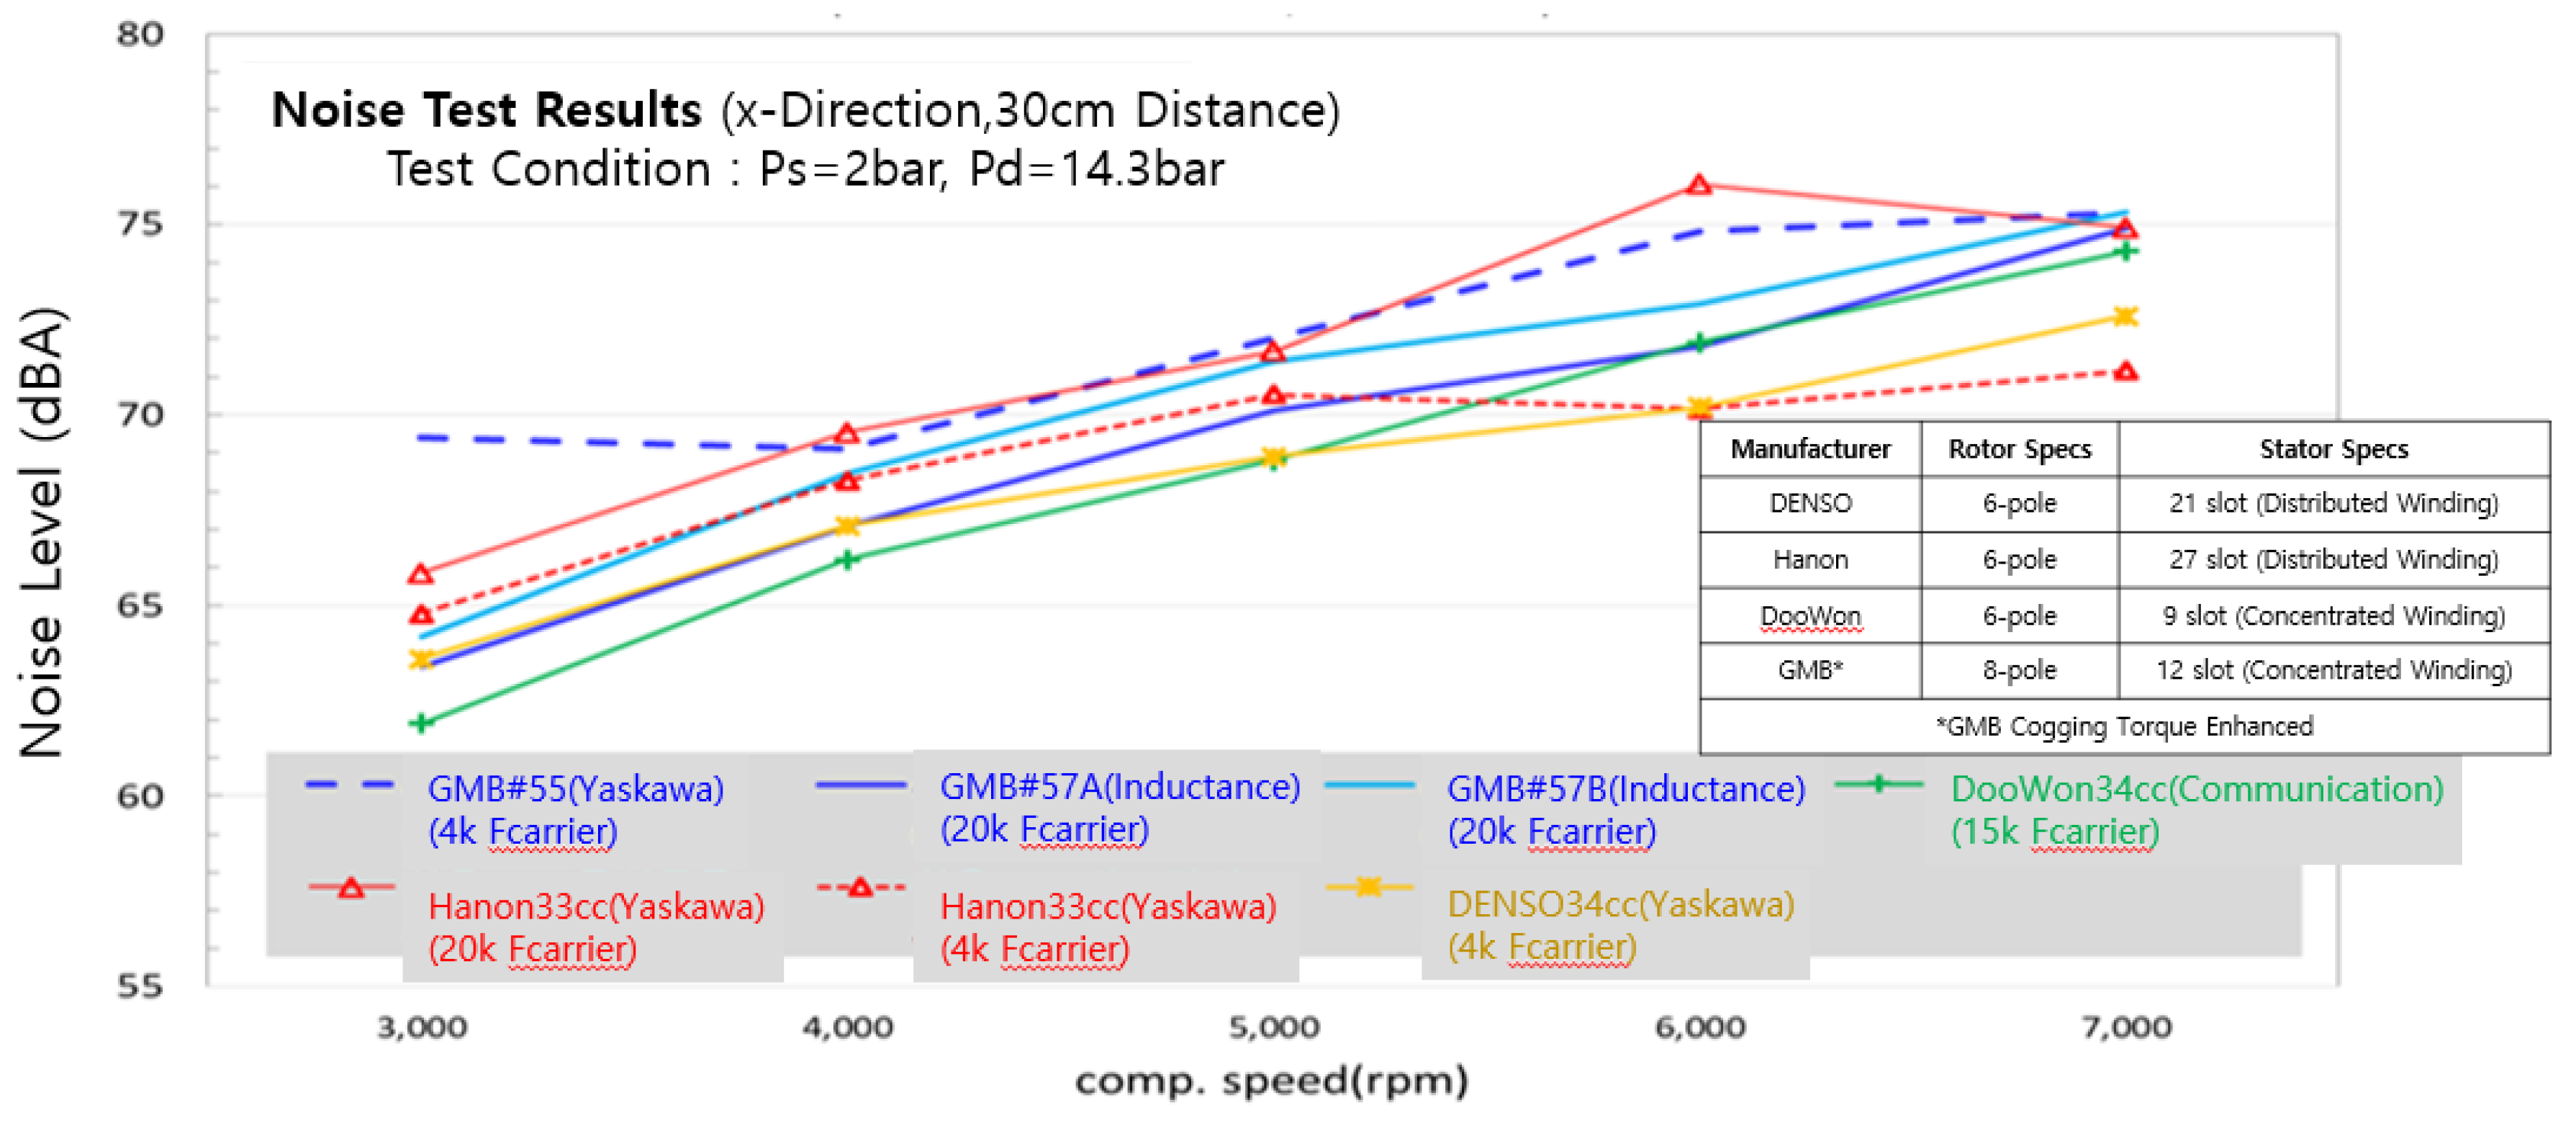
Figure 15.
Noise Spectrum According to Carrier Frequency.
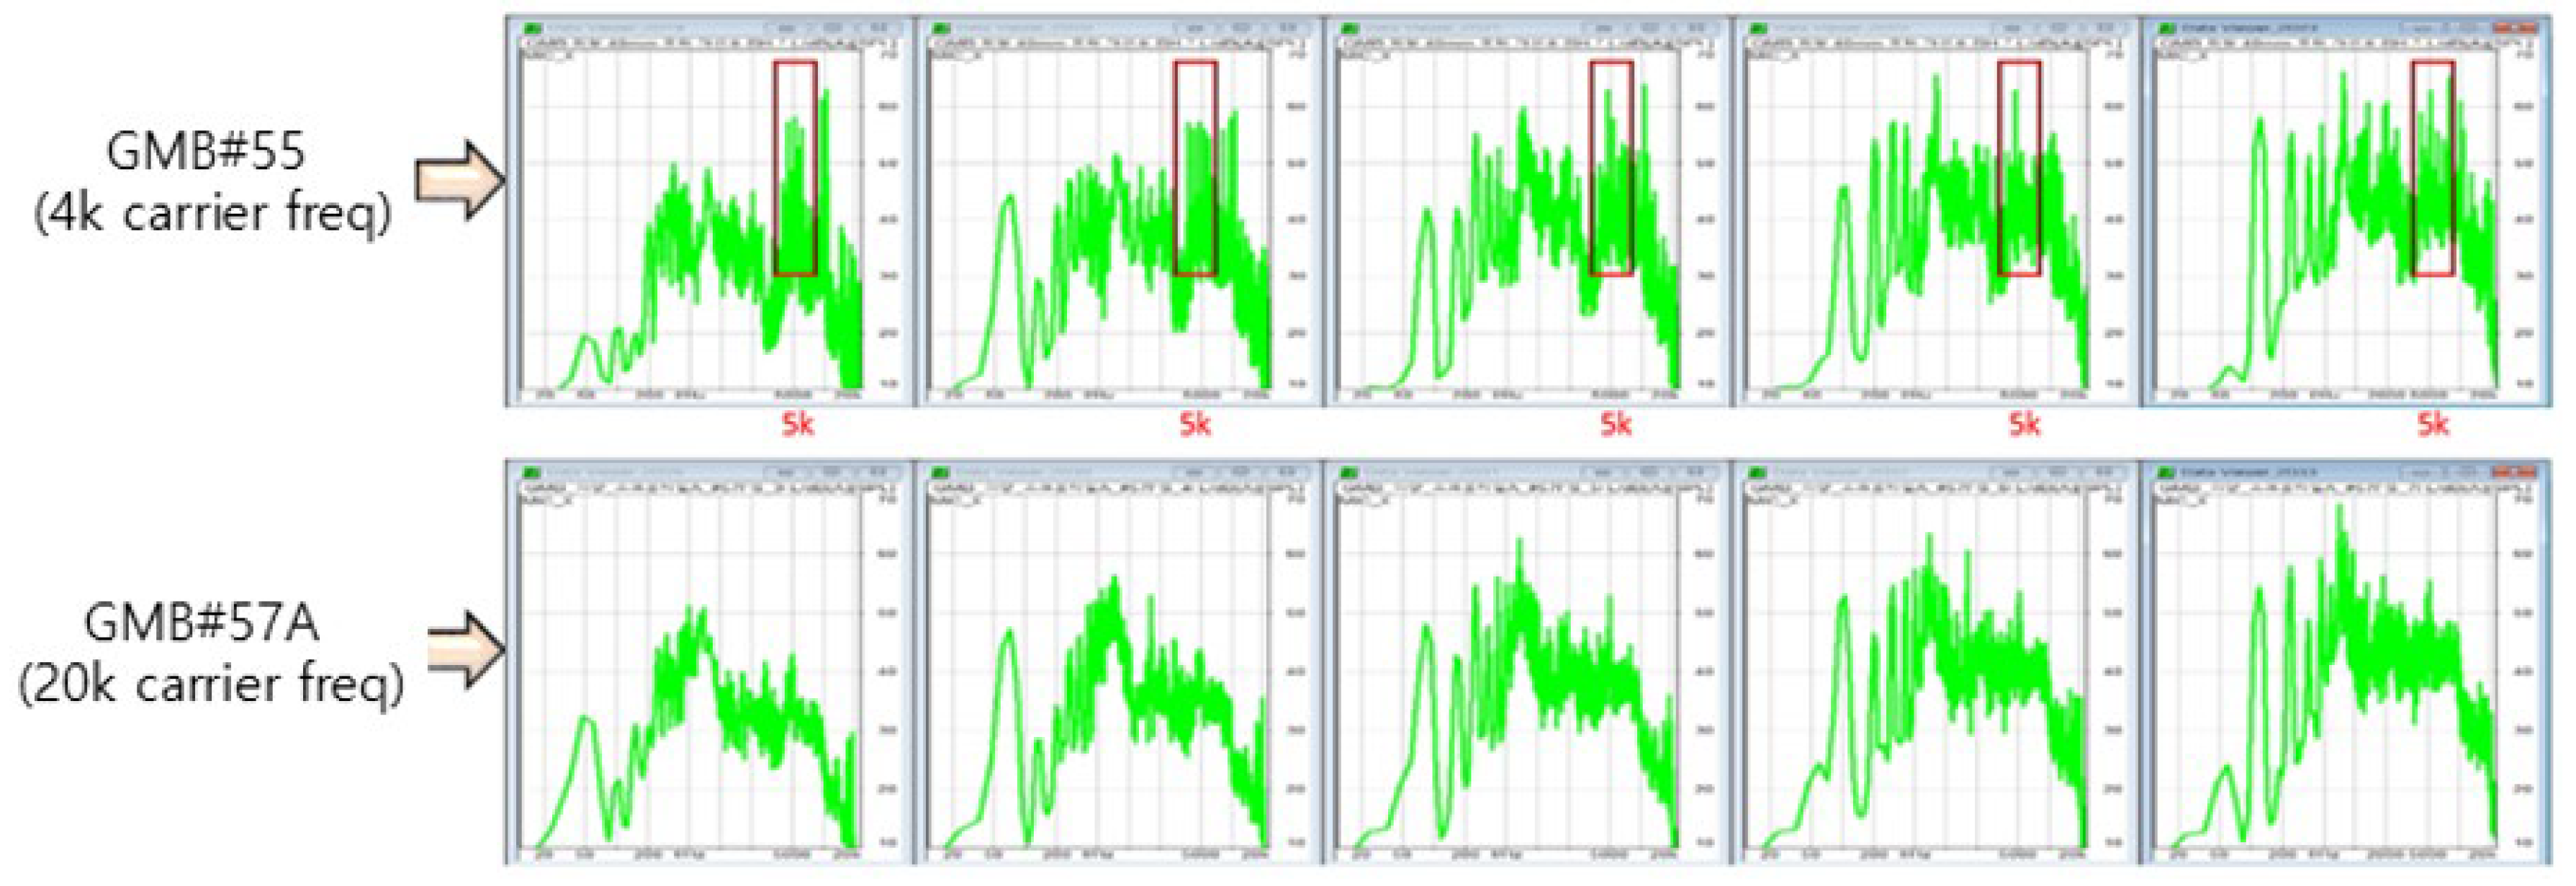
Figure 16.
Results Graph of Noise Measurement According to Carrier Frequency.
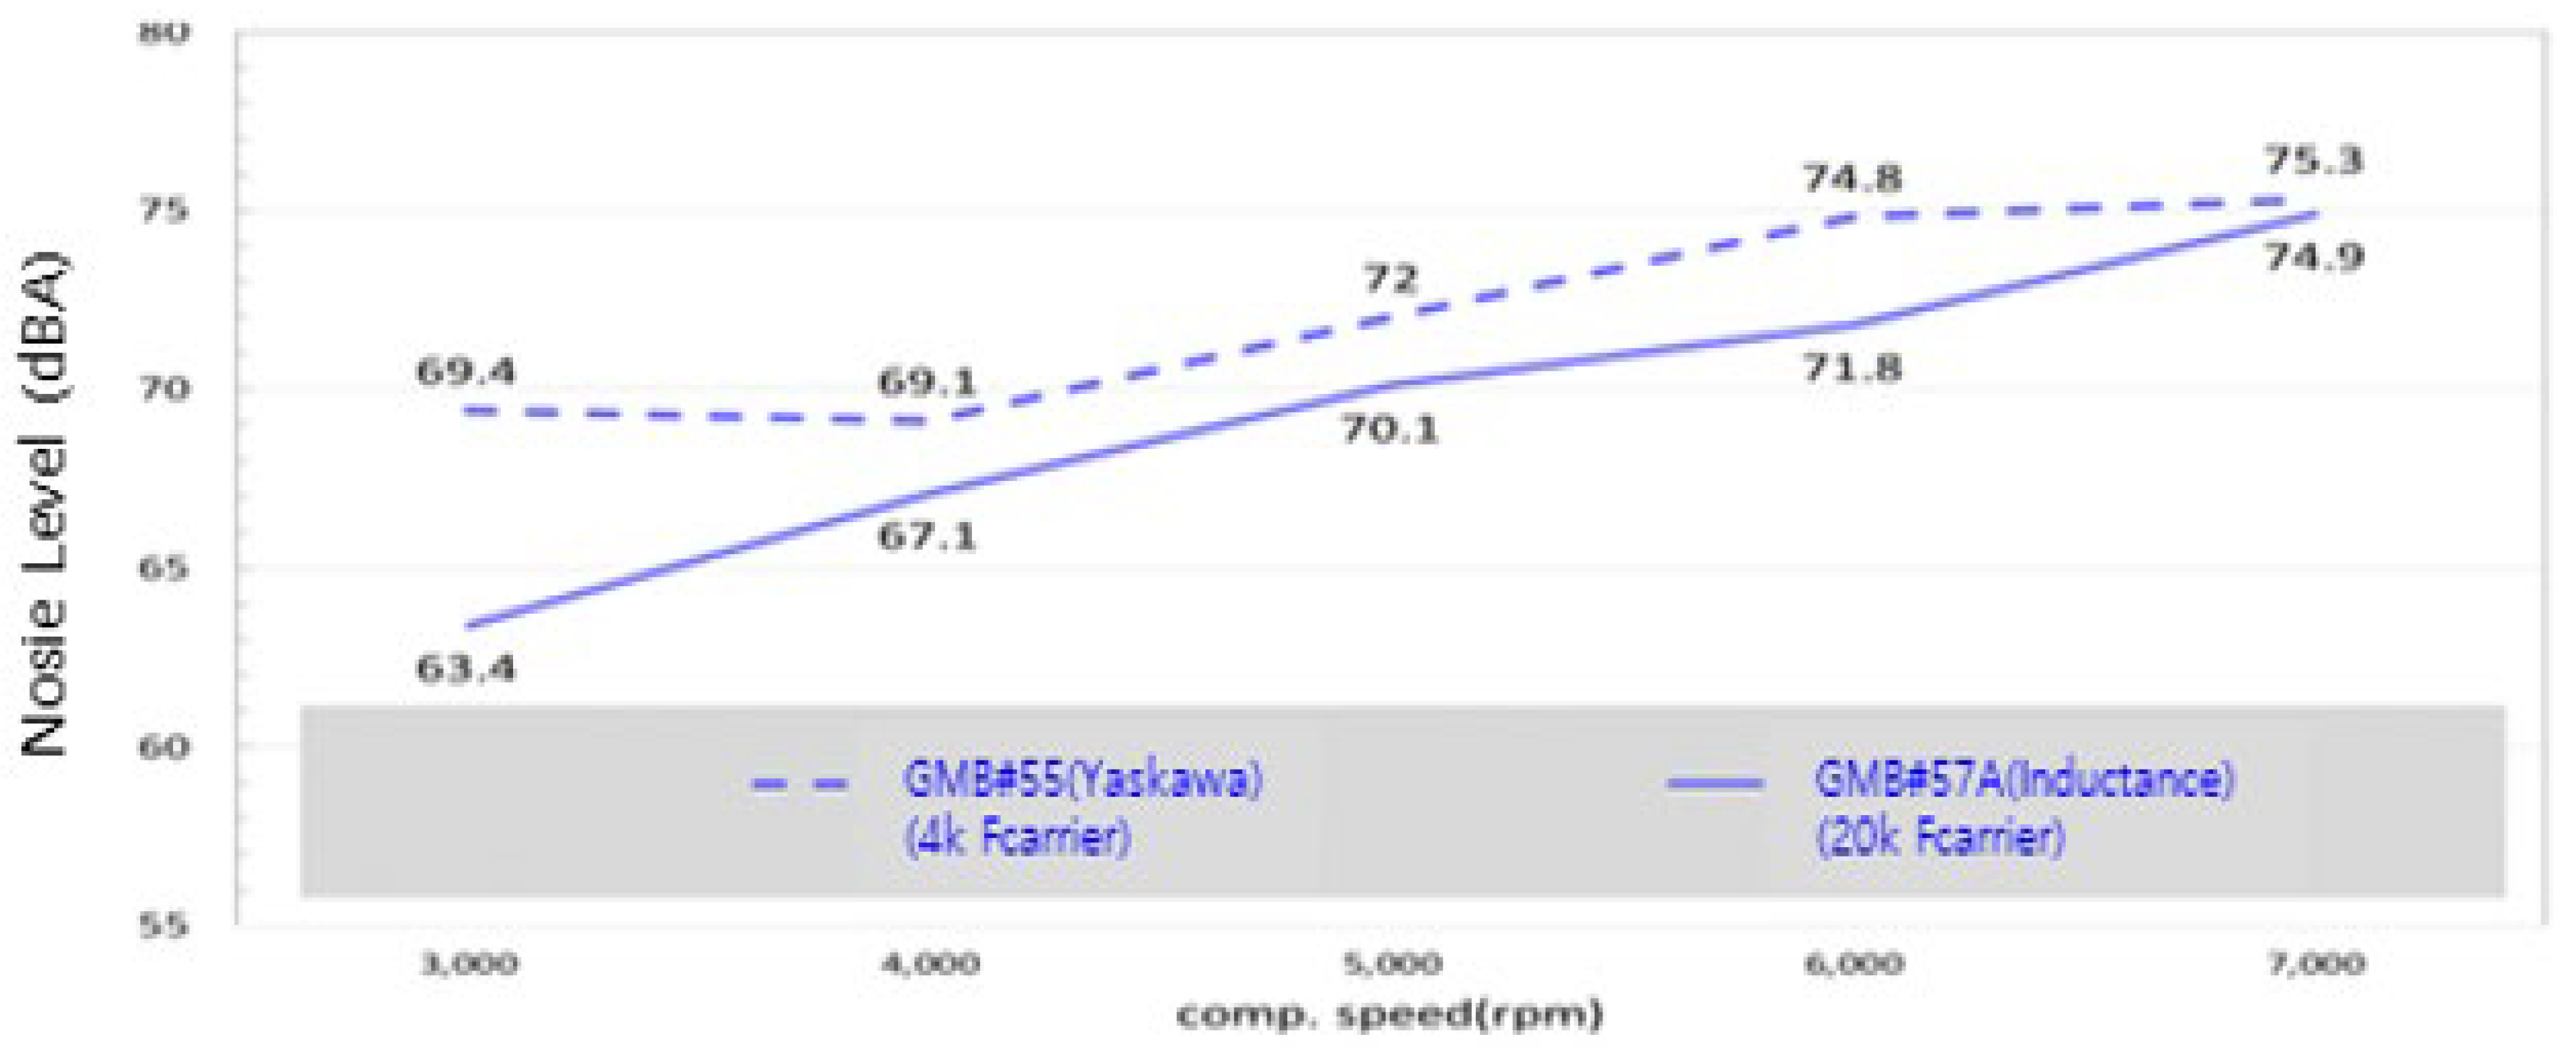
Figure 17.
Results Graph of Noise Measurement for Existing and Redesigned Development Products.
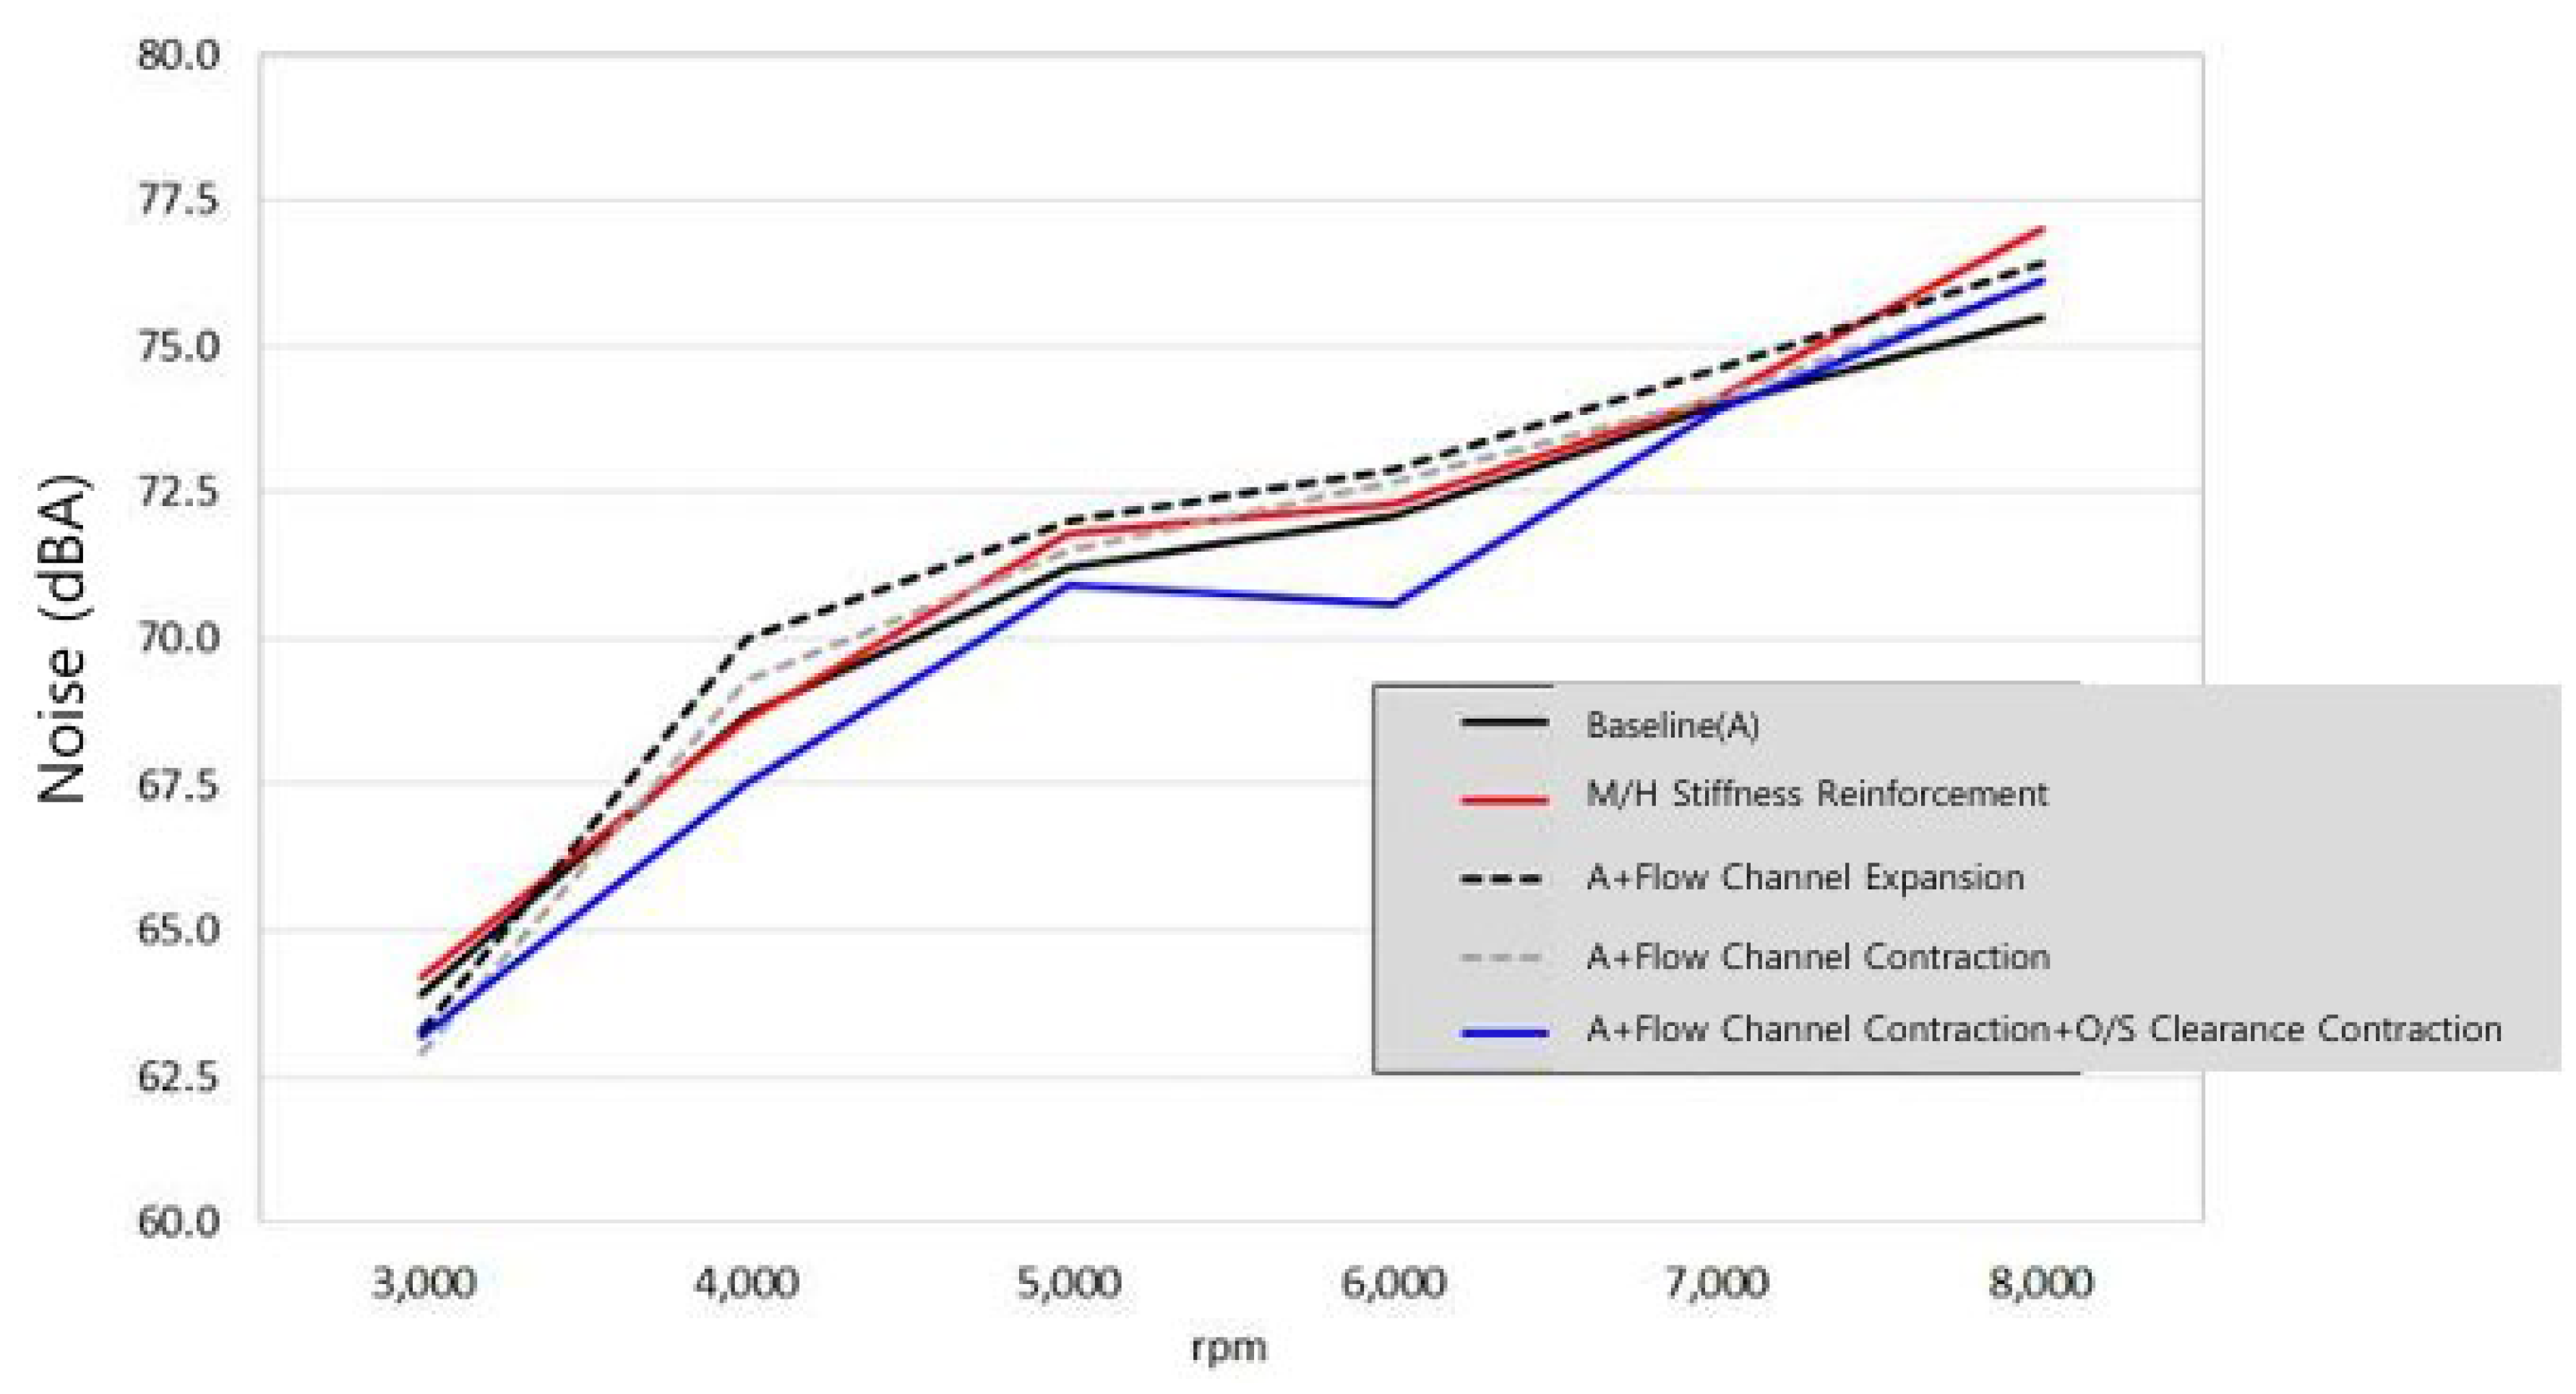
Figure 18.
Graph for Comparing Noise Levels of the Development Product and Competitors.
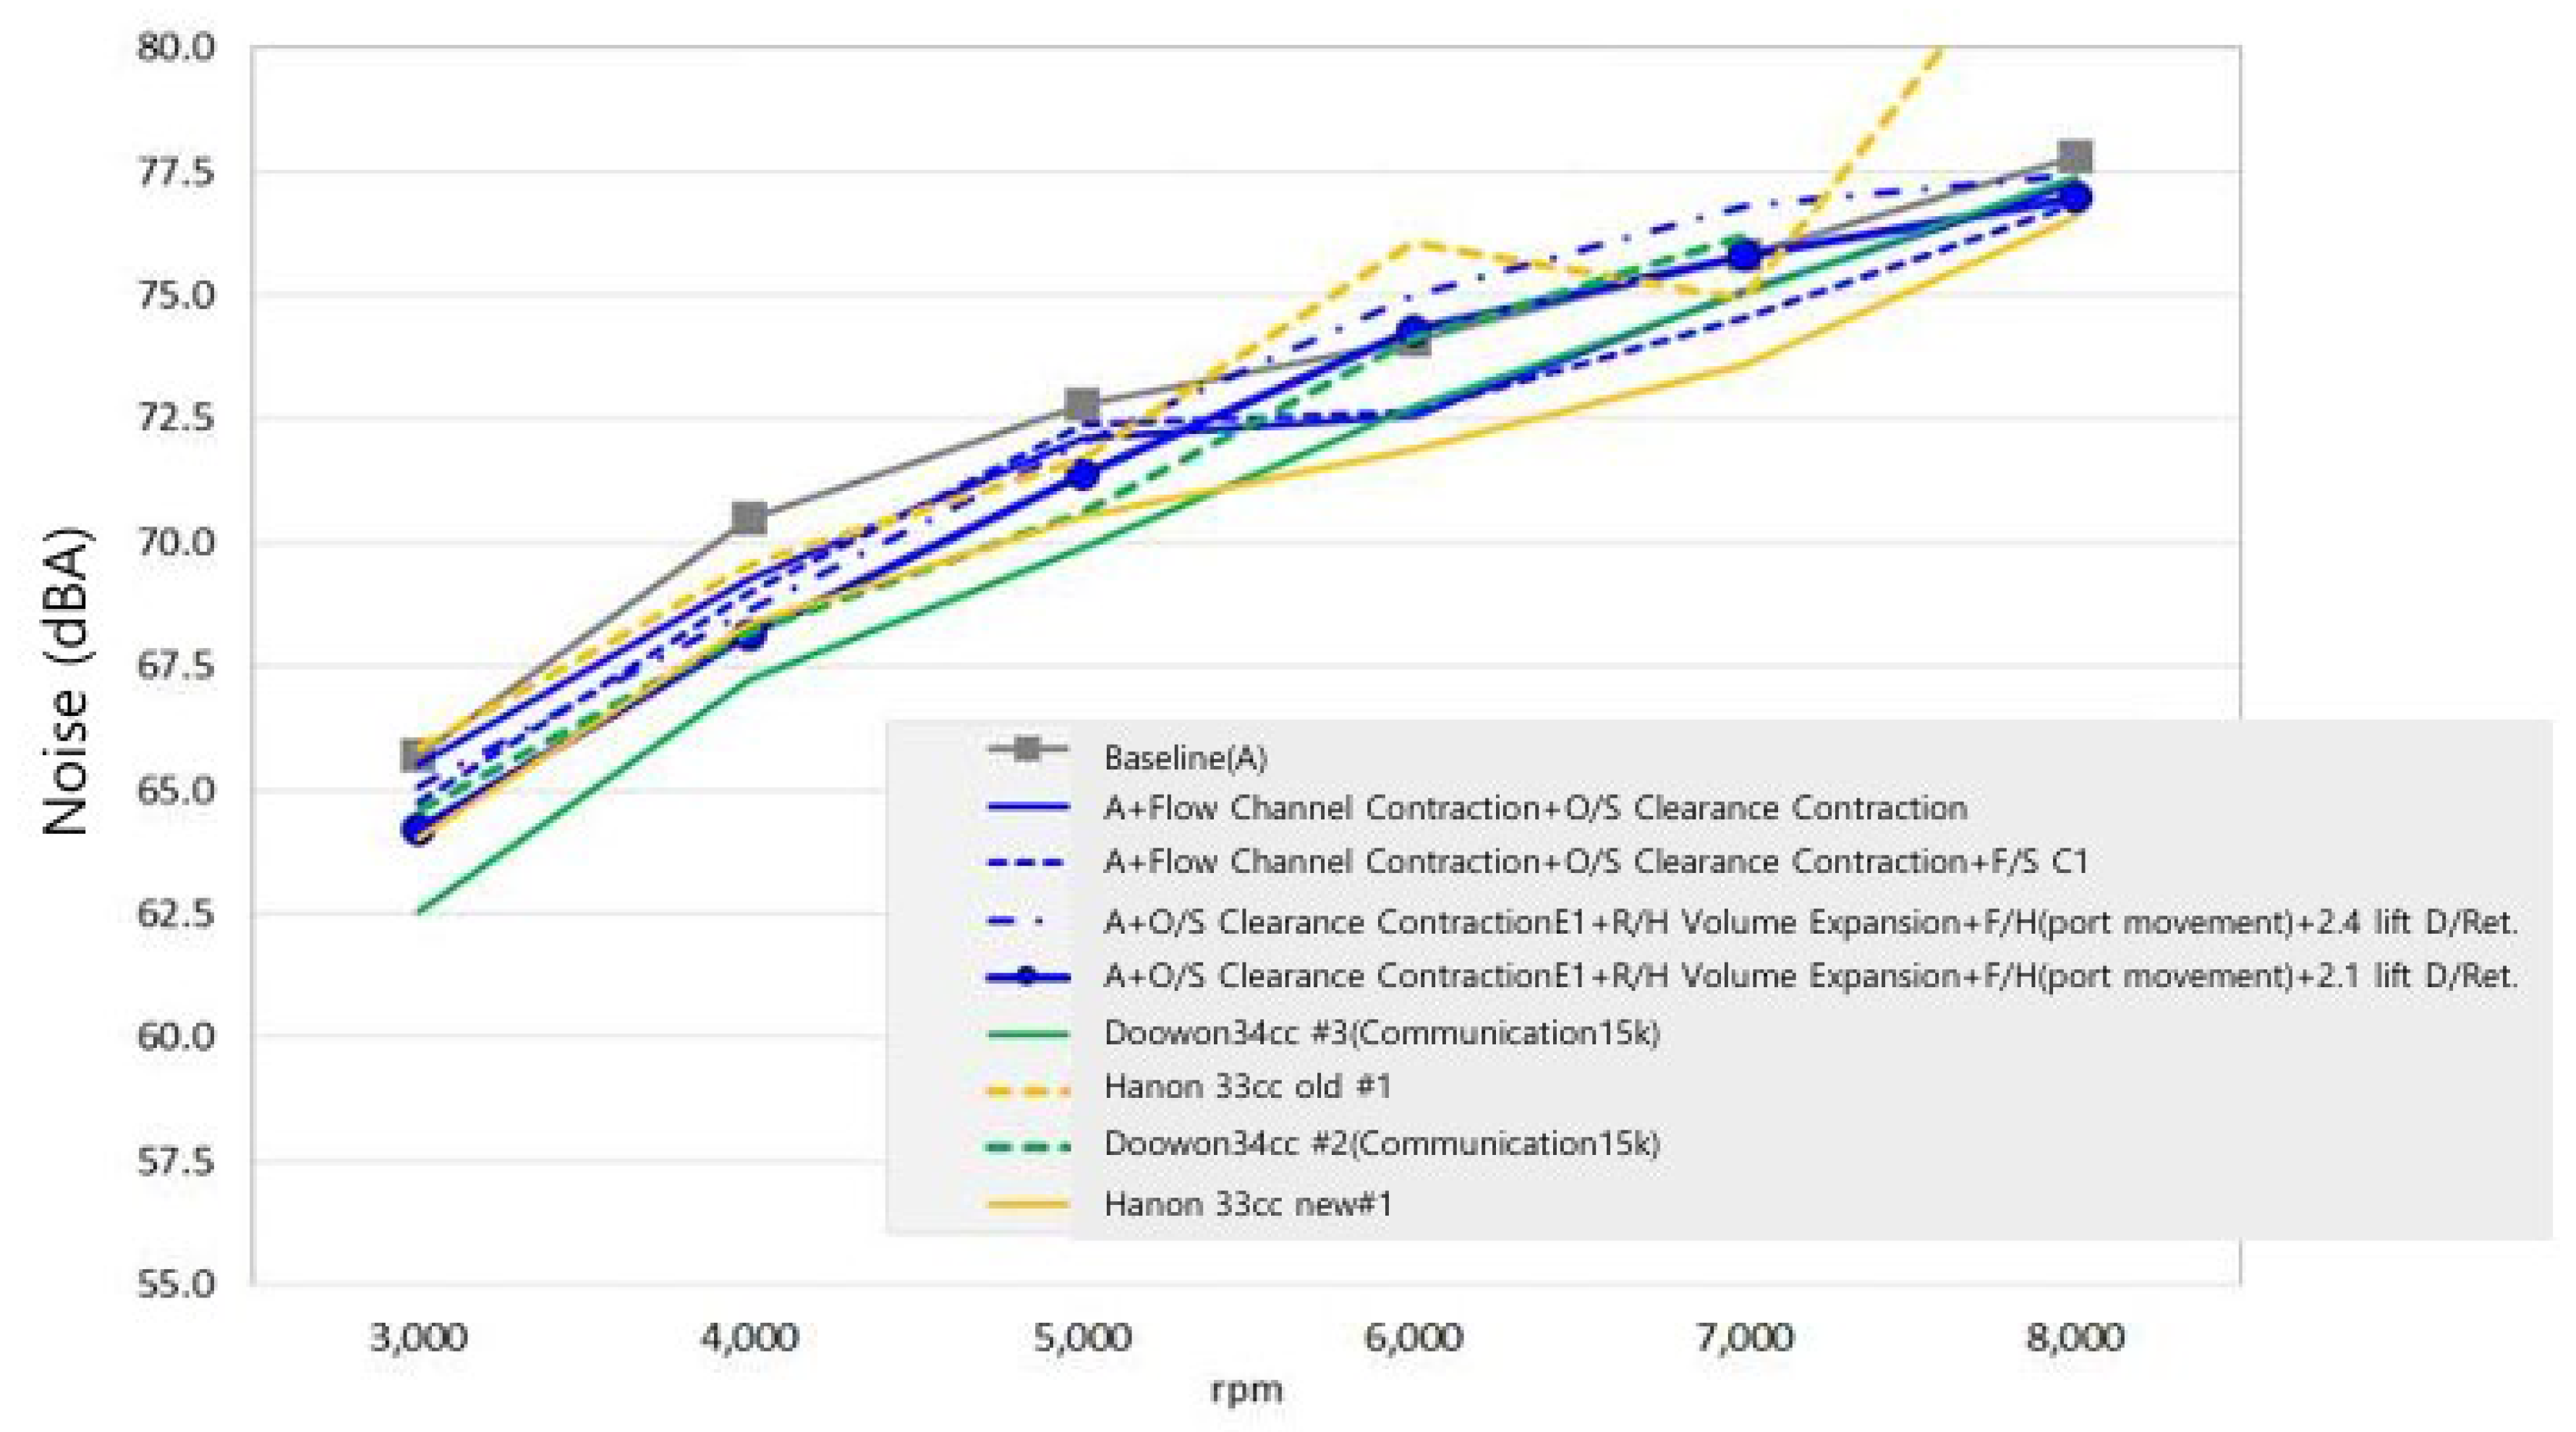
Table 1.
Discharge Space Volumes of Competitors' Rear Housings.
| Denso | Hanon | Doowon | GMB | |
|---|---|---|---|---|
| Discharge Space Volume (cc) : D | 70.9 | 77.6 | 88.9 | 81.9 |
Table 2.
Dimensions of Competitors' Oil Separator Installation Structures.
| Category | Specification | Denso | Hanon | Doowon | GMB |
|---|---|---|---|---|---|
| Discharge Port Inner Diameter (mm) | - | 15.5 | 13.0 | 13.0 | 15.5 |
| Oil Separator Inner Diameter (mm) | m | 6.0 | 5.0 | 6.5 | 6.0 |
| Oil Separator Entrance Diameter (mm) | d | 4.8 | 5.8 | 6.5 | 5.0 |
| Oil Separator Discharge Diameter (mm) | D | 10.5 | 11.0 | 8.5 | 10.0 |
| Expansion Section Length (mm) | L1 | 18.0 | 5.0 | 10.0 | 2.5 |
| Straight Section Length (mm) | L2 | 30.5 | 36.0 | 40.0 | 40.0 |
| Expansion Section Ratio | L1/L2 | 0.6 | 0.6 | 0.2 | 0.04 |
| Total Oil Separator Length (mm) | - | 48.5 | 56.0 | 50.0 | 60.0 |
Table 4.
Specification of PCB Accelerometer, ICP, Model(352C33).
| Sensitivity | (±10%)100 mV/g(10.2 mV/(m/s²)) |
| Measurement Range | ±50 g pk (±490 m/s² pk) |
| Broadband Resolution | 0.00015 g rms (0.0015 m/s² rms) |
| Frequency Range | (±5%)0.5 to 10000 Hz |
| Sensing Element | Ceramic |
| Weight | 0.20 oz (5.8 gm) |
Disclaimer/Publisher’s Note: The statements, opinions and data contained in all publications are solely those of the individual author(s) and contributor(s) and not of MDPI and/or the editor(s). MDPI and/or the editor(s) disclaim responsibility for any injury to people or property resulting from any ideas, methods, instructions or products referred to in the content. |
© 2025 by the authors. Licensee MDPI, Basel, Switzerland. This article is an open access article distributed under the terms and conditions of the Creative Commons Attribution (CC BY) license (http://creativecommons.org/licenses/by/4.0/).
Copyright: This open access article is published under a Creative Commons CC BY 4.0 license, which permit the free download, distribution, and reuse, provided that the author and preprint are cited in any reuse.


