1. Introduction
Lumbar total joint replacement (L-TJR) was developed to treat degeneration affecting the anterior, middle, and posterior columns of the lumbar spine [
1,
2]. Historically, large total joint replacements, such as those for the knee joint, have adopted an anatomic or functional design paradigm [
3]. In this context, the present L-TJR is a functional design that replaces both the facet joints and the intervertebral disc, providing physiologic allowances and restrictions to various translational and rotational degrees of freedom (
Figure 1).
To achieve its functional goals, the L-TJR consists of bilateral metal-on-polyethylene bearings fabricated from CoCr alloy and Vitamin E stabilized highly crosslinked polyethylene (VE-HXLPE). Based on published international standards, researchers previously evaluated the L-TJR design under idealized “clean” wear test conditions (Mode I), abrasive wear conditions (Mode III), and worst-case sagittal plane impingement (Mode IV) conditions [
4]. In these wear test scenarios, the wear of the L-TJR was comparable to that observed in anterior lumbar total disc replacements (ADRs) [
4].
The L-TJR has advanced to clinical trials as part of an Investigational Device Exemption (IDE) study [
5]. One goal of the clinical trial is to understand how the design performs and how sensitive it is to patient and clinical factors. However, the complexity of the in vivo environment limits the ability to study these effects independently. Furthermore, because the implantation of the L-TJR is performed using manual instrumented techniques [
6], it is unclear how variations in component placement in the coronal and sagittal planes may impact device performance. For the present study, we sought to analyze the sensitivity of the L-TJR’s wear performance to placement and positioning using computational modeling. This approach is based on historical research [
7,
8,
9], which provides the basis for what is considered to be reasonable worst-case misalignment conditions in the sagittal plane for lumbar disc arthroplasty. This previous comprehensive body of finite element research was undertaken in response to the well-documented risk of sagittal plane impingement observed in previous motion preserving spinal implants. Thus, the historical approach towards understanding misalignment involved first having established clinical relevance of sagittal impingement from anterior disc replacement (ADR) explants, which were then followed up by simulations with in vivo boundary conditions to reproduce clinically relevant sagittal impingement [
10]. These were then used as a basis for developing the Mode IV, in vitro sagittal plane impingement tests described in ASTM F3295. However, historical modeling research focused exclusively on sagittal misalignment, and little attention was devoted to coronal and axial plane placement.
The goal of this study was to develop, validate, and parametrically analyze the L-TJR under axial and coronal misalignment conditions. Previous studies by Bartel et al. starting in the 1980s established that the stresses in polyethylene under worst-case biomechanical loading are associated with observations of surface damage in clinically retrieved total joint replacement components [
11,
12,
13,
14]. Subsequent research by Maxian et al. in the 1990s introduced wear simulations by combining contact stress and in vitro kinematics over a prescribed joint duty cycle to simulate wear based on Archard’s law [
15,
16]. Together, these bodies of work established finite element analysis as an established methodology in orthopedics to assess surface damage and wear in polyethylene components for total joint replacement under simulated in vitro and in vivo conditions. In this study, we hypothesized that the polyethylene bearing stresses and strains under horizontal and coronal plane misalignment conditions would be less severe than those encountered during Mode IV testing and would be comparable to those associated with Mode I testing.
2. Materials and Methods
Our overall modeling approach relied upon evaluation of the risk of the L-TJR design to axial and coronal plane misalignment using a validated finite element approach, similar to that developed by Rundell et al [
8]. The two phases of this approach were as follows: first, to create, verify, and validate a finite element simulation of the L-TJR under Mode I and Mode IV wear conditions; and second, to explore a range of reasonable misalignment scenarios using the validated FE model under Mode I wear boundary conditions.
2.1. FE Model Development and Validation
2.1.1. FE Model Geometry
Finite element models of the of the L-TJR (MOTUS®, 3Spine, Chattanooga, TN) were developed based on CAD geometries of the in vitro Mode I and Mode IV wear testing setups [
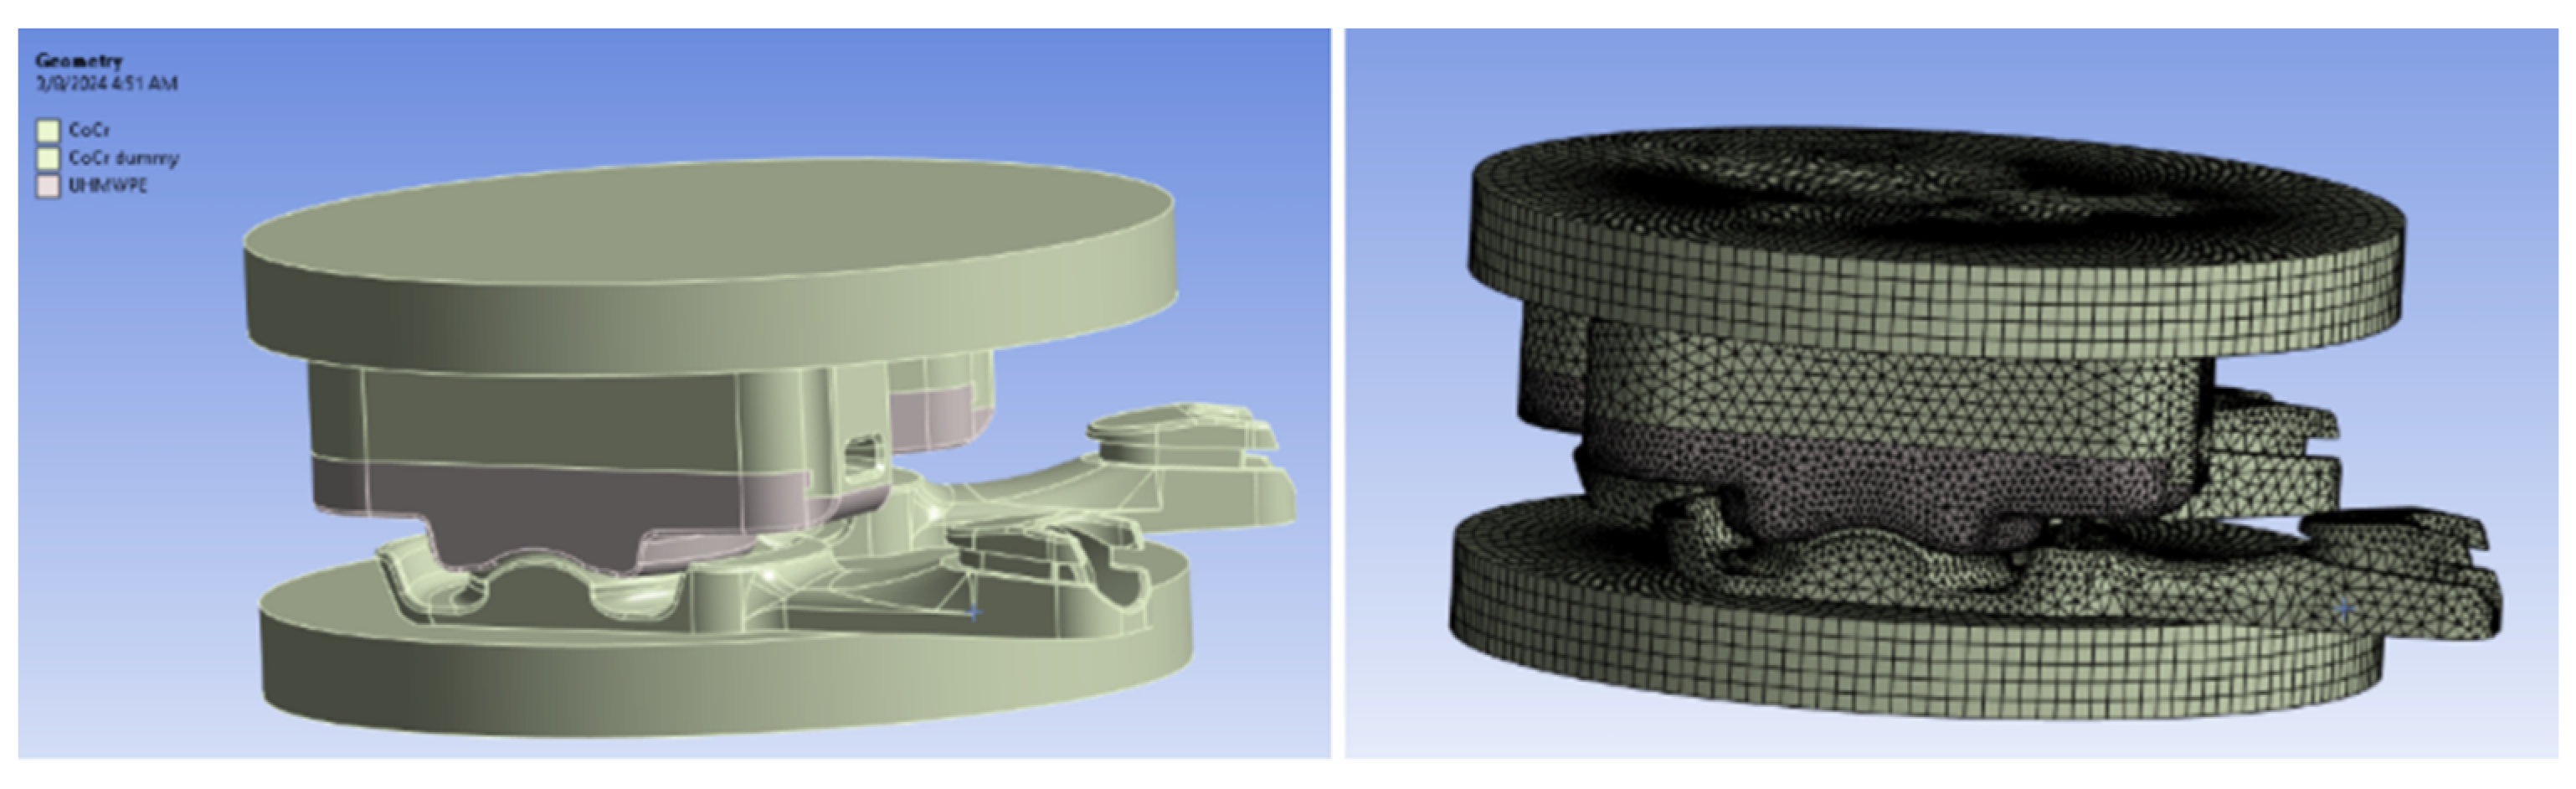
17]. Specifically, the model consists of bilateral implants each with a cobalt chrome (CoCr) backed direct compression molded VE-HXLPE cranial component and a CoCr caudal component. Further details of the implant design have been described previously [
2,
17].
The implant components were oriented with a total convergence angle (defined below) of 40° replicating the baseline configuration of the previous Mode I and Mode IV wear tests. The model also consists of two platens (vertebral test blocks) to represent the in vitro wear testing setup described in ISO 18192-11 [
18] (
Figure 2). Two L-TJR implant sizes were modeled, consistent with the sizes that were physically tested in previous experiments.
Modules within ANSYS software (ANSYS Inc., Canonsburg, PA) were used for finite element modeling. The polyethylene and CoCr endplate components were discretized with fully integrated 4-pointed 10-noded tetrahedral elements. Mesh sizes for the polyethylene component were varied in order to create four distinct levels of model discretization. Ultimately, the element size of 0.6 mm was determined to be sufficiently converged. An element size of 0.6 mm corresponded to 152,315 nodes and 104,743 elements within each polyethylene component.
2.1.2. Material Properties
The component material properties defined in the FEM were based on information from published literature (
Table 1). Specifically, the top and bottom implant endplates were treated as linear elastic materials, with a modulus of elasticity of 210 GPa and a Poisson's ratio of 0.3 [
19]. The polymer component was based on GUR 1020-E 80kGy VE-HXLPE and represented using an elastic-plastic material model [
20]. The vertebral test blocks that comprise the wear simulator fixture were modeled as rigid.
The CoCr components of the L-TJR design are effectively rigid with respect to the polyethelene component and the Delrin test blocks. Since the deformable polyethylene was sandwiched between two effectively infinitely stiff metallic components, the stresses are highly insensitive to the details of how the loads and displacements are delivered to the Delrin text blocks, which were likewise modeled as rigid. A similar approach has been used for decades by Bartel et al. to effectively model metal backed contact in UHMWPE for total joint replacement [
11,
12,
13,
14].
2.1.3. Wear Test Boundary Conditions
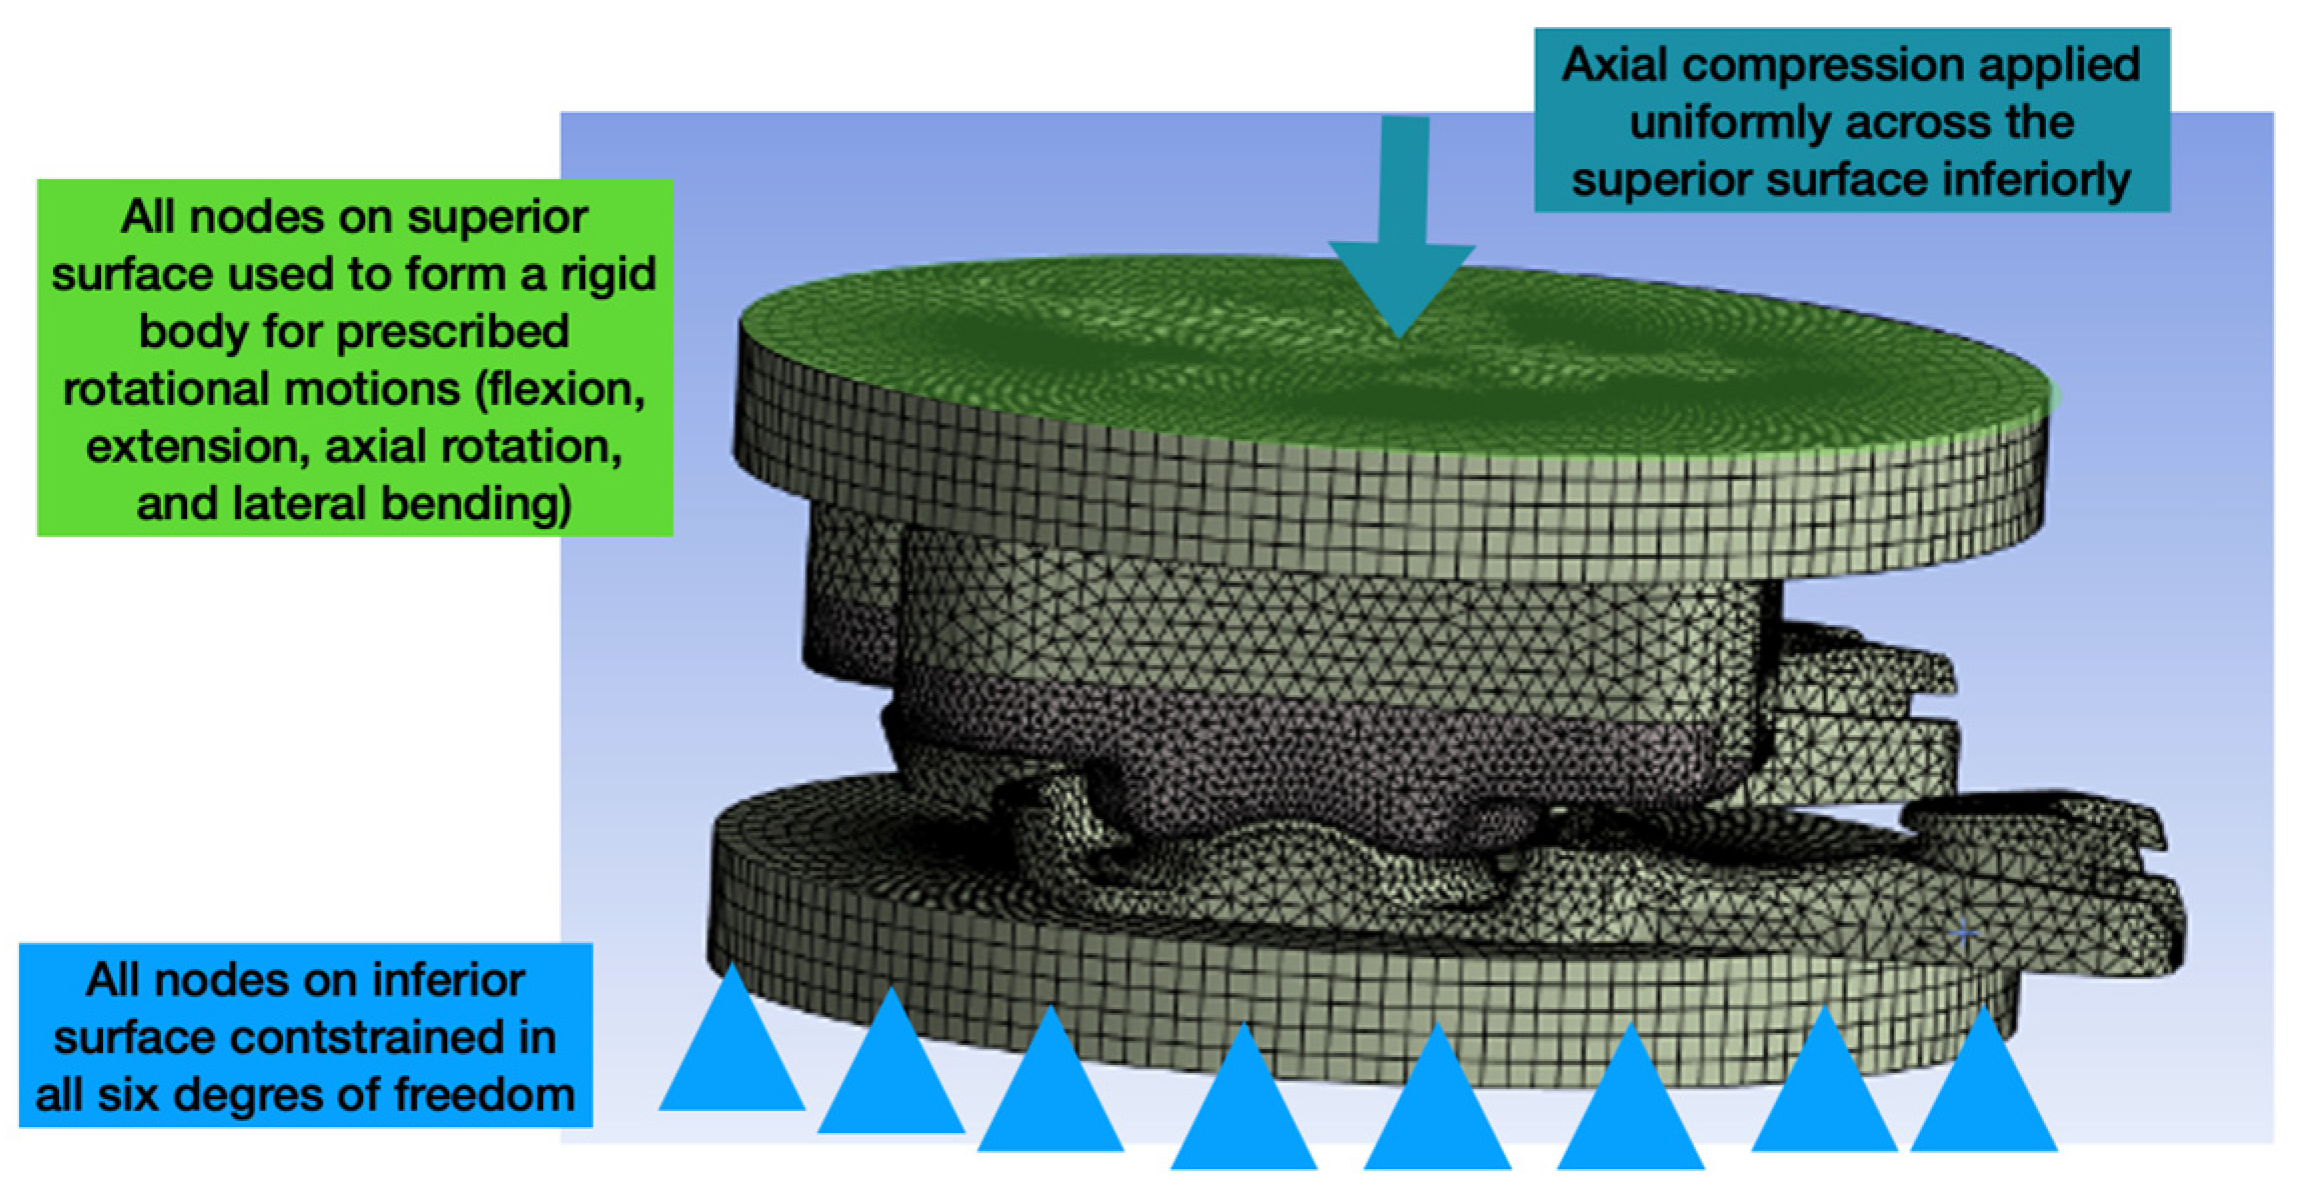
In general, the model was configured such that the nodes on the inferior-most surface were constrained in all six degrees-of-freedom. Rotational displacements were applied to the superior- most surface by making the nodes on that surface a rigid body. Axial loading was applied in a distributed and uniform fashion to the superior-most surface and always directed in the inferior direction (orthogonal to the inferior-most surface) (
Figure 3).
2.1.4. Mode I Wear Duty Cycle
The boundary conditions for Mode I standard wear testing were guided by ISO 18192-1 and ASTM F2423 [
18,
21]. We verified that our model replicated the kinematics and loading gait cycle of the physical wear tests conducted previously.
Prescribed loads and motions were based on ISO 18192-1 [
18]. Specifically, rotations in all three rotational degrees of freedom were prescribed along with axial loading (±4.5° flexion-extension, ±2° lateral bending, ±2° rotation, and 600 - 2,000N compressive axial load). All translational degrees of freedom were not constrained. Due to the explicit nature of the analysis, the initial condition of the duty cycle was ramped up between an arbitrary time period of 0 to 0.025s (
Figure 4). From there, additional increments of 0.025s corresponded to 25% of the duty cycle. This shortened time was selected for efficiency purposes. Analyses were performed in such a way to keep the kinetic energy at zero and limit mass scaling to components that do not move (bottom endplate).
2.1.5. Mode IV Wear Duty Cycle
For the Mode IV unintended wear/impingement analysis, the setup and boundary conditions followed ASTM F3295-18 [
22]. For the impingement analysis, an axial force of 1200N was applied to the reference point on the top block surface, followed by angular extension until posterior contact between the device components (~8°), continuing approximately 2° past initial posterior contact, after which an axial rotation of ±2° was implemented.
2.1.6. Contact Modeling
Contact was defined on the bearing surfaces and at points of potential impingement to accurately simulate physical interactions within the device. LS-Dyna’s (vR15, ANSYS Inc., Canonsburg, PA) “Automatic_Surface_to_Surface” penalty-based algorithm was used, in part for its ability to adapt to changes in the geometry as the simulation progressed. A uniform coefficient of friction of 0.05 was applied across all contacting interfaces to model the resistance to sliding (static and kinetic) [
23,
24].
2.1.7. FEM Verification and Validation
The FEM was formally verified and validated using the risk informed credibility assessment framework established by ASME V&V 40-2018 [
25] and FDA Guidance [
26,
27]. Briefly, this approach involved formally defining a Question of Interest (QOI) for the modeling effort and its Context of Use (COU). A risk analysis was then undertaken to guide the level of rigor that was required for the verification and validation (V&V) activities to establish the credibility of the model. Because the FDA’s guidance for establishing and documenting the credibility of FEMs in accordance with V&V40 is a relatively new development, examples of such validation efforts are limited in the published literature for spinal implants [
28]. We provide here additional details on our credibility planning and execution efforts to hopefully guide future FEA practitioners in the spinal medical device field and increase familiarity with the risk analysis methodology that is currently required for regulatory submissions.
Specifically, in the context of ASME V&V 40-2018 [
25], the primary Question of Interest (QOI) for the FEM was:
Is the L-TJR sufficiently resistant to wear under reasonably worst-case misaligned conditions? Previously performed physical wear testing for both Mode I and Mode IV wear were used to establish sufficient resistance of the L-TJR design to wear [
4]; the computational model was developed in the present study to evaluate the sensitivity of the L-TJR design to reasonable misalignment for Mode I boundary conditions.
The COU for the FEM, in the context of ASME V&V 40-2018 [
25], was to assess the impact of worst-case misalignment scenarios on polyethylene wear through quantification of the bearing surface contact pressure. The primary goal was to quantify contact pressures associated with Mode I (a standardized test that is considered a best case for alignment and contact) and Mode IV (the worst-case test that evaluates conditions beyond reasonable misuse) wear such that predicted contact pressures during reasonable misalignment could be properly contextualized. In other words, the model was developed to determine if contact pressures occurring during misalignment would match or exceed those that occur during a worst-case Mode IV scenario. Consequently, the model was developed as a tool to assess relative risk of the L-TJR device design to misalignment by comparing the stresses and deformations in the model in reasonably worst-case misaligned scenarios with the results from the impingement (Mode IV) and non-impingement (Mode I) simulations.
The model risk assessment considered both the model influence and decision consequence as required by FDA Guidance and ASTM V&V 40 [
25,
26,
27]. The model influence was found to be low because the outputs would only make up a minor factor in answering the QOI [
4]. The primary data establishing the safety profile to wear included previous physical wear tests for both Mode I and Mode IV wear [
4]. The previous wear tests included the presence of misalignment and erred on the side of worst-case scenarios (i.e., maximum device convergence angle and impingement). The FEM in the present study was intended to supplement these findings by evaluating the sensitivity of contact pressures during reasonable misalignment in the coronal and axial planes. The decision consequence was also classified as low because the model was used to assess the sensitivity of stresses relative to two physically tested and benchmarked states that were associated with a reasonable assurance of safety. The credibility plan included seven verification and three validation activities (
Table 2).
Validation included direct comparison of aggregate contact pressures during the simulated duty cycle against MicroCT penetration maps from Mode I (Validation Goal 1) and Mode IV (Validation Goal 2). We selected the L-TJR size (15 mm long) for the Mode I study based on its appropriateness with a previously developed and validated FEM of the lumbar spine (Validation Goal 1). For Mode IV analysis (Validation Goal 2), the impingement testing was performed on the thinnest devices (11 mm long and short sizes), and the FEA therefore also utilized these sizes.
We compared the simulation results qualitatively and semi-quantitatively in our validations. The foundation for the comparisons was the penetration or wear maps from the physical Mode I and Mode IV wear tests [
4]. These penetration maps for the polyethylene components were based on MicroCT analysis of the wear tested components before and after wear testing. The polyethylene components were scanned using a CT 80 (Scanco Medical AG, Switzerland) at approximately 18 mm voxel resolution as further described by Siskey et al. [
4].
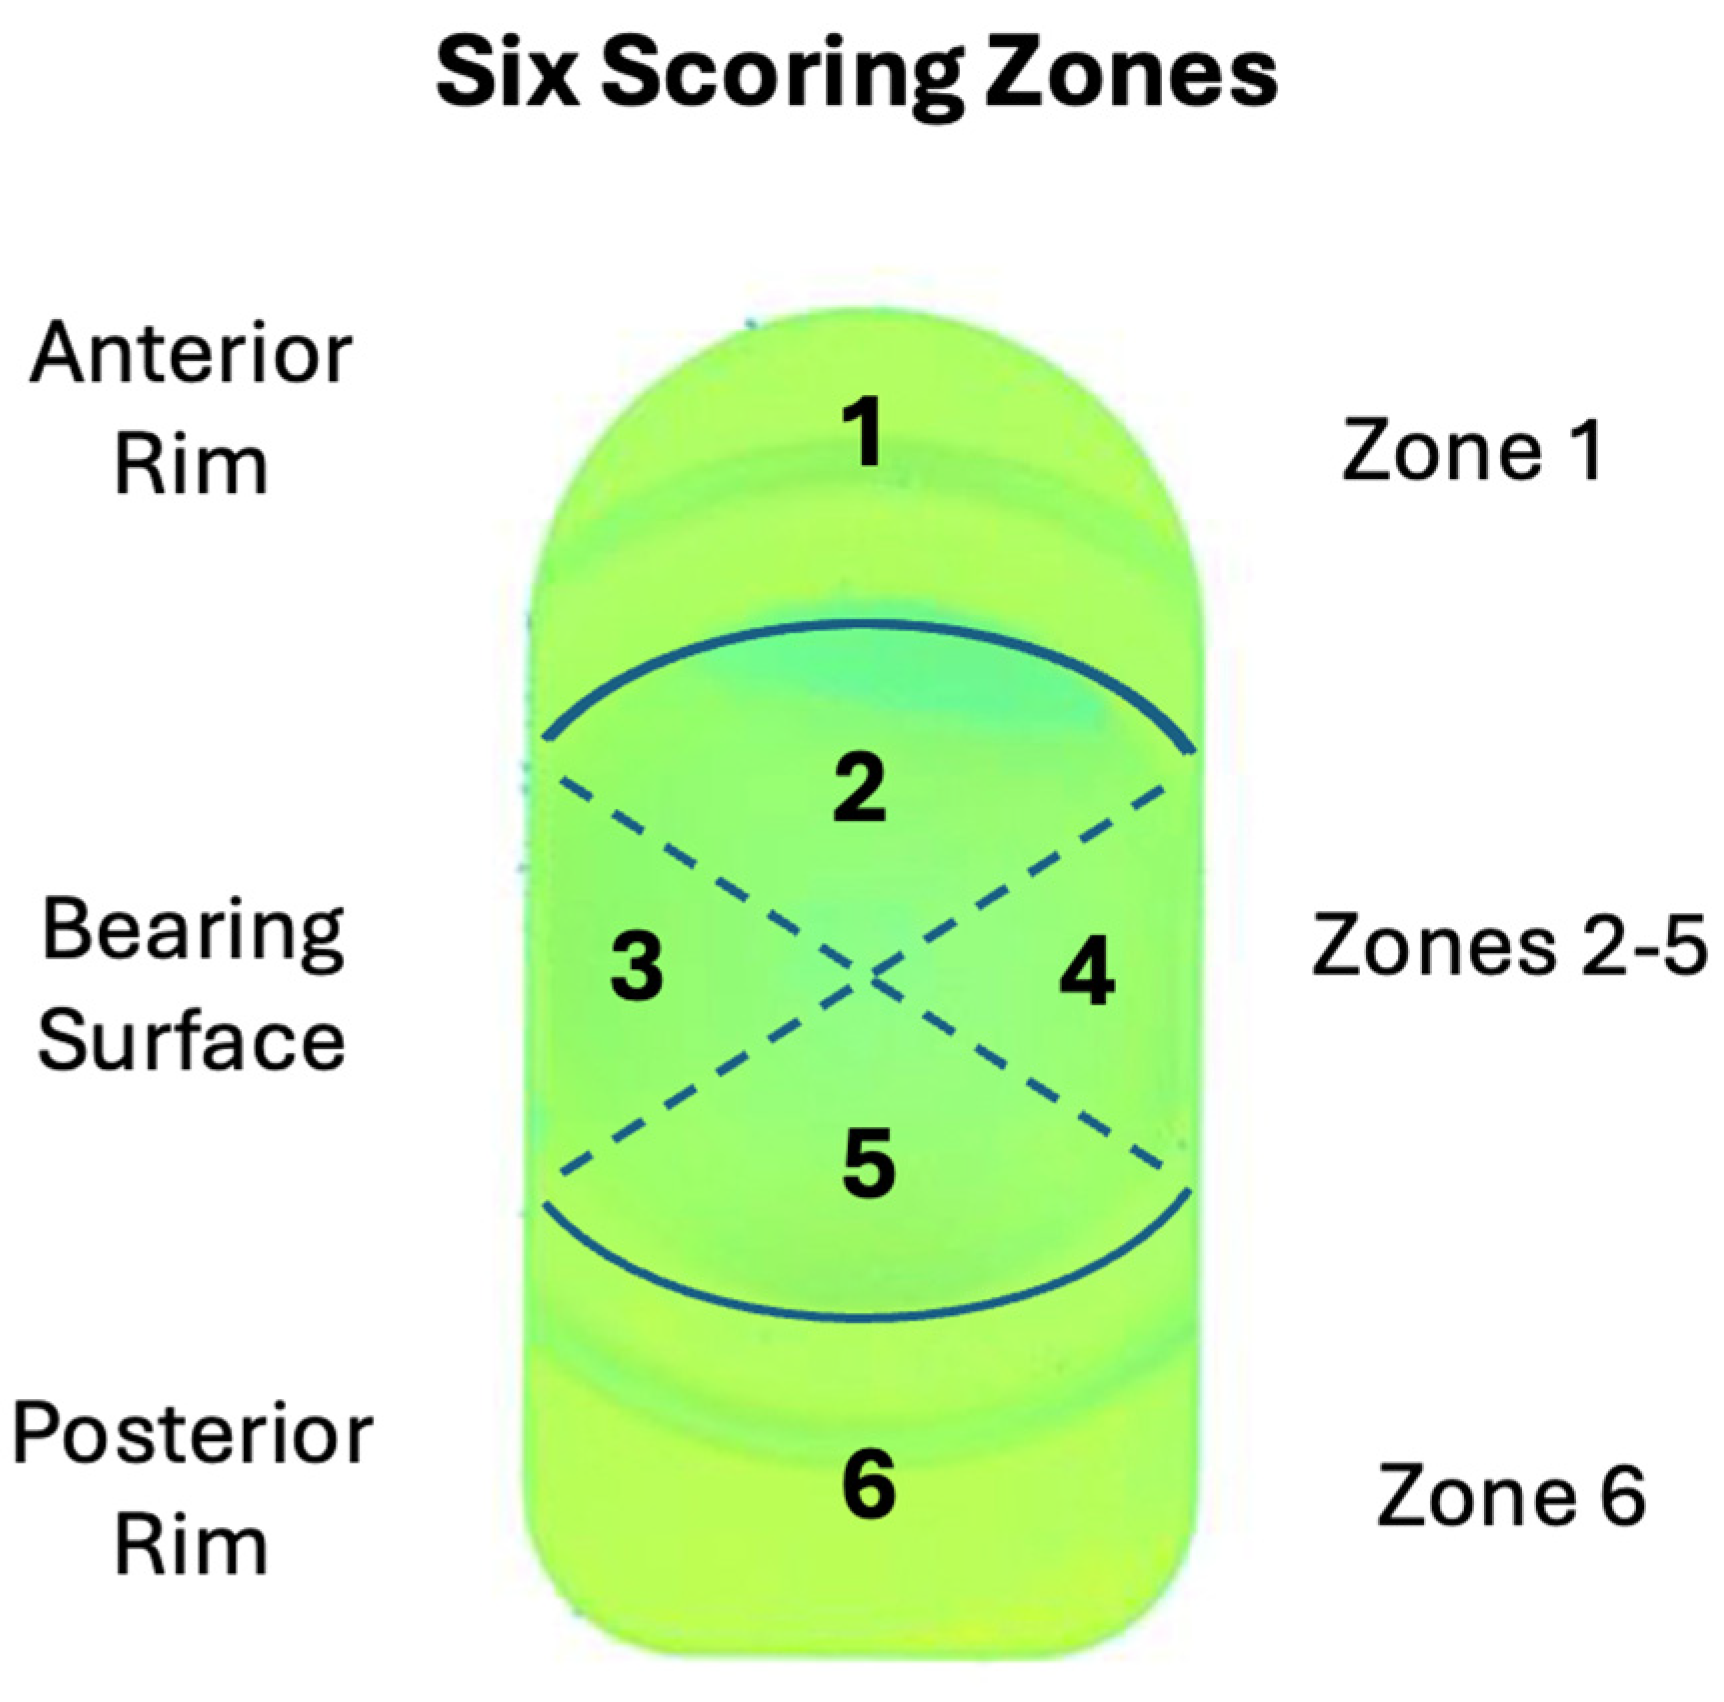
Semi-quantitative comparisons between the penetration maps and the aggregate contact stress distributions were made in six regions of the polyethylene bearing surface (
Figure 5). Within each region, the damage was scored from 0 to 3. A grade of 0 indicated that damage was not present in that region. Grades of 1, 2, or 3, indicated that damage was present in <10%, 10-50%, or over 50% respectively, similar to the methodology established by Hood et al. [
29] for damage scoring large joint orthopaedic components. The total damage score was obtained by the sum of the scores in all six component regions. The left and right components were scored independently. The wear maps from the physical testing and the aggregate contact pressure plots were scored independently. Damage scoring was performed by three of the study co-authors (SMK, SJR, and HS) who met to adjudicate differences in the scoring.
2.1.7.1. Validation Goal 1
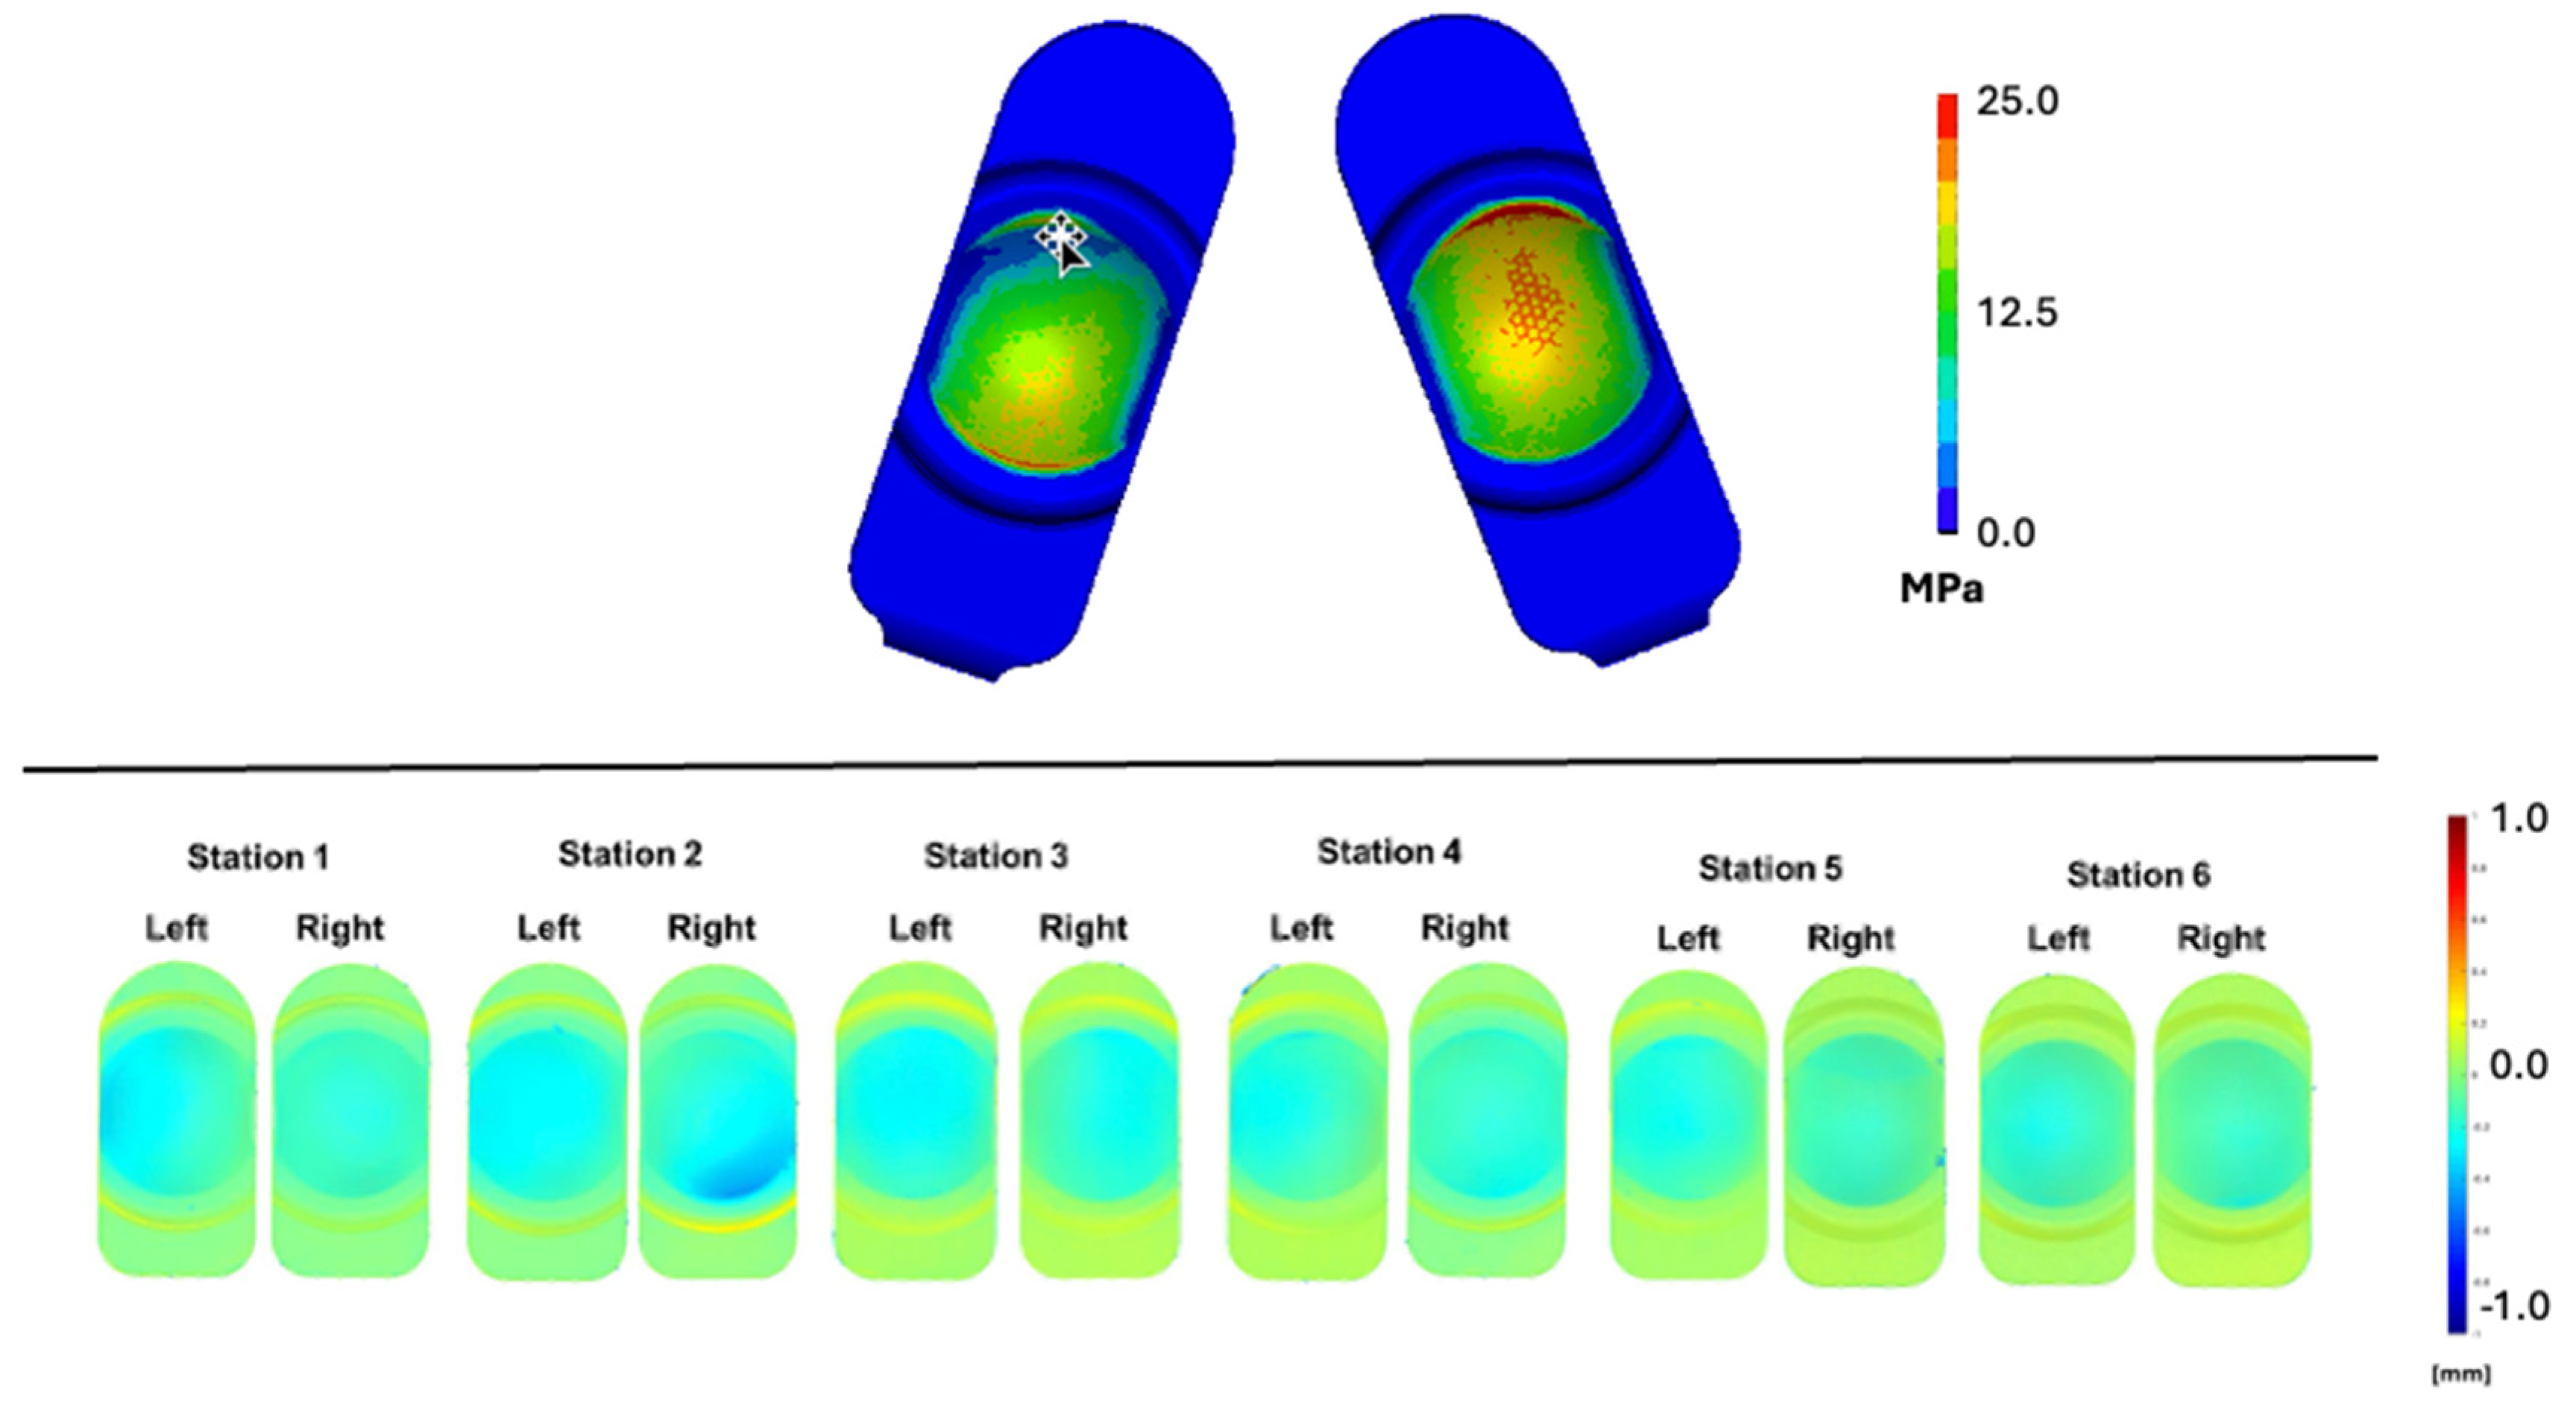
Qualitatively, the lateral bending, axial rotation, and plasticity of the component resulted in predominantly asymmetric contact stress contours across the duty cycle (
Figure 6, top). In general, contact pressure contours generally depicted loading across the entire area of the bearing surface depending on the phase of the duty cycle. The peak contact pressure was 33.6 MPa at or near to 50% of the duty cycle.
The 10 million cycle (MC) wear maps shown in
Figure 6 (bottom) for Stations 1 to 6 were damage scored for penetration, with fringes of the lightest blue corresponding to a deformation of greater than 0.2 mm and to visually differentiable damage from the wear map fringe plots. Similarly, the lightest blue fringes in the aggregated contact stress contour plots (>2.5 MPa) were judged to be associated with damage in the PE FEM fringe plot (
Figure 6, top). The average total damage score for the penetration maps was 11.3 and was, on average, 12, for the FEM stress plots, corresponding to a difference of 6.2%. Overall, both the qualitative assessment as well as the semi-quantitative comparison of the simulator penetration maps and the aggregate contact stress results supported the credibility of the FEM under Mode I conditions.
2.1.7.2. Validation Goal 2
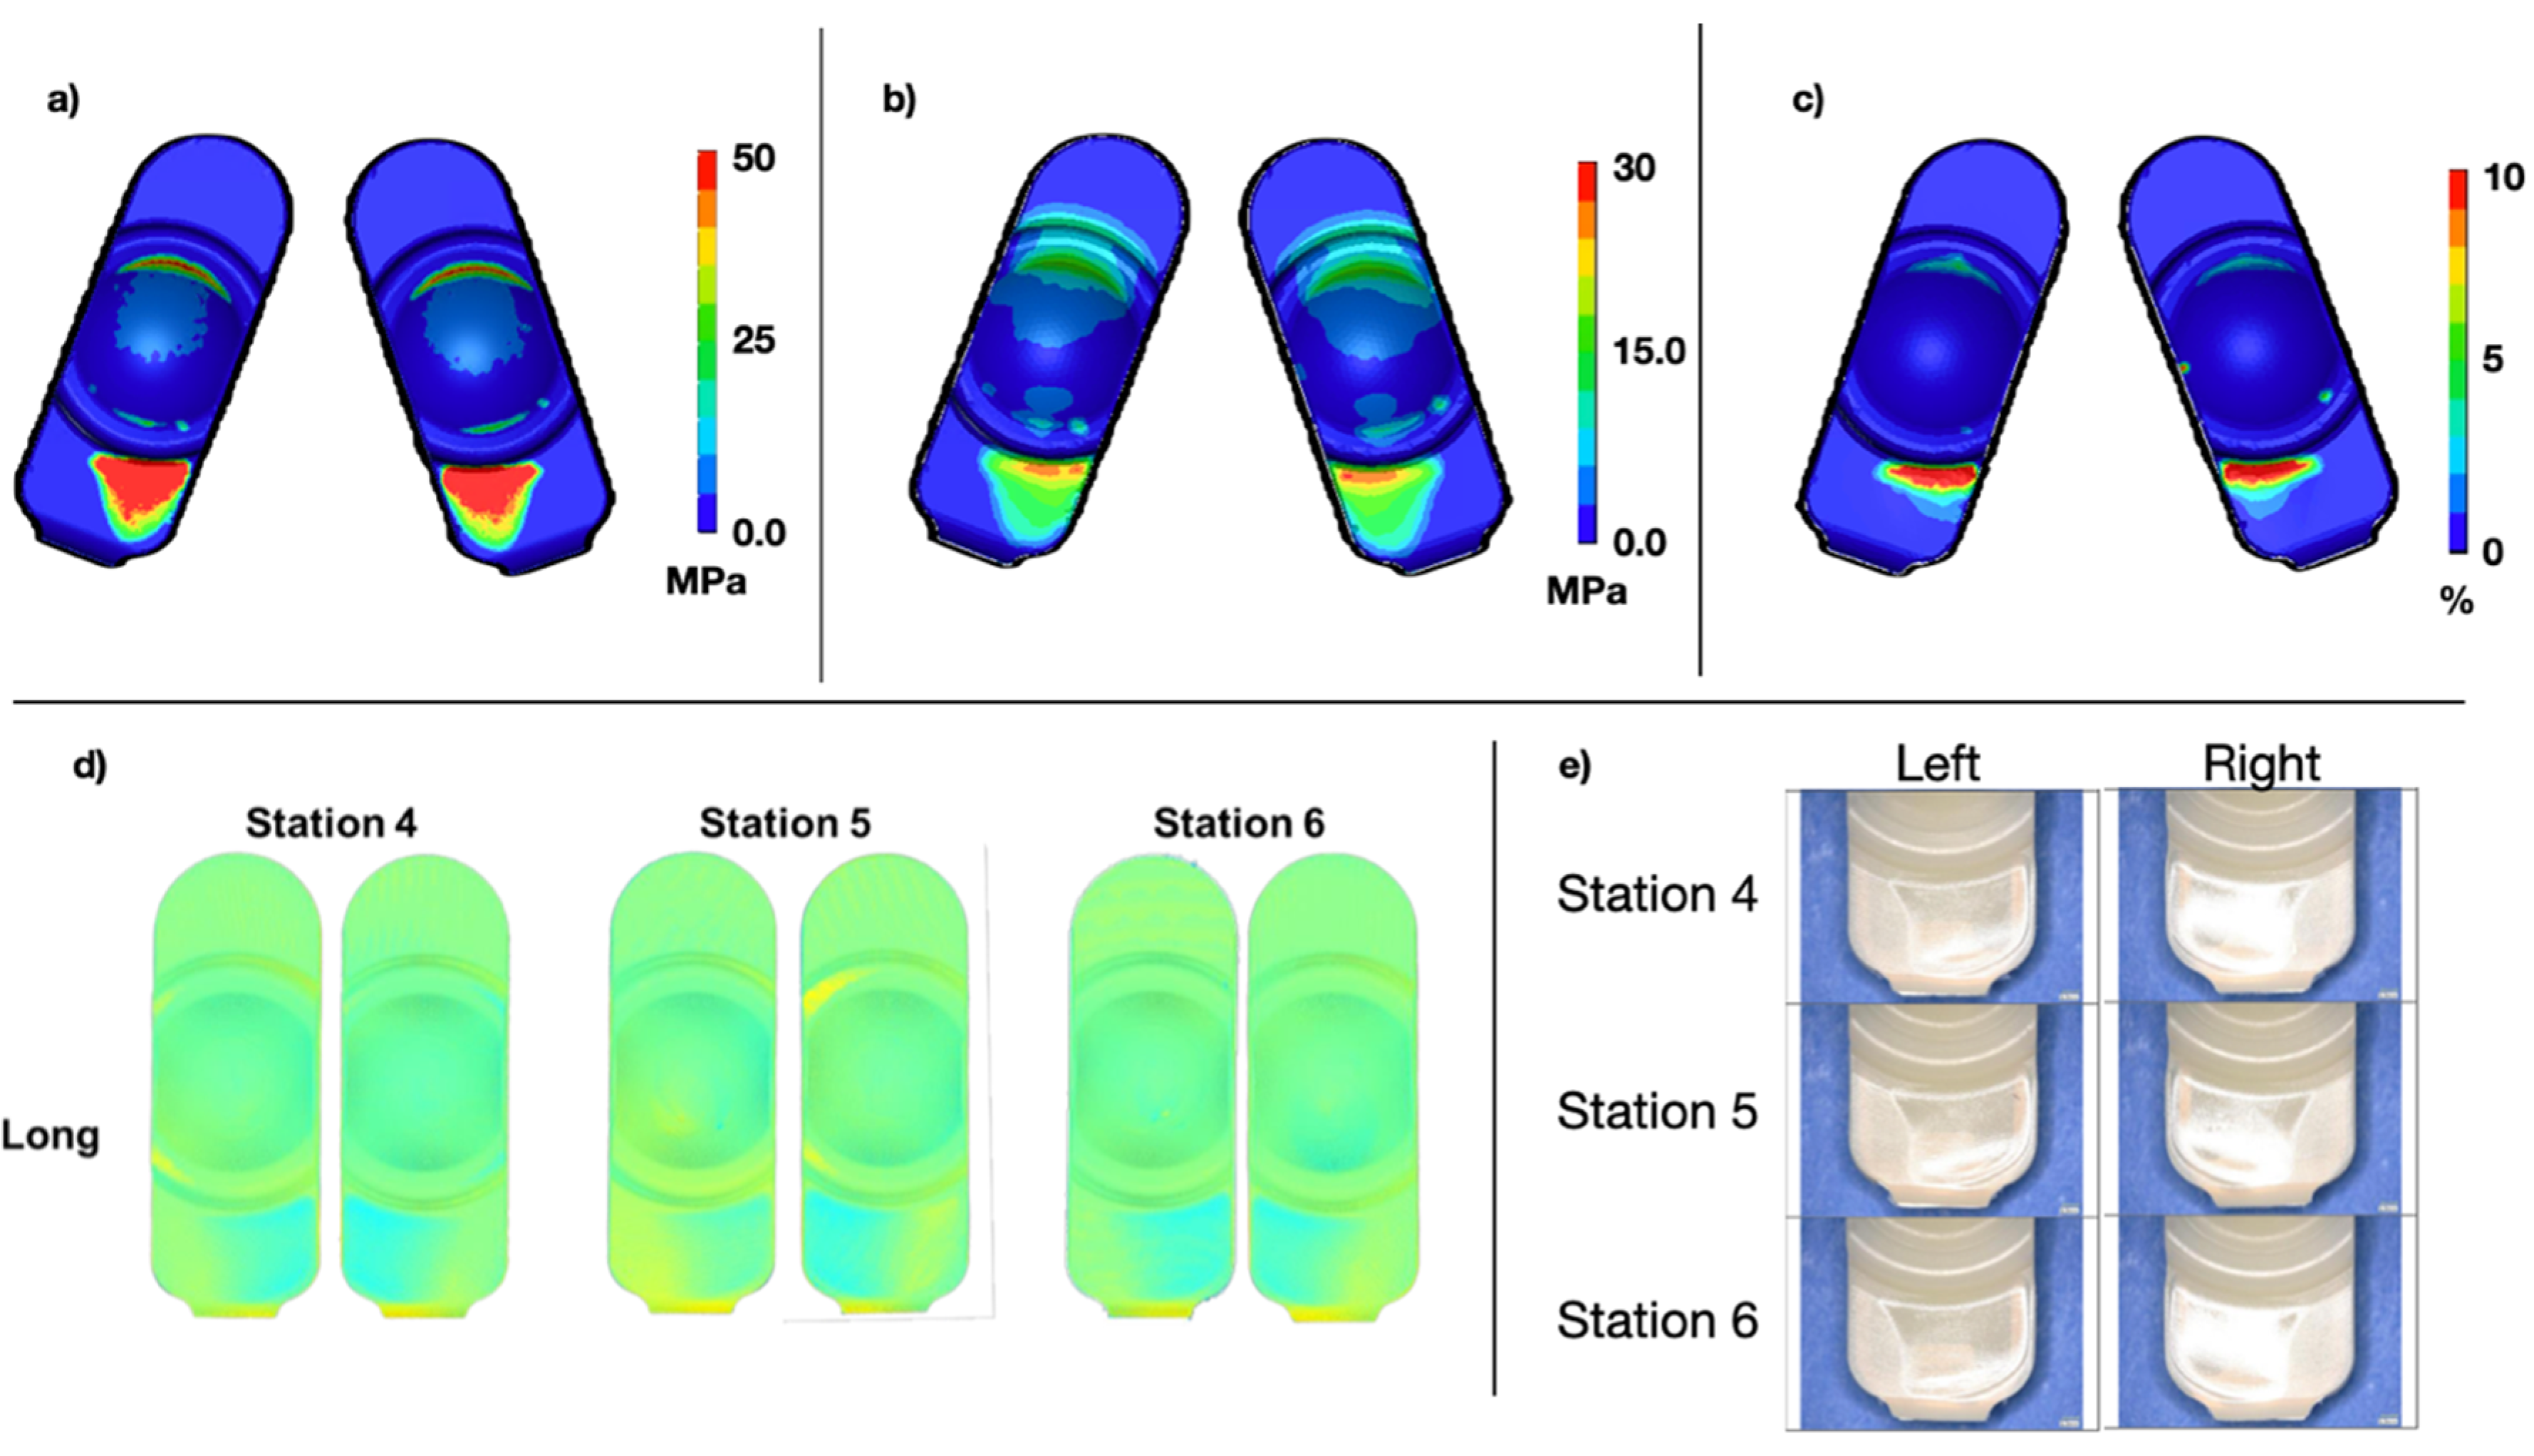
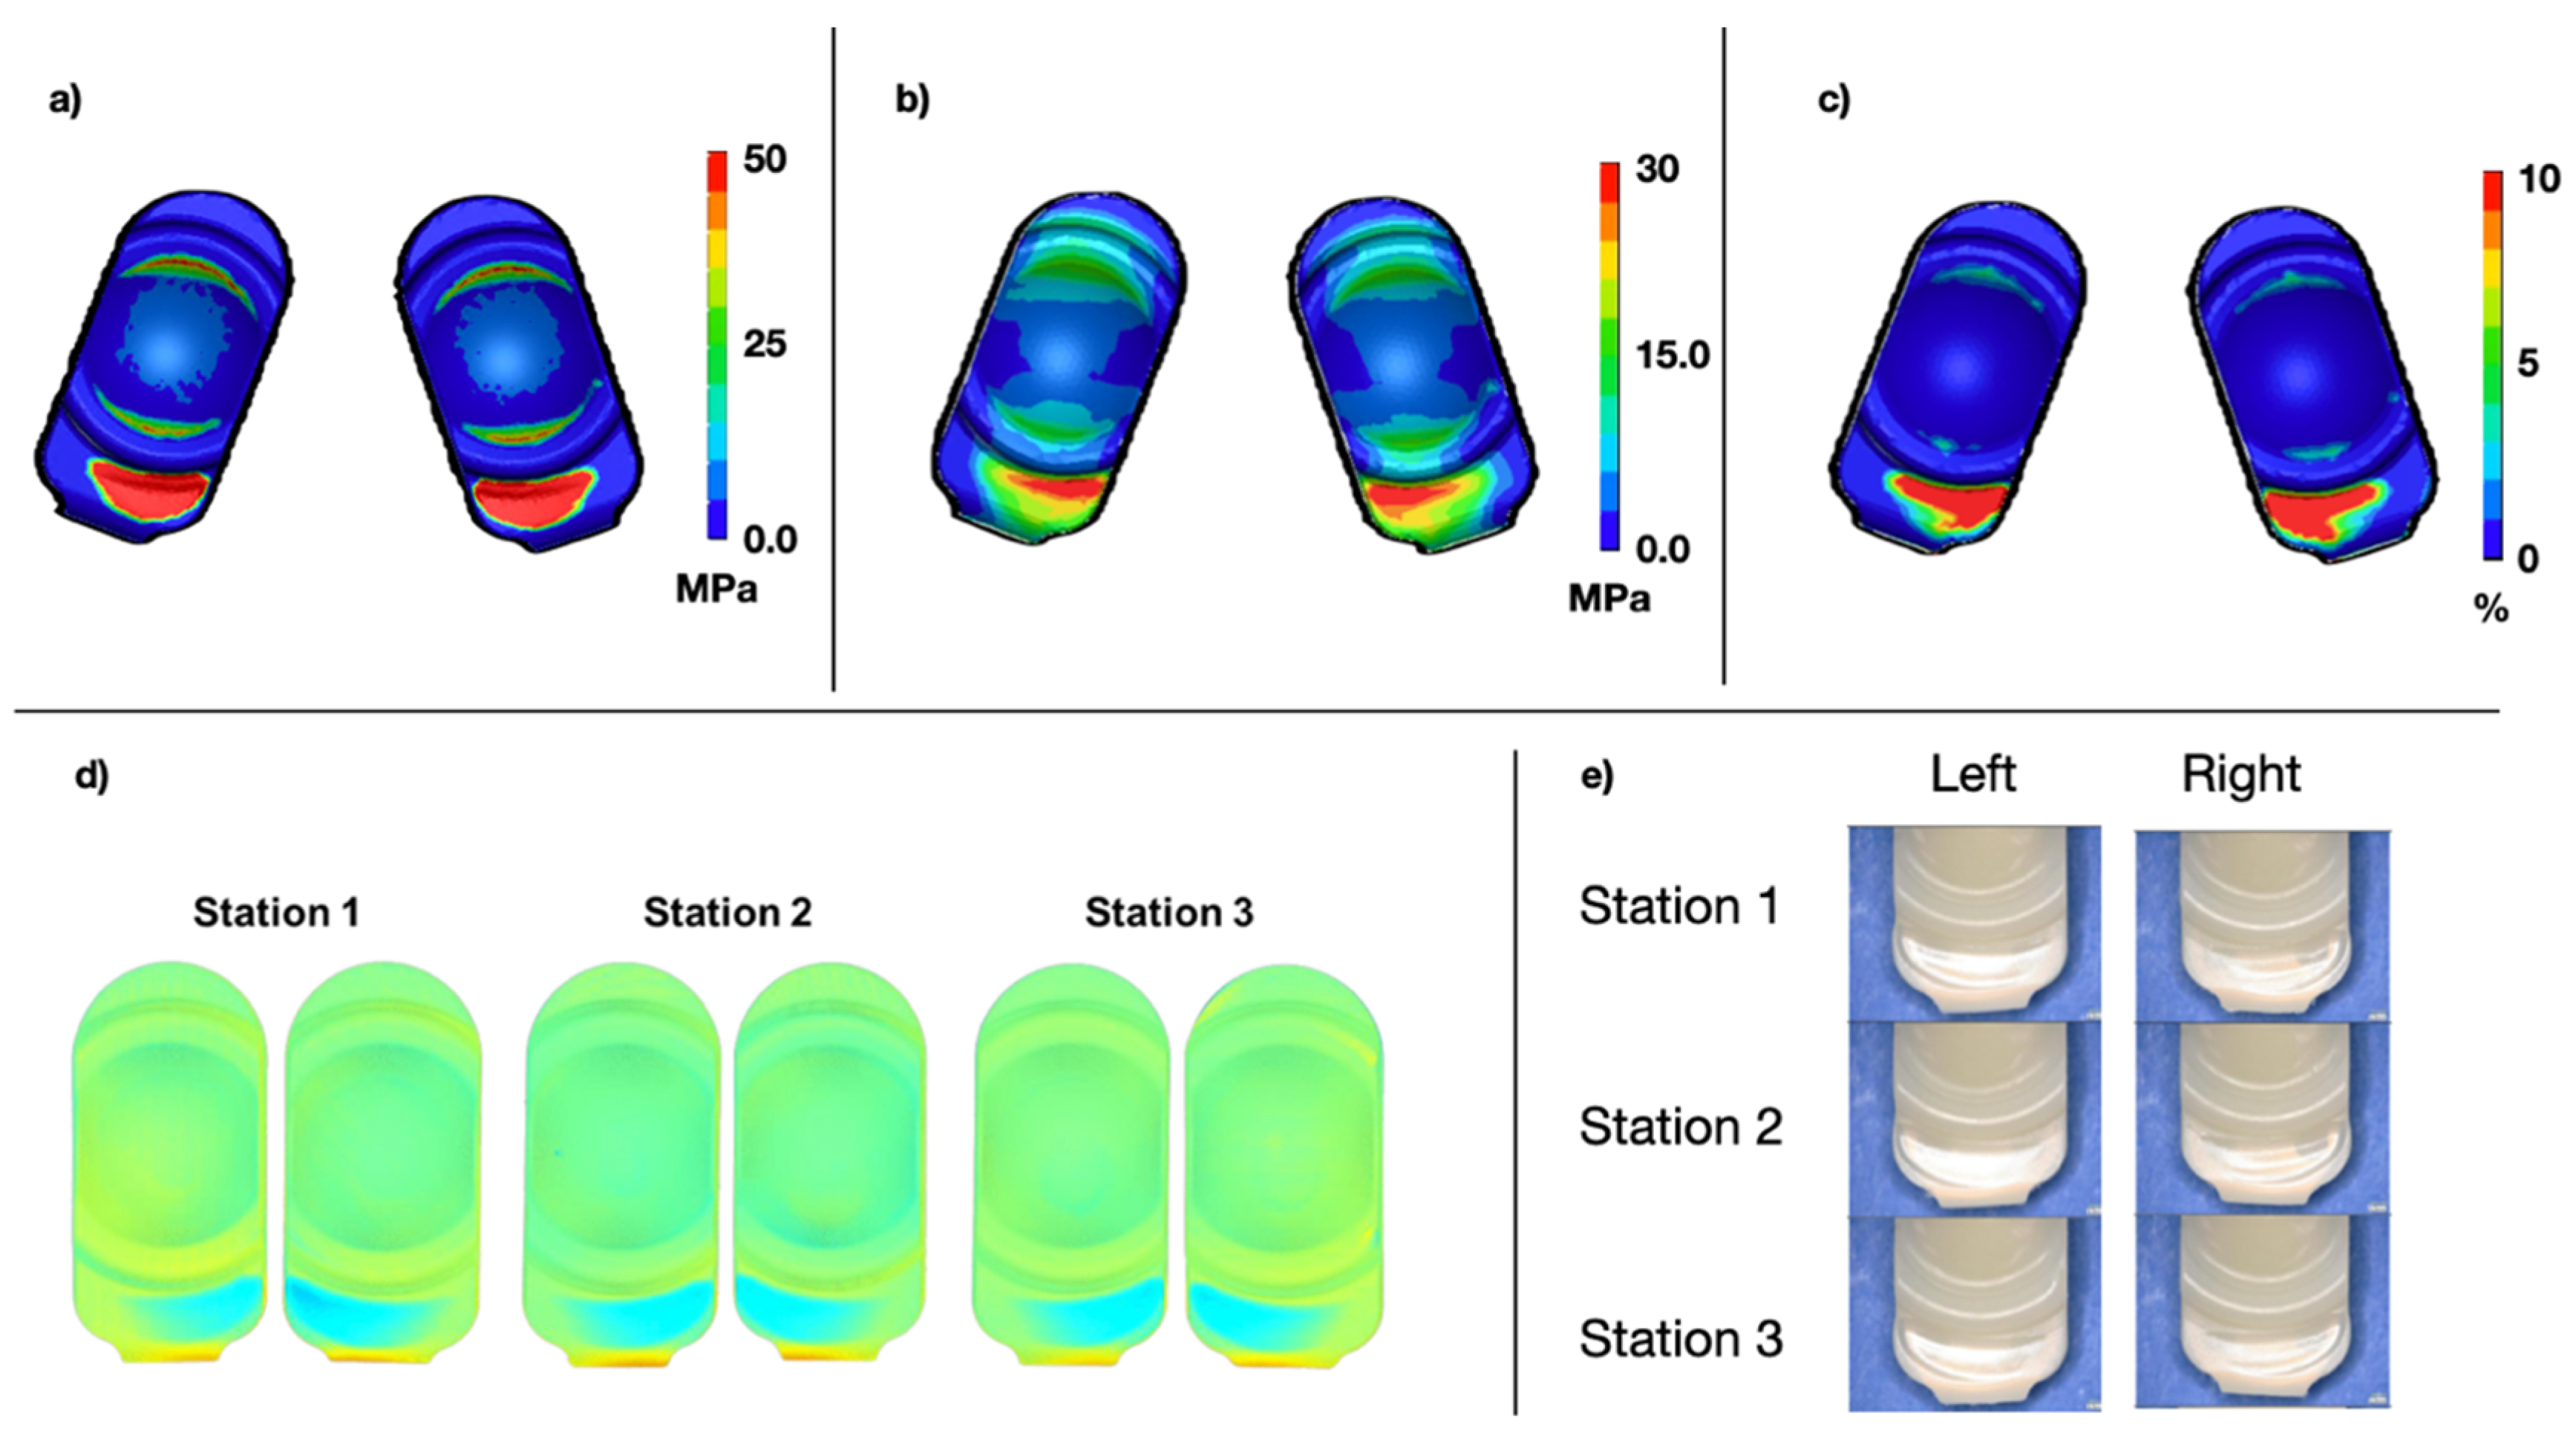
Qualitatively, the physical Mode IV wear testing indicated focal wear and deformation on the posterior aspect of the PE component, outside of the intended bearing surface as anticipated. These data were generally consistent with the standalone FEA results. In general, wear scar locational results between the short and long implants were similar (
Figure 7 and
Figure 8). The peak contact pressure for the long implant was 83.3 MPa and 104.8 MPa for the short.
The average total damage scores for the penetration maps were 7.5 and 8.8 for the long and short designs, respectively. For the FEM stress plots, the average damage scores were 7 and 9 for the long and short designs, respectively. These differences corresponded to a difference of 6.7% and 2.2%. Overall, this credibility activity supported the validation of the FEM under Mode IV conditions.
2.1.7.3. Validation Goal 3
Bartel et al., 1995 [
6] reported max contact pressures ranging from 40 to 60 MPa, which is generally greater than what was reported in the current model (~37 MPa). Given the lower axial load (2,000 N vs 3,000 N) and the generally stiffer PE, these results are consistent with those determined in the L-TJR FEM.
In a study by Rawlinson et al., 2006 [
23], peak axial compressive loading of 2,000 N was applied to a FEM of a total knee replacement PE bearing surface. The authors reported maximum contact pressures of 26 and 30 MPa for two different TKR designs. The PE material properties were the same as those described in Bartel et al., 1995. These results are similar to the results of the current FEM.
2.2.7.4. Summary of Credibility Activities for FEM
Overall, the FEA results were consistent with physical Mode I and IV penetration maps, as well as relevant published studies (Validation Goals 1-3). Thus, the results of these verification and validation activities support that the L-TJR FEM is credible for its context of use.
2.2. Parametric Analysis of Reasonable Axial and Coronal Plane Misalignment
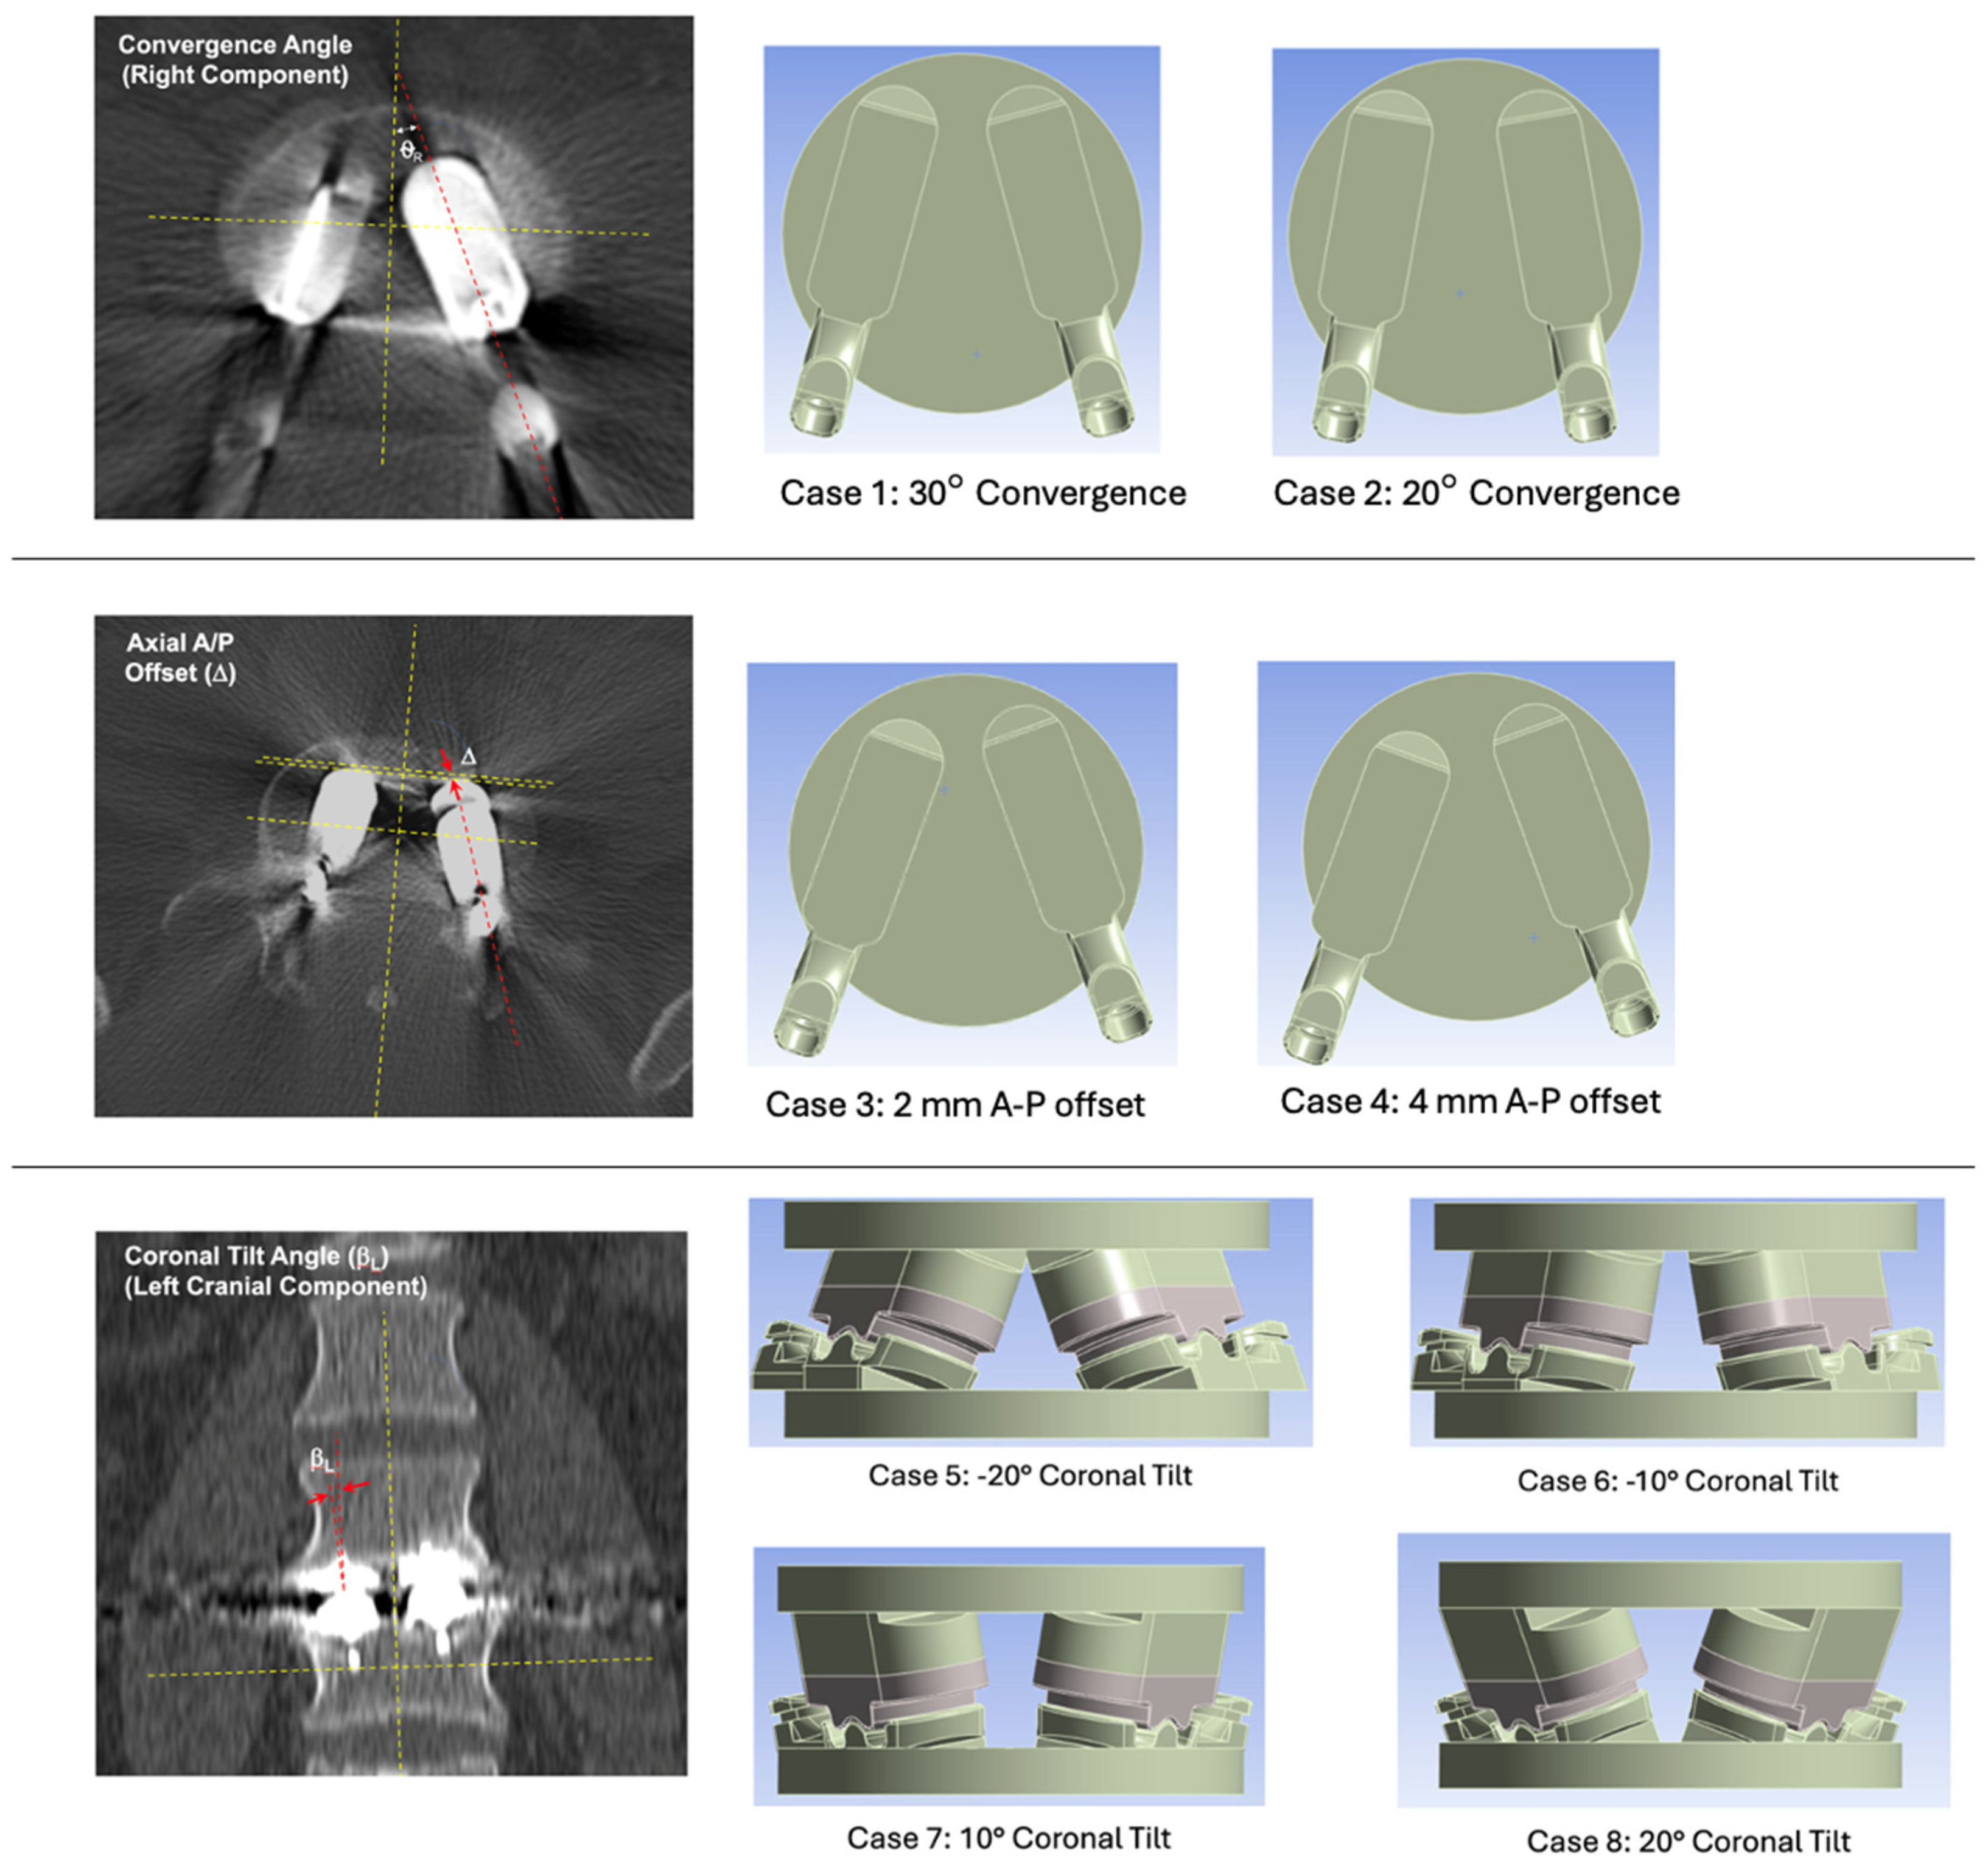
Having established the credibility of the FEM, we turned next to the analysis of axial and coronal plane misalignment. We relied on the current surgical technique for the L-TJR, which identifies the following cases as unreasonable misalignment, including insufficient convergence angle, rotation of the device in the coronal plane, and inappropriate anterior/posterior placement. Based on the criteria for unreasonable misuse outlined in the surgical technique guide, a parametric analysis of reasonably worst-case misalignment using the validated L-TJR FEM was performed in the study. Reasonable misalignment was created by altering L-TJR component positioning from the baseline condition for the following three independent misalignment scenarios:
Axial Plane Convergence Angle – baseline for Mode I testing was 40° based on reasonable worst-case total convergence between the two components. We therefore parametrically varied the total convergence between 30° and 20°. Less than 20° total convergence (i.e., 10° from the mid-line for each component) is considered unreasonable misuse based on the surgical technique guide, and hence was beyond the scope of the present study.
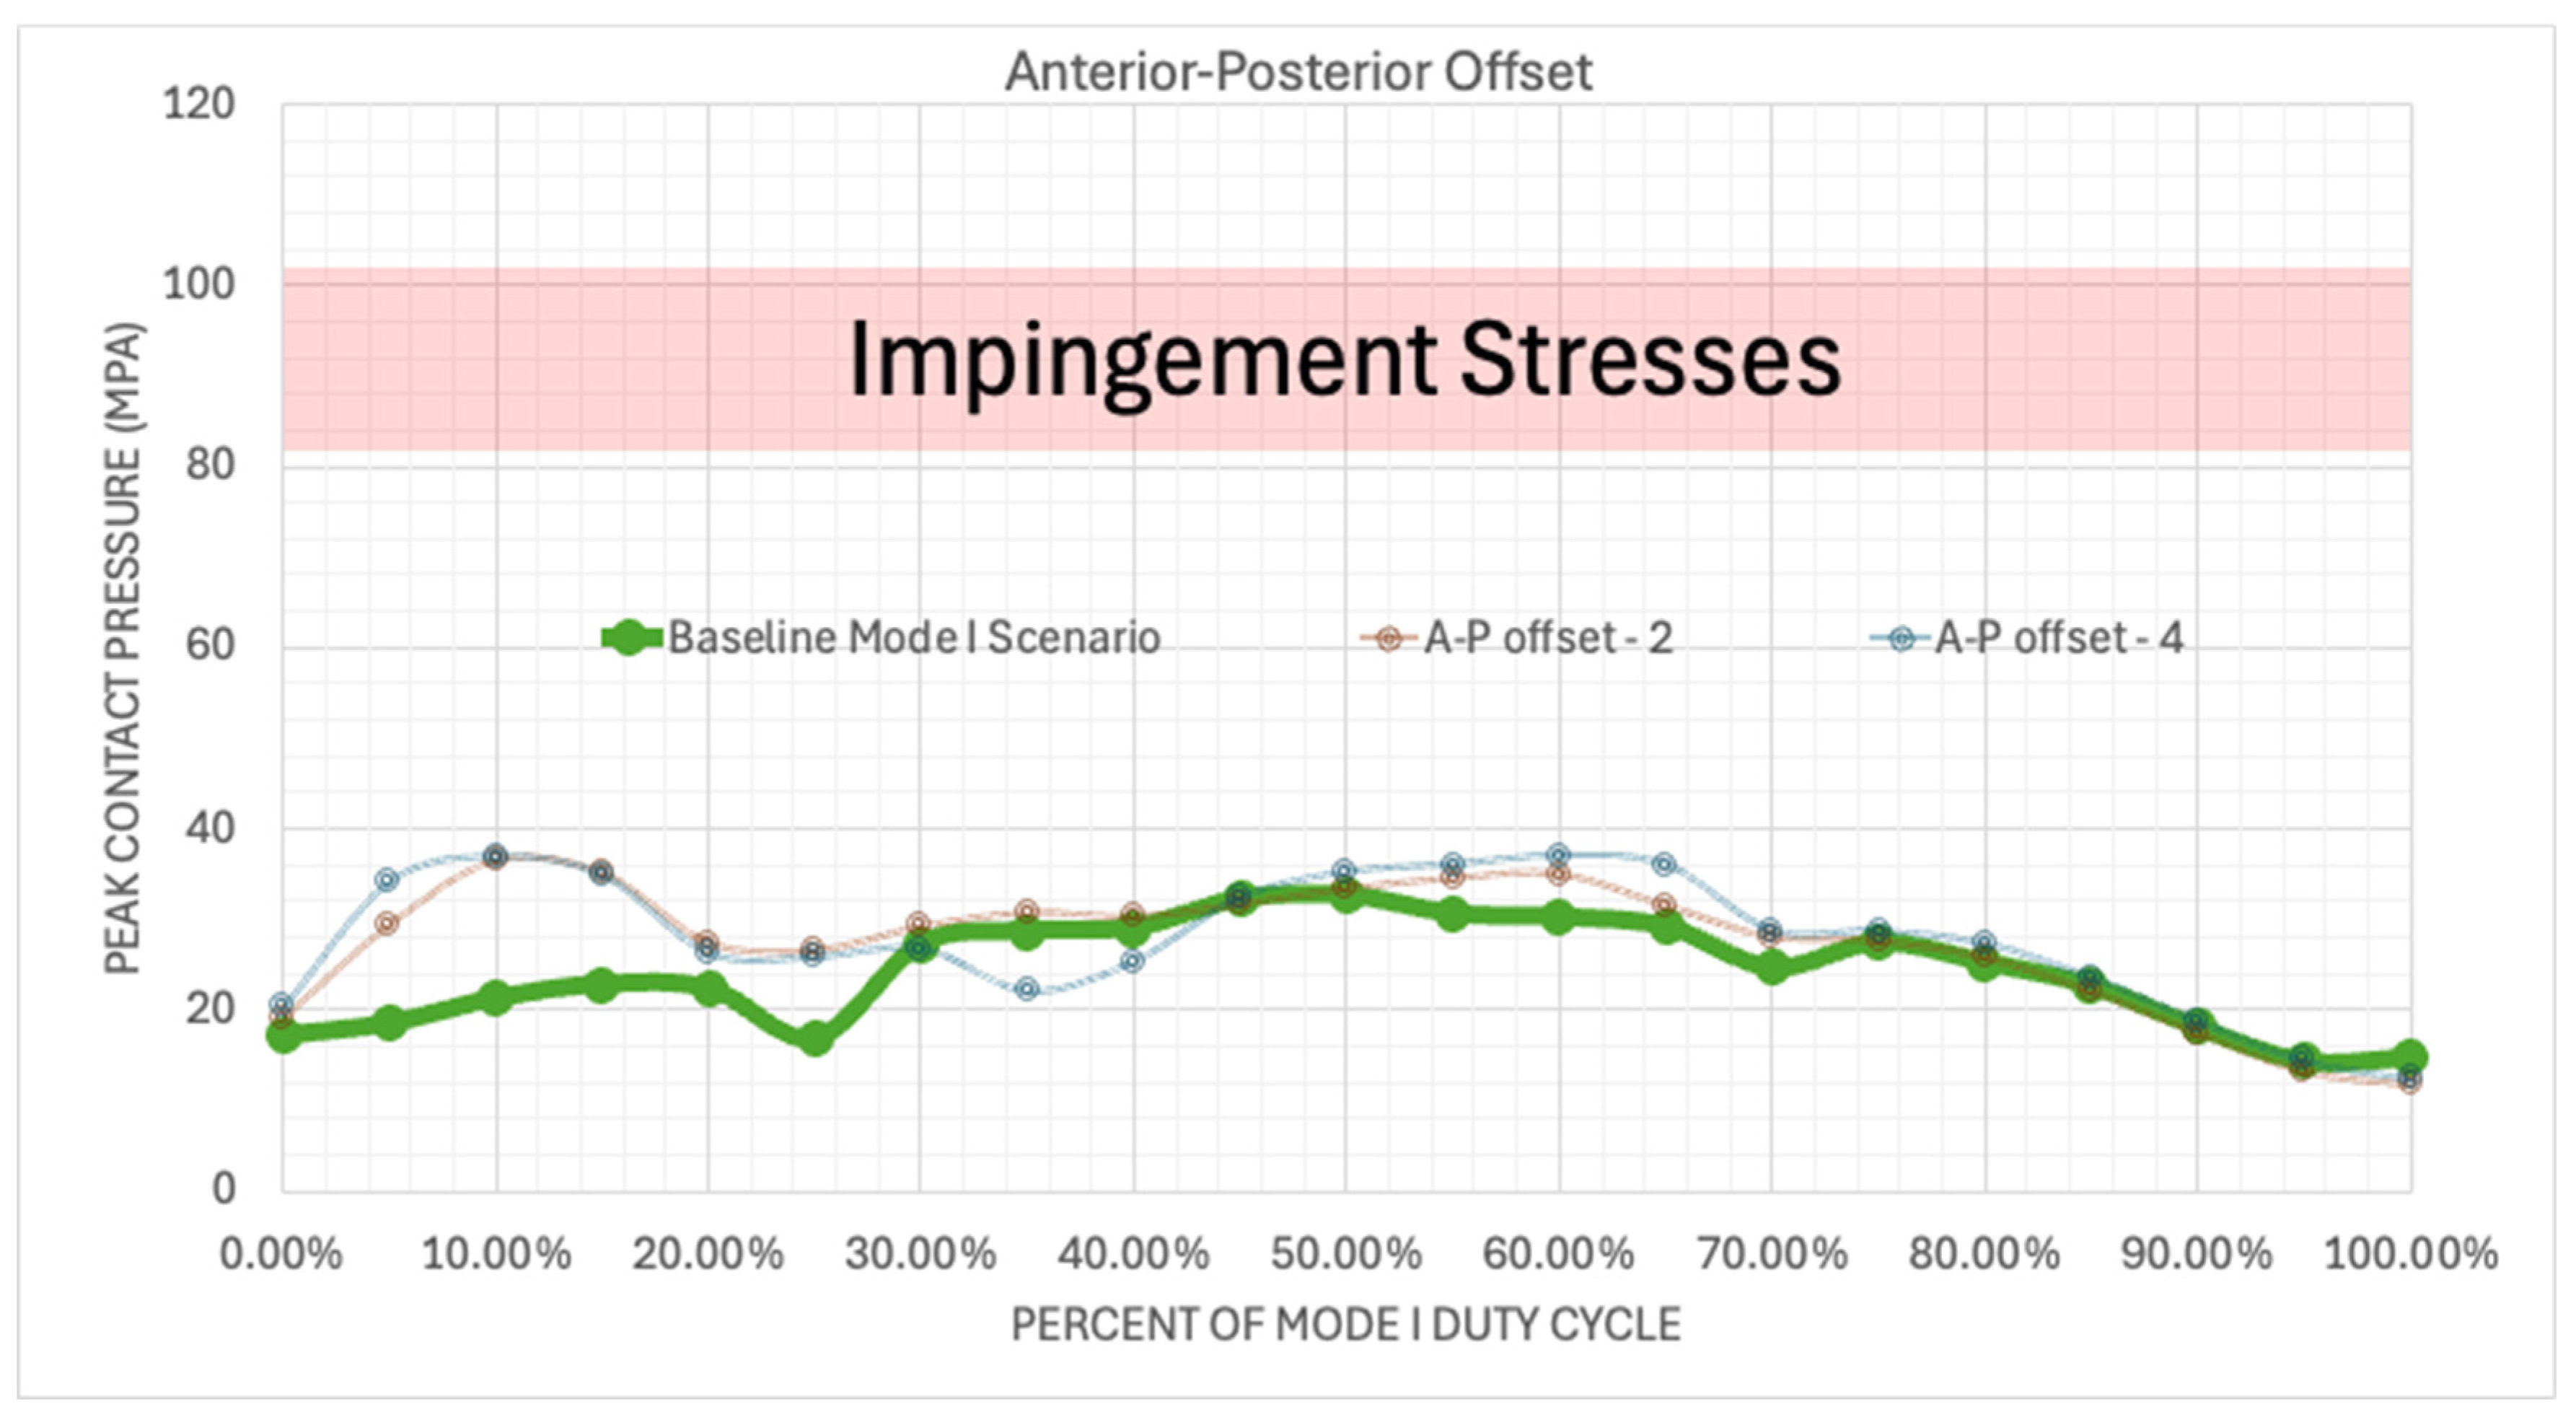
Axial Plane A-P Offset – baseline for Mode I testing was 0 mm. We parametrically varied the offset between 2 and 4 mm. Greater than 4 mm offset between the two components in the axial plane was considered unreasonable misuse.
Coronal Plane Tilt – baseline is 0°. We parametrically increased/decreased coronal tilt with the following four levels: -20°, -10°, +10° and +20°. Greater than ±20° total convergence (i.e., 10° from the mid-line for each component) is considered unreasonable misuse.
The following eight simulations of misalignment were conducted, in addition to the Mode I baseline wear testing conditions from the original validation study, as summarized in
Table 3 and shown in
Figure 9.
The discretization of the L-TJR components in the validated FEM, as well as material properties, boundary conditions, finite element solver parameters, and contact modeling parameters were all scripted parametrically in ANSYS to facilitate the present analysis. Thus, once the orientation of the components was specified, the meshing of the misaligned Cases 1 to 8, as well as the additional properties and parameters, were all identical to that of the validated baseline L-TJR FEM.
Resulting contour plots of contact pressure, Von Mises stress, principal stresses, and displacement, as well as data plots of reaction contact and boundary force, internal energy, kinetic energy, and total energy were collected for each run and at each timestep.
4. Discussion
Understanding how device misalignment influences component wear and deformation is essential for characterizing any implantable orthopedic or spinal device. In this study, we used FEM to assess the relative risk of a novel L-TJR device design to misalignment by comparing contact pressures in reasonably worst-case misaligned scenarios with the results from in vitro wear testing. We found that for all of the reasonable worst-case misalignment scenarios considered (Cases 1 to 8), the bearing mechanics of the L-TJR design remained reasonably consistent with Mode I conditions. Specifically, contact between the superior and inferior components remained confined to the intended spherical bearing surfaces of the design, without evidence of impingement. The contact pressures, Von Mises stresses, and effective strain in all of the reasonable worst-case misalignment scenarios fell below the levels associated with Mode IV wear boundary condition performance bench testing. Based on the literature [
11], the contact pressures and internal stresses in the polyethylene indicate that relative risks of wear and surface damage, including pitting, delamination, and fracture associated with misalignment, will be lower relative to the conditions from Mode IV bench testing. Consequently, the existing physical wear test results are sufficient to assess the wear consequences of such misalignment, and validated FEM will enable the ability to contextualize a wide range of reasonable worst-case misalignment scenarios with wear rates established during physical testing.
Our analysis has limitations. First, the QOI for our modeling activities is limited to the parametric analysis of reasonable misalignment, not unreasonable misuse or revision scenarios such as subsidence or gross migration. Second, our verification and validation activities undertaken in this report were based on the analysis of a specific LTJR design and relative risk analysis founded on the results of previous Mode I and Mode IV wear tests for that specific design, under assumption that in future parametric analyses only the orientation of the components was being perturbed. It is not clear whether this model would be suitable for addressing other QOIs, such as the analysis of scenarios related to revision, which were beyond the scope of our current investigation and would require additional validation activities.
Third, the outcomes of our analyses included the bearing stresses and strains in the polyethylene component instead of wear. Previous simulations of PE wear by Maxian and colleagues [
15,
16] included assessments of bearing stresses and sliding distance into their formulation of Archard’s law for abrasive wear. In the present study, both the implant design factors and duty cycle factors driving the kinematics of the bearing surface remained constant, hence the changes in the wear according to Archard’s law would theoretically be driven only by the changes in contact stresses due to misalignment during the duty cycle, when other factors are held constant. Fourth, our boundary conditions were limited to “simulating the simulator,” based on our ability to validate the FEM under these international standard wear test conditions. Thus, our findings will serve as the basis for assessing L-TJR behavior under more complex in vivo loading scenarios in future research. The application of the model to such alternate scenarios will of course necessitate additional verification and validation activities.
Overall, the limitations of the model do not diminish the credibility of the FEM and its ability to rigorously address the QOI for which it was developed. Rather, the limitations identified here are intended to caution the reader about the potential generalization of our findings to other QOIs or COUs without undertaking the appropriate validation activities.
For the present study, our primary goal was to test the hypothesis that the bearing stresses and strains will be insensitive to reasonable misalignment in the context of Mode IV impingement wear, which is the worst-case test that evaluates conditions beyond reasonable misuse. Overall, the results of our parametric analysis supported our hypothesis. Our approach was based on historical research [
7,
9,
30] that went into developing what we consider today to be reasonable worst-case misalignment conditions in the sagittal plane for lumbar ADR. This comprehensive body of finite element research was undertaken in response to the well-documented risk of sagittal plane impingement observed in previous motion-preserving spinal implants. Specifically, the development of an impingement model involved not only explant analysis to identify and characterize the potential in vivo damage mode, but also detailed, validated FEM, conducted with realistic in vivo boundary conditions. Thus, the historical approach towards understanding misalignment is based on an established clinical relevance of sagittal impingement from ADR explants, which were then followed up by simulations with in vivo boundary conditions to reproduce clinically relevant sagittal impingement [
10]. These were then used as a basis for developing in vitro sagittal plane impingement tests [
22].
We considered anatomical (cadaver) models as an approach to assess wear and deformation of the L-TJR device but ruled them out for several reasons. First, cadaver experiments are limited to the availability of donors, who are typically elderly and may be outside the range of bone quality and tissue integrity representative of a sizable portion of the target population. Second, and most importantly, the magnitude of loading that can be exerted on preserved/stored cadaver specimens may be only a fraction of the loading that can be exerted in vivo. Additionally, simulating misalignment in a physical model has limitations arising from the uncertainties in positioning introduced by nonstandard misalignment fixtures (in the simulator) or by the inability to repeatedly control and readjust misalignment (in a cadaver model). Overall, our adopted approach lends itself well to translation into more biofidelic boundary conditions, such as those associated with simulated daily activities including standing and bending and will provide a comprehensive assessment of reasonable worst-case misalignment under a broad set of in vitro and clinically relevant boundary conditions. This comprehensive approach is judged to be superior to physical testing in spine simulators or robotic cadaver experiments for addressing misalignment queries, given their critical limitations.
We verified and validated our FEM in accordance with ASME V&V 40. There are currently very few published studies that report using this framework for spinal fusion components [
28], and to date we have found no such ADR studies for comparison. However, FEM analyses that consider lumbar ADR misalignment have been previously published [
30,
31,
32,
33,
34,
35,
36,
37,
38,
39,
40]. Schmidt et al. assessed the effect of sagittal misalignment for a Charité model, specifically displacing the implants 2 mm both anteriorly and posteriorly [
32]. The authors report impacts to range of motion, increased facet joint forces, and lift-off between the device core and endplates (which may lead to dislocation or early component wear). Rohlmann et al. reported similar findings as well as some minor facet joint force effects related to coronal plane alignment (up to 3 mm) [
31]. The study by Rundell et al., upon which our present approach is based, additionally reports an increased risk of impingement related to A-P misplacement (as well as implant disc distraction, lordotic angle, and spinal orientation) for a Charité model [
30]. Several studies have further demonstrated altered kinematics, facet joint forces, and core stresses due to both sagittal and coronal alignment, with the impact of positioning depending on device type (e.g., mobile or fixed core) and load type (e.g., flexion, extension, bending) [
35,
36,
37,
38,
39,
40].
Comparison of our work to previous results is limited by the difference in designs: while traditional ADR alignment is judged with respect to the vertebral midline, the bilateral design of the L-TJR introduces the element of alignment between the two components. Still, for a range of alignment scenarios, our work showed the L-TJR design to be reasonably insensitive to axial and coronal misalignment under the imposed boundary conditions. Additionally, previous studies evaluated devices within lumbar spine models, whereas our work represents a standalone device model under in vitro testing conditions. In the future, our findings will serve as the basis for assessing L-TJR behavior under more complex in vivo loading scenarios.
Author Contributions
Conceptualization, SAR, RVY, and SMK; methodology, SAR, RVY, and SMK; validation, SAR and SMK; formal analysis, SAR; investigation, SAR; resources, SAR, RVY, and SMK; data curation, SAR; writing—original draft preparation, SMK and HS; writing—review and editing, All authors; visualization, SAR; supervision, SMK; project administration, RVY, SAR, HS and SMK; funding acquisition, SAR, RVY, and SMK. All authors have read and agreed to the published version of the manuscript.
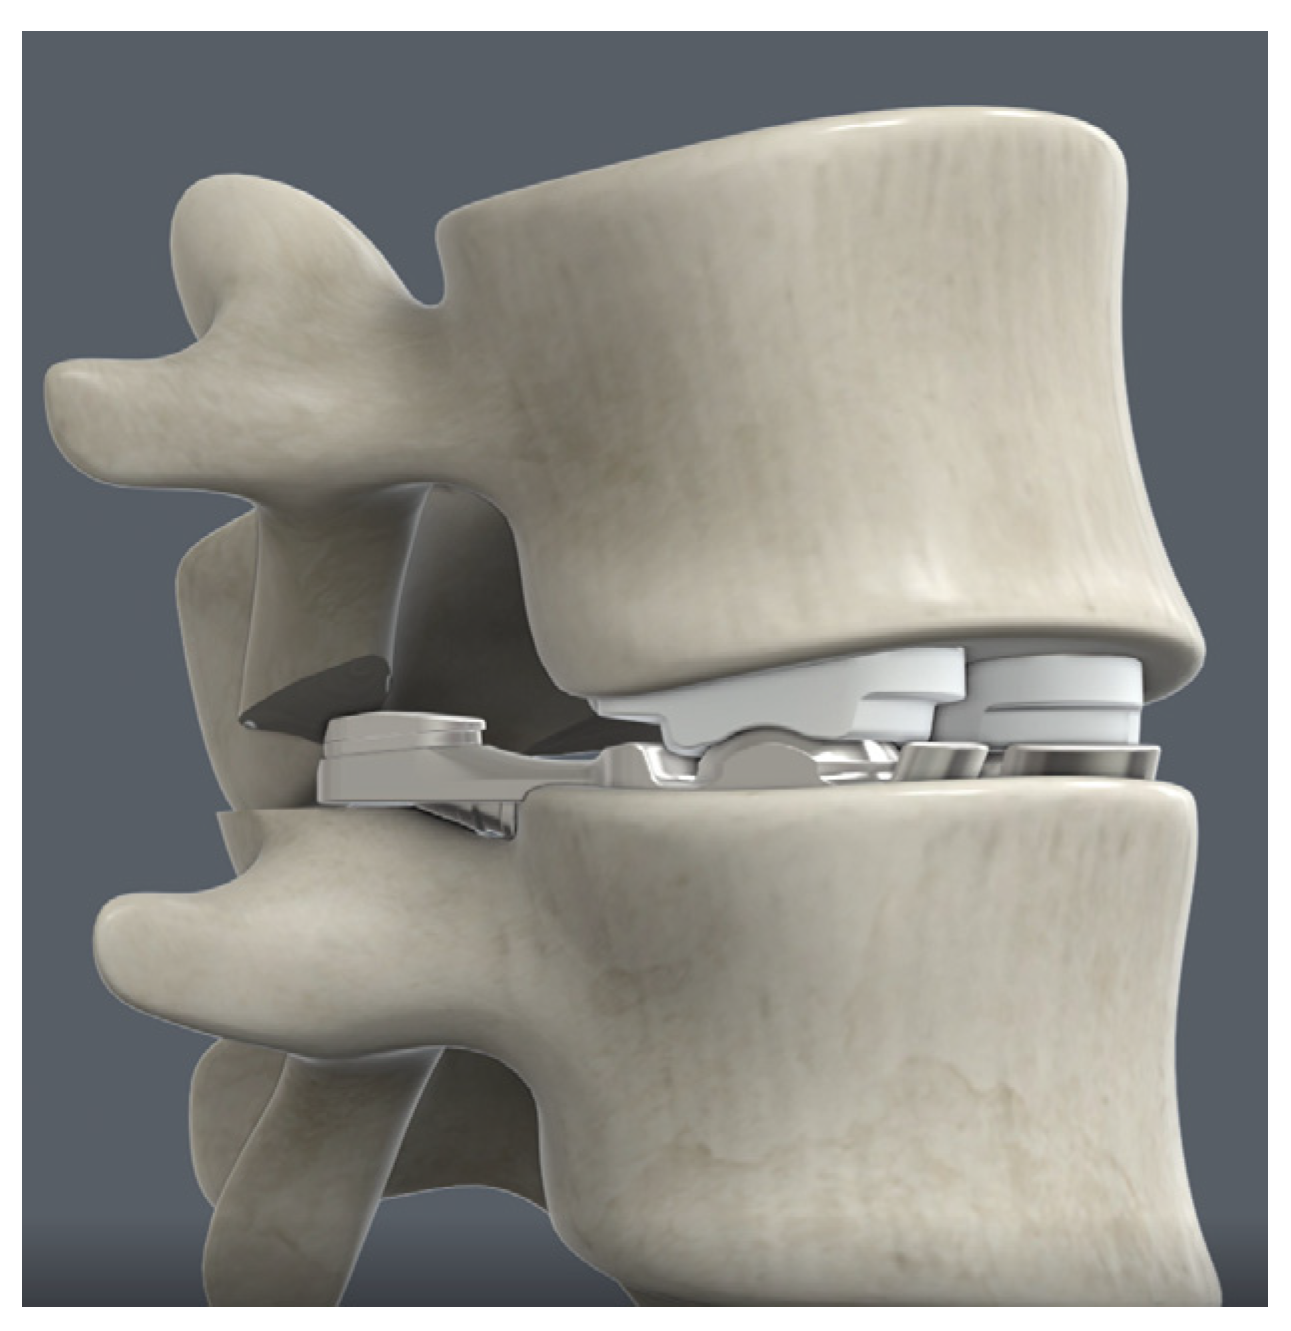
Figure 1.
MOTUS® Lumbar Total Joint Replacement design (3Spine, Chattanooga, TN).
Figure 1.
MOTUS® Lumbar Total Joint Replacement design (3Spine, Chattanooga, TN).
Figure 2.
CAD surfaces and FEM Model of the in vitro wear simulator.
Figure 2.
CAD surfaces and FEM Model of the in vitro wear simulator.
Figure 3.
Image depicting the general boundary and loading conditions of the validated standalone FEM of the L-TJR.
Figure 3.
Image depicting the general boundary and loading conditions of the validated standalone FEM of the L-TJR.
Figure 4.
Annotated
Figure 4 from ISO 18192-1 [
18] depicting the explicit model times in relation to the percentages of the Mode I wear duty cycle.
Figure 4.
Annotated
Figure 4 from ISO 18192-1 [
18] depicting the explicit model times in relation to the percentages of the Mode I wear duty cycle.
Figure 5.
Diagram of L-TJR Component Damage Scoring Regions for Validation Activities 1 and 2.
Figure 5.
Diagram of L-TJR Component Damage Scoring Regions for Validation Activities 1 and 2.
Figure 6.
Contours of maximum contact pressure aggregated over the duty cycle. Superior component penetration maps based on microCT scans after 10 million cycles of Mode I duty cycles is also shown (bottom).
Figure 6.
Contours of maximum contact pressure aggregated over the duty cycle. Superior component penetration maps based on microCT scans after 10 million cycles of Mode I duty cycles is also shown (bottom).
Figure 7.
Contours of maximum contact pressure across all states (a), maximum von Mises stress across all states (b), and cumulative plastic strain (c) for the long design under Mode IV conditions. Superior component penetration maps based on microCT scans (d) and photo documentation (e) after 1 million cycles of Mode IV duty cycles is also shown.
Figure 8.
Contours of maximum contact pressure across all states (a), maximum von Mises stress across all states (b), and cumulative plastic strain (c) for the short design under Mode IV conditions. Superior component penetration maps based on microCT scans (d) and photo documentation (e) after 1 million cycles of Mode IV duty cycles is also shown.
Figure 9.
Definitions of convergence angle, axial A/P offset, and coronal tilt angle and images of 3D CAD models illustrating the component positioning of cases 1 through 8.
Figure 9.
Definitions of convergence angle, axial A/P offset, and coronal tilt angle and images of 3D CAD models illustrating the component positioning of cases 1 through 8.
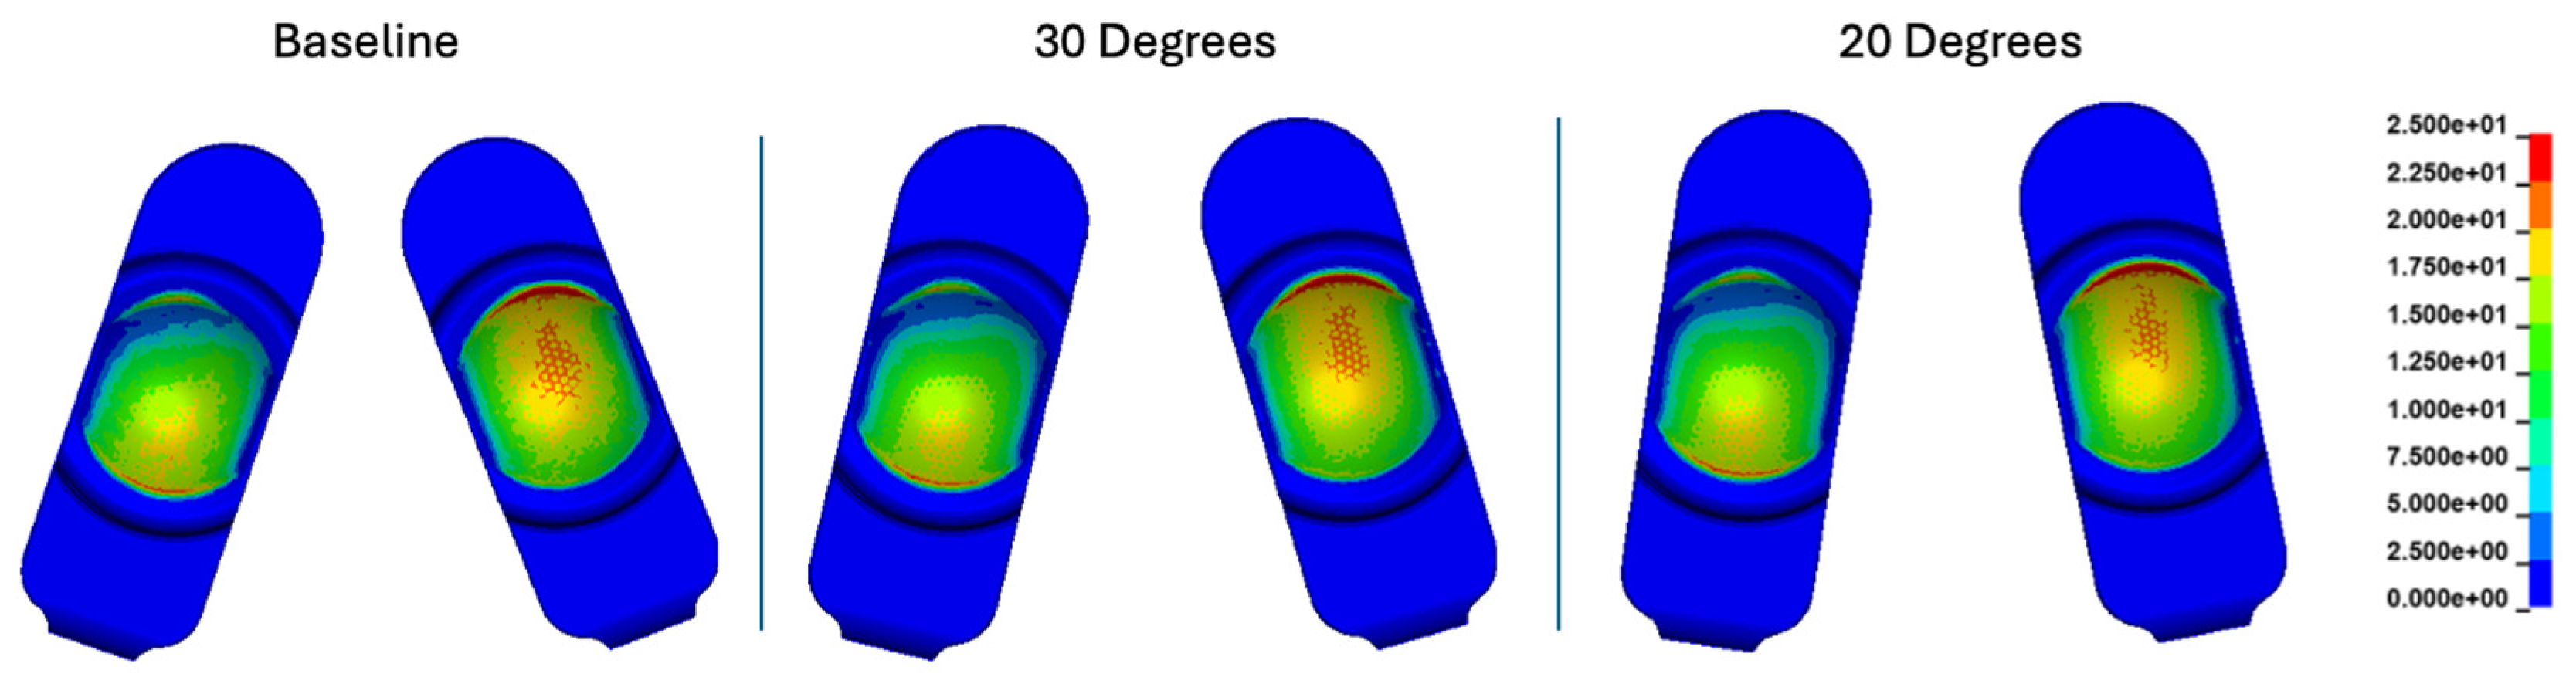
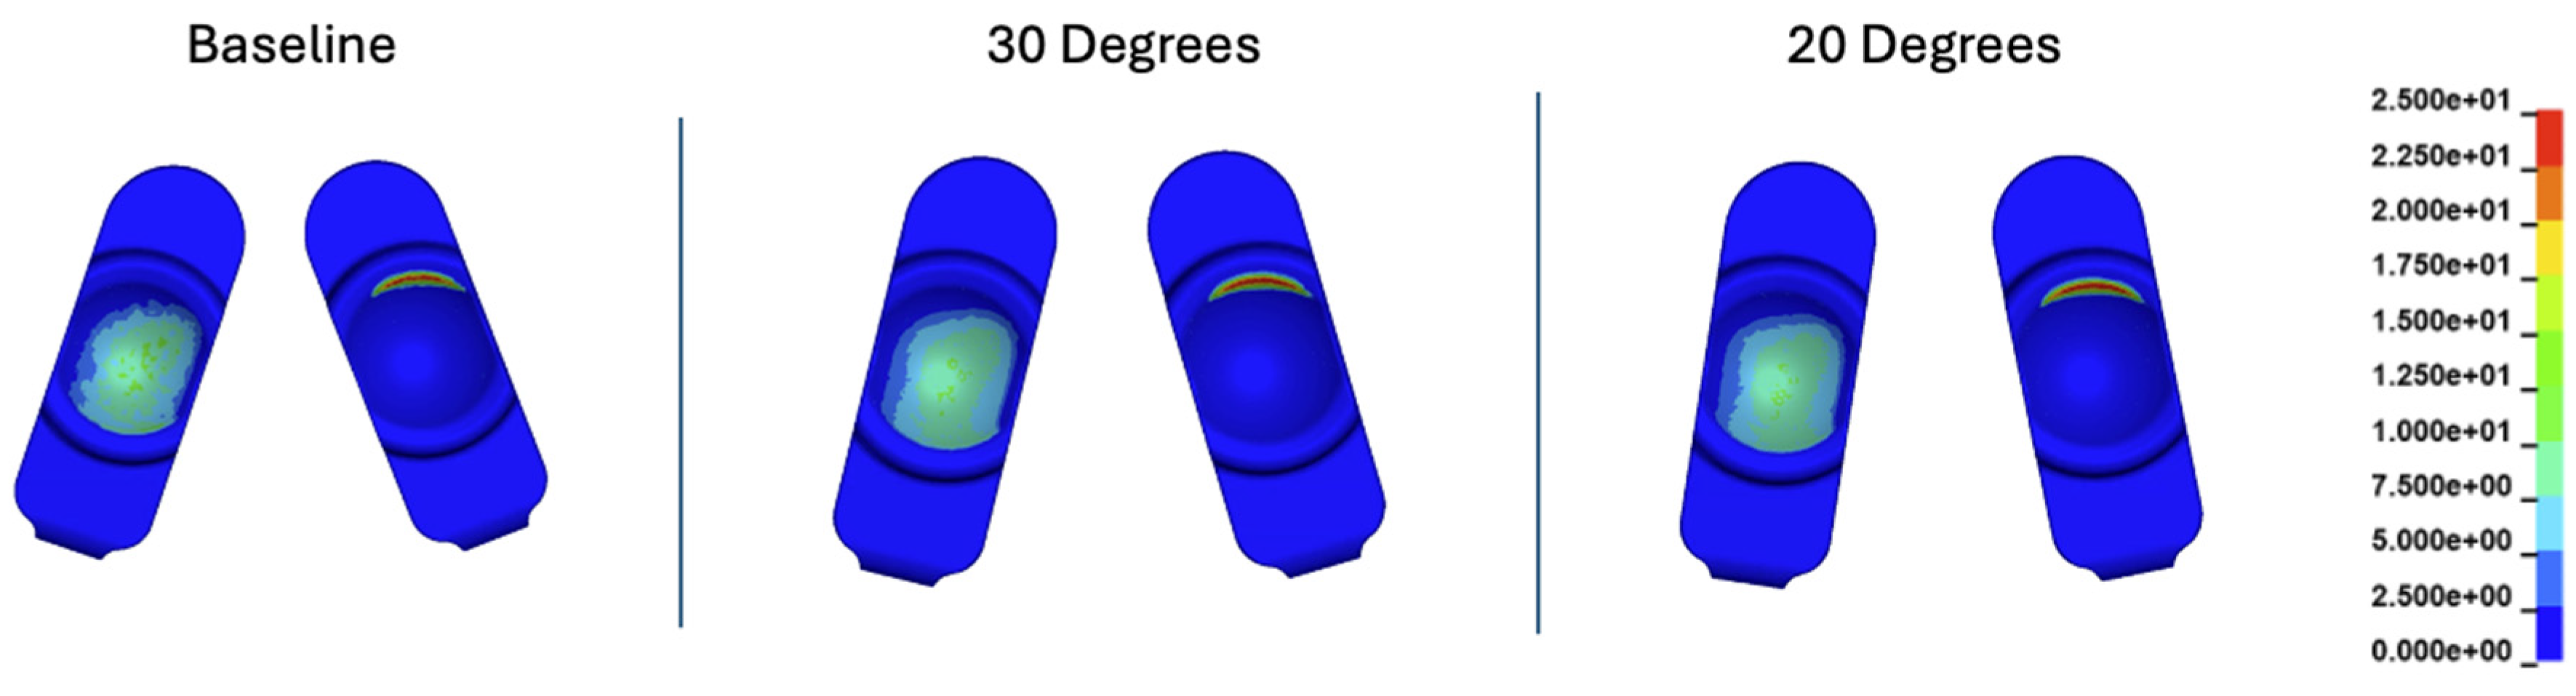
Figure 10.
Contact pressure (MPa) plots cumulatively over the Mode I duty cycle for the baseline, 30°, and 20° convergence angle simulations. The contact stress plots are viewed on the L-TJR superior polyethylene components from the bottom looking up. The up direction in the figure corresponds to the anterior direction.
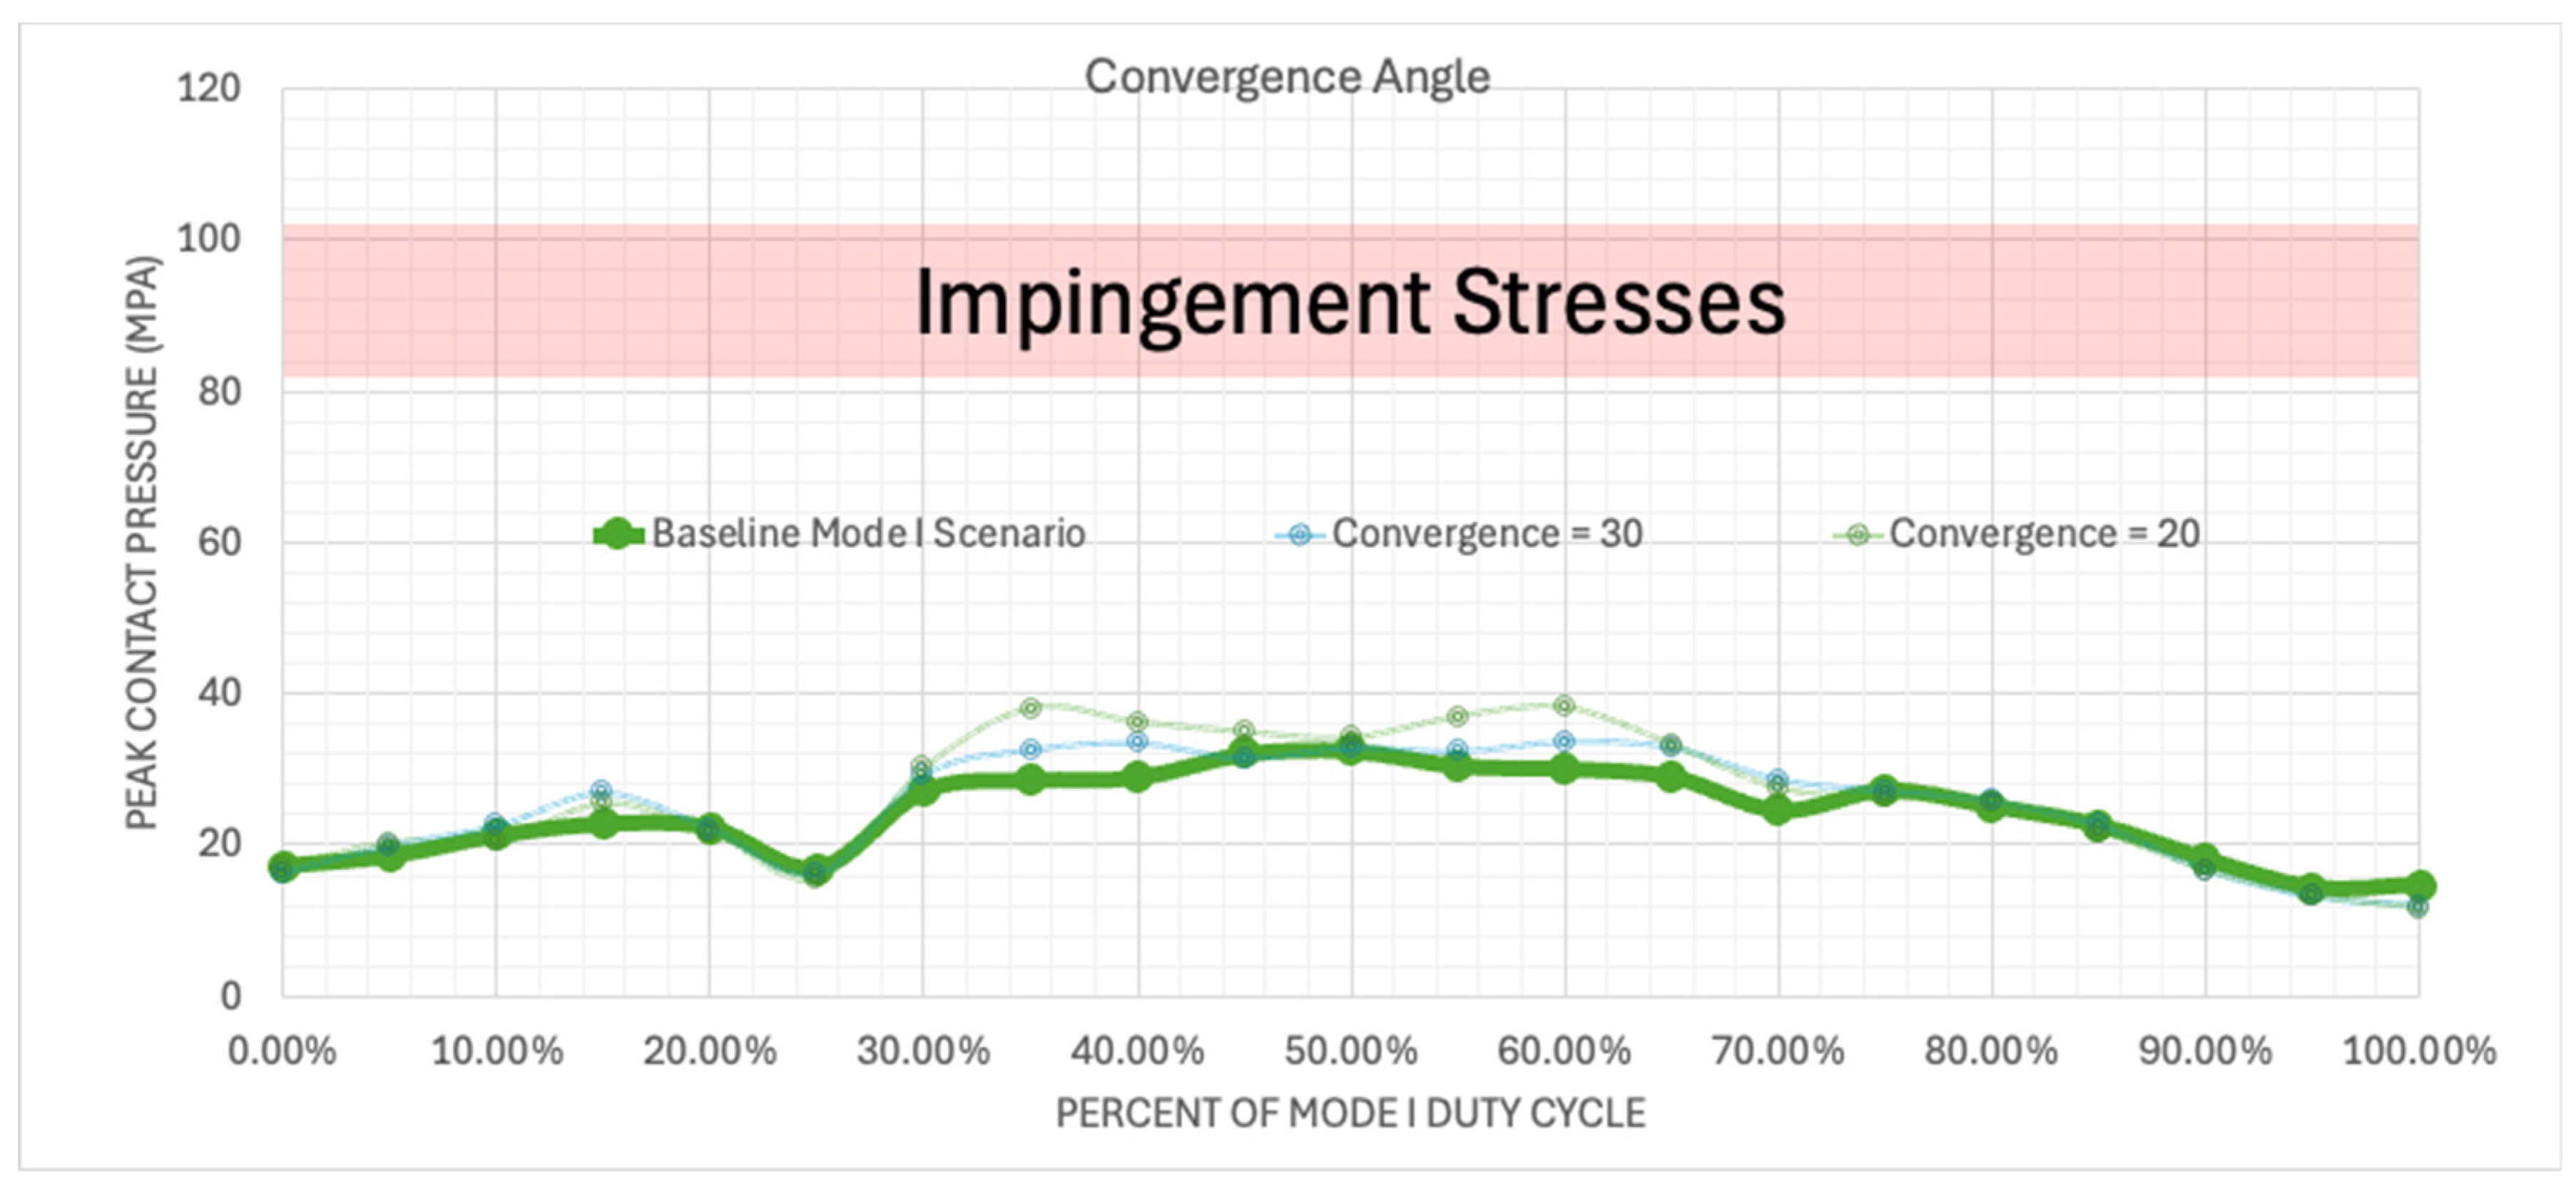
Figure 11.
Plotted peak contact stress values for the Mode I Duty Cycle for the baseline, 30°, and 20° convergence angle simulations.
Figure 11.
Plotted peak contact stress values for the Mode I Duty Cycle for the baseline, 30°, and 20° convergence angle simulations.
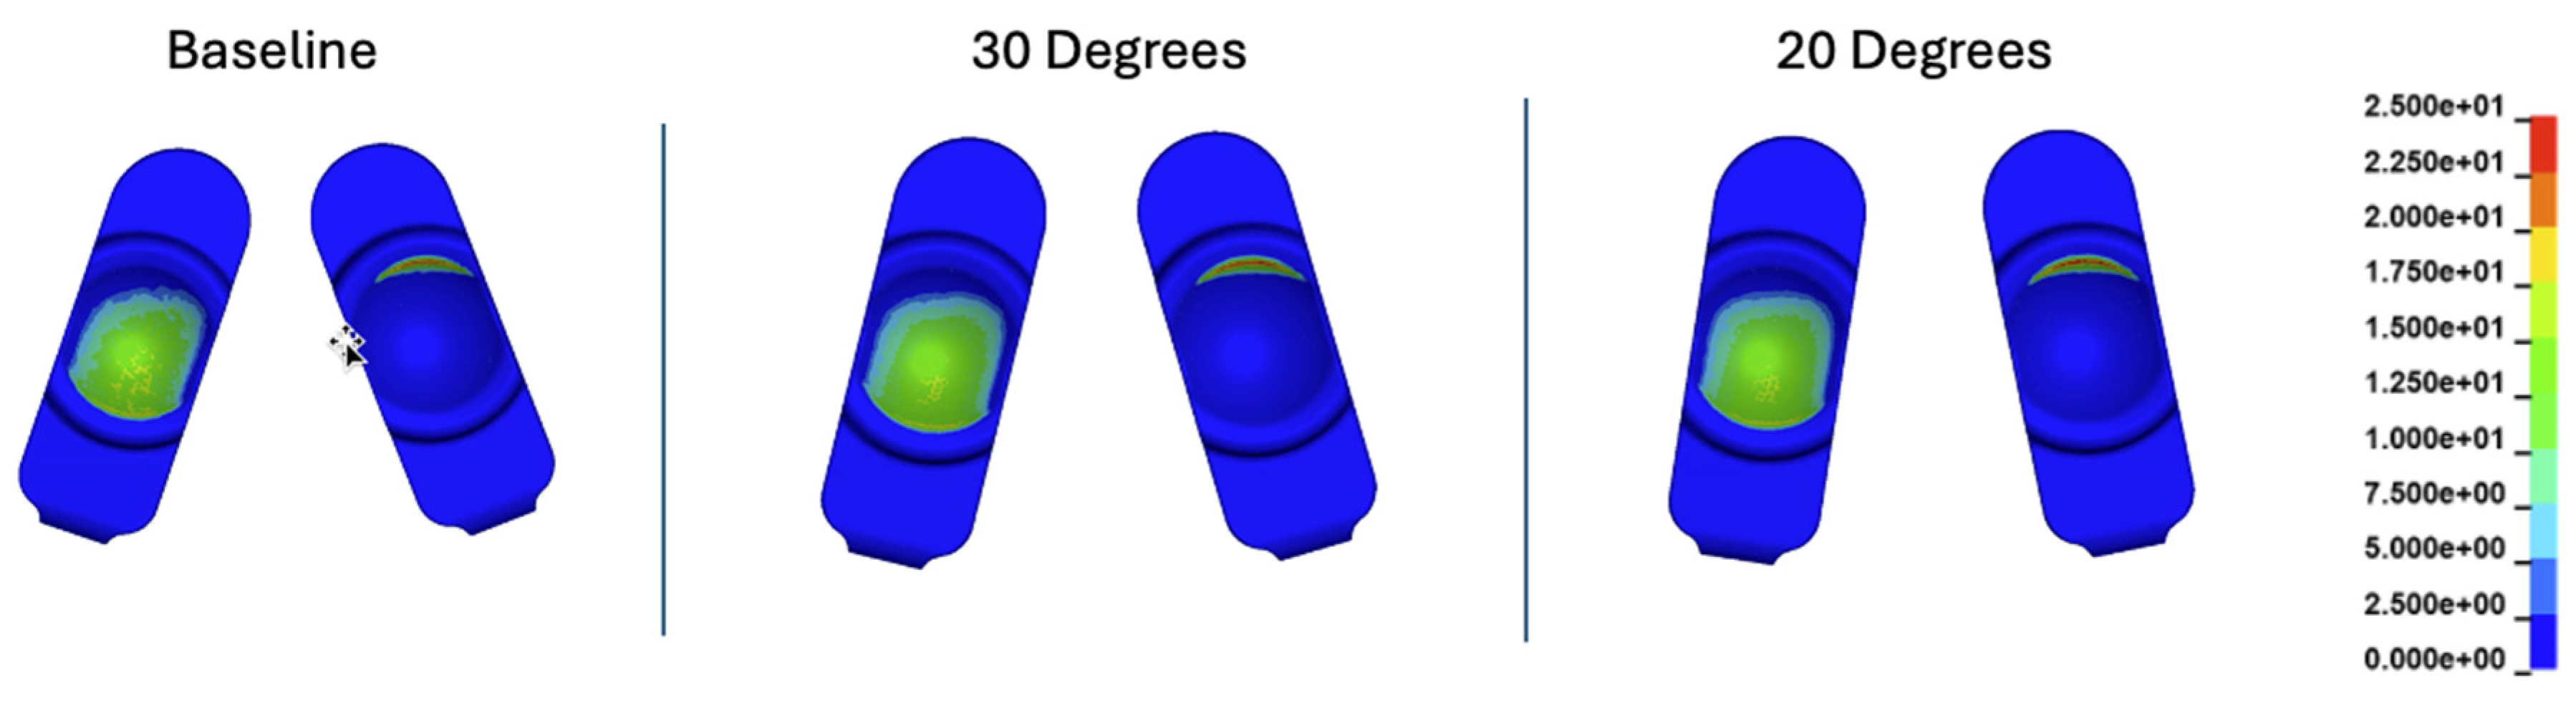
Figure 12.
Contour plots of contact stress (MPa) at 35% of the Mode I Duty Cycle for the baseline, 30 degree, and 20 degree convergence angle simulations.
Figure 12.
Contour plots of contact stress (MPa) at 35% of the Mode I Duty Cycle for the baseline, 30 degree, and 20 degree convergence angle simulations.
Figure 13.
Contour plots of contact stress (MPa) at 60% of the Mode I Duty Cycle for the baseline, 30 degree, and 20 degree convergence angle simulations.
Figure 13.
Contour plots of contact stress (MPa) at 60% of the Mode I Duty Cycle for the baseline, 30 degree, and 20 degree convergence angle simulations.
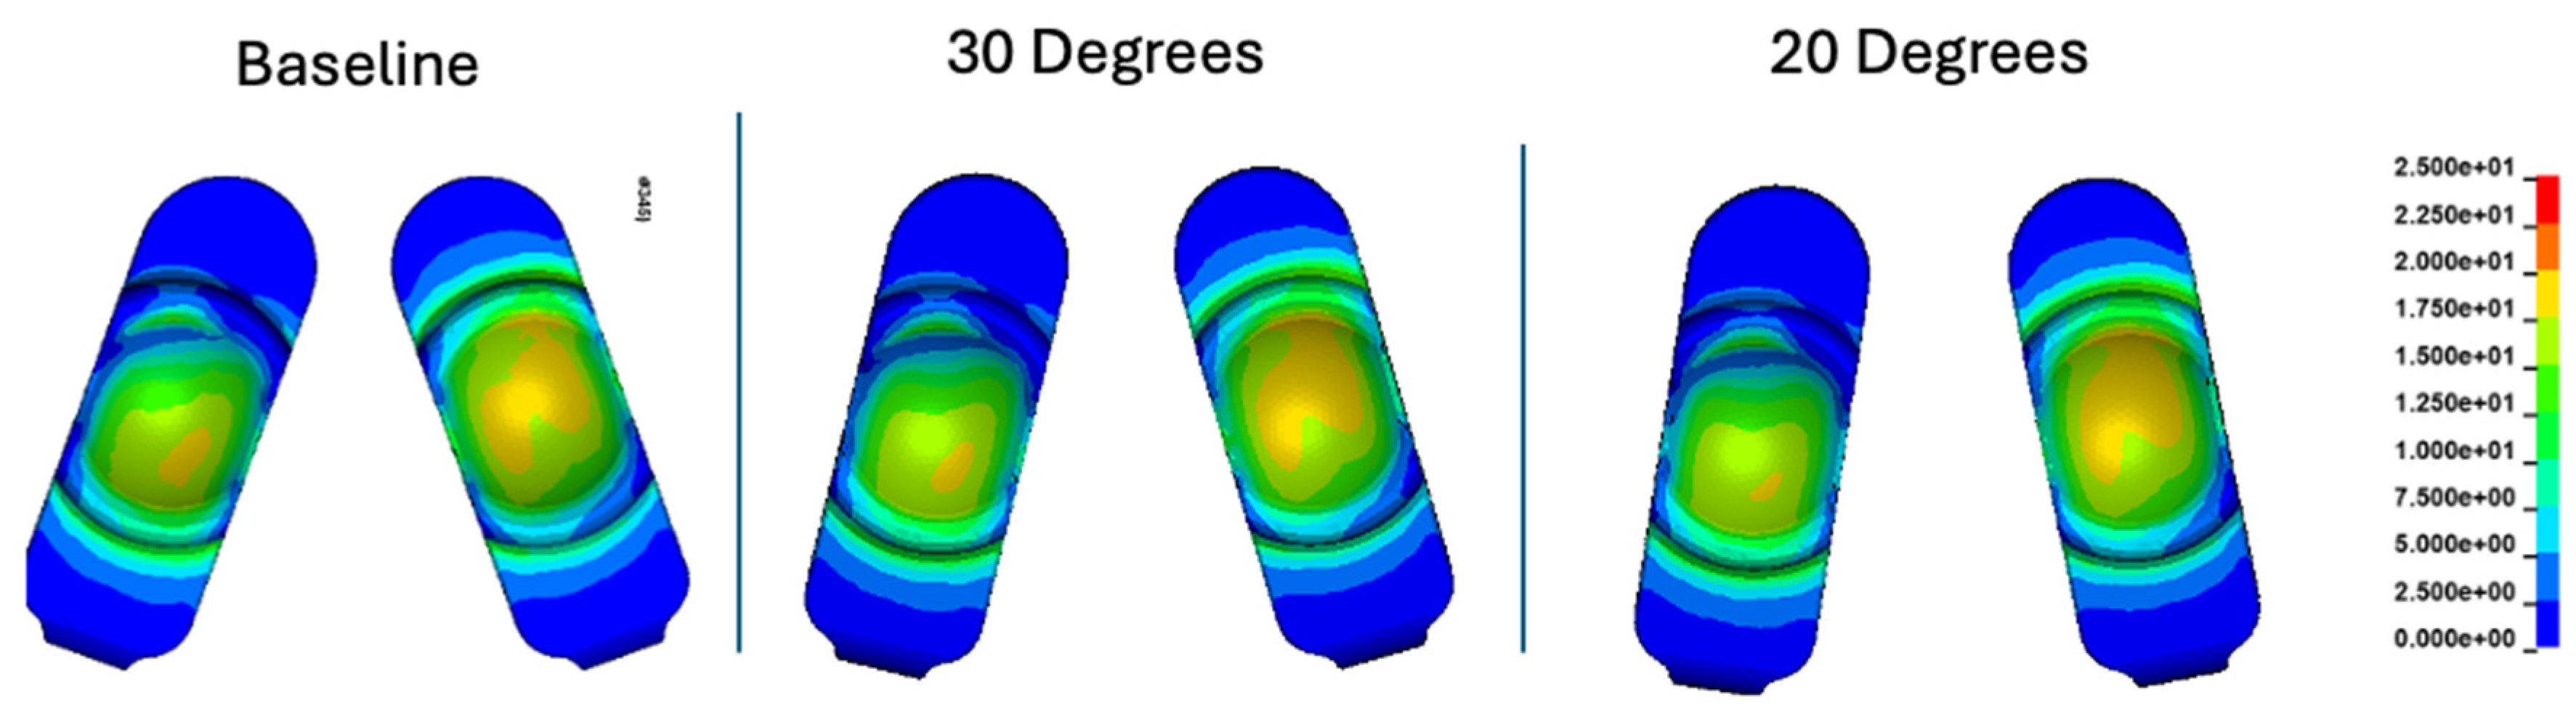
Figure 14.
Contours of cumulative Von Mises stress (MPa) for the baseline, 30°, and 20° convergence angle simulations.
Figure 14.
Contours of cumulative Von Mises stress (MPa) for the baseline, 30°, and 20° convergence angle simulations.
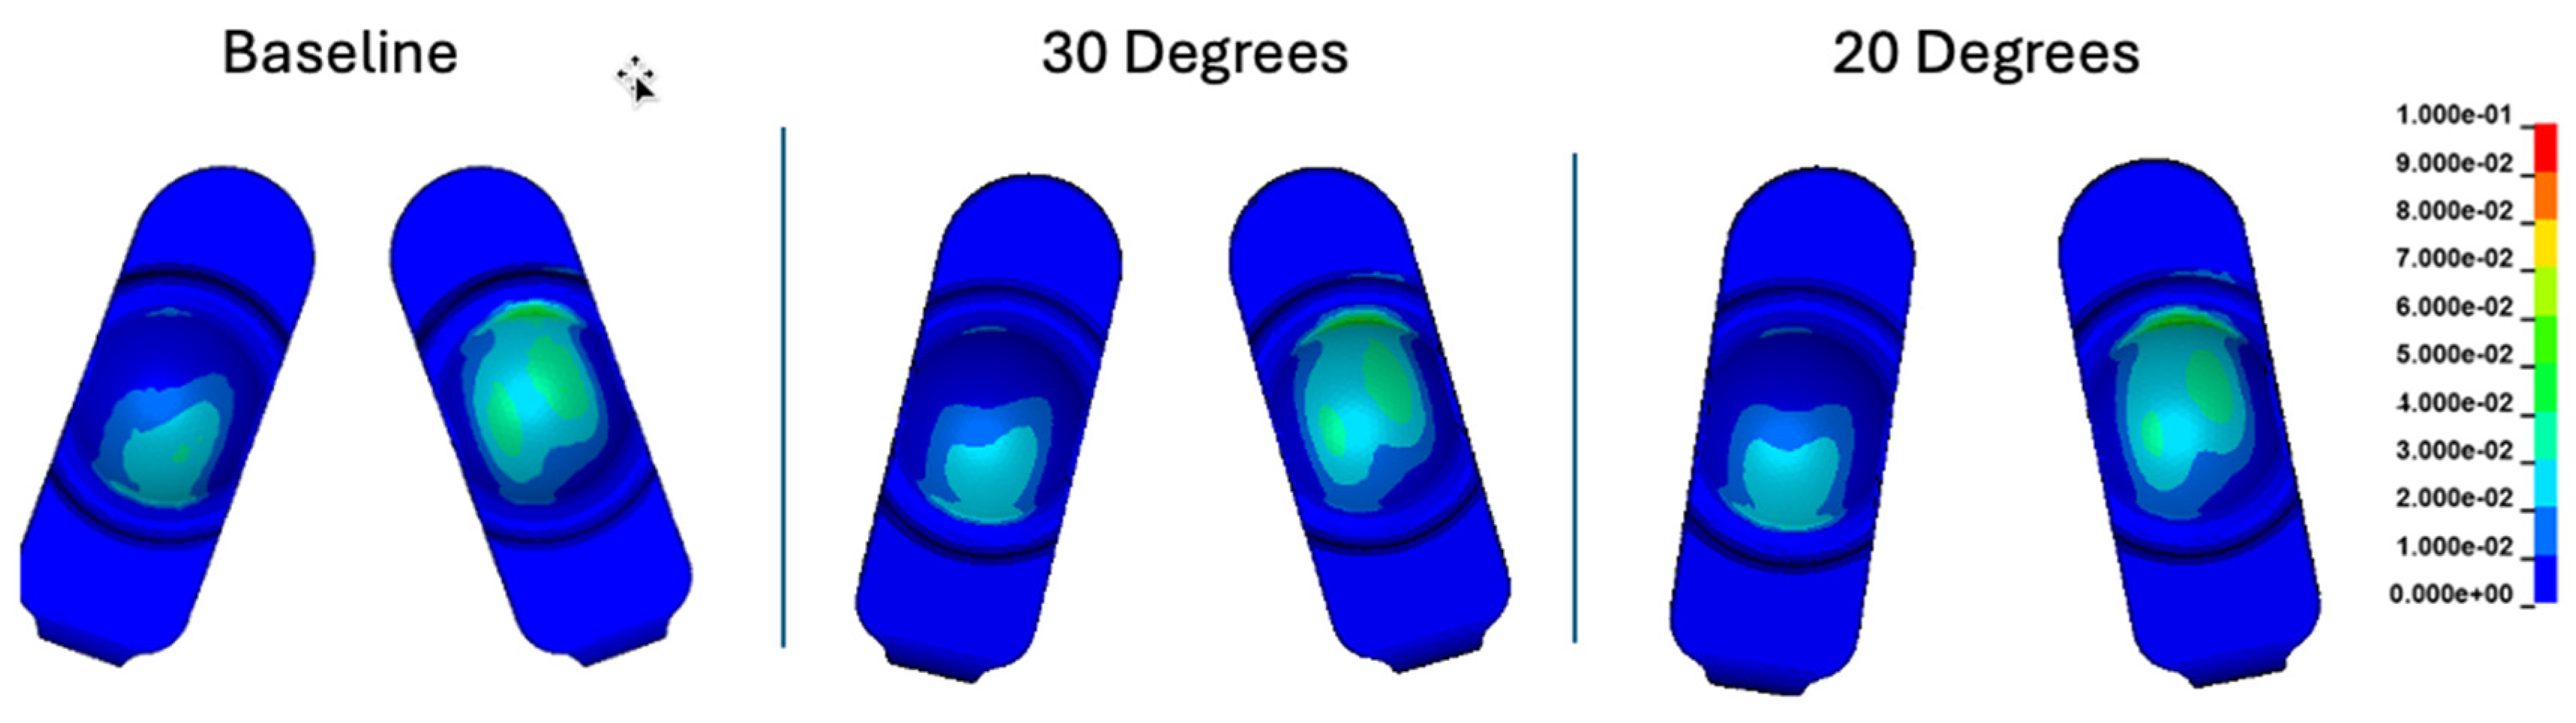
Figure 15.
Contours of cumulative effective strain for the baseline, 30°, and 20° convergence angle simulations.
Figure 15.
Contours of cumulative effective strain for the baseline, 30°, and 20° convergence angle simulations.
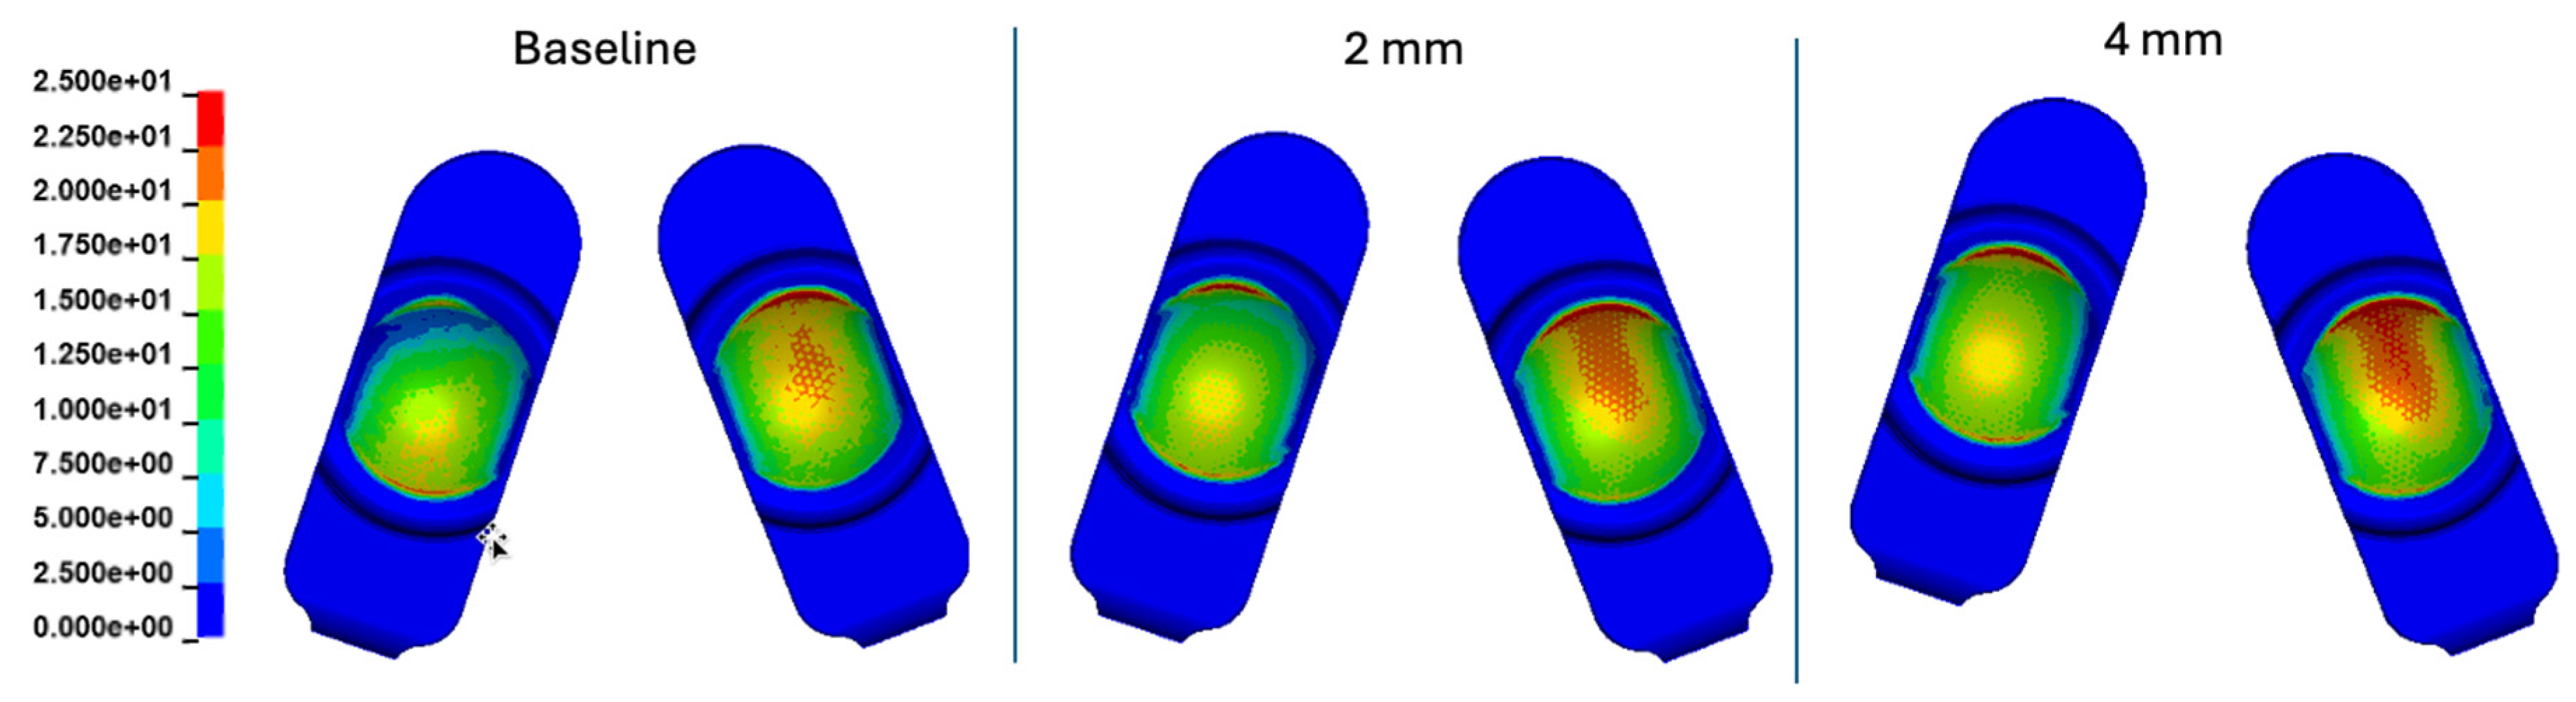
Figure 16.
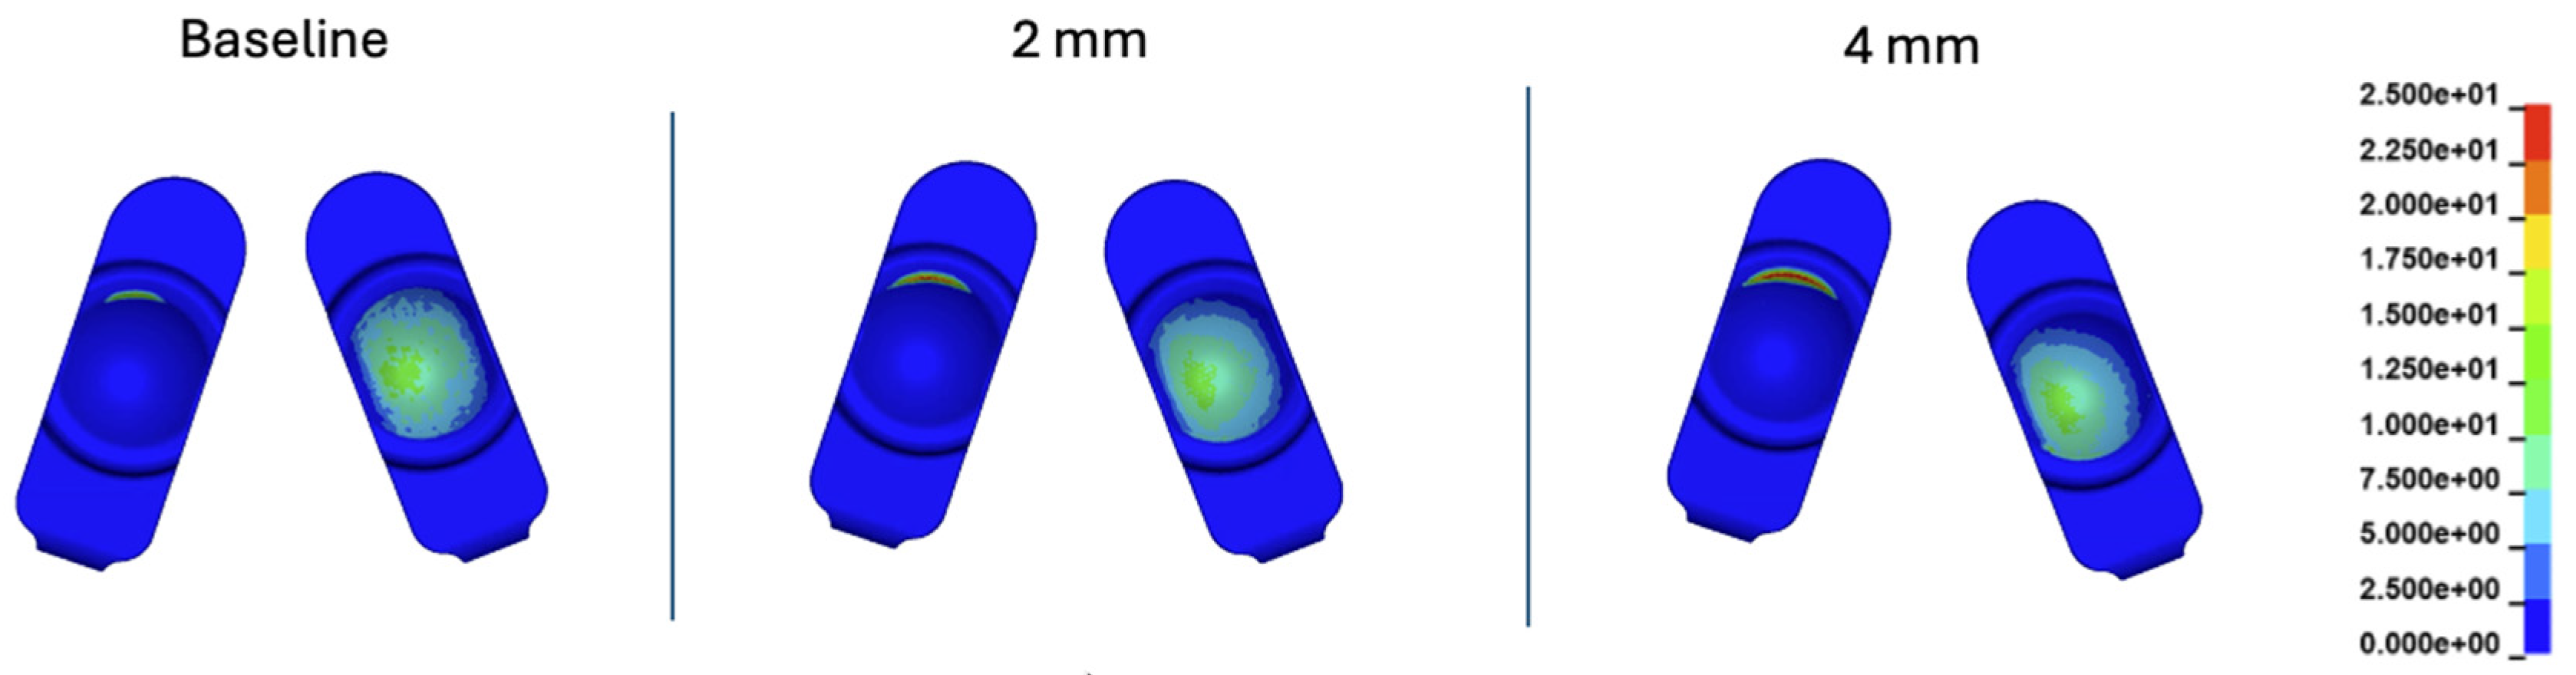
Contour plots of contact pressure cumulatively over the Mode I Duty Cycle for the 2 mm A-P offset, and 4 mm A-P offset simulations.
Figure 16.
Contour plots of contact pressure cumulatively over the Mode I Duty Cycle for the 2 mm A-P offset, and 4 mm A-P offset simulations.
Figure 17.
Plotted peak contact pressure values for the Mode I Duty Cycle for the 2 mm A-P offset, and 4 mm A-P offset simulations.
Figure 17.
Plotted peak contact pressure values for the Mode I Duty Cycle for the 2 mm A-P offset, and 4 mm A-P offset simulations.
Figure 18.
Contour plots of contact pressure at 10% of the Mode I Duty Cycle for the 2 mm A-P offset, and 4 mm A-P offset simulations.
Figure 18.
Contour plots of contact pressure at 10% of the Mode I Duty Cycle for the 2 mm A-P offset, and 4 mm A-P offset simulations.
Figure 19.
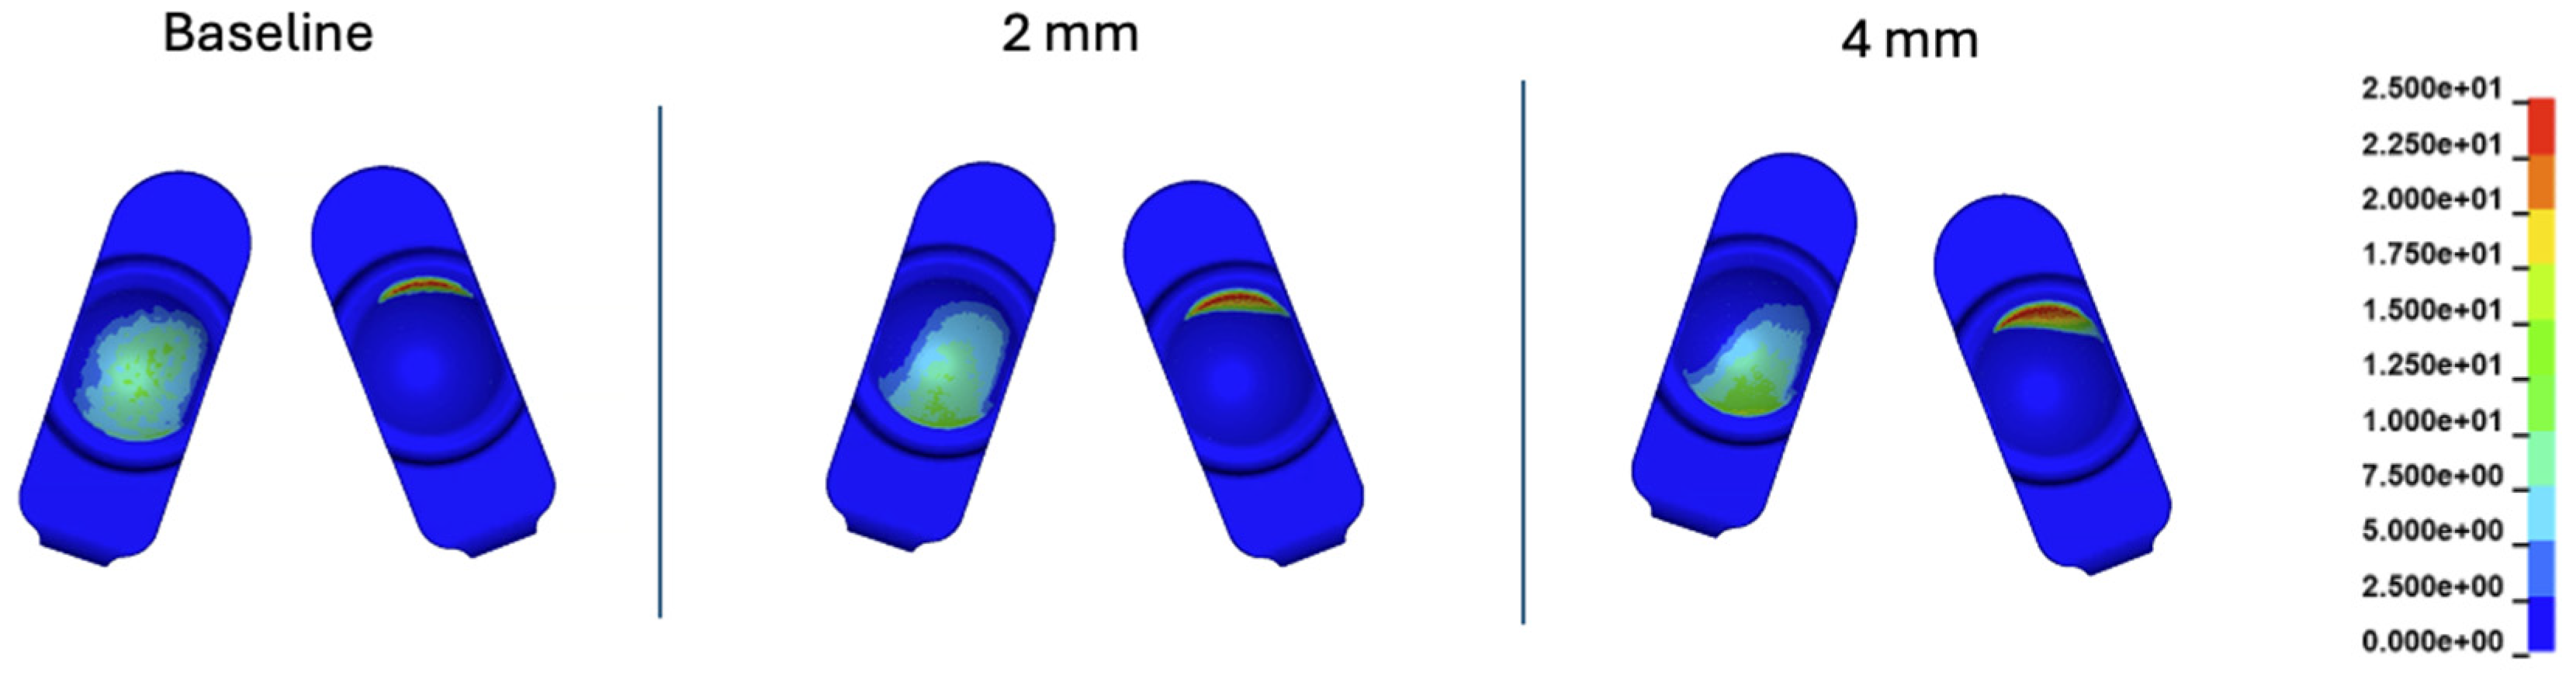
Contour plots of contact pressure at 60% of the Mode I Duty Cycle for the 2 mm A-P offset, and 4 mm A-P offset simulations.
Figure 19.
Contour plots of contact pressure at 60% of the Mode I Duty Cycle for the 2 mm A-P offset, and 4 mm A-P offset simulations.
Figure 20.
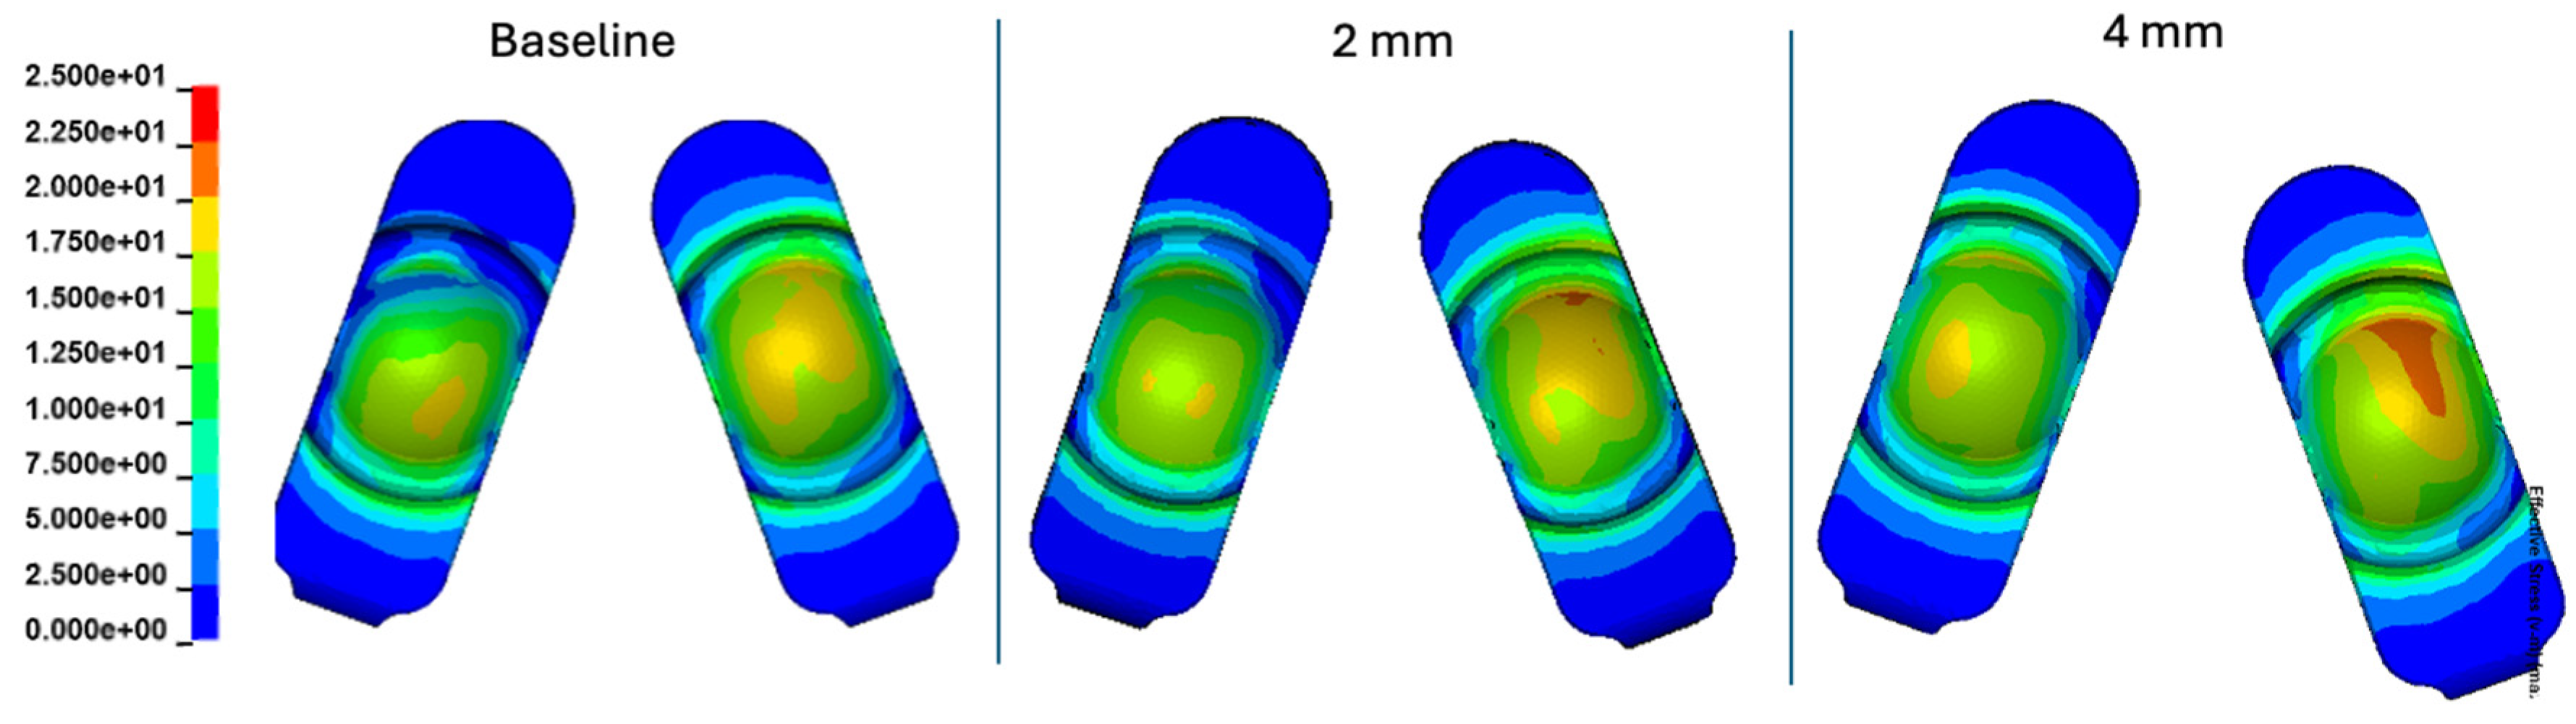
Contours of cumulative Von Mises stress for the 2 mm A-P offset, and 4 mm A-P offset simulations.
Figure 20.
Contours of cumulative Von Mises stress for the 2 mm A-P offset, and 4 mm A-P offset simulations.
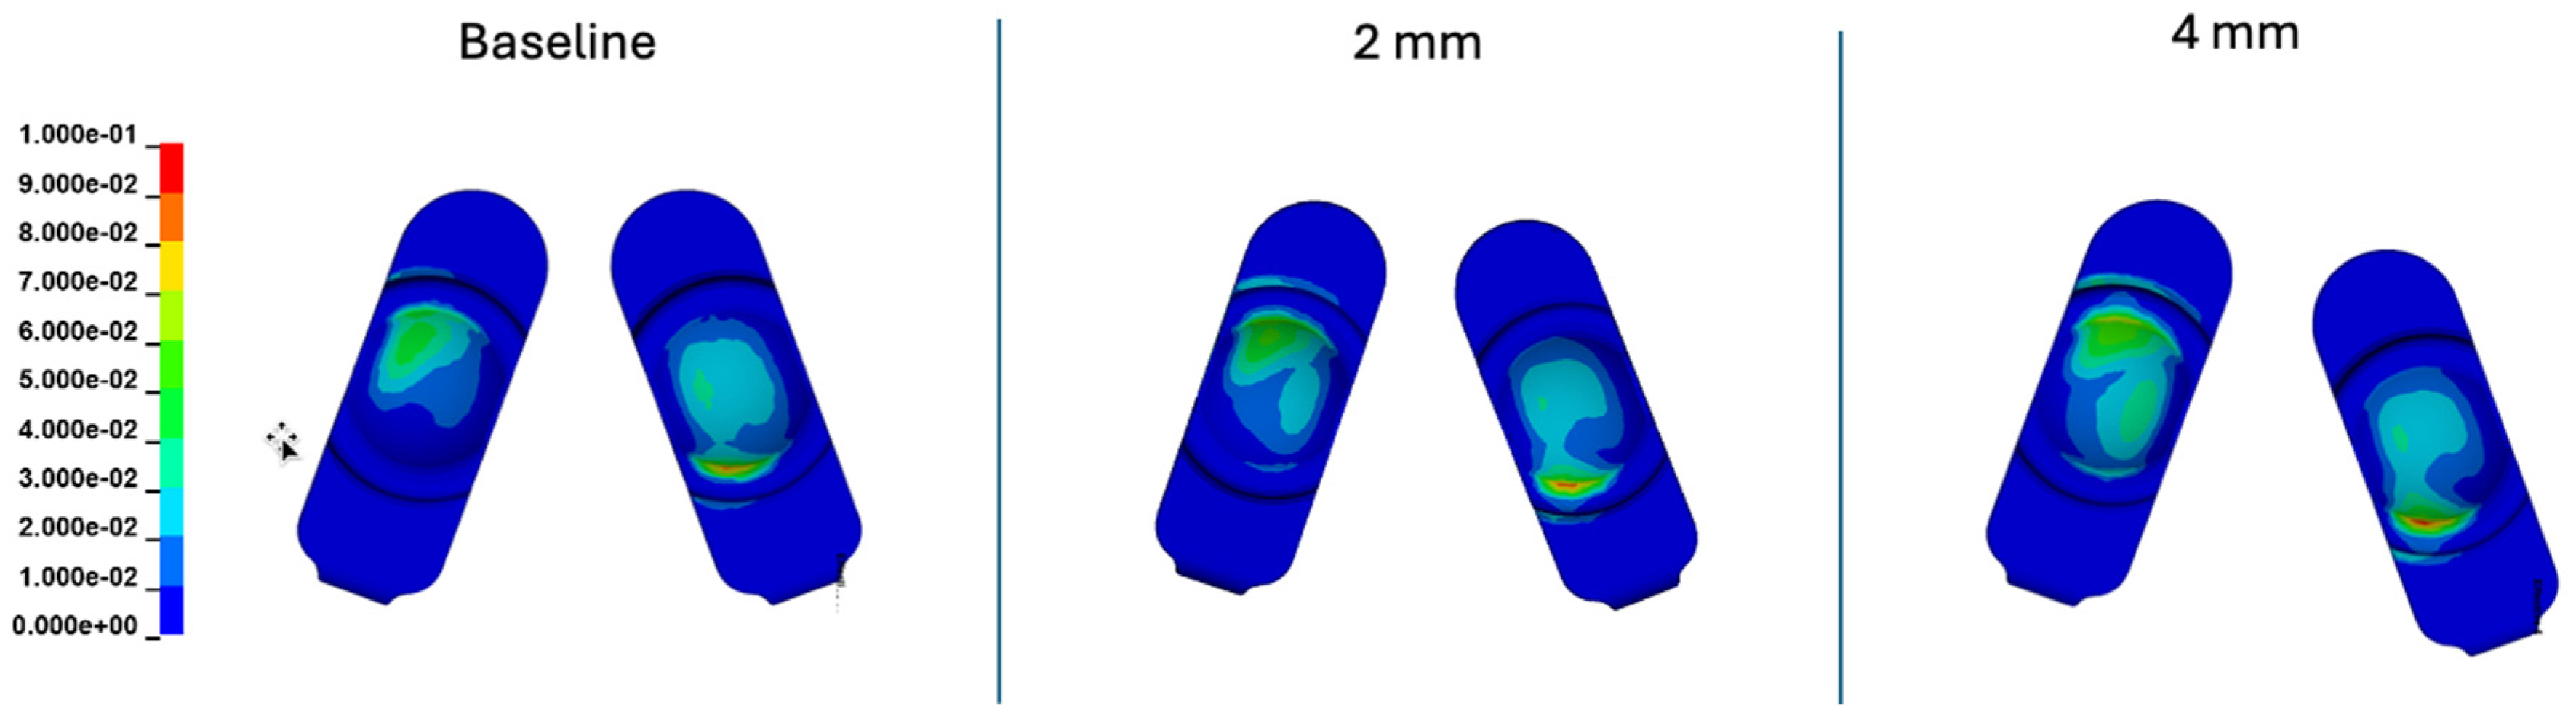
Figure 21.
Contours of cumulative effective strain for the 2 mm A-P offset, and 4 mm A-P offset simulations.
Figure 21.
Contours of cumulative effective strain for the 2 mm A-P offset, and 4 mm A-P offset simulations.
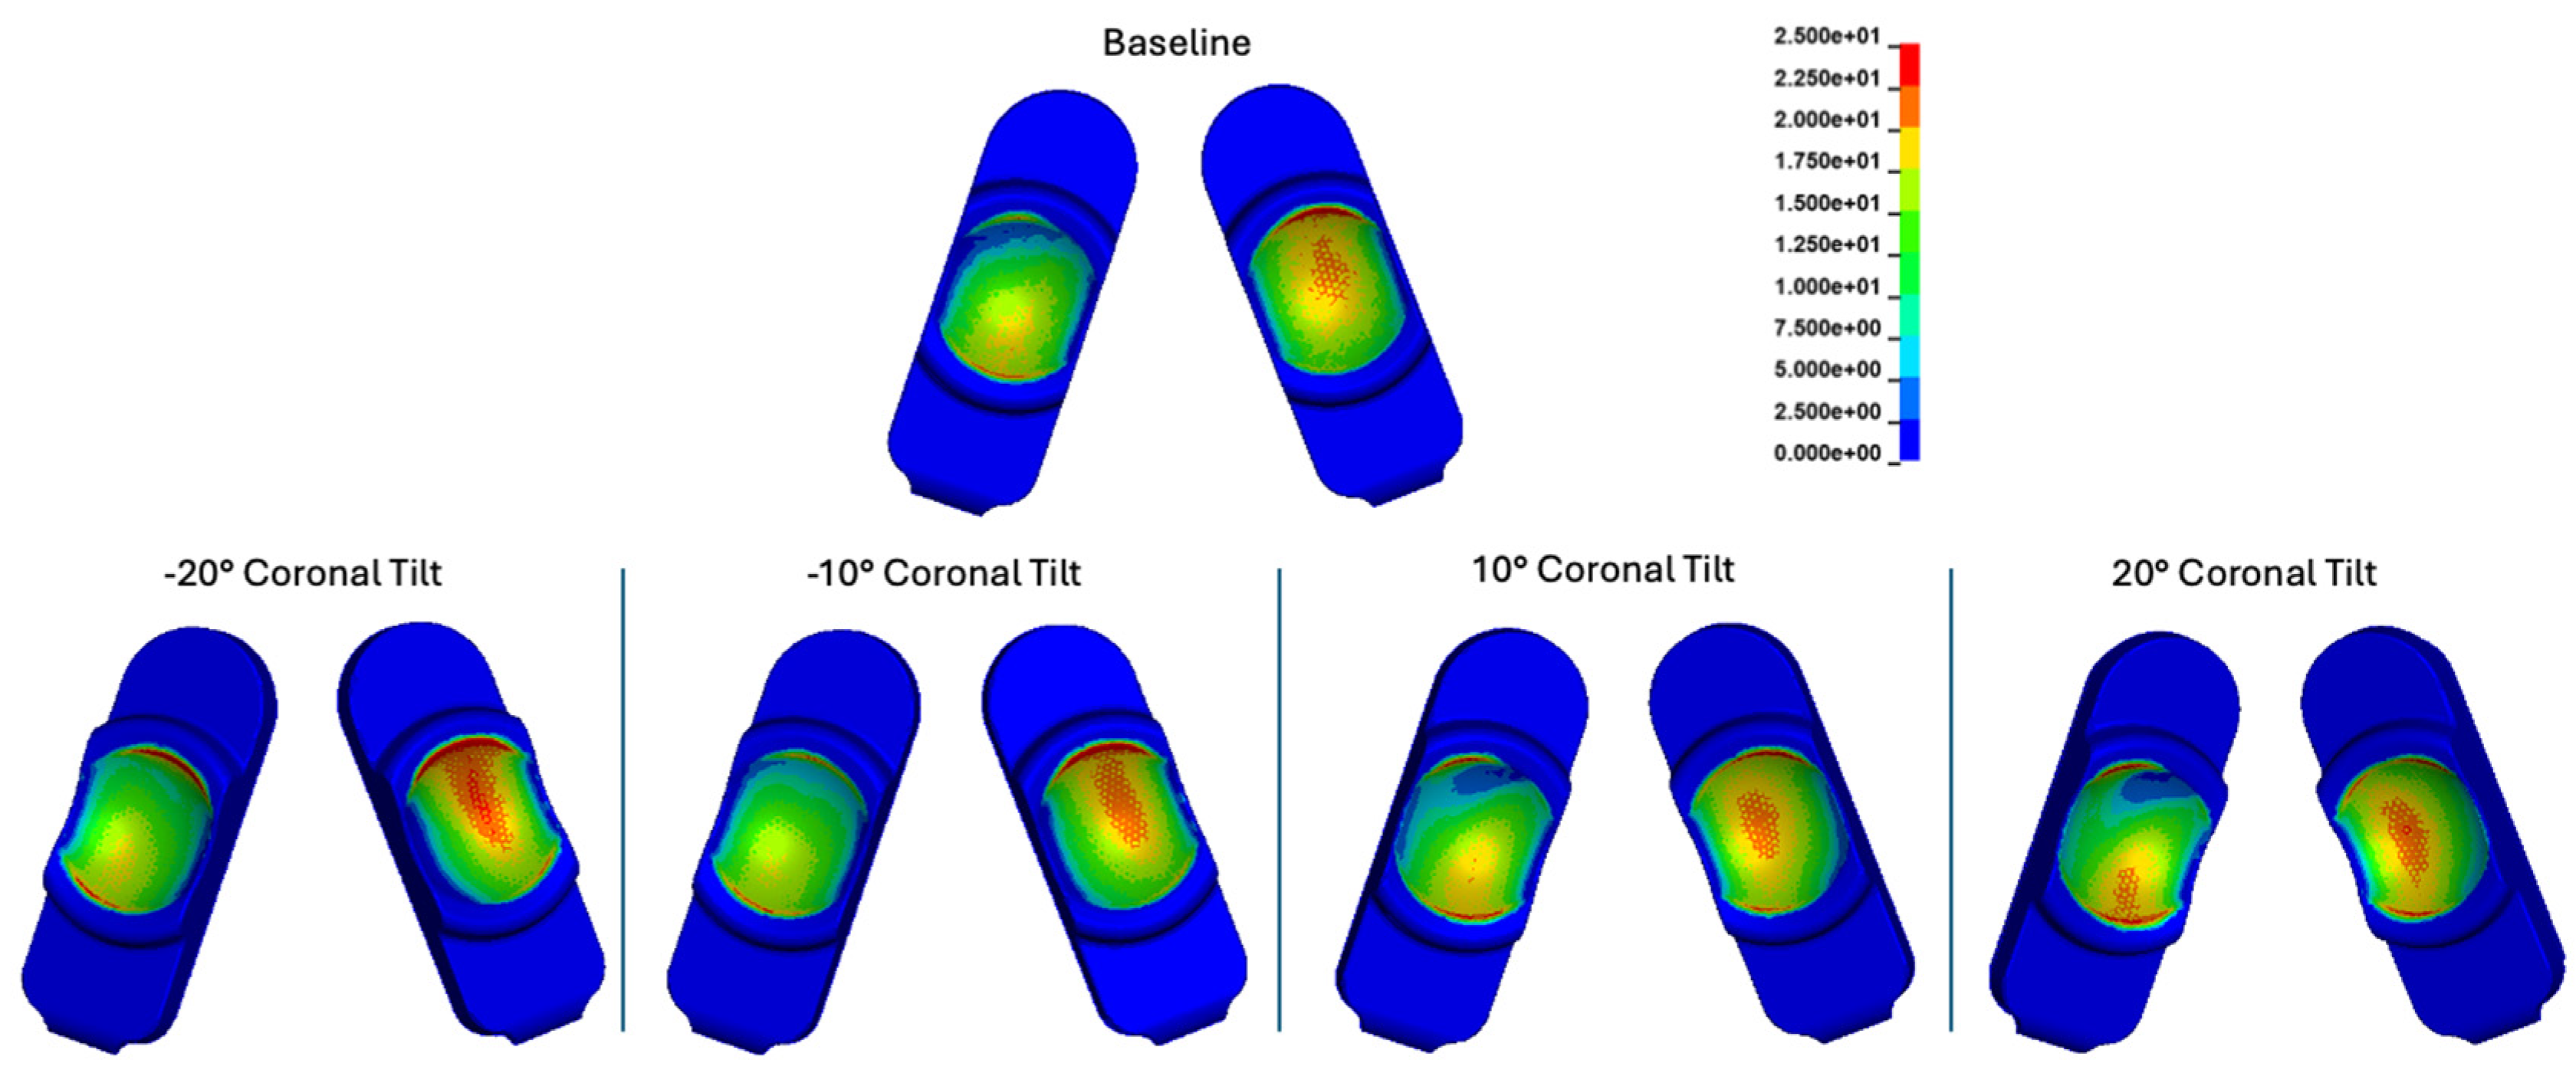
Figure 22.
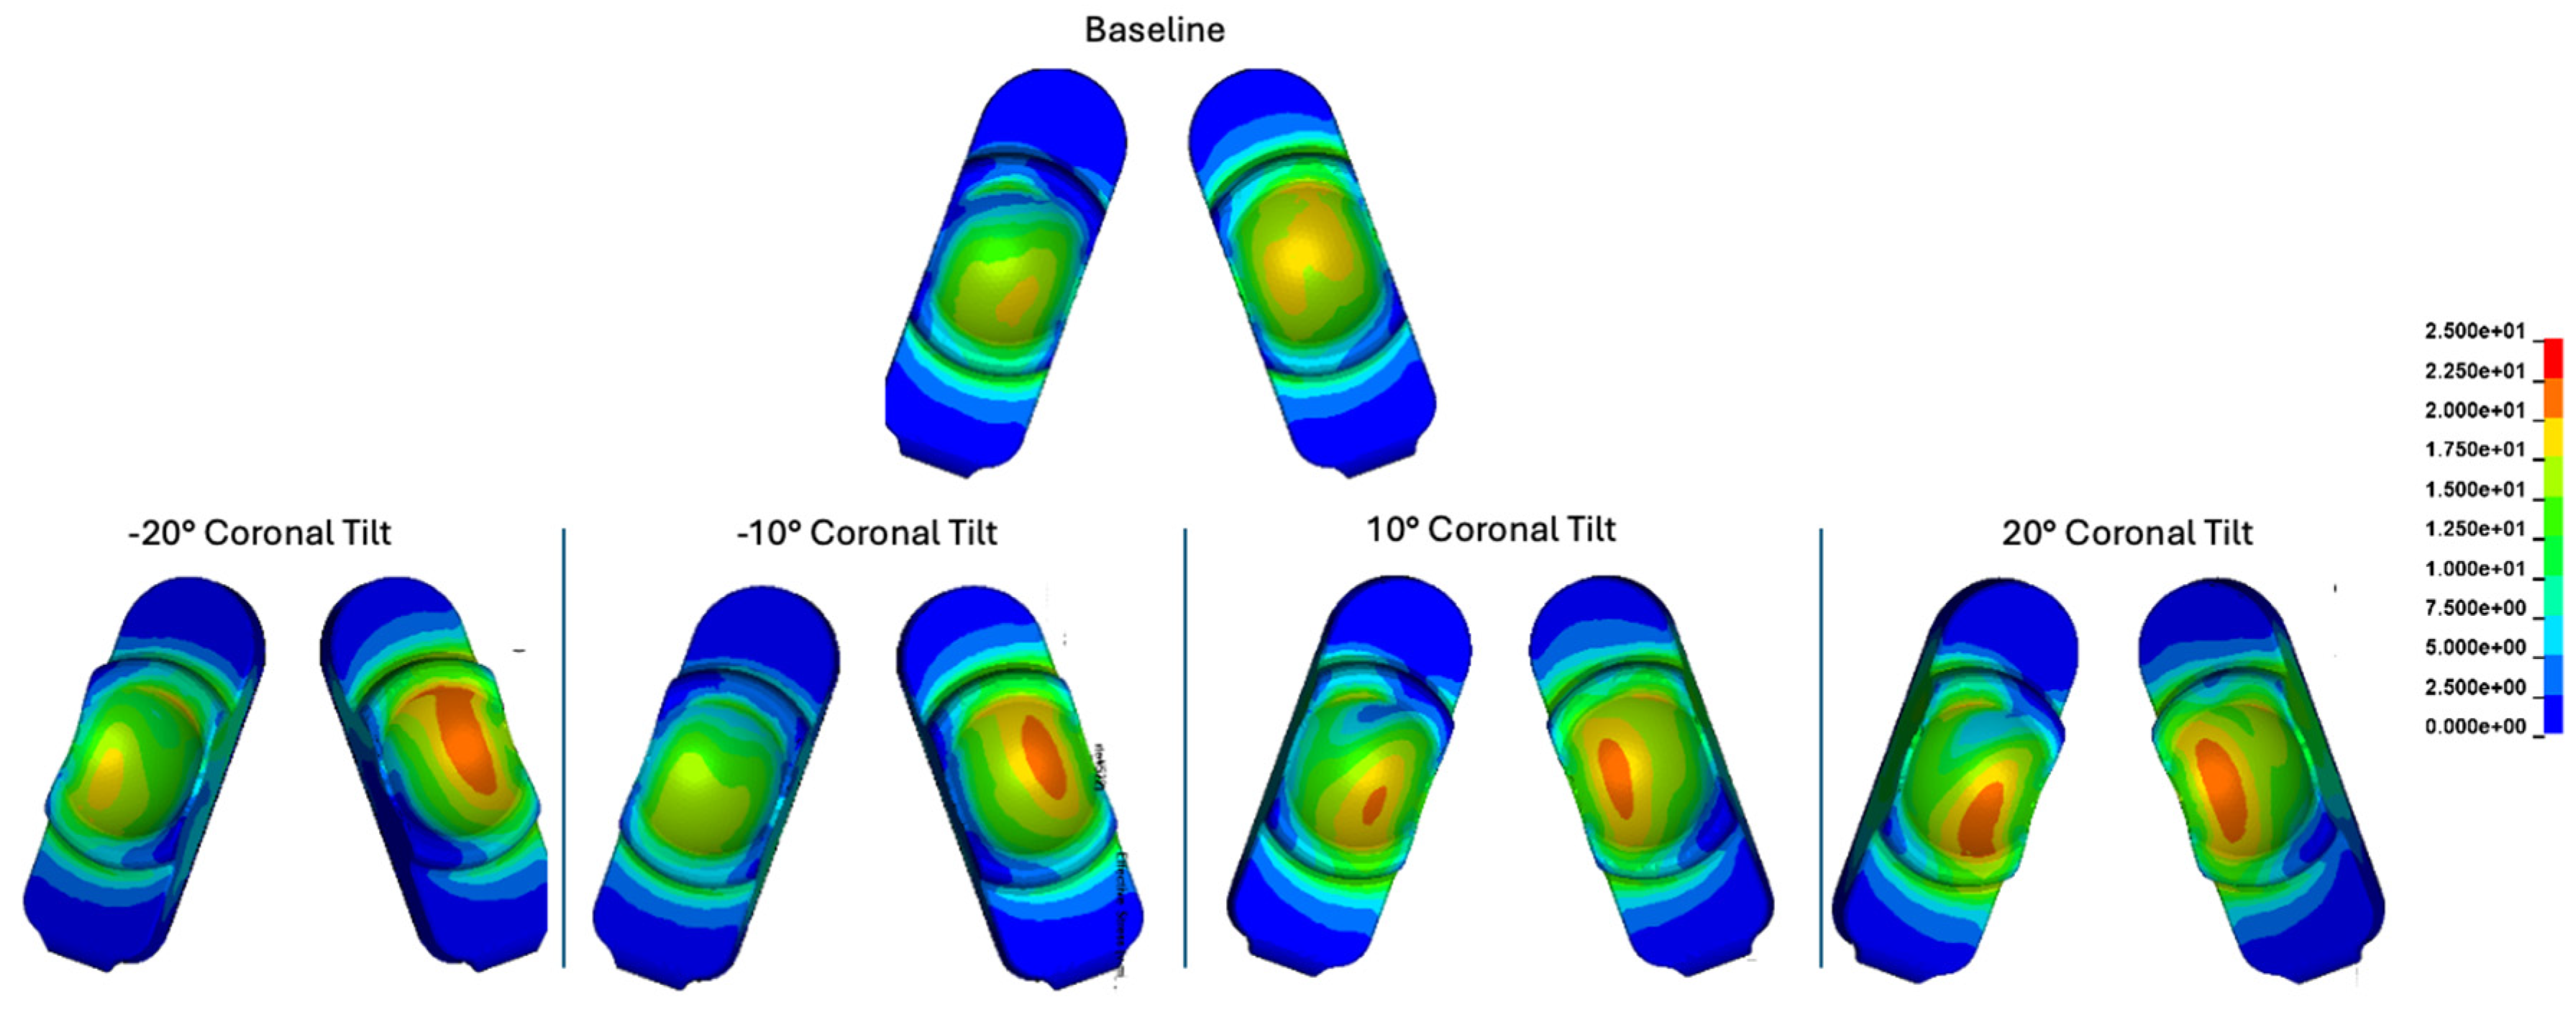
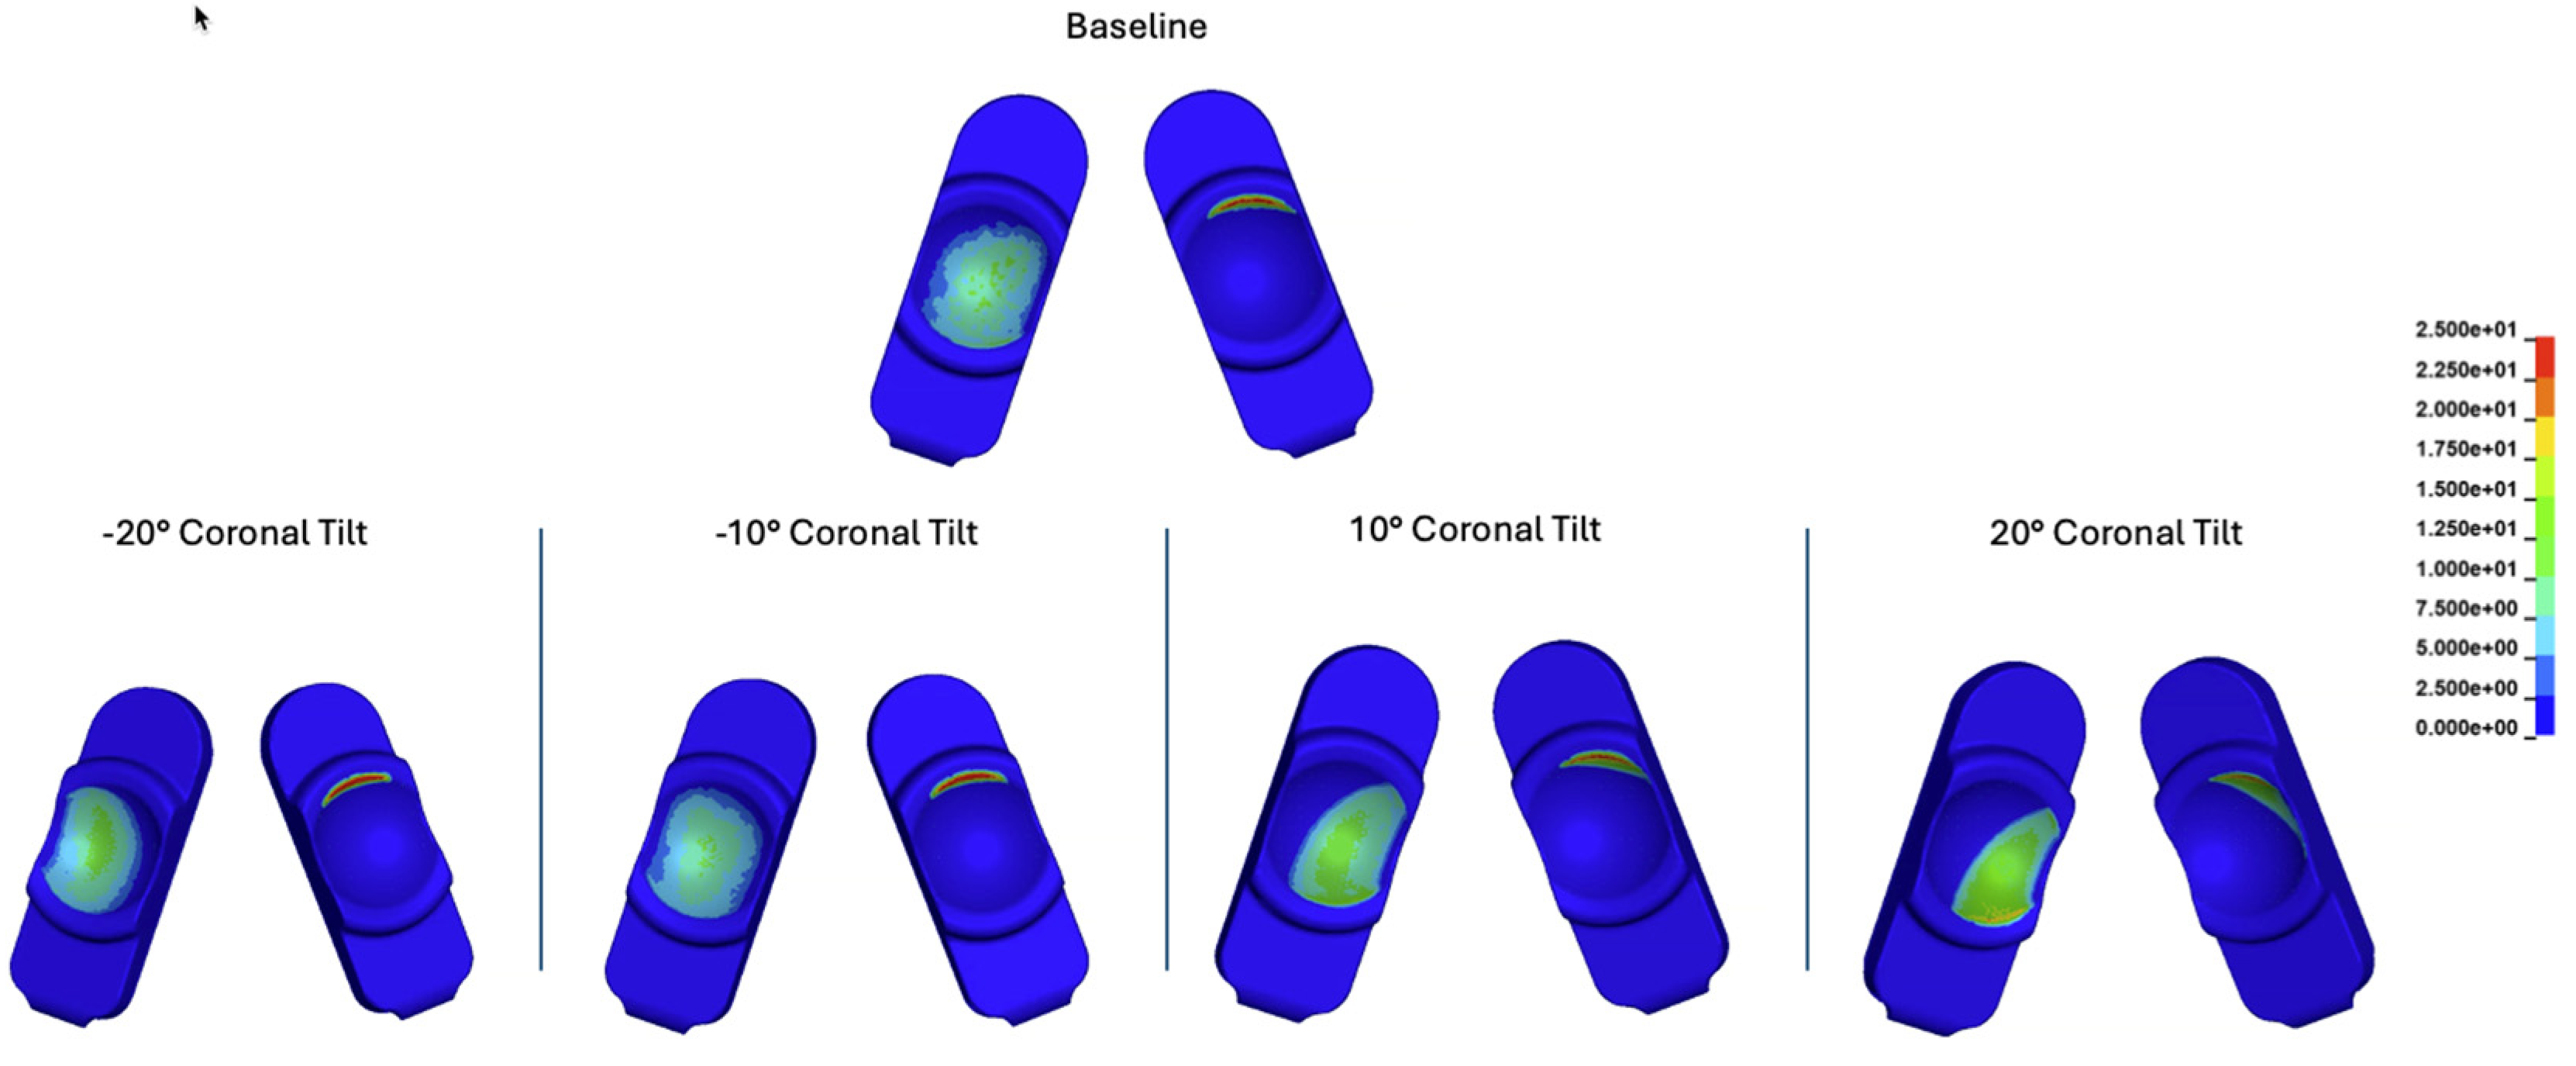
Contour plots of contact stress cumulatively and over the Mode I Duty Cycle for the baseline, -20°, -10°, 10°, and 20° of coronal tilt simulations.
Figure 22.
Contour plots of contact stress cumulatively and over the Mode I Duty Cycle for the baseline, -20°, -10°, 10°, and 20° of coronal tilt simulations.
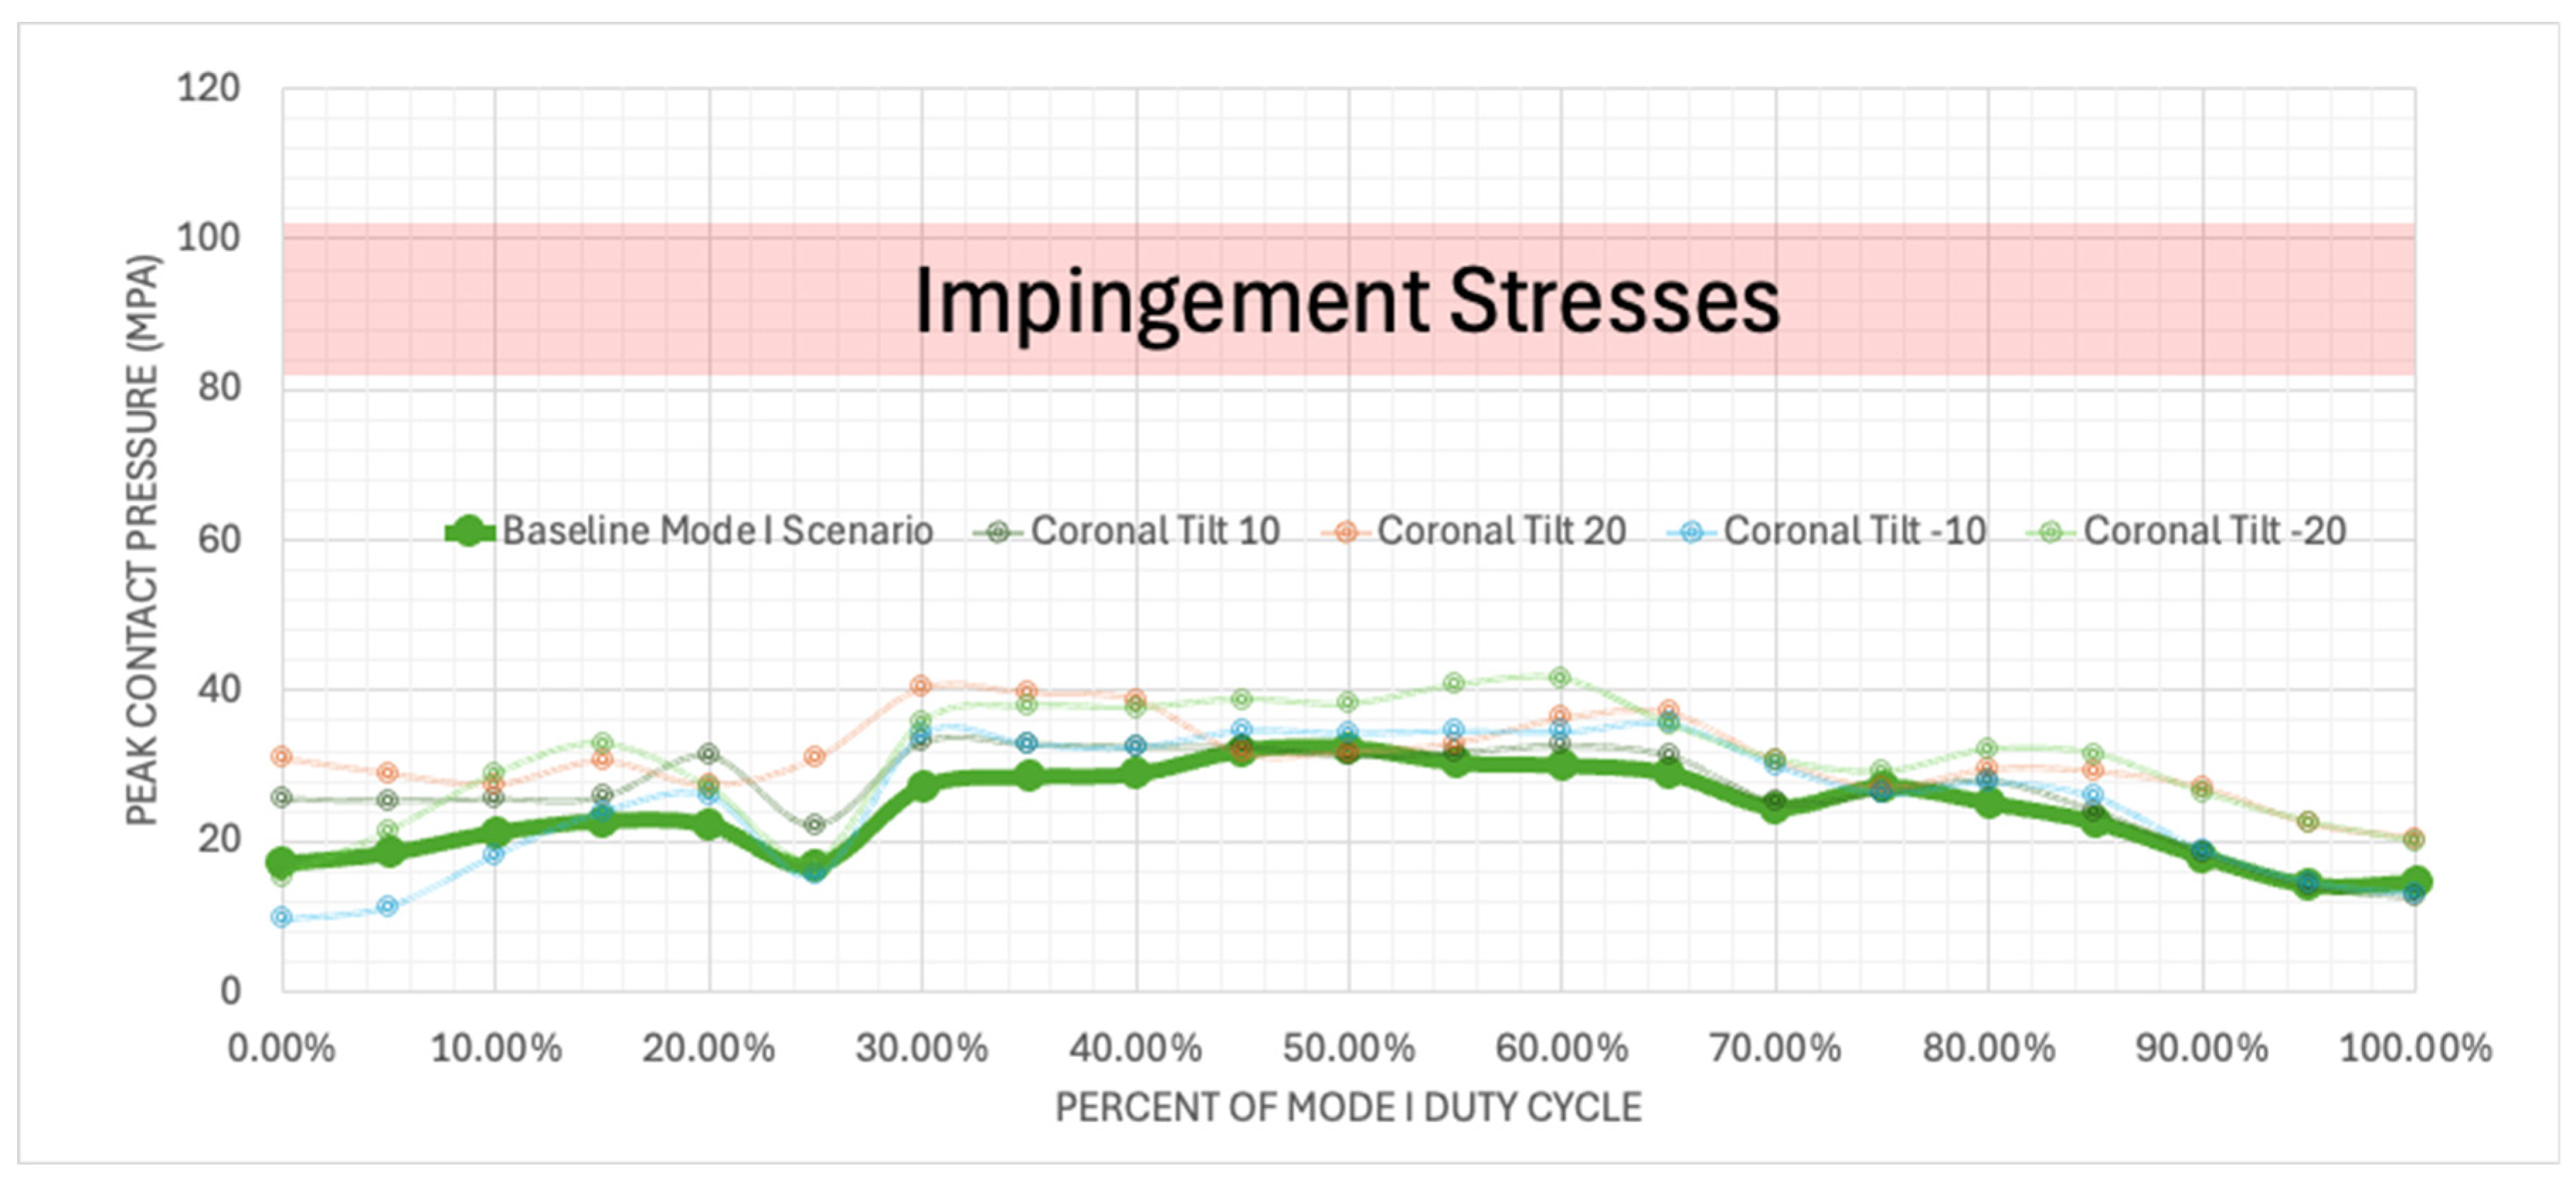
Figure 23.
Plotted peak contact stress values for the Mode I Duty Cycle for the baseline, -20°, -10°, 10°, and 20° of coronal tilt simulations.
Figure 23.
Plotted peak contact stress values for the Mode I Duty Cycle for the baseline, -20°, -10°, 10°, and 20° of coronal tilt simulations.
Figure 24.
Contour plots of contact stress at 30% of the Mode I Duty Cycle for the baseline, -20 degrees, -10 degrees, 10 degrees, and 20 degrees of coronal tilt simulations.
Figure 24.
Contour plots of contact stress at 30% of the Mode I Duty Cycle for the baseline, -20 degrees, -10 degrees, 10 degrees, and 20 degrees of coronal tilt simulations.
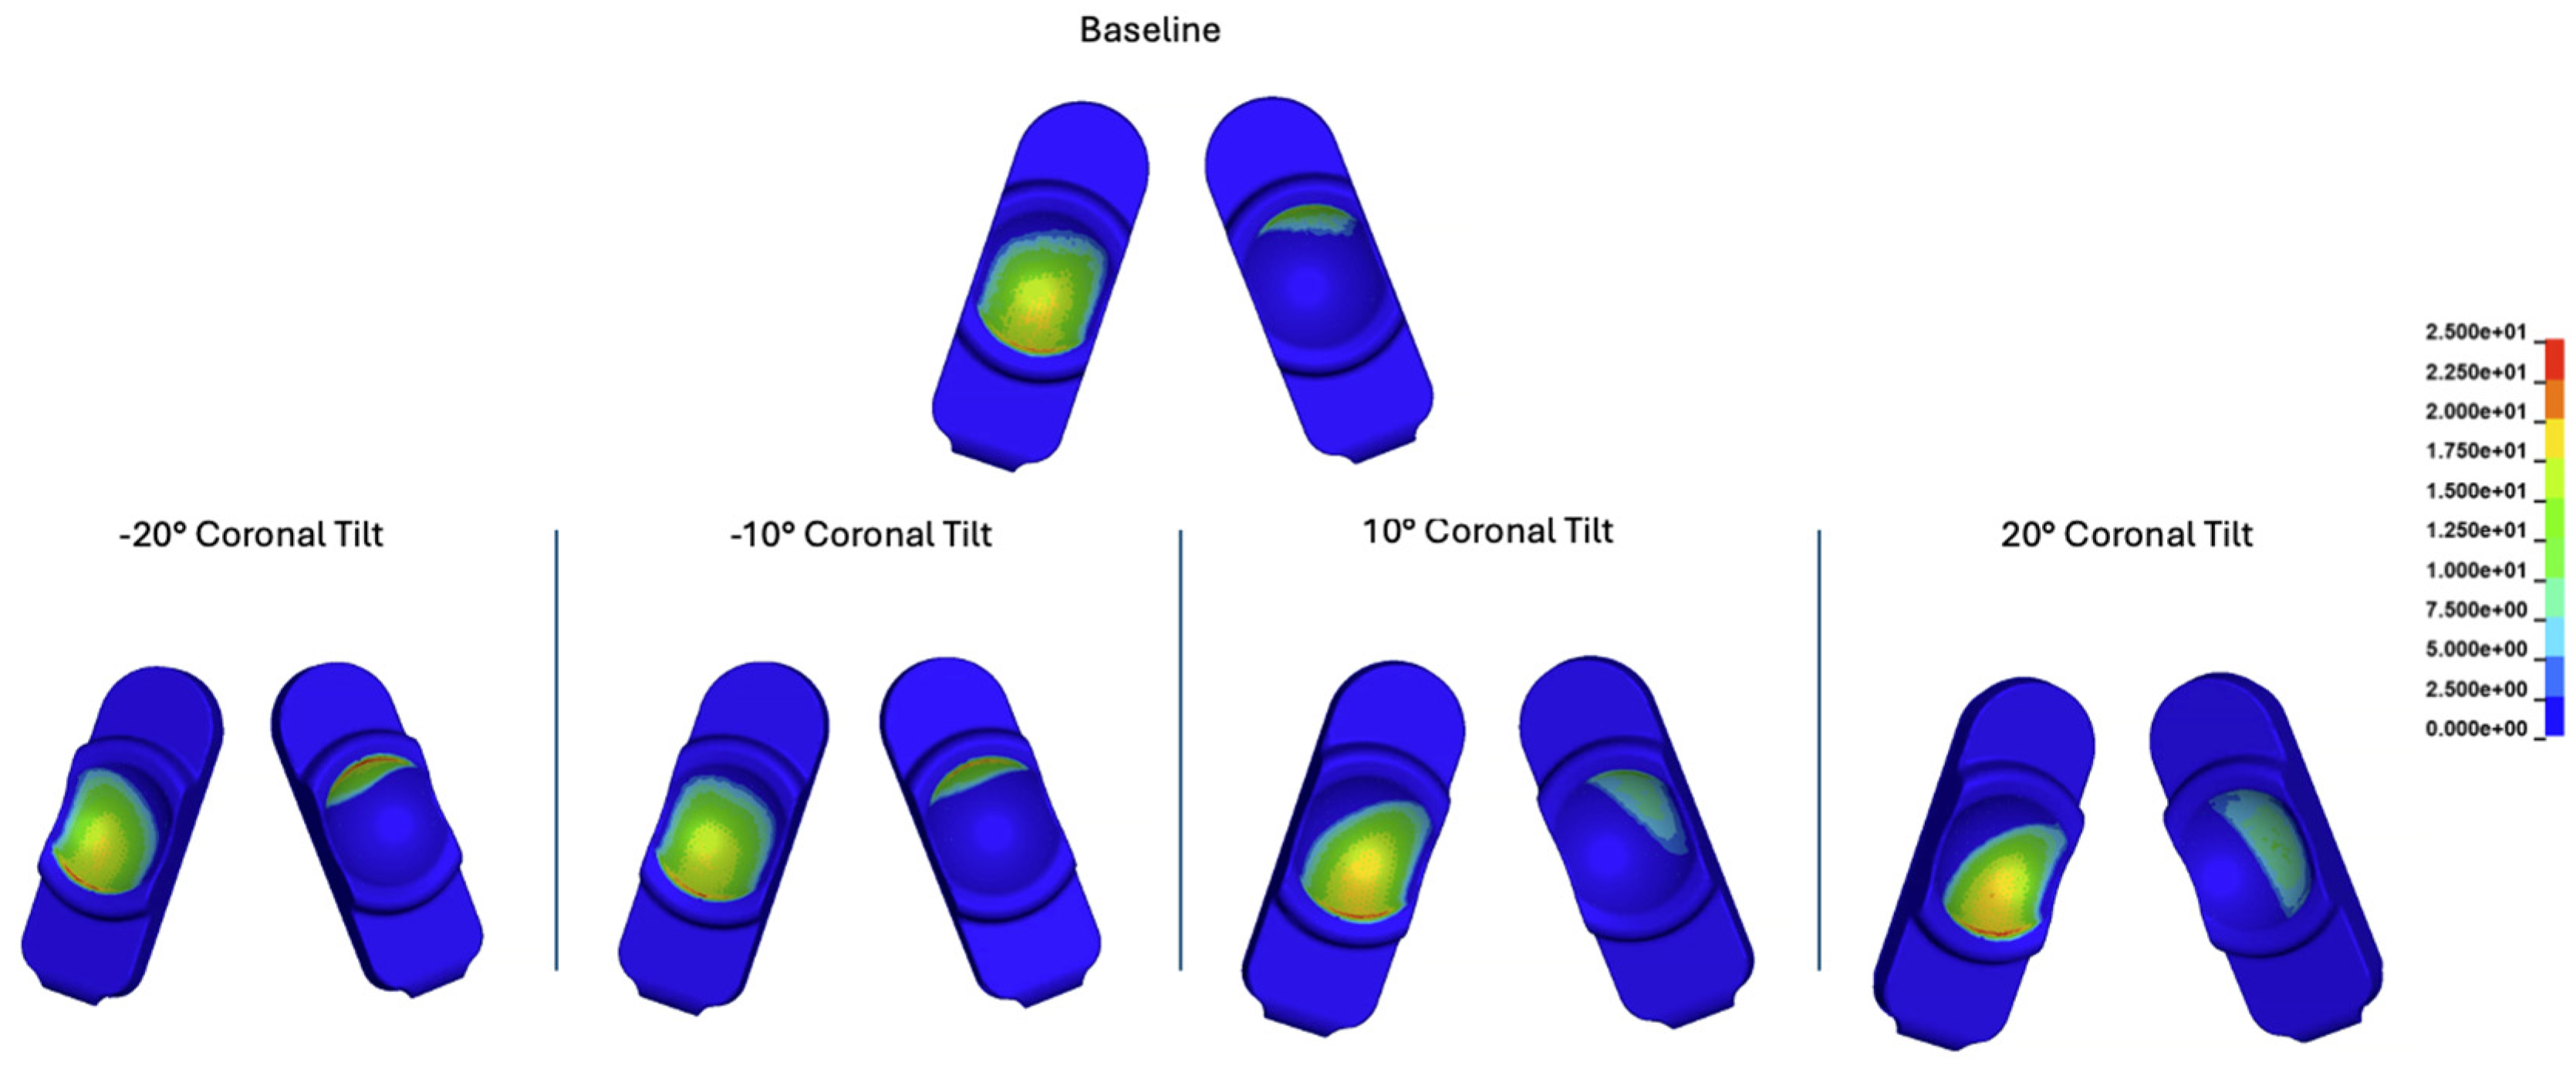
Figure 25.
Contour plots of contact stress at 60% of the Mode I Duty Cycle for the baseline, -20 degrees, -10 degrees, 10 degrees, and 20 degrees of coronal tilt simulations.
Figure 25.
Contour plots of contact stress at 60% of the Mode I Duty Cycle for the baseline, -20 degrees, -10 degrees, 10 degrees, and 20 degrees of coronal tilt simulations.
Table 1.
Material properties used in the finite element model [
19,
20].
Table 1.
Material properties used in the finite element model [
19,
20].
| Component |
Material |
Elastic Modulus
(GPa)
|
Poisson’s Ratio |
Yield Strength (MPa) |
| Endplates |
CoCr |
210 |
0.3 |
N/A |
| Polymer Bearing Surface |
UHMWPE GUR 1020-E 80kGy |
0.662 |
0.4 |
11.65 |
Table 2.
Summary of seven verification and three validation activities performed for the L-TJR FEM in accordance with ASME V&V 40-2018 [
25] and FDA Guidance [
26,
27].
Table 2.
Summary of seven verification and three validation activities performed for the L-TJR FEM in accordance with ASME V&V 40-2018 [
25] and FDA Guidance [
26,
27].
| Activity |
Outcome |
| Verification Goal 1: Code verification |
Software credibility certified by ANSYS. We performed the suite of verification benchmark tests provided by ANSYS for LS-DYNA. Benchmark testing demonstrated <1.9% maximum error among 34 test parameters evaluated. |
| Verification Goal 2: Sufficient discretization of finite element mesh |
Four levels of mesh discretization (1.0, 0.8, 0.6, and 0.5 mm) were assessed. Stable convergence of the resulting contact pressures was indicated at an element size of 0.6 mm. |
| Verification Goal 3: Force balancing given the quasi-static nature of the simulation |
Results indicated equivalence between the total superior-inferior contact force and the superior-inferior constraint force. These forces were also consistent with the prescribed axial loading per the boundary conditions. |
| Verification Goal 4: Stress pattern symmetry under symmetric loading |
Ran analysis with purely linear-elastic material properties and confirmed that instances of asymmetric contact pressures during symmetric applied loading in the duty cycle was a result of the plasticity of the PE material properties |
| Verification Goal 5: Quasi-static performance of explicit analysis |
Kinetic energies remained at zero for both Mode I and Mode IV simulations, indicating a quasi-static solution during explicit analysis. |
| Verification Goal 6: User error mitigation |
Key inputs (i.e., material properties, load and displacement boundary conditions, contact definitions, and output displacement and stresses) were independently verified. |
| Verification Goal 7: Confirm the displacement boundary conditions from the simulator are correctly implemented in the FEM. |
A video of the simulator applying the gait cycle to the L-TJR was compared with the FEM. A side-by-side comparison of the FEM kinematics and the kinematics of the simulator was performed to ensure similarity between the FEM and physical tests. |
| Validation Goal 1: Comparable contact pressures and polyethylene deformations between FEA and wear maps from Mode I in vitro testing |
FE peak contact stress was 39 MPa and occurred at or near to 100% of the duty cycle. Aggregate contact stress distributions from FEM and MicroCT wear maps from the wear tests were compared using damage scoring techniques and were found to agree within 6.2%. |
| Validation Goal 2: Comparable contact pressures and polyethylene deformations between FEA and wear maps from Mode IV in vitro testing |
FE indicated focal wear and deformation on the posterior aspect of the PE component outside of the intended bearing surface, consistent with physical Mode IV wear testing. Aggregate contact stress distributions from FEM and MicroCT wear maps from the impingement wear tests were compared using damage scoring techniques and were found to agree within 6.7%. |
| Validation Goal 3: Levels of PE component contact pressures consistent with previously reported and validated magnitudes |
Maximum Mode I contact pressures were comparable to previously reported values for large joint PE bearing surfaces [11,23] |
Table 3.
Summary of Axial Misalignment Conditions for FE Models.
Table 3.
Summary of Axial Misalignment Conditions for FE Models.
| Misalignment Condition |
Baseline Mode I Scenario |
Case 1 |
Case 2 |
Case 3 |
Case 4 |
Case 5 |
Case 6 |
Case 7 |
Case 8 |
| Axial Convergence Angle (°) |
40 |
30 |
20 |
40 |
40 |
40 |
40 |
40 |
40 |
| Axial A-P Offset (mm) |
0 |
0 |
0 |
2 |
4 |
0 |
0 |
0 |
0 |
| Coronal Tilt (°) |
0 |
0 |
0 |
0 |
0 |
-20 |
-10 |
10 |
20 |