

Submitted:
04 December 2024
Posted:
06 December 2024
You are already at the latest version
Abstract
Energy poverty remains a significant issue in Bosnia and Herzegovina, characterized by limited access to affordable and sustainable energy sources. This paper examines the prevalence of energy poverty among 1,500 pensioner households and evaluates the potential of photovoltaic (PV) systems as a solution. The research highlights the multidimensional nature of energy poverty, incorporating variables such as income, energy expenditures, and heating methods. Using statistical methods, including factor analysis and regression models, the research developed an Energy Poverty Index (EPI) to categorize households and identify key drivers of energy poverty. The findings reveal that 96.5% of households experience moderate to high energy poverty when transport costs are included, dropping to 84.3% when these costs are excluded. Households using wood for heating, with a combined rooftop area of 26,104 m², could generate 7,831,200 kWh of solar energy annually, reducing CO₂ emissions by 1,389,825 kg. The aggregated payback period for PV investments is approximately 9.3 years, demonstrating financial viability. The paper underscores the potential of energy communities in pooling resources, facilitating rooftop leasing for PV installations, and promoting policy reforms to promote renewable energy adoption. This research contributes to the understanding of energy poverty dynamics and provides actionable recommendations for integrating PV power plants, fostering energy equity, and reducing environmental impacts.
Keywords:
energy poverty
; photovoltaic systems
; energy communities
; CO₂ emissions
; renewable energy policy
1. Introduction
Energy poverty denotes a multidimensional deficit in affordable, reliable energy access for essential household needs [1]. This includes insufficient access to clean and reliable energy sources necessary for heating, cooling, cooking, and lighting [2]. Energy poverty is not merely an issue of energy availability; it also encompasses factors such as the energy efficiency of buildings and the affordability of energy for households.
Households affected by energy poverty often face high energy bills relative to their income, which may force them to choose between heating or cooling their homes and meeting other basic needs such as food and healthcare. This situation can lead to adverse health outcomes, increased stress levels, and a diminished quality of life.
Energy poverty in Bosnia and Herzegovina is significant and affects a large portion of the population, particularly in rural areas. The issue is complex and linked to a range of socio-economic factors, including low household incomes, poor energy efficiency of residential buildings, and high-energy prices. According to available data, energy poverty disproportionately affects vulnerable social groups, such as the unemployed, low-income households, and those with lower levels of education. These groups are often forced to use older, high-emission vehicles or live in informal settlements without adequate access to sustainable energy services, resulting in increased emissions and deteriorating living conditions [3].
Statistical findings from literature [4] indicate that the average annual household electric power consumption in Bosnia and Herzegovina is approximately 3,939 kWh. However, the reliability of these data could be compromised by the use of outdated demographic statistics, as no recent census has been conducted in Bosnia and Herzegovina. Such discrepancies can substantially affect the accuracy of assessments concerning energy poverty and the formulation of energy efficiency strategies.
The most widely accepted definition of energy poverty is: "A household is energy poor if it has to spend more than 10% of its income on all forms of energy consumption" [5]. Bosnia and Herzegovina faces significantly greater challenges compared to EU countries. Energy-poor households often lack the resources or knowledge to meet their basic energy needs, leading to social isolation. The main causes of energy poverty are low incomes, high-energy prices, and poor-quality housing. Recognizing energy poverty indicators is crucial for addressing this problem [6]. The conducted researches [7,8] have also identified three main causes of energy poverty: low household incomes, high-energy costs, and poor housing quality (low levels of energy efficiency). Many signs suggest that a household is facing energy poverty, including unemployment, low pensions, inadequate heating of living spaces, old and energy-inefficient houses and buildings, delayed or unpaid utility bills, moisture on walls and floors, decayed window frames, lack of district heating, and high housing costs relative to income.
Energy poverty directly and indirectly affects human health, the economy, and the environment. Vulnerable groups, such as large families, single parents, and pensioners, are particularly affected. These groups often are not aware that they are energy-poor and accept their inability to meet energy needs as a normal state of affairs [9].
The need for updated and precise demographic and energy data is critical for formulating effective interventions to address energy poverty. Improved transparency in statistical data would facilitate better targeting of resources and the development of policies that directly address the needs of vulnerable households. For instance, more accurate data might reveal higher household electric power consumption, indicating energy inefficiency due to poor insulation or outdated technologies in impoverished households.
Given these challenges, new research is recommended to update demographic and energy data. This would not only improve the understanding of current energy consumption and poverty but also enable the development of targeted programs to enhance energy efficiency and reduce energy costs for the most vulnerable population groups. Without these steps, there is a risk that policies and interventions may fail to adequately address the real needs of households experiencing energy poverty, leaving a substantial number of citizens in a cycle of energy and economic insecurity.
This paper aims to carry out in-depth research and field surveys to gather data that are more precise on electric power consumption. As part of this research, 1,500 pensioners living in households with one to three members are surveyed. It is revealed that their electric power consumption reflects the average household consumption in Bosnia and Herzegovina. This approach allows for a better understanding of actual energy consumption within a specific demographic group, contributing to a more precise definition and addressing energy poverty issues.
The paper is organized as follows: The second section provides a comprehensive literature review, discussing definitions, impacts, and existing research on energy poverty, with an emphasis on Bosnia and Herzegovina and comparative insights from other regions. The third section outlines the materials and methods, including the survey design, data collection, and statistical approaches used to analyze energy poverty and develop the Energy Poverty Index (EPI). The fourth section presents the results, detailing findings from the Energy Poverty Index analysis under various scenarios, including the impact of transport costs. The fifth section evaluates the potential savings and environmental benefits of photovoltaic (PV) panel installations for heating, considering different energy sources and their associated CO₂ emissions. Finally, the discussion and conclusion summarize the findings and provides recommendations for addressing energy poverty through policy interventions and renewable energy solutions.
2. Literature Review
Energy poverty's definitions and impacts vary by region, reflecting diverse socio-economic backgrounds and levels of infrastructural development. For instance, research has shown that energy inefficiency in households and the public sector significantly contributes to energy poverty in Bosnia and Herzegovina [6]. Similar challenges are observed across European regions and in Israel, where the rural-urban divide in energy poverty is further influenced by climate change, as discussed in [10].
In [11], a multidimensional approach is proposed to understand and measure energy poverty, emphasizing the significance of both access to modern energy services and their quality. This work introduces the Multidimensional Energy Poverty Index (MEPI), a tool designed to measure the deprivation of access to such services.
Research conducted in Banja Luka examined the prevalence of energy poverty among university staff and students, indicating significant energy poverty within the surveyed group. This paper [9] highlights the social implications of energy poverty, such as health issues and social exclusion, prevalent among sensitive groups like pensioners and large families.
In the Energy Community region, energy poverty persists as a significant challenge, particularly in non-EU states such as Serbia, Montenegro, Ukraine, and Georgia. These countries face difficulties in addressing housing quality and energy efficiency, which are critical to alleviating energy poverty. Limited long-term strategies and insufficient funding further exacerbate the problem, especially in post-socialist states where energy poverty rates are considerably higher than the European average [12]. At the EU level, policy initiatives such as the Clean Energy for All Europeans Package and the Green Deal have aimed to mitigate energy poverty by emphasizing energy efficiency, affordability, and access. However, the implementation of these policies has been uneven across member states, highlighting the need for localized, comprehensive solutions underpinned by principles of procedural and distributional justice [13]. Empirical evidence further reveals the importance of renewable energy in addressing energy poverty and reducing greenhouse gas emissions. Electric power generation from renewable sources has been shown to significantly lower energy poverty while contributing to environmental sustainability, whereas reliance on fossil fuels and inefficient energy systems exacerbates these challenges. The introduction of the MEPI provides a valuable tool for assessing the socio-economic and environmental dimensions of energy poverty, reinforcing the need for investments in renewable energy infrastructure and supportive policies to promote sustainable energy transitions [14].
Energy poverty elimination poses both opportunities and challenges for global carbon neutrality. As noted in [15], increasing electric power access is crucial for reducing energy poverty, with renewable energy playing a significant role. However, reliance on thermal power complicates carbon reduction efforts. Regional differences are evident, as non-Belt and Road Initiative (non-B&RI) countries benefit from clean energy adoption, reducing emissions, while B&RI nations face increased emissions due to fossil-fuel-based electric power. These findings highlight the need for targeted policies emphasizing renewable energy to balance energy access and emission reduction goals.
The research presented in [16] develops a method for defining energy poverty thresholds by analyzing energy, climate, social, and health indicators. Key factors include building energy efficiency, heating system performance, household appliances, and energy expenditure relative to income. Using the Analytic Hierarchy Process (AHP), the study identifies health as a priority criterion and building retrofitting as a critical measure. It provides a practical framework for policymakers to target vulnerable households and craft effective public policies to mitigate energy poverty.
Similarly, [17] introduces an intelligent approach to analyze energy poverty by applying neural networks and data optimization techniques. It identifies significant social and economic parameters, such as employment, income, and housing growth, to predict electric power and heat consumption. This innovative model demonstrates the importance of data preprocessing and parameter selection in understanding and mitigating energy poverty, particularly in vulnerable regions like South-Eastern Europe.
In the context of energy poverty, the research [18] provides a compelling example of how integrating renewable energy solutions can address not only environmental challenges but also socioeconomic issues such as energy poverty. The research focuses on the implementation of PV power systems in Sarajevo Canton, highlighting how these systems can significantly reduce the reliance on inefficient and polluting heating fuels, which are a major contributor to both air pollution and high-energy costs in urban settings. The paper underscores the discrepancy between the potential of solar energy and its actual utilization in Bosnia and Herzegovina, suggesting that increased adoption of renewable energy sources can enhance the energy self-sustainability of cities. This in turn can lead to reduced energy costs for households, particularly important for those struggling with energy expenses, a core aspect of energy poverty.
Existing research on energy poverty, while valuable, reveals notable limitations, underscoring the need for further investigation. Many studies focus on specific geographic or socio-economic contexts, limiting their applicability to broader regions and diverse populations. Methodological inconsistencies, including the absence of standardized metrics, complicate cross-country comparisons and the formulation of universally applicable policies. Additionally, a strong emphasis on technical solutions, such as energy efficiency and renewable energy adoption, often neglects socio-cultural and behavioral dimensions, as well as the long-term socio-political barriers to implementation.
These limitations underscore the critical need for further research to address existing gaps in understanding and mitigating energy poverty. This research focuses on Bosnia and Herzegovina, with a particular emphasis on vulnerable populations such as pensioners. By employing advanced statistical analyses and integration models, the research provides actionable recommendations adapted to the local context. A central focus is on assessing the feasibility and impact of integrating PV systems for the electrification of heating, aiming to simultaneously reduce CO₂ emissions and alleviate energy poverty. Additionally, the research highlight the strategic role of energy communities as key facilitators in implementing heating electrification, promoting sustainable energy solutions, and fostering resilience within local communities. This approach offers a comprehensive framework to tackle energy poverty, emphasizing practical, data-driven strategies aligning with environmental and social objectives.
3. Materials and Methods
Bosnia and Herzegovina lacks adequate data and an official definition of energy poverty, hindering efforts to address the issue. A reliable approach to assessing energy poverty involves large-scale population surveys. The authors conducted a survey targeting a highly affected group, revealing a high prevalence of energy poverty, though it remains under recognized by respondents.
3.1. Introduction to the Survey
In order to assess the extent and impact of energy poverty among retirees in Bosnia and Herzegovina, a comprehensive survey is conducted. The survey targeted pensioners, as this demographic is particularly vulnerable to energy poverty due to limited fixed incomes and often inefficient housing conditions. The aim of the survey is to gather data on various household characteristics, including household size, heating methods, annual energy expenditures, and the availability of roof space for potential installation of PV modules. The data collected provide insights into the energy consumption patterns and financial burdens faced by households, which are critical for understanding and addressing energy poverty in the region.
The survey comprised 15 questions, covering both general household indicators and specific energy-related expenditures. The key areas of inquiry included annual income, types of heating method, electric power consumption, and other factors that influence the energy poverty status of the respondents.
3.1.1. Survey Design and Structure
The survey is conducted to analyze the energy needs and consumption patterns of households inhabited by pensioners in Bosnia and Herzegovina, with a particular focus on the relationship between socio-economic factors and energy habits, as well as the potential for transitioning to renewable energy sources. The sample includes 1,500 pensioner households from various regions, ensuring the representativeness of the data and enabling a deeper understanding of their specific needs and challenges. The survey collected information on the number of household members and the size of their residences, along with economic indicators such as annual income and monthly expenses related to energy and transportation.
The respondents provided information on the type of fuel for heating, such as wood, gas, pellets, or coal, as well as the modes of transportation they rely on, which allows for the identification of consumption patterns and energy-related expenditures. Data on the annual electric power consumption forms the basis for analyzing the energy efficiency of these households. Additionally, households reported that the area of their rooftops is suitable for installing PV panels, offering insights into their potential to adopt renewable energy solutions.
The data are collected through a standardized questionnaire completed by household members, enabling detailed quantitative analysis. The research will focus on exploring the correlations between socioeconomic factors and energy consumption, identifying key patterns in energy choices, and assessing the potential for the introduction of PV panels as a way to reduce costs and enhance energy efficiency. This analysis aims to contribute to the formulation of customized support programs and subsidies, facilitating the energy transition for pensioner households and alleviating their financial burden.
All financial values in this paper are expressed in BAM (Bosnian Convertible Mark). For reference, 1.00 BAM is approximately equal to 0.511 EUR based on the official exchange rate of the Central Bank of Bosnia and Herzegovina [19].
Table 1 below is a representation of the survey questions used in the research, focusing on both general household characteristics and energy consumption patterns.
3.2. Survey Analysis
The survey is completed by 1500 retirees from Bosnia and Herzegovina. The majority of respondents (68,2%) live in single or two-member households (Table 2).
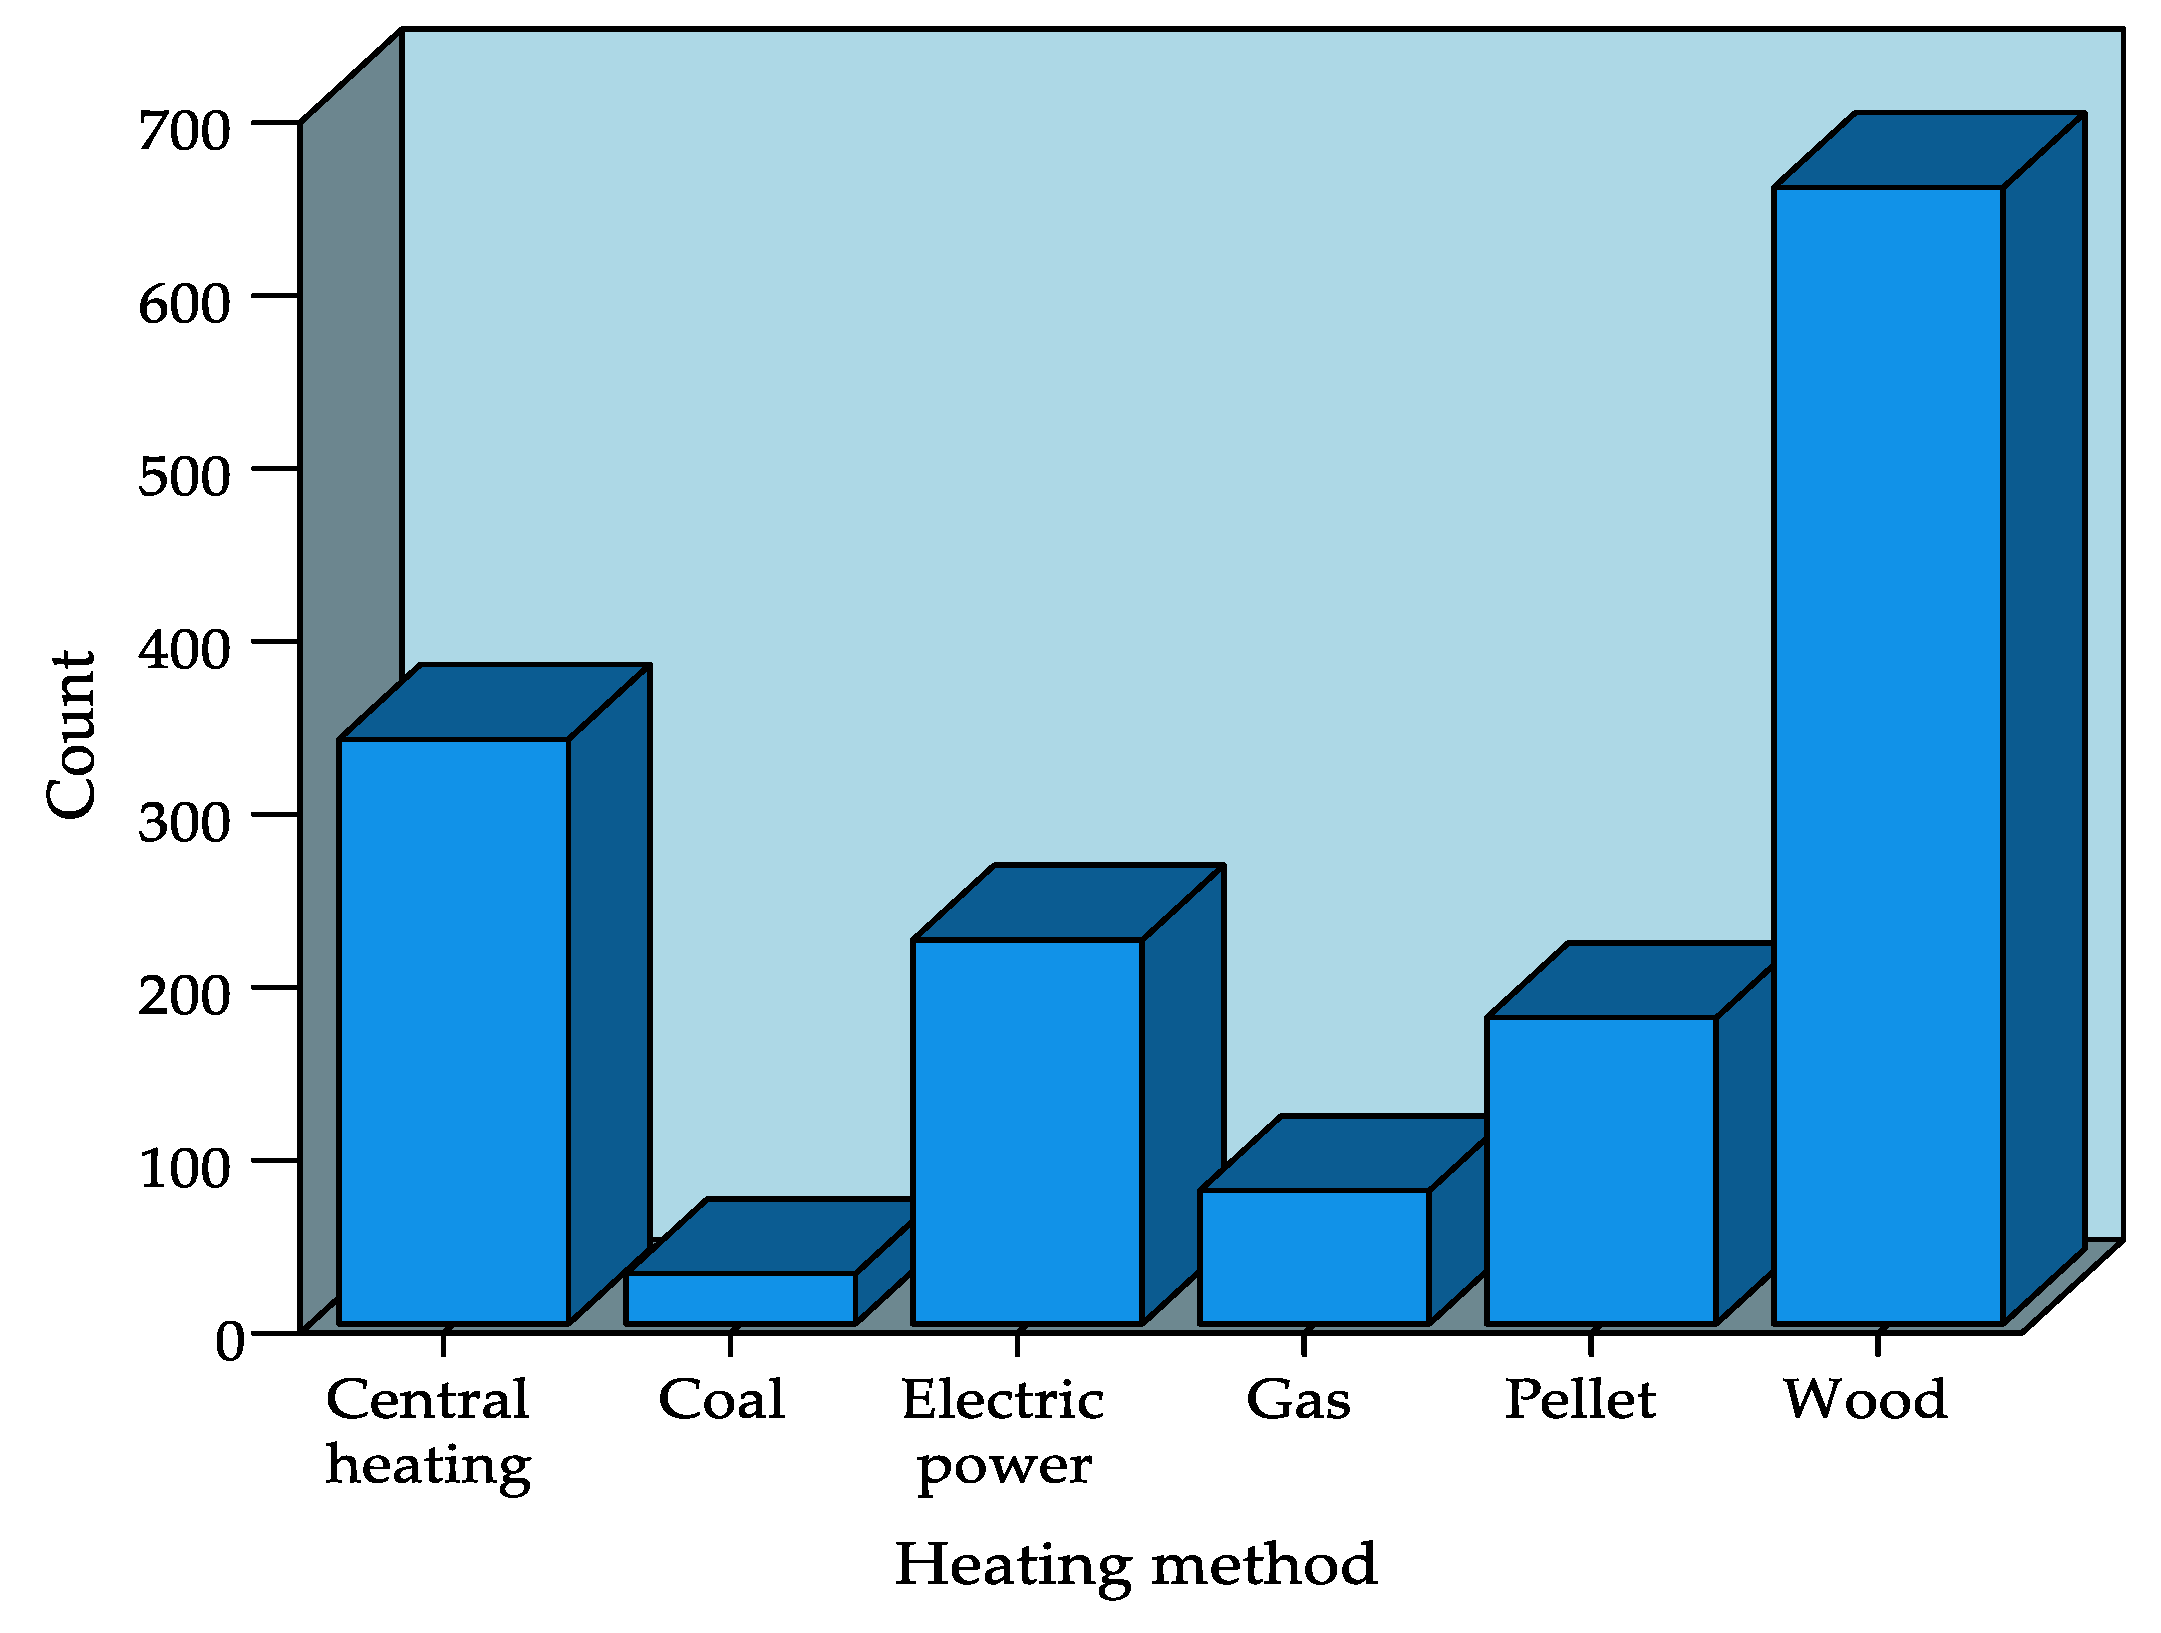
The most common heating method used by households is wood, accounting for 43.8% (n = 657) of the sample. District heating is the second most utilized method, representing 22.5% (n = 338) of households. This is followed by electric power with 14.8% (n = 222), pellet with 11.8% (n = 177), and gas with 5.1% (n = 77). The least common heating method is coal, which is used by only 1.9% (n = 29) of the households.
Figure 1.
Frequency of household heating methods.
The Figure 2.a presents the frequency distribution of annual income categories among respondents. The income categories reveal a clear trend where the majority of respondents fall within the mid-income range of 7,500-15,000 BAM, accounting for 63.0% of the total population. A smaller, yet significant portion (25.2%) earns 15,000-20,000 BAM, while low-income households earning less than 7,500 BAM represent 11.5%. High-income households earning above 20,000 BAM are extremely rare, comprising only 0.3% of respondents. This distribution suggests that the majority of the surveyed population is concentrated in moderate-income levels, with a minority at the extremes (low or high incomes), indicating limited income disparity among the respondents.
The Figure 2.b presents the distribution of households based on their annual electric power expenditure. The majority of respondents, 43.9% (659 households), fall into the 600-1,000 BAM expenditure category, followed closely by 41.3% (620 households) spending less than 600 BAM annually. A smaller proportion, 14.7% (221 households), spend more than 1,000 BAM on electric power.
The Figure 2.c displays the distribution of households based on their annual heating expenses. A majority of households, 50.5% (758 households), spend more than 1,000 BAM on heating annually. Another significant portion, 41.9% (628 households), incur heating costs between 600-1,000 BAM, while only 7.6% (114 households) spend less than 600 BAM on heating.
The Figure 2.d illustrates the distribution of households based on their annual transport expenditure. The majority of households, 67.4% (1,011 households), report transport costs of less than 600 BAM annually. A smaller portion of households, 16.2% (243 households), spend between 600-1,000 BAM, while 16.4% (246 households) incur transport costs exceeding 1,000 BAM.
The data presented in Figure 3 highlights the transport expenditure and respondent frequency across various transportation methods. Transport by private cars account for the highest transport expenditure, totaling 512,024 BAM, with 515 respondents reporting car usage. In contrast, public transport incurs a significantly lower expenditure of 132,860 BAM, with a slightly lower number of users (492 respondents). Similarly, the category other shows an expenditure of 139,006 BAM, with 493 respondents utilizing alternative transportation methods. The "Other" category encompasses transportation methods such as taxis, company-provided transport like buses or vehicles for commuting, and shared car used with friends or family.
As presented in Figure 4, the distribution of roof areas for potential PV panel installation shows that the majority of households, 72.5% (1,088 households), have roof areas smaller than 50 m². Roof areas between 50-100 m² are available for 25.6% (384 households), while only 1.9% (28 households) fall into the 100-150 m² category. This distribution highlights that most households have limited roof space, which could be a potential constraint for large-scale PV panel installations.
Figure 5 provides a comprehensive comparison of average heating expenditures (BAM) and the consumption of four heating sources—wood, gas, coal, and pellets—across three apartment size categories: Small (<50 m²), Medium (50–100 m²), and Large (>100 m²).
The data reveal that heating expenditures are generally consistent across apartment sizes, with minor variations depending on the heating source. Wood and pellet consumption slightly increases with larger apartments, reflecting higher fuel requirements for heating larger spaces (Figure 5. (a) and (d)). However, gas consumption (Figure 5. (b)) shows an inverse relationship, with smaller apartments consuming more gas and incurring higher costs, likely due to differences in heating efficiency.
Coal consumption remains relatively stable across all apartment sizes, with expenditures slightly decreasing as apartment size increases (Figure 5. (c)).
Analyzing the survey results presented in Figure 5, it can be concluded that, in all cases, and most prominently with heating methods utilizing gas and coal, increasing the apartment size does not lead to higher heating costs or increased fuel consumption. This phenomenon, observed in Bosnia and Herzegovina, can be attributed to several socioeconomic and behavioral factors.
Residents of larger apartments often consciously or financially limit heating to essential spaces or conservatively use heating systems. Due to insufficient household incomes, many families are restricted to heating only the primary rooms they occupy. While reducing overall energy consumption, the practice is a clear indicator of energy poverty, which has significant implications.
Energy poverty not only limits the comfort and quality of life for residents but also exposes them to adverse living conditions during colder months. Inadequate heating can result in health risks, reduced productivity, and diminished well-being. The findings highlight how energy poverty in Bosnia and Herzegovina directly influences heating practices, underlining the need for targeted interventions to improve energy efficiency, affordability, and access to adequate heating solutions for vulnerable households.
The responses of 222 participants out of 1,500, who use electric power for heating, are presented below. Figure 6 provides a representation of the relationships between three key variables related to household energy usage: annual heating expenditure (BAM), energy consumption (in kWh), and household income (BAM). Figure 6 illustrates a comparison of these variables using a bar chart. The average heating cost is 900.78 BAM, while the average electric power consumption for heating is 3,503.05 kWh. The average annual household income totals 12,355.74 BAM.
3.4. Factor Analysis
Factor analysis is a statistical method used to identify underlying patterns or latent structures in data. This method reduces the dataset’s complexity, making it easier to interpret.
This paper employs factor analysis to analyze energy consumption and expenditure data to uncover hidden dimensions related to energy poverty. The primary goal is to reduce the number of variables and identify the main components that explain most of the variability in the dataset. These components are subsequently used to calculate EPI, which quantifies and categorizes households based on their level of energy poverty.
By applying factor analysis in IBM® SPSS® Statistics 28 [20], groups of interrelated variables are identified, each representing a latent component. These components explain the shared variance among the variables, and their respective weights are used to compute the index.
The process of determining components consisted of the following steps:
Six variables are analyzed:
- Apartment area (m²);
- Annual income (BAM);
- Expenditure on electric power (BAM);
- Expenditure on heating (BAM);
- Expenditure on transport (BAM);
- Total electric power consumption (kWh).
The Principal Component Analysis (PCA) method is chosen for factor extraction. PCA reduces data dimensionality by identifying latent dimensions that account for the largest variance in the dataset.
All variables are standardized using z-scores to ensure comparability across different units of measurement (e.g., BAM vs. m²).
The initial eigenvalues for each potential component are calculated, representing the amount of variance explained by each component. Based on Kaiser’s criterion (eigenvalue > 1), three components are retained for further analysis.
The factor analysis using PCA demonstrates that the communalities for expenditures on electric power, heating, transport, total electric power consumption, apartment area and annual income are satisfactorily high, ranging from 0.569 to 0.968. This indicates that approximately 57% to 97% of the variability in each variable is well explained by the extracted factors, suggesting a robust factor structure in the dataset. Such communalities confirm that the PCA effectively captures the major variance components of the variables analyzed, which are crucial for understanding the dynamics influencing the energy poverty coefficient. This detailed breakdown of how the factors capture each variable's variance is presented in Table 3, showing the proportion of variance explained by the model for each predictor.
The detailed variance explanation table from the PCA illustrates the variance accounted for by each extracted component in the dataset. The first component explains 36.573% of the variance, with cumulative contributions increasing to 56.097% by the second component, 73.330% by the third component, and reaching 100% across all six components. Initial Eigenvalues show the total variance explained by each component. The first component explains 36.573% of the variance, the second adds 19.524%, and the third contributes 17.233%, resulting in a cumulative explained variance of 73.33%. This demonstrates that the extracted factors effectively capture the entirety of the variability in the observed variables, with eigenvalues highlighting the significance of each factor in describing the underlying patterns in the data. This comprehensive view of variance distribution across components validates the efficiency of PCA in reducing dimensionality while preserving essential information. The detailed variance explained by each component, both before and after extraction, is presented in Table 4.
The rotated component matrix, using Varimax rotation, clarifies the interpretation of components by redistributing the loadings.
- Component 1 is strongly associated with expenditure on electric power (BAM) (0.977) and annual electric power consumption (kWh) (0.963);
- Component 2 is dominated by apartment area (m²) (0.785) and expenditure on heating (BAM) (0.823);
- Component 3 is most strongly linked to annual income (BAM) (0.753) and expenditure on transport (BAM) (0.755).
Table 5 present the component score coefficient matrix to identify which components are most strongly associated with factors indicative of energy poverty.
3.4.1. Calculation of the Energy Poverty Coefficients
Based on the results of factor analysis, the EPI is calculated using the three components. The calculation relies on the component score coefficient matrix, which provides specific coefficients for each variable across the components. This method ensures that the weights assigned to the components accurately reflect their significance in explaining the variability in the dataset by incorporating the contribution of individual variables within each component.
The first step involves determining the absolute contribution of each component. This is achieved by summing the absolute values of the coefficients for all variables within a component and dividing by the total number of variables. For Component 1, the calculation is as follows [21]:
Similarly, the absolute contributions for Component 2 and Component 3 are computed:
To determine the weights for the components (X,Y,Z), these values are normalized to ensure proportionality and that their sum equals 1. The normalization process is as follows:
Finally, the Energy Poverty Coefficient is calculated using the following formula:
Energy Poverty Coefficient = (X * Component 1) + (Y * Component 2) + (Z * Component 3)
This method ensures that the Energy Poverty Coefficient captures the multidimensional nature of energy poverty by integrating the specific contributions of the variables within each component. The resulting index serves as a comprehensive tool for quantifying and categorizing households based on their level of energy poverty, enabling data-driven decisions for addressing this critical issue.
Table 6 provides descriptive statistics of the Energy Poverty Coefficient, summarizing its distribution among the surveyed households. The minimum value of -1.45 indicates that some households experience negligible energy poverty, likely due to lower energy-related expenditures and higher income levels. In contrast, the maximum value of 4.83 reflects households facing the highest levels of energy poverty, characterized by higher expenses and lower income. The mean coefficient of 0.1520 represents the average energy poverty level across all households, serving as a benchmark for comparing individual or group performance within the dataset. The standard deviation of 0.60287 highlights moderate variability, suggesting a diverse range of household energy poverty conditions.
3.5. Regression Analysis
The regression analysis builds upon the descriptive findings of the survey presented in the previous section, aiming to derive deeper insights into the factors contributing to energy poverty. While the survey analysis provided a comprehensive overview of household responses, including expenditures and income, this section utilizes these data points to develop a quantitative model. The primary goal is to calculate the energy poverty index that represents the multidimensional aspects of energy poverty.
In the multiple regression analysis, the model with predictors including annual income and expenditures on electric power, heating, and transportation explains 83.4% of the variability in the energy poverty coefficient (R² = 0.834). The adjusted R-square also amounts to 0.834, confirming the model's effectiveness even after adjusting for the number of predictors. The standard error of the estimate is 0.29079, which provides an estimate of the typical deviation of the observed values from the model's predicted values. The F-statistic (1883.141) and p-value (<0.001) affirm the statistical significance of the model. The Durbin-Watson test (1.914) shows an absence of autocorrelation among residuals, thus ensuring the validity of the model. These results highlight the reliability of the model in predicting energy poverty, which can be instrumental in designing targeted social programs. The statistical details and performance indicators of the regression model are displayed in Table 7.
This ANOVA summary helps in assessing the overall significance of the regression model. The model exhibits a regression sum of squares of 636.929, which indicates the total variability explained by the model. This is divided among 4 degrees of freedom, resulting in a mean square of 159.232. The model's F-statistic is exceptionally high at 1883.141, signifying a very strong model fit with a p-value less than 0.001, confirming the statistical significance of the model's predictors. The residual sum of squares is 126.412 with 1495 degrees of freedom, resulting in a mean square of 0.085, representing the variance of the residuals or unexplained variance by the model. The total sum of squares, the total variability in the dependent variable, is 763.341 across 1499 total degrees of freedom. Table 8 confirms that the predictors significantly affect the dependent variable, with the model explaining a substantial portion of the variance in the Energy Poverty Coefficient.
The regression coefficients table provides a detailed statistical analysis showing how each predictor influences the Energy Poverty Coefficient. The model includes predictors like expenditures on electric power, heating, transport, and annual income. For each predictor, the table lists unstandardized coefficients (indicating the change in the Energy Poverty Coefficient for a unit change in the predictor), standardized coefficients (Beta values, showing the relative importance of each predictor), and t-values with significance levels (indicating the statistical significance of each predictor). The coefficients for expenditures are all positive (0.001), suggesting that increases in these costs raise the Energy Poverty Coefficient, while the coefficient for annual income is negative (-7.943E-5), indicating that higher income reduces energy poverty. All predictors are highly significant (p < .001). Additionally, the table includes collinearity diagnostics (tolerance and VIF), which are all within acceptable limits, suggesting no serious multicollinearity issues among the predictors. The detailed analysis is presented in Table 9.
The regression analysis reported in Table 10 is conducted on the Energy Poverty Coefficient derived from Equation (1), focusing on predictors including annual income and expenditures on electric power and heating excluding transport expenditures. This model demonstrates a robust correlation with an R value of 0.823, signifying a strong linear relationship between the selected predictors and the dependent variable. The model accounts for 67.8% of the variance in the Energy Poverty Coefficient, as evidenced by an R Square of 0.678. Both models demonstrated a highly significant F Change, indicating that the predictors significantly improved the models' abilities to predict energy poverty in both cases. The Durbin-Watson is 1.914 with transport expenditures included and slightly higher at 1.955 when transport expenditures are excluded. Both values are close to 2, which suggests minimal autocorrelation in both cases, indicating that both models produced independent residuals. However, the slight increase when transport expenditures are excluded does not significantly affect the model's reliability but shows a marginally better independence of the residuals without transport expenditures.
Table 11 presents an ANOVA summary for the regression model described in Table 10, where annual income, expenditures on electric power and heating are predictors for the Energy Poverty Coefficient. The model reports a regression sum of squares of 517.236 across 3 degrees of freedom, leading to a mean square of 172.412. This model demonstrates a significant fit with an F-value of 1048.039 and a p-value less than 0.001. Comparatively, the previous model, which additionally incorporated transport expenditures as a predictor, exhibited a higher regression sum of squares of 636.929 and a similar level of statistical significance. The residual sum of squares in the current model is 246.106 with a mean square of 0.165, suggesting higher unexplained variance compared to the prior model's residual of 126.412. This indicates that including transport expenditures in the model reduces unexplained variance, enhancing the model's explanatory power as evidenced by a lower residual mean square. The comparison between these models highlights the impact of including transport expenditures on the explanatory capability and precision of the model in predicting the Energy Poverty Coefficient.
Table 12, outlines regression coefficients and diagnostic statistics for a model estimating the Energy Poverty Coefficient. It shows the impact of expenditures on electric power, heating, and annual income on this coefficient. Each predictor's unstandardized coefficient indicates the effect size per unit change, with expenditure coefficients being positive (0.001) and the income coefficient negative (-9.059E-5). The standardized coefficients (Beta) quantify the relative influence of each variable, with heating expenditure having the highest beta value of 0.752, indicating a strong effect on energy poverty. All predictors are statistically significant with p-values below 0.001, demonstrating their meaningful contribution to the model. The model's constant is -0.747, with a highly significant t-value of -27.106, suggesting a strong baseline effect. Collinearity diagnostics show tolerance and VIF within acceptable ranges, indicating no concerns about multicollinearity among the predictors.
Table 9 and Table 12 report positive coefficients for expenditures and a negative coefficient for income, consistent with the expectation that higher expenses increase and higher income decreases the Energy Poverty Coefficient. However, the Table 12 does not include expenditure on transport as a predictor, which simplifies the model slightly. The standardized coefficients in the Table 12 show a higher influence of heating expenditures and a slightly stronger negative impact of income on energy poverty. The constants in both models are negative, but the new model's constant has a lesser absolute value (-0.747 compared to -1.045), indicating a higher baseline Energy Poverty Coefficient when all predictors are zero. The statistical significance and collinearity diagnostics remain robust in both models, affirming the reliability and independence of the predictors used.
3.5.1. Energy Poverty Index
In this paper, the Energy Poverty Index is determined using a multiple regression analysis over the Energy Poverty Coefficient, a method employed to ascertain the influences of several independent variables, specifically, expenditures on electric power, heating, and transportation, alongside annual income [22]. The regression formula developed through this analysis is given by:
Energy Poverty Index = -1.045+0.001* Expenditure_on_electric power+0.001* Expenditure_on_heating+0.001* Expenditure_on_transport-0.00007943* Annual_income
The coefficients attached to each predictor in Equation (2) represent their respective weights, which are quantitatively determined to minimize the residual sum of squares in the model. The intercept of -1.045 indicates the baseline value of the Energy Poverty Index when all predictors are set to zero. The positive coefficients associated with the expenditure variables suggest that an increase in these expenditures contributes to higher energy poverty. Conversely, the negative coefficient related to annual income indicates that higher income levels mitigate the effects of energy poverty. This model provides a quantitative framework to assess the impact of financial expenditures and income on the state of energy poverty among households.
Table 13 provides descriptive statistics of the Energy Poverty Index, summarizing its distribution among the surveyed households. The minimum value of -1.09 indicates that some households experience negligible energy poverty, likely due to lower energy-related expenditures and higher income levels. In contrast, the maximum value of 2.76 reflects households facing the highest levels of energy poverty, characterized by higher expenses and lower income. The mean coefficient of 0.3501 represents the average energy poverty level across all households, serving as a benchmark for comparing individual or group performance within the dataset. The standard deviation of 0.70387 highlights moderate variability, suggesting a diverse range of household energy poverty conditions.
Examining the regression model, which only considers the costs associated with electric power and heating as outlined in Table 12, the following relationship for the Energy Poverty Index can be derived based on the unstandardized coefficients B:
Energy Poverty Index = -0.747+0.001* Expenditure_on_electric power+0.001* Expenditure_on_heating-0.00009059* Annual_income
The Equation (3) indicates that EPI increases by 0.001 units with each unit increase in expenditures on electric power and heating, showing that higher utility costs contribute to greater energy poverty. Conversely, the index decreases by 0.00009059 units for every unit increase in annual income, suggesting that higher incomes help alleviate energy poverty. The intercept of -0.747 represents the baseline level of the index when expenditures and income are zero, indicating the starting point of the index in the absence of these financial factors. This relationship highlights the dual impact of utility costs and income on energy poverty within the analyzed population.
Expanding upon the previously discussed regression analysis, Table 14 provides descriptive statistics for the Energy Poverty Index, offering insight into the distribution and variability of this indicator within the analyzed population.
The Energy Poverty Index ranges from a minimum of -3.32 to a maximum of 1.93, indicating a wide spread in the data, with the average value at -0.0094. This suggests that while most values hover around a slightly negative mean, indicating a general absence of acute energy poverty under the current study conditions, there are instances of both significantly higher and lower values, reflecting diverse energy poverty experiences among the population. The standard deviation of 0.61820 points to a moderate level of dispersion around the mean, confirming variability in energy poverty levels across different households or individuals analyzed. This variability underscores the importance of considering individual differences in energy expenses and income levels as substantial determinants of energy poverty, as modeled in Equation (3).
4. Results
This chapter presents the results of EPI analysis for two scenarios: one including expenditures on electric power, heating, and transport, and the other excluding transport costs. The findings provide insight into the categorization of energy poverty levels among households and compare regression-based results with data derived from survey responses.
The Energy Poverty Index categories are determined based on standard deviation, a commonly used statistical measure to classify data into distinct ranges. For both cases, households are categorized as follows [23]:
- Low: Index values below - standard deviation (SD);
- Moderate: Index values between - SD and + SD;
- High: Index values above + SD.
This approach helps identify households that deviate significantly from the average energy poverty levels, offering a robust method to capture the diversity in energy poverty experiences. Using standard deviation ensures the categorization is data-driven and reflects the distribution of EPI within the population.
The regression model used in this research builds on survey data collected from 1,500 households, which includes responses on Annual Income (BAM), Expenditure on Electric power (BAM), Expenditure on Heating (BAM), and Expenditure on Transport (BAM). The survey also employed a widely accepted definition of energy poverty: a household is considered energy poor if it spends more than 10% of its income on energy-related costs.
- First case (Including Transport Costs): Using the regression model, households are categorized into energy poverty levels. Results from Table 15 and Figure 7 indicate that 3.5% of households fall into the "Low" category, 66.7% into "Moderate," and 29.8% into "High" energy poverty. A combined 96.5% of households (1,448 households) are classified as either "Moderate" or "High" in the energy poverty index, indicating that the vast majority of the population experiences some level of energy poverty. Parallel to this, the survey-based calculation revealed that 1,454 households (96.9%) exceeded the 10% threshold for energy expenditures when considering electric power, heating, and transport costs. This high percentage underscores the significant burden transport costs add to overall energy expenses.
- Second case (Excluding Transport Costs): When transport costs are excluded, the regression-based categorization presented in Table 16 and Figure 8 showed 15.7% in "Low," 67.4% in "Moderate," and 16.9% in "High" energy poverty. A total of 84.3% of households (1,264 households) fall into the "Moderate" or "High" categories of the energy poverty index, indicating that the majority of the population experiences some level of energy poverty. The survey-based calculation found that 1,255 households (83.7%) exceeded the 10% threshold for energy expenditures when only electric power and heating costs are considered. This reduction in the number of energy-poor households demonstrates the substantial contribution of transport costs to energy poverty levels.
The results highlight the sensitivity of energy poverty classifications to the inclusion of transport costs. The first scenario, which includes transport expenditures, identifies a larger proportion of households in "High" energy poverty (29.8%) compared to the second scenario (16.9%). This indicates that transport costs are a significant driver of energy poverty for many households.
Survey data confirm these findings, with the number of households exceeding the 10% income threshold significantly higher in the first scenario (96.9%) than in the second (83.7%). The difference between the two scenarios (1,454 households versus 1,255) further emphasizes the role of transport expenses in pushing households over the energy poverty threshold.
Table 17 compares the results of two methods, regression-based and survey-based for classifying households into energy poverty categories across two scenarios.
The table illustrates that the inclusion of transport costs significantly increases the number of households classified as energy poor. Both methods yield similar results in each case, validating the regression model as an effective tool for analyzing energy poverty alongside survey-based calculations.
5. Analysis of Savings and Environmental Benefits of PV Panels for Heating
In this chapter, the focus shifts to evaluating the feasibility and potential benefits of installing PV panels on available rooftop areas among the surveyed households. Using data collected from 1,500 respondents, this analysis examines how the available roof area for PV panels could contribute to meeting the energy needs of households, particularly for heating purposes. To achieve this, energy requirements for heating calculated in kilowatt-hours (kWh) across all heating methods are used as the baseline. This ensures that the analysis accounts for total energy demand, regardless of the heating method currently employed.
The analysis explores:
- Potential solar energy generation: Calculating the energy output achievable from the available rooftop areas based on standard PV panel efficiency rates;
- Payback period: Estimating the financial viability of PV panel installation by considering the upfront costs, energy savings, and potential payback periods;
- Reduction in CO₂ emissions: Assessing the environmental benefits of switching to solar-based energy systems, specifically the reduction in carbon emissions compared to traditional heating methods reliant on coal, wood, gas, or pellets.
The following steps outline the general methodology used to evaluate the potential savings, environmental benefits, and financial feasibility of transitioning household heating systems to PV panels. The analysis is based on data collected for households using various heating sources, including their energy consumption, expenditures, and rooftop area availability.
Step 1: Calculation of Energy Consumption and CO₂ Emissions
- Energy Consumption: The total annual energy required for heating is calculated using the quantity of the primary energy source consumed by each household. The energy content specific to each fuel type is used to estimate the total heating energy;Energy Consumption (kWh) = Q * C * E
where:
Q - quantity of fuel consumed (e.g., in tons, m³, or kg, depending on the fuel type)
C - conversion factor to kilograms or the standard unit (e.g., 1000kg/t for tons, or 1kg for kg directly, or 1000kg/m³ for wood or gas, depending on the fuel type)
E - energy content of the fuel (e.g., kWh/kg for pellets, kWh/m³ for gas, or kWh/kg for wood).
- 2.
- CO₂ Emissions: The annual CO₂ emissions are determined by applying the emission factor for the primary energy source [24]. This provides an estimate of the environmental impact of current heating methods.
Total CO2 Emissions (kg) = Q
* C * F
where:
F - CO₂ emission factor for the fuel (e.g., kg CO₂/kg for pellets, kg CO₂/m³ for gas).
Step 2: Estimation of Solar Energy Potential
- Available Rooftop Area: The rooftop area available for PV panel installation is analyzed for each household;
- Installed Capacity: The total photovoltaic capacity (in kW) is calculated by multiplying the rooftop area by the capacity of PV panels per square meter. If a PV panel has a power output of 400 W and a physical size of 1.6 m², power density of the panel is 0.4 kW/1.6 m² = 0.25 kW/m² [25];Installed capacity (kW) = Available Rooftop Area * 0.25 kW/m²
- Annual Energy Production: The energy production potential of the installed PV panels is estimated using the annual energy generation rate per installed kW. The annual energy generation for each installed kilowatt of photovoltaic capacity is 1,200 kWh [26,28].Solar energy (kWh) = Installed capacity (kW) * 1,200 kWh/kW
Step 3: Estimation of Heating Cost Savings
- Reduction in Heating Costs: The annual savings are calculated by determining the reduction in costs from replacing a portion of the energy demand with solar-generated energy;
- Remaining Energy Demand: The remaining heating energy demand, after accounting for solar energy production, is used to calculate ongoing costs for the primary energy source;
- Annual Savings: The annual savings are determined by comparing the original heating costs with the reduced costs after introducing PV panels. A price of 0.15 BAM per kilowatt-hour is used as the assumed cost for energy [27].Annual Savings (BAM) = Expenditure on Heating (BAM) – (0.15 (BAM/kWh) * (Energy Consumption (kWh) - Solar energy (kWh)))
Step 4: Calculation of Investment and Payback Period
- Investment: The total cost of PV panel installation is calculated by multiplying the installed capacity (in kW) by the average price per kW of installation (1,500 BAM/kW) [28];Investment (BAM)= 1,500 BAM/kW * Installed capacity (kW)
- Payback Period: The return on investment is estimated by dividing the total investment by the annual savings, providing an indication of how long it will take for the investment to pay off.Payback Period (years) = Investment (BAM)/ Annual Savings (BAM)
This approach aims to highlight the role of solar energy as a sustainable and cost-effective alternative to current heating systems, aligning with global energy transition goals. The results provide insights into the practicality of implementing widespread PV panel installations and electrifying heating systems to reduce household energy costs and mitigate environmental impacts.
A slightly different approach is applied in this paper to assess the potential benefits and feasibility of PV panel installations for households that lack access to private rooftops. This scenario primarily concerns respondents living in multi-story buildings with central city heating, where the survey data does not record rooftop availability. For these households, the following methodology and relationships are used to estimate the energy requirements, installation capacity, and financial feasibility of PV panels.
Since rooftop availability is not applicable, the annual heating energy demand in kilowatt-hours (kWh) is derived from the reported heating expenditure. Using the average energy price for heating (0.15 BAM/kWh), the total energy consumption for heating (Eheating) is calculated as:
Eheating (kWh) = Expenditure on heating (BAM) / 0.15 (BAM/kWh)
The total energy demand for each household, including both heating and electric power consumption, is calculated as the sum of the heating energy demand and the total reported electric power consumption:
Etotal (kWh) = Eheating (kWh)+ Total electric power consumption (kWh)
To estimate the required capacity of PV panels (Csolar), the total energy demand is divided by the average annual energy output per kilowatt of installed PV capacity (1,200 kWh/kW):
Csolar (kW) = Etotal (kWh) / 1,200 (kWh/kW)
The total annual energy expenditure (Total Costs) is determined by summing the expenditures for electric power and heating:
Total Costs (BAM) = Expenditure on electric power (BAM)+Expenditure on heating (BAM)
The total investment required for PV panel installation (Isolar) is calculated based on the estimated solar capacity and the specific installation cost per kilowatt (1,500 BAM/kW):
Isolar (BAM) =1,500 (BAM/kW) * Csolar (kW)
The payback period (Tpayback) is determined by dividing the total investment cost by the total annual energy expenditure:
Tpayback (years) = Isolar (BAM) / Total Costs (BAM)
This approach provides a structured methodology for estimating the energy demand and economic feasibility of PV systems for households without direct access to rooftops. By using heating and electric power expenditure data, the analysis offers practical insights for the deployment of solar energy in urban areas.
5.1. Households with Wood Heating
An analysis of 657 respondents revealed that 440 households have suitable and viable roof areas for the installation of PV panels. These households are identified as having the potential to implement solar energy systems with an estimated return on investment ranging between 6 and 15 years. This research includes 440 respondents with the following summary data:
- Annual electric power consumption: 1,664,484 kWh;
- Total electric power cost: 267,082 BAM;
- Annual heating cost: 570,464 BAM;
- Total roof area for PV panels: 26,104 m²;
- Annual wood consumption for heating: 3,088.5 m³.
5.1.1. Calculation of CO₂ emissions from annual wood consumption
To ensure accurate calculations of CO₂ emissions from wood consumption, several key assumptions regarding the properties and energy content of the wood are considered:
To determine the total mass of wood consumed annually, its density multiplies the volume of wood:
Total wood mass = 3,088.5 m³ × 500 kg/m³ = 1,544,250 kg
The annual energy consumption derived from the wood is calculated by multiplying the wood volume by its energy value (Equation (4)):
Energy Consumption (kWh form wood) = 3088.5 m³ * 1,500 kWh/kg= 4,632,750 kWh
The CO₂ emissions from the total wood consumption are calculated by multiplying the total wood mass by the emission factor per kilogram of wood (Equation (5)):
Total CO2 emissions = 1,544,250 kg * 0.9 kg CO2/kg = 1,389,825 kg CO2
5.1.1. Assessment of Solar Power Capacity
The installed capacity of PV panels is calculated by multiplying the total available roof area by the specific capacity per square meter of PV panels (Equation (6)):
Installed capacity = 26,104 m² * 0.25 kW/m² = 6,526 kW
The total energy production from the installed PV panels is calculated by multiplying the installed capacity by the average annual energy output per kilowatt (Equation (7)):
Solar energy = 6,526 kW * 1,200 kWh/kW = 7,831,200 kWh
5.1.1. Heating Cost Reduction Analysis
The potential annual savings in heating costs are estimated by subtracting the adjusted costs of using solar energy from the total heating costs, considering the remaining wood consumption (Equation (8)):
Annual Savings = 570,464 BAM – (0.15 * (4,632,750 kWh - 7,831,200 kWh)) = 1,050,231.5 BAM
5.1.1. Investment and Break-even Period
The total investment required for the PV panel installation is calculated by multiplying the specific cost per kilowatt by the total installed capacity (Equation (9)):
Investment = 1,500 BAM/kW * 6,526 kW = 9,789,000 BAM
The break-even period is determined by Equation (10):
Break-even Period = 9,789,000 BAM / 1,050,231.5 BAM = 9.3 years
The analysis demonstrates the significant potential for households with wood heating systems to transition to solar energy systems, leveraging available roof space for PV panel installations. 440 households are identified with viable roof areas, enabling the implementation of PV power plant with an average return on investment of 9.55 years for individual households.
From a broader perspective, the overall payback period for the entire investment, calculated based on aggregated data, is estimated at 9.32 years. These results confirm the economic feasibility of solar energy adoption, particularly for the electrification of heating systems. Additionally, this transition could lead to substantial reductions in CO₂ emissions, amounting to 1,389,825 kg annually, alongside significant energy production from solar systems totaling 7,831,200 kWh per year.
The Figure 9 illustrates the distribution of break-even periods for individual investments in PV power plant designed for household heating electrification. This data underscores the financial viability and environmental benefits of adopting renewable energy solutions.
5.1. Households with Pellet Heating
This analysis includes 177 respondents who use pellets as the primary energy source for heating. The objective is to evaluate potential savings and CO₂ emission reductions when transitioning to PV panels. Among the 177 respondents, 113 households are identified as having feasible and acceptable conditions for installing PV panels on their available rooftop areas, with an estimated investment payback period ranging from 9 to 15 years. The aggregated data for these 113 respondents are as follows:
- Annual electric power expenditure: 70,189 BAM;
- Annual heating expenditure (pellets): 132,245.7 BAM;
- Annual electric power consumption: 248,703 kWh;
- Total rooftop area available for PV panels: 7,434.5 m²;
- Annual pellet consumption for heating: 330.61 tons.
5.1.1. Calculation of CO₂ Emissions from Pellet Consumption
Since households use pellets as their heating source, annual CO₂ emissions are estimated based on the quantity of pellets consumed. The following assumptions are applied:
To calculate the energy required for heating among households using pellet heating, the total annual consumption of pellets is analyzed. With 113 surveyed households reporting a combined consumption of 330.61 tons of pellets annually, the energy content of the pellets is utilized to estimate the total energy provided for heating. Pellets are a biofuel with a standardized energy content of approximately 4.5 kWh per kilogram. Using this value, the total energy for heating is calculated as follows (Equation (4)):
Total energy for heating (kWh from pellets) = 330.61 t*1000 kg/t*4.5 kWh/kg= 1,487,764 kWh
This calculation indicates that households relying on pellet heating require a total of 1,487,764 kWh of energy annually to meet their heating needs.
In addition to energy consumption, the analysis also estimated the annual CO₂ emissions associated with pellet use. While pellets are considered a cleaner alternative to fossil fuels, their combustion still produces CO₂ emissions. The emission factor for pellets is 0.18 kg of CO₂ per kilogram (kg CO₂/kg) of pellets burned. Using this emission factor, the total CO₂ emissions from the consumption of 330.61 tons of pellets are calculated by Equation (5):
Total CO2 emissions = 330.61 t*1000 kg/t*0.18 kg CO2/kg = 59,509.8 kg CO2
This calculation reveals that the use of pellets for heating results in annual CO₂ emissions of approximately 59,509.8 kilograms (59.5 metric tons). These emissions reflect the environmental impact of relying on pellets as a primary energy source for heating, despite their advantages over traditional fossil fuels.
5.1.1. Potential Solar Energy Production
The potential energy production from PV panels is estimated based on the total available rooftop area reported by the 113 households, which amounts to 7,434.5 m². Using standard assumptions for photovoltaic system performance, the following parameters are applied:
- PV panel capacity per m²: 0.25 kW/m²;
- Annual energy generation per installed kW: 1,200 kWh/kW.
The total installed capacity is calculated by Equation (6):
Installed capacity = 7,434.5 m2 * 0.25 kW/m² = 1,858.625 kW
This calculation shows that the households can collectively install a total of 1,858.625 kW of photovoltaic capacity on their rooftops.
The annual energy production potential of the installed solar capacity is estimated by multiplying the total installed capacity by the annual energy generation rate per kW (Equation (7)):
Solar energy = 1,858.625 kW * 1,200 kWh/kW = 2,230,350 kWh
This indicates that the PV panels could produce approximately 2,230,350 kWh of energy annually, significantly contributing to household energy needs.
5.1.1. Estimation of Heating Cost Savings
The total annual energy required for heating among the analyzed households is 1,487,764 kWh, while the potential energy production from PV panels is 2,230,350 kWh. This indicates that PV panels can meet the households' heating energy needs.
The Equation (8) for calculating annual savings is as follows:
Annual Savings = 132,245.7 – (0.15 * (1,487,764 kWh - 2,230,350 kWh)) = 243,633.6 BAM
The equation essentially compares the total cost of heating before and after the installation of PV panels. It calculates annual savings by changing the pellet-based heating energy with solar energy. The greater the energy contribution from PV panels, the smaller the remaining energy demand from pellets, leading to higher savings.
5.1.1. Investment and Payback Period
The total cost of PV panel installation is calculated based on the installed capacity using Equation (9):
Investment = 1,500 BAM/kW * 1,858.625 kW = 2,787,937.5 BAM
The payback period is determined by dividing the total investment by the annual savings (Equation (10)):
Payback Period = 2,787,937.5 BAM / 243,633.6 BAM = 11.4 years
For the 113 households identified as suitable for PV panel installation, the payback period is calculated individually using data on rooftop capacity, energy needs, and savings potential. The average payback period across individual households is 11.91 years, reflecting the variability in conditions such as available roof area and heating costs. When analyzed collectively, by summing the total rooftop area, energy consumption, and costs, the aggregate payback period is 11.44 years, indicating a slightly faster return on investment when considering the group as a whole. These results highlight both the individual feasibility and the collective potential of PV panel installations, emphasizing their financial and energy-saving benefits.
This scatter plot illustrates the relationship between the total available rooftop area for PV panels (m²) and the net heating energy balance (kWh) for 113 households after accounting for the maximum solar energy production potential. Each point in Figure 10 represents one household. The rooftop areas range from a minimum of 35 m² to a maximum of 120 m².
Positive values on the y-axis indicate households where the energy generated by PV panels exceeds their heating requirements, resulting in surplus energy. Negative values, on the other hand, represent households where the rooftop solar potential is insufficient to meet the heating demand, leaving a deficit.
The distribution of points shows that the majority of households achieve a surplus in heating energy, demonstrating that their available rooftop area is adequate for solar energy production. A smaller subset of 12 households with negative values suggests that additional measures, such as higher-efficiency panels or supplemental heating sources, may be required to meet their heating needs fully.
5.1. Households with Coal Heating
This analysis includes 29 respondents who use coal as their primary energy source for heating. The objective is to evaluate the potential savings and benefits of introducing PV panels as an alternative energy source. Among the 29 respondents, 19 households are identified as having feasible and acceptable conditions for installing PV panels on their available rooftop areas, with an estimated investment payback period ranging from 10 to 20 years. The aggregated data for these 19 respondents are as follows:
- Annual electric power expenditure: 10,715 BAM;
- Annual heating expenditure: 14,626.33 BAM;
- Annual electric power consumption: 41,136 kWh;
- Total rooftop area available for PV panels: 1,280 m²;
- Annual coal consumption for heating: 66.5 tons;
The assumptions for this analysis are as follows:
The total available rooftop area for these households is 1,280 m², enabling a potential installed capacity of 319.89 kW (Equation (6)), which can generate approximately 383,868 kWh of solar energy annually by Equation (7).
The annual energy required for heating is estimated at 265,933.33 kWh (Equation (4)), derived from the total coal consumption of 66.5 tons. This coal use results in CO₂ emissions of approximately 159,600 kg (155.6 metric tons) annually (Equation (5)). Solar energy can offset a significant portion of these heating needs, reducing both CO₂ emissions and heating costs.
The total investment for PV panel installation is calculated at 479,835 BAM, with an average payback period of 16.33 years for individual households (Equation (10)). When analyzed collectively, the payback period is slightly reduced to 14.84 years, emphasizing the financial and environmental benefits of transitioning to solar energy for coal-dependent households.
Figure 11 presents the comparison between original heating expenditure, reduced heating costs, and the corresponding annual savings for 19 households. The blue bars represent the initial heating costs before the integration of PV panels, while the yellow bars indicate the reduced heating costs after accounting for the contribution of PV panels to the total energy consumption. This calculates the reduced heating cost by accounting for the energy savings achieved through PV panels. It quantifies the cost of the additional energy required beyond what the PV panels provide, using a standard energy price of 0.15 BAM/kWh. When subtracted from the original heating expenditure, it reflects the annual savings that the household achieves due to the integration of PV panels.
The green embedded chart shows the annual savings for each household. These savings are calculated as the sum of the blue and yellow bars, reflecting the financial benefits achieved through solar integration (as defined by the Equation (8)).
5.1. Households with Gas Heating
An analysis of 77 respondents who use gas as a primary energy source identified 36 households residing in private houses or with access to suitable roof space for the installation of PV panels. In contrast, 41 households live in apartments within multi-story buildings and lack the option for such installations. Following statistical analysis and data processing, all 36 eligible households are confirmed as having feasible and viable conditions for PV panel installation. The estimated return on investment for these households ranges between 8 and 10.4 years, highlighting the economic potential of adopting solar energy solutions in this group. The data for these 36 respondents are as follows:
- Annual electric power expenditure: 22,258 BAM;
- Annual heating expenditure: 26,637.82 BAM;
- Annual electric power consumption: 81,027 kWh;
- Total rooftop area available for PV panels: 2,054.1 m²;
- Annual gas consumption for heating: 22,198 m3.
The assumptions for this analysis are as follows:
The analysis further evaluates the potential energy production and cost savings for households utilizing gas heating, considering their available rooftop space for PV panel installation. For the 37 households identified as suitable candidates, the energy consumption derived from gas is calculated based on the annual gas usage of 22,198 m³. The energy value of 10 kWh per cubic meter of gas equates to an annual energy consumption of 221,980 kWh (Equation (4)).
The associated CO₂ emissions are assessed using a CO₂ emission factor of 1.88 kg CO₂ per cubic meter of gas, resulting in a total emission of 41,732.24 kg CO₂ (Equation (5)). This highlights the environmental impact of current heating practices and underscores the potential for emissions reduction through solar energy integration.
To determine the installed capacity of PV panels, the total available rooftop area of 2,054.1 m² is multiplied by the specific capacity of 0.25 kW per square meter of PV panels, yielding an installed capacity of 513.525 kW (Equation (6)). The potential annual energy production from PV panels is estimated by Equation (7) at 616,230 kWh.
Figure 12 illustrates comparison of energy consumption from gas and additional solar energy contribution for 36 households (kWh) using gas as heating method. This bar chart compares the energy consumption from gas (blue bars) with the contribution of solar energy (green bars) for 36 households. The blue bars represent the energy consumption in kilowatt-hours (kWh) from gas heating, while the green bars above them indicate the additional energy obtained from PV panels beyond what is provided by gas. This visualization highlights the combined energy potential from both sources for each household.
The financial viability of PV panel installation is assessed by calculating potential heating cost savings. Annual savings are derived by considering the reduction in energy costs due to solar energy production and the remaining energy consumption from conventional gas heating. This analysis indicated potential annual savings of approximately 85,775.32 BAM (Equation (8)), highlighting the economic benefits of transitioning to solar energy for heating.
The total investment required for installing PV panels is calculated based on Equation (9). For the total capacity of 513.525 kW, the investment amounts to 770,287.5 BAM. The break-even period for this investment is determined by dividing the total investment by the estimated annual savings, resulting in a payback period of 8.91 years.
When considering the data for all households, the average payback period for individual investments is 9.12 years, further supporting the feasibility and long-term benefits of adopting solar energy solutions. These results confirm the substantial economic and environmental potential of integrating photovoltaic systems into the energy mix for households with gas heating.
5.1. District Heating
In analyzing the data from 338 respondents who use district heating, it is established that they reside in multi-story buildings without access to private rooftops. Consequently, the analysis for this group is conducted differently. Using the reported Expenditure on heating (in BAM), the equivalent energy consumption in kilowatt-hours (kWh) is calculated. This value is then combined with the total electric power consumption (kWh) data collected from the survey for each household.
The combined energy consumption (heating and electric power) is divided by an average annual energy output of 1,200 kWh/kW, resulting in an estimate of the PV capacity (in kW) that would need to be installed for each household to cover their energy needs. Based on this, the total investment for PV panel installation is calculated, followed by an assessment of the payback period. The payback period is determined by dividing the total investment by the annual energy costs, which represent the combined expenditure on heating and electric power for each household.
This method provides a practical approach for evaluating the feasibility and economic potential of PV panel installation for households without private rooftop access, offering insights into the transition to sustainable energy solutions.
5.1.1. Calculations
The results highlight the economic viability of PV panel installation for households utilizing district heating, emphasizing the potential for significant energy cost savings and a reasonable payback period. The data for these 338 respondents are as follows:
- Annual electric power expenditure: 198,341 BAM;
- Annual heating expenditure: 585,761 BAM;
- Annual electric power consumption: 764,354 kWh.
The analysis calculates the total energy consumption for heating (Eheating) as 3,905,073.33 (kWh) using Equation (11), derived from a reported heating expenditure of 585,761 (BAM) at a unit cost of 0.15 (BAM/kWh). The total energy demand (Etotal) for each household, combining heating and electric power consumption, is computed as 4,669,427.33 (kWh), based on the sum of the heating energy demand and the reported electric power consumption (764,354 (kWh)) in Equation (12). To meet this demand, the required PV capacity (Csolar) is estimated at 3,891.18 (kW) by dividing the total energy demand by an average annual output of 1,200 (kWh/kW), as shown in Equation (13). The total annual energy expenditure (Ctotal) is calculated at 784,102.04 (BAM) using Equation (14). The total investment (Isolar) for installing PV panels is estimated at 5,836,770 (BAM), using a specific installation cost of 1,500 (BAM/kW), as presented in Equation (15). Finally, the payback period (Tpayback) for this investment is determined to be 7.4 years by dividing the total investment by the annual energy expenditure, as given in Equation (16).
Following the analyses, the payback period for individual investments is determined to range between 5 and 8.5 years. The average payback period for these investments is calculated to be 7.61 years, with the overall aggregated payback period yielding an average of 7.42 years.
Figure 13 illustrates the distribution of key parameters for the analyzed households using boxplots. Subplot (a) represents the installed photovoltaic capacity (kW) and the payback period (years), emphasizing the variability and median values across households for PV system investments. Subplot (b) showcases the investment costs (BAM) and energy demand (kWh), providing insights into the financial and energy characteristics of the analyzed households.
5.1. Households that use Electric Power for Heating
An analysis of data collected from 222 households using electric power revealed that all have suitable and available roof surfaces for the installation of PV panels, with an estimated investment payback period ranging from 7 to 11 years. The details for these 222 respondents are outlined as follows:
- Annual electric power expenditure: 335,962 BAM;
- Annual heating expenditure: 199,973 BAM;
- Annual electric power consumption: 2,103,871.25 kWh;
- Total rooftop area available for PV panels: 9,264.14 m².
The analysis of the collected data indicates significant potential for the use of PV panels in households that rely on electric power for heating. With a total available rooftop area of 9,264.14 m² and a specific capacity of 0.25 kW per square meter, the installed capacity of PV panels is calculated to be 2,316.035 kW (Equation (6)). Considering Equation (7), the estimated total energy production from the installed PV panels amounts to 2,779,242 kWh per year. This production capacity demonstrates the potential to significantly reduce reliance on conventional electric power sources.
By incorporating solar energy into their heating systems, households can achieve notable savings in heating costs. The potential reduction in costs is calculated by considering the offset provided by solar energy, resulting in annual savings of 437,267.61 BAM (Equation (8)). These savings represent a substantial economic benefit for households, directly reducing their annual energy expenses and improving affordability.
The financial feasibility of PV panel installation is further highlighted by the total investment required for the project. With a specific cost of 1,500 BAM per kilowatt of installed capacity, the overall investment amounts to 3,474,052.5 BAM (Equation (9)). The return on this investment is demonstrated by the calculated payback period, which is approximately 7.92 years when aggregated savings are considered (Equation (10)). Additionally, the average payback period for individual household investments is estimated at 7.94 years, further confirming the economic viability of this initiative.
5.1. Summary Results
The transition from traditional heating methods to using electric power powered by PV power plants for heating results in a significant reduction in CO₂ emissions. The environmental impact of conventional heating systems, which rely on wood, pellets, coal, and natural gas, is calculated based on their respective CO₂ emission factors. By replacing these methods with electric power generated from solar energy, the emissions associated with heating are nearly eliminated, as solar power is a renewable and carbon-neutral energy source. Table 18 presents the number of households using various heating methods (wood, pellet, coal, gas) and the estimated reduction in CO₂ emissions (in kilograms) when transitioning to electric power generated from solar energy.
The table demonstrates a total reduction of 1,650,667.04 kg CO₂ annually, achieved by replacing conventional heating systems with solar-powered electric power. This significant decrease underscores the environmental benefits of adopting solar energy, not only as a clean and sustainable source of power but also as a means to mitigate climate change by reducing greenhouse gas emissions.
Figure 14 illustrates the reduction in CO₂ emissions (in kilograms) and the number of households for different heating methods. The darker shades of blue in the CO₂ reduction column represent higher values, while lighter shades transition to near-white for lower values.
The largest CO₂ reduction, amounting to 1,389,825 kg, comes from households using wood for heating, which also represent the largest group with 440 households. In contrast, households using gas, totaling 36, contribute the smallest reduction of 41,732 kg. Pellet users, accounting for 113 households, achieve a moderate reduction of 59,510 kg, while coal users, with only 19 households, contribute a reduction of 159,600 kg. These specific numbers of households are used in the analyses as they reflect the actual distribution of heating methods in the surveyed population, providing a realistic basis for evaluating the impact of transitioning to solar energy on reducing emissions.
The following summarizes the results for the payback period, considering the average values of individually calculated returns and the payback period obtained based on aggregated data from surveys of households with the potential to install PV panels on roof surfaces. The payback period is then calculated using these aggregated values. The payback period represents the time required to recover the initial investment in PV panels through energy cost savings. The analysis presents two methods for calculating the payback period for households with the potential to install PV panels. Table 19 presents the payback periods for households transitioning to PV panels, calculated both using aggregated data and averaged individual household data for each heating method.
The first method calculates the payback period based on aggregated survey data for households grouped by heating method. Total energy consumption, costs, and benefits for each group are summed first, and the payback period is calculated using these aggregated values. This approach provides a generalized estimate of the average payback time for each group.
The second method calculates the payback period for each household individually, using specific energy consumption, costs, and benefits obtained from the survey. The reported value represents the average of these individually calculated payback periods, providing a more detailed estimate that reflects the variability between households.
These two approaches yield slightly different results. The payback period calculated using aggregated data often results in shorter payback times because it smooths out variations in energy consumption and costs across households. On the other hand, the individually calculated payback period reflects variability among households, leading to slightly longer payback times due to differences in energy usage, roof sizes, or other household-specific factors.
For instance, households using wood as a heating method have a payback period of 9.32 years when calculated using the aggregated approach, compared to 9.55 years when calculated individually. Similarly, households using coal show the longest payback periods in both approaches, with 14.84 years for the aggregated method and 16.33 years for the individual method. It is also evident from Table 19 that out of 1,500 surveyed households, 1,164 are eligible for these analyses based on the suitability of their properties, including the availability of roof surfaces for PV panel installation and the structural feasibility of their buildings.
Figure 15 presents the comparison of payback periods for different heating methods, calculated using aggregated and averaged individual household data.
The results demonstrate that households using coal experience the longest payback periods, while district heating shows the shortest. The discrepancies between the two approaches are minimal, emphasizing the reliability of aggregated data in approximating overall trends. This visualization supports the assessment of financial viability for transitioning to PV systems across heating methods.
6. Discussion
The findings of this paper underline the critical importance of renewable energy solutions, particularly photovoltaic (PV) systems, in addressing energy poverty and mitigating environmental impacts in Bosnia and Herzegovina. One of the most significant opportunities highlighted is the potential role of energy communities in accelerating the adoption of renewable energy technologies. These communities can serve as platforms for collective investment, management, and distribution of renewable energy resources, ensuring cost efficiency and broader accessibility for households.
Energy communities are instrumental in achieving aggregated energy production and consumption goals. By pooling resources, energy communities can:
- Enhance financial feasibility by aggregating investments in PV power plants, reduce individual costs and improve the return on investment (ROI). The research shows that aggregated solar installations lead to shorter payback periods compared to individual efforts, with average payback periods as low as 9 years when implemented collectively;
- Energy communities can advocate for and leverage supportive policies, such as subsidies or tax incentives for renewable energy projects. These policies are essential for reducing the financial burden of transitioning to clean energy systems;
- Households with suitable rooftop areas but limited financial means could lease their rooftops to energy communities for PV installations, enabling broader participation in renewable energy projects.
A significant portion of surveyed households has rooftops suitable for PV installations, yet many lack the financial means or technical knowledge to pursue such projects. Rooftop leasing offers a practical solution, allowing energy communities or private investors to install and manage PV systems. In return, households can receive discounted energy rates or lease payments. This approach maximizes the utilization of available roof space and ensures that energy production aligns with community-wide needs.
For successful implementation, it is crucial to establish supportive policies and financial frameworks. Key recommendations include:
- Governments should provide grants or low-interest loans for energy community projects and individual installations;
- Streamlined permitting and grid connection procedures are necessary to reduce administrative barriers for PV projects;
- Establish dedicated funds to support vulnerable households in transitioning to renewable energy solutions, particularly through energy communities.
Transitioning to renewable energy systems has profound environmental and social benefits. The analysis indicates that adopting PV systems can significantly reduce CO₂ emissions, contributing to national and global climate goals. Moreover, by lowering energy costs, these systems alleviate financial pressures on households, enhancing their quality of life and resilience to energy price fluctuations. Fostering energy communities and promoting rooftop PV installations are transformative strategies for addressing energy poverty and achieving sustainable energy goals. With supportive policies and active community participation, Bosnia and Herzegovina can pave the way for a greener and more equitable energy future. These efforts not only combat energy poverty but also position the nation as a regional leader in renewable energy innovation.
The aggregated approach is useful for policymakers or planners to estimate the overall feasibility and benefits of PV panel installations for broader groups. In contrast, the individual approach highlights specific conditions and variability for each household, making it suitable for customized recommendations. Together, they offer a comprehensive understanding of the financial implications of transitioning to PV panels across various heating methods.
Future research should focus on a more detailed investigation of the impact of transport costs on energy poverty. Transport costs represent a significant component of household energy expenditures, as evidenced by the substantial increase in the Energy Poverty Index when these costs are included in the analysis. Understanding the underlying dynamics of transport-related energy expenditures is essential for developing targeted strategies to alleviate energy poverty.
Additionally, future research should explore proposals for the electrification of transportation systems as a means to reduce energy poverty. Transitioning to electric vehicles (EVs) and integrating public transportation with renewable energy sources can substantially lower transportation costs for households, particularly for vulnerable populations. Such an approach not only addresses financial challenges but also aligns with broader goals of reducing greenhouse gas emissions and fostering environmental sustainability.
To support these efforts, future research should evaluate the feasibility and economic benefits of electrified transport solutions, such as the installation of public EV charging infrastructure powered by renewable energy and incentives for adopting EVs. These would provide valuable insights into how transport electrification can complement renewable energy initiatives to create a holistic framework for reducing energy poverty and improving energy equity in Bosnia and Herzegovina.
7. Conclusions
This research provides a comprehensive analysis of energy poverty in Bosnia and Herzegovina, emphasizing the potential for renewable energy solutions, particularly photovoltaic (PV) systems, to alleviate financial burdens on households and contribute to environmental sustainability. The findings reveal that energy poverty is a significant issue, with 96.5% of households experiencing moderate to high energy poverty when transport costs are included, and 84.3% when they are excluded. On average, households using electric power for heating spend 900.78 BAM annually, consuming 3,503.05 kWh of energy. These figures underline the pressing need for targeted interventions to reduce energy poverty while improving energy efficiency.
The research highlights the considerable potential of rooftop PV installations to address these challenges. Among the surveyed households, 72.5% have rooftops smaller than 50 m², while 25.6% have 50–100 m² available for PV installations. Despite the relatively small average roof area, the aggregation of rooftop resources through energy communities enables substantial energy generation. For instance, households using wood heating collectively possess 26,104 m² of rooftop area, which could support 6,526 kW of PV capacity, generating 7,831,200 kWh annually. This could lead to annual heating cost savings of 1,050,231.5 BAM, with an average ROI of 9.3 years. Similarly, households relying on pellet heating could install 1,858.625 kW of PV capacity on their collective rooftop area of 7,434.5 m², generating 2,230,350 kWh of energy annually. This would result in annual savings of 243,633.6 BAM and a payback period of 11.4 years.
Transitioning to renewable energy systems also offers significant environmental benefits. Households using wood heating could reduce CO₂ emissions by 1,389,825 kg annually, while those relying on pellets could achieve a reduction of 59,509.8 kg annually. For coal-heated households with a rooftop potential of 1,280 m², PV installations could generate 383,868 kWh annually, significantly reducing the 159,600 kg of CO₂ emissions produced by coal consumption. These environmental benefits underscore the role of renewable energy in addressing both energy poverty and climate change.
The results underline the transformative potential of energy communities in promoting renewable energy adoption. By pooling resources and enabling collective action, energy communities can reduce costs, streamline project implementation, and ensure that even households without financial means can benefit from renewable energy installations. Rooftop leasing presents another practical solution, allowing households with available roof space to contribute to energy production while receiving financial compensation. This approach ensures optimal utilization of resources and broadens access to renewable energy benefits.
Policy support is crucial for realizing these opportunities. Subsidies and financial incentives should be established to reduce upfront costs for renewable energy projects. Simplified permitting and grid connection processes are necessary to encourage broader participation in PV installations. Additionally, energy poverty alleviation funds targeting vulnerable households could accelerate the adoption of renewable energy systems and reduce disparities in energy access.
In conclusion, this paper demonstrates the substantial potential of renewable energy systems to address energy poverty while contributing to environmental goals in Bosnia and Herzegovina. By fostering energy communities, promoting rooftop PV installations, and implementing supportive policies, the nation can achieve significant economic and environmental benefits. The quantitative findings illustrate that renewable energy adoption not only reduces financial burdens for households—resulting in potential savings of up to 1,050,231.5 BAM annually for specific groups—but also significantly lowers CO₂ emissions. These initiatives align with global energy transition goals and position Bosnia and Herzegovina as a regional leader in renewable energy innovation.
Author Contributions
Conceptualization: M.M.D., A.A. and N.D.; methodology: M.M.D. and A.M.; validation: A.M. and N.D.; formal analysis: M.M.D and S.A.; investigation: A.M.; resources: N.D.; data curation: M.M.D., S.A. and N.D.; writing—original draft preparation: M.M.D., A.M. and N.D.; writing—review and editing: A.M.; visualization and supervision: S.A and A.M.
Funding
This research is supported by The Minister for Science, Higher Education and Youth of Sarajevo Canton (Project titled: The Challenge of Extreme Energy Poverty: Strategic Approaches for Sarajevo Canton).
Conflicts of Interest
The authors declare no conflict of interest.
Abbreviations
| EPI | Energy Poverty Index |
| CO₂ | Carbon Dioxide |
| PV | Photovoltaic |
| MEPI | Multidimensional Energy Poverty Index |
| EU | European Union |
| B&RI | Belt and Road Initiative |
| AHP | Analytic Hierarchy Process |
| BAM | Bosnian Convertible Mark |
| PCA | Principal Component Analysis |
| SD | Standard Deviation |
References
- İpek. E.; İpek. Ö. Energy poverty and health in Turkey: Evidence from Longitudinal data. Renewable and Sustainable Energy Reviews 2024. 203. 114777. https://doi.org/10.1016/j.rser.2024.114777. [CrossRef]
- Bouzarovski S. Energy poverty in the European union: Landscapes of vulnerability. Wiley Interdisciplinary Reviews: Energy Environ 2014. 3(3). 276–89. https://doi.org/10.1002/wene.89. [CrossRef]
- Strambo. C.; Segnestam. L; Jahović. B. Air pollution in Bosnia and Herzegovina: a gender equality. social equity and poverty reduction lens. Stockholm Environment Institute: BiH ESAP 2030+(discussion brief). May 2021. pp.1-6.
- Worlddata.info. Available online: https://www.worlddata.info/europe/bosnia-and-herzegovina/energy-consumption.php (accessed on 12.10.2024).
- Kolokotsa. D.; Santamouris. M. Energy poverty in Europe: Challenges for energy efficiency. In Proceedings of the IISA 2014—The 5th International Conference on Information. Intelligence. Systems and Applications. Chania. Greece. 7–9 July 2014; IEEE. pp. 229–234. https://doi.org/10.1109/IISA.2014.6878736. [CrossRef]
- Tešanović. M; Hivziefendić. J. Survey of Energy Poverty in Bosnia and Herzegovina. In Advanced Technologies. Systems. and Applications IV-Proceedings of the International Symposium on Innovative and Interdisciplinary Applications of Advanced Technologies (IAT 2019) 2020. pp. 126-136. Lecture Notes in Networks and Systems. vol 83. Springer. Cham. https://doi.org/10.1007/978-3-030-24986-1_10. [CrossRef]
- Bouzarovski. S.; Petrova. S.; Sarlamanov. R. Energy poverty policies in the EU: A critical perspective. Energy Policy 2012. 49. 76–82. https://doi.org/10.1016/j.enpol.2012.01.033. [CrossRef]
- Poggi. A.; Florio. M. Energy deprivation dynamics and regulatory reforms in Europe: Evidence from household panel data. Energy Policy 2010. 38. 253–264. https://doi.org/10.1016/j.enpol.2009.09.014. [CrossRef]
- Preradović. L.; Gvero. P.; Kotur. M. Energetsko siromaštvo–rezultati ankete provedene na Univerzitetu u Banjoj Luci. In Proceedings of the ENEF 2023—Energetska Efikasnost. Banja Luka. Bosnia and Herzegovina. 26–27 April 2023.
- Dokupilová. D.; Stojilovska. A.; Palma. P.; Gouveia. J.P.; Paschalidou. E.G.; Barrella. R.; Feenstra. M.; Horta. A.; Sánchez-Guevara. C.; Kádár. J.; et al. Exploring Energy Poverty in Urban and Rural Contexts in the Era of Climate Change: A Comparative Analysis of European Countries and Israel. Energies 2024. 17. 2939. https://doi.org/10.3390/en17122939. [CrossRef]
- Nussbaumer. P.; Bazilian. M.; Modi. V. Measuring energy poverty: Focusing on what matters. Renew. Sustain. Energy Rev. 2012. 16. 231–243. https://doi.org/10.1016/j.rser.2011.07.150. [CrossRef]
- Bouzarovski. S.; Brajković. J.; Robić. S.; Brown. C.; Vuchkova. I. Energy poverty in the Energy Community region: Interrogating policy formulation and coverage. Eur. Urban Reg. Stud. 2024. 31. 184–199. https://doi.org/10.1177/09697764231162229. [CrossRef]
- Bouzarovski. S.; Thomson. H.; Cornelis. M. Confronting Energy Poverty in Europe: A Research and Policy Agenda. Energies 2021. 14. 858. https://doi.org/10.3390/en14040858. [CrossRef]
- Kocak. E.; Ulug. E.E.; Oralhan. B. The impact of electric power from renewable and non-renewable sources on energy poverty and greenhouse gas emissions (GHGs): Empirical evidence and policy implications. Energy 2023. 272. 127125. https://doi.org/10.1016/j.energy.2023.127125. [CrossRef]
- Zhao. J.; Dong. K.; Dong. X. How does energy poverty eradication affect global carbon neutrality? Renew. Sustain. Energy Rev. 2024. 191. 114104. https://doi.org/10.1016/j.rser.2023.114104. [CrossRef]
- Robić. S. Metoda za određivanje praga energijskoga siromaštva temeljena na energijskim. klimatskim. socijalnim i zdravstvenim pokazateljima. Ph.D. Thesis. University of Zagreb. Faculty of Electrical Engineering and Computing. Zagreb. Croatia. 2023.
- Rajić. M.N.; Milovanović. M.B.; Antić. D.S.; Maksimović. R.M.; Milosavljević. P.M.; Pavlović. D.L. Analyzing energy poverty using intelligent approach. Energy Environ. 2020. 31. 1448–1472. https://doi.org/10.1177/0958305X20907087. [CrossRef]
- Dedović. M.M.; Avdaković. S.; Mujezinović. A.; Dautbašić. N. Integration of PV into the Sarajevo Canton Energy System-Air Quality and Heating Challenges. Energies 2021. 14. 123. https://doi.org/10.3390/en14010123. [CrossRef]
- Central Bank of Bosnia and Herzegovina. Available online: https://www.cbbh.ba (accessed on 30 October 2024).
- IBM Corp. IBM SPSS Statistics for Windows, Version 28.0. IBM Corp.: Armonk, NY, USA, 2021.
- Baumgartner, H.; Homburg, C. Factor Analysis. In Handbook of Market Research; Homburg, C., Klarmann, M., Vomberg, A., Eds.; Springer: Cham, Switzerland, 2023; https://doi.org/10.1007/978-3-319-05542-8_13-1. [CrossRef]
- Kang, H.; Zhao, H. Description and application research of multiple regression model optimization algorithm based on data set denoising. J. Phys.: Conf. Ser. 2020, 1631, 012063. https://doi.org/10.1088/1742-6596/1631/1/012063. [CrossRef]
- Gawusu, S.; Jamatutu, S.A.; Zhang, X.; Moomin, S.T.; Ahmed, A.; Mensah, R.A.; Das, O.; Ackah, I. Spatial analysis and predictive modeling of energy poverty: insights for policy implementation. Environ. Dev. Sustain. 2024, 1–48. https://doi.org/10.1007/s10668-024-05015-4. [CrossRef]
- Deru, M.P.; Torcellini, P.A. Source Energy and Emission Factors for Energy Use in Buildings; National Renewable Energy Laboratory: Golden, CO, USA, 2007; pp. 1–47.
- Singh, R.; Banerjee, R. Estimation of rooftop solar photovoltaic potential of a city. Sol. Energy 2015, 115, 589–602. https://doi.org/10.1016/j.solener.2015.03.016. [CrossRef]
- Pavlović, T.; Milosavljević, D.; Radonjić, I.; Pantić, L.; Radivojević, A.; Pavlović, M. Possibility of electricity generation using PV solar plants in Serbia. Renew. Sustain. Energy Rev. 2013, 20, 201–218. https://doi.org/10.1016/j.rser.2012.11.070. [CrossRef]
- Public Enterprise Electric Utility of Bosnia and Herzegovina. Price of Electricity. Available online: https://www.epbih.ba/eng/page/price-of-electricity (accessed on 30 November 2024).
- E3 Analytics. Country Report: Bosnia and Herzegovina. Available online: https://www.e3analytics.eu/wp-content/uploads/2020/11/E3A_Country-Report_BIH_BIH.pdf (accessed on 28 October 2024).
- Green Economic Development. CO₂ Calculator. Available online: https://ged.ba/co2-kalkulator/ (accessed on 10 November 2024).
- Forest Research. Typical Calorific Values of Fuels. Available online: https://www.forestresearch.gov.uk/tools-and-resources/fthr/biomass-energy-resources/reference-biomass/facts-figures/typical-calorific-values-of-fuels/ (accessed on 12 October 2024).
- Ljubić, H.; Volarić, T.; Rozić, R. Exploratory Data Analysis and Prediction of Fuel Prices in FBiH Relative to Oil Price Movements. ESS Open Archive 2024, eprints 100, 10074277. https://doi.org/10.31223/X10074277. [CrossRef]
Figure 2.
Distribution of household income and expenditure categories. (a) Frequency distribution of annual income categories among respondents; (b) Distribution of households based on their annual electric power expenditure; (c) Distribution of households based on their annual heating expenses; (d) Distribution of households based on their annual transport expenditure.
Figure 2.
Distribution of household income and expenditure categories. (a) Frequency distribution of annual income categories among respondents; (b) Distribution of households based on their annual electric power expenditure; (c) Distribution of households based on their annual heating expenses; (d) Distribution of households based on their annual transport expenditure.
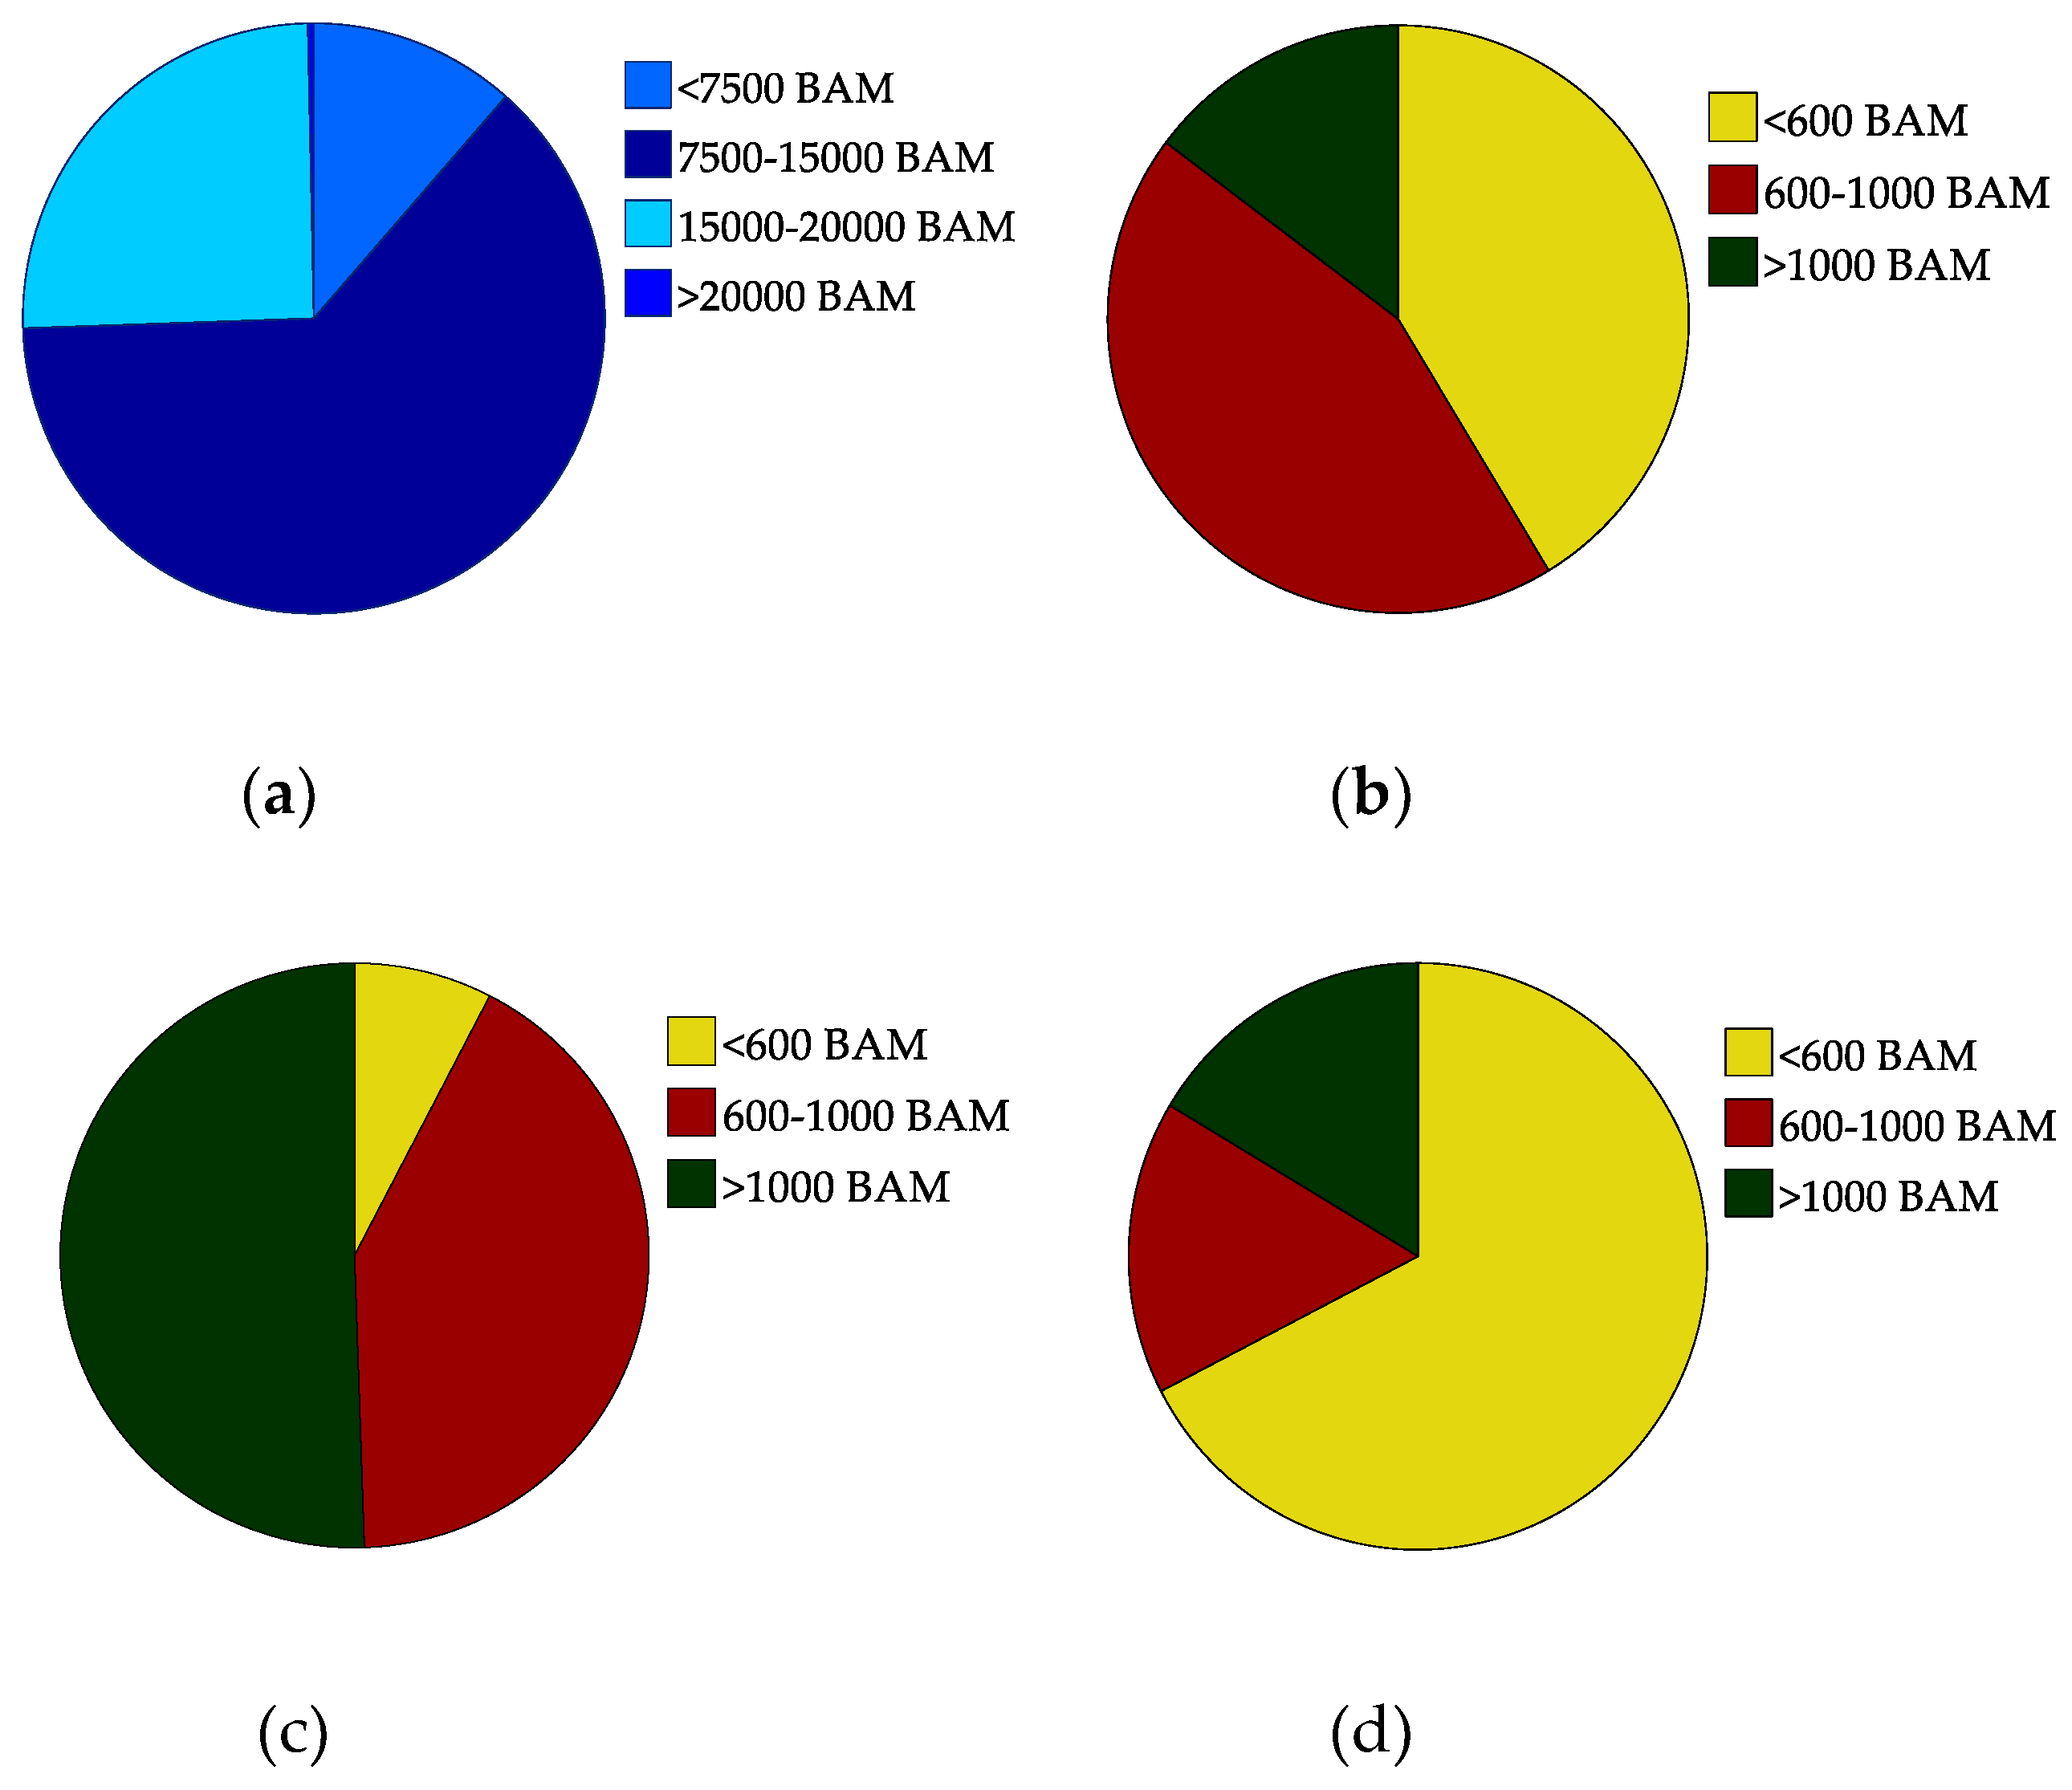
Figure 3.
Transport expenditure and respondent frequency across different transportation methods.
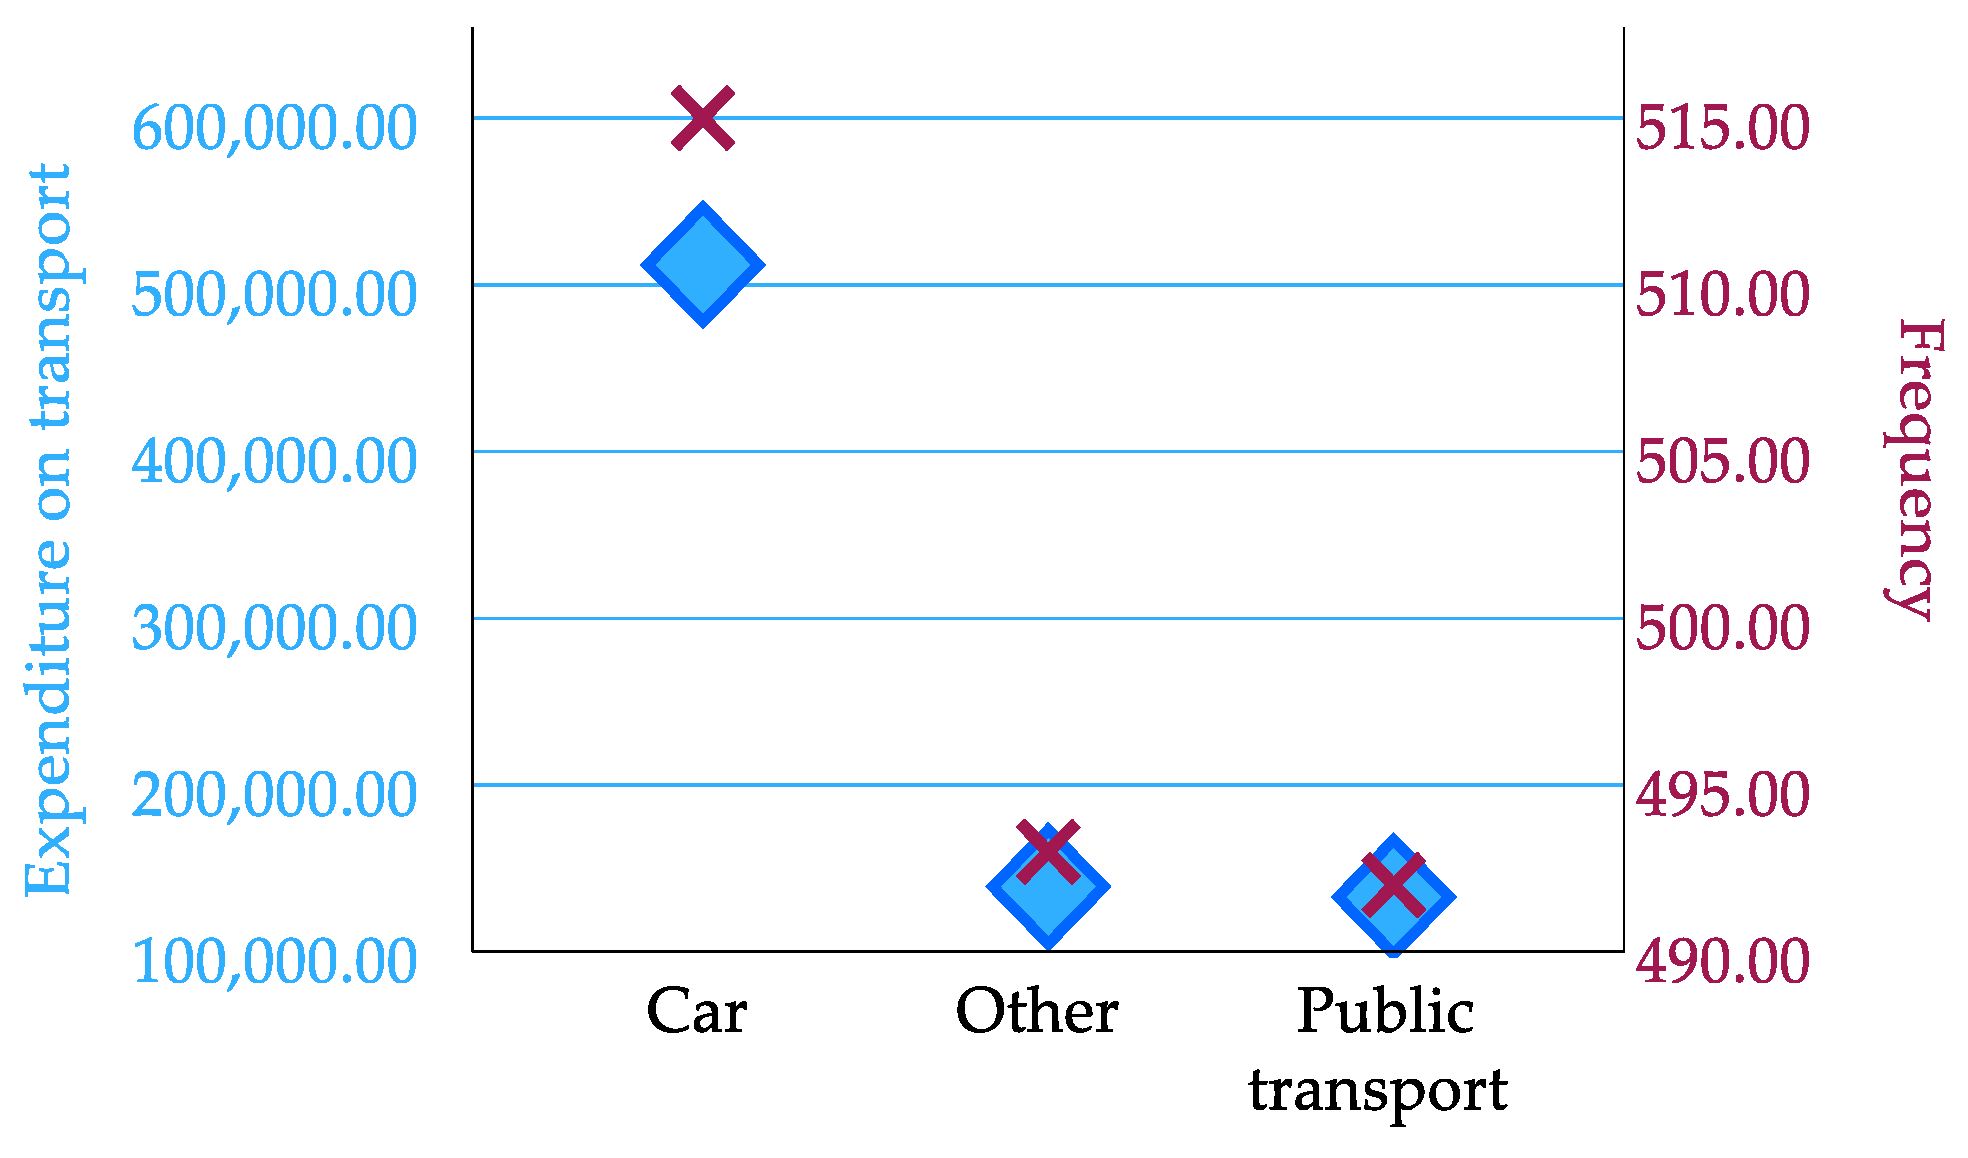
Figure 4.
Distribution of roof areas available for PV panel installation.
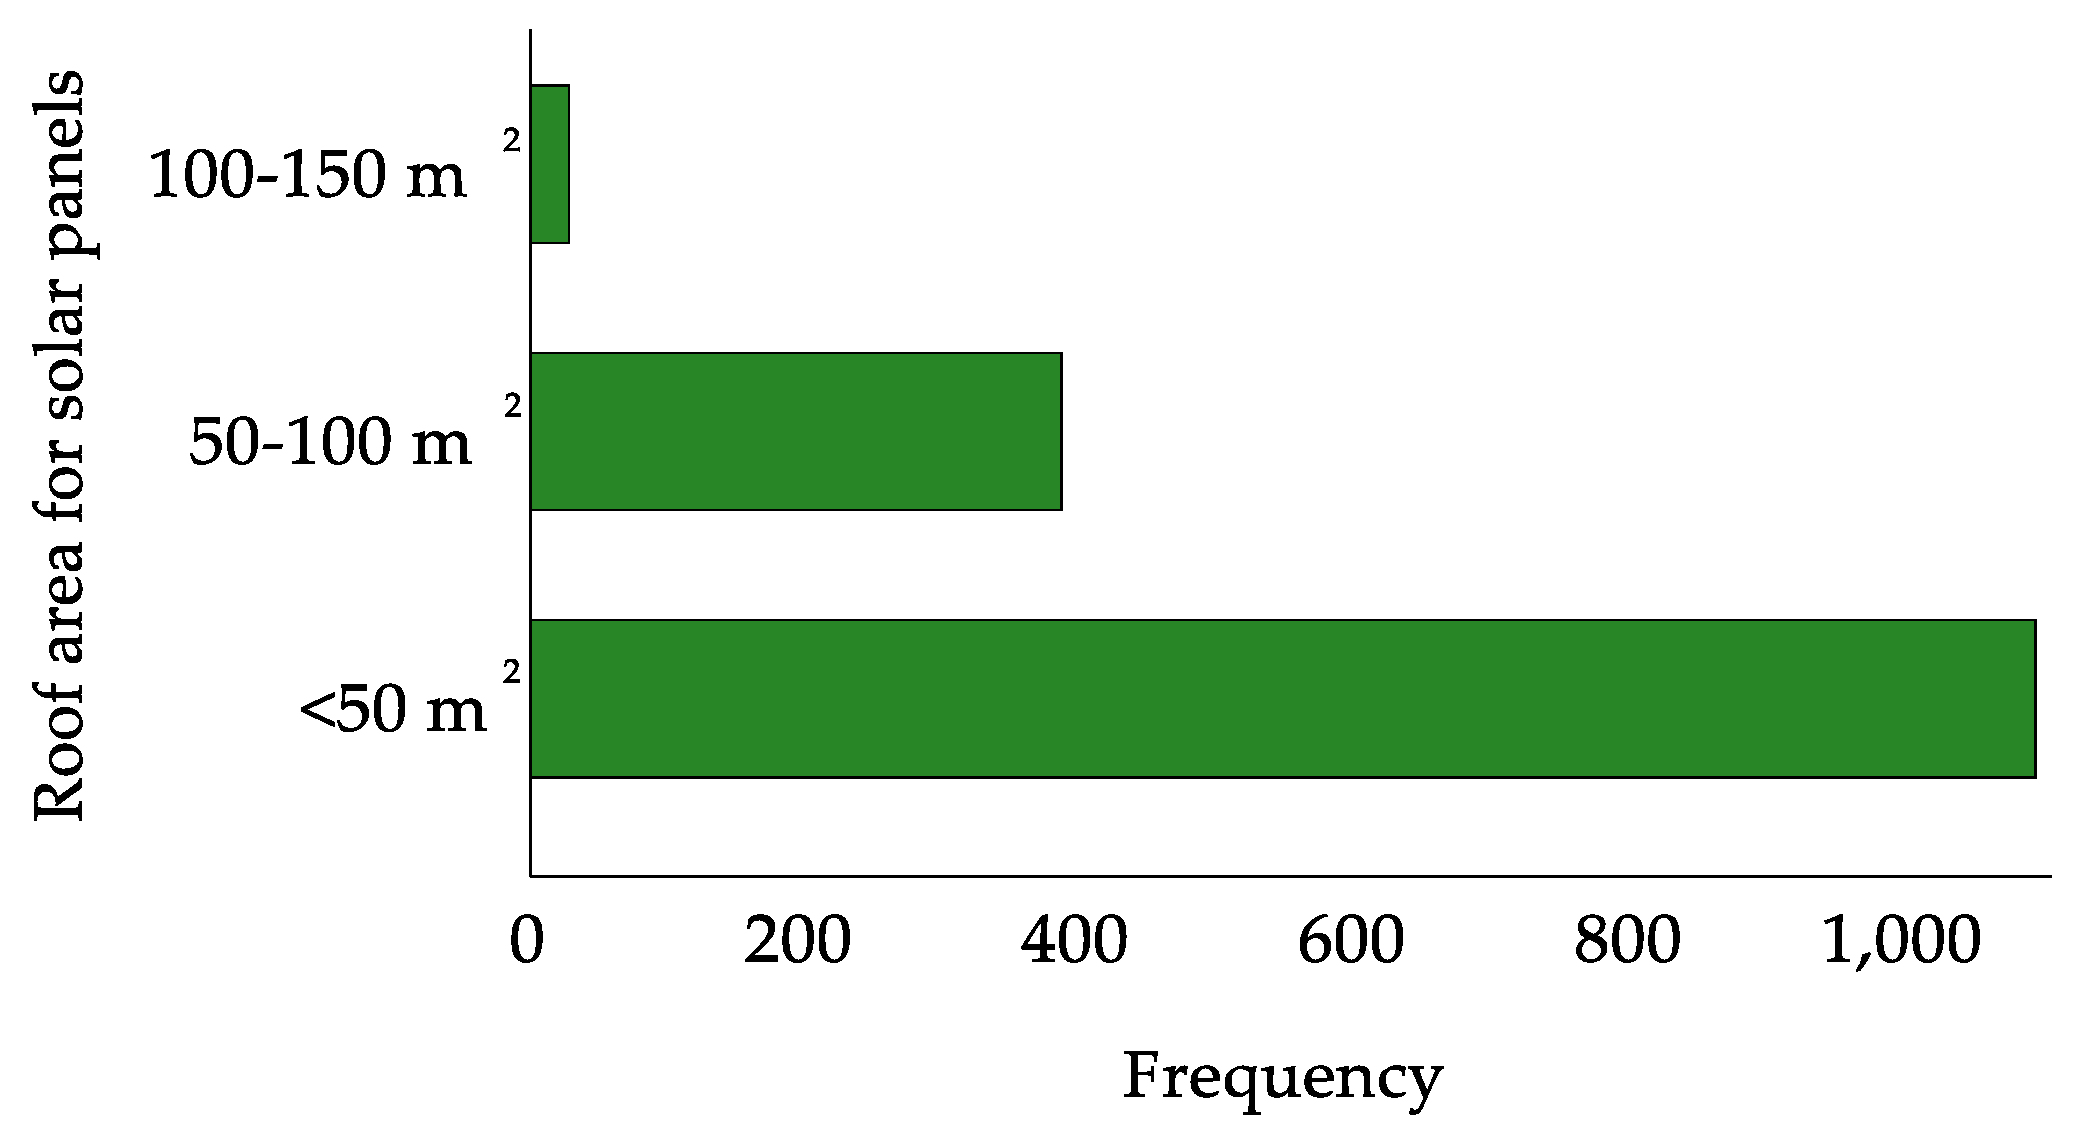
Figure 5.
Average heating expenditure (BAM) and consumption of various heating sources (wood, gas, coal, and pellets) by apartment size: (a) Wood consumption; (b) Gas consumption; (c) Coal consumption; (d) Pellet consumption.
Figure 5.
Average heating expenditure (BAM) and consumption of various heating sources (wood, gas, coal, and pellets) by apartment size: (a) Wood consumption; (b) Gas consumption; (c) Coal consumption; (d) Pellet consumption.
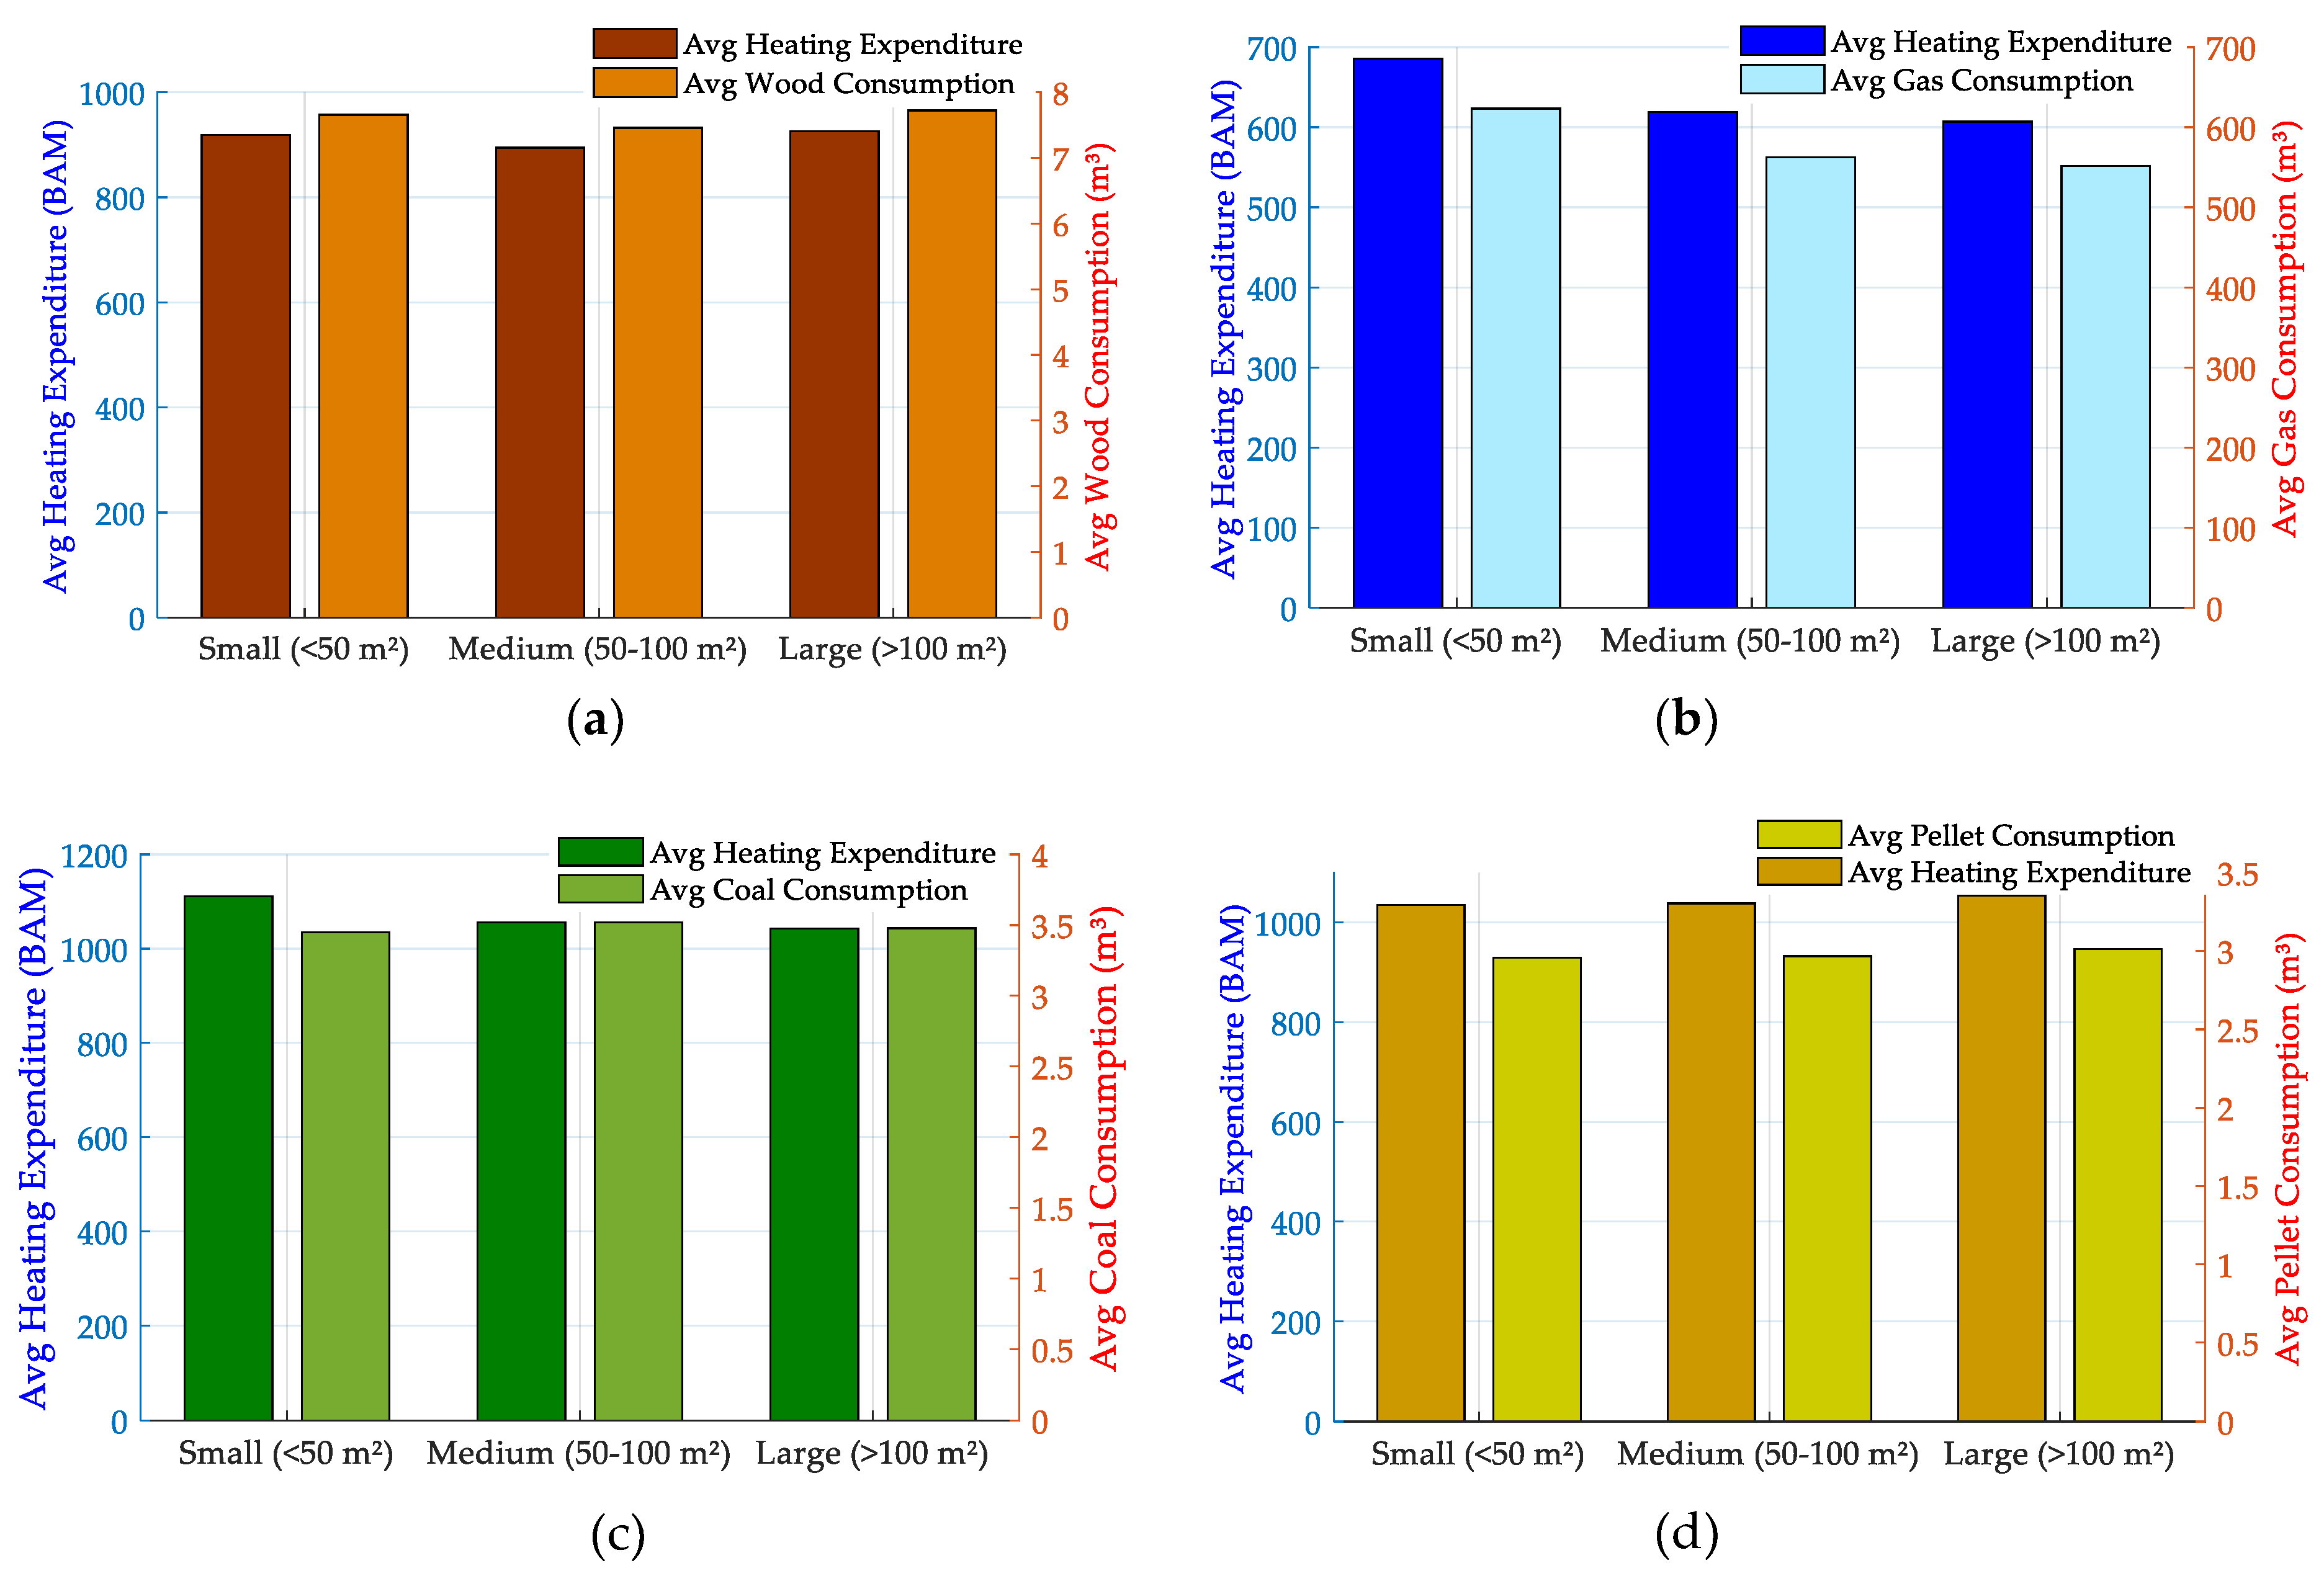
Figure 6.
Annual heating expenditure, electric power consumption, and household income for electric power-heating households.
Figure 6.
Annual heating expenditure, electric power consumption, and household income for electric power-heating households.
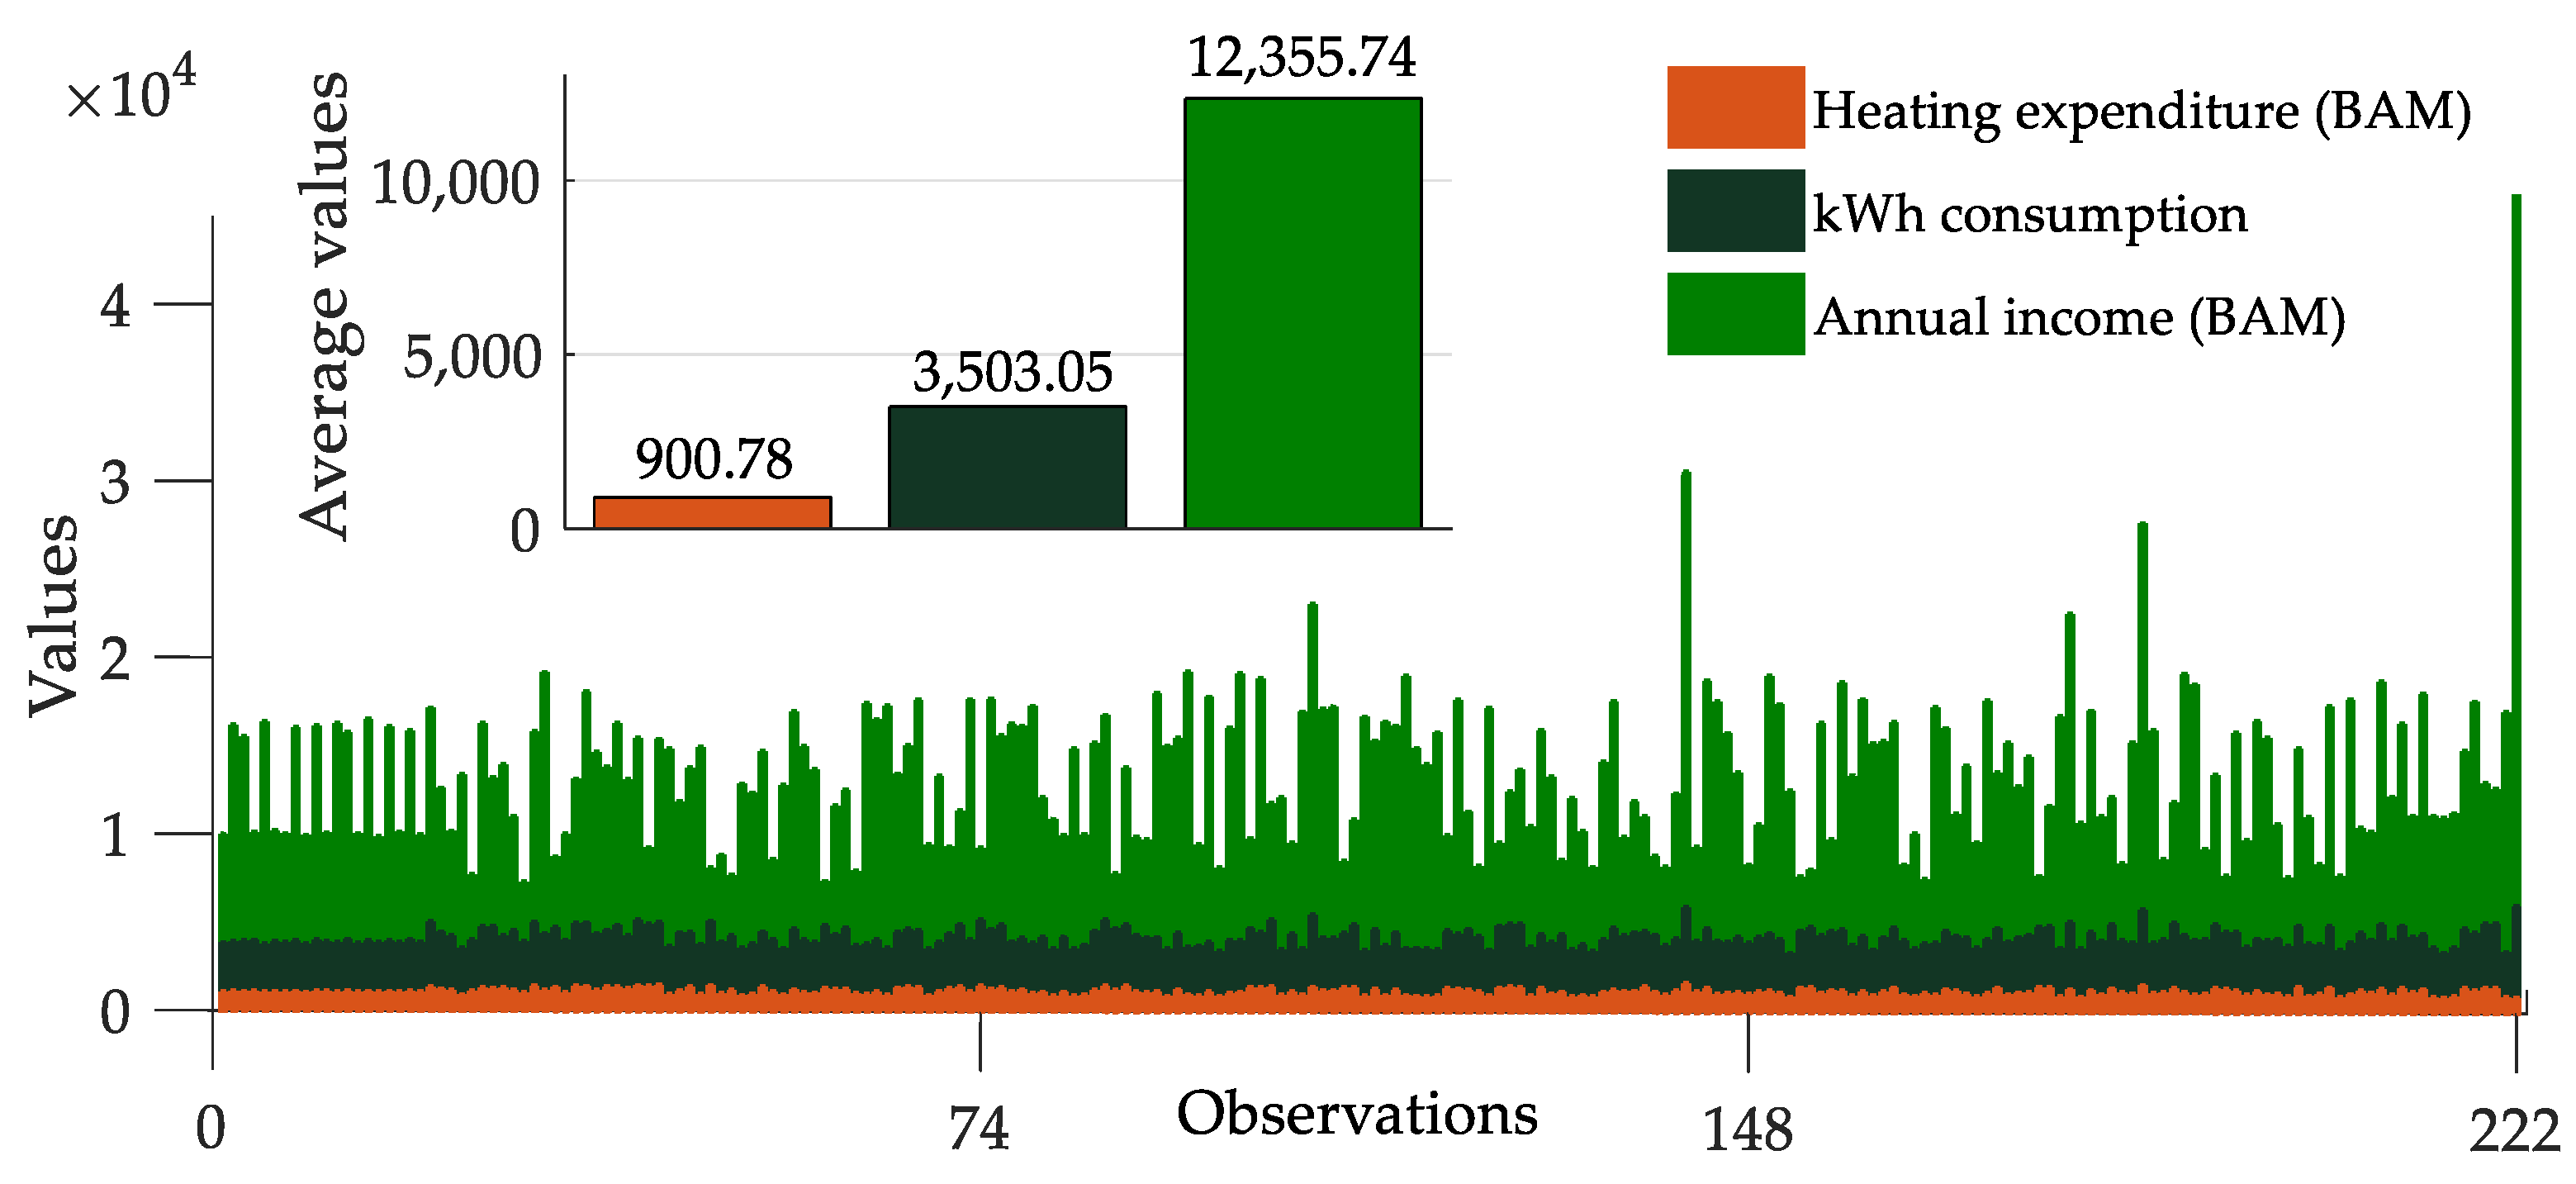
Figure 7.
Energy Poverty Index categories (case 1).
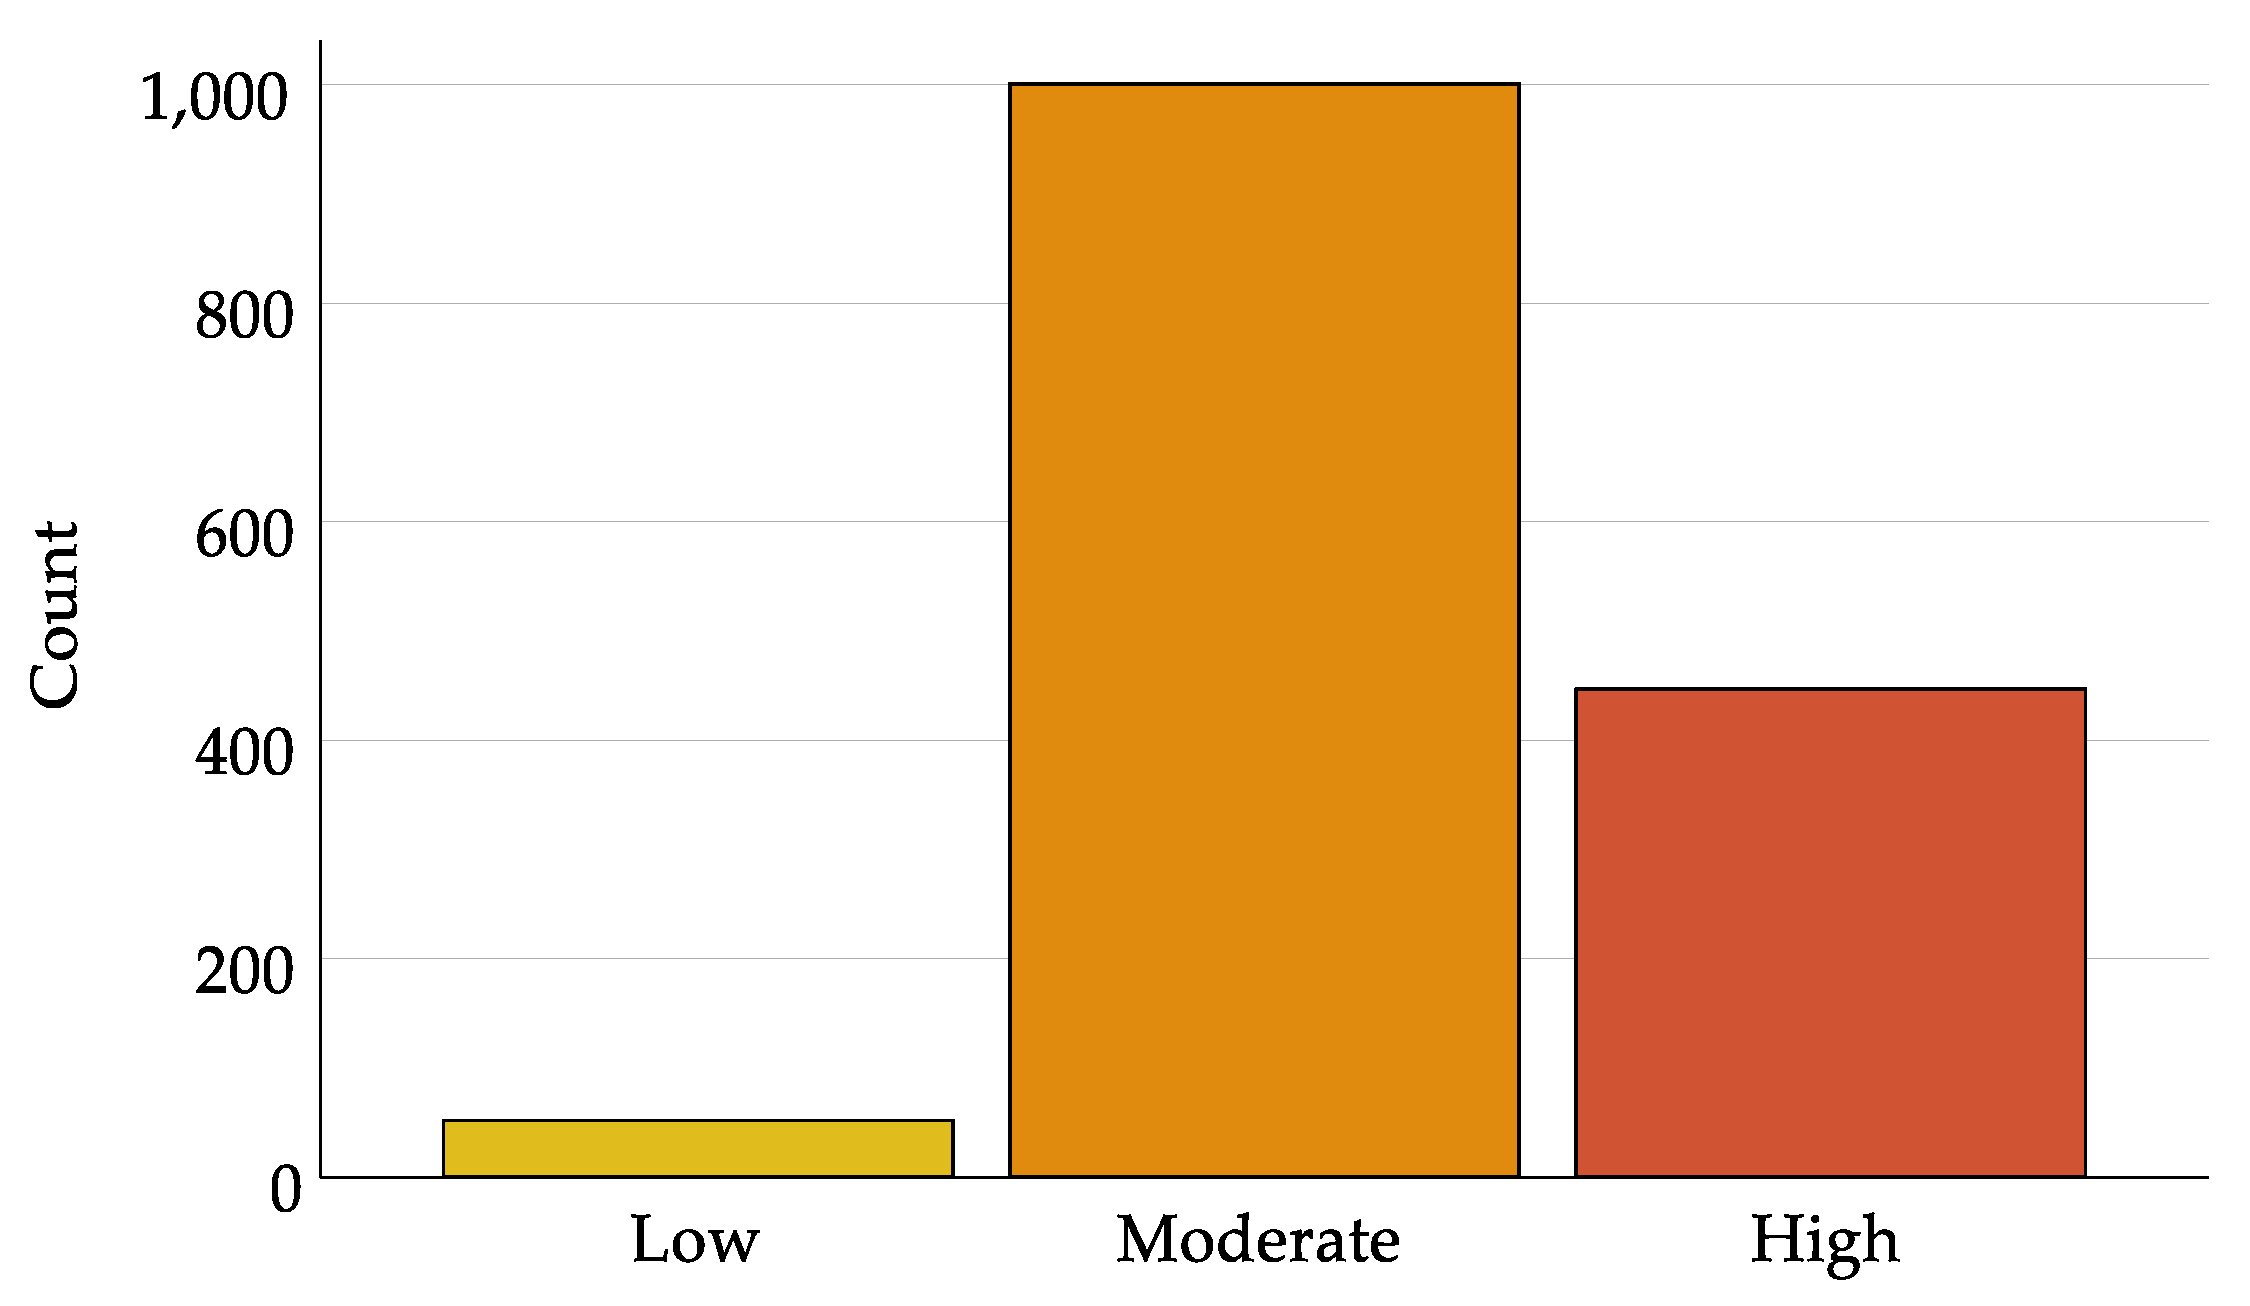
Figure 8.
Energy Poverty Index categories (case 2).
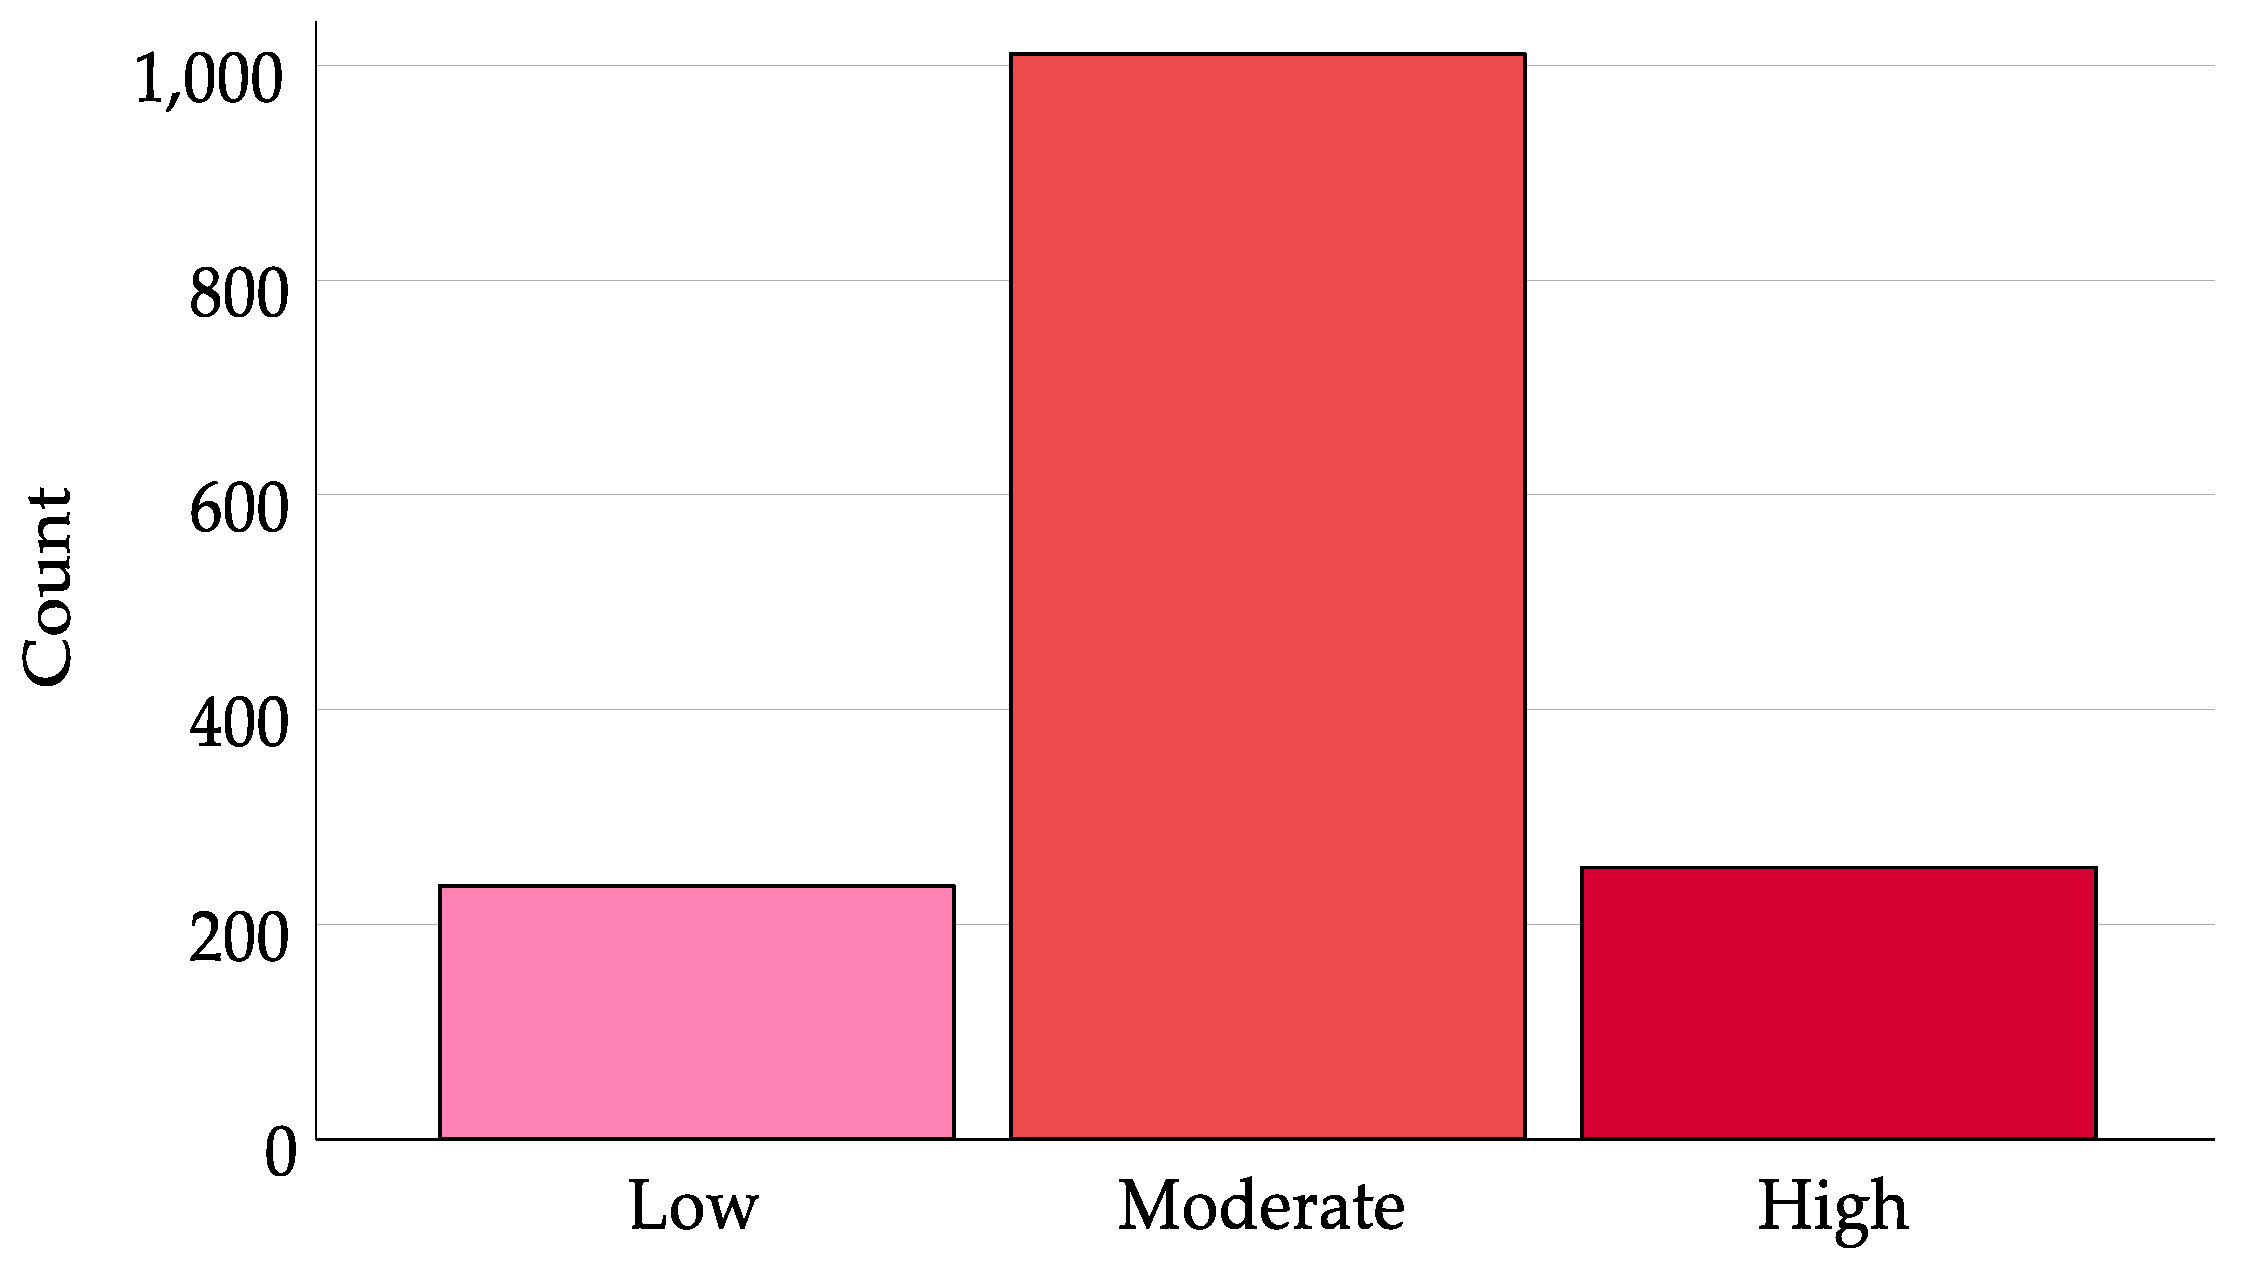
Figure 9.
Distribution of break-even periods for PV panel investments in households with retirees.
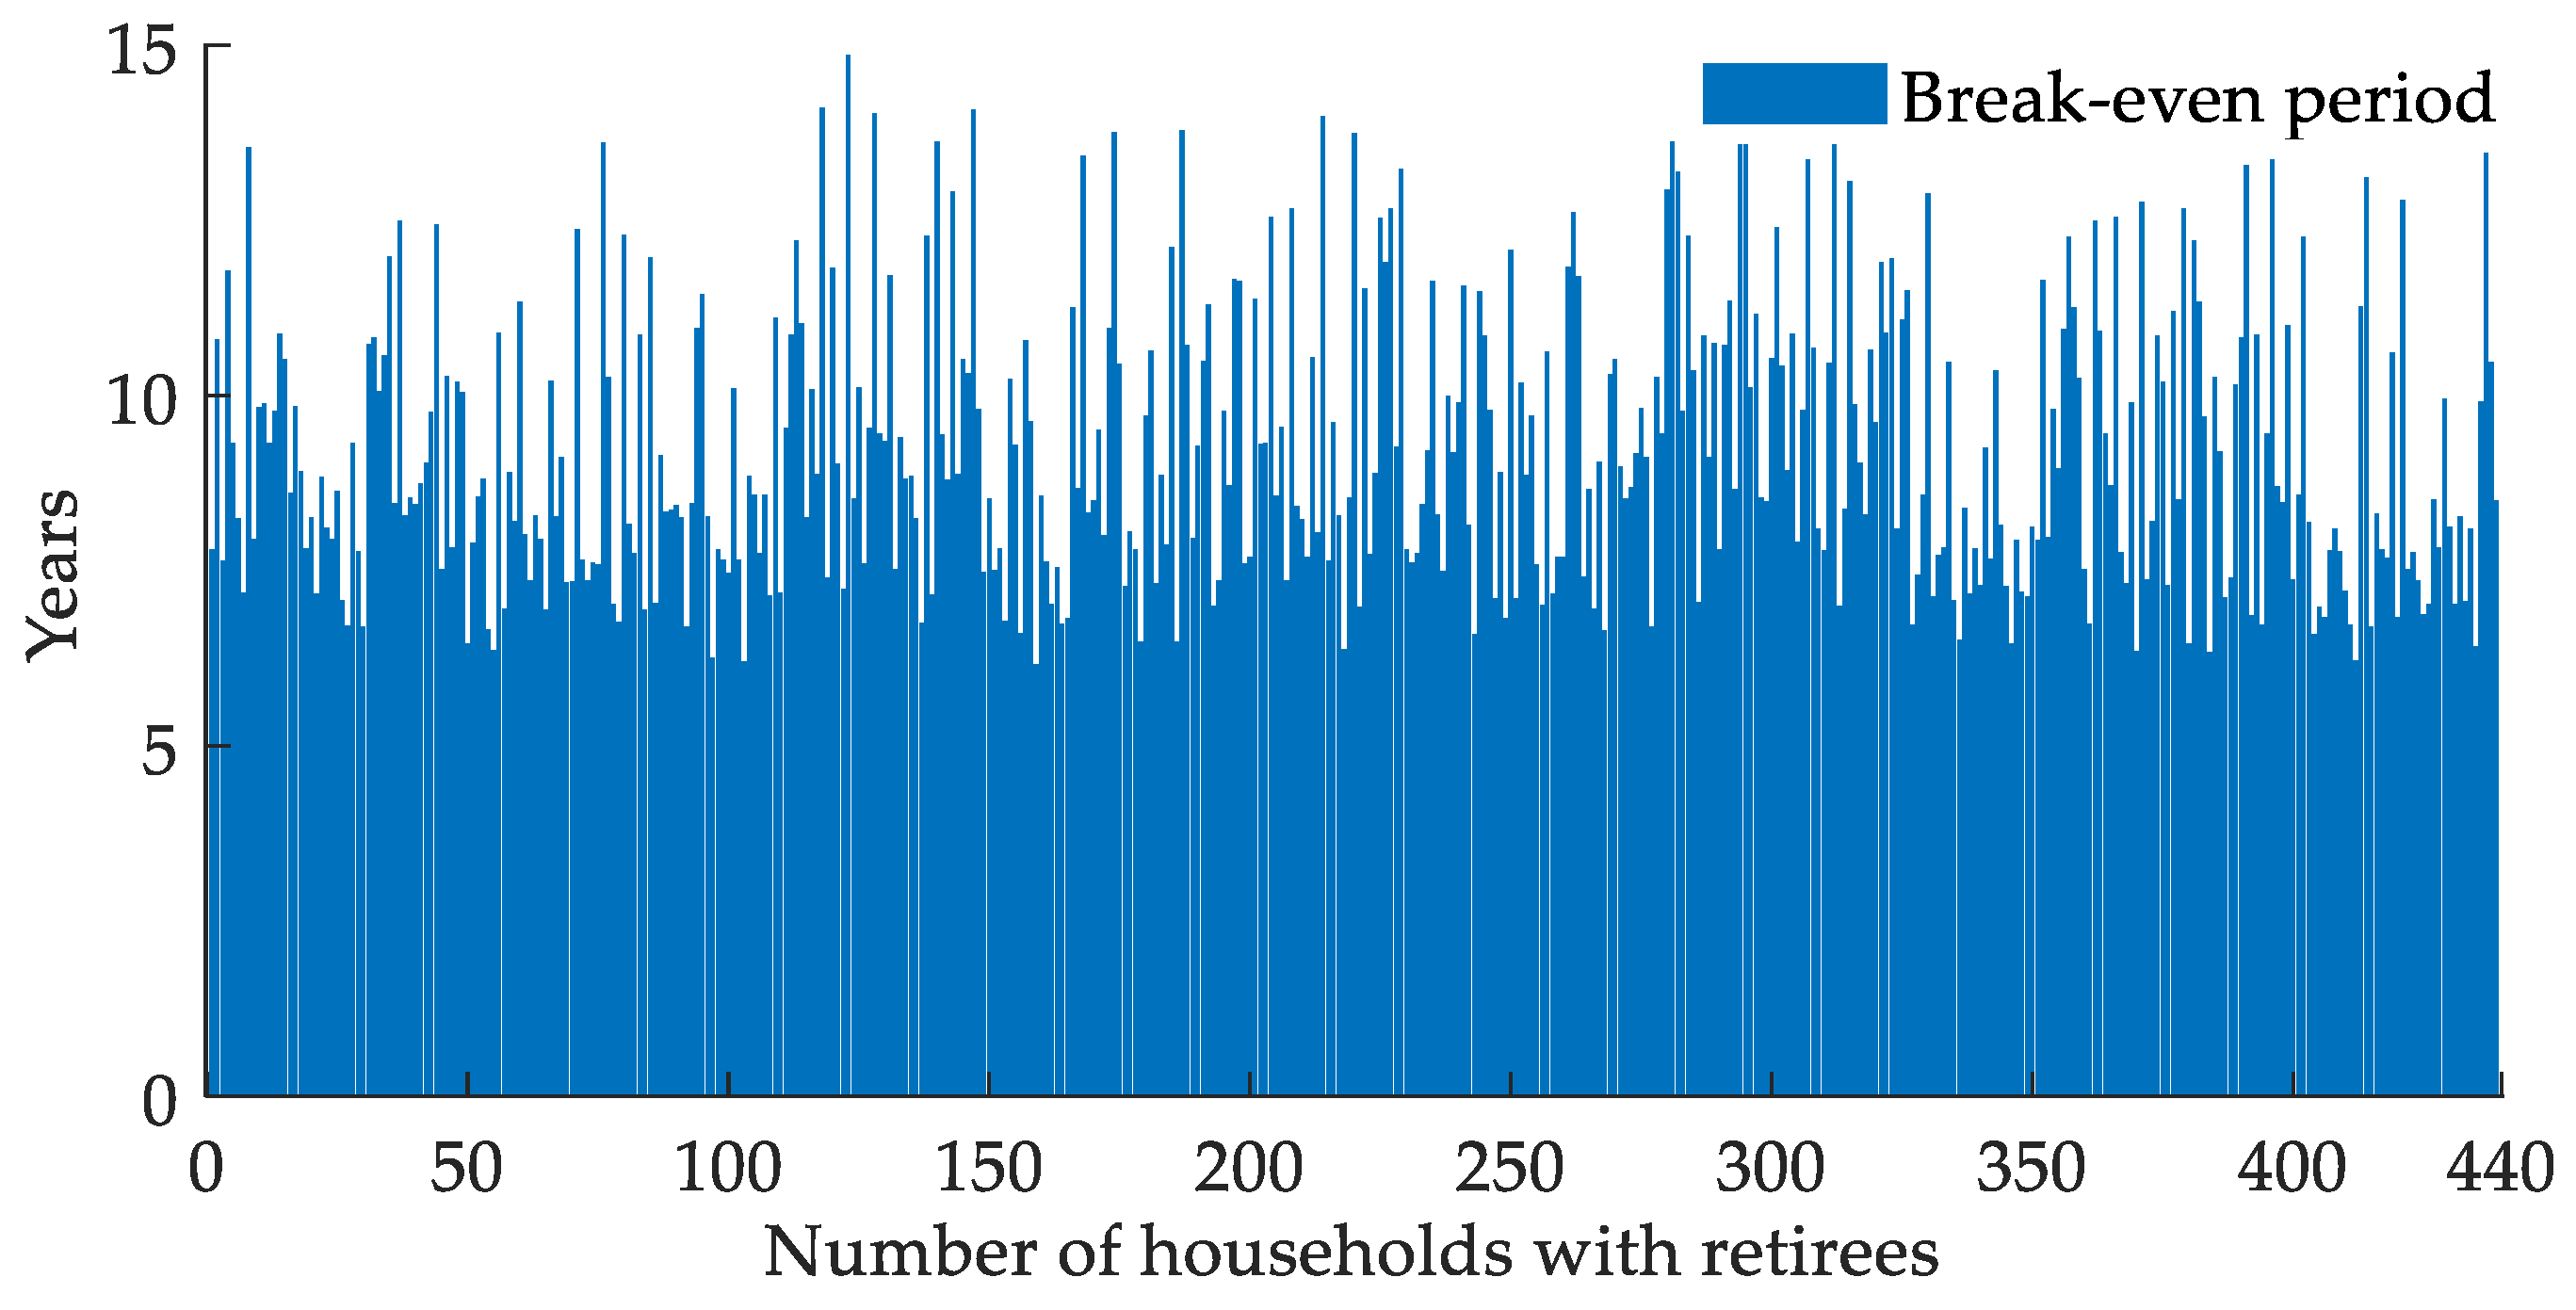
Figure 10.
Scatter plot of rooftop area for PV panels (m²) vs. net heating energy balance (kWh) for 113 households, showing surpluses (positive) and deficits (negative).
Figure 10.
Scatter plot of rooftop area for PV panels (m²) vs. net heating energy balance (kWh) for 113 households, showing surpluses (positive) and deficits (negative).
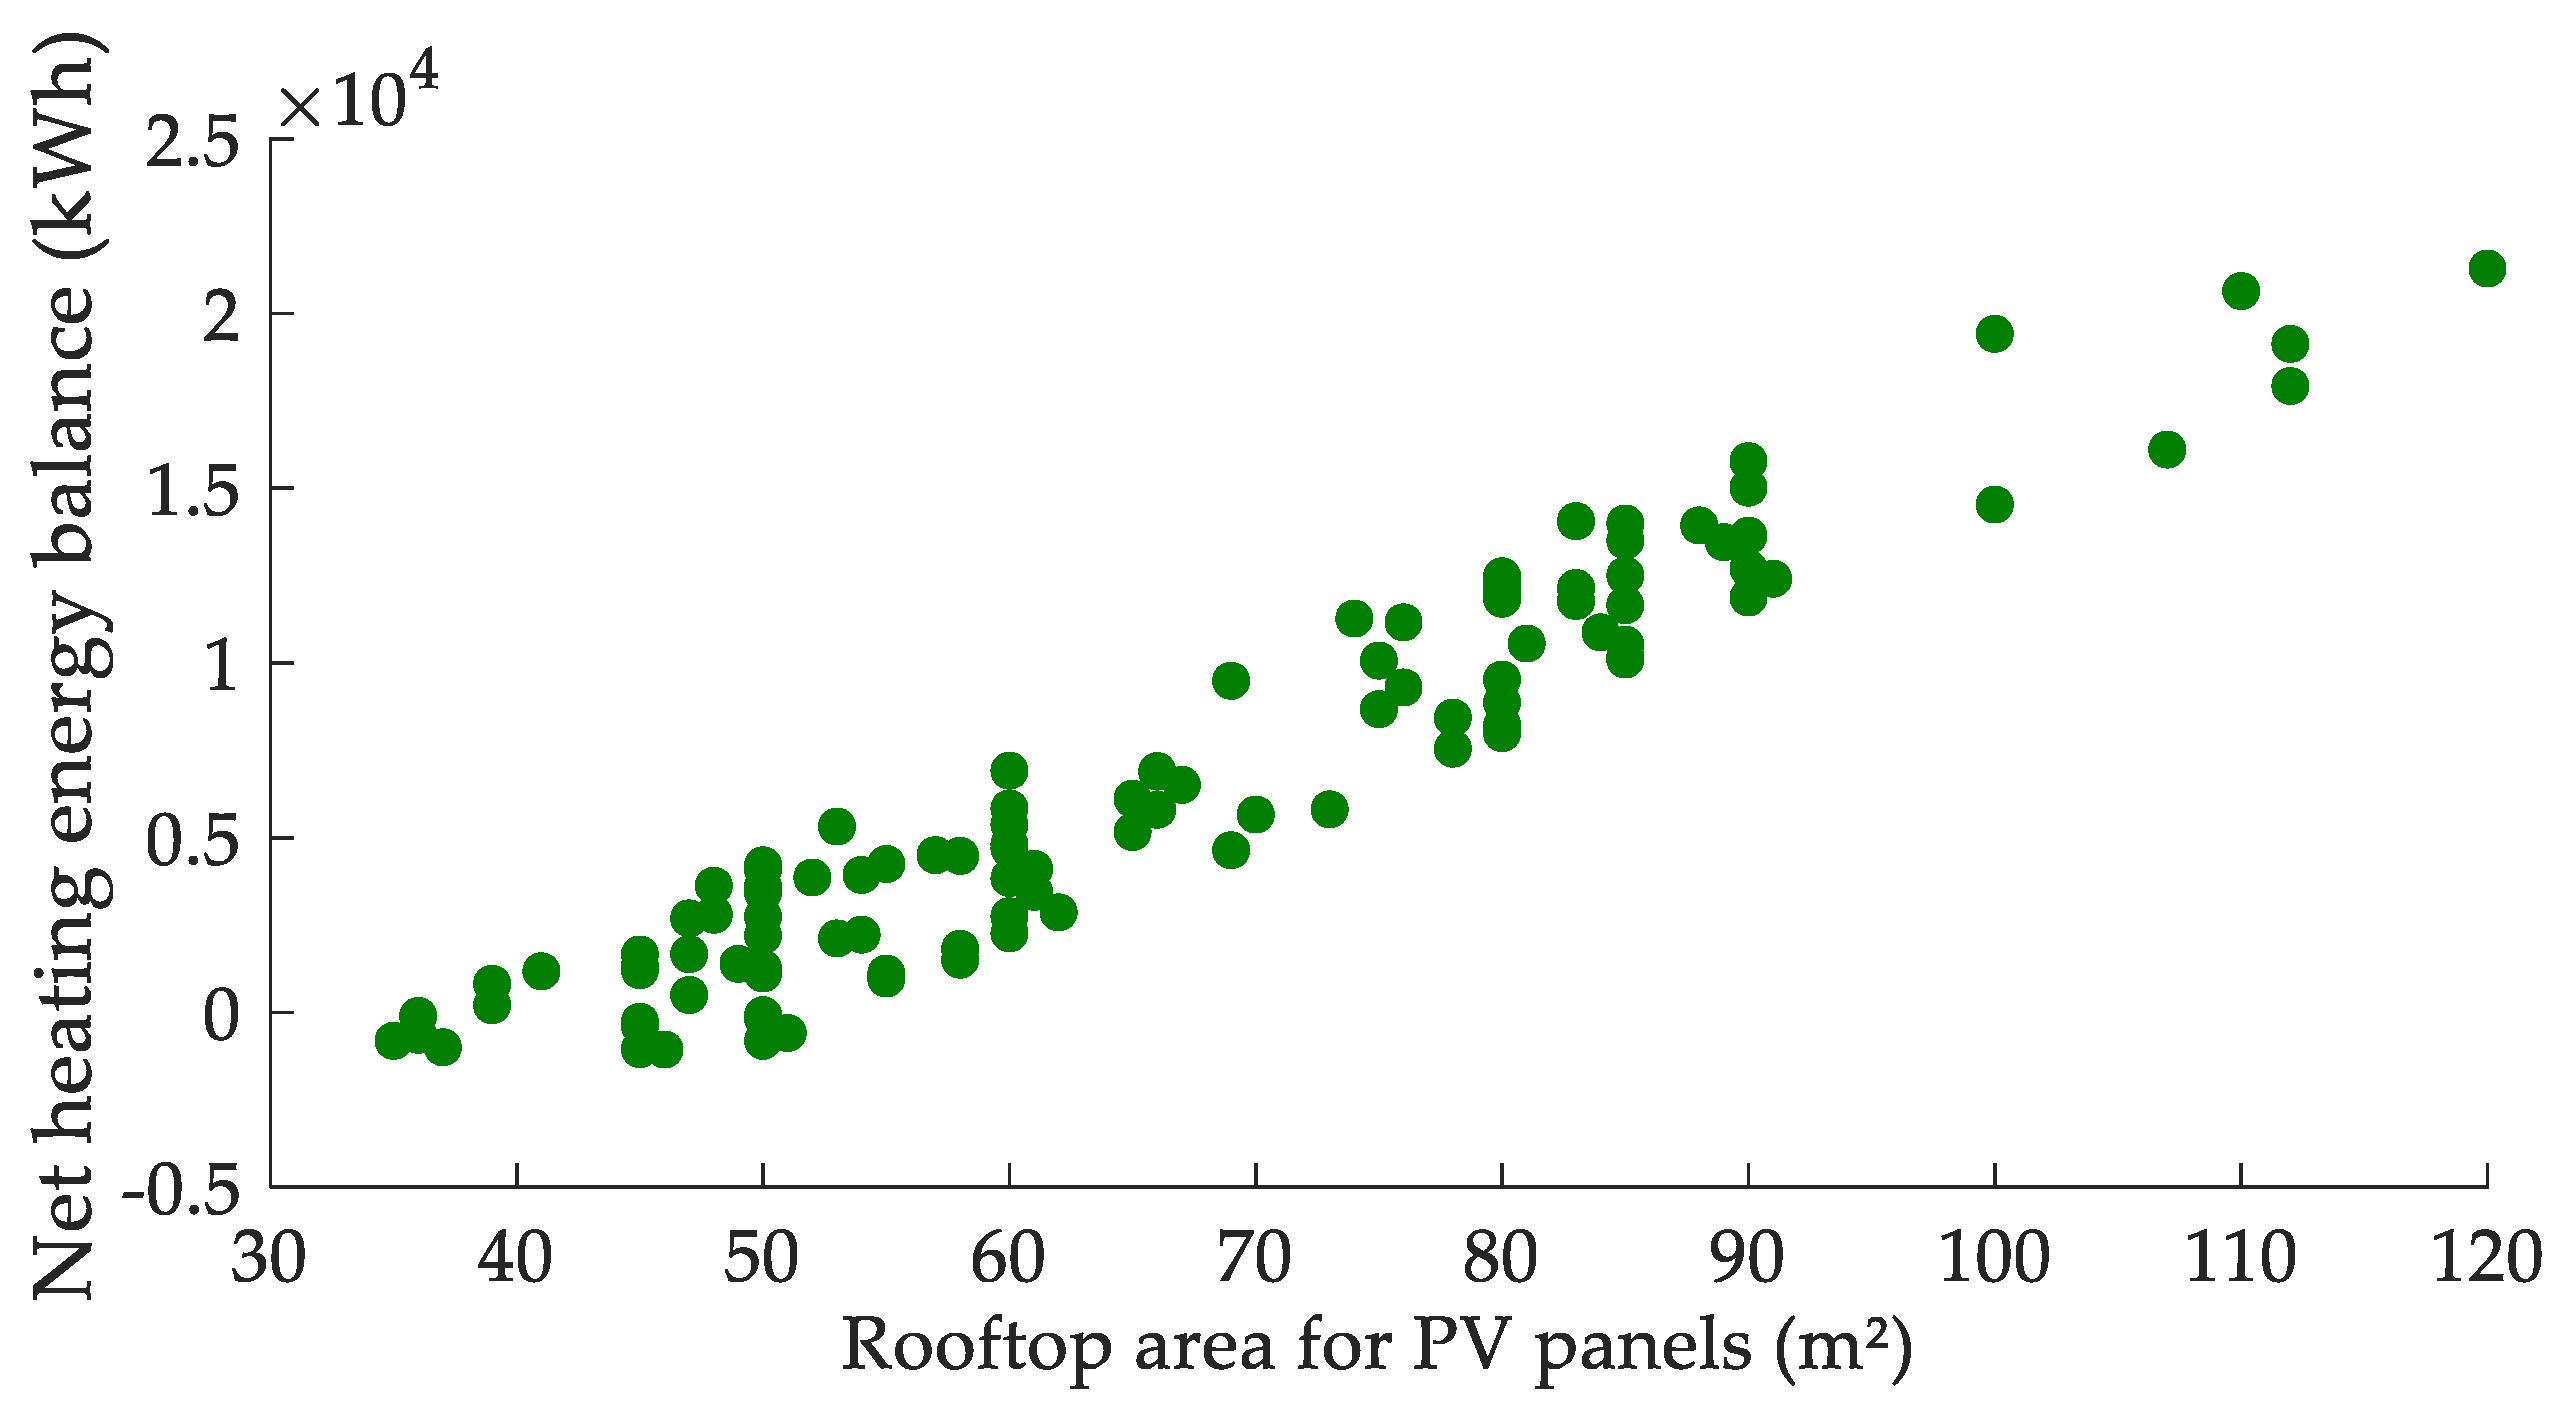
Figure 11.
Heating expenditure, reduced heating costs and annual savings for households with coal heating.
Figure 11.
Heating expenditure, reduced heating costs and annual savings for households with coal heating.
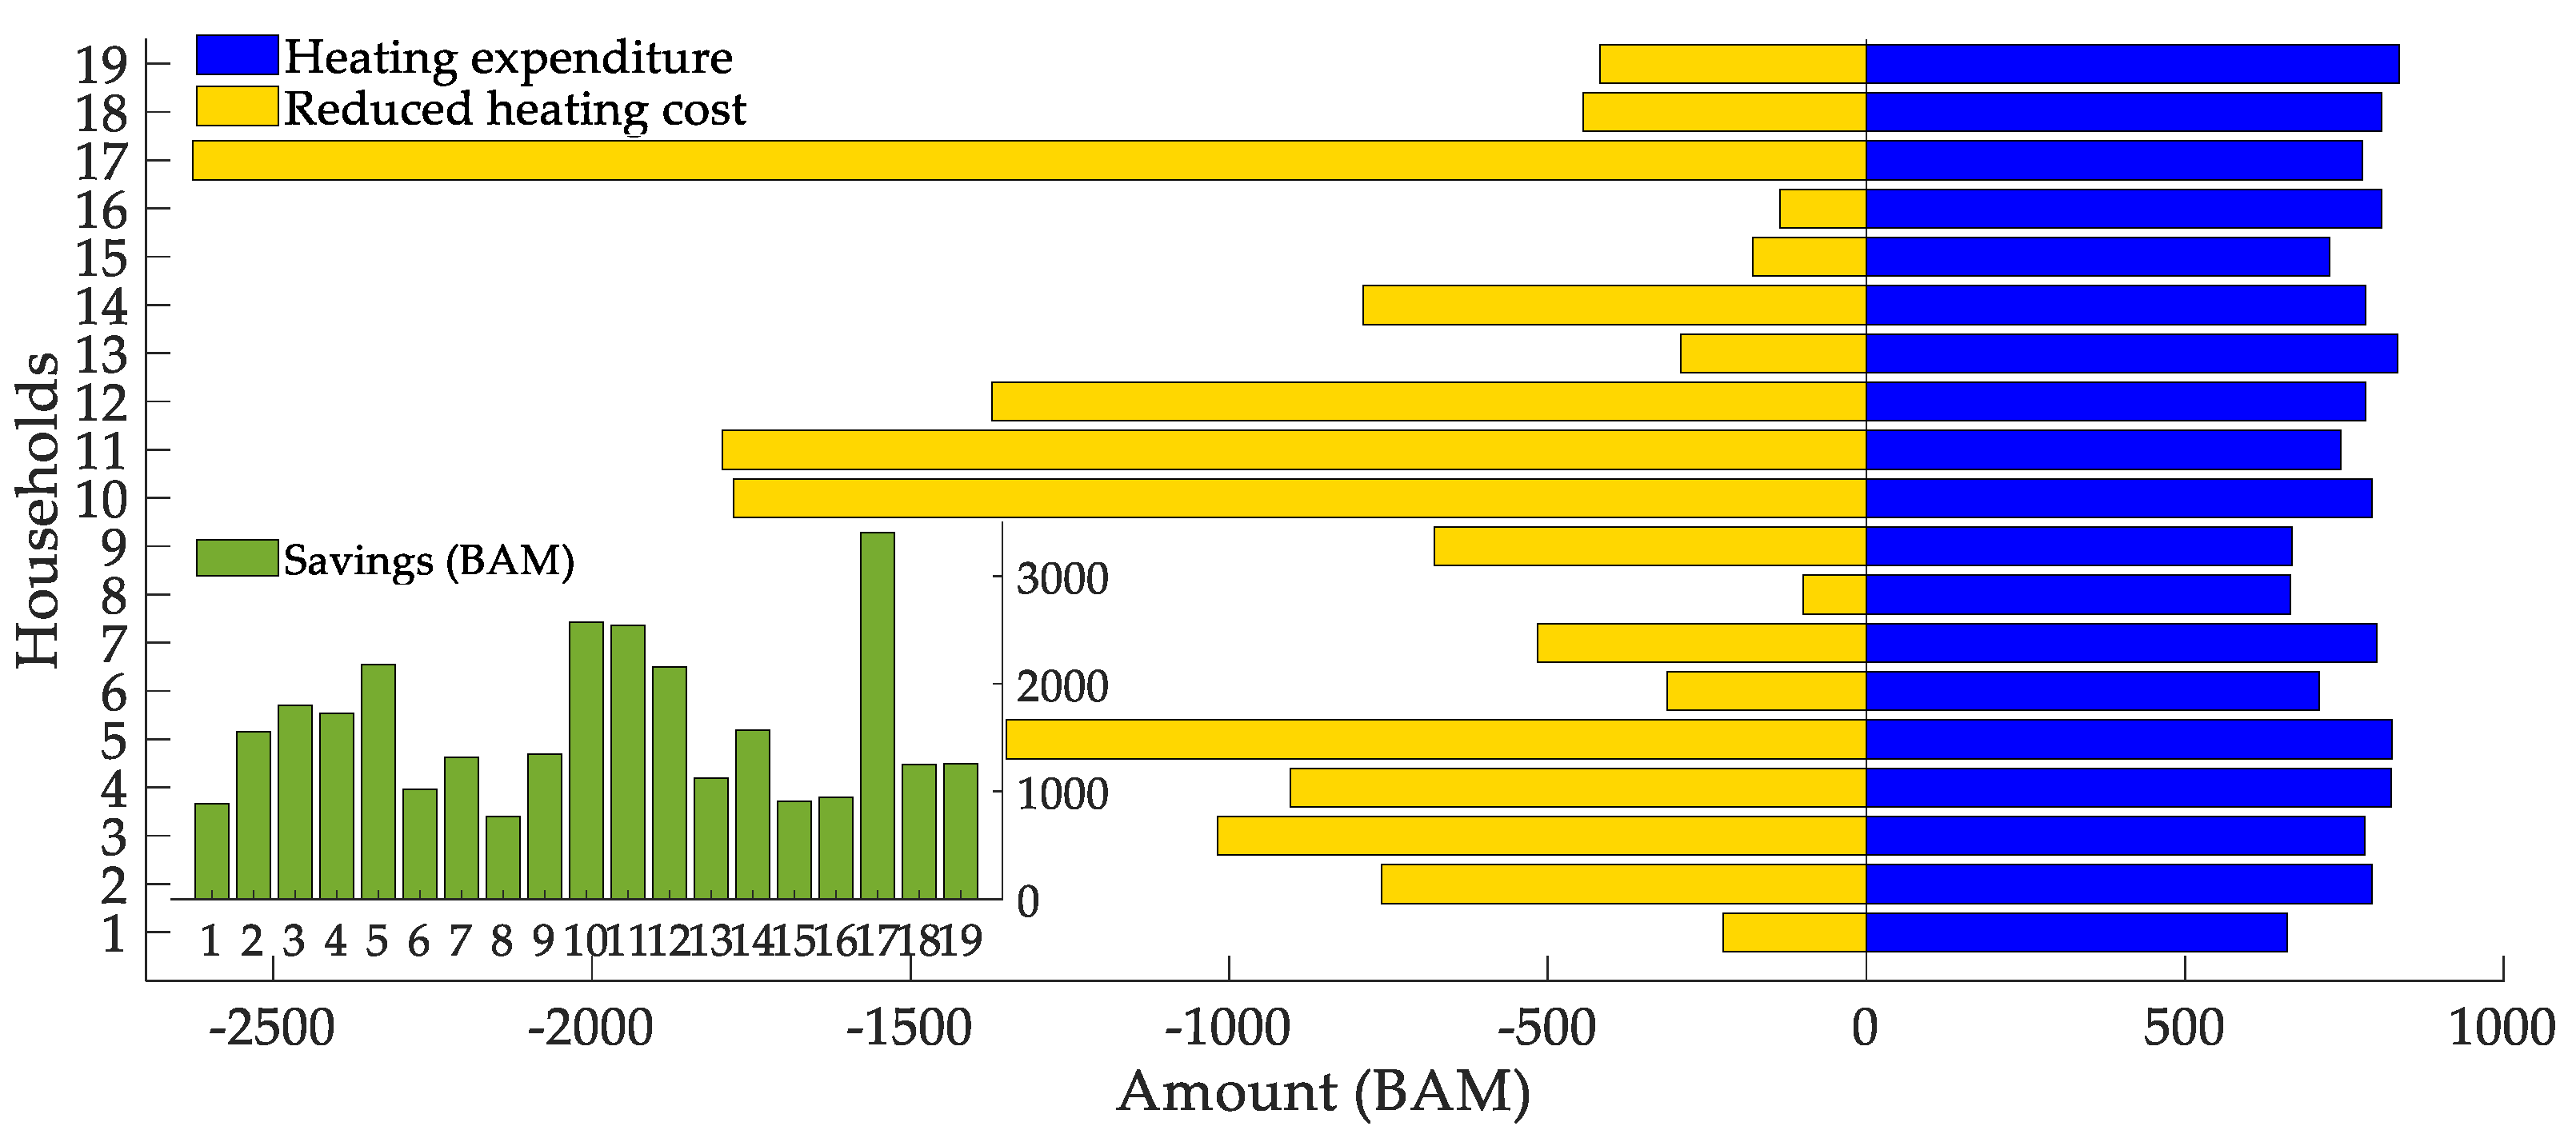
Figure 12.
Energy consumption from gas and solar contribution.
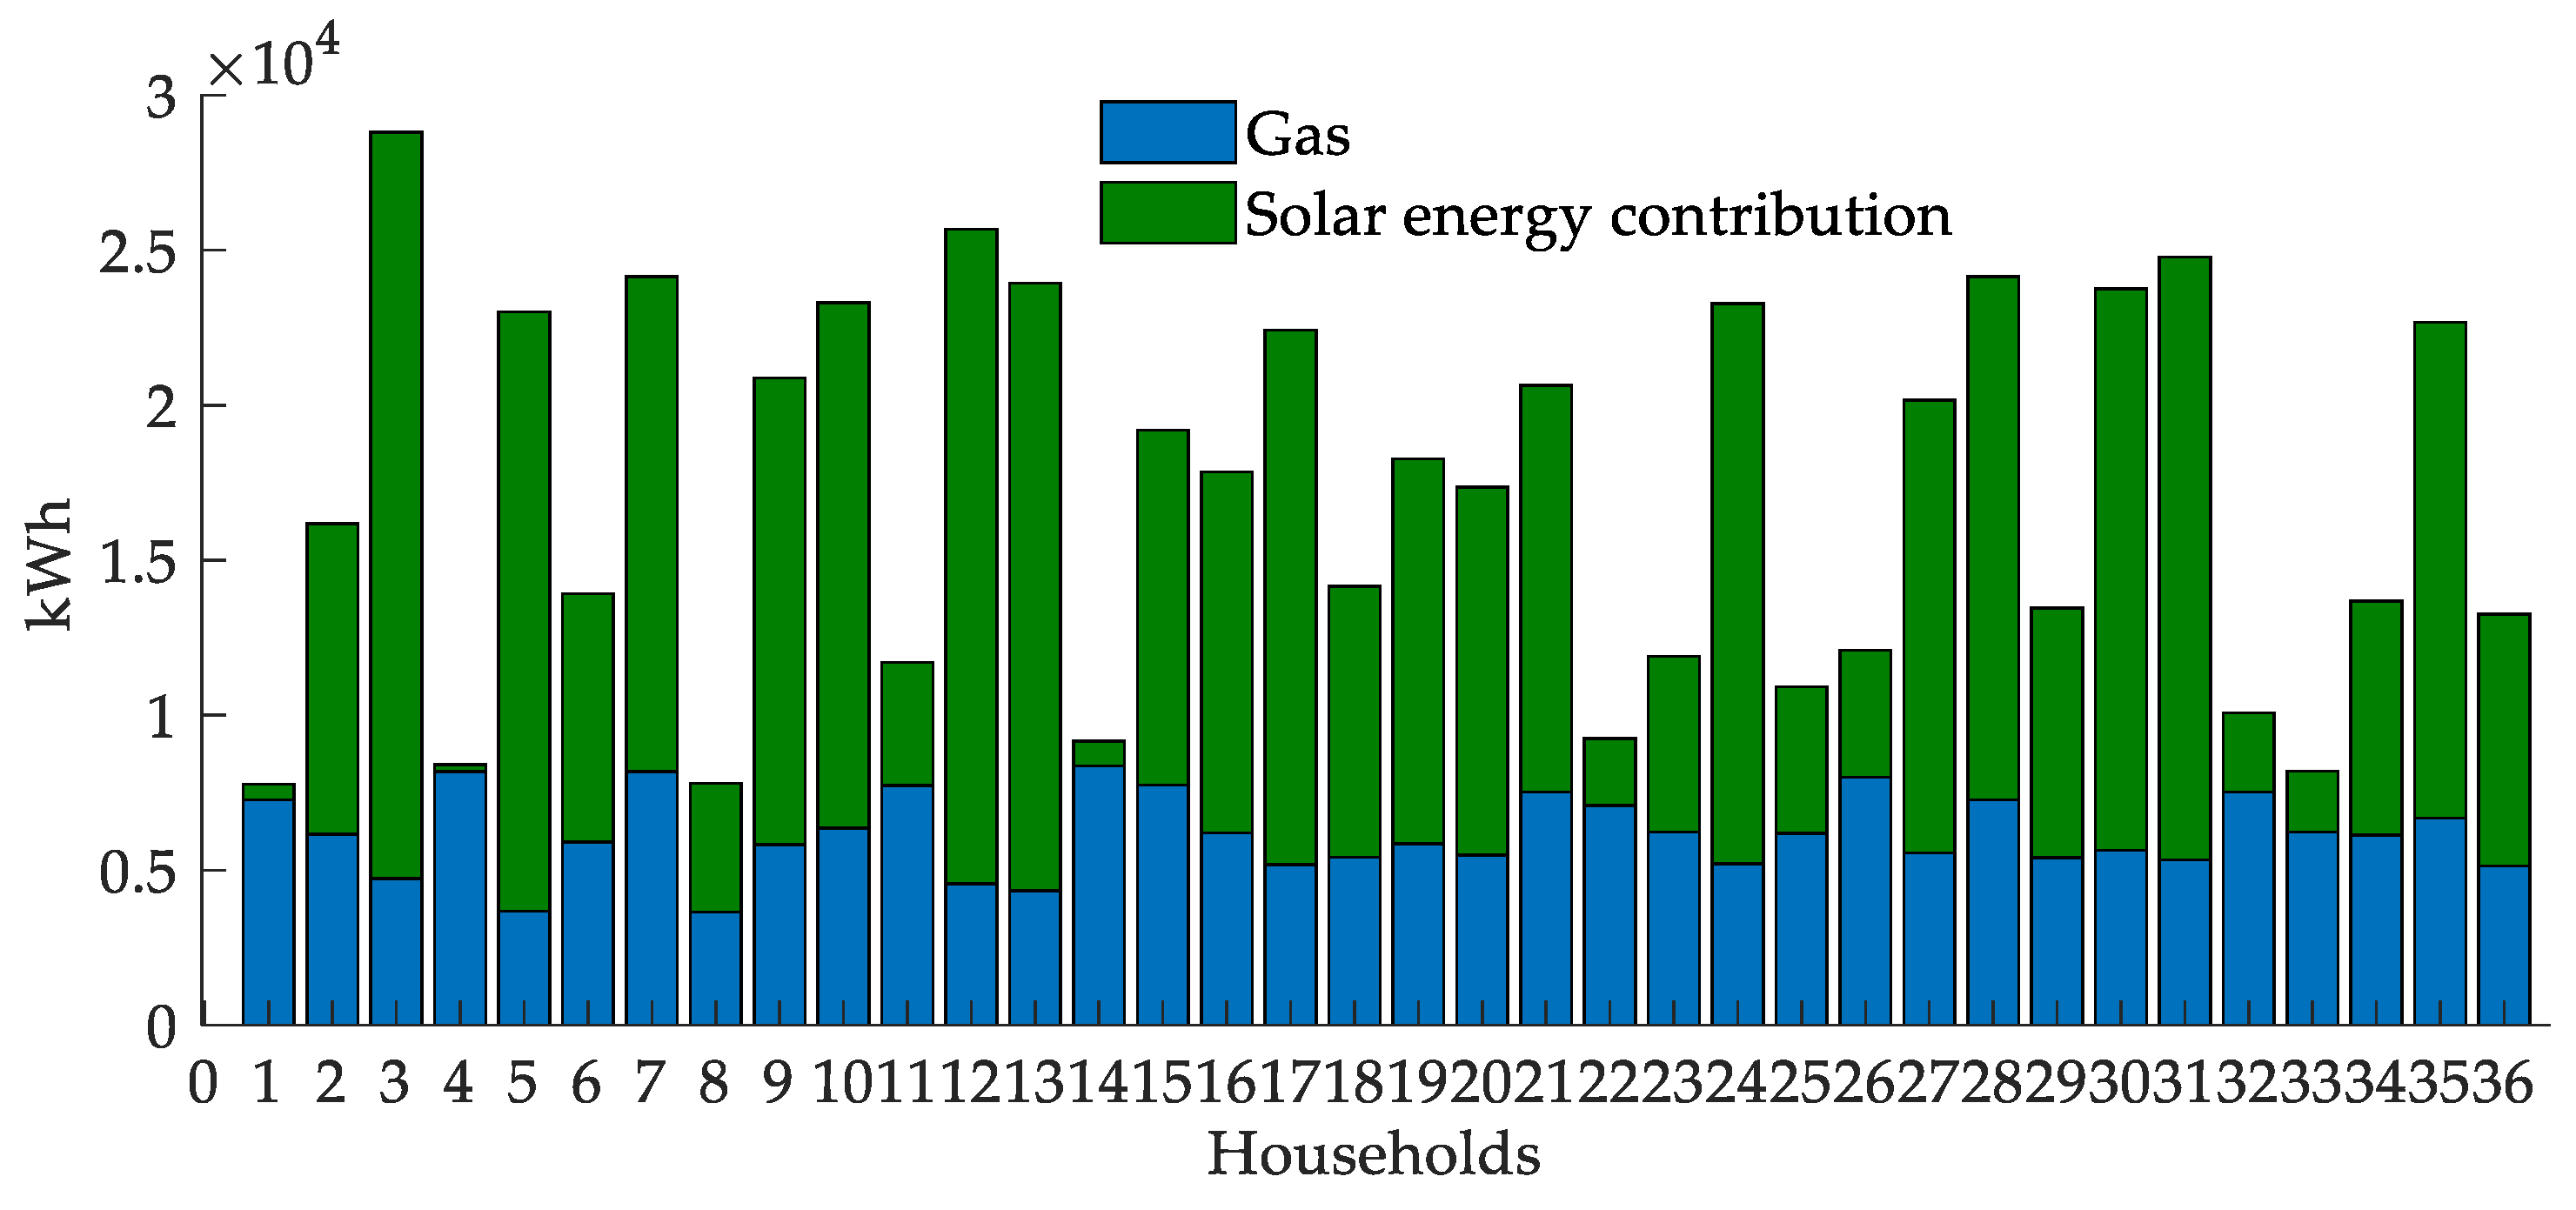
Figure 13.
Boxplots of household solar systems investment and energy parameters. (a) Distribution of installed solar capacity and payback period; (b) Distribution of investment costs and energy demand.
Figure 13.
Boxplots of household solar systems investment and energy parameters. (a) Distribution of installed solar capacity and payback period; (b) Distribution of investment costs and energy demand.
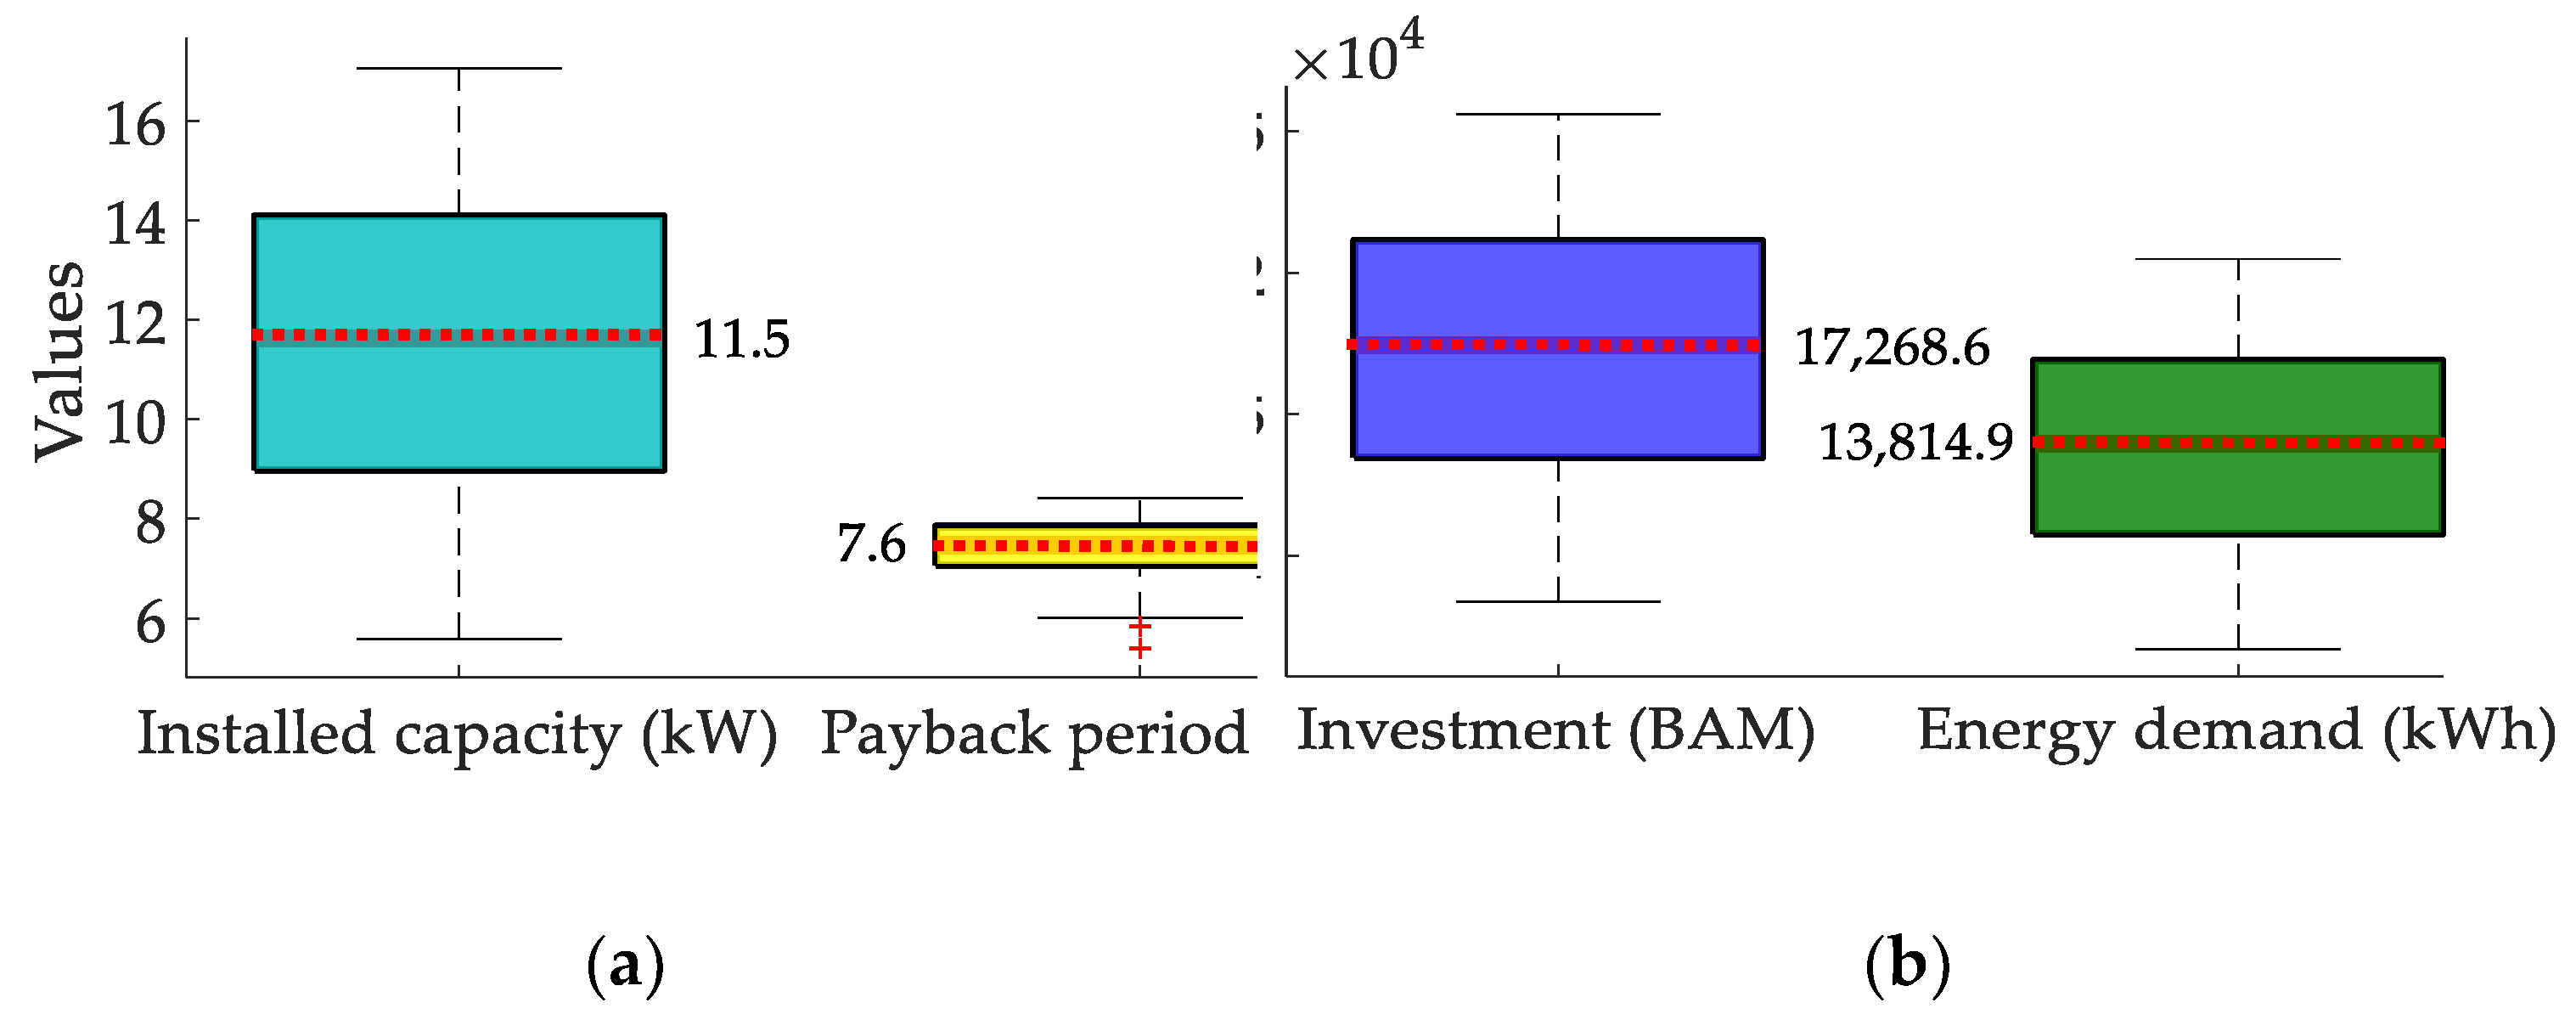
Figure 14.
Heatmap showing CO₂ reduction (kg) and number of households by heating method.
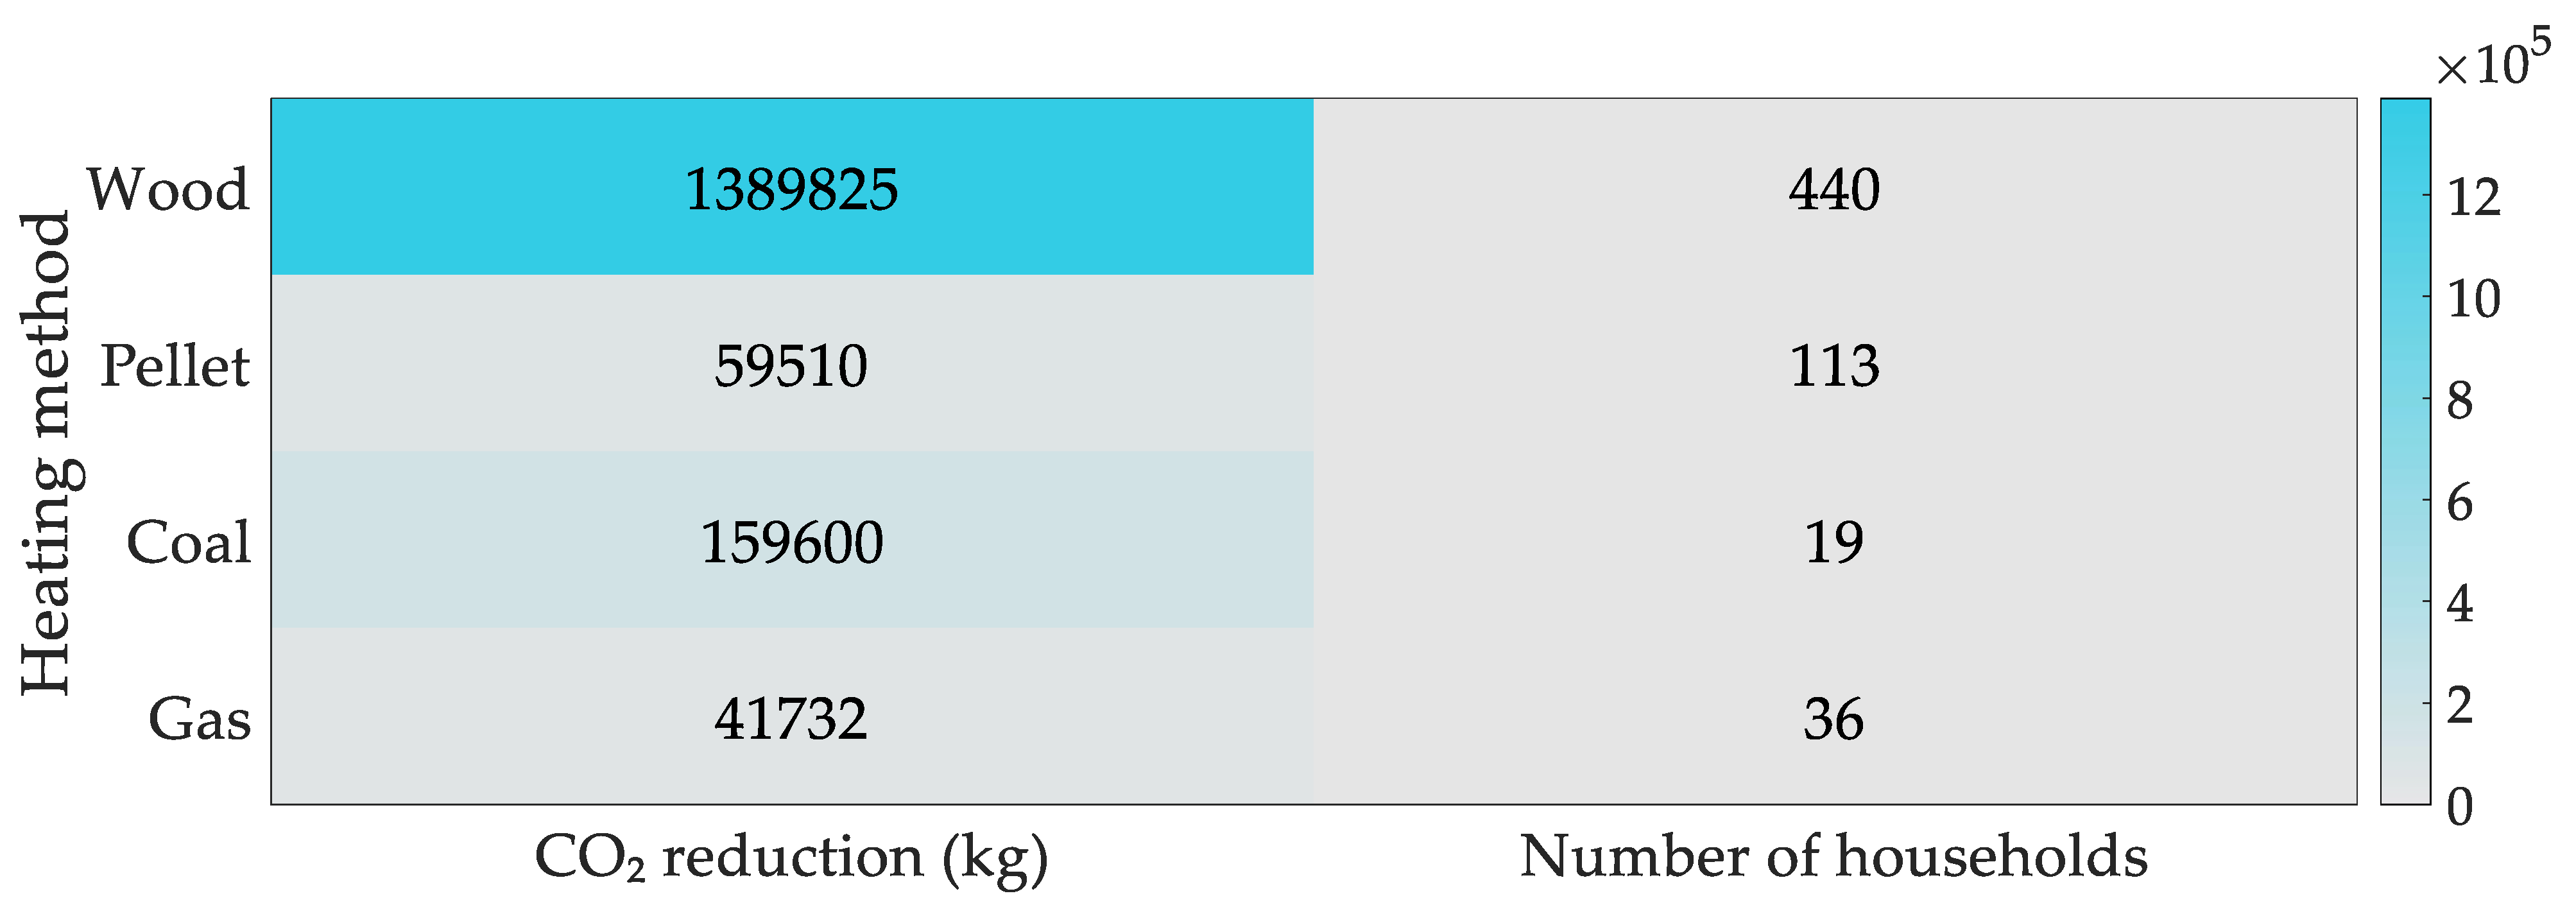
Figure 15.
Comparison of payback periods for different heating methods.
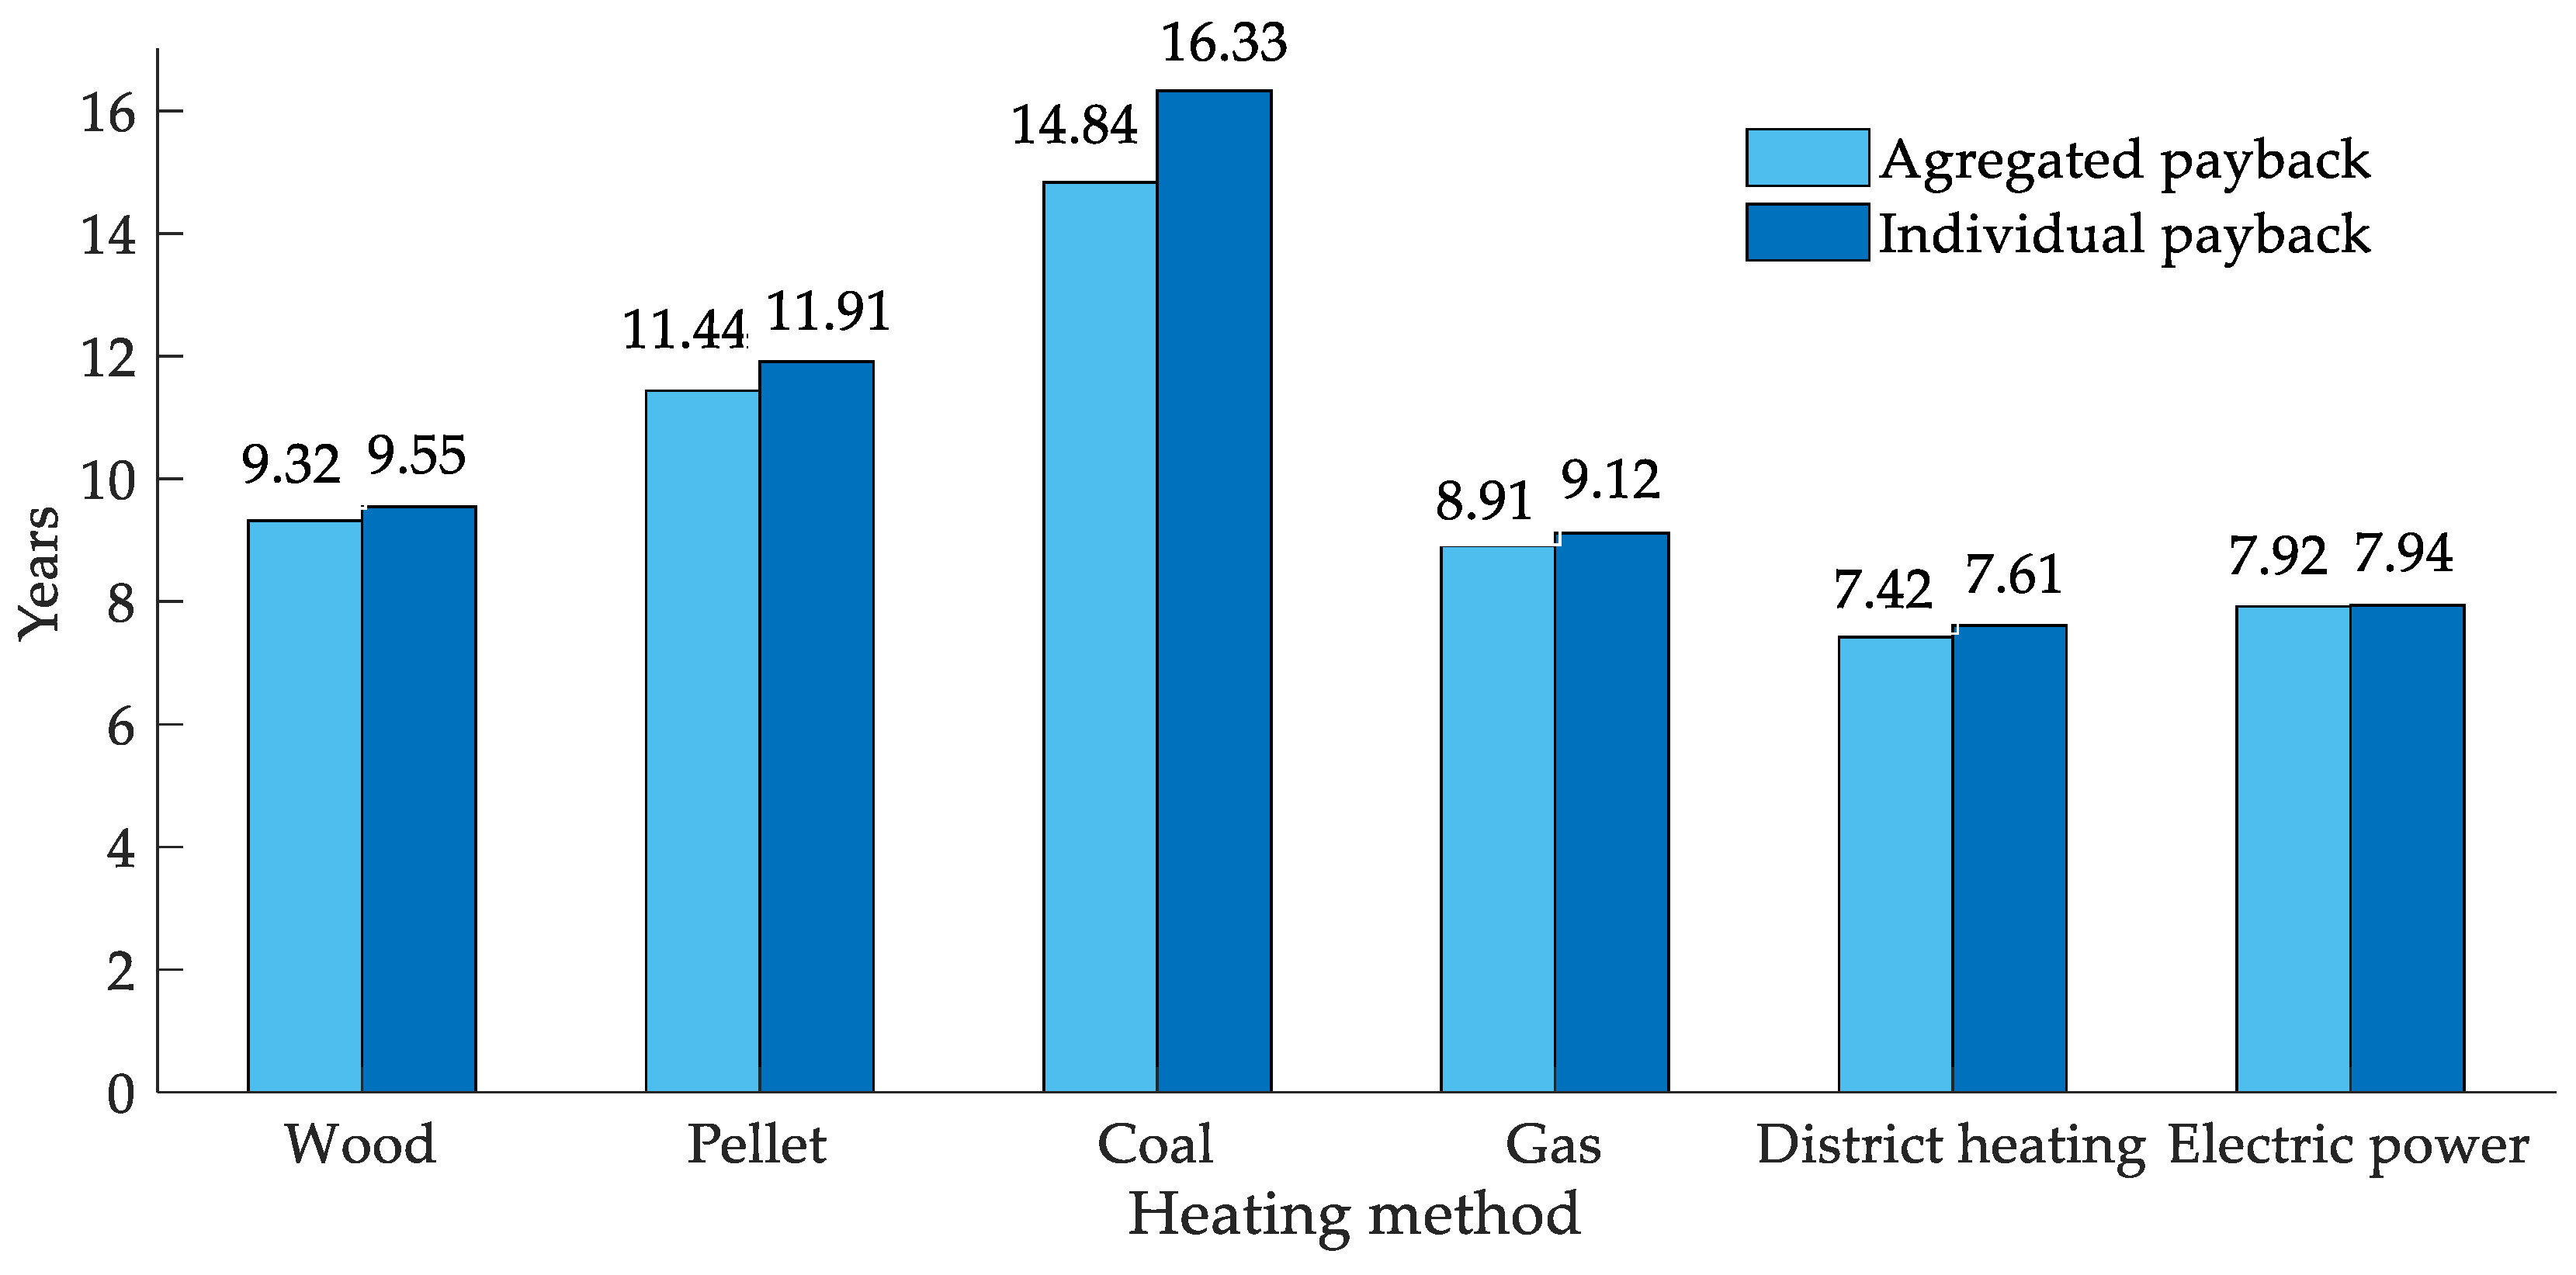

Table 1.
Example of survey questions used for data collection.
| Category | Survey question |
|---|---|
| General Indicators | |
| Household Size | How many members are there in your household? |
| Total Living Area (m²) | What is the total living area of your home (in m²)? |
| Annual Household Income (BAM) Roof Area for PV Installation (m²) |
What is your household’s total annual income (BAM)? What is the total roof area available for PV module installation (m²)? |
| Heating Method | |
| What is the main heating method used in your home? (electric power, coal, wood, gas, pellet, fuel oil, district heating) |
|
| Transport Mode | |
| What is your primary mode of transportation? (private car, public transportation, other) |
|
| Expenditures | |
| Annual Electric power Expenditure | What is your annual expenditure on electric power (BAM)? |
| Annual Heating Expenditure | What is your annual expenditure on heating (BAM)? |
| Annual Transport Expenditure | What is your annual expenditure on transportation (BAM)? |
| Annual Energy Consumption | |
| Electric power consumption (kWh) | What is your household's total annual electric power consumption (kWh)? |
| Coal consumption (t) | What is your household's annual coal consumption (t)? |
| Wood consumption (m³) | What is your household's annual wood consumption (m³)? |
| Gas consumption (m³) | What is your household's annual gas consumption (m³)? |
| Pellet consumption (t) | What is your household's annual pellet consumption (t)? |
| Fuel Oil consumption (t) | What is your household's annual fuel oil consumption (t)? |
Table 2.
Distribution of household members.
| Household members | Frequency | Percent |
|---|---|---|
| 1 | 540 | 36.0 |
| 2 | 483 | 32.2 |
| 3 | 477 | 31.8 |
Table 3.
Communalities in factor analysis.
| Extraction | |
|---|---|
| Apartment area (m²) | 0.642 |
| Annual income | 0.569 |
| Expenditure on electric power | 0.968 |
| Expenditure on heating | 0.689 |
| Expenditure on transport | 0.570 |
| Total electric power consumption (kWh) | 0.962 |
Table 4.
Detailed variance explanation by PCA components.
| Initial Eigenvalues | Extraction Sums of Squared Loadings | Rotation Sums of Squared Loadings | |||||||
|---|---|---|---|---|---|---|---|---|---|
| Component | Total | % of Variance |
Cumulative % | Total | % of Variance |
Cumulative % | Total | % of Variance |
Cumulative % |
| 1 | 2.194 | 36.573 | 36.573 | 2.194 | 36.573 | 36.573 | 1.915 | 31.916 | 31.916 |
| 2 | 1.171 | 19.524 | 56.097 | 1.171 | 19.524 | 56.097 | 1.342 | 22.363 | 54.279 |
| 3 | 1.034 | 17.233 | 73.330 | 1.034 | 17.233 | 73.330 | 1.143 | 19.051 | 73.330 |
| 4 | 0.860 | 14.331 | 87.662 | ||||||
| 5 | 0.676 | 11.262 | 98.924 | ||||||
| 6 | 0.065 | 1.076 | 100.000 | ||||||
Table 5.
Component score coefficient matrix.
| Component | ||||
|---|---|---|---|---|
| 1 | 2 | 3 | ||
| Apartment area (m²) | -0.150 | 0.785 | 0.064 | |
| Annual income (BAM) | 0.030 | 0.023 | 0.753 | |
| Expenditure on electric power (BAM) | 0.977 | -0.113 | 0.000 | |
| Expenditure on heating (BAM) | -0.098 | 0.823 | -0.028 | |
| Expenditure on transport (BAM) | -0.012 | 0.008 | 0.755 | |
| Annual electric power consumption (kWh) | 0.963 | -0.187 | 0.026 | |
Table 6.
Descriptive statistics.
| Minimum | Maximum | Mean | Std. deviation | |
|---|---|---|---|---|
| Energy Poverty Coefficient | -1.45 | 4.83 | 0.1520 | 0.60287 |
Table 7.
Model summary and performance indicators.
| Change Statistics | ||||||||||
|---|---|---|---|---|---|---|---|---|---|---|
| Model | R | R Square | Adjusted R Square | Std. Error of the Estimate | R Square Change | F Change | df1 | df2 | Sig. F Change | Durbin-Watson |
| 1 | 0.913a | 0.834 | 0.834 | 0.29079 | 0.834 | 1883.141 | 4 | 1495 | <0.001 | 1.914 |
a. Predictors: (Constant), Annual income (BAM), Expenditure on electric power (BAM), Expenditure on heating (BAM), Expenditure on transport (BAM). b. Dependent variable: Energy Poverty Coefficient.
Table 8.
ANOVA summary for regression model.
| Model | Sum of Squares | df | Mean Square | F | Sig. | |
|---|---|---|---|---|---|---|
| 1 | Regression | 636.929 | 4 | 159.232 | 1883.141 | <0.001b |
| Residual | 126.412 | 1495 | 0.085 | |||
| Total | 763.341 | 1499 | ||||
Table 9.
Regression coefficients and diagnostic statistics.
| Unstandardized Coefficients |
Standardized Coefficients | 95.0% Confidence Interval for B |
Collinearity Statistics |
|||||||
|---|---|---|---|---|---|---|---|---|---|---|
| Model | B | Std. Error |
Beta | t | Sig. | Lower Bound | Upper Bound |
Tolerance | VIF | |
| 1 (Constant) | -1.045 | 0.017 | -43.271 | <.001 | -1.080 | -1.010 | ||||
| Expenditure_on_ electric power |
0.001 | 0.000 | 0.495 | 35.128 | <.001 | 0.001 | 0.001 | 0.969 | 1.032 | |
| Expenditure_on_ heating |
0.001 | 0.000 | 0.661 | 47.371 | <.001 | 0.001 | 0.001 | 0.969 | 1.032 | |
| Expenditure_on_ transport |
0.001 | 0.000 | 0.572 | 37.624 | <.001 | 0.001 | 0.001 | 0.980 | 1.021 | |
| Annual_income | -7.943E-5 | 0.000 | -0. 406 | -37.699 | <.001 | 0.000 | 0.000 | 0.980 | 1.021 | |
a Dependent Variable: Energy Poverty Coefficient.
Table 10.
Model summary and performance indicators.
| Change Statistics | ||||||||||
|---|---|---|---|---|---|---|---|---|---|---|
| Model | R | R Square | Adjusted R Square | Std. Error of the Estimate |
R Square Change | F Change | df1 | df2 | Sig. F Change | Durbin-Watson |
| 1 | 0.823a | 0.678 | 0.677 | 0.4056 | 0.678 | 1048.039 | 3 | 1495 | <0.001 | 1.955 |
a. Predictors: (Constant), Annual income (BAM), Expenditure on electric power (BAM), Expenditure on heating (BAM). b. Dependent variable: Energy Poverty Coefficient.
Table 11.
ANOVA summary for regression model.
| Model | Sum of Squares | df | Mean Square | F | Sig. | |
|---|---|---|---|---|---|---|
| 1 | Regression | 517.236 | 3 | 172.412 | 1048.039 | <0.001b |
| Residual | 246.106 | 1496 | 0.165 | |||
| Total | 763.341 | 1499 | ||||
Table 12.
Regression coefficients and diagnostic statistics.
| Unstandardized Coefficients |
Standardized Coefficients | 95.0% Confidence Interval for B |
Collinearity Statistics |
|||||||
|---|---|---|---|---|---|---|---|---|---|---|
| Model | B | Std. Error |
Beta | t | Sig. | Lower Bound | Upper Bound |
Tolerance | VIF | |
| 1 (Constant) | -0.747 | 0.022 | -27.106 | <.001 | -0.790 | -0.703 | ||||
| Expenditure_on_ electric power |
0.001 | 0.000 | 0.563 | 25.181 | <.001 | 0.001 | 0.001 | 0.969 | 1.032 | |
| Expenditure_on_ heating |
0.001 | 0.000 | 0.752 | 34.509 | <.001 | 0.001 | 0.001 | 0.969 | 1.032 | |
| Annual_income | -9.059E-5 | 0.000 | -0. 528 | -31.137 | <.001 | 0.000 | 0.000 | 0.980 | 1.021 | |
a Dependent Variable: Energy Poverty Coefficient.
Table 13.
Descriptive statistics.
| Minimum | Maximum | Mean | Std. deviation | |
|---|---|---|---|---|
| Energy Poverty Index | -1.09 | 2.76 | 0.3501 | 0.70387 |
Table 14.
Descriptive statistics.
| Minimum | Maximum | Mean | Std. deviation | |
|---|---|---|---|---|
| Energy poverty coefficient | -3.32 | 1.93 | -0.0094 | 0.61820 |
Table 15.
Frequency and percent of EPI categories (case 1).
| Frequency | Percent (%) | |
|---|---|---|
| Low | 52 | 3.5 |
| Moderate | 1001 | 66.7 |
| High | 447 | 29.8 |
| Total | 1500 | 100.0 |
Table 16.
Frequency and percent of EPI categories (case 2).
| Frequency | Percent (%) | |
|---|---|---|
| Low | 236 | 15.7 |
| Moderate | 1011 | 67.4 |
| High | 253 | 16.9 |
| Total | 1500 | 100.0 |
Table 17.
Comparison of regression-based and survey-based methods for energy poverty classification.
Table 17.
Comparison of regression-based and survey-based methods for energy poverty classification.
| Energy poverty | |||
|---|---|---|---|
| Case Method | Frequency | Percent (%) | |
| Case 1 | Regression-Based | 1,448 | 96.5 |
| Survey-Based [5] | 1,454 | 96.9 | |
| Case 2 | Regression-Based | 1,264 | 84.3 |
| Survey-Based [5] | 1,255 | 83.7 | |
Table 18.
Estimated reduction in CO₂ emissions based on heating method.
| Heating method | ||||
|---|---|---|---|---|
| Wood | Pellet | Coal | Gas | |
| Reduction in CO₂ emissions (kg) | 1,389,825 | 59,509.8 | 159,600 | 41,732.24 |
| Total reduction (kg) | 1,650,667.04 | |||
Table 19.
Payback periods for transition to PV panels by heating method.
| Heating method | Number of households | Payback period aggregated |
Payback period individual |
| Wood | 440 | 9.32 | 9.55 |
| Pellet | 113 | 11.44 | 11.91 |
| Coal | 19 | 14.84 | 16.33 |
| Gas | 36 | 8.91 | 9.12 |
| District heating | 338 | 7.42 | 7.61 |
| Electric power | 222 | 7.92 | 7.94 |
| Total | 1168 |
Disclaimer/Publisher’s Note: The statements, opinions and data contained in all publications are solely those of the individual author(s) and contributor(s) and not of MDPI and/or the editor(s). MDPI and/or the editor(s) disclaim responsibility for any injury to people or property resulting from any ideas, methods, instructions or products referred to in the content. |
© 2024 by the authors. Licensee MDPI, Basel, Switzerland. This article is an open access article distributed under the terms and conditions of the Creative Commons Attribution (CC BY) license (http://creativecommons.org/licenses/by/4.0/).
Copyright: This open access article is published under a Creative Commons CC BY 4.0 license, which permit the free download, distribution, and reuse, provided that the author and preprint are cited in any reuse.


