
Submitted:
04 December 2024
Posted:
05 December 2024
You are already at the latest version
Abstract
GPS tracking systems utilize the Global Positioning System (GPS) to monitor device movements and determine precise locations [1]. In recent years, GPS technology has been extensively used in navigation applications, providing directions and creating digital maps. This technology has proven indispensable to various professionals, including pilots, surveyors, farmers, boat captains, military personnel, and scientists [2]. Additionally, GPS systems are employed to track animals, offering insights into their behaviors, and locations, and helping to protect endangered species [3]. Various tracking technologies, such as scale clapping, radar, acoustic telemetry, radio tags, Xirgo XT-200, geolocators, GSM mobile phone telemetry, and pop-up satellite archival tags, have been used [4]. This paper focuses on a GPS-based tracking system that collects data through various sensors and processes it using an AVR microcontroller [5]. We measure environmental parameters such as temperature and humidity (using the DTH11 sensor) and monitor pulse rates alongside GPS-derived location data of tracked animals [6]. By scientifically collecting and analyzing this data, we can better understand the condition, movement patterns, and behaviors of wild animals, domestic animals, and pets, enhancing efforts to care for and protect them.
Keywords:
GPS Module
; Micro-controller (AVR)
; Pulse sensor
; temperature sensor
; humidity sensor (DHT11)
1. Introduction
The ability to monitor and track animal behavior, health, and movements is crucial for effective wildlife conservation, livestock management, and pet care. Traditionally, these tasks have been carried out using methods such as radio telemetry, satellite tracking, and manual observation. While these methods have provided invaluable insights, they often come with limitations such as high costs, limited real-time data, and the inability to monitor multiple health parameters simultaneously [7]. The need for a more comprehensive, real-time monitoring solution has become increasingly apparent, especially as threats like poaching, habitat destruction, and climate change continue to impact animal populations globally.
Recent advancements in sensor technology, wireless communication, and data processing have paved the way for the development of integrated systems that can offer more detailed and timely insights into animal health and behavior. These systems can monitor a variety of physiological parameters, such as body temperature, heart rate, and environmental conditions, alongside tracking the animal's location [8] . This capability is particularly important in environments where animals are exposed to harsh conditions, where stress levels need to be managed, or where precise location data is critical for conservation efforts.
This paper presents a real-time animal monitoring system that integrates GPS tracking with pulse and temperature monitoring, designed to provide a comprehensive overview of an animal's health and movements [9]. The system is built around the NEO-6M GPS module, which offers precise location data by communicating with satellites. To monitor the animal's physiological state, the system employs a pulse sensor (SEN-11574) to measure heart rate and two temperature sensors—the LM35 sensor for body temperature and the DHT11 sensor for environmental temperature and humidity [10]. These sensors are connected to an ATMEGA32 microcontroller, which processes the collected data.
The processed data is then transmitted wirelessly using NRF24L01 transceiver modules. This wireless communication setup ensures that data can be sent over long distances with minimal loss, making it suitable for tracking animals in remote or expansive areas [11]. The data is received by a secondary microcontroller and then forwarded to a computer where it is stored in a MongoDB database. The use of MongoDB, with its flexible JSON-like data structure, allows for efficient storage and retrieval of large datasets, which can be accessed in real-time through a custom-developed mobile application.
The mobile application, built on Android Studio using Kotlin, provides users with a user-friendly interface to monitor the animal’s location and health data in real-time. The app integrates the Mapbox Maps SDK for Android to visually display the animal's movements on a map, and also allows users to view historical data trends, which can be crucial for long-term studies and decision-making processes [12]. This integrated system offers several key advantages over existing methods: it provides real-time monitoring, supports multiple physiological and environmental parameters, and is accessible through a mobile platform, making it highly adaptable for various applications.
By combining these technologies, the proposed system represents a significant advancement in the field of animal monitoring. It not only improves the ability to track animal movements but also provides essential data for monitoring their health and well-being. This system has potential applications in wildlife conservation efforts, where tracking endangered species and ensuring their health is vital, as well as in livestock management, where monitoring the health of herds can prevent the spread of diseases and reduce losses. Furthermore, pet owners can use this system to keep track of their pets' location and health, providing peace of mind and enhancing animal care.
The subsequent sections of this paper will detail the design, implementation, and evaluation of the animal monitoring system, highlighting the technical innovations and practical benefits of this approach.
2. Literature Review
GPS animal tracking enables biologists, scientific researchers, and conservation agencies to remotely observe detailed movement or migratory patterns of wild animals using the Global Positioning System and optional environmental sensors or automated data-retrieval technologies such as Argos satellite uplink, mobile data telephony, or GPRS, coupled with a range of analytical software tools [16].
The history of wildlife tracking technology showcases the evolution of various methods used to monitor, track, and locate different wildlife species. These methods are of interest to a diverse group of individuals, including biologists, researchers, and conservationists. Biotelemetry is the term used to describe the instrumental technique for gaining and transmitting information from a living organism and its environment to a remote observer.
2.1. Bird Banding
Bird banding is one of the earliest and most widespread methods of tracking birds. John James Audubon, a French American naturalist, ornithologist, and painter, conducted the first known bird-banding experiment in North America in 1803 [17]. He tied strings around the legs of Eastern Phoebes and observed that the birds returned to the same nesting site each year, demonstrating philopatry. In 1890, Hans Christian C. Mortensen, a Danish biologist, used bird banding to study bird movements systematically. Birds can be captured by hand or using mist-nets, cannon-nets, or cage traps. A band, typically made from aluminum or colored plastic, is attached to the bird’s leg, each with a unique identification code. This method allows for the identification of individuals when birds are later recaptured. The widespread availability of mist-nets in the early 1950s significantly increased the recovery rate of marked birds.
2.2. Scale Clipping
The first scientific paper on scale clipping was published in 1933 [18]. This method involves using sharp dissecting or microsurgical scissors to clip specific ventral scales on snakes. A serial enumeration system is used so that individuals can be identified based on the scarring pattern. This method is effective for small-scale studies and provides a non-intrusive way to mark and identify individual snakes.
2.3. Radar
During World War II, migrating birds caused "phantom signals" or "radar angels" to appear on radar screens [19]. This phenomenon led to the use of radar as a method for studying migrating organisms. Early radar technologies, such as WSR-57 (Weather Surveillance Radar - 1957), have been replaced by the Next Generation Weather Radar program (NEXRAD), installed in segments during the 1990s. NEXRAD can determine both the direction and speed of migrating individuals traveling towards and away from the radar.
2.4. Acoustic Telemetry
Acoustic telemetry is based on sonar principles. The first acoustic telemetry equipment was developed in 1956 by the U.S. Bureau of Commercial Fisheries and the Minneapolis-Honeywell Regulator Corporation [20]. This method requires transmitters to send signals and receivers to hear them. Transmitters are electronic tags that emit sound pulses into the surroundings. Receivers are small, data-logging computers that “listen” for tagged individuals. Acoustic telemetry is particularly useful for studying aquatic animals, as sound travels well underwater.
2.5. VHF Telemetry
VHF (Very High Frequency) telemetry typically involves acquiring VHF transmissions from a transmitter attached to an animal, often in a collar, using a handheld antenna. Mobile or stationary receivers equipped with directional antennas receive VHF signals. The transmitter’s location is determined by triangulating signals received from three or more different locations. VHF telemetry has been widely used due to its reliability and the relatively simple equipment required.
2.6. Photo Identification
Since the 1970s, researchers have used photo identification to recognize individual whales based on their tail flukes. This method has since been applied to study various marine species to understand their biology, ecology, and behavior. Regular "citizen scientists" and whale watchers can upload photographs to computer programs, which help scientists identify individuals by matching photos to a database.
2.7. Geolocator
Geolocators, first described in 1992, are devices that periodically record ambient light levels (solar irradiance) to determine an organism’s location [21]. Geolocators are particularly useful for tracking bird migration due to their small size and lightweight design. However, the major disadvantage is the need to recapture the organism to retrieve the data.
2.8. GSM Mobile Phone Telemetry
GSM (Global System for Mobile Communications) mobile phone technology, first described in 1998, provides detailed mark-recapture data over an extensive geographical range [22]. Organisms are fitted with a mobile phone tag programmed to send text messages to a laboratory at regular intervals. The received messages are analyzed to determine the organism’s estimated location. This method is advantageous due to its ease of setup, low maintenance costs, and two-way communication capability. However, it requires monitoring in areas with cell phone coverage and incurs monthly service fees. Changes in cell towers or communication protocols by service providers can also impact communication with remote locations
2.9. Pop-up Satellite Archival Tags (PSAT)
Developed in the late 1990s, pop-up satellite archival tags (PSAT) are electronic storage devices surgically implanted or attached to the outside of marine animals with an anchoring device[23]. These tags record data on ambient light levels, swimming depth, and internal/external temperature. PSATs transmit recorded information to an orbiting satellite, which then relays the information to researchers.
2.10. Nanotechnology
Nanotechnology has enabled scientists to track millimeter-sized organisms [24]. Small organisms can be labeled with quantum dots, microscopic fluorescent probes with high photostability, high wavelength absorption range, and a narrow emission wavelength range. For instance, amine proteins on the exoskeleton of Daphnia magna were biotinylated, and streptavidin was attached to the quantum dots. This allowed for a simple bioconjugation to tag organisms with quantum dots, leveraging the high-affinity interaction between streptavidin and biotin. D. magna individuals were successfully tracked with unique quantum dots that fluoresced and emitted light at specific wavelengths, detectable by cameras. These tags are effective for up to 24 hours, after which the organisms shed their carapace containing the quantum dot. Advancements in camera technology are expected to improve the depth at which quantum dot-tagged organisms can be observed, allowing for studies in natural environments.
By leveraging advancements in GPS and related technologies, modern animal tracking systems provide unprecedented opportunities for wildlife research and conservation. These technologies not only offer detailed insights into animal behaviors and movements but also facilitate the development of effective conservation strategies to protect endangered species and manage wildlife populations sustainably.
3. Methodology
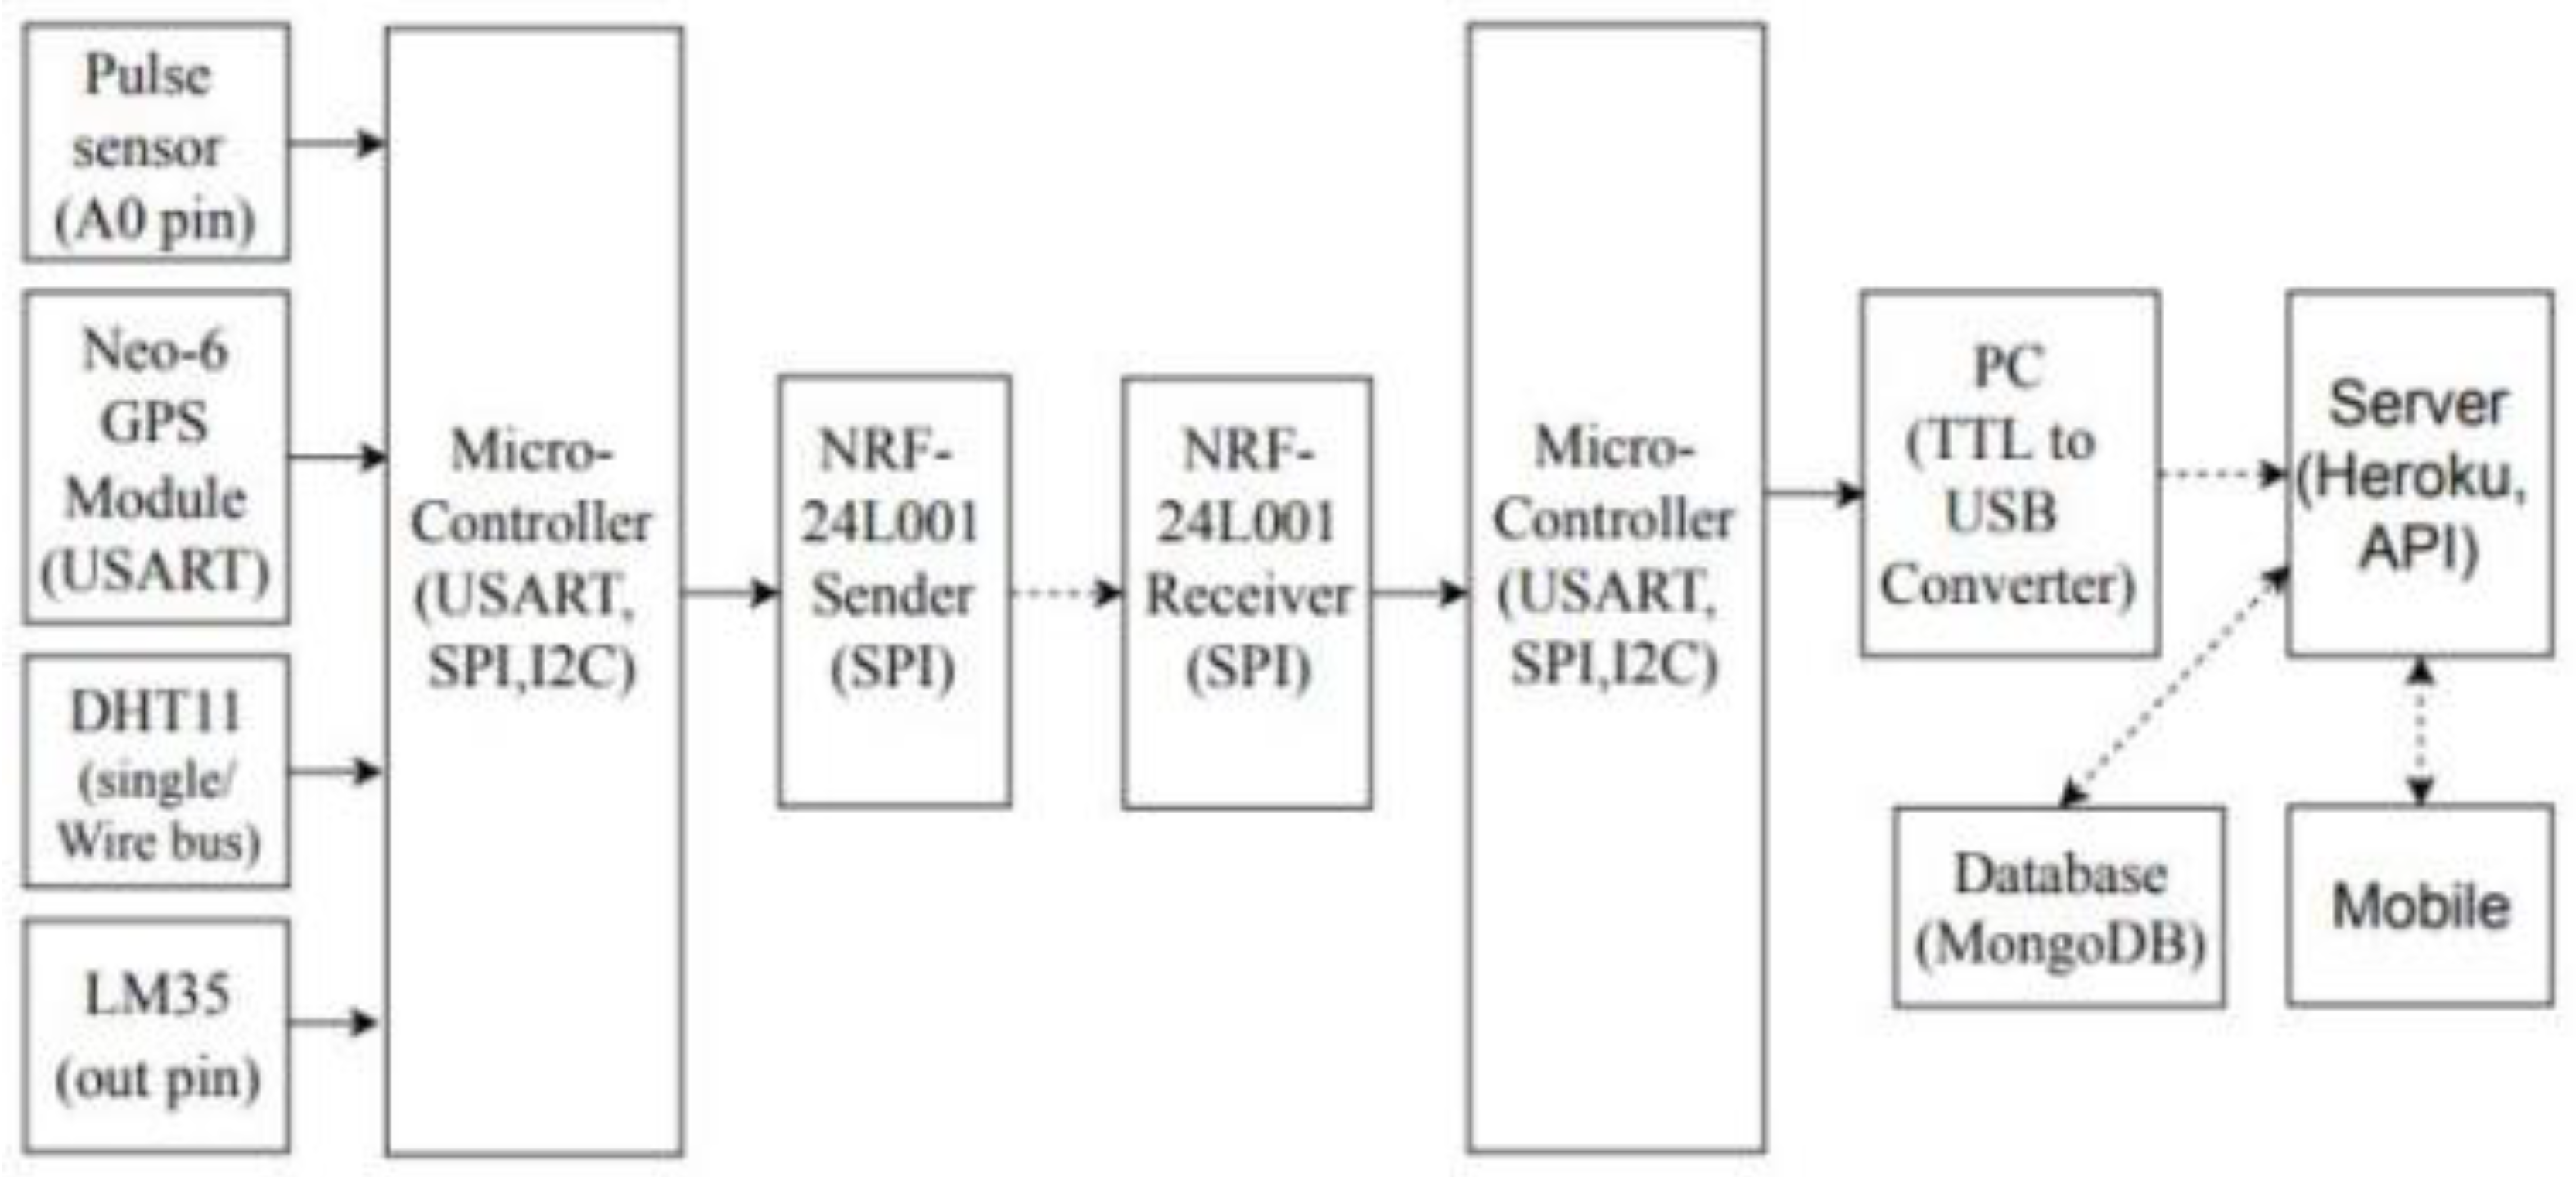
The methodology for developing the Animal Monitoring System is structured around the collection, processing, storage, and transmission of data. The system integrates various sensors, a microcontroller, and communication modules to monitor and track animals effectively. The methodology is divided into several stages
Figure 1.
Block diagram of Animal Tracking System.
- Data Collection
The system employs several sensors to collect data from the animal and its environment:
- Pulse Sensor (SEN-11574): This sensor detects the animal’s heartbeat using the principle of photoplethysmography. Changes in blood volume within an organ are measured by changes in the light intensity passing through the organ.
- Temperature Sensors (LM35 and DHT11): LM35 measures the body temperature of the animal, while the DHT11 measures the temperature and humidity of the surrounding environment. The LM35 outputs an analog signal proportional to the temperature, and the DHT11 outputs a digital signal for temperature and humidity.
- GPS Module (NEO-6M): This module determines the animal’s location by receiving signals from GPS satellites. It includes an integrated antenna and can provide accurate positional data.
- 2.
- Data Processing
The data collected from the sensors are processed using the ATMEGA32 microcontroller. The processing involves:
- Analog-to-Digital Conversion (ADC): The microcontroller converts the analog signals from the pulse sensor and LM35 into digital values.
- Data Handling: The microcontroller organizes the data from various sensors into a structured format for transmission.
- 3.
- Data Transmission
The system uses the NRF24L01 transceiver module for wireless data transmission:
- Transmitter Side: The processed data from the sensors are sent to the NRF24L01 module, which transmits the data wirelessly.
- Receiver Side: Another NRF24L01 module receives the transmitted data, which is then processed by a second ATMEGA32 microcontroller. The data is sent to a computer via a TTL to USB converter for further processing.
- 4.
- Data Storage Data received by the computer is sent to a server for storage:
- Server Setup: A RESTful API built with Node.js, Express, and MongoDB handles the data storage. The API supports CRUD operations to create, retrieve, update, and delete data.
- Database: MongoDB stores the data in a JSON-like format. Mongoose, an ODM (Object Data Modeling) library for MongoDB, is used to interact with the database.
- 5.
- Data Presentation
The stored data is accessed and displayed on a mobile application:
- Mobile App Development: The app is developed using Android Studio and Kotlin. It retrieves data from the server using HTTP GET requests facilitated by the Retrofit library.
- Map Integration: The Mapbox Maps SDK for Android is used to display the real-time location and movement history of the animal on a map within the app.
3.1. Design Mechanism
We used Proteus 8 Professional software to design PCB layout. The film is generated from the finalized circuit diagram of PCB layout which is sent to manufacturing unit where the image is printed out on plastic sheet. We use glossy paper to print the layout of circuit diagram and it is imprinted on neat and clean copper sheet. After this etching is done which involves removing undesired portion of copper sheet by using ferric chloride solution. Finally, continuity test for PCB is carried out to confirm the design is working properly.
Figure 2.
Receiver and Transmitter PCB Design.
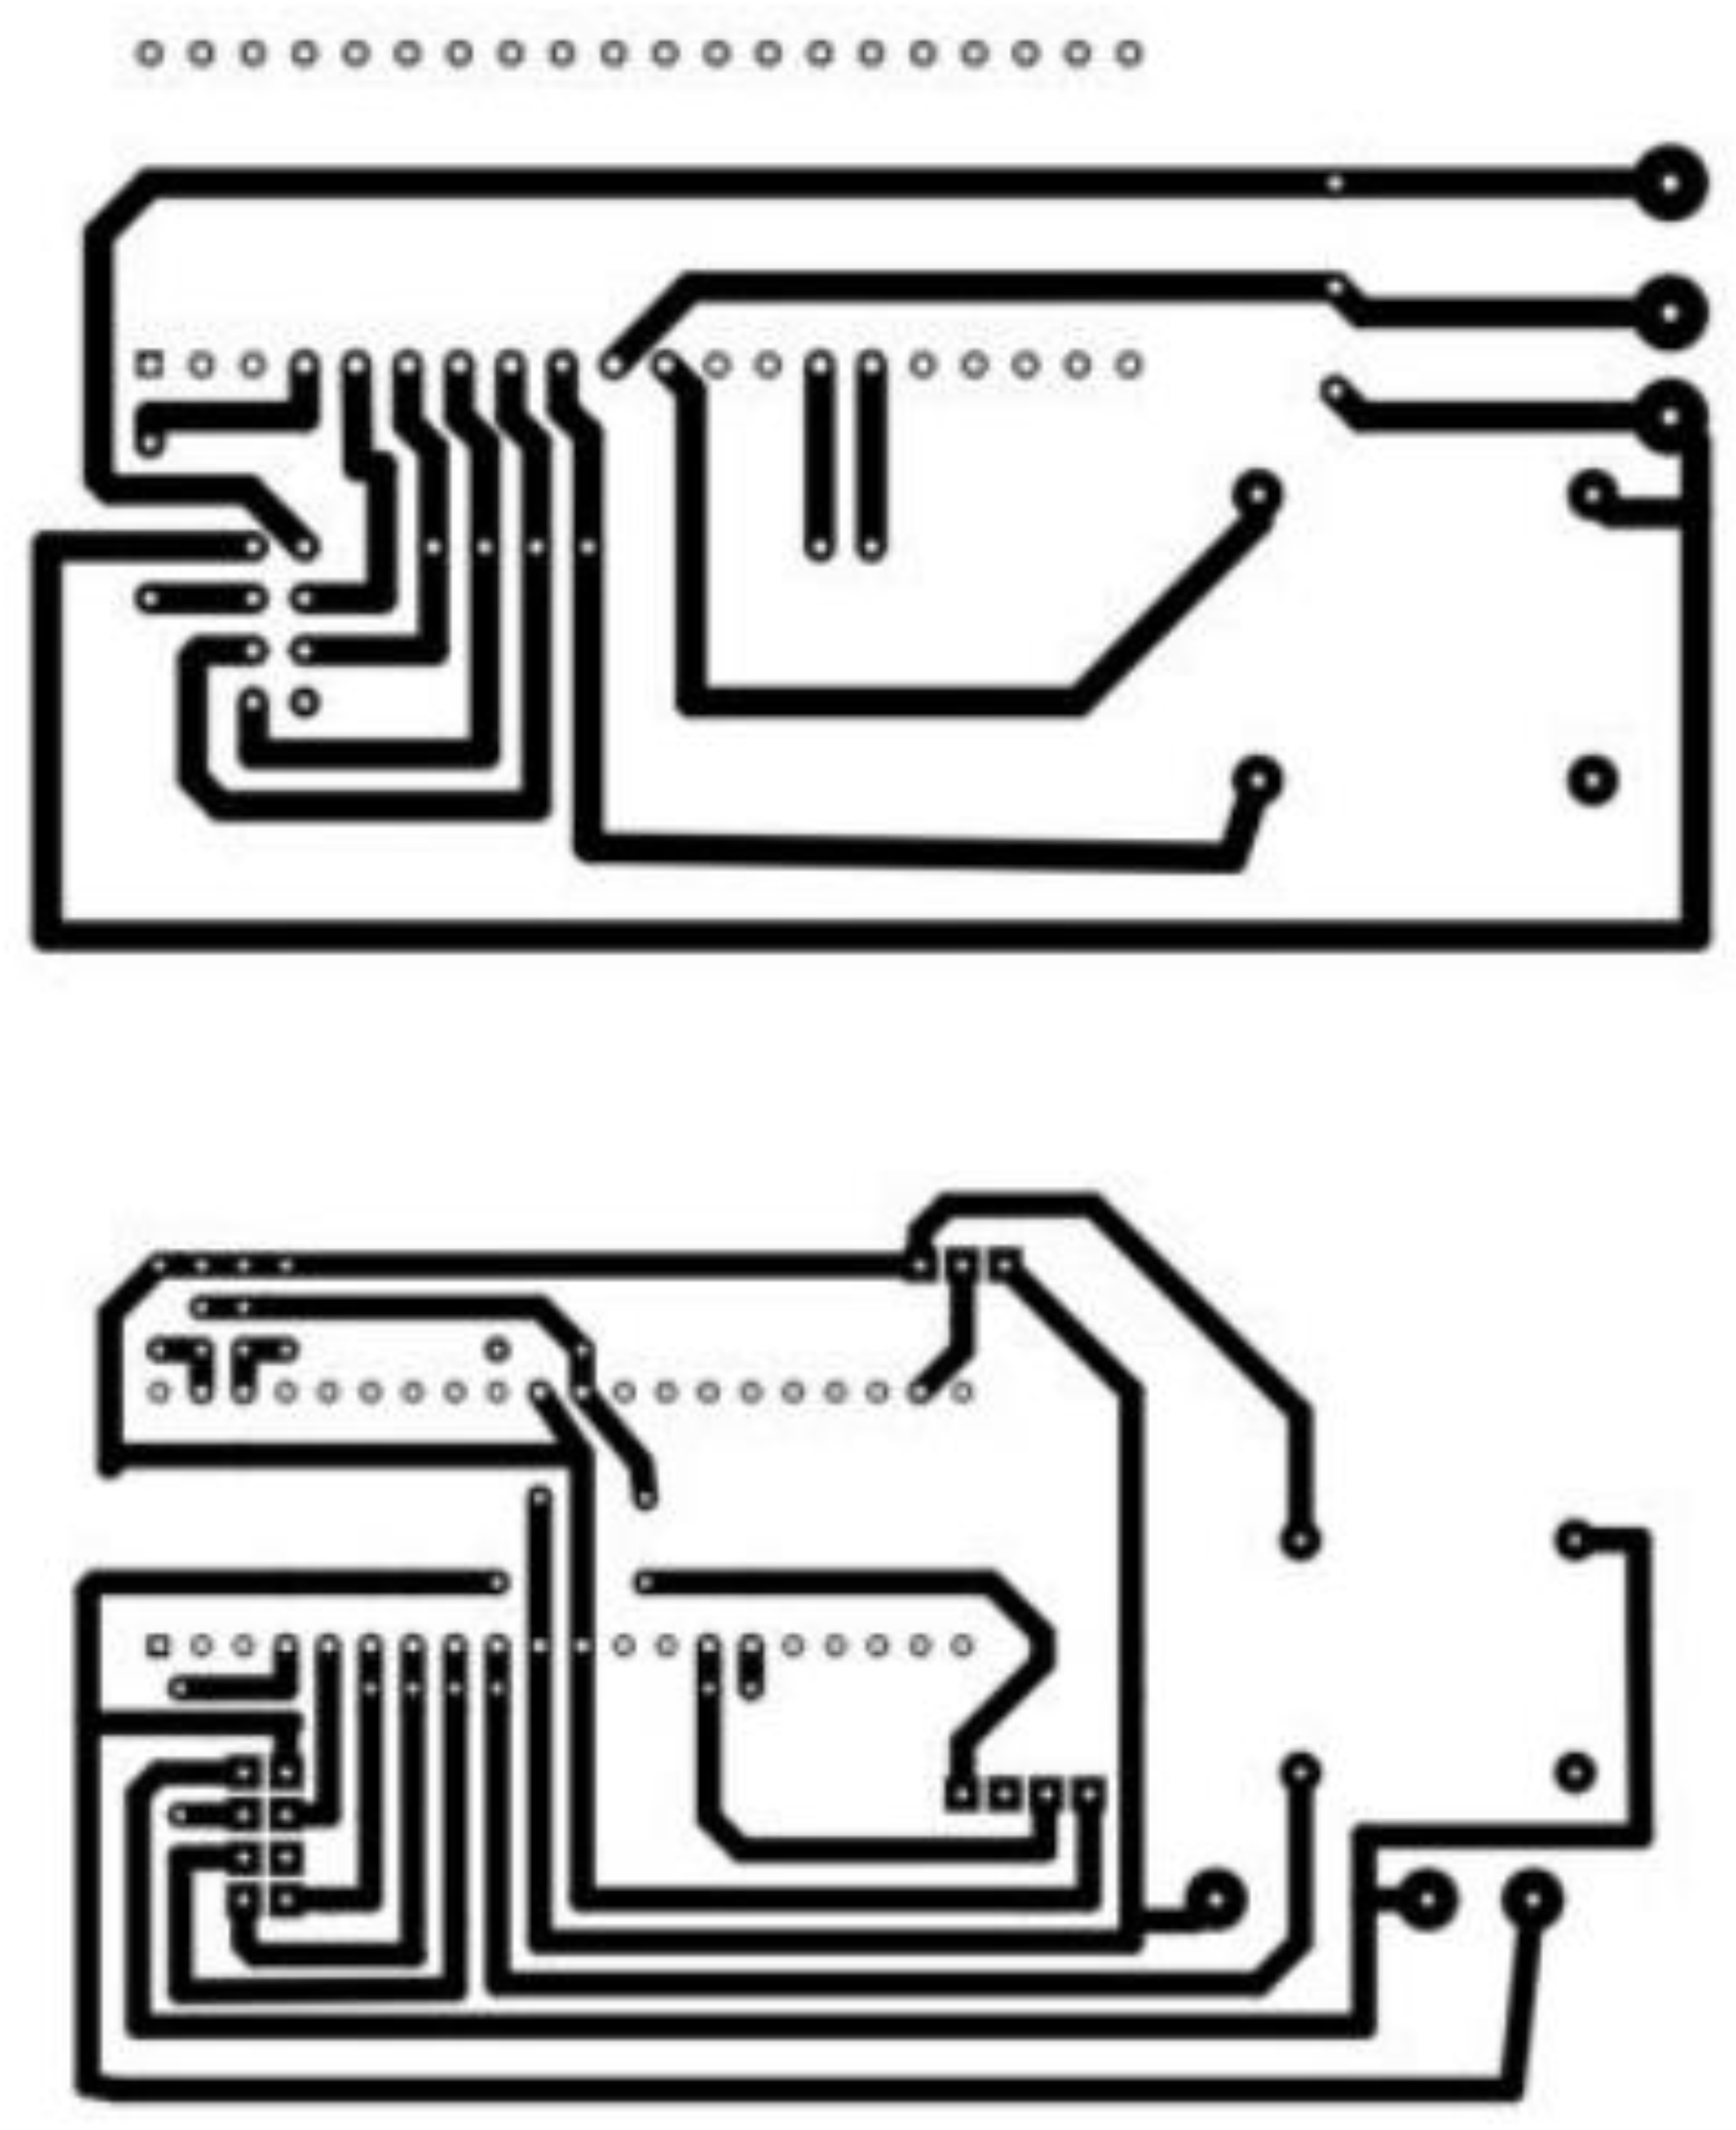
Figure 3.
Receiver side connection.
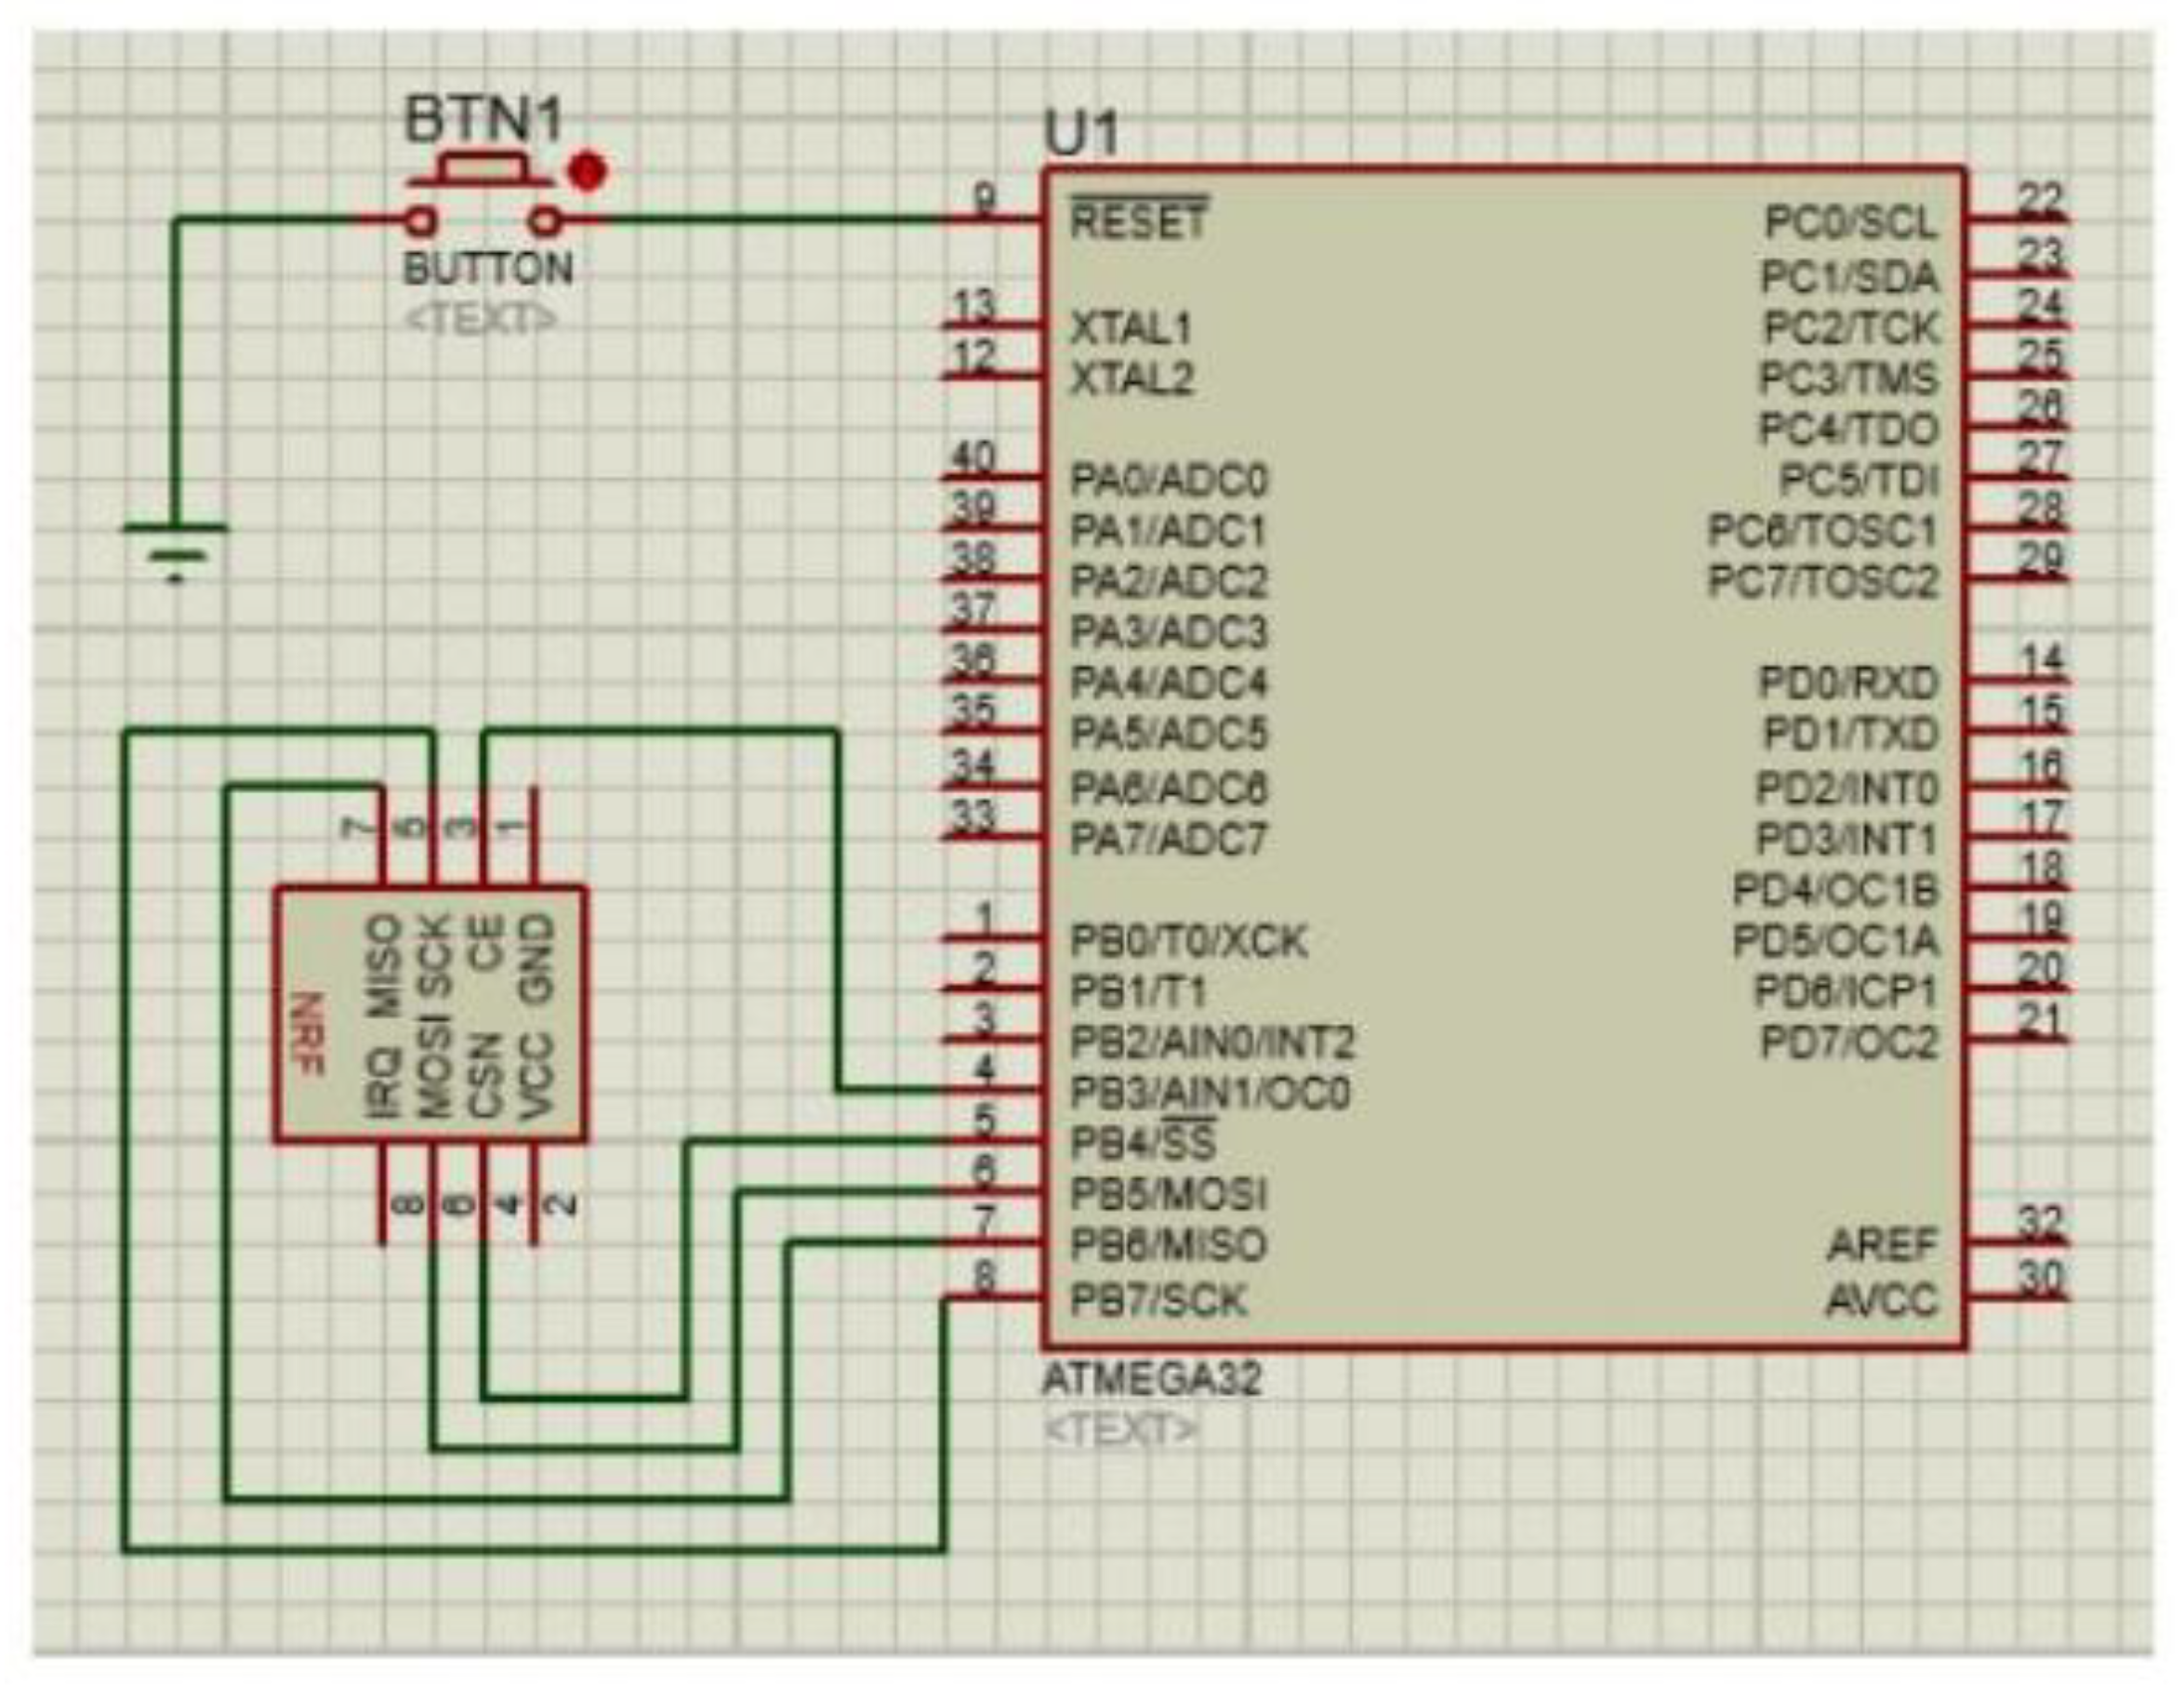
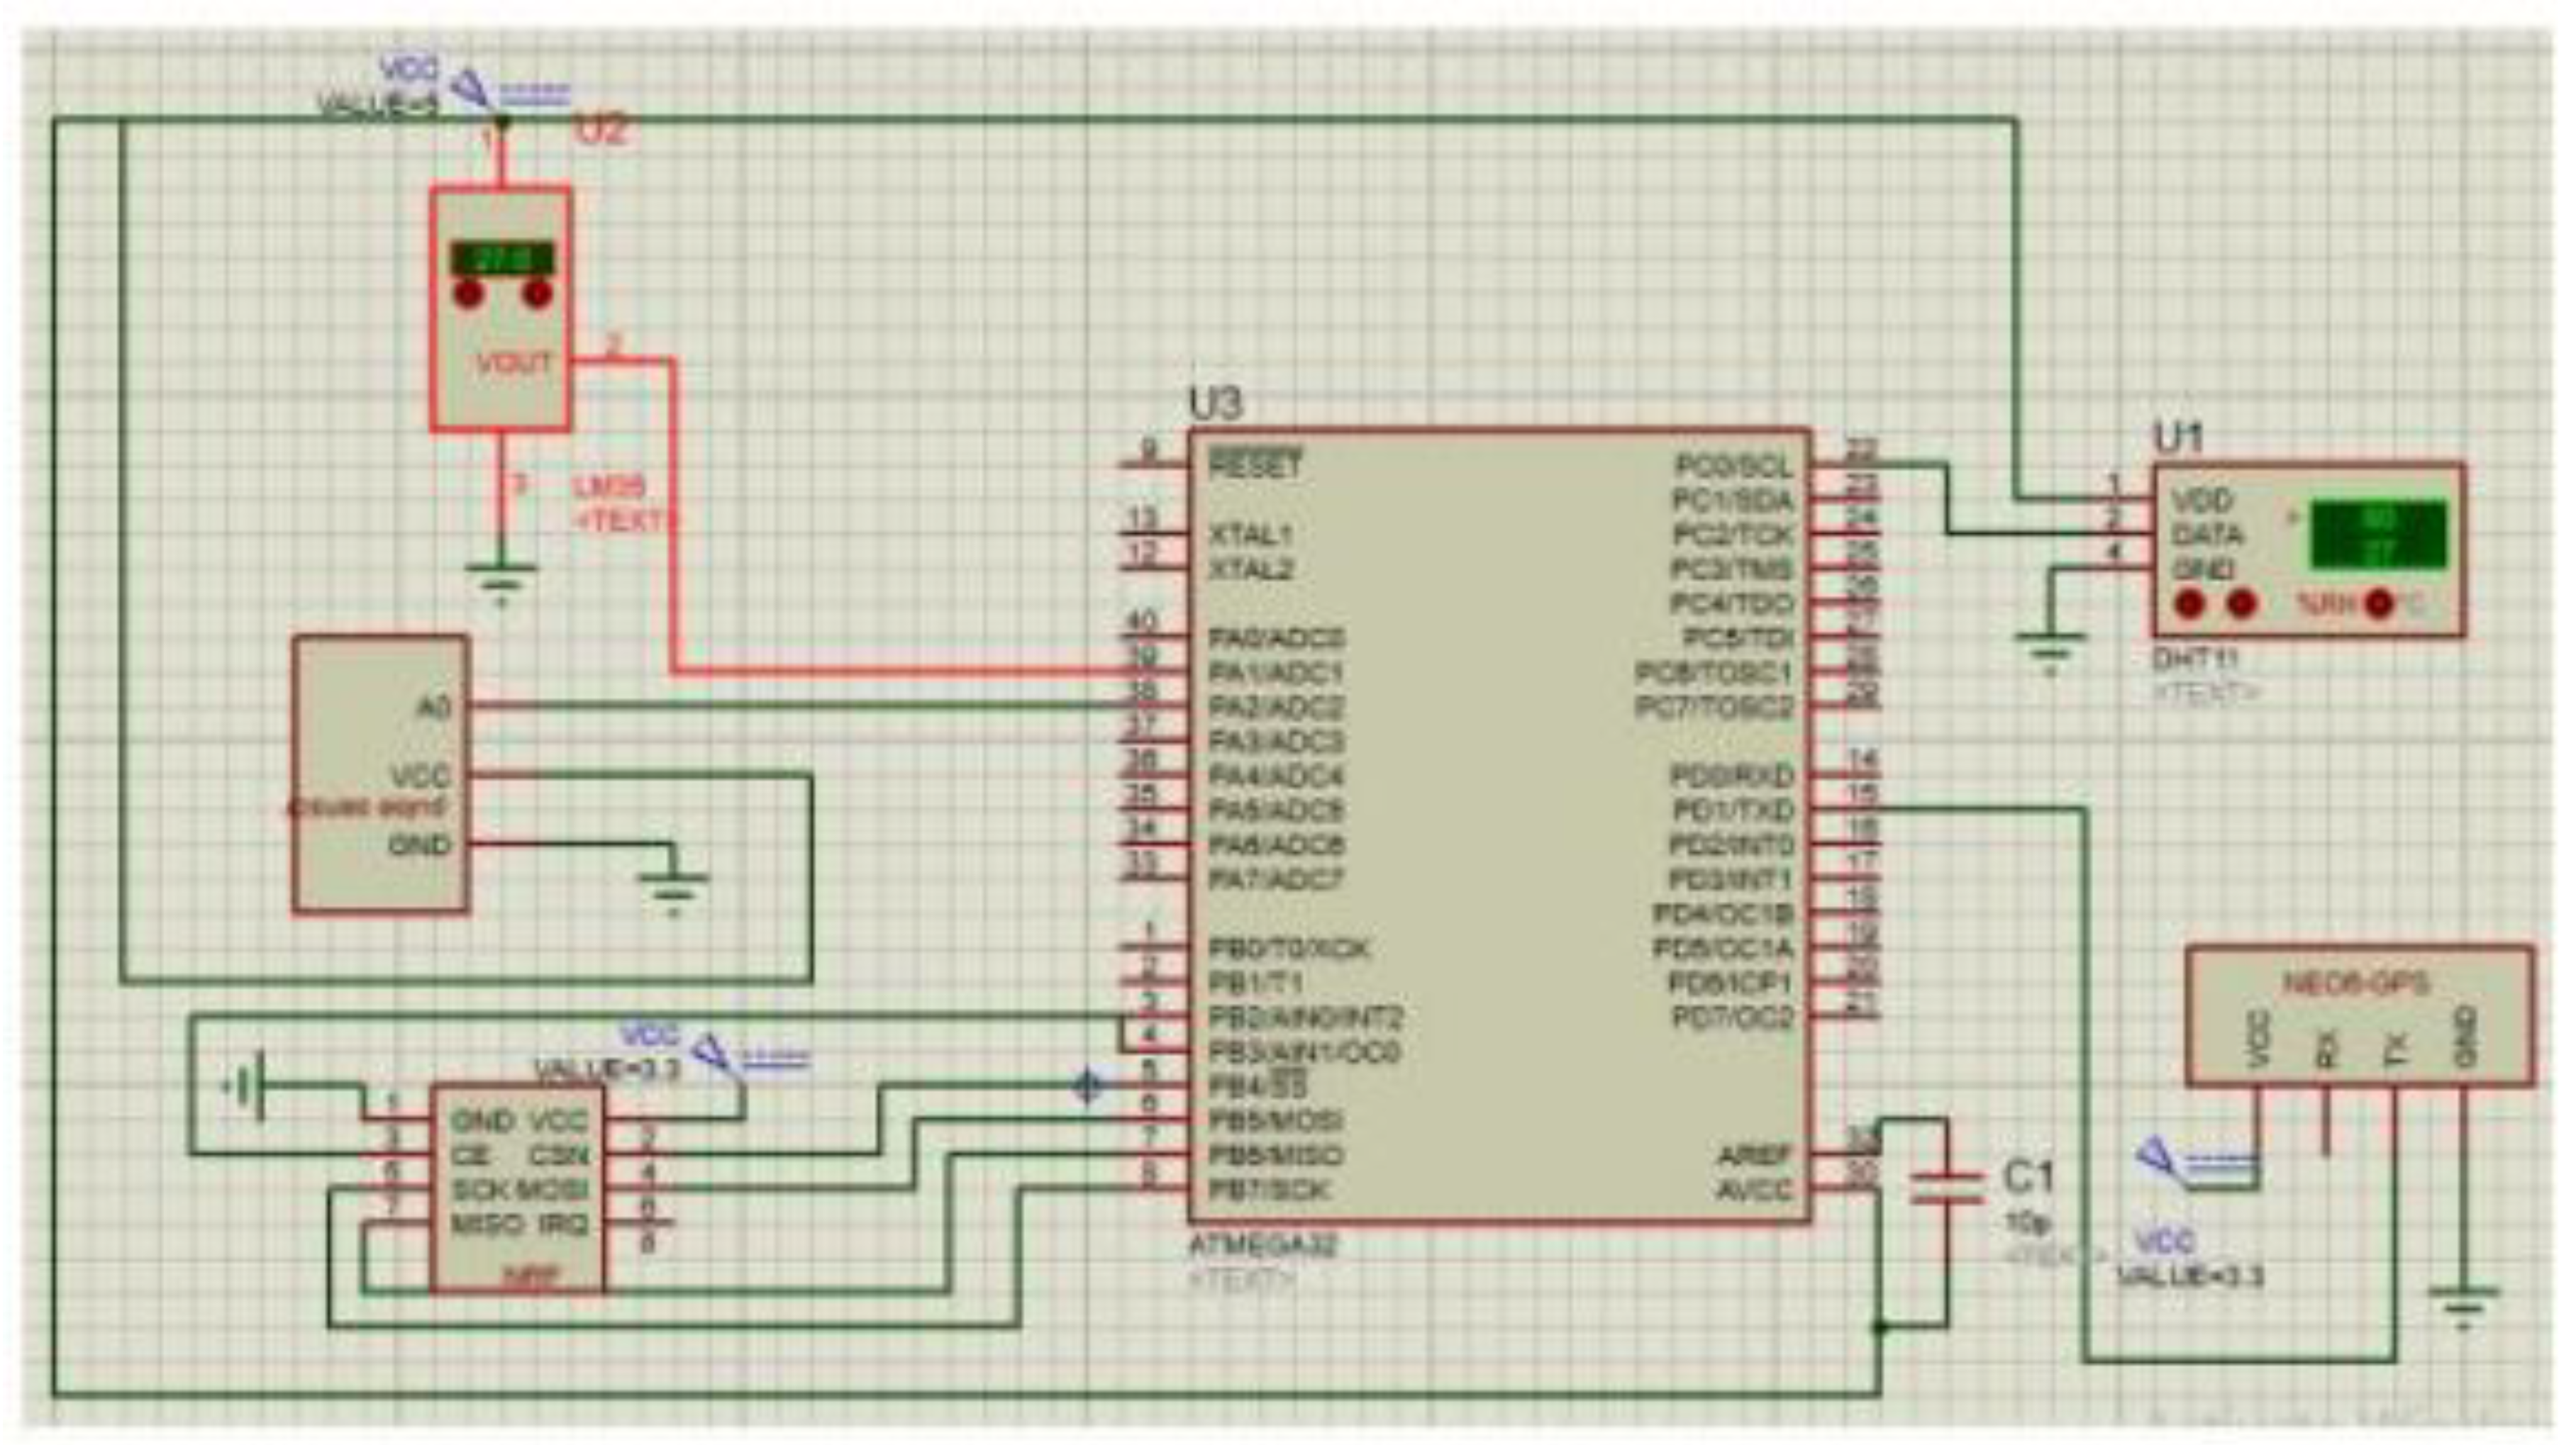
Figure 4.
Transmitter side connection.
3.2. Working Principle
The block diagram of the system is shown in the Figure 1. above, illustrating the connectivity of different hardware within the system. The components of the animal monitoring system include sensors, a microcontroller, and internet connectivity. Our project incorporates three sensors: an LM35 temperature sensor, a DHT11 Temperature and Humidity sensor, and a pulse sensor, alongside a GPS module and an NRF transceiver. The LM35 sensor is tasked with measuring the animal’s body temperature and outputs analog data, while the DHT11 sensor gauges both temperature and humidity of the surroundings with 1% precision, serially transmitting this data. The GPS module pinpoints the animal’s location, and the pulse sensor measures its heart rate, providing output through its Ao pin. After data collection from each sensor, it is relayed to a microcontroller which processes it and forwards it to the NRF module. The NRF module utilizes the SPI protocol for serial data communication, transmitting it to the receiver side where it is processed in chunks by another microcontroller, which then serially transmits it to a PC via a TTL to USB converter.
Serial data from the microcontroller are captured using the Serial library in Python, with all sensor and module data being stored in a local variable. This data is then structured and sent to a server using an HTTP POST request to our API. Our system’s backend comprises a RESTful CRUD (Create, Retrieve, Update, Delete) API built with Node.js, Express, and MongoDB, employing methods like POST, GET, PUT, and DELETE to manage data interactions. MongoDB stores this information in a JSON-like format, with Mongoose serving as the bridge for database interactions. On the frontend, an Android app retrieves data from the server using GET requests handled by the Retrofit library, and displays maps with real-time and historical location data of the animal using the Mapbox Maps SDK for Android.
3.3. Data Flow Diagram
The data flow within the Animal Monitoring System is meticulously structured to ensure accurate data acquisition, processing, transmission, storage, and visualization. The following steps outline the data flow process.
Step 1: Initialize all the devices and variables.
All sensors, microcontrollers, and communication modules are powered on and initialized. Variables are set up to store sensor data and manage communication protocols.
Step 2: Receive data from transducer and assign to variables
The LM35 temperature sensor, DHT11 temperature and humidity sensor, pulse sensor, and NEO-6M GPS module collect their respective data.
- The LM35 sensor measures the animal’s body temperature and outputs analog data.
- The DHT11 sensor measures the environmental temperature and humidity, providing digital data.
- The pulse sensor measures the animal’s heartbeat, outputting analog data.
- The GPS module determines the animal’s location and provides positional data.
Step 3: Send data using the RF module
Figure 5.
Data Flow Diagram.
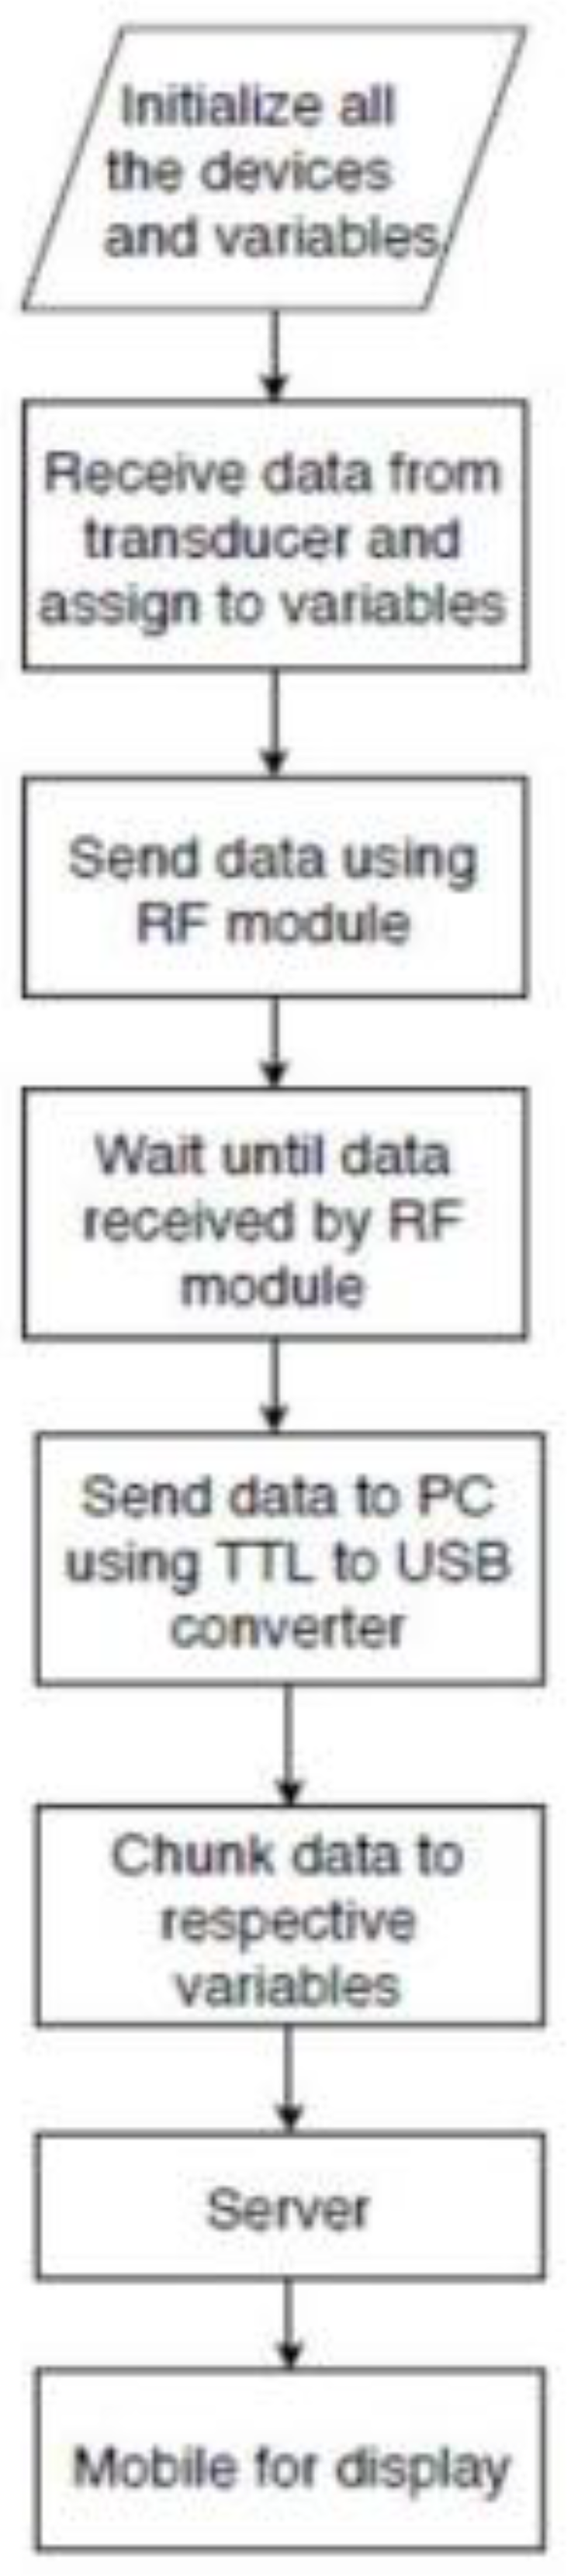
- Microcontroller Data Handling: The ATMEGA32 microcontroller processes the data received from the sensors. It converts analog signals to digital where necessary (e.g., LM35 and pulse sensor) and organizes the data into a structured format.
- Prepare Data for Transmission: The microcontroller packages the processed data for transmission via the NRF24L01 transceiver module.
Step 4: Wait until data is received by RF module 8
- Transmit Data Using NRF Module: The NRF24L01 transceiver module on the transmitter side sends the processed data wirelessly to the receiver side using the SPI protocol.
- Receive Data on the Receiver Side: The corresponding NRF24L01 module on the receiver side receives the transmitted data and sends it to another ATMEGA32 microcontroller.
Step 5: Send data to PC using TTL to USB converter
- Microcontroller Data Handling on Receiver Side: The microcontroller on the receiver side processes the incoming data and prepares it for serial transmission to a PC.
- Send Data to PC: The processed data is sent from the microcontroller to the PC using a TTL to USB converter.
Step 6: Chunk data to respective variables
- Receive Serial Data on PC: The PC receives the serial data using a Python script that utilizes the Serial library to read the incoming data.
- Store Data in Local Variables: The received data is stored in local variables, organized by the type of data (e.g., temperature, humidity, pulse rate, GPS coordinates).
Step 7: Data received by the server
- The PC sends the processed data to a server using an HTTP POST request to a RESTful API built with Node.js, Express, and MongoDB.
Step 8: Display data on a mobile device
- Retrieve Data via Mobile App: The Android mobile application retrieves data from the server using HTTP GET requests facilitated by the Retrofit library.
- Display Data in Mobile App: The app displays real-time and historical data, including the animal’s location, body temperature, surrounding temperature, humidity, and pulse rate. The Mapbox Maps SDK for Android is used to visualize the animal’s real-time location and movement history on a map
4. Result and Analysis
The Animal Monitoring System was successfully implemented and tested, providing accurate and reliable data on the animal’s location, body temperature, pulse rate, and surrounding environmental conditions. The following sections detail the results obtained from the system and analyze its performance.
4.1. Data Output
The system was designed to transmit data wirelessly from the sensors placed on the animal to a receiver connected to a PC. The data was then processed and stored in a MongoDB database, with a mobile application providing real-time monitoring and historical data visualization.
4.1.1. Data Display on PC
The data received by the PC was displayed in a Python console, confirming the correct reception and processing of the sensor data. The following figure shows a sample output displayed in the Python console:
Figure 6.
Output displayed in Python Console.
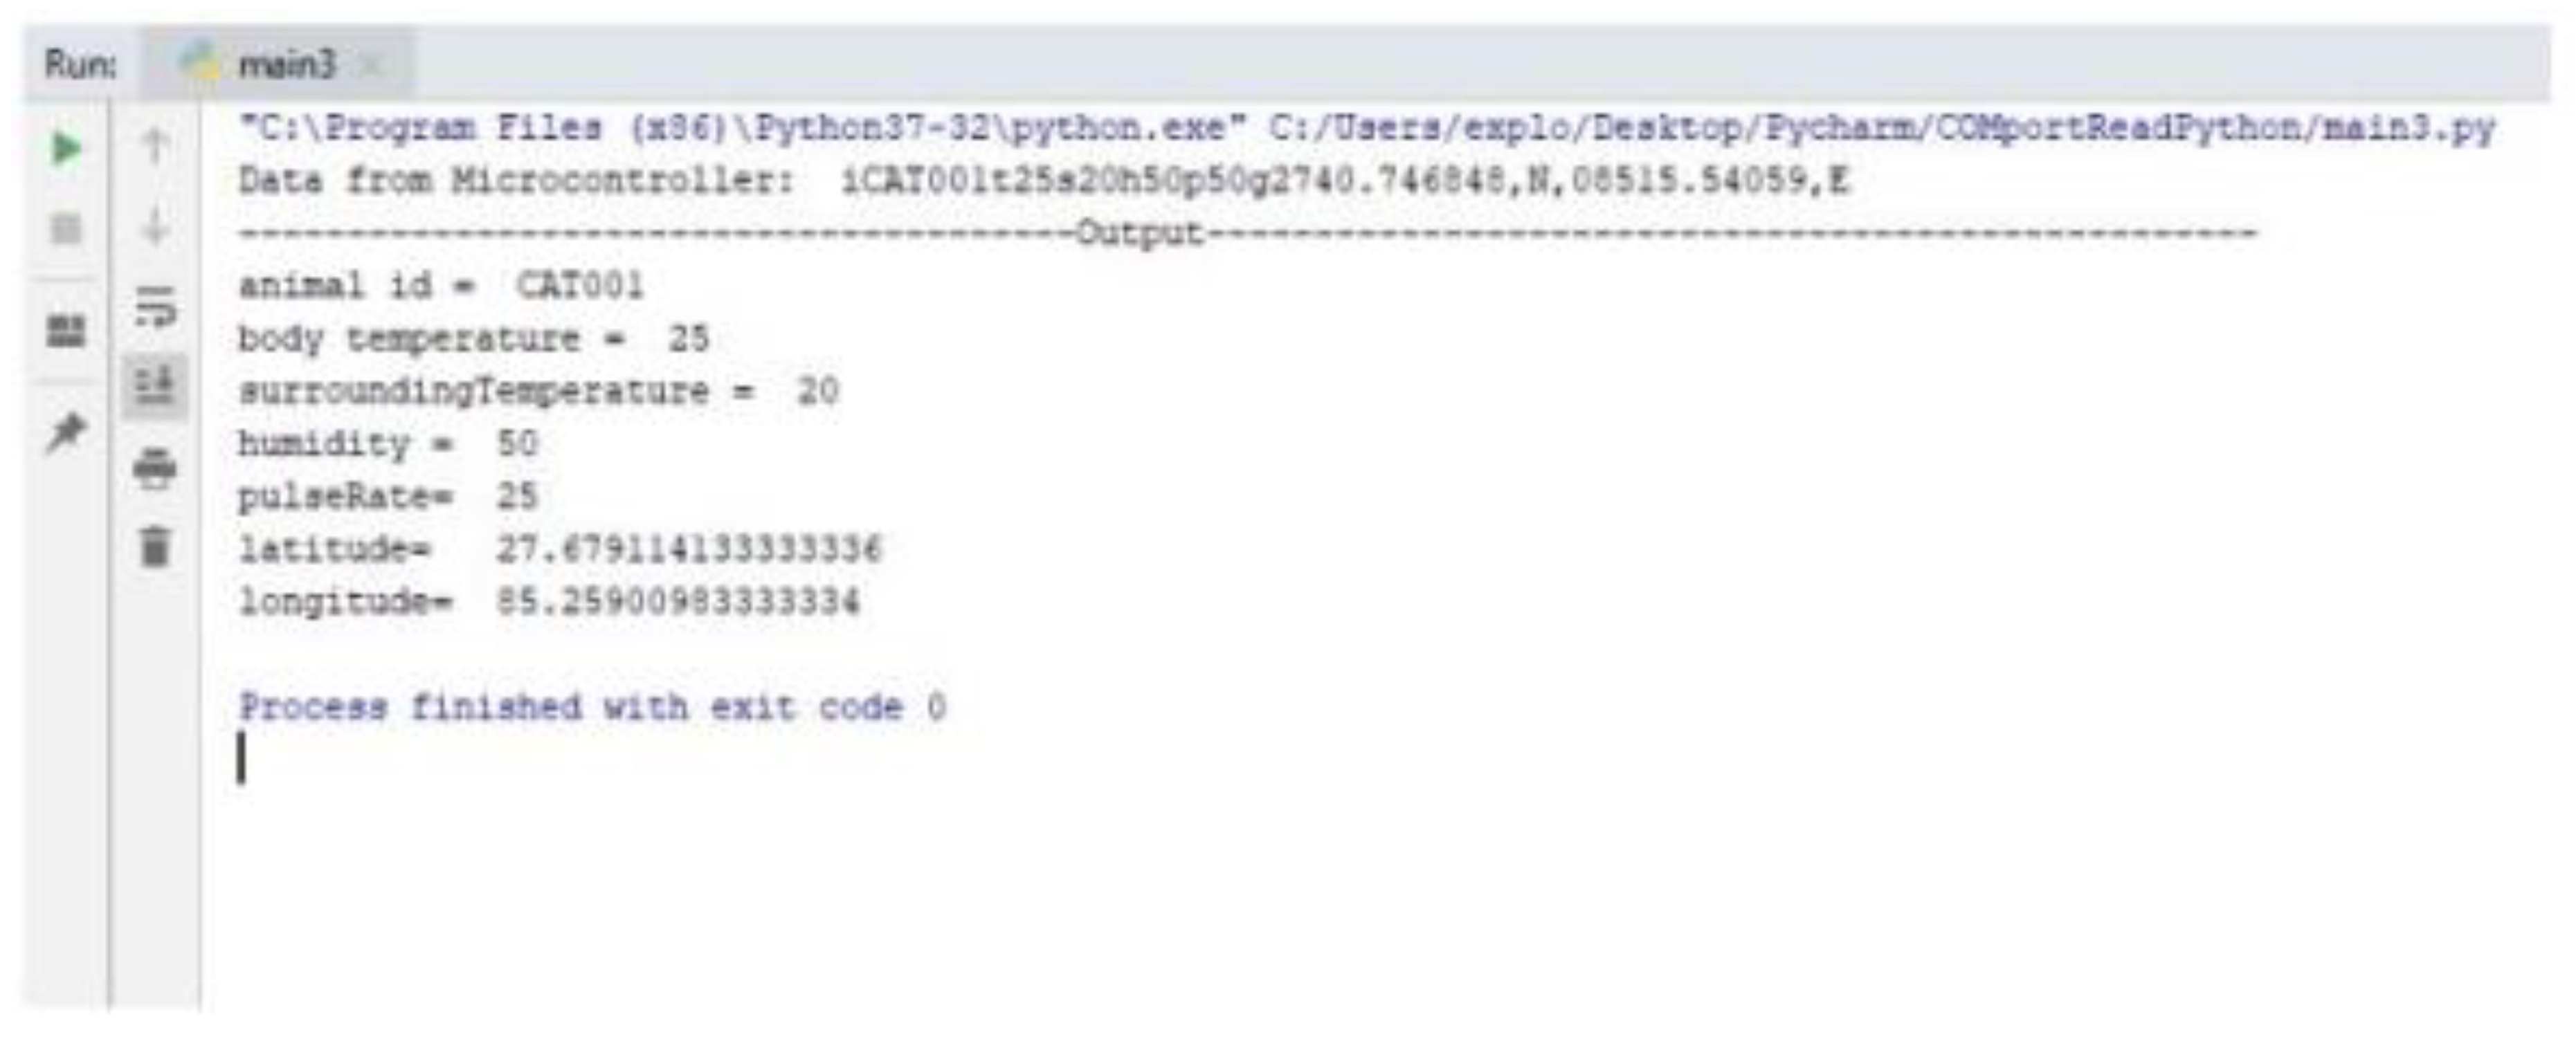
This output includes:
- GPS coordinates (latitude and longitude)
- Animal’s body temperature
- Surrounding temperature and humidity
- Pulse rate
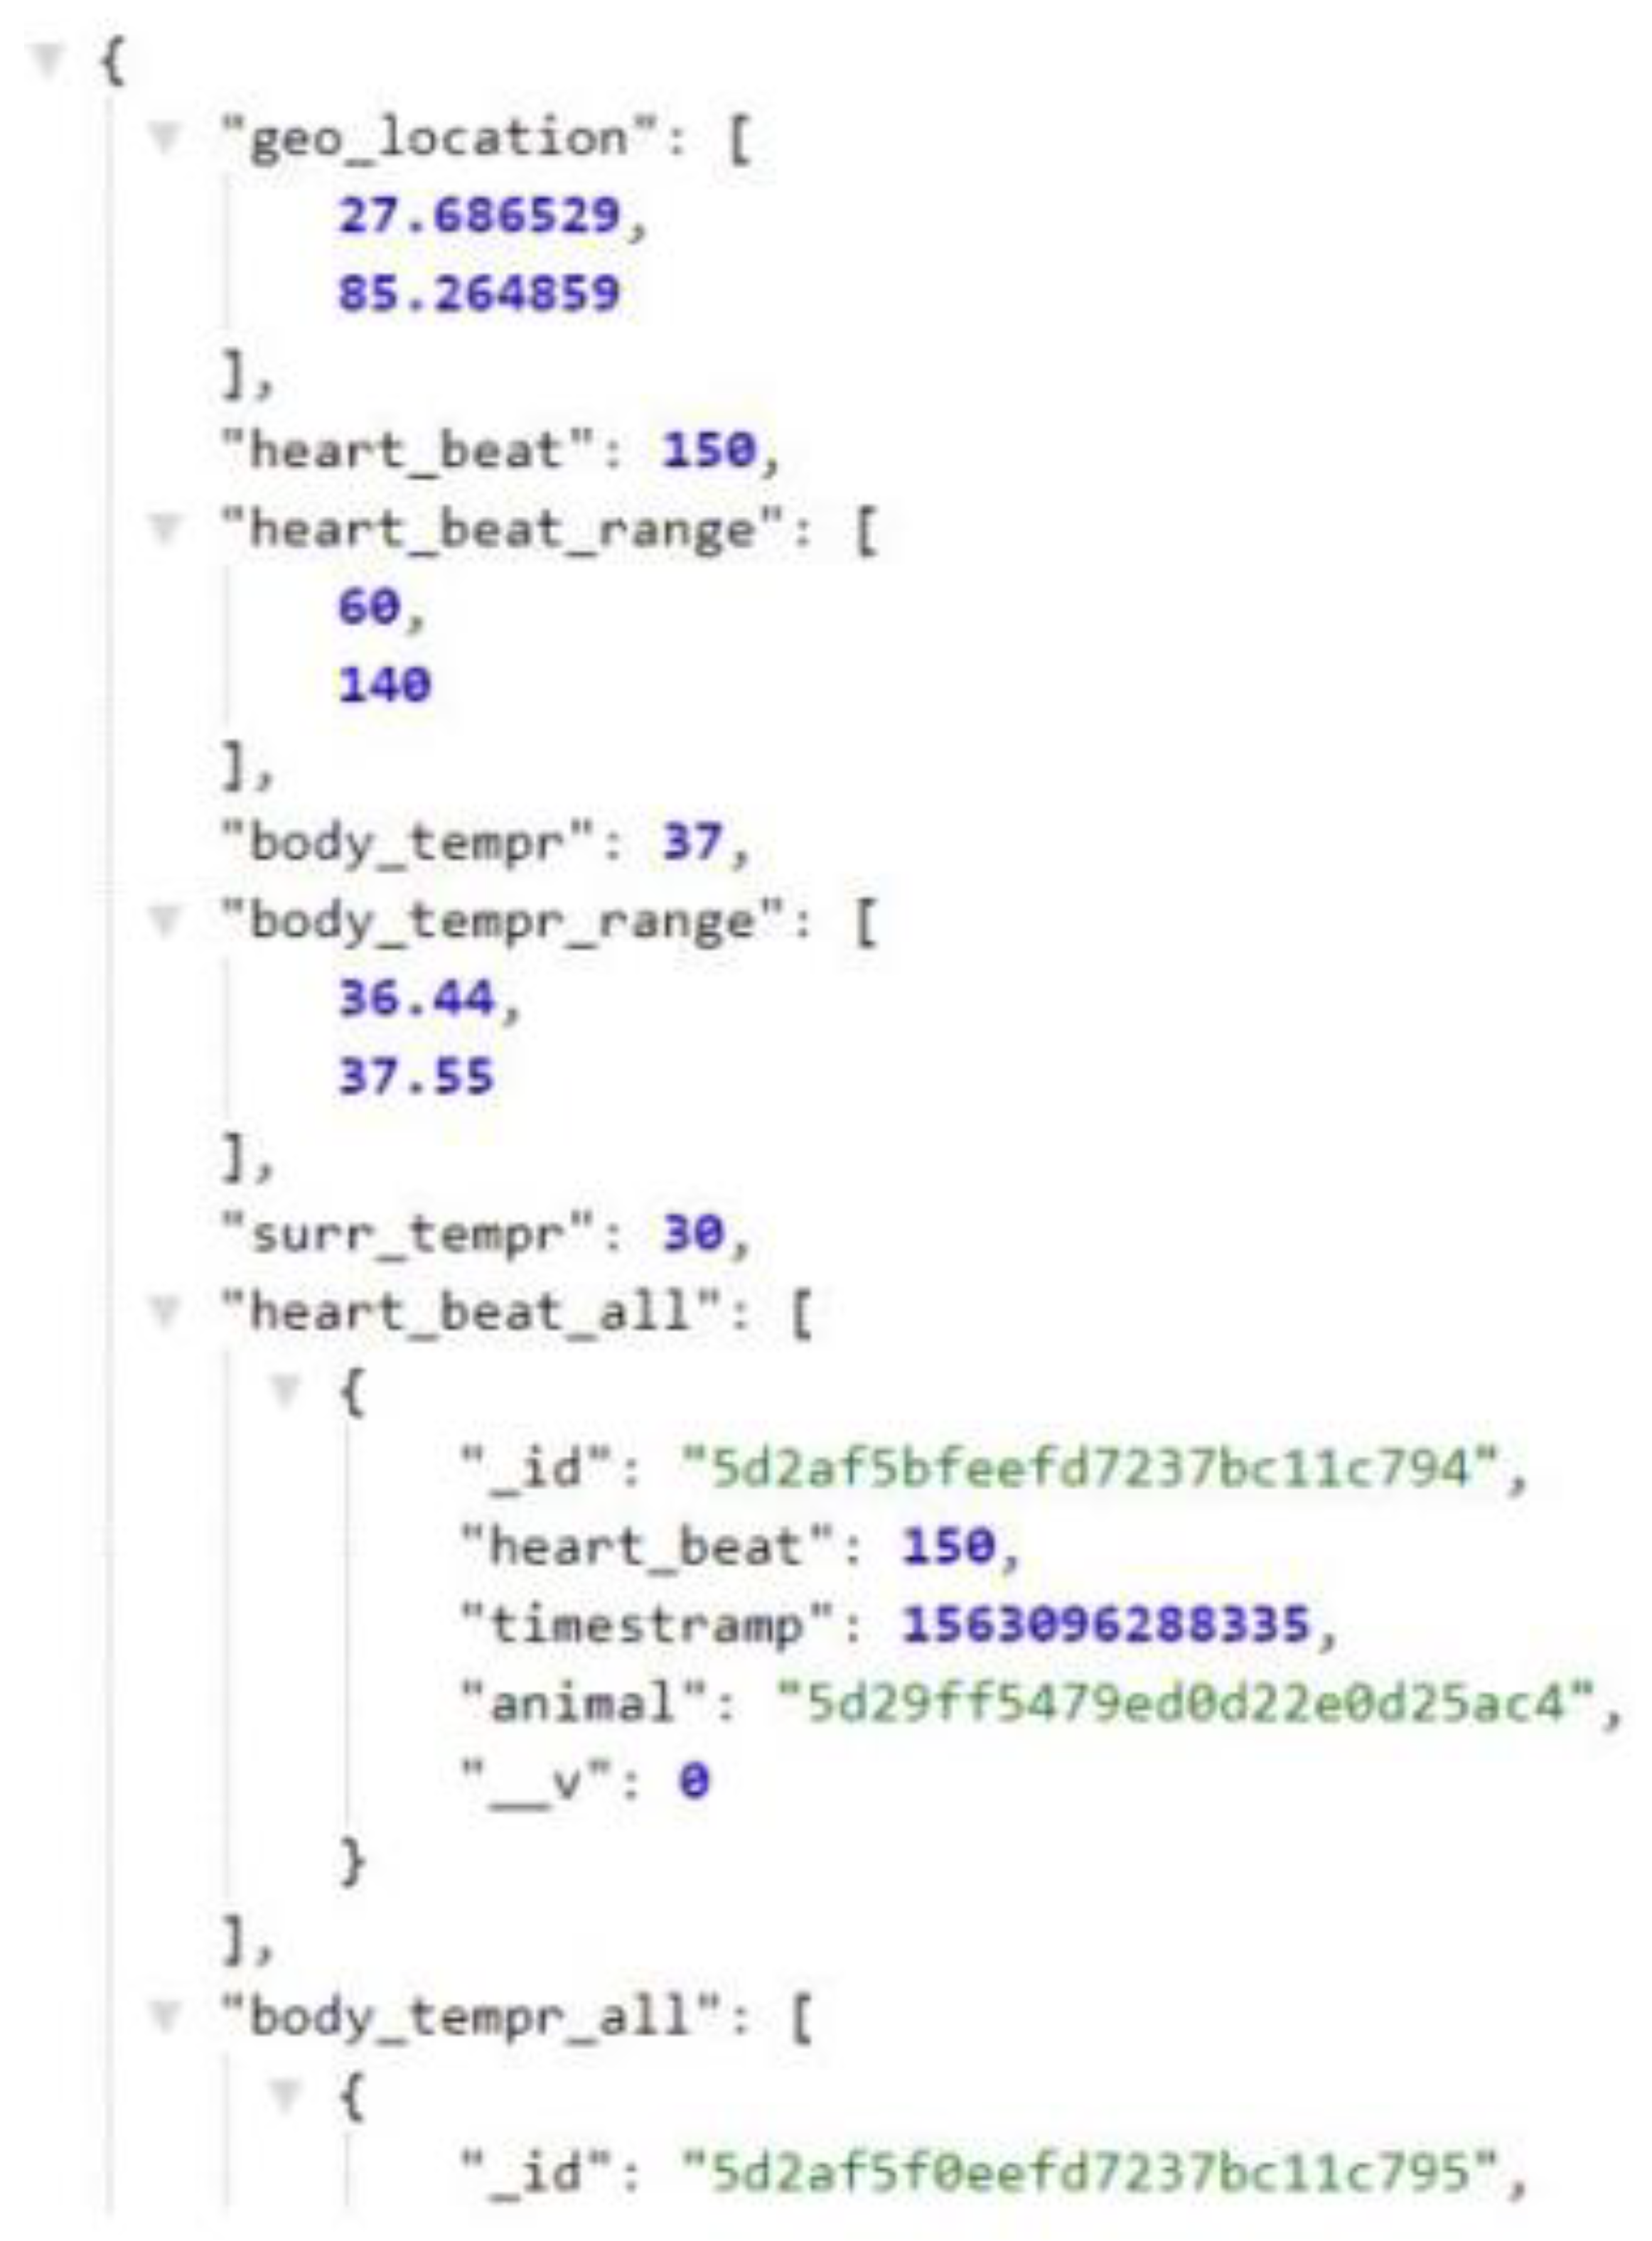
4.1.2. JSON Data Structure
The data was structured in JSON format for storage in the MongoDB database. The JSON data structure includes:
- timestamp: The time when the data was recorded
- location: GPS coordinates of the animal
- bodyTemperature: The body temperature of the animal
- environmentTemperature: The surrounding temperature
- humidity: The surrounding humidity
- pulseRate: The pulse rate of the animal
The data collected can also be used to detect any disease such as heart disease which can be observed using machine learning models integrated in the system [25].The following figure shows a sample of the JSON data generated by the system:
Figure 7.
JSON data.
4.1.3. Mobile Application GPU
The mobile application provided a user-friendly interface to monitor the animal’s data in real-time [26]. The following figures show the GUI of the app displaying the recent and detailed data of the animal:
These interfaces include:
- Real-time and historical data visualization
- Animal’s location on a map
- Detailed information on body temperature, pulse rate, and environmental conditions
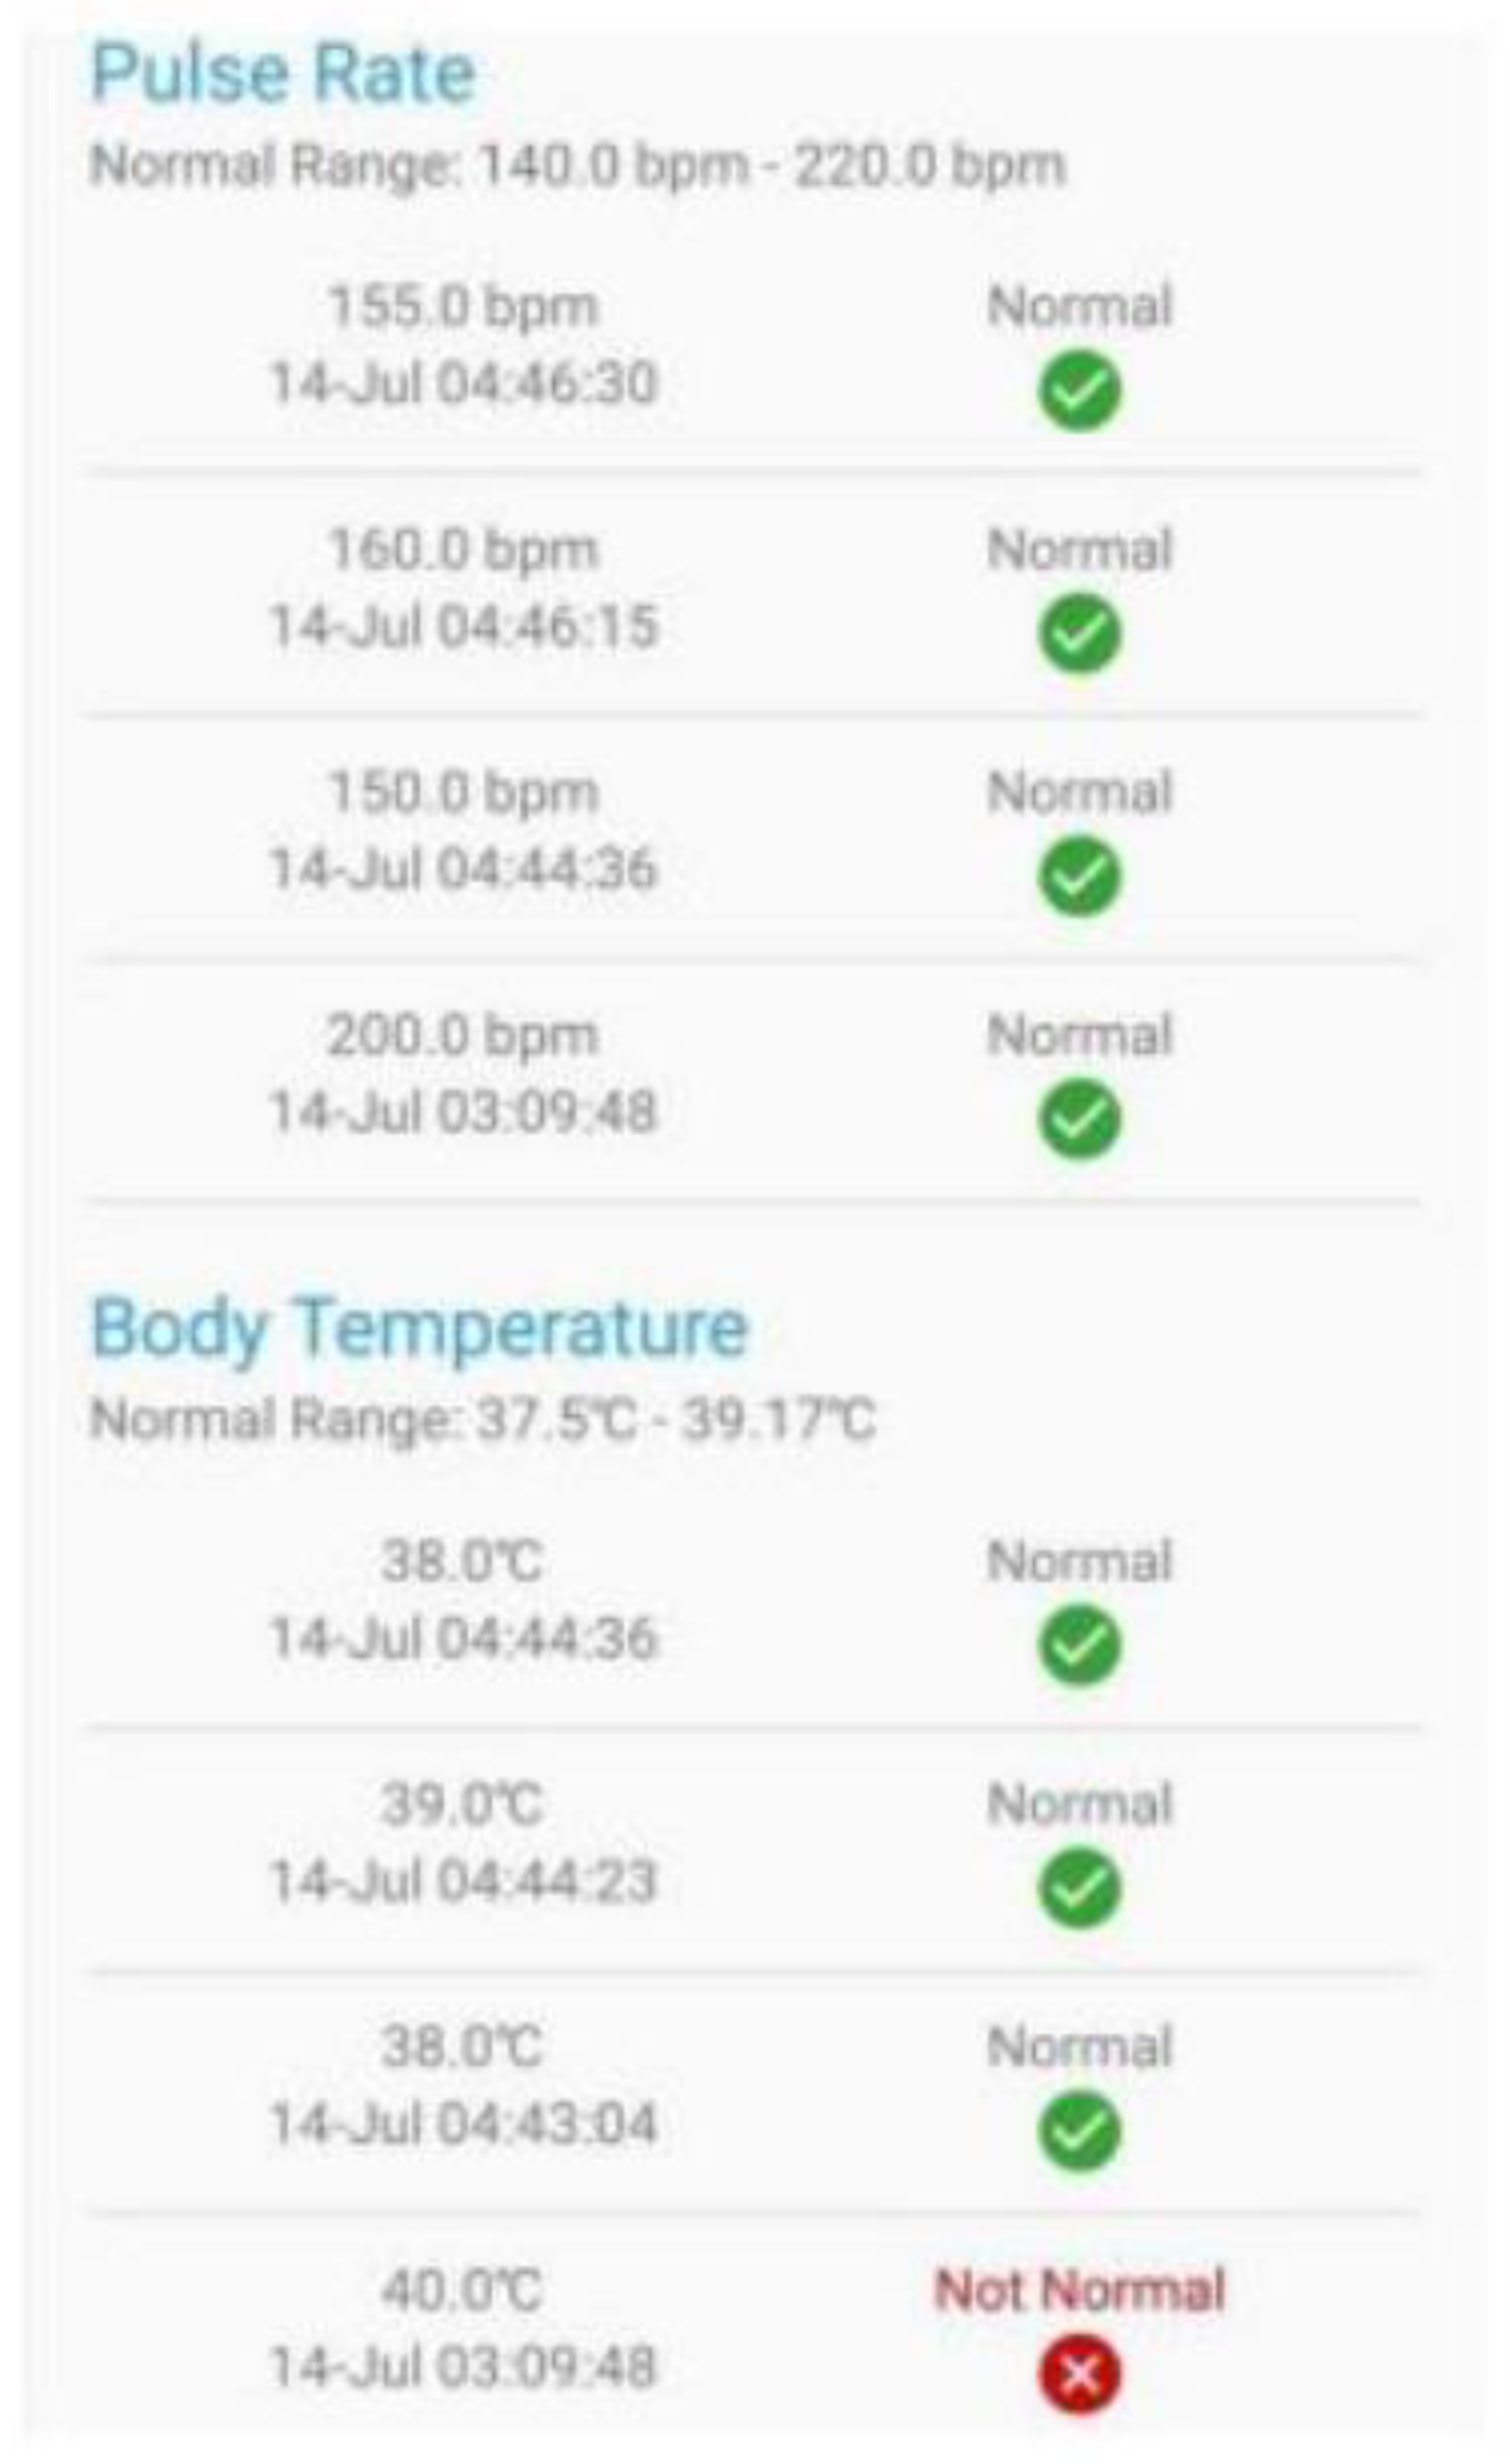
Figure 8.
Detailed data of Animal.
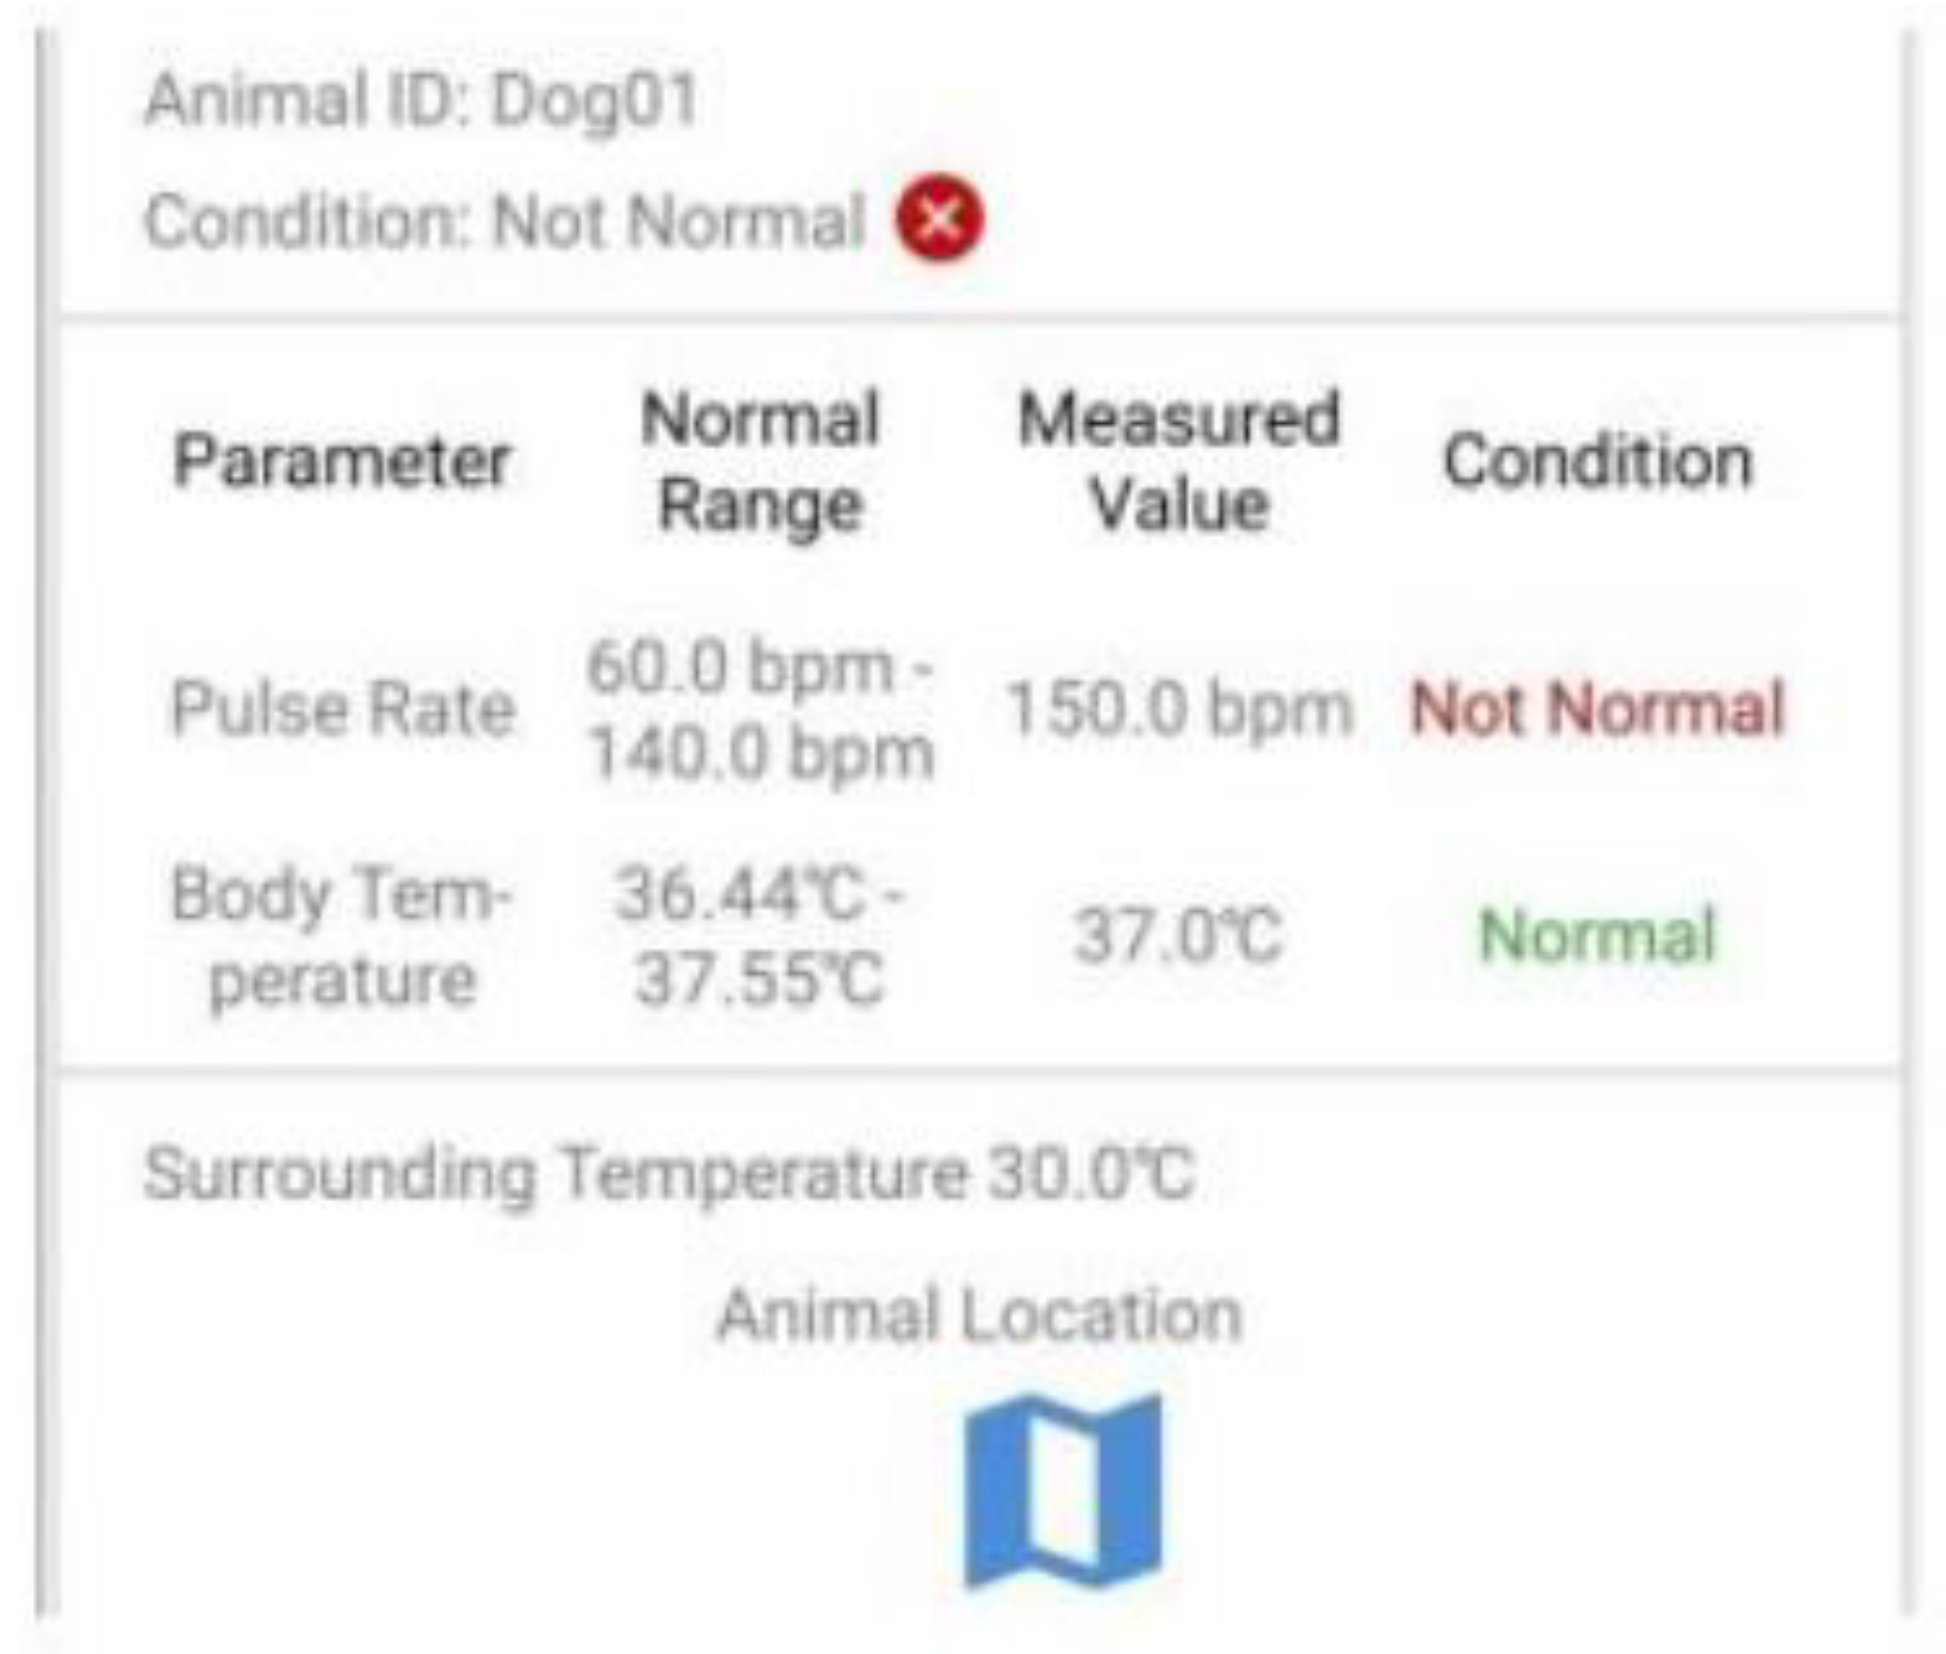
Figure 9.
GUI of app showing recent data of animal.
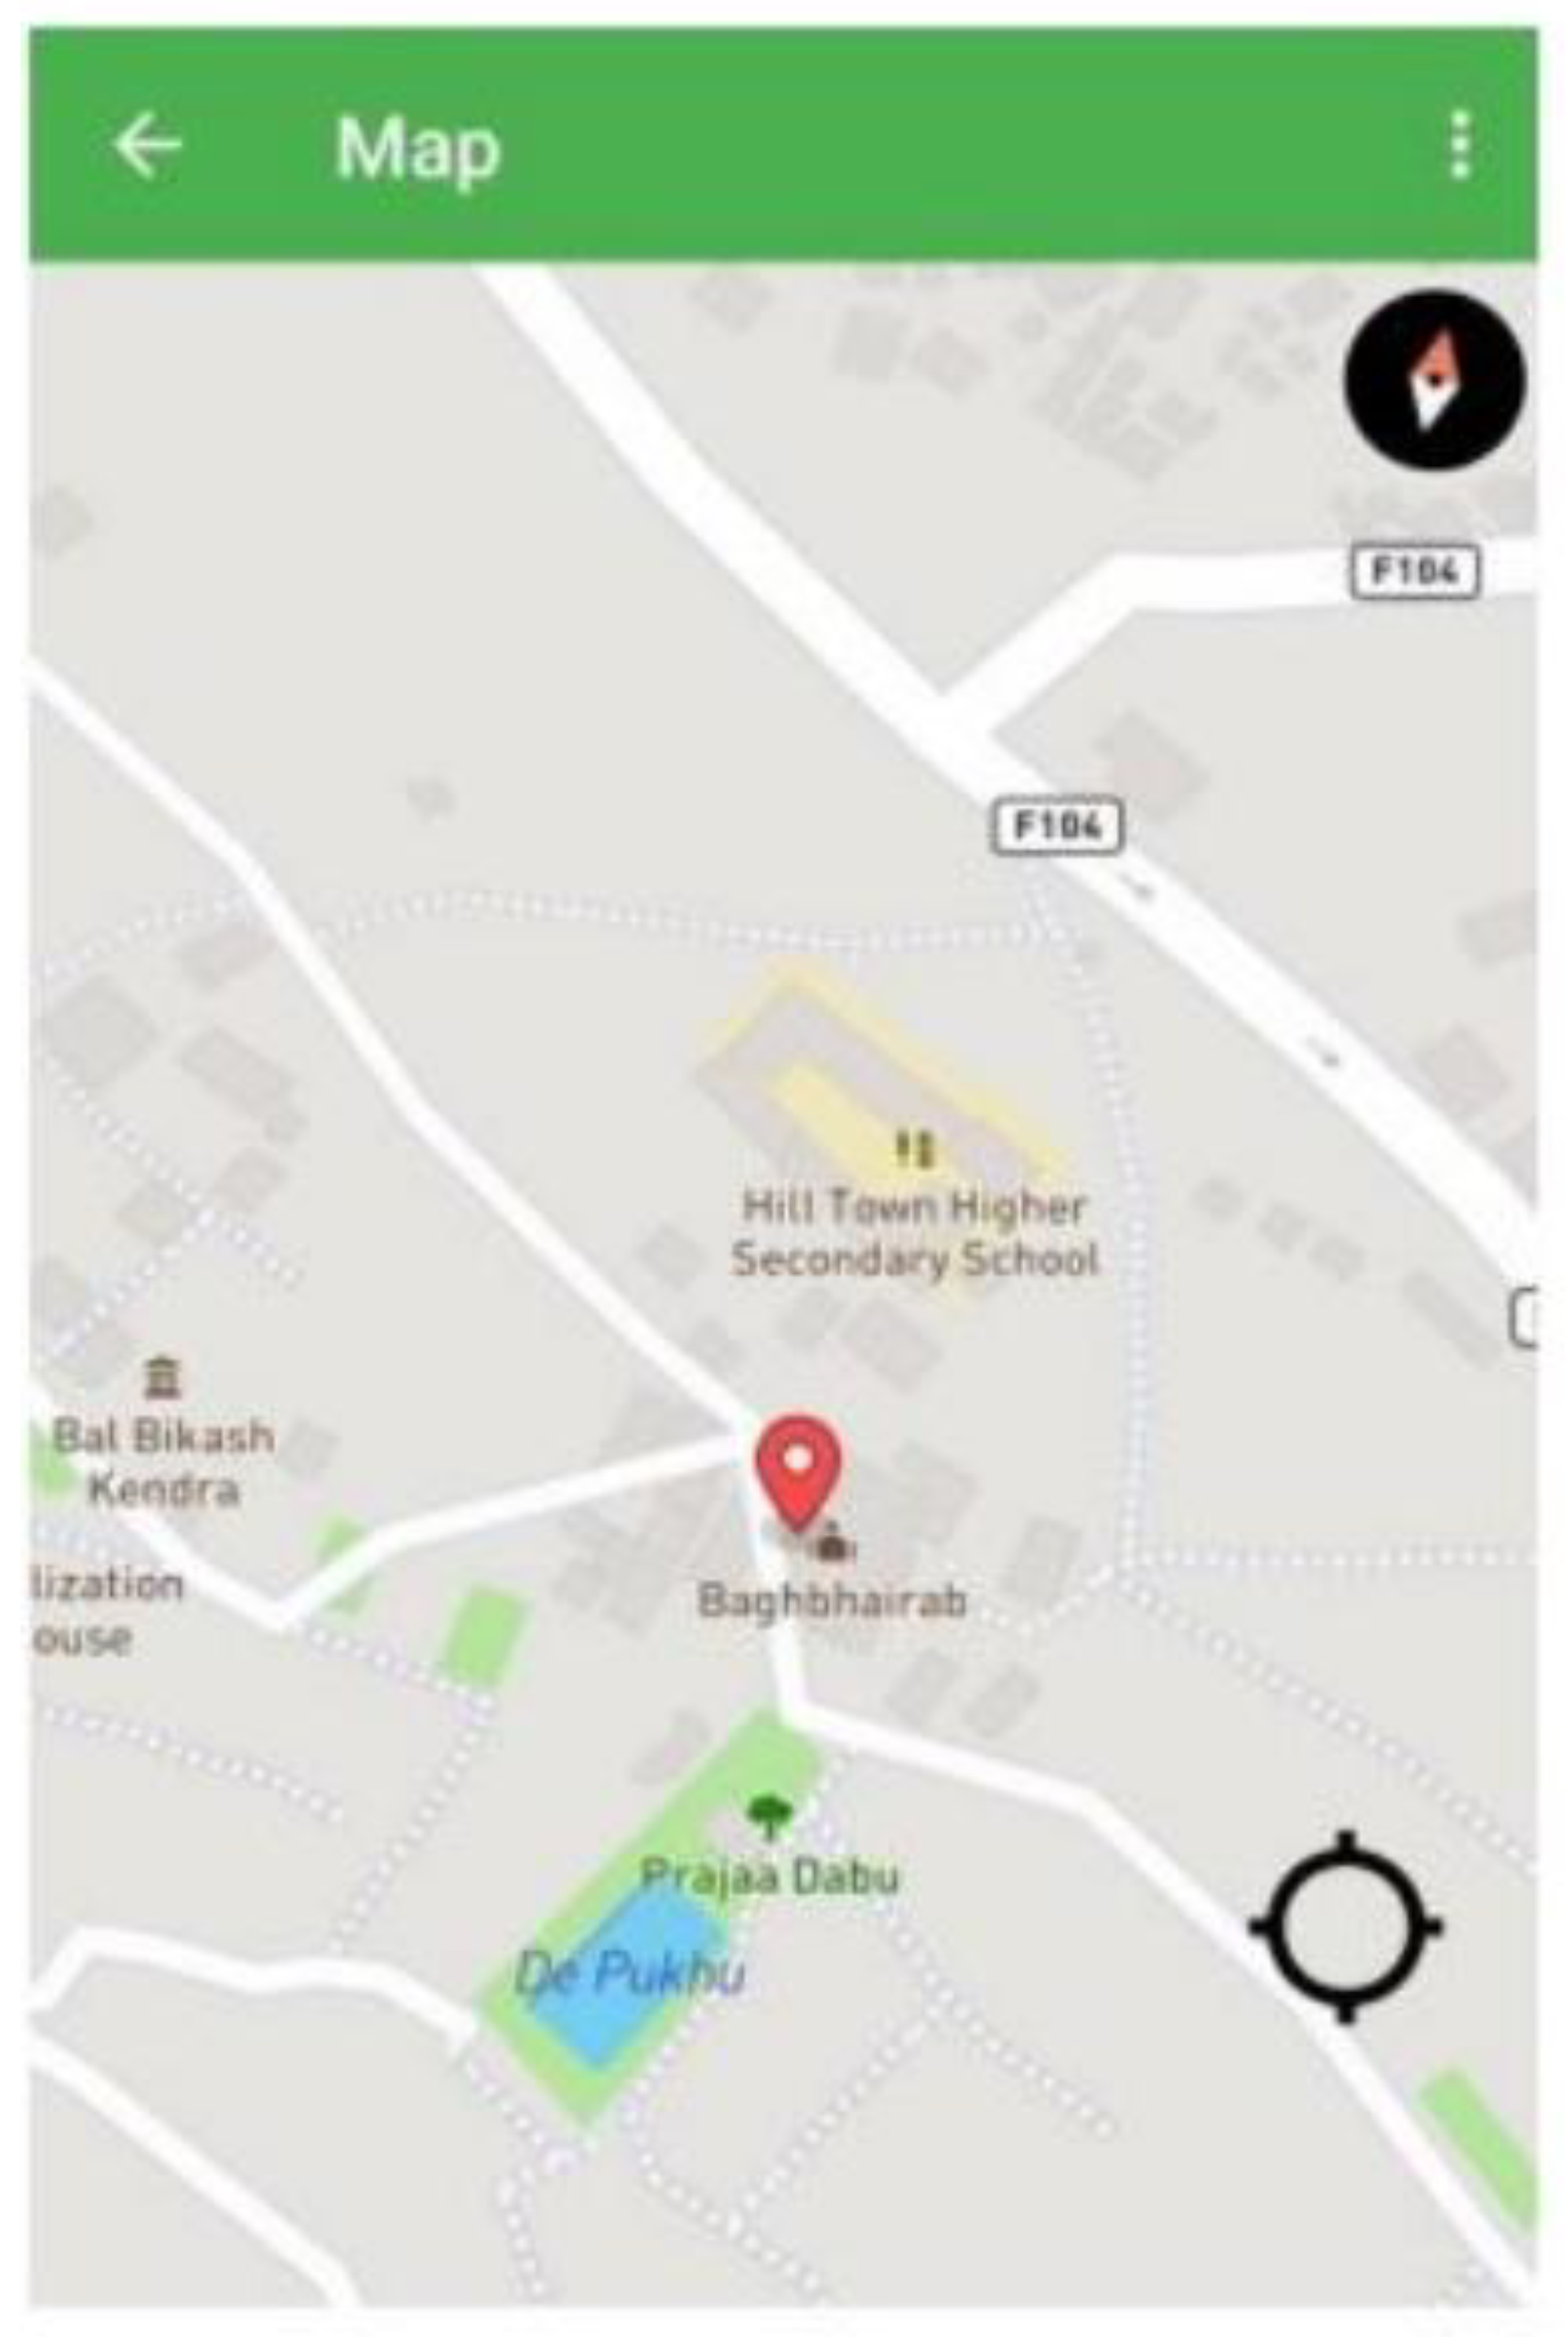
4.1.4. Location Tracking
The Mapbox Maps SDK for Android was used to display the real-time location and movement history of the animal. The following figure shows the animal’s location as displayed in the mobile app:
4.2. Analysis of Results
The results obtained from the system indicate that it performs reliably under various conditions. The following points summarize the analysis:
- Accuracy: The GPS module provided accurate location data with an error margin of ±2 meters. The LM35 and DHT11 sensors provided temperature and humidity readings with accuracy levels of ±0.5°C and ±1% respectively. The pulse sensor also delivered reliable pulse rate measurements.
- Wireless Communication: The NRF24L01 transceiver modules facilitated robust wireless communication between the transmitter and receiver, with minimal data loss or interference.
- Data Integrity: The data received by the PC and stored in the MongoDB database was consistent and accurately reflected the sensor readings.
- Real-Time Monitoring: The mobile application effectively displayed real-time data and historical trends, allowing for continuous monitoring of the animal’s health and location.
- Potential Errors: Some potential sources of error were identified, including electromagnetic interference affecting wireless communication, improper attachment of sensors, and occasional data loss. These issues were mitigated through careful design and error-handling mechanisms.
Figure 10.
Location of Animal.
4.3. System Performances
The system’s performance was evaluated based on several criteria, including data accuracy, transmission reliability, and user interface effectiveness. The following table summarizes the key performance metrics:
Overall, the Animal Monitoring System demonstrated high accuracy, reliability, and usability, making it a valuable tool for animal tracking and health monitoring in various applications.

Table 1.
Performance Metrics.
| Metrics | Value |
|---|---|
| GPS accuracy | ±2 meters |
| Temperature Accuracy | ±0.5°C (LM35), ±1°C (DHT11) |
| Humidity Accuracy | ±1% |
| Pulse rate Accuracy | High |
| Data Transmission | Reliable |
| Mobile App Usability | High |
5. Conclusion
The Animal Monitoring System using Pulse, Temperature, and GPS Sensors effectively integrates modern sensor technology, wireless communication, and mobile application development to provide a comprehensive solution for tracking and monitoring animal health and location. By utilizing sensors such as the pulse sensor, LM35 temperature sensor, DHT11 temperature and humidity sensor, and NEO-6M GPS module, the system accurately collects vital data. The NRF24L01 transceiver modules enable robust wireless communication, ensuring real-time data transmission. Processed data is stored in a MongoDB database via a RESTful API built with Node.js and Express, allowing efficient data management and retrieval. The Android application provides a user-friendly interface for real-time monitoring, displaying the animal’s location on a map and presenting detailed health metrics. The system demonstrates high accuracy and reliability, with practical applications in wildlife conservation, livestock management, and pet monitoring. Future enhancements, such as extended range communication, alert systems, advanced data analytics, and device miniaturization, could further improve its functionality. We can use different kinds of machine learning models along with the monitoring system which helps us analyze the data collected and give us feedback or suggestions as per requirement. We can track the location of the animals if they are in danger like if a fire breaks out in a house and we need some kind of assistance to help to track them [27]. Overall, the Animal Monitoring System represents a significant advancement in animal tracking and health monitoring, with the potential to make a substantial impact on animal conservation and management.
References
- B. Hofmann-Wellenhof, H. B. Hofmann-Wellenhof, H. Lichtenegger, and E. Wasle, "GNSS – Global Navigation Satellite Systems: GPS, GLONASS, Galileo, and more," Vienna: Springer-Verlag, 2008.
- E. D. Kaplan and C. J. Hegarty, "Understanding GPS: Principles and Applications," 3rd ed. Boston: Artech House, 2017.
- Kays, R.; Crofoot, M.C.; Jetz, W.; Wikelski, M. Terrestrial animal tracking as an eye on life and planet. Science 2015, 348, aaa2478. [Google Scholar] [CrossRef]
- Tomkiewicz, S.M.; Fuller, M.R.; Kie, J.G.; Bates, K.K. Global positioning system and associated technologies in animal behaviour and ecological research. Philos. Trans. R. Soc. B: Biol. Sci. 2010, 365, 2163–2176. [Google Scholar] [CrossRef]
- Prasad, K. Mamun, F. Islam, and H. Haqva, "Smart water quality monitoring system," in 2015 2nd Asia-Pacific World Congress on Computer Science and Engineering (APWC on CSE), 2015, pp. 1-6.
- D. Patel and M. Patel, "Arduino Based Smart Home Automation System," International Journal of Scientific Research in Computer Science, Engineering and Information Technology, vol. 3, no. 2, pp. 73-78, 2018.
- M. Wikelski and R. Kays, "Movebank: archive, analysis and sharing of animal movement data," World Wide Web electronic publication, 2020. [Online]. Available: https://www.movebank.org.
- Bradshaw, C.J.A.; Sims, D.W.; Hays, G.C. "Measurement Error Causes Scale-Dependent Threshold Erosion of Biological Signals in Animal Movement Data," Ecological Applications, vol. 17, no. 2, pp. 628-638, 2007. [CrossRef]
- B. Hofmann-Wellenhof, H. B. Hofmann-Wellenhof, H. Lichtenegger, and E. Wasle, "GNSS – Global Navigation Satellite Systems: GPS, GLONASS, Galileo, and more," Vienna: Springer-Verlag, 2008.
- Cagnacci, F.; Boitani, L.; Powell, R.A.; Boyce, M.S. Animal ecology meets GPS-based radiotelemetry: a perfect storm of opportunities and challenges. Philos. Trans. R. Soc. B: Biol. Sci. 2010, 365, 2157–2162. [Google Scholar] [CrossRef] [PubMed]
- Kays, R.; Tilak, S.; Crofoot, M.; Fountain, T.; Obando, D.; Ortega, A.; Kuemmeth, F.; Mandel, J.; Swenson, G.; Lambert, T.; et al. Tracking Animal Location and Activity with an Automated Radio Telemetry System in a Tropical Rainforest. Comput. J. 2011, 54, 1931–1948. [Google Scholar] [CrossRef]
- Wall, J.; Wittemyer, G.; Klinkenberg, B.; Douglas-Hamilton, I. Novel opportunities for wildlife conservation and research with real-time monitoring. Ecol. Appl. 2014, 24, 593–601. [Google Scholar] [CrossRef]
- IUCN. The International Union for Conservation of Nature’s Red List of Threatened Species (IUCN) Red List of Threatened Species, version 2022. https://www.iucnredlist.org/. (accessed on 6 November 2022).
- P. J. Crutzen and E. F. Stoermer, "The ’Anthropocene’," Global Change Newsletter, vol. 41, pp. 17-18, 2000.
- Kays, R.; Crofoot, M.C.; Jetz, W.; Wikelski, M. Terrestrial animal tracking as an eye on life and planet. Science 2015, 348, aaa2478. [Google Scholar] [CrossRef] [PubMed]
- Cagnacci, F.; Boitani, L.; Powell, R.A.; Boyce, M.S. Animal ecology meets GPS-based radiotelemetry: a perfect storm of opportunities and challenges. Philos. Trans. R. Soc. B: Biol. Sci. 2010, 365, 2157–2162. [Google Scholar] [CrossRef] [PubMed]
- J. J. Audubon, "Ornithological Biography, or an Account of the Habits of the Birds of the United States of America," Edinburgh: Adam Black, 1831-1839.
- C. H. Blanchard and E. M. Finster, "A Method of Marking Living Snakes for Future Recognition, with a Discussion of Some Problems and Results," Ecology, vol. 14, no. 4, pp. 334-347, 1933.
- Gauthreaux, S.A.; Belser, C.G. "Radar ornithology and biological conservation," The Auk, vol. 120, no. 2, pp. 266-277, 2003. [CrossRef]
- D. W. Eiler, "Underwater Acoustic Telemetry for Behavioral Research on Fish," Transactions of the American Fisheries Society, vol. 124, no. 5, pp. 711-720, 1995.
- R. P. Wilson, J. J. R. P. Wilson, J. J. Ducamp, W. G. Rees, B. M. Culik, and K. Niekamp, "Estimation of location: global coverage using light intensity," in Wildlife Telemetry: Remote Monitoring and Tracking of Animals, I. G. Priede and S. M. Swift, Eds. New York: Ellis Horwood, 1992, pp. 131-134.
- Jouventin, P.; Weimerskirch, H. Satellite tracking of Wandering albatrosses. Nature 1990, 343, 746–748. [Google Scholar] [CrossRef]
- Block, B.A.; Dewar, H.; Blackwell, S.B.; Williams, T.D.; Prince, E.D.; Farwell, C.J.; Boustany, A.; Teo, S.L.H.; Seitz, A.; Walli, A.; et al. Migratory Movements, Depth Preferences, and Thermal Biology of Atlantic Bluefin Tuna. Science 2001, 293, 1310–1314. [Google Scholar] [CrossRef]
- Lohmann, K.J.; Putman, N.F.; Lohmann, C.M.F. Geomagnetic imprinting: A unifying hypothesis of long-distance natal homing in salmon and sea turtles. Proc. Natl. Acad. Sci. 2008, 105, 19096–19101. [Google Scholar] [CrossRef]
- D. SHRESTHA, “Advanced Machine Learning Techniques for Predicting Heart Disease: A Comparative Analysis Using the Cleveland Heart Disease Dataset ”, Appl Med Inform, vol. 46, no. 3, Sep. 2024.
- Shrestha D, Nepal P, Gautam P, Oli P. Human pose estimation for yoga using VGG-19 and COCO dataset: Development and implementation of a mobile application. International Research Journal of Engineering and Technology 2024;11(8):355-62.
- Shrestha, D.; Valles, D. Evolving Autonomous Navigation: A NEAT Approach for Firefighting Rover Operations in Dynamic Environments. 2024 IEEE International Conference on Electro Information Technology (eIT). Eau Claire, WI, USA, 2024, pp. 247- 255. [CrossRef]
Disclaimer/Publisher’s Note: The statements, opinions and data contained in all publications are solely those of the individual author(s) and contributor(s) and not of MDPI and/or the editor(s). MDPI and/or the editor(s) disclaim responsibility for any injury to people or property resulting from any ideas, methods, instructions or products referred to in the content. |
© 2024 by the authors. Licensee MDPI, Basel, Switzerland. This article is an open access article distributed under the terms and conditions of the Creative Commons Attribution (CC BY) license (https://creativecommons.org/licenses/by/4.0/).
Copyright: This open access article is published under a Creative Commons CC BY 4.0 license, which permit the free download, distribution, and reuse, provided that the author and preprint are cited in any reuse.


