
Submitted:
04 December 2024
Posted:
05 December 2024
You are already at the latest version
Abstract
Patient-level grouped data is prevalent in public health and medical fields, and Multiple Instance Learning (MIL) offers a framework to address the challenges associated with this type of data structure. This study compares four data aggregation methods designed to tackle the grouped structure in classification tasks: post-mean, post-max, post-min, and pre-mean aggregation. We developed a customized AI pipeline that incorporates twelve machine learning algorithms along with the four aggregation methods to detect Parkinson's Disease (PD) using multiple voice recordings from individuals available in the UCI Machine Learning Repository, which includes 756 voice recordings from 188 PD patients and 64 healthy individuals.
Seven performance metrics—Accuracy, Precision, Sensitivity, Specificity, F1 score, AUC, and MCC—were utilized for model evaluation. Various techniques, such as Bag Over-sampling (BOS), Cross-validation, and Grid Search, were implemented to enhance classification performance. Among the four aggregation methods, post-mean aggregation combined with XGBoost achieved the highest accuracy (0.921), F1 score (0.949), and MCC (0.783). Furthermore, we identified potential trends in selecting aggregation methods that are suitable for imbalanced data, particularly based on their differences in sensitivity and specificity. These findings provide meaningful implications for further exploration of grouped imbalanced data.
Keywords:
Parkinson’s Disease (PD)
; Machine Learning (ML)
; Artificial Intelligence (AI)
; Multiple Instance Learning (MIL)
; data aggregation
; classification
; supervised learning
; comparative study
1. Introduction
In the dynamic field of machine learning and artificial intelligence, comprehensive research and accumulated expertise have consistently demonstrated a fundamental principle: there is no universal, one-size-fits-all approach that can optimally solve every computational challenge or problem across diverse scenarios[1,2,3]. When dealing with diverse structures of data, it is essential to customize methodologies based on the data’s intrinsic characteristics to provide reliable outcomes. This work concentrates on a particular form of imbalanced grouped data, where each group encompasses multiple individual samples. This data structure is common in fields such as public health and medicine, where individual patients would have multiple records and diagnoses need to be made based on these records. In these fields, imbalanced data is also common and must be addressed in analyses[4].
Multiple Instance Learning (MIL) is a specialized approach designed to handle grouped data structures. This method is particularly useful when dealing with data organized into “bags,” where each bag contains multiple instances. A practical example of this is in medical research: when studying a specific disease, individual patients can be considered as bags, with their various medical readings or tests serving as instances within those bags. The distinguishing feature of MIL is its ability to work with partially labeled data. In these scenarios, labels are assigned to the bags (e.g., patient diagnoses), but the individual instances within each bag (e.g., specific test results) often lack their own labels. This characteristic makes traditional supervised learning algorithms unsuitable for direct application. The primary goal of MIL is to bridge this gap by developing techniques to transform these collections of unlabeled instances within labeled bags into single, labeled instances. This transformation allows for more effective analysis and prediction in scenarios where instance-level labels are unavailable or impractical to obtain[5,6]. In addressing multiple instance learning challenges, researchers typically employ two main strategies: the bag-based approach and the instance-based approach. The bag-based method focuses on consolidating data at the bag level. This approach involves representing each bag (a collection of instances) as a single vector. By doing so, it becomes possible to apply conventional supervised learning models to these bag-level representations. One effective technique within this approach is the use of neural network embedding to extract features for each bag. This consolidation allows for a more streamlined analysis, as it transforms the complex, multi-instance structure into a format that’s compatible with standard machine learning algorithms. Essentially, it simplifies the problem by treating each bag as a single, cohesive unit rather than a collection of separate instances. The bag-based approach offers a practical solution to the challenges posed by multiple instance learning, enabling the application of well-established supervised learning techniques to datasets that would otherwise be difficult to analyze using traditional methods[7,8,9,10].While the bag-based approach offers simplicity and ease of implementation, it comes with a significant drawback: the potential loss of valuable information from individual instances within each bag. This limitation is particularly concerning in medical research and practice. In healthcare contexts, the detailed data from each instance (such as individual test results or specific symptoms) often represents what is known as intraindividual variability. This term refers to the variations observed within a single individual over time or across different measurements. Medical professionals and researchers widely recognize the critical importance of intraindividual variability. This granular level of detail can provide crucial insights into a patient’s condition, treatment response, or disease progression that might be obscured when data is aggregated at the bag level. Therefore, while the bag-based approach simplifies analysis, it risks overlooking subtle but potentially vital patterns or indicators that exist at the instance level, which could be essential for accurate diagnosis, personalized treatment, or in-depth medical research[11].
The instance-based approach offers an alternative strategy to handle multiple instance learning challenges. This method focuses on labeling individual instances within each bag, allowing for the application of supervised learning models at the instance level. Once these models predict labels for each instance, the collective results are used to determine the overall label for the bag. One innovative technique within this approach involves clustering instances into several groups, effectively creating distinct classes. This clustering strategy provides a systematic way to assign labels to all instances, enabling a more granular analysis of the data. By preserving the detailed information of each instance, this approach can potentially capture nuanced patterns that might be lost in bag-level aggregation, though it may also introduce additional complexity in terms of computation and result interpretation[12]. The instance-based approach preserves the unique details of each instance but labelling instances requires careful design to capture the nature of instances[5]. Nevertheless, both approaches have distinct advantages and disadvantages, and the selection primarily depends on the characteristics of the data and the specific objectives of the project.
To evaluate the effectiveness of bag-based and instance-based approaches in handling multiple instances, we developed two distinct data aggregation strategies tailored to a specific dataset. Our comprehensive AI-driven analysis employs a custom-designed pipeline optimized for supervised learning, with a focus on classification tasks. This sophisticated workflow comprises three core components: data preprocessing, model fitting, and evaluation, with each component adaptable to either data aggregation strategy. We rigorously tested twelve AI algorithms, assessing their performance across seven diverse evaluation metrics. To ensure the robustness and reliability of our findings, we incorporated several advanced techniques, including data augmentation to expand our dataset, cross-validation for thorough model testing, and grid search for optimal hyperparameter tuning. This methodical approach allows for a thorough comparison of the two strategies, providing valuable insights into their relative strengths and weaknesses in multiple instance learning scenarios.
2. Parkinson Disease and Dataset Description
Parkinson’s disease (PD) is a chronic, progressive neurological disorder that primarily affects motor function[13]. It is marked by the progressive deterioration of dopamine-producing neurons in the substantia nigra, a region near the brain’s base. The loss of neurons hinders the brain’s capacity to regulate bodily movements, leading to a trifecta of hallmark motor symptoms: tremors, muscle rigidity, and bradykinesia[14,15,16,17,18]. In addition to movement abnormalities, PD frequently entails cognitive deterioration and several non-motor symptoms, including depression, sleep disturbances, and anosmia. The disorder profoundly affects patients’ quality of life and presents an escalating global health concern, with an estimated 500,000 to 1 million individuals impacted in the United States alone and a consistently increasing global occurrence[19,20,21,22,23,24,25]. Numerous research studies have consistently linked the persistent accumulation of cytotoxic intracellular and extracellular protein aggregates to various neurodegenerative disorders (NDs), including PD[26,27,28,29]. This established connection has catalyzed extensive exploration into potential pharmacological interventions, with a significant focus on developing and identifying novel non-steroidal anti-inflammatory drugs (NSAIDs) that show promise in inhibiting protein aggregation associated with NDs. These innovative compounds include Aspirin, various quinoline analogs, TDZD analogs such as PNR886 and PNR962, combretastatin-A4 analog PNR502, among others [26,27,28,29]. These compounds are being designed to target not only PD, but also a broader spectrum of NDs. The pursuit of such multi-faceted therapeutic approaches reflects the growing understanding of shared pathological mechanisms across different NDs and the potential for more comprehensive treatment strategies that could address multiple aspects of these complex disorders simultaneously. However, despite these advancements, no intervention has been able to cure PD to date, reinforcing the critical need for continued research in this field. Timely diagnosis and comprehensive care are vital for preserving patients’ independence and quality of life as the PD advances[30,31,32,33,34,35,36].
The dataset used in this research was obtained from the UCI Machine Learning Repository, specifically the Parkinson’s Disease Classification dataset (https://archive.ics.uci.edu/dataset/470/parkinson+s+disease+classification)[37]. The objective of this study is to develop AI models capable of predicting Parkinson’s disease (PD) using voice recordings as input. We utilized a comprehensive dataset consisting of 756 voice samples collected from 252 individuals, encompassing 188 PD patients (107 males and 81 females, aged 33-87) and 64 healthy controls (23 males and 41 females, aged 41-82). Each participant provided three sustained phonations of the vowel /a/, recorded at a sampling rate of 44.1 kHz. A unique identifier was assigned to link samples from the same individual. The dataset includes binary labels (1 for PD, 0 for healthy) and an extensive set of 754 features for each voice recording. These features, derived from advanced speech signal processing algorithms, comprise Time Frequency Features, Mel Frequency Cepstral Coefficients (MFCCs), Wavelet Transform based Features, Vocal Fold Features, and TWQT (Tunable Q-factor Wavelet Transform) features. This rich array of acoustic characteristics provides a robust foundation for analyzing vocal patterns associated with PD, enabling the development of sophisticated AI models for disease prediction[37]. Extensive research has revealed that vocal biomarkers, derived from patients’ speech patterns and acoustic characteristics, offer a promising avenue for the identification and diagnosis of Parkinson’s disease (PD). This method stands out for its reliability and non-invasive nature. Even in the early stages of the disease, when speech abnormalities are often subtle, advanced vocal analysis techniques can detect these changes. This capability not only suggests a powerful tool for early detection but also presents an opportunity for ongoing monitoring of disease progression. By leveraging sophisticated analysis of speech, healthcare professionals may be able to identify PD earlier and track its development more effectively, potentially leading to improved patient outcomes through timely intervention and personalized treatment strategies[38,39].
PD frequently manifests in speech abnormalities, including reduced volume (hypophonia), slowed speech rate, imprecise articulation, and voice tremor [40,41,42]. These vocal changes stem from the progressive degeneration of neural pathways governing motor control in the brain. Leveraging advanced artificial intelligence algorithms and speech processing technologies to analyze these vocal biomarkers offers a promising avenue for early PD detection and diagnosis [43]. This non-invasive method may facilitate earlier diagnosis and intervention strategies, thereby enabling more timely and targeted treatment with the potential to halt the progression of Parkinson’s disease and enhance the quality of life for individuals with the condition[44]. The application of AI in vocal analysis has shown remarkable potential, with some studies demonstrating the ability of artificial neural networks (ANNs) to detect PD based on voice samples of vowels, with test accuracy rates as high as 86.47%[45].By utilizing these technologies, clinicians could potentially intervene at the pre-clinical stage of PD, a critical period when neuroprotective therapies might be most effective in preserving neurological function.
In this research, we leveraged the meticulously pre-processed features from the original dataset to construct a bespoke multi-algorithm AI pipeline specifically designed for PD classification. Our approach builds upon this solid foundation, emphasizing the implementation and refinement of various AI algorithms. The primary objective of our study is to enhance the accuracy of PD detection while eliminating the need for additional signal processing steps. By focusing on algorithm application and optimization within our custom pipeline, we aim to streamline the classification process and potentially improve its effectiveness, contributing to the advancement of non-invasive diagnostic tools for PD.
3. Methods (Workflow Description)
This study was implemented using Python, with the scikit-learn package[46] serving as the primary tool for data preprocessing and AI tasks.
3.1. Data Preprocessing
The data preprocessing stage involved two key steps: first, splitting the data into training and test sets, and second, conducting data augmentation to address issue of class imbalance.
3.1.1. Train-Test Split
To assess the generalizability of our AI pipeline, we implemented a strategic 70:30 split of the dataset into training and test sets [47]. This division resulted in a training set of 528 voice recordings from 176 subjects and a test set of 228 recordings from 76 subjects. Crucially, we employed stratified sampling based on the diagnosis status to maintain a consistent distribution of PD cases (approximately 75%) and healthy controls across both sets. This stratification is essential for ensuring reliable performance evaluation, especially given the imbalanced nature of our dataset. By preventing overrepresentation of the majority class in either set, this approach enhances the robustness of our model assessment and helps guarantee that our AI pipeline’s performance is accurately evaluated across diverse data subsets[48].
3.1.2. Bag Over-sampling (BOS)
The dataset exhibits a mild class imbalance, with Parkinson’s disease (PD) cases outnumbering healthy controls in a ratio of approximately 3:1. Although this level of imbalance may not significantly impact the classification performance of our models, it remains an important consideration, particularly when contemplating real-world applications. For instance, in population-based screening scenarios, the class distribution is likely to be reversed, with healthy individuals substantially outnumbering those with PD. Addressing this imbalance is crucial for ensuring our models can generalize effectively to diverse real-world situations, maintain fairness in predictions, and potentially optimize performance across various population distributions[49].
Data augmentation was implemented on the training set to enable the AI models to place more emphasis on the minority class during the training phase. Specifically, we use Bag Over-sampling (BOS) [50], which is a generalization of Synthetic Minority Oversampling Technique (SMOTE) [51] in MIL. Since this is an interpolation method in Euclidean space, all features of the voice recordings are first standardized to mitigate the influence of different feature scales.
In the BOS algorithm, a new bag is synthesized based on two existing bags. Since there is no information showing that the three recordings from each subject have any inherent order or weight, we assumed that the recordings are equivalent and should be treated with equal importance for each subject [37]. Considering two existing bags (i.e., subject) and , an instance (i.e., voice recording) is randomly sampled from each of them, say and . Then an instance in the new bag can be generated as:
where is a random number. This process assigns equal sampling probabilities to the three instances in a bag, ensuring equivalent treatment. This step is repeated three times and then a new bag containing three instances is synthesized.
To select two bags for synthesis, the -nearest neighbor method is used. For a randomly selected bag, the-nearest neighbors ( in our case) is identified, and new bags are then synthesized based on this bag and each of its neighbors respectively. Since this method requires the distance between bags, we defined it as the distance between their centroids, which are calculated as the mean vector of the three instances in a bag. The oversampling process is repeated for the minority class until the ratio of the two classes reaches 1:1, thereby completing the data augmentation process.
3.2. Handling Multiple Instances
In this PD dataset, each subject provided three voice recordings, resulting in multiple instances that need to be addressed through MIL[52]. Therefore, we designed two customized data aggregation strategies, one following the instance-based approach and another following the bag-based approach, to handle these multiple instances.
3.2.1. Post-aggregation strategy
Our exploratory data analysis (EDA) revealed a high degree of similarity among the three voice recordings from each subject. When clustered, these recordings typically grouped together, suggesting they would likely receive the same label. This observation led us to adopt a straightforward approach: assigning the subject’s overall label to all three of their voice recordings. This strategy eliminates the need for a separate clustering process and provides practical meaning to the labels. Consequently, we labeled all recordings from Parkinson’s disease (PD) patients as diseased (1) and those from healthy individuals as non-diseased (0). This approach allows AI algorithms to directly predict whether a voice recording indicates the presence of disease, simplifying the classification task while maintaining clinical relevance.
Once predictions for the voice recordings are generated, they must be aggregated to produce the final predictions for each subject, a process known as post-aggregation. We proposed three aggregation methods: mean, min, and max. These methods calculate the mean, minimum, and maximum of the predicted probabilities of being diseased from the three voice recordings to represent the overall likelihood of each subject having Parkinson’s disease (PD). This aggregation process ensures that we capture a comprehensive assessment of the subject’s condition based on their voice recordings. These methods can be represented as follows:
where is the predicted probability of being diseased for the th voice recording of the th subject, and , , are the three kinds of overall probabilities of having PD for the th subject derived from the three post-aggregation methods. During this process, we avoid assigning any different weights to the three voice recordings from each subject to ensure the equivalent treatments. The overall probability is then compared to a threshold of 0.5 to determine whether the subject is classified as having PD or not.
The selection of specific aggregation methods—mean, min, and max—was based on varying priorities. The post-min aggregation method requires all three voice recordings to be classified as diseased in order to predict that the subject has Parkinson’s disease (PD). This approach is ideal for situations where it is crucial to avoid misdiagnosing healthy individuals as diseased. Conversely, the post-max aggregation method predicts a subject as having PD if any one of their three voice recordings is classified as diseased, making it suitable for scenarios where it is vital not to overlook individuals with the disease. The post-mean aggregation method, on the other hand, does not favor either class and operates similarly to a voting system, providing a balanced assessment. This strategy allows us to leverage all available data points, enabling the model to learn from the nuances of each recording. However, it is important to note that assuming each voice recording has a definitive label indicating whether it is diseased may not be entirely accurate, which could limit the model’s effectiveness and necessitates validation in practical applications.
3.2.2. Pre-aggregation strategy
In the pre-aggregation strategy, we employed the bag-based idea by aggregating the features of the three voice recordings from each subject into a single vector to represent the subject. Since the recordings are assumed equally important, we simply aggregate the features of the three voice recordings by taking their mean value. In other words, the centroid of the three instances is used to represent the entire bag. This produces a composite feature vector for each patient, subsequently utilized to train AI models on subject level. This strategy facilitates direct modeling of the subjects, but at the cost of omitting certain details from the individual recordings. By simply mean-aggregating the three recordings into one, we may lose some information of variations across recordings that could be useful for diagnosis.
3.3. Artificial Intelligence (AI) Algorithms
In the modeling stage, we applied a range of AI classification algorithms to predict Parkinson’s disease (PD). The inclusion of multiple machine learning algorithms in the pipeline serves to assess whether the aggregation methods yield consistent results across different algorithms, thereby evaluating their generalizability. This approach allows us to determine the robustness of our findings and ensures that the predictive performance is not overly dependent on a single algorithm. The algorithms employed include Logistic Regression[53], Decision Tree [54], Random Forest [55], Gradient Boosting [56], XGBoost [57], LightGBM [58], K-Nearest Neighbors (KNN)[59], Support Vector Machine (SVM) [60], Naive Bayes [61], AdaBoost[62] , and Multi-layer Perceptron (MLP)[63].
In addition, we included a stacking classifier, which consists of two base estimators (KNN and SVM) and a final estimator (Logistic Regression). The stacking model leverages the predictive power of base models, with the final model learning to optimally combine the predictions of these base estimators [64,65].
3.3.1. Hyperparameter Tuning
We employed cross-validation and grid search for hyperparameter tuning to minimize the risk of overfitting while enhancing the generalizability and stability of our AI models[66,67]. For each AI algorithm, we delineate a spectrum of hyperparameter values and use 5-fold cross-validation to identify the best hyperparameter combinations, where models are evaluated based on accuracy.
In particular, we implemented group 5-fold cross-validation when applying the post-aggregation strategy, ensuring that all voice recordings from the same subject are kept within the same fold to prevent data leakage[68]. The final model is then trained on the entire training set using the optimal hyperparameters identified in this process.
3.3.2. Model Evaluation
Once the final models have been developed through hyperparameter tuning, we evaluate the performance of each AI model using a range of evaluation metrics. This comprehensive assessment is designed to capture various aspects of classification performance, providing a well-rounded understanding of how effectively each model predicts outcomes. These metrics include Accuracy, Precision, Sensitivity, F1 Score, Area Under the Receiver Operating Characteristic Curve (AUC), and Matthews Correlation Coefficient (MCC) [69,70].By standard conventions:
Accuracy measures the overall correctness of the model. Mathematically,
where TP refers to True Positives, TN denotes True Negatives, FP represents False Positives, and FN refers to False Negatives.
Precision measures the proportion of positive identifications that are accurate:
asure the proportions of actual positives and negatives that are accurately identified, respectively:
The F1 Score is the harmonic mean of Precision and Sensitivity, providing a balance between the two metrics:
The Area Under the Receiver Operating Characteristic Curve (AUC) quantifies a model’s capacity to differentiate between classes, with a higher AUC reflecting superior performance. Finally, the Matthews Correlation Coefficient (MCC) provides a balanced measure even in the presence of class imbalance:
Each AI model was trained on the training set and evaluated on the test set by these performance metrics. Subsequently, comparisons between models were made to identify the best-performing AI model for PD classification.
3.4. Workflow
To clearly illustrate our customized multi-algorithm AI pipeline for predictive modeling, we have included a detailed flowchart that outlines the methods employed in this study. The entire process is summarized in Figure 1.
4. Results
We present the evaluation results of the models trained using the four aggregation methods—post-aggregation (mean/min/max) and pre aggregation via our customized multi-algorithm AI pipeline. The models were evaluated on the test set using the seven-performance metrics: Accuracy, Precision, Sensitivity, Specificity, F1 Score, AUC, and MCC. The results for each aggregation method are summarized in Table 1, Table 2, Table 3 and Table 4.
Figure 2 presents a visual comparison of the seven metrics for the best-performing models—those with the highest accuracy—across the four aggregation methods.
Figure 3 offers a visual comparison of the averages of seven metrics for the twelve machine learning algorithms across the four aggregation methods.
To further investigate the effect of aggregation methods on classification performance, we performed a comprehensive comparison of each AI algorithm across the four aggregation methods within our customized multi-algorithm AI pipeline. Figure 4 displays the performance metrics for each algorithm across these four aggregation strategies.
5. Discussion
5.1. Findings
Previous research that employed same dataset and similar AI algorithms have reported accuracies between 0.66 and 0.90[4,71,72,73,74,75,76,77,78,79,80,81,82,83]. Notably, in the post-mean aggregation method, the XGBoost algorithm achieved peak performance with an accuracy of 0.921, precision of 0.918, sensitivity of 0.982, specificity of 0.737, F1 score of 0.949, AUC of 0.896, and MCC of 0.783.
Our results demonstrate that the post-mean aggregation method is the overall best aggregation approach, as evidenced by the mean accuracy, F1 score, AUC, and MCC presented in Figure 3. The other three methods display varying performance across these metrics without demonstrating significant superiority. Figure 2 provides an additional comparison of the top-performing machine learning algorithms across different aggregation methods.
Figure 4 ranks the machine learning models based on their mean accuracy across the four aggregation methods, revealing that higher-performing models tend to be more complex, such as MLP and boosting algorithms, with post-mean aggregation achieving the best results. Conversely, for the lower-performing models, post-max aggregation demonstrates superior performance.
The metrics indicate that post-min aggregation generally results in higher specificity, but lower sensitivity compared to post-mean aggregation. For instance, the top-performing LightGBM algorithm achieved an accuracy of 0.908, with a sensitivity of 0.947 and a specificity of 0.789. This distinction is evident when the metrics are analyzed in detail. To explain this phenomenon, it is important to examine how the aggregation method affects the balance between true positives (TP), true negatives (TN), false negatives (FN), and false positives (FP). The post-min aggregation method employs a conservative threshold by focusing on the lowest prediction scores. This approach emphasizes the accurate classification of negative samples (i.e., TN) while minimizing false positives (FP), resulting in higher specificity. However, this method also has the drawback of increasing false negatives (FN) and decreasing true positives (TP), which ultimately leads to reduced sensitivity.
In contrast, post-max aggregation prioritizes the maximum prediction scores, leading to the opposite effect: it emphasizes the identification of positive cases, thereby enhancing sensitivity (1.0 for XGBoost). However, this approach also decreases specificity (0.526 for XGBoost) because it is more prone to misclassifying negative samples as positives, resulting in an increase in false positives (FP). This may explain why post-max aggregation is more effective for lower-performing models. By applying straightforward formula-based reasoning, we can infer that in an imbalanced dataset with more positive cases than negative ones, sensitivity has a greater influence on accuracy than specificity. For models like MLP or boosting algorithms, the sensitivity achieved through post-mean aggregation is already close to 1, and post-max aggregation does not result in a significant increase in sensitivity. However, for models that underperformed, the enhancement in sensitivity provided by post-max aggregation becomes crucial for improving overall accuracy.
These differences underscore the importance of selecting between post-min and post-max aggregation based on specific requirements. In applications where it is essential to prevent misclassifying negatives as positives—such as situations where false positives could lead to serious consequences (e.g., unnecessary medical interventions) —post-min aggregation would be the preferable choice. Conversely, when the goal is to maximize the identification of positive cases, such as in screening for rare but critical conditions, post-max aggregation may be the more suitable option[84,85].
Another important consideration is the inherent class imbalance in the dataset, with positive samples outnumbering negative ones by a ratio of 3:1. This type of imbalance leads machine learning models to prioritize positive samples, resulting in higher sensitivity but lower specificity[84]. Although the data augmentation performed by BOS mitigates the imbalance to some extent, this trend persists. In this context, even post-min aggregation shows high sensitivity and low specificity, though it maintains the highest specificity among the four aggregation methods. Post-max aggregation exacerbates this trend, increasing mean sensitivity by only 0.164 while decreasing mean specificity by 0.355 compared to post-min aggregation. This illustrates the potential limitations of post-max aggregation, particularly in scenarios where specificity is critical[86]. This is noteworthy given that our study utilized a relatively large dataset for PD voice analysis[87,88,89].
Although many studies utilizing the same dataset and comparable AI algorithms have reported accuracies ranging from 0.66 to 0.90, [4,71,72,73,74,75,76,77,78,79,80,81,82,83], our pipeline demonstrated far promising performance, achieving a maximum accuracy of 92.1%. This achievement is particularly significant considering the simplicity and ease of implementation of our pipeline.
5.2. Future Directions
The current design of the pre-aggregation method in our research can be improved, necessitating further exploration. To preserve intraindividual variability, more advanced techniques are required to extract maximum information from each voice recording during the pre-aggregation phase. One potential strategy is to concatenate various descriptive statistics, such as mean and variance, from the features of multiple voice recordings to create subject-level features. This approach captures more information beyond the mean and has the potential to enhance classification performance. Additionally, neural networks could be effective if a specialized encoder is developed to extract features from multiple voice recordings [90,91,92,93,94,95,96].
While our pipeline shows promising results, certain limitations might be addressed in future studies to enhance its generalizability. The data imbalance identified in this study stems from the case-control design, which maintains a 3:1 ratio of cases to controls. However, in practical applications, such class imbalances may not always be present. For instance, in population-based research, the number of individuals with a disease can be significantly lower than that of healthy individuals. This potential reversal in class distribution requires modifications to the pipeline for effective adaptation. Possible adjustments include implementing additional resampling techniques or recalibrating classification thresholds to strike a balance between sensitivity and specificity. Furthermore, developing aggregation strategies that maintain robustness across varying class distributions by automatically adjusting for class imbalance could improve the pipeline’s applicability in real-world scenarios.
6. Conclusion
This study highlights the critical importance of appropriate data aggregation strategies and methods in multiple instance learning, particularly in the context of class imbalance. We developed a customized multi-algorithm AI pipeline for non-invasive Parkinson’s disease screening using voice recordings. The results revealed that the post-mean aggregation method achieved the best overall performance, with an accuracy of up to 0.921 and an MCC of up to 0.783, underscoring the effectiveness of our AI pipeline. The observed variations in performance metrics among the different aggregation methods, particularly in sensitivity and specificity, may provide valuable insights for selecting aggregation methods in imbalanced grouped data. These findings have significant practical implications for the application of various aggregation methods in broader medical diagnostic tasks.
Supplementary Materials
A fully reproducible workflow using the provided Python scripts, including all necessary packages and code snippets, is available in our GitHub repository: https://github.com/Durixas/Parkinson-s-Disease-Prediction-Code-and-Data-Repository. These scripts are designed to facilitate reproducibility and allow users to replicate the machine learning classification tasks outlined in our study.
Author Contributions
SK developed the conceptual framework for this study. Under SK’s direct supervision and with contributions from SS and JS, ZY and HZ designed and implemented the artificial intelligence pipeline for predictive modeling used in this study. The manuscript was written by ZY, HZ, SS, JS, SMN, KEA, and SK.
Funding
This work was supported by start-up funds provided to SK by Celia Scott Weatherhead School of Public Health and Tropical Medicine, Tulane University.
Data Availability Statement
The Parkinson’s Disease classification dataset used in this study is accessible from the UCI Machine Learning Repository (https://archive.ics.uci.edu/dataset/470/parkinson+s+disease+classification) [37]. All data have been anonymized to protect privacy. For additional assistance in reproducing results or customizing analysis workflows, users are encouraged to contact the corresponding author at the provided email address.
Acknowledgments
The authors are thankful to the office of the president, provost and the Dean of Celia Scott Weatherhead School of Public Health and Tropical Medicine for the wonderful support.
References
- Sterkenburg, T.F. and P.D. Grünwald, The no-free-lunch theorems of supervised learning. Synthese, 2021. 199(3): p. 9979-10015.
- Xu, Y. , et al., Artificial intelligence: A powerful paradigm for scientific research. The Innovation, 2021. 2(4): p. 100179.
- Datta, S.D. , et al., Artificial intelligence and machine learning applications in the project lifecycle of the construction industry: A comprehensive review. Heliyon, 2024. 10(5): p. e26888.
- Salmi, M. , et al., Handling imbalanced medical datasets: review of a decade of research. Artificial Intelligence Review, 2024. 57(10): p. 273.
- Carbonneau, M.-A. , et al., Multiple instance learning: A survey of problem characteristics and applications. Pattern Recognition, 2018. 77: p. 329-353.
- Foulds, J. and E. Frank, A review of multi-instance learning assumptions. The Knowledge Engineering Review, 2010. 25(1): p. 1-25.
- Ilse, M., J. M. Tomczak, and M. Welling, Chapter 22 - Deep multiple instance learning for digital histopathology, in Handbook of Medical Image Computing and Computer Assisted Intervention, S.K. Zhou, D. Rueckert, and G. Fichtinger, Editors. 2020, Academic Press. p. 521-546.
- Asif, A. and F.u.A.A. Minhas, An embarrassingly simple approach to neural multiple instance classification. Pattern Recognition Letters, 2019. 128: p. 474-479.
- Luan, T. , et al., Multi-Instance Learning with One Side Label Noise. ACM Trans. Knowl. Discov. Data, 2024. 18(5): p. Article 122.
- Møllersen, K., J. Y. Hardeberg, and F. Godtliebsen A Probabilistic Bag-to-Class Approach to Multiple-Instance Learning. Data, 2020. 5. [CrossRef]
- Herold, F. , et al., Causes and Consequences of Interindividual Response Variability: A Call to Apply a More Rigorous Research Design in Acute Exercise-Cognition Studies. Front Physiol, 2021. 12: p. 682891.
- Zhou, Z.-H. and M.-L. Zhang, Solving multi-instance problems with classifier ensemble based on constructive clustering. Knowledge and Information Systems, 2007. 11(2): p. 155-170.
- Aarsland, D. , et al., Parkinson disease-associated cognitive impairment. Nature Reviews Disease Primers, 2021. 7(1): p. 47.
- Ramesh, S. and A. Arachchige, Depletion of dopamine in Parkinson’s disease and relevant therapeutic options: A review of the literature. AIMS Neurosci, 2023. 10(3): p. 200-231.
- Radad, K. , et al., Pathophysiology of non-motor signs in Parkinson’s disease: some recent updating with brief presentation. Exploration of Neuroprotective Therapy, 2023. 3(1): p. 24-46.
- Chaudhuri, K.R. and A.H.V. Schapira, Non-motor symptoms of Parkinson’s disease: dopaminergic pathophysiology and treatment. The Lancet Neurology, 2009. 8(5): p. 464-474.
- Rana, A.Q. , et al., Parkinson’s disease: a review of non-motor symptoms. Expert Review of Neurotherapeutics, 2015. 15(5): p. 549-562.
- Park, A. and M. Stacy, Non-motor symptoms in Parkinson’s disease. Journal of Neurology, 2009. 256(3): p. 293-298.
- Thach, A. , et al., Real-world assessment of the impact of “OFF” episodes on health-related quality of life among patients with Parkinson’s disease in the United States. BMC Neurology, 2021. 21(1): p. 46.
- Zhu, J. , et al., Temporal trends in the prevalence of Parkinson’s disease from 1980 to 2023: a systematic review and meta-analysis. The Lancet Healthy Longevity, 2024. 5(7): p. e464-e479.
- Dorsey, E.R. and B.R. Bloem, The Parkinson Pandemic—A Call to Action. JAMA Neurology, 2018. 75(1): p. 9-10.
- Schiess, N. , et al., Six Action Steps to Address Global Disparities in Parkinson Disease: A World Health Organization Priority. JAMA Neurology, 2022. 79(9): p. 929-936.
- Savica, R. , et al., Time Trends in the Incidence of Parkinson Disease. JAMA Neurology, 2016. 73(8): p. 981-989.
- Kowal, S.L. , et al., The current and projected economic burden of Parkinson’s disease in the United States. Mov Disord, 2013. 28(3): p. 311-8.
- Rong, S. , et al., Trends in Mortality From Parkinson Disease in the United States, 1999–2019. Neurology, 2021. 97(20): p. e1986-e1993.
- Ayyadevara, S. , et al., Aspirin-Mediated Acetylation Protects Against Multiple Neurodegenerative Pathologies by Impeding Protein Aggregation. Antioxid Redox Signal, 2017. 27(17): p. 1383-1396.
- Bowroju, S.K. , et al., Design and Synthesis of Novel Hybrid 8-Hydroxy Quinoline-Indole Derivatives as Inhibitors of Aβ Self-Aggregation and Metal Chelation-Induced Aβ Aggregation. Molecules, 2020. 25(16).
- Kakraba, S. , et al., Thiadiazolidinone (TDZD) Analogs Inhibit Aggregation-Mediated Pathology in Diverse Neurodegeneration Models, and Extend Life- and Healthspan. Pharmaceuticals, 2023. 16(10).
- Kakraba, S. , et al., A Novel Microtubule-Binding Drug Attenuates and Reverses Protein Aggregation in Animal Models of Alzheimer’s Disease. Front Mol Neurosci, 2019. 12: p. 310.
- Tod, A.M. , et al., Good-quality social care for people with Parkinson’s disease: a qualitative study. BMJ Open, 2016. 6(2): p. e006813.
- Paulsen, J.S. , et al., A review of quality of life after predictive testing for and earlier identification of neurodegenerative diseases. Progress in Neurobiology, 2013. 110: p. 2-28.
- Alanazi, M.D.S. , et al., Parkinson’s Disease: Neurotransmitter Imbalance, Motor Dysfunction, and Nursing Interventions for Quality of Life. Journal of International Crisis and Risk Communication Research, 2024: p. 269-282.
- Bužgová, R., R. Kozáková, and M. Bar, The effect of neuropalliative care on quality of life and satisfaction with quality of care in patients with progressive neurological disease and their family caregivers: an interventional control study. BMC Palliative Care, 2020. 19(1): p. 143.
- Rees, R.N. , et al., An early diagnosis is not the same as a timely diagnosis of Parkinson’s disease. F1000Res, 2018. 7.
- Dodel, R.C., K. Berger, and W.H. Oertel, Health-Related Quality of Life and Healthcare Utilisation in Patients with Parkinson’s Disease. PharmacoEconomics, 2001. 19(10): p. 1013-1038.
- Goldman, J.G. , et al., Delivering Multidisciplinary Rehabilitation Care in Parkinson’s Disease: An International Consensus Statement. J Parkinsons Dis, 2024. 14(1): p. 135-166.
- Sakar, C. , Serbes, G., Gunduz, A., Nizam, H., & Sakar, B. Parkinson’s Disease Classification [Dataset], /: from: https.
- Aich, S. , et al. A Supervised Machine Learning Approach using Different Feature Selection Techniques on Voice Datasets for Prediction of Parkinson’s Disease, 2019. [Google Scholar]
- Ho, A.K. , et al., Speech impairment in a large sample of patients with Parkinson’s disease. Behav Neurol, 1998. 11(3): p. 131-137.
- Vandana, V.P. , et al., Speech Characteristics of Patients with Parkinson’s Disease-Does Dopaminergic Medications Have a Role? J Neurosci Rural Pract, 2021. 12(4): p. 673-679.
- Skodda, S. , Aspects of speech rate and regularity in Parkinson’s disease. Journal of the Neurological Sciences, 2011. 310(1): p. 231-236.
- Tabari, F. , et al., Speech, voice, and language outcomes following deep brain stimulation: A systematic review. PLoS One, 2024. 19(5): p. e0302739.
- Krasko, M.N. , et al. Rat Models of Vocal Deficits in Parkinson’s Disease, 2021; 11. [Google Scholar] [CrossRef]
- Iyer, A. , et al., A machine learning method to process voice samples for identification of Parkinson’s disease. Scientific Reports, 2023. 13(1): p. 20615.
- Berus, L. , et al. Classifying Parkinson’s Disease Based on Acoustic Measures Using Artificial Neural Networks, 2019; 19. [Google Scholar] [CrossRef]
- Pedregosa, F. , Scikit-learn: Machine learning in Python, in Journal of machine learning research 12. 2011. p. 2825.
- Tan, J. , et al., A critical look at the current train/test split in machine learning. ArXiv, 2021. abs/2106.04525.
- Szeghalmy, S. and A. Fazekas A Comparative Study of the Use of Stratified Cross-Validation and Distribution-Balanced Stratified Cross-Validation in Imbalanced Learning. Sensors, 2023. 23. [CrossRef]
- Zheng, W. and M. Jin, The Effects of Class Imbalance and Training Data Size on Classifier Learning: An Empirical Study. SN Computer Science, 2020. 1(2): p. 71.
- Cao, P. , et al., Efficient multi-kernel multi-instance learning using weakly supervised and imbalanced data for diabetic retinopathy diagnosis. Computerized Medical Imaging and Graphics, 2018. 69: p. 112-124.
- Chawla, N. , et al., SMOTE: Synthetic Minority Over-sampling Technique. ArXiv, 2002. abs/1106.1813.
- Carbonneau, M.-A. , et al., Multiple instance learning: A survey of problem characteristics and applications. Pattern Recognit., 2016. 77: p. 329-353.
- Liu, L. Research on Logistic Regression Algorithm of Breast Cancer Diagnose Data by Machine Learning. in 2018 International Conference on Robots & Intelligent System (ICRIS). 2018.
- Classification Based on Decision Tree Algorithm for Machine Learning. Journal of Applied Science and Technology Trends, 2021. 2(01): p. 20 - 28.
- Liu, Y., Y. Wang, and J. Zhang. New Machine Learning Algorithm: Random Forest, S: Computing and Applications. 2012. Berlin, Heidelberg, 2012. [Google Scholar]
- Natekin, A. and A. Knoll, Gradient boosting machines, a tutorial. Frontiers in Neurorobotics, 2013. 7.
- Chen, T. and C. Guestrin, XGBoost: A Scalable Tree Boosting System. Proceedings of the 22nd ACM SIGKDD International Conference on Knowledge Discovery and Data Mining, 2016.
- Ke, G. , et al. in Neural Information Processing Systems. 2017.
- Jodas, D.S. , et al., PL-kNN: A Python-based implementation of a parameterless k-Nearest Neighbors classifier. Software Impacts, 2023. 15: p. 100459.
- Abdullah, D.M. and A.M. Abdulazeez, Machine Learning Applications based on SVM Classification A Review. Qubahan Academic Journal, 2021.
- Lowd, D. and P.M. Domingos, Naive Bayes models for probability estimation. Proceedings of the 22nd international conference on Machine learning, 2005.
- Schapire, R.E. , The Boosting Approach to Machine Learning: An Overview, in Nonlinear Estimation and Classification, D.D. Denison, et al., Editors. 2003, Springer New York: New York, NY. p. 149-171.
- Orrù, P.F. , et al. Machine Learning Approach Using MLP and SVM Algorithms for the Fault Prediction of a Centrifugal Pump in the Oil and Gas Industry, 2020; 12. [Google Scholar] [CrossRef]
- Mienye, I.D. and Y. Sun, A Survey of Ensemble Learning: Concepts, Algorithms, Applications, and Prospects. IEEE Access, 2022. 10: p. 99129-99149.
- Jakhar, A.K., A. Gupta, and M. Singh, SELF: a stacked-based ensemble learning framework for breast cancer classification. Evolutionary Intelligence, 2024. 17(3): p. 1341-1356.
- Shekar, B.H. and G. Dagnew. Grid Search-Based Hyperparameter Tuning and Classification of Microarray Cancer Data, 2019. [Google Scholar]
- Browne, M.W. , Cross-Validation Methods. Journal of Mathematical Psychology, 2000. 44(1): p. 108-132.
- Roberts, D.R. , et al., Cross-validation strategies for data with temporal, spatial, hierarchical, or phylogenetic structure. Ecography, 2017. 40: p. 913-929.
- Wardhani, N.W.S. , et al. Cross-validation Metrics for Evaluating Classification Performance on Imbalanced Data, 2019. [Google Scholar]
- Halimu, C., A. Kasem, and S.M. Newaz, Empirical Comparison of Area under ROC curve (AUC) and Mathew Correlation Coefficient (MCC) for Evaluating Machine Learning Algorithms on Imbalanced Datasets for Binary Classification. Proceedings of the 3rd International Conference on Machine Learning and Soft Computing, 2019.
- Pah, N.D. , et al., Detecting Effect of Levodopa in Parkinson’s Disease Patients Using Sustained Phonemes. IEEE Journal of Translational Engineering in Health and Medicine, 2021. 9: p. 1-9.
- Ngo, Q.C. , et al., Computerized analysis of speech and voice for Parkinson’s disease: A systematic review. Computer Methods and Programs in Biomedicine, 2022. 226: p. 107133.
- Ali, L. , et al., Automated Detection of Parkinson’s Disease Based on Multiple Types of Sustained Phonations Using Linear Discriminant Analysis and Genetically Optimized Neural Network. IEEE Journal of Translational Engineering in Health and Medicine, 2019. 7: p. 1-10.
- Arora, S. and A. Tsanas Assessing Parkinson’s Disease at Scale Using Telephone-Recorded Speech: Insights from the Parkinson’s Voice Initiative. Diagnostics, 2021. 11. [CrossRef]
- Azadi, H. , et al., Evaluating the Effect of Parkinson’s Disease on Jitter and Shimmer Speech Features. Advanced Biomedical Research, 2021. 10(1).
- Viswanathan, R. , et al. Complexity Measures of Voice Recordings as a Discriminative Tool for Parkinson’s Disease, 2020; 10. [Google Scholar] [CrossRef]
- Gunduz, H. , Deep Learning-Based Parkinson’s Disease Classification Using Vocal Feature Sets. IEEE Access, 2019. 7: p. 115540-115551.
- Polat, K. and M. Nour, Parkinson disease classification using one against all based data sampling with the acoustic features from the speech signals. Medical Hypotheses, 2020. 140.
- Sakar, C.O. , et al., A comparative analysis of speech signal processing algorithms for Parkinson’s disease classification and the use of the tunable Q-factor wavelet transform. Applied Soft Computing, 2019. 74: p. 255-263.
- Sakar, B.E. , et al., Collection and analysis of a Parkinson speech dataset with multiple types of sound recordings. IEEE Journal of Biomedical and Health Informatics, 2013. 17(4): p. 828-834.
- Naranjo, L. , et al., A two-stage variable selection and classification approach for Parkinson’s disease detection by using voice recording replications. Computer Methods and Programs in Biomedicine, 2017. 142: p. 147-156.
- Moro-Velázquez, L. , et al., Analysis of speaker recognition methodologies and the influence of kinetic changes to automatically detect Parkinson’s Disease. Applied Soft Computing, 2018. 62: p. 649-666.
- García, A.M. , et al., How language flows when movements don’t: An automated analysis of spontaneous discourse in Parkinson’s disease. Brain and Language, 2016. 162: p. 19-28.
- Luque, A. , et al., The impact of class imbalance in classification performance metrics based on the binary confusion matrix. Pattern Recognition, 2019. 91: p. 216-231.
- Sasse, E.A. , Objective evaluation of data in screening for disease. Clinica Chimica Acta, 2002. 315(1): p. 17-30.
- Trevizan, B. , et al., A comparative evaluation of aggregation methods for machine learning over vertically partitioned data. Expert Systems with Applications, 2020. 152: p. 113406.
- Berus, L. , et al., Classifying Parkinson’s Disease Based on Acoustic Measures Using Artificial Neural Networks. Sensors, 2019. 19(1): p. 16.
- Naranjo, L. , et al., Addressing voice recording replications for Parkinson’s disease detection. Expert Systems with Applications, 2016. 46: p. 286-292.
- Holmes, R.J. , et al., Voice characteristics in the progression of Parkinson’s disease. Int J Lang Commun Disord, 2000. 35(3): p. 407-18.
- Hinton, G. , et al., Deep Neural Networks for Acoustic Modeling in Speech Recognition: The Shared Views of Four Research Groups. IEEE Signal Processing Magazine, 2012. 29(6): p. 82-97.
- Hou, J.C. , et al., Audio-Visual Speech Enhancement Using Multimodal Deep Convolutional Neural Networks. IEEE Transactions on Emerging Topics in Computational Intelligence, 2018. 2(2): p. 117-128.
- Ye, F. and J. Yang, A Deep Neural Network Model for Speaker Identification. Applied Sciences, 2021. 11(8): p. 3603.
- Chen, L. and J. Chen, Deep Neural Network for Automatic Classification of Pathological Voice Signals. Journal of Voice, 2022. 36(2): p. 288.e15-288.e24.
- Tzirakis, P. , et al., End-to-End Multimodal Emotion Recognition Using Deep Neural Networks. IEEE Journal of Selected Topics in Signal Processing, 2017. 11(8): p. 1301-1309.
- Chaiani, M. , et al., Voice disorder classification using speech enhancement and deep learning models. Biocybernetics and Biomedical Engineering, 2022. 42(2): p. 463-480.
- Yadav, S.P. , et al., Survey on Machine Learning in Speech Emotion Recognition and Vision Systems Using a Recurrent Neural Network (RNN). Archives of Computational Methods in Engineering, 2022. 29(3): p. 1753-1770.
Figure 1.
Workflow of the multi-algorithm AI pipeline. The pipeline starts with input data and progresses through preprocessing steps, including stratified train-test splitting, feature standardization, and data augmentation. It then diverges into two primary strategies: post-aggregation, where machine learning models are trained at the voice level with subsequent aggregation of predictions, and pre-aggregation, where features are aggregated at the subject level prior to model training. For both aggregation strategies, twelve (12) machine learning algorithms are utilized. The process concludes with an evaluation phase that assesses model performance on the test set using seven different metrics.
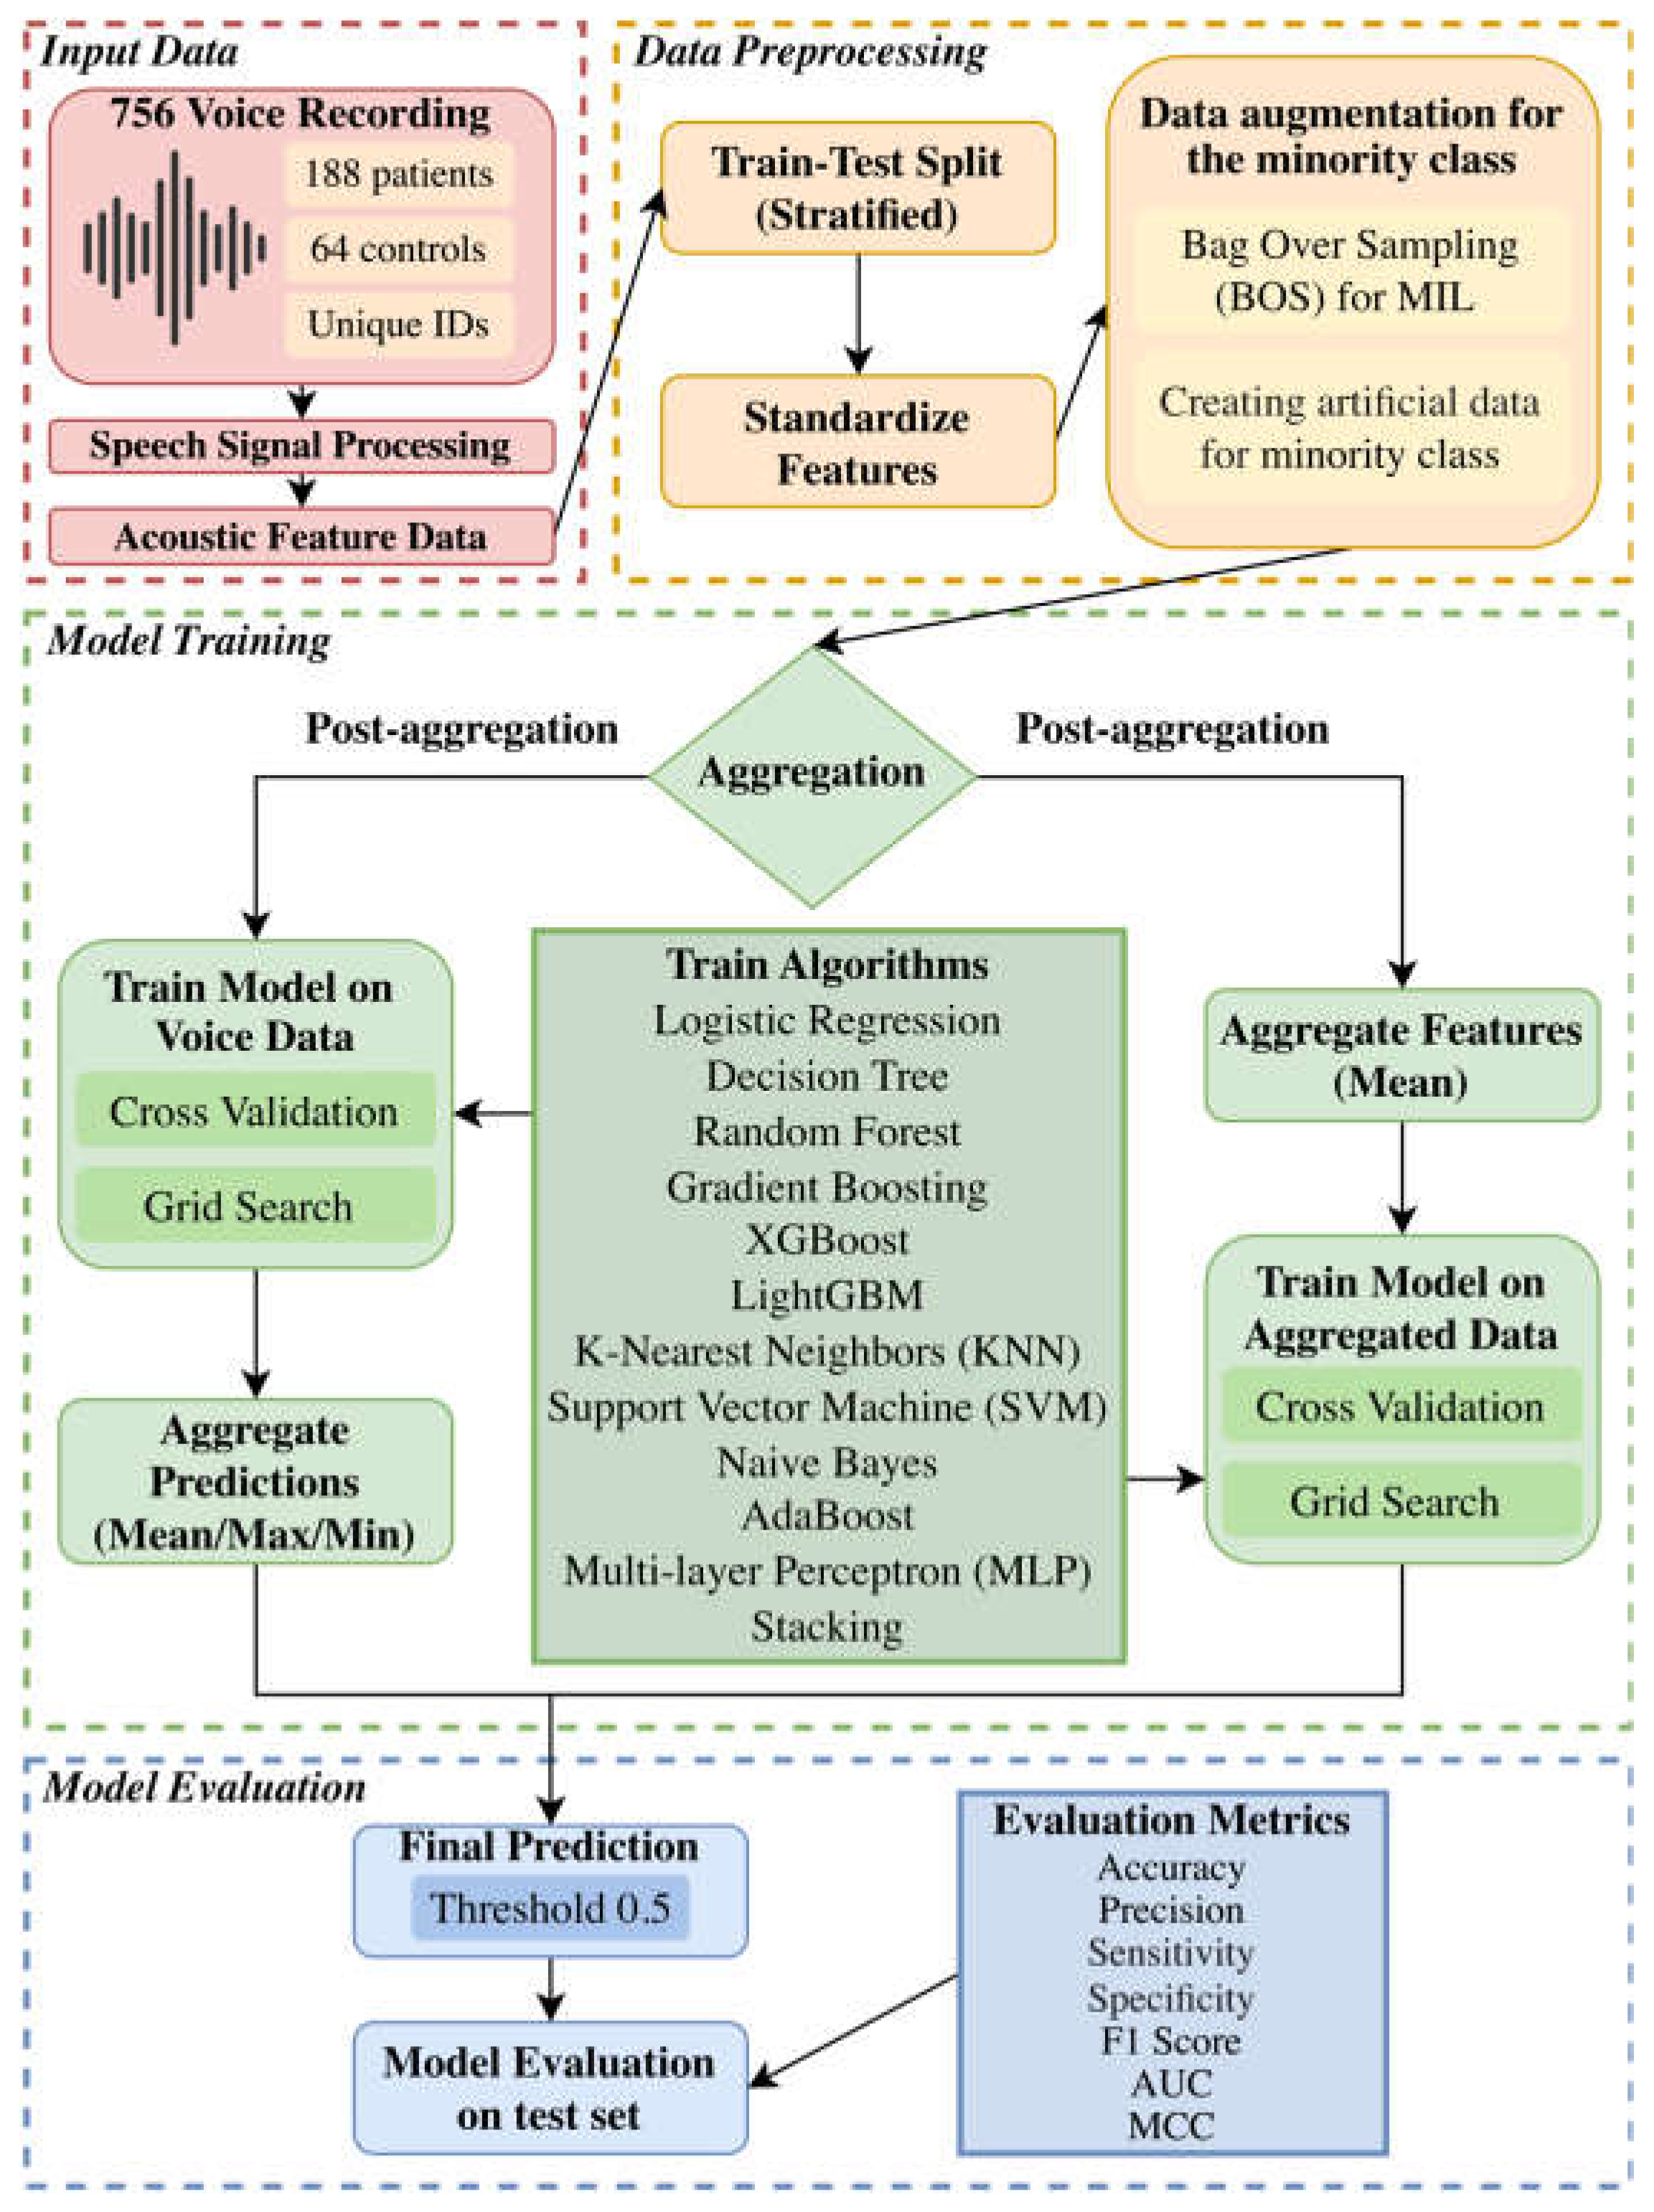
Figure 2.
Comparison of Best Models on Test Set Across Different Aggregation Methods. For each aggregation method, the model with the highest accuracy was identified as the best performer. Overall, the post-mean aggregation method achieved superior classification performance based on accuracy, F1 score, AUC, and MCC. In contrast, the post-min aggregation exhibited higher precision and specificity but lower sensitivity, while the post-max aggregation showed the opposite trend.
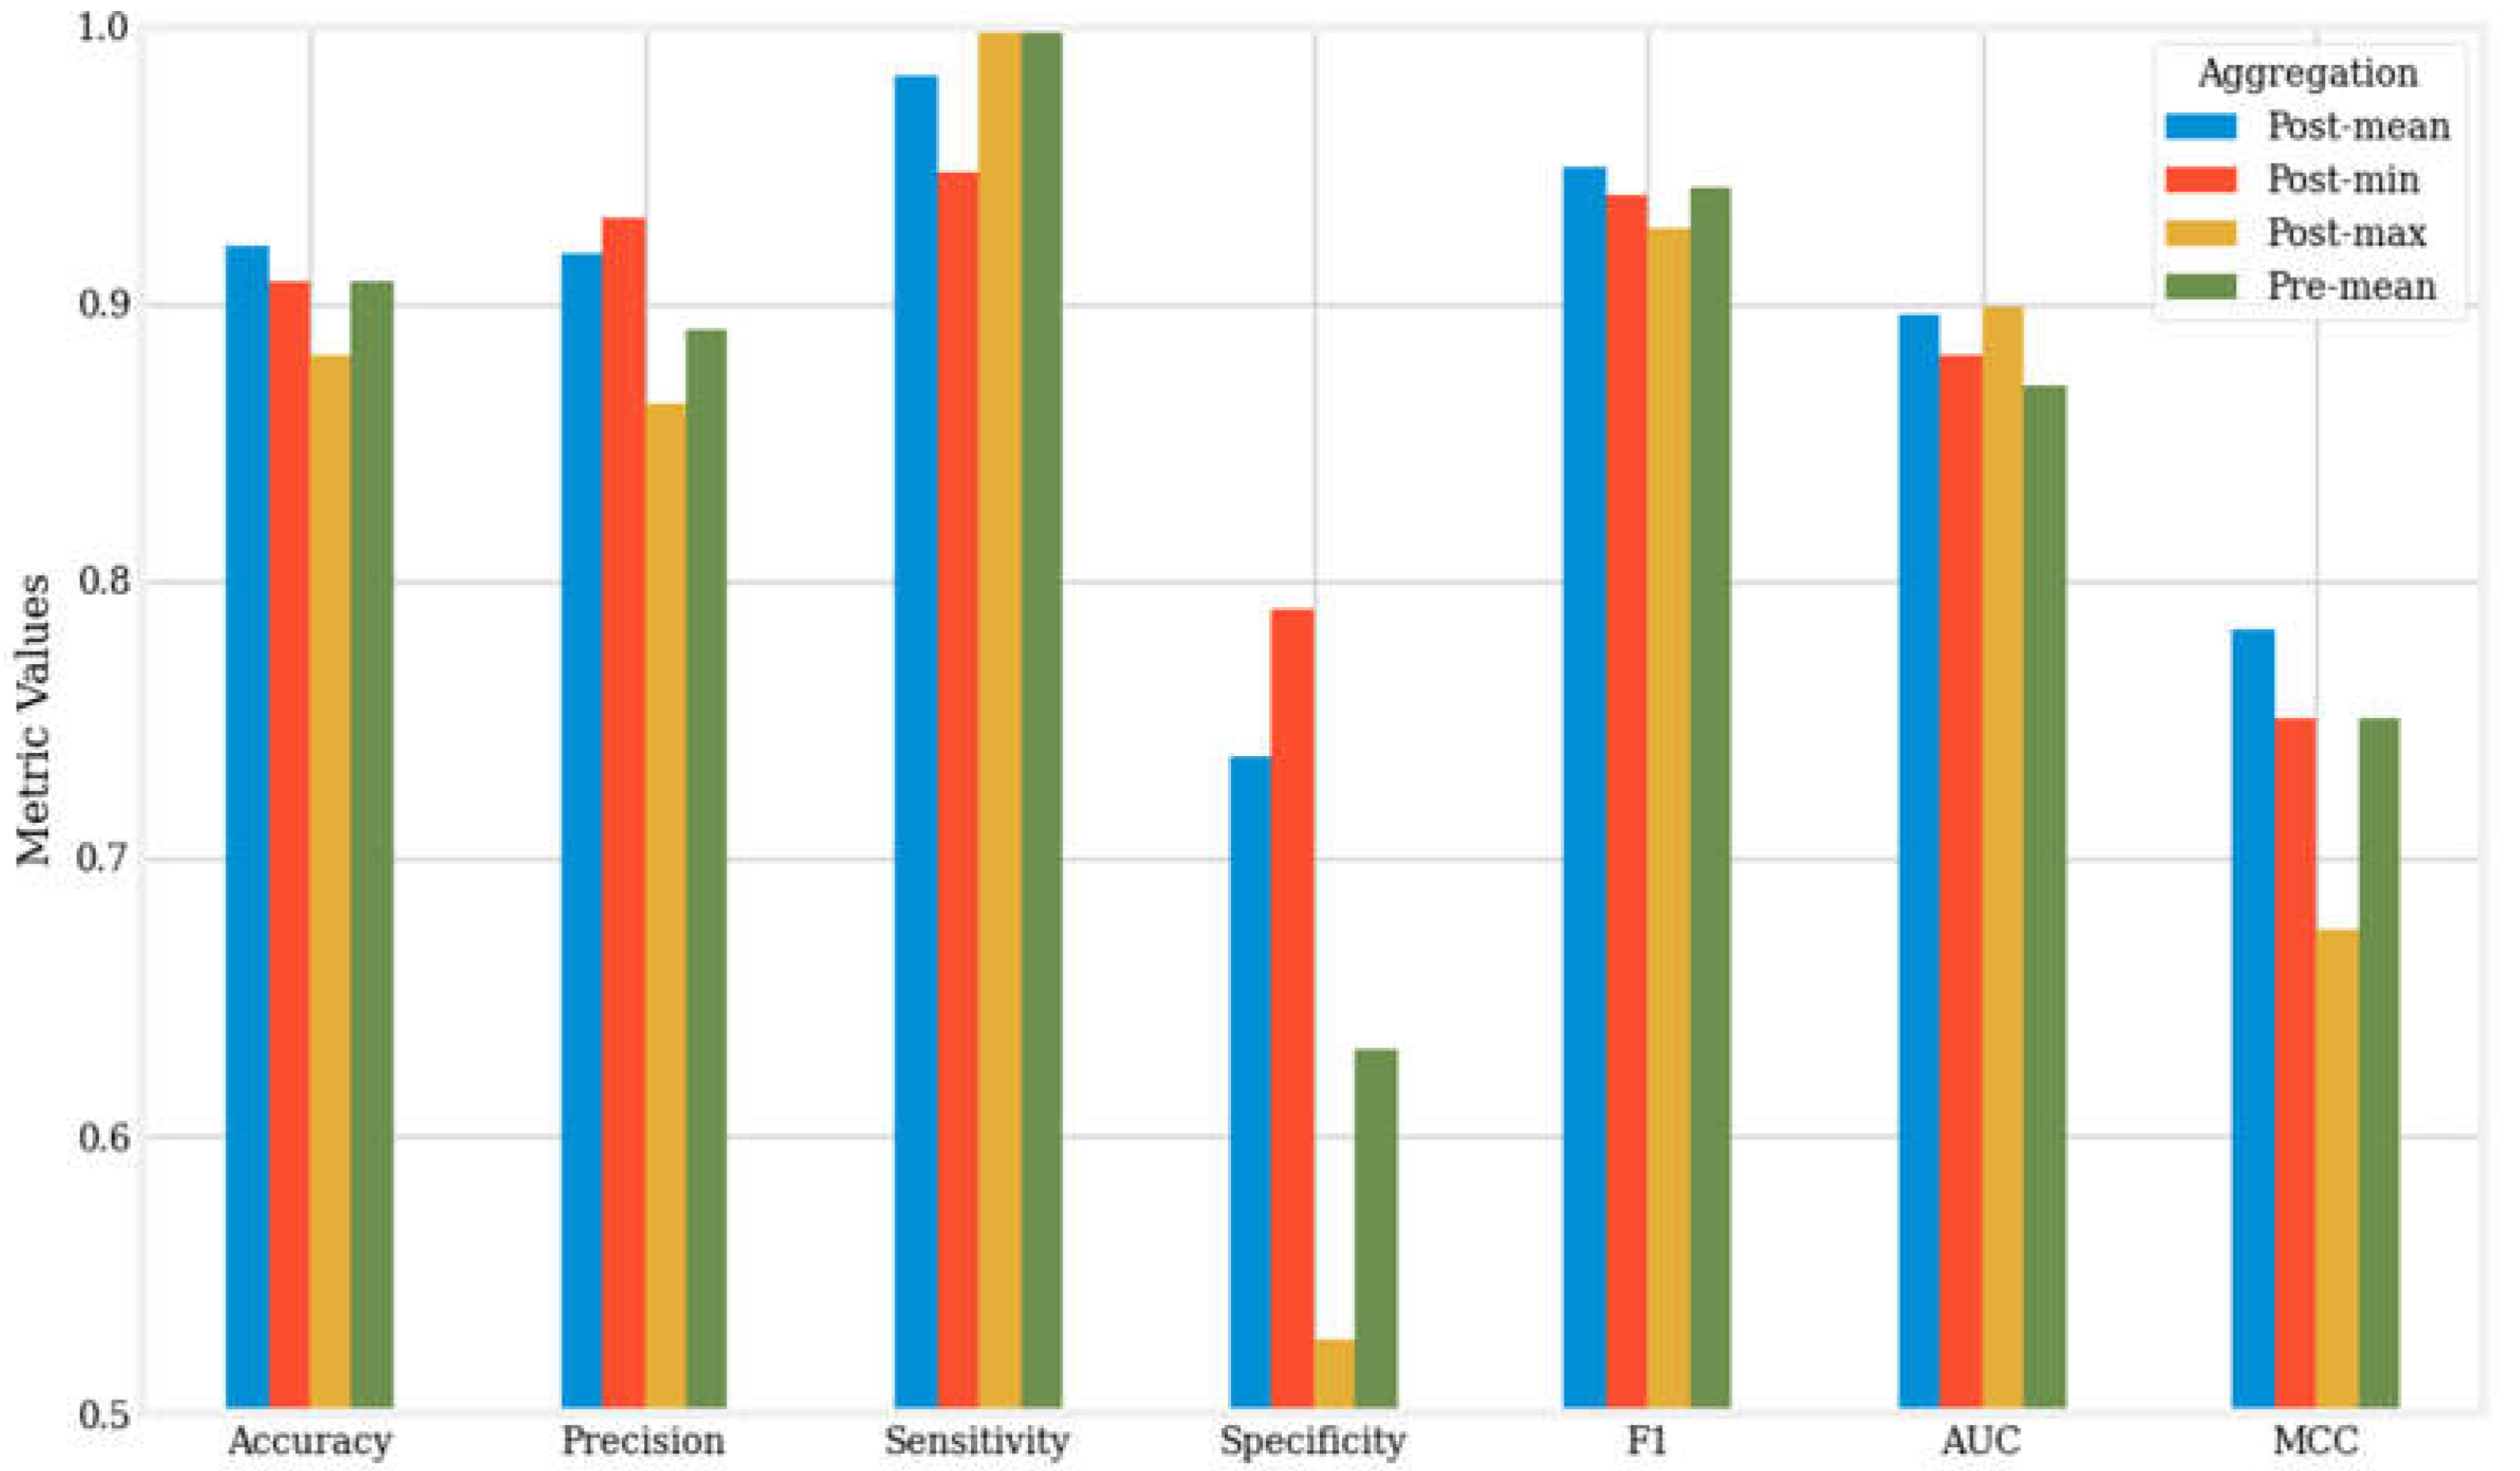
Figure 3.
Comparison of Average Performance on the Test Set Across Different Aggregation Methods. The mean values of seven metrics were calculated for each aggregation method across twelve AI algorithms to represent average performance. In line with Figure 2, the post-mean aggregation method achieved the highest classification performance in terms of accuracy, F1 score, AUC, and MCC. Furthermore, the post-min aggregation demonstrated higher precision and specificity but lower sensitivity, while the post-max aggregation displayed the opposite trend.
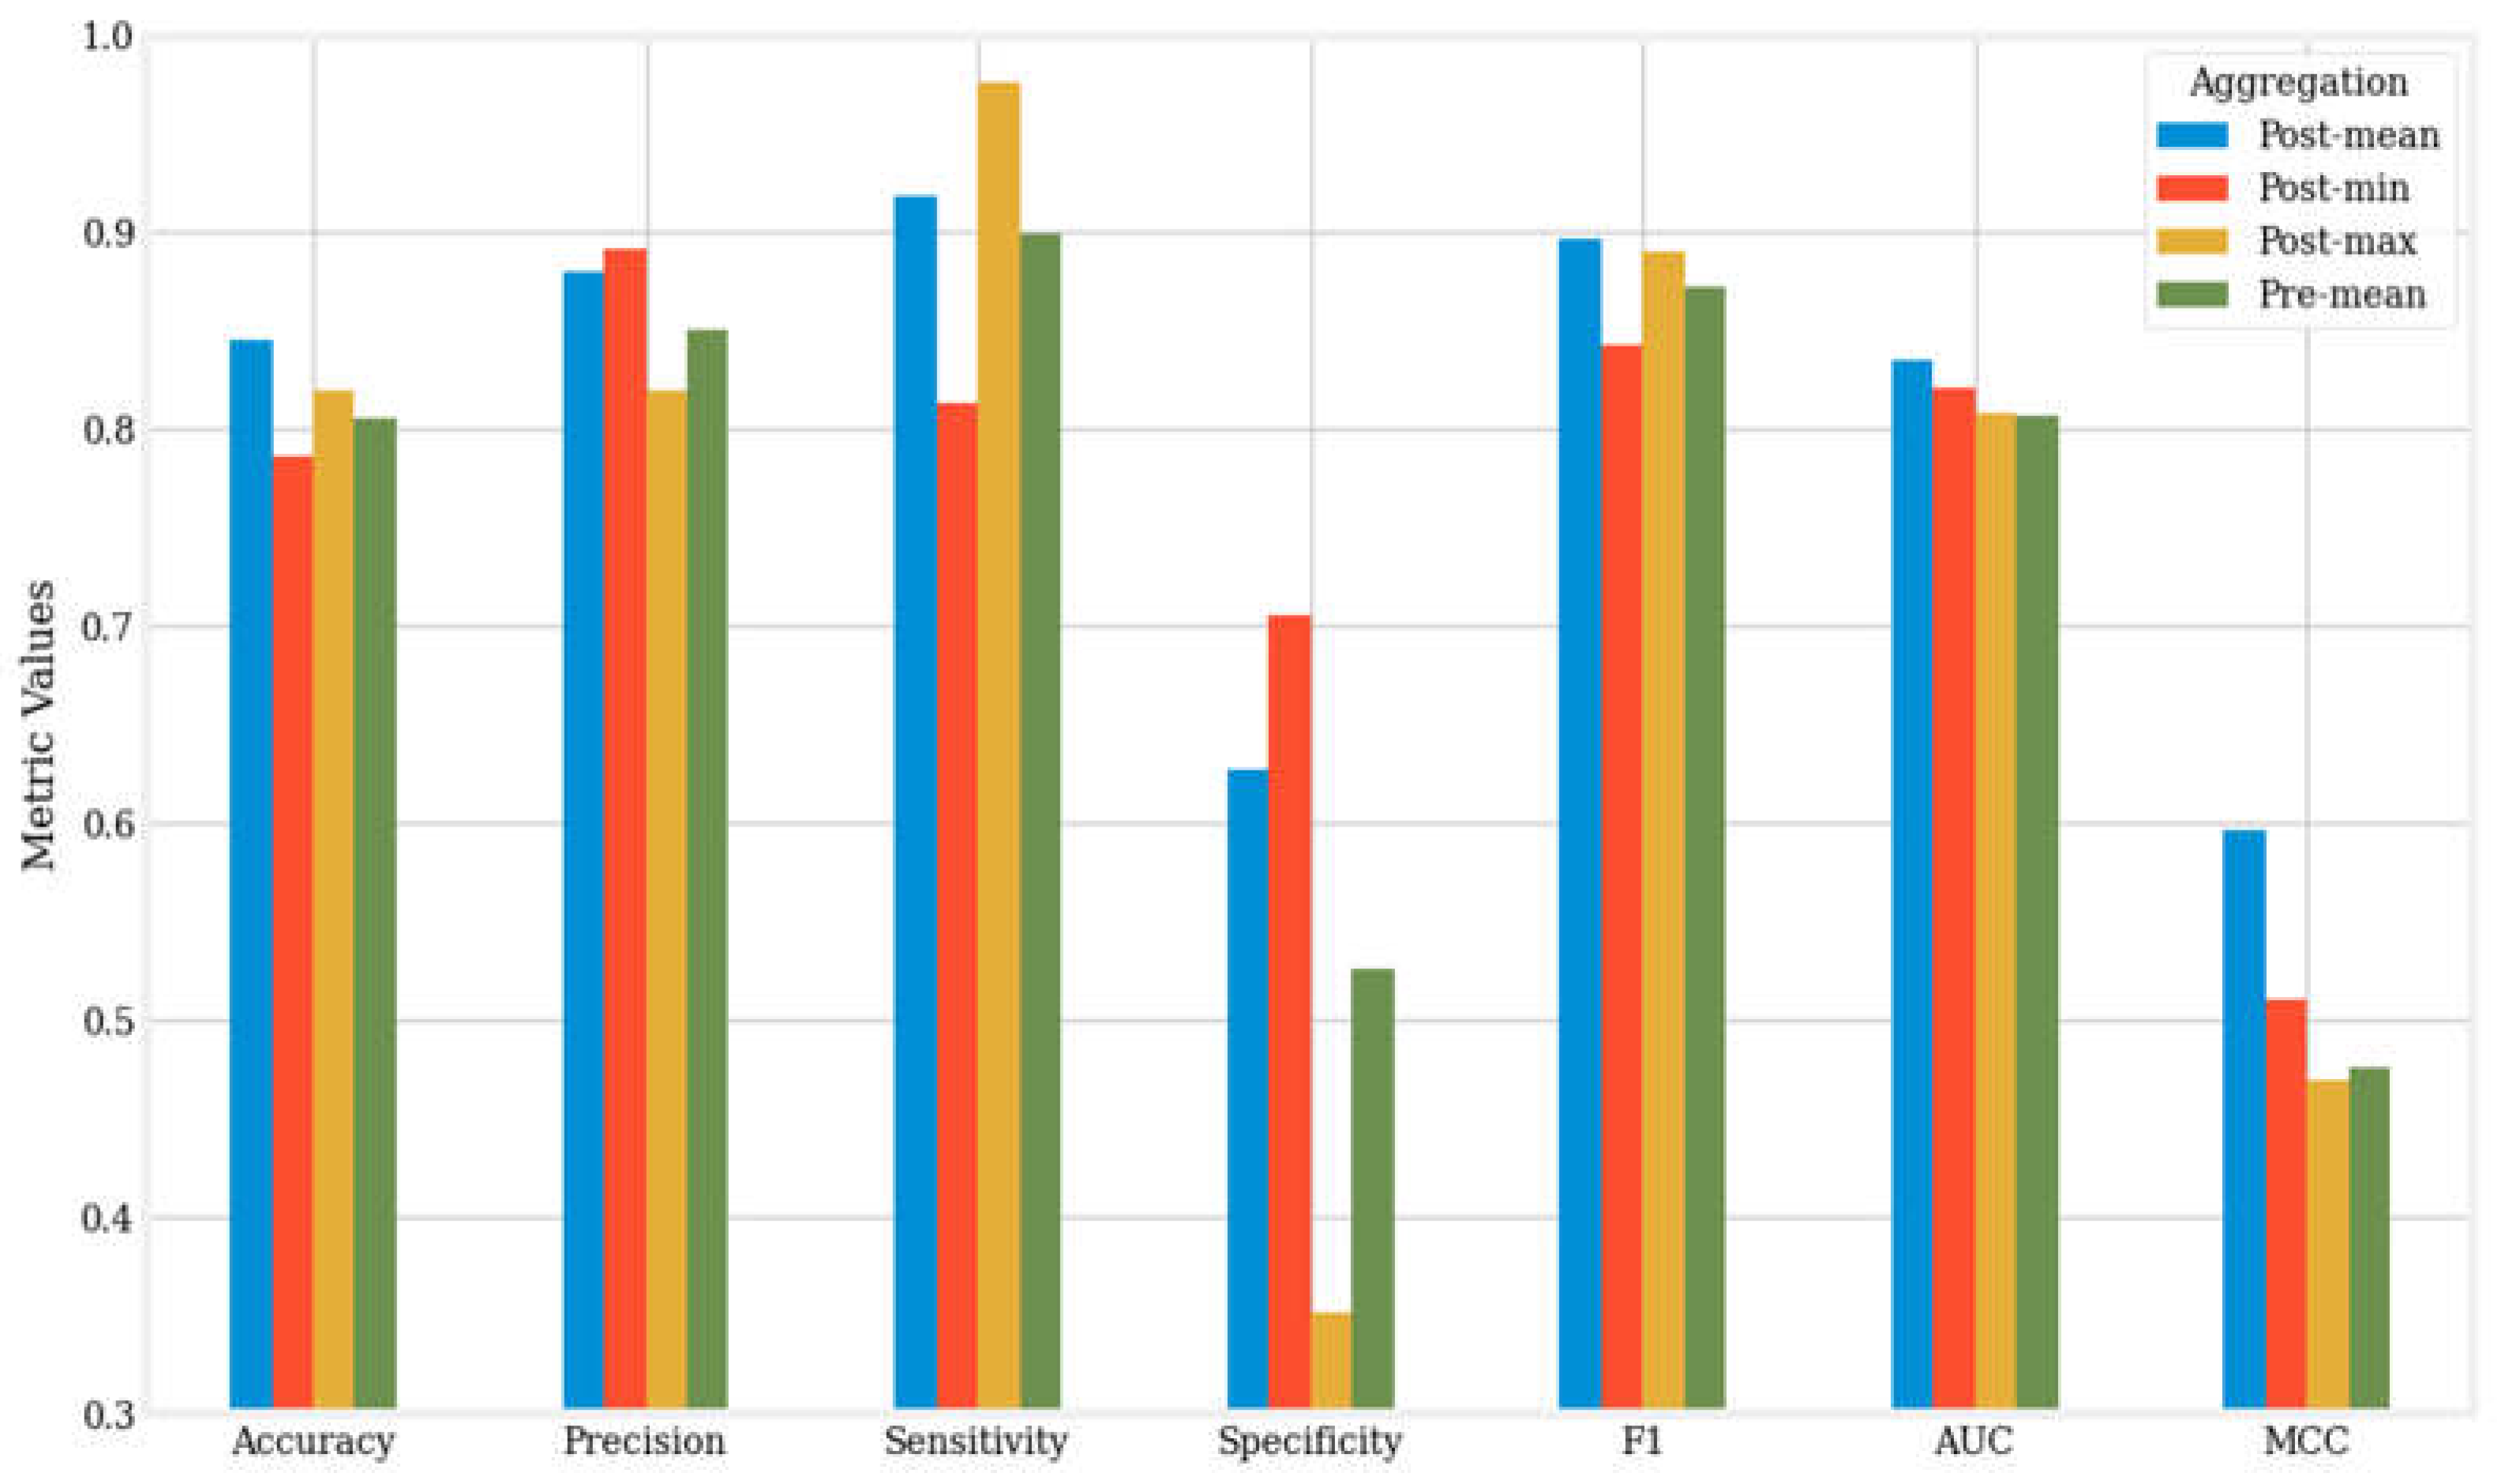
Figure 4.
Comparison of AI Algorithms’ Performance on the Test Set Across Different Aggregation Methods. The twelve AI algorithms were ranked according to their average accuracy across the four aggregation methods. The results show that more complex algorithms, such as MLP and boosting models, generally outperformed simpler algorithms like Naïve Bayes, Decision Tree, and KNN. Among the higher-ranked algorithms, post-mean aggregation consistently proved to be the most effective method, while post-max aggregation was particularly noteworthy for the lower-performing algorithms.
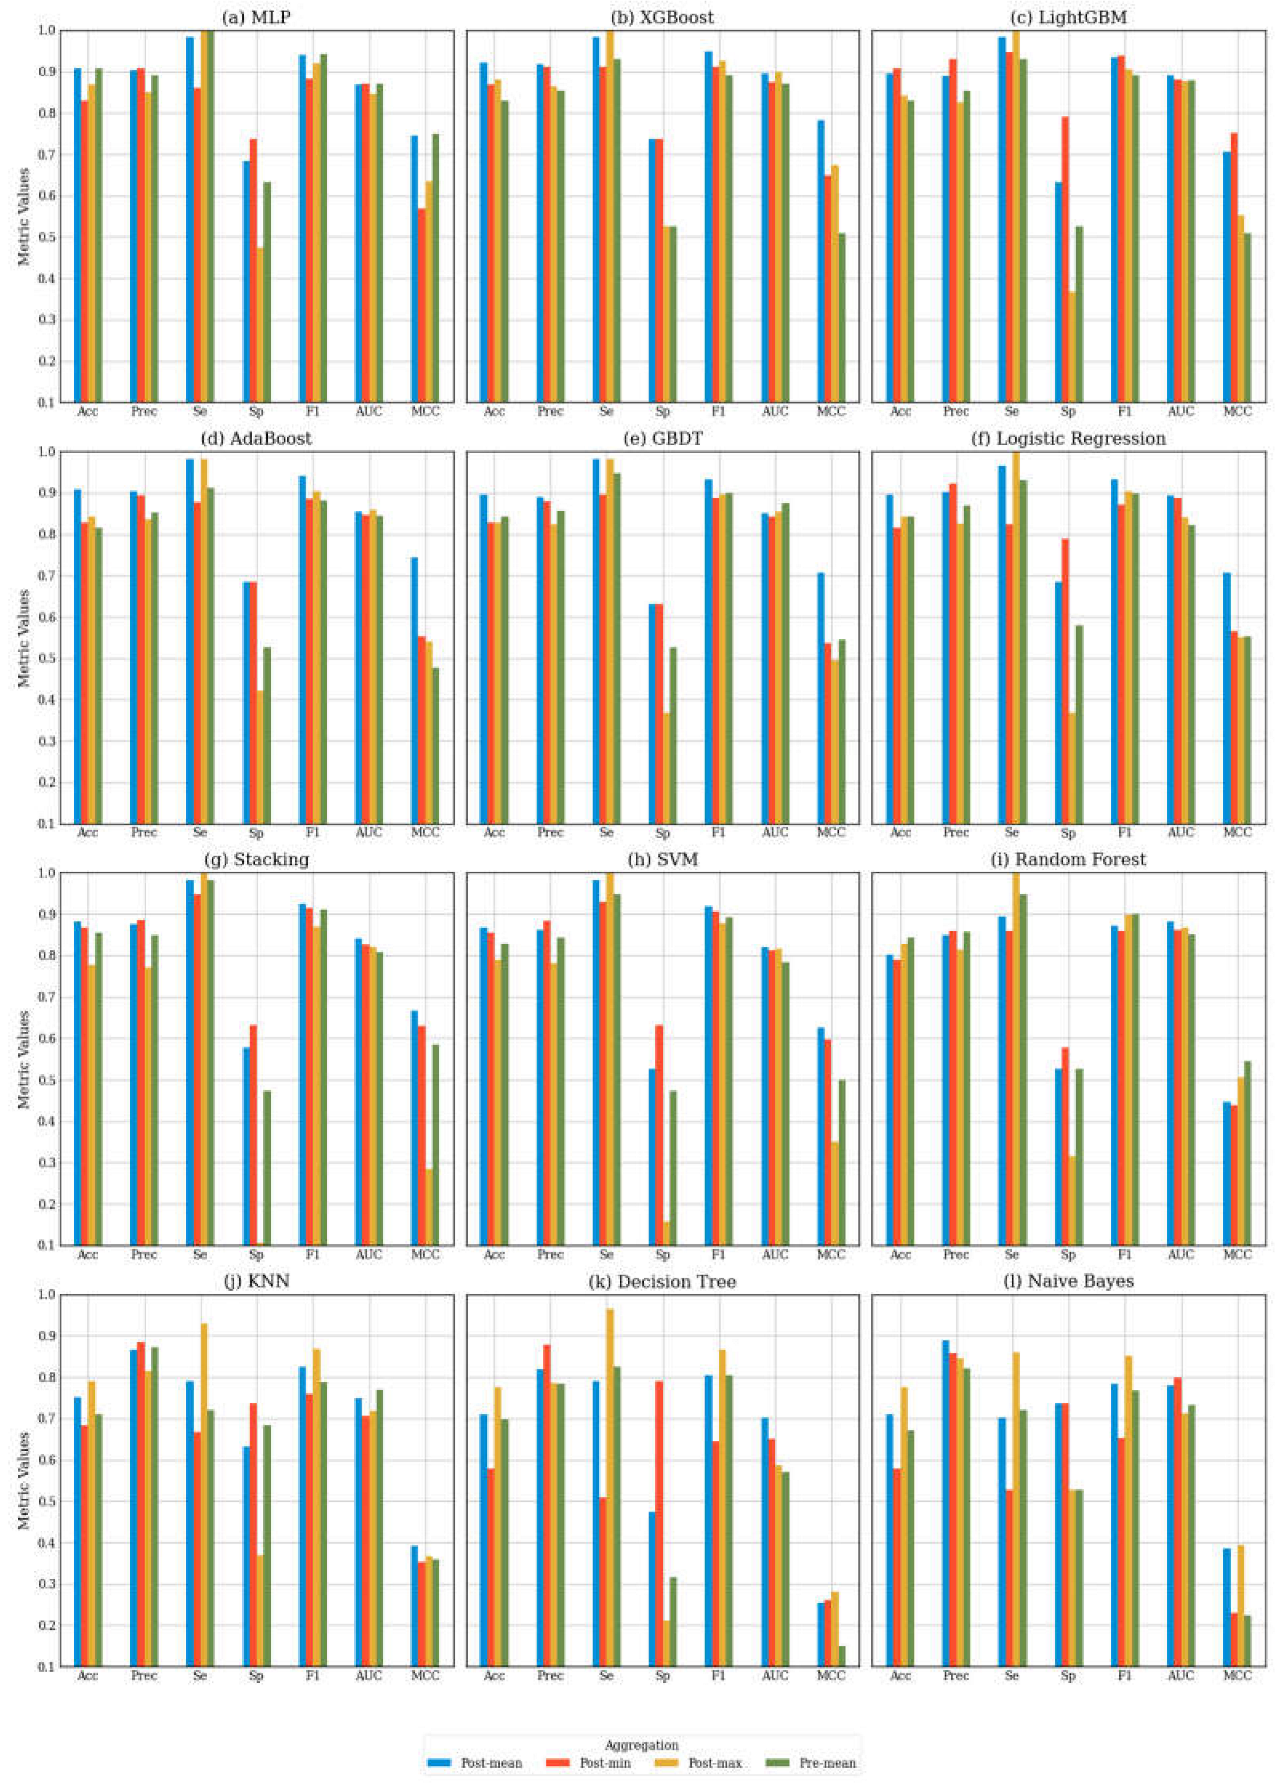

Table 1.
Model Performance on the test set with Post-mean Aggregation ranked by accuracy.
| Model Name | Acc | Prec | Se | Sp | F1 | AUC | MCC |
|---|---|---|---|---|---|---|---|
| XGBoost | 0.921 | 0.918 | 0.982 | 0.737 | 0.949 | 0.896 | 0.783 |
| MLP | 0.908 | 0.903 | 0.982 | 0.684 | 0.941 | 0.868 | 0.745 |
| AdaBoost | 0.908 | 0.903 | 0.982 | 0.684 | 0.941 | 0.855 | 0.745 |
| Logistic Regression | 0.895 | 0.902 | 0.965 | 0.684 | 0.932 | 0.893 | 0.706 |
| LightGBM | 0.895 | 0.889 | 0.982 | 0.632 | 0.933 | 0.891 | 0.706 |
| GBDT | 0.895 | 0.889 | 0.982 | 0.632 | 0.933 | 0.850 | 0.706 |
| Stacking | 0.882 | 0.875 | 0.982 | 0.579 | 0.926 | 0.840 | 0.667 |
| SVM | 0.868 | 0.862 | 0.982 | 0.526 | 0.918 | 0.820 | 0.626 |
| Random Forest | 0.803 | 0.850 | 0.895 | 0.526 | 0.872 | 0.881 | 0.447 |
| KNN | 0.750 | 0.865 | 0.789 | 0.632 | 0.826 | 0.750 | 0.392 |
| Naive Bayes | 0.711 | 0.889 | 0.702 | 0.737 | 0.784 | 0.781 | 0.386 |
| Decision Tree | 0.711 | 0.818 | 0.789 | 0.474 | 0.804 | 0.701 | 0.255 |
Table 2.
Model Performance on the test set with Post-min Aggregation ranked by accuracy.
| Model Name | Acc | Prec | Se | Sp | F1 | AUC | MCC |
|---|---|---|---|---|---|---|---|
| LightGBM | 0.908 | 0.931 | 0.947 | 0.789 | 0.939 | 0.881 | 0.750 |
| XGBoost | 0.868 | 0.912 | 0.912 | 0.737 | 0.912 | 0.875 | 0.649 |
| Stacking | 0.868 | 0.885 | 0.947 | 0.632 | 0.915 | 0.825 | 0.630 |
| SVM | 0.855 | 0.883 | 0.930 | 0.632 | 0.906 | 0.812 | 0.596 |
| MLP | 0.829 | 0.907 | 0.860 | 0.737 | 0.883 | 0.871 | 0.570 |
| AdaBoost | 0.829 | 0.893 | 0.877 | 0.684 | 0.885 | 0.847 | 0.552 |
| GBDT | 0.829 | 0.879 | 0.895 | 0.632 | 0.887 | 0.843 | 0.536 |
| Logistic Regression | 0.816 | 0.922 | 0.825 | 0.789 | 0.870 | 0.888 | 0.566 |
| Random Forest | 0.789 | 0.860 | 0.860 | 0.579 | 0.860 | 0.861 | 0.439 |
| KNN | 0.684 | 0.884 | 0.667 | 0.737 | 0.760 | 0.706 | 0.353 |
| Decision Tree | 0.579 | 0.879 | 0.509 | 0.789 | 0.644 | 0.650 | 0.261 |
| Naive Bayes | 0.579 | 0.857 | 0.526 | 0.737 | 0.652 | 0.798 | 0.229 |
Table 3.
Model Performance on the test set with Post-max Aggregation ranked by accuracy.
| Model Name | Acc | Prec | Se | Sp | F1 | AUC | MCC |
|---|---|---|---|---|---|---|---|
| XGBoost | 0.882 | 0.864 | 1.000 | 0.526 | 0.927 | 0.898 | 0.674 |
| MLP | 0.868 | 0.851 | 1.000 | 0.474 | 0.919 | 0.845 | 0.635 |
| LightGBM | 0.842 | 0.826 | 1.000 | 0.368 | 0.905 | 0.877 | 0.552 |
| Logistic Regression | 0.842 | 0.826 | 1.000 | 0.368 | 0.905 | 0.839 | 0.552 |
| AdaBoost | 0.842 | 0.836 | 0.982 | 0.421 | 0.903 | 0.860 | 0.541 |
| Random Forest | 0.829 | 0.814 | 1.000 | 0.316 | 0.898 | 0.868 | 0.507 |
| GBDT | 0.829 | 0.824 | 0.982 | 0.368 | 0.896 | 0.855 | 0.495 |
| KNN | 0.789 | 0.815 | 0.930 | 0.368 | 0.869 | 0.718 | 0.367 |
| SVM | 0.789 | 0.781 | 1.000 | 0.158 | 0.877 | 0.815 | 0.351 |
| Naive Bayes | 0.776 | 0.845 | 0.860 | 0.526 | 0.852 | 0.711 | 0.393 |
| Stacking | 0.776 | 0.770 | 1.000 | 0.105 | 0.870 | 0.821 | 0.285 |
| Decision Tree | 0.776 | 0.786 | 0.965 | 0.211 | 0.866 | 0.588 | 0.282 |
Table 4.
Model Performance on the test set with Pre-mean Aggregation ranked by test accuracy.
| Model Name | Acc | Prec | Se | Sp | F1 | AUC | MCC |
|---|---|---|---|---|---|---|---|
| MLP | 0.908 | 0.891 | 1.000 | 0.632 | 0.942 | 0.871 | 0.750 |
| Stacking | 0.855 | 0.848 | 0.982 | 0.474 | 0.911 | 0.809 | 0.584 |
| Logistic Regression | 0.842 | 0.869 | 0.930 | 0.579 | 0.898 | 0.822 | 0.554 |
| Random Forest | 0.842 | 0.857 | 0.947 | 0.526 | 0.900 | 0.851 | 0.545 |
| GBDT | 0.842 | 0.857 | 0.947 | 0.526 | 0.900 | 0.875 | 0.545 |
| XGBoost | 0.829 | 0.855 | 0.930 | 0.526 | 0.891 | 0.870 | 0.510 |
| LightGBM | 0.829 | 0.855 | 0.930 | 0.526 | 0.891 | 0.879 | 0.510 |
| SVM | 0.829 | 0.844 | 0.947 | 0.474 | 0.893 | 0.783 | 0.500 |
| AdaBoost | 0.816 | 0.852 | 0.912 | 0.526 | 0.881 | 0.844 | 0.477 |
| KNN | 0.711 | 0.872 | 0.719 | 0.684 | 0.788 | 0.769 | 0.360 |
| Decision Tree | 0.697 | 0.783 | 0.825 | 0.316 | 0.803 | 0.570 | 0.149 |
| Naive Bayes | 0.671 | 0.820 | 0.719 | 0.526 | 0.766 | 0.733 | 0.224 |
Disclaimer/Publisher’s Note: The statements, opinions and data contained in all publications are solely those of the individual author(s) and contributor(s) and not of MDPI and/or the editor(s). MDPI and/or the editor(s) disclaim responsibility for any injury to people or property resulting from any ideas, methods, instructions or products referred to in the content. |
© 2024 by the authors. Licensee MDPI, Basel, Switzerland. This article is an open access article distributed under the terms and conditions of the Creative Commons Attribution (CC BY) license (http://creativecommons.org/licenses/by/4.0/).
Copyright: This open access article is published under a Creative Commons CC BY 4.0 license, which permit the free download, distribution, and reuse, provided that the author and preprint are cited in any reuse.


