
Submitted:
03 December 2024
Posted:
04 December 2024
You are already at the latest version
Preprints on COVID-19 and SARS-CoV-2
Abstract
COVID-19, a respiratory illness that mostly attacks the human lungs emerged in 2019 and quickly became a global health crisis. Its fast transmission has necessitated the creation of effective tools that could aid in its classification. In this paper, we present an artificial intelligence multimodal deep learning model that leverages X-ray, CT-scan, and cough signals to classify COVID-19 accurately. This paper meticulously compares the effectiveness of non-pre-trained and pre-trained versions of VGG19, MobileNetv2, and ResNET across various multimodal and some unimodal models. Findings show that while the pre-trained unimodal systems for cough and X-ray outperform their non-pre-trained counterparts, the non-pre-trained CT scan model performs exceptionally well. This suggests that features learned from the VGG19 model fail to generalize effectively. Remarkably, the non-pre-trained multimodal model accomplishes an F1-score of 0.9804, slightly outperforming its pre-trained counterpart. These results indicate the potential of developing artificial intelligence models from scratch, especially for specialized datasets in multimodal scenarios. While this research advances our understanding of transfer learning within COVID-19 classification, it also emphasizes the prospects of developing custom deep-learning models for solving complex medical problems.
Keywords:
Machine learning
; audio signal processing
; deep learning
; Image classification
; Multimodal systems
; Transfer learning
; Unimodal systems
1. Introduction
The Covid-19 pandemic resulted from the novel SARS-CoV-2 virus that emerged in late 2019 [1]. Its emergence was accompanied by a record number of deaths across the globe. Because of the loss of lives, lockdowns were imminent, leading to businesses shutting down for months to contain the virus. The pandemic strained the healthcare sector to an unprecedented level, as recorded in Europe and the Americas, for example. This development points to the fact that there is a need for a robust diagnostic system for the early detection of the virus [2]. Its early detection would allow medical personnel to effectively contain it because affected persons would be isolated, contact tracing would start in earnest, and patients would be promptly treated [2]. Furthermore, early detection could potentially save lives [2]. The traditional approach for testing patients for COVID-19 has been through the Reverse Transcription Polymerase Chain Reaction (RT-PCR) [3]. This test is usually time-consuming; in addition, it requires specialized skills to carry out the test on patients) [3]. This development therefore requires that experts be trained on how to effectively administer this process. Also, the process gives a lot of conflicting results, potentially allowing COVID-19 patients to go home due to error [4]. In addition, there have been cases of false positives recorded via RT-PCR [5].
In response to this, researchers have come up with artificial intelligence (AI)-based solutions for the detection of COVID-19 from X-rays [5], CT scans [6], and cough sounds [7]. This is now possible because of the availability of datasets. Cough sound has been used to detect COVID-19, as seen in [8]. They combined this with the symptoms of the patients to make a prediction. The use of a cough signal is useful because a COVID-19 cough produces a distinctive pattern, differentiating it from a normal cough [8]. This distinctive pattern arises as the virus attacks the lungs, thereby damaging its structure [8].
Authors have researched several methods for the detection of COVID-19 from images. For example in [5], they developed a deep learning model that extracts key features from X-ray images and then leverages a pre-trained model (VGG19) for the classification of COVID-19. A pre-trained model reflects an already existing model that has been trained on thousands of images. Therefore, its usage is usually appreciated in image classification tasks – since it has learned images sufficiently from different domains. There is a high likelihood of improved performance when in use in different classification tasks, including medical image classification tasks. Several pre-trained models have been used as seen by authors in [9]. They used several pre-trained models for their proposed model. Some of the pre-trained models (transfer learning models) are ResNET50, ResNET101, and InceptionV3, the pre-trained models were also finetuned on the collected X-ray images, where the model trained on ResNET101 proved to have outperformed other models. In addition, other research using deep learning models for X-ray COVID-19 detection has also been done as seen in the following papers [10] [11]. In [12], authors used the VGG-19 pre-trained model for the classification of X-ray images with improved performance.
The CT-scan images have also been solely analyzed for the detection of the presence of the COVID-19 virus. For example, authors in [13] used a similar approach proposed by authors in [9]. However, they used pre-trained models built on the VGG19 and then compared them to other pre-trained models such as Xception Net, and CNN. From their analysis, it is observed that their model performed satisfactorily. In addition, authors in [14] developed a deep learning model that improves on traditional deep learning methods. Their model incorporates two key innovations – the ability to reason based on the passed data, and the ability to learn. This means the model does not need input from humans in setting parameters. The model achieved an F1-score of 0.9731 on CT-scan images [14].
Furthermore, in [15] they showed that the adoption of a pre-trained model for CT-scan can further improve its classification output compared to models that do not use pre-trained models. On the other hand, researchers have also solely used cough datasets for the prediction of COVID-19. This is because patients suffering from the virus have a distinct way of coughing. After all, their lung structure has been altered [16] [17]. Authors in [18] used a Support Vector Machine (SVM) to classify cough sounds. An ensemble model has also been proposed by authors in [19]. The model consists of a CNN layer for feature extraction, and then another classification model. The authors went further to develop an application called "AI4COVID-19” where users can interface with their tool.
The papers reviewed above point to the fact that pre-trained models can potentially improve the output of COVID-19 classification. More recently, the use of multimodal deep learning models has been adopted to improve COVID-19 accuracy. For example, in [20], authors developed a multimodal system that uses X-ray and CT-scan images for classification. They went further to experiment with different transfer learning architectures such as the MobileNetV2 VGG16, and ResNET50 [20]. Similarly, authors in [21] used two pre-trained models, one for the CT scan and another for the X-ray. The outputs of these different deep learning layers are then fused to give an improved classification output. Many researchers have also combined datasets from different sources; for example, authors in [22] combined datasets of X-ray and cough for improved classification. Consequently, two models were developed, and then the outputs of these models were fused. In addition, their cost function gives more weight or relevance to the model with the least error [22].
Authors in [23] also used several pre-trained models for the detection of the virus in X-ray images as well as CT-scan images. From their experiment, it was established that VGG19 gave the best result in terms of classification accuracy. It was also established that X-ray images are more accurate in the detection of the virus compared to CT-scan images.
While COVID-19 detection with multimodal architectures exists, as discussed, to the best of our knowledge, no multimodal architectures take advantage of cough, X-ray, and CT scans together for the classification of the COVID-19 virus. In addition, no research has been carried out to investigate the relevance of pre-trained models on multimodal architecture using these three datasets. Our research therefore aims to fill this gap by researching the relevance of a multimodal system using three datasets in the classification of COVID-19 with or without a pre-trained model. In addition, we also explored the contribution of pre-trained models on unimodal systems for cough, X-ray, and CT-scan datasets.
Many researchers have exhausted using unimodal pre-trained models to improve the classification of COVID-19 via X-ray images, CT-scan, and cough, in addition, to using multimodal designs for different combinations such as X-ray and CT scan. No research has been done, from our knowledge, using multimodal designs that combine cough, CT-scan and X-rays. In addition, we investigate further the impact of the VGG19 pre-trained model on unimodal classifications such as for cough, CT-scan, and X-ray, and then the effect of the VGG19 on a multimodal design that leverages on three datasets – cough, X-ray and CT scan. Therefore, this research investigates the impact of pre-trained models (VGG19, ResNET, and MobileNetV2) on a multimodal system that combines three datasets of cough, X-ray and CT scan. This research is important in that it provides an in-depth analysis of how the combination of three datasets can be used to improve COVID-19 classification. In addition, it provides a comparative study of how selected pre-trained models can influence COVID-19 classification from the perspective of unimodal and multimodal systems. Furthermore, this research also provides a platform to look at medical diagnosis from the multimodal perspective as it may potentially improve classification. The motivation behind the combination of these datasets is hinged on the fact that COVID-19 patients usually exhibit these symptoms – lung abnormalities, and cough [24]. Lung abnormalities can be detected from X-ray images as well as CT scans. There are several advantages to the proposed model of using three datasets. One of them is the ability to harness complementary information - the sound from a cough could depict respiratory disease while images from X-rays and CT scans could reveal the structure of the lungs [25]. In addition, X-rays and CT-scan can also reveal the extent of damage to the lungs while the cough sounds might indicate early signs of COVID-19 [25]. In addition, there is the potential to increase sensitivity (correctly identifying persons with COVID-19) and specificity (correctly identifying persons without COVID-19) [25]. Lastly, data from one source might be unreliable for exams due to poor X-ray or CT-scan images [25].
2. Materials and Methods
This section discusses the architecture of the proposed model as well as the data preprocessing stages for the datasets used. Recall that we used three datasets: cough sound, X-ray, and CT scan. We therefore need to preprocess the data before passing it into the proposed multimodal architecture.
2.1. Data Pre-Processing
The first dataset is the cough dataset found in [26]. This dataset has audio that lasts up to 9 seconds, however, on average, each audio has approximately two seconds segment of cough. Therefore, we needed to extract this segment. To do this, each cough file is loaded using the PyTorch torch audio. Load () function. This function then reads the audio waveform (wf) as seen in Eq. (1).
In Eq. (1), wf is the cough waveform (wf). The next stage is resampling. If the sample rate of the audio is not at 16 kHz, we then resample (Eq. 2).
The conversion of the waveform to a mono channel is next (Eq 3). The conversion is necessary because, the critical information (cough) can be found in one channel, another advantage of using one channel is for noise reduction.
Next, the detection of the cough segment kicks in and it is then extracted. This is done by using the Short-Time Fourier Transform (STFT) [27]. The STFT breaks the cough waveform into small time windows that would enable signal change detection [27]. STFT converts the waveform from a time domain into the frequency domain (F) for each frame [27]. The next is to calculate the energy of each frame as seen in Eq. (4)
where squares the size or magnitude of the Short-Time Fourier Transform for each frame. In the next stage, we normalized the energy (Eq. 5).
The normalized energy ( is then analyzed based on a set threshold of 0.5. If an energy’s frame exceeds 0.5, the algorithm then selects the first two seconds of the waveform, effectively collecting the cough portion into.
We used the X-ray dataset found in [28], [29], [30] and [31] while for the CT scan, we used the dataset in [14]. The pre-processing for X-ray and CT-scan images is similar. Each image is opened using the PIL image. Open () function, and read as coloured images. The images are further resized into 224 by 224 – since some pre-trained models take images in this size. The preprocessing X-ray images are stored in while is for CT-scan.
2.2. Model Design
Figure 1 depicts the design of the multimodal system which has five layers, excluding the pre-processing layer. For C1 (which houses the first convolution layer for cough). We have the pre-pressed cough sound (X_audio) being fed into the model via block C1. This block takes the processed cough sounds as input as seen in the equation below. In Eqs. (6), (7), and (8) encapsulate the processes in block C1. In Eq. (7) p is the dropout value, set to 0.5.
For block C2, we have Eqs. (9), (10) where is the output from the previous layer while are the weights and biases of the block.
For X-ray pre-processed images, we have Eqs. (11), (12), (13), (14), (15), and (16) for blocks X1 and X2
For CT-scan images, we have the following Equations – (17), (18), (19), (20), (21), and (22).
For FC1, in Figure 1, we have Eq. (23). combines the outputs from C2, X2, and CT2, as seen in Eq. (24)
has 164,913408 trainable weights while has 164 trainable parameters. is the fully connected layer, as seen in Figure 1. The second fully connected layer is in Eq. (25). has 1164 trainable parameters while has 1 parameter. The output of this goes into a sigmoid activation in Eq. (26), and then the output is seen in Eqs. (27) and (28).
2.3. Training
For the training process, we used the Eq. (29). We trained for 30 epochs. The inputs to the proposed model go into the model at the same time. This means that a sample of positive COVID-19 cough, X-ray and CT scan goes into the model at once. This also goes for negative COVID-19. We used batch processing of 8 during the training process.
In Eq. 29, is the model parameter, while is the forward pass of the model. is the learning rate. Lastly) is the loss function.
Figure 2 provides the structure of the dataset for training, testing and validation.
2.4. Validation
At the end of each epoch, we validate the model, and if the loss value on the validation dataset is less than the previous epoch, the current training model is saved. For each batch, i of 8 data points (eight cough sounds, eight X-ray images, and eight CT-scan), do the following in Eqs (30) to (35):
- Initialize model’s best loss
- Forward pass
- Compute loss
- Compute accuracy
- We then calculate the total loss on the validation dataset for each epoch.
2.5. Unimodal Systems
To test the robustness of the multimodal design, we developed two different models for each dataset, one with a VGG19 pre-trained model (Figure 4) and another without a pre-trained model (Figure 3). We decided to concentrate on VGG19 as it is claimed in [21] that its performance outperforms other pre-trained models. For the unimodal system in Figure 3, for cough the T1 and T2 blocks replicate the C1 and C2 blocks in Figure 1. Also, for the unimodal system for X-ray T1 and T2 replicates the X1 and X2 blocks. The same goes for the CT-scan - CT1 and CT2 for T1 and T2. Same as FC1 and FC2.
In Figure 4, the pre-trained model is the VGG19. FC1 and FC2 reflect the same architecture as seen in Figure 1. The training, and testing validation of the unimodal systems follow the same process prescribed for the multimodal systems, earlier. Except that the combination of datasets is not implemented.
2.6. Multimodal Pre-Trained Systems
Furthermore, we also developed a multimodal pre-trained model. We experimented on three pre-trained models – they are the VGG19, ResNET and MobileNetV2. We used these models as they are popular pre-trained models that have been used in the literature.
3. Evaluation
For the evaluation of the proposed multimodal system, we passed samples of the test dataset in batches of 8. Each data sample contains a collection of Cough C, X-ray X, and CT-scan CT (C, X, CT). This input is then fed into the model to produce a prediction = . Here, M reflects the trained model. This evaluation is also carried out on the multimodal system equipped with pre-trained models, and also the unimodal system with or without pre-trained models. The following evaluation metrics are used (Eqs 36-40). Where TP is the true positive, TN is the true negative, FP is the false positive and FN is the true negative.
4. Results
The results highlight several key insights into the use of deep learning models. First for the unimodal systems for cough, X-ray, and CT-scan. The result from Table 1 shows the accuracy score as well as the F1-score of the unimodal system for cough. Looking at the graphs of the unimodal and pre-trained unimodal in Figure 6 and Figure 7, it is observed that the cough with a pre-trained model improves the validation loss, as against the graph in Figure 6 without a pre-trained model. It therefore means that the traditional deep learning model cannot learn the dataset patterns, hence the poor outcome. In Table 2, there is an improved performance on the accuracy and the F1-score. This shows the importance of transfer learning on the cough dataset to deliver an improved outcome. The architectural complexity of the VGG-19 might have assisted in delivering an improved outcome.
The same outcome is also recorded for unimodal deep learning system for X-ray, Table 3 and Table 4, Figure 8 and Figure 9. The pre-trained model for the VGG-19 outperformed the traditional CNN deep learning model (Table 3 and Table 4). It can also be observed that the over-fitting is minimized as the training loss curve and the validation loss curve are relatively close.
However, this is not the case for the CT scan. The traditional unimodal deep learning model outperformed the pre-trained unimodal for CT-scan (Table 5 and Table 6). An explanation to this could be that the images learned from the pre-trained model may not be useful in the CT-scan scenario. Even though the pre-trained model and the traditional model attempt to solve the over-fitting problem encountered during the training phase (Figure 10 and Figure 11).
Moving on to multimodal systems (Table 7, Table 8, Table 9 and Table 10), it is observed that the model that leveraged on a pre-trained model and that without a pre-trained model have the same accuracy value of 98% (Table 7 vs Table 8). However, using the F1-score, the non-pre-trained model outperformed the pre-trained model. An explanation for this could be that since the multimodal system has learned from three different datasets, it has aggregated complementary information from different datasets. As a result, it is possible to learn the unique attributes from these datasets to deliver an improved COVID-19 classification model. We also extended the experiment to two additional pre-trained models (ResNET and Mobilenetv2), in Table 9 and Table 10 however, they could not outperform the multimodal system developed without the pre-trained model.
Using the F1-score it is also true that the non-pre-trained multimodal performs better than the unimodal CT scan proposed by [14] which gave an F1-score of 0.9731. The multimodal system, that we proposed, is enriched by learning from three diverse datasets. In addition, analyzing the training graphs (Figure 12 and Figure 13) shows that the non-pre-trained multimodal system (Figure 12) exhibits less overfitting compared to the VGG19-based pre-trained multimodal.
5. Discussion
The results highlight several key insights into the use of deep learning models. First for the unimodal systems for cough, X-ray, and CT-scan. The result from Table 1 shows the accuracy score as well as the F1-score of the unimodal system for cough. In Table 2, there is an improved performance on the accuracy and the F1-score. This shows the importance of transfer learning on the cough dataset to deliver an improved outcome. The same outcome is also recorded for unimodal deep learning systems for X-rays. The pre-trained model for the VGG19 outperformed the traditional CNN deep learning model (Table 3 and Table 4). However, this is not the case for the CT scan. The unimodal deep learning model outperformed the pre-trained unimodal for CT-scan (Table 6 and Table 6). An explanation for this could be that the images learned from the pre-trained model may not be useful in the CT-scan scenario.
Moving on to multimodal systems, it is observed that models that leveraged on pre-trained model and that without pre-trained model are close - regarding the F1-score. Using the F1-score, the model without the pre-trained model outperformed the pre-trained model. An explanation to this could be that since the multimodal system has learned from three different datasets, aggregating complementary information from different datasets. As a result, there is a high possibility that it would have learned the unique attributes from these datasets to deliver an improved COVID-19 model. We also extended the experiment to two additional pre-trained models (ResNET and Mobilenetv2) in Table 9 and Table 10, however, they could not outperform the multimodal system developed without the pre-trained model.
The multimodal system is enriched by learning from three diverse datasets. From Figure 13, we can observe that the multimodal system with a pre-trained model over-fits. This also shows that VGG19 pre-trained model was just learning almost completely from its own training dataset, and not learning from the new dataset. This contrasts with the non-pre-trained multimodal model (Figure 12).
6. Conclusion
This study developed a multimodal deep learning system for classifying COVID-19 through three datasets – cough, X-ray and CT scan. Using a pre-trained model such as ResNet, VGG19, and MobileNetV2, the results show that a multimodal system that combines these datasets could deliver an impressive performance without any pre-trained models. This is possible as the multimodal system has learned sufficiently from different heterogeneous datasets, making it robust enough to perform well without a pre-trained model. However, this is not the case for unimodal models developed for cough and X-ray – it was found that their pre-trained models outperformed their unimodal deep learning models. An explanation for this could be that the images learnt from VGG19 are indeed useful for the training process. On the flip side, this was not the case for the unimodal deep learning model developed for the CT scan. It was discovered that the pre-trained model did not outperform the non-pre-trained unimodal deep learning model for the CT scan. An explanation for this could be that the images learned from the pre-trained model might not be useful for the CT scan. The results conclude that the non-pre-trained multimodal system had an F1-score of 0.9804 while that of a pre-trained model had 0.98.
This research points to the need to investigate the characteristics of datasets before engaging in transfer learning from pre-trained models. While pre-trained models might be useful for tasks such as unimodal COVID-19 classification for cough and x-tray, they might be counterintuitive for unimodal CT-scan and multimodal COVID-19 classification.
Author Contributions
Conceptualization, K.O., E.E. and M. C.; methodology, K.O., E.E. and M. C.; software, K.O., E.E..; validation, K.O., E.E. and M. C.; formal analysis, K.O., E.E..; investigation, K.O., E.E. and M. C.; resources, E.E. and M. C.; data curation, K.O., E.E. and M. C.; writing— K.O., E.E.; writing—review and editing, E.E. and M. C.; visualization, K.O., E.E. and M. C.; supervision, E.E. and M. C.; project administration, M. C.; funding acquisition, E.E. and M. C. All authors have read and agreed to the published version of the manuscript.
Funding
This work was partly supported by the University of South Africa, College of Accounting Science
Informed Consent Statement
Not applicable – This study used publicly available dataset.
Data-Availability-Statement
Acknowledgments
We acknowledge the University of South Africa College of graduate Studies and the College of Accounting Science.
Conflicts of Interest
The authors declare no conflicts of interest.
References
- B. Hu, H. Guo, P. Zhou, and Z.-L. Shi,, "Characteristics of SARS-CoV-2 and COVID-19," Nature Reviews Microbiology, vol. 19, no. 3, pp. 141-154, 2021.
- Y. J. Chen, W. H. Jian, Z. Y. Liang, W. J. Guan, W. H. Liang, R. C. Chen, C. L. Tang, T. Wang, H. R. Liang, Y. M. Li, X. Q. Liu, L. Sang, L. L. Cheng, F. Ye, S. Y. Li, N. F. Zhang, Z. Zhang, Y. Fang, J. X. He, N. S. Zhong, and J. P. Zheng, "Earlier diagnosis improves COVID-19 prognosis: a nationwide retrospective cohort analysis,," Ann. Transl. Med, vol. 9, no. 11, p. 941, 2021. [CrossRef]
- L. J. Layfield, S. Camp, K. Bowers, and D. C. Miller,, "SARS-CoV-2 detection by reverse transcriptase polymerase chain reaction testing: Analysis of false positive results and recommendations for quality control measures," Pathology - Research and Practice, vol. 225, p. 153579, 2021.
- M. Teymouri, S. Mollazadeh, H. Mortazavi, Z. N. Ghale-Noie, V. Keyvani, F. Aghababaei, M. R. Hamblin, G. Abbaszadeh-Goudarzi, H. Pourghadamyari, S. M. R. Hashemian, and H. Mirzaei, , "Recent advances and challenges of RT-PCR tests for the diagnosis of COVID19," athology - Research and Practice, vol. 221, p. 153443, 2021. [CrossRef]
- ". E. M. F. El Houby, "COVID-19 detection from chest X-ray images using transfer learning," Scientific Reports, , vol. 14, p. 11639, 2024. [CrossRef]
- R. Fusco, R. Grassi, V. Granata, S. V. Setola, F. Grassi, D. Cozzi, B. Pecori, F. Izzo, and A. Petrillo, , "Artificial Intelligence and COVID-19 Using Chest CT Scan and Chest X-ray Images: Machine Learning and Deep Learning Approaches for Diagnosis and Treatment," J. Pers. Med, vol. 11, no. 10, p. 993, 2021. [CrossRef]
- M. Melek, "Diagnosis of COVID-19 and non-COVID-19 patients by classifying only a single cough sound,," Neural Comput. Appl., vol. 33, no. 24, p. 17621–17632, 2021. [CrossRef]
- K. Nguyen-Trong and K. Nguyen-Hoang, "Multi-modal Approach for COVID-19 Detection Using Coughs and Self-reported Symptoms," Journal of Intelligent & Fuzzy Systems, vol. 44, no. 3, p. 3501 – 3513, 2023. [CrossRef]
- M. Constantinou, T. Exarchos, A. G. Vrahatis, and P. Vlamos, "COVID-19 classification on chest X-ray images using deep learning methods," Int. J. Environ. Res. Public Health, vol. 20, no. 3, p. 2035, 2023. [CrossRef]
- Z. Li et al.,, "COVID19-ResCapsNet: A novel residual capsule network for COVID-19 detection from chest X-ray scans images," IEEE Access,, vol. 11, pp. 52923-52937, 2023. [CrossRef]
- M. Nahiduzzaman et al, " A novel method for multivariant pneumonia classification based on hybrid CNN-PCA based feature extraction using extreme learning machine with CXR images," IEEE Access, vol. 9, pp. 147512-147526, 2021. [CrossRef]
- U. Haruna, R. Ali, and M. Man, , "A new modification CNN using VGG19 and ResNet50V2 for classification of COVID-19 from X-ray radiograph images," Indonesian Journal of Electrical Engineering and Computer Science, vol. 31, no. 1, pp. 369-377, 2023. [CrossRef]
- K. K. Mohbey, S. Sharma, S. Kumar, and M. Sharma,, "COVID-19 identification and analysis using CT scan images: Deep transfer learning-based approach," Blockchain Applications for Healthcare Informatics, p. 447–470, 2022.
- P. Angelov and E. Soares, , "Towards explainable deep neural networks (xDNN)," Neural Networks, , vol. 130, p. 185–194, 2020. [CrossRef]
- W. Zhao, W. Jiang, and X. Qiu, "Deep learning for COVID-19 detection based on CT images," Scientific Reports, vol. 11, no. 1, p. 14353, 2021. [CrossRef]
- R. Han, L. Huang, H. Jiang, J. Dong, H. Peng, and D. Zhang,, " Early clinical and CT manifestations of coronavirus disease 2019 (COVID-19) pneumonia," American Journal of Roentgenology, vol. 215, no. 2, pp. 338-343, 2020. [CrossRef]
- W. H. Organization, "Clinical management of severe acute respiratory infection (SARI) when COVID-19 disease is suspected: interim guidance," Tech. Rep, 2020.
- J. Han, C. Brown, J. Chauhan, A. Grammenos, A. Hasthanasombat, D. Spathis, T. Xia, P. Cicuta, and C. Mascolo, , "Exploring automatic COVID-19 diagnosis via voice and symptoms from crowdsourced data," in EEE International Conference on Acoustics, Speech and Signal Processing (ICASSP), 2021, pp. 8328-8332.
- I. A. Imran, I. Posokhova, H. N. Qureshi, U. Masood, M. S. Riaz, K. Ali, C. N. John, M. I. Hussain, and M. Nabeel,, " AI4COVID-19: AI enabled preliminary diagnosis for COVID-19 from cough samples via an app.," Informatics in Medicine Unlocked, vol. 20, no. 10, p. 100378, 2020. [CrossRef]
- N. Nasir, A. Kansal, F. Barneih, O. Al-Shaltone, T. Bonny, M. Al-Shabi, and A. Al Shammaa, "Multi-modal image classification of COVID-19 cases using computed tomography and X-rays scans," Intelligent Systems with Applications, vol. 15, p. 200160, 2023. [CrossRef]
- N. Hilmizen, A. Bustamam, and D. Sarwinda, "The Multimodal Deep Learning for Diagnosing COVID-19 Pneumonia from Chest CT-Scan and X-Ray Images," in 3rd International Seminar on Research of Information Technology and Intelligent Systems (ISRITI),, Yogyakarta, Indonesia,, 2020.
- S. Kumar, M. K. Chaube, S. H. Alsamhi, S. K. Gupta, M. Guizani, R. Gravina, and G. Fortino, , "A novel multimodal fusion framework for early diagnosis and accurate classification of COVID-19 patients using X-ray images and speech signal processing techniques," Comput. Methods Programs Biomed, vol. 226, p. 107109, 2022. [CrossRef]
- S. E. Mukhi, R. T. Varshini, and S. E. F. Sherley,, " Diagnosis of COVID-19 from Multimodal Imaging Data Using Optimized Deep Learning Techniques," SN Comput. Sci.,, vol. 4, p. 212, 2023.
- E. Jangam, A. A. D. Barreto, and C. S. R. Annavarapu, "E. Jangam, A. A. D. Barreto, and C. S. R. Annavarapu, "Automatic detection of COVID-19 from chest Automatic detection of COVID-19 from chest CT scan and chest X-Rays images using deep learning, transfer learning and stacking," Appl. Intell.,, vol. 52, p. 2243–2259, 2022.
- C. Mahanty et al, "A Comprehensive Review on COVID-19 Detection Based on Cough Sounds, Symptoms, CXR, and CT Images," IEEE Access, vol. 12, pp. 75412-75425, 2024.
- A. M. V. D. Andrew, "COVID-19 Cough Audio Classification," Kaggle, 2020 . [Online]. Available: https://www.kaggle.com/datasets/andrewmvd/covid19-cough-audio-classification/discussion?sort=hotness. [Accessed 12 July 2024].
- D. Griffin and J. Lim, "Signal Estimation from Modified Short-Time Fourier Transform," IEEE Transactions on Acoustics, Speech, and Signal Processing,, vol. 32, no. 2, pp. 236-243,, 1984. [CrossRef]
- P. Prashant, "Chest X-ray Images (COVID-19, Pneumonia)," 2020. [Online]. Available: https://www.kaggle.com/datasets/prashant268/chest-xray-covid19-pneumonia. [Accessed 20 July 2024].
- J. P. Cohen, P. Morrison, L. Dao, K. Roth, T. Q. Duong, and M. Ghassemi, "COVID-19 Image Data Collection: Prospective Predictions Are the Future," 2020. [Online]. Available: https://github.com/ieee8023/covid-chestxray-dataset.. [Accessed 12 July 2024]. [CrossRef]
- A. G. Chung, "Figure 1 COVID Chest X-ray Dataset," 2020. [Online]. Available: https://github.com/agchung/Figure1-COVID-chestxray-dataset. [Accessed 12 July 2024].
- J. Tiptj, "Chest X-ray Pneumonia COVID-19 Tuberculosis Dataset," 2020. [Online]. Available: https://www.kaggle.com/datasets/jtiptj/chest-xray-pneumoniacovid19tuberculosis. [Accessed 12 July 2024].
Figure 1.
Proposed multimodal architecture.
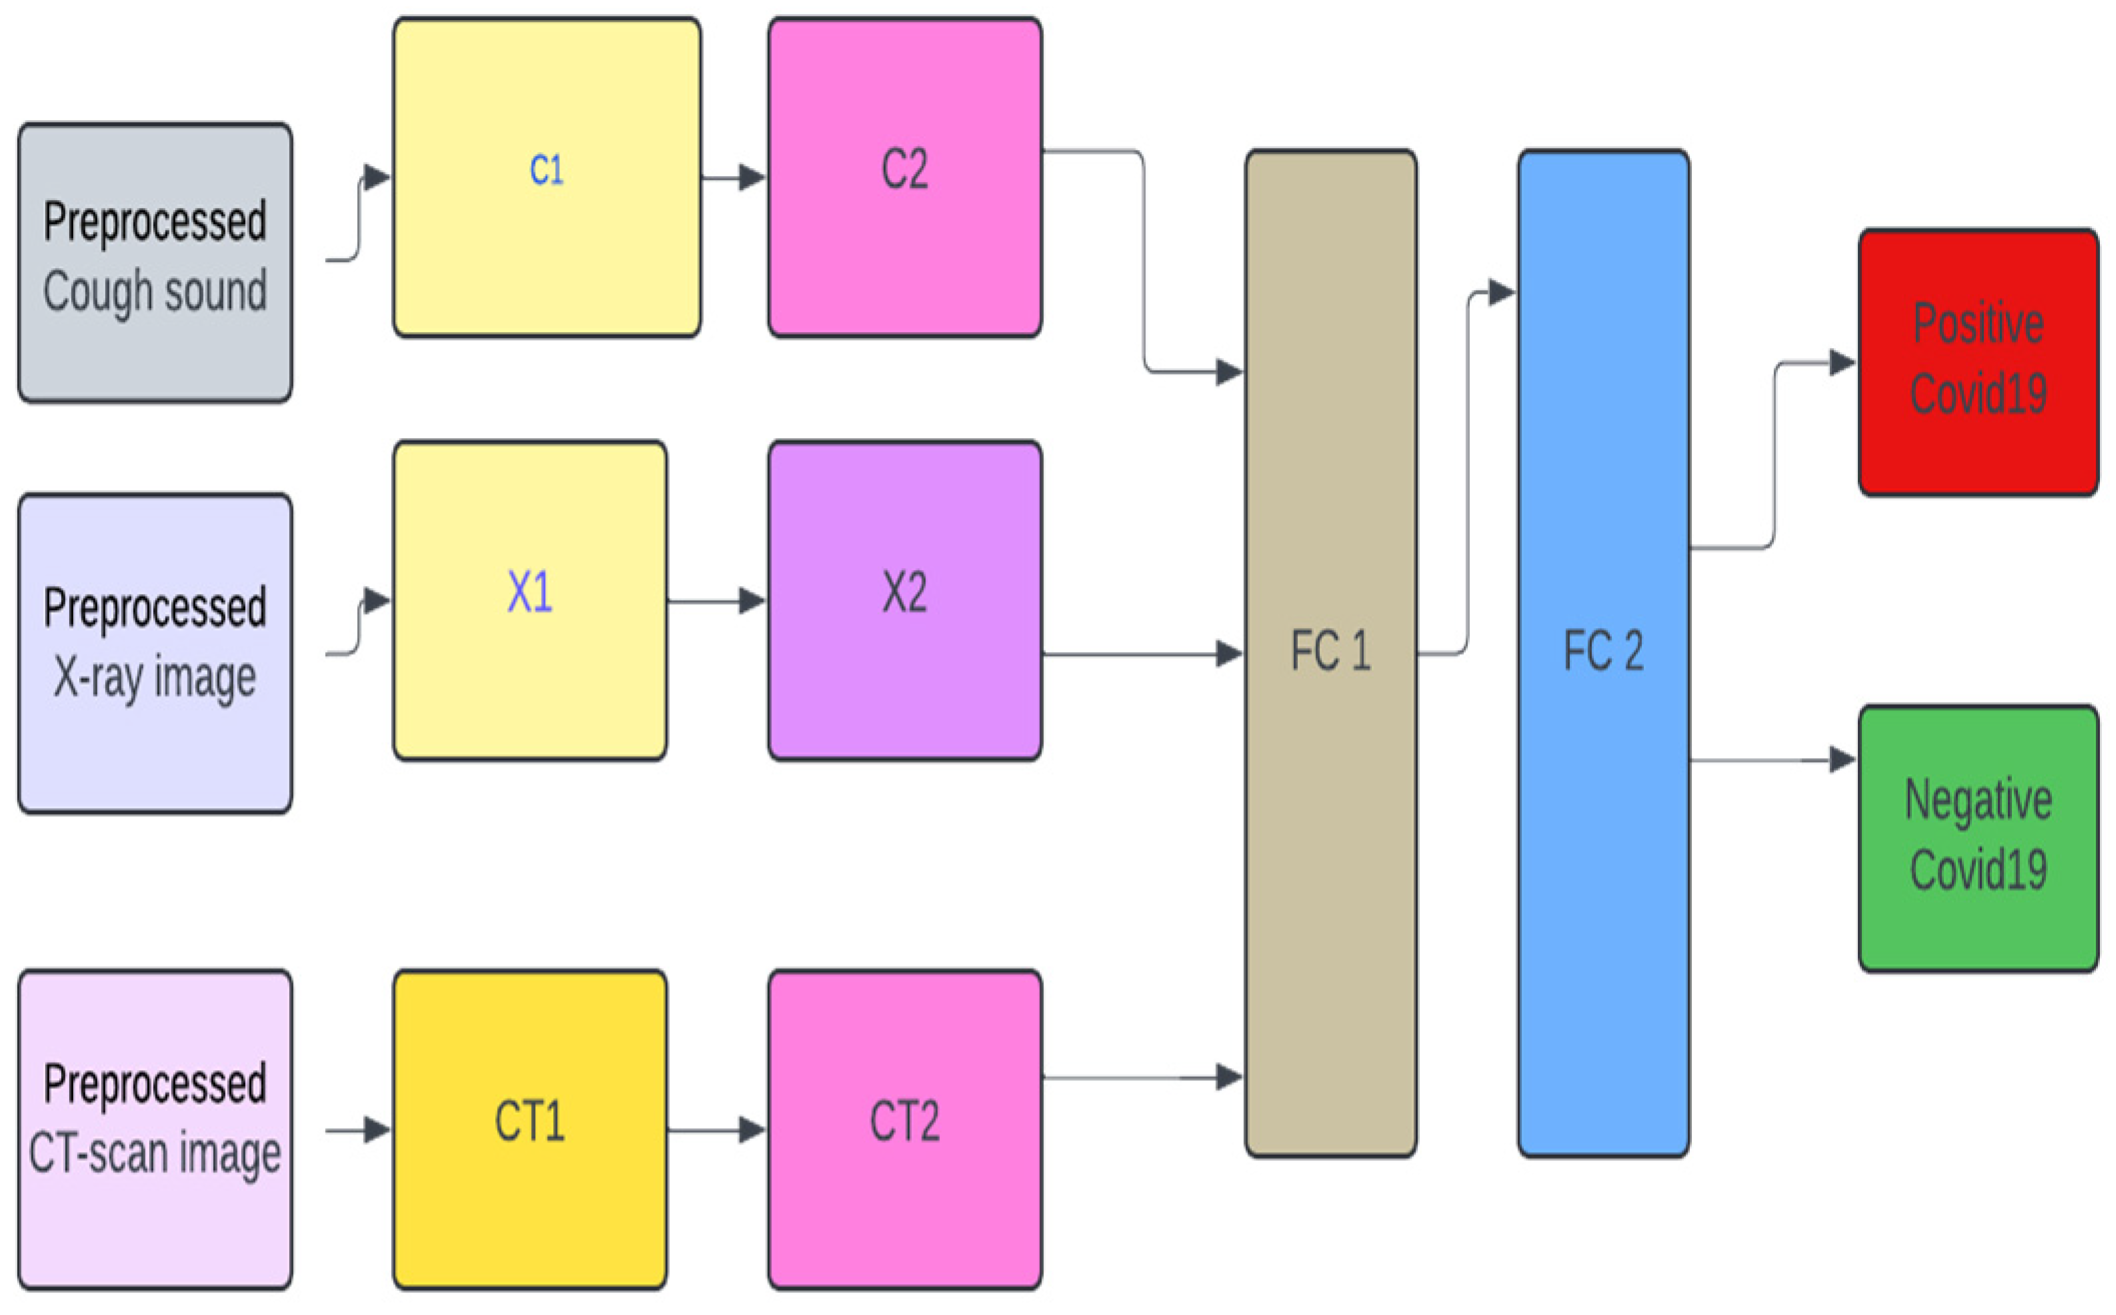
Figure 2.
Training, testing and validation configuration.
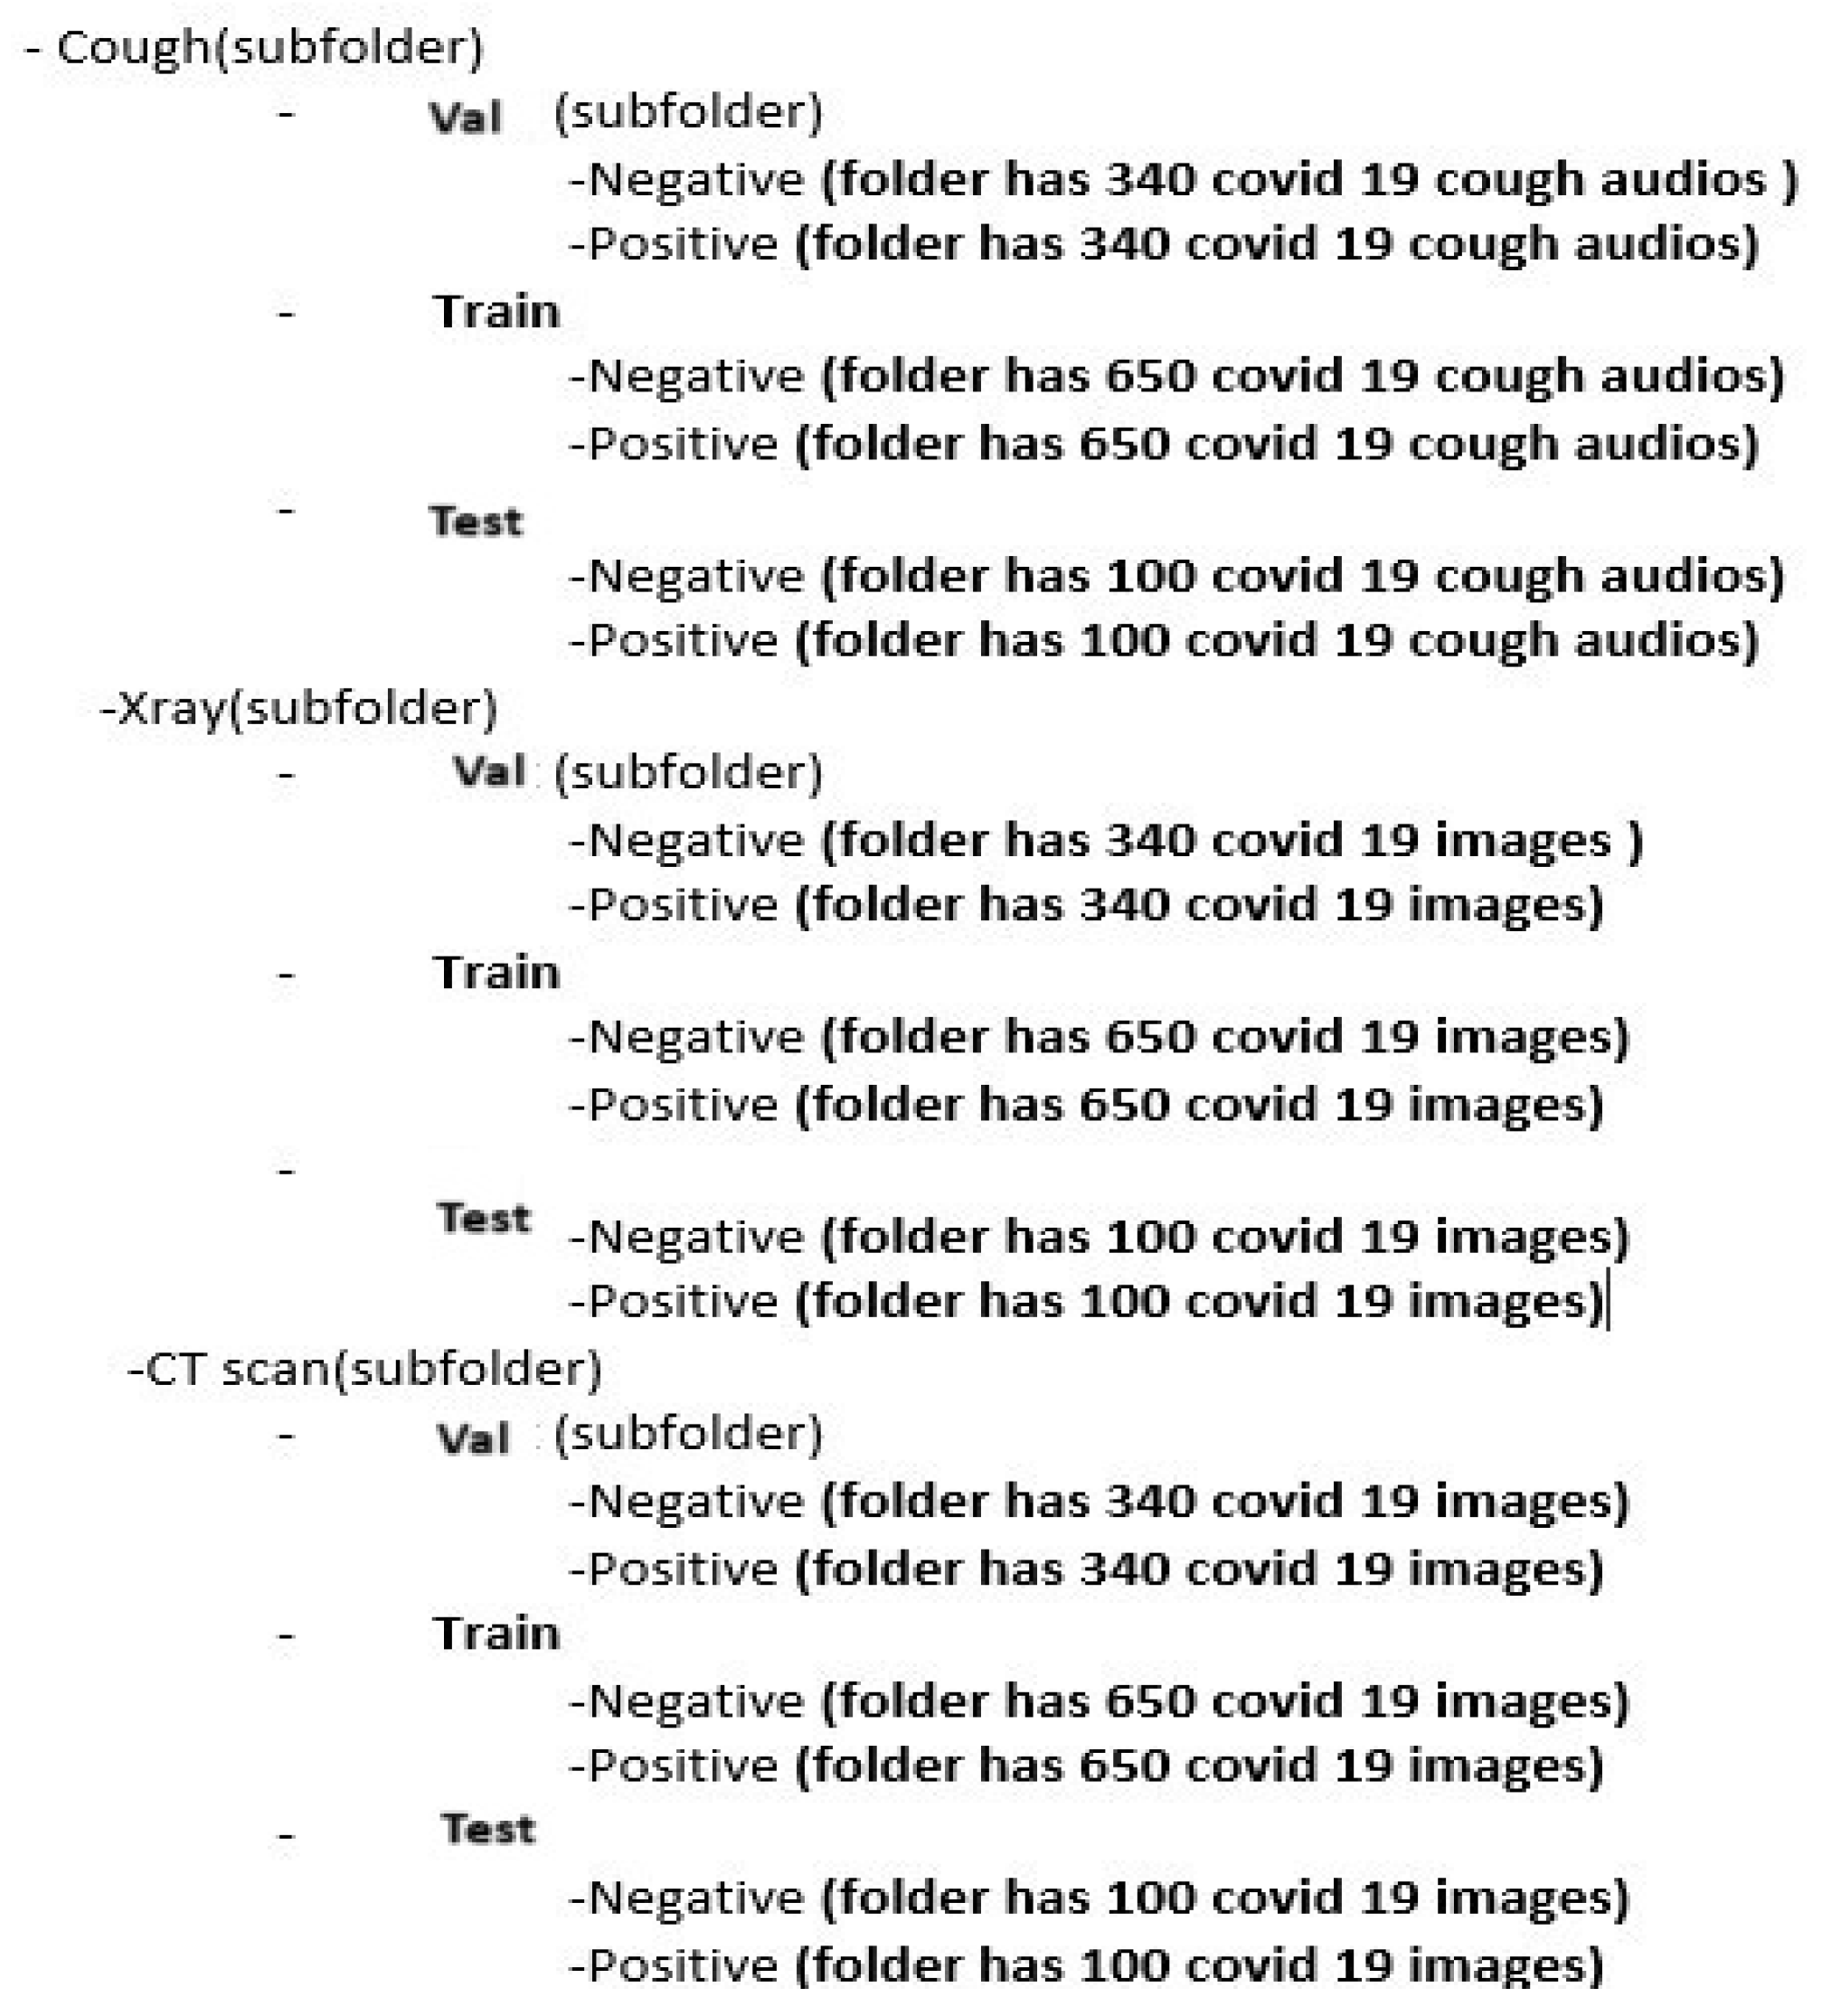
Figure 3.
Unimodal architecture used for Cough, X-ray, and CT-scan for COVID-19 classification.
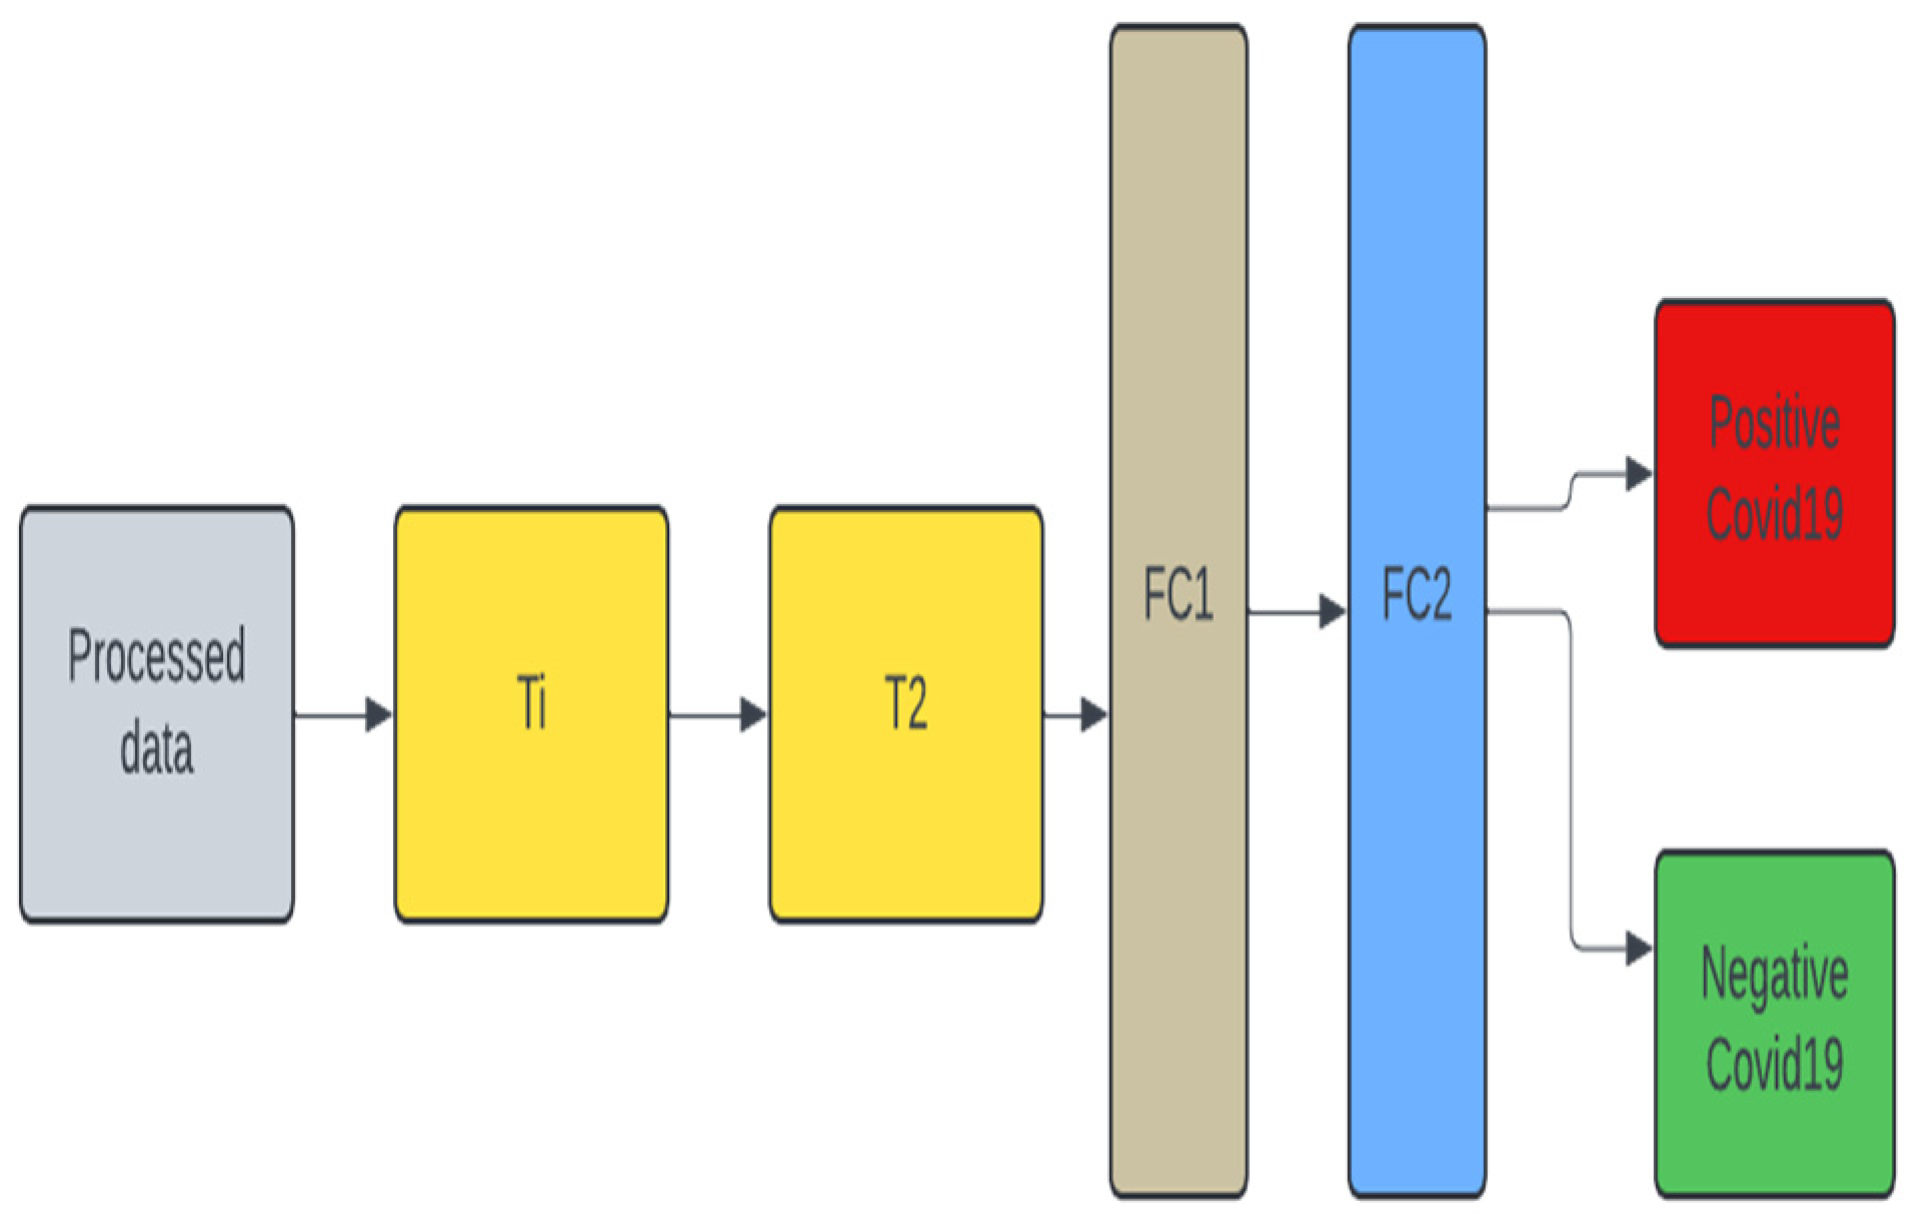
Figure 4.
Unimodal architecture with Pre-trained model (VGG19) used for Cough, X-ray, and CT-scan for COVID-19 classification.
Figure 4.
Unimodal architecture with Pre-trained model (VGG19) used for Cough, X-ray, and CT-scan for COVID-19 classification.

Figure 5.
Multimodal architecture with Pre-trained model (VGG19) used for Cough, X-ray, and CT-scan for COVID-19 classification.
Figure 5.
Multimodal architecture with Pre-trained model (VGG19) used for Cough, X-ray, and CT-scan for COVID-19 classification.
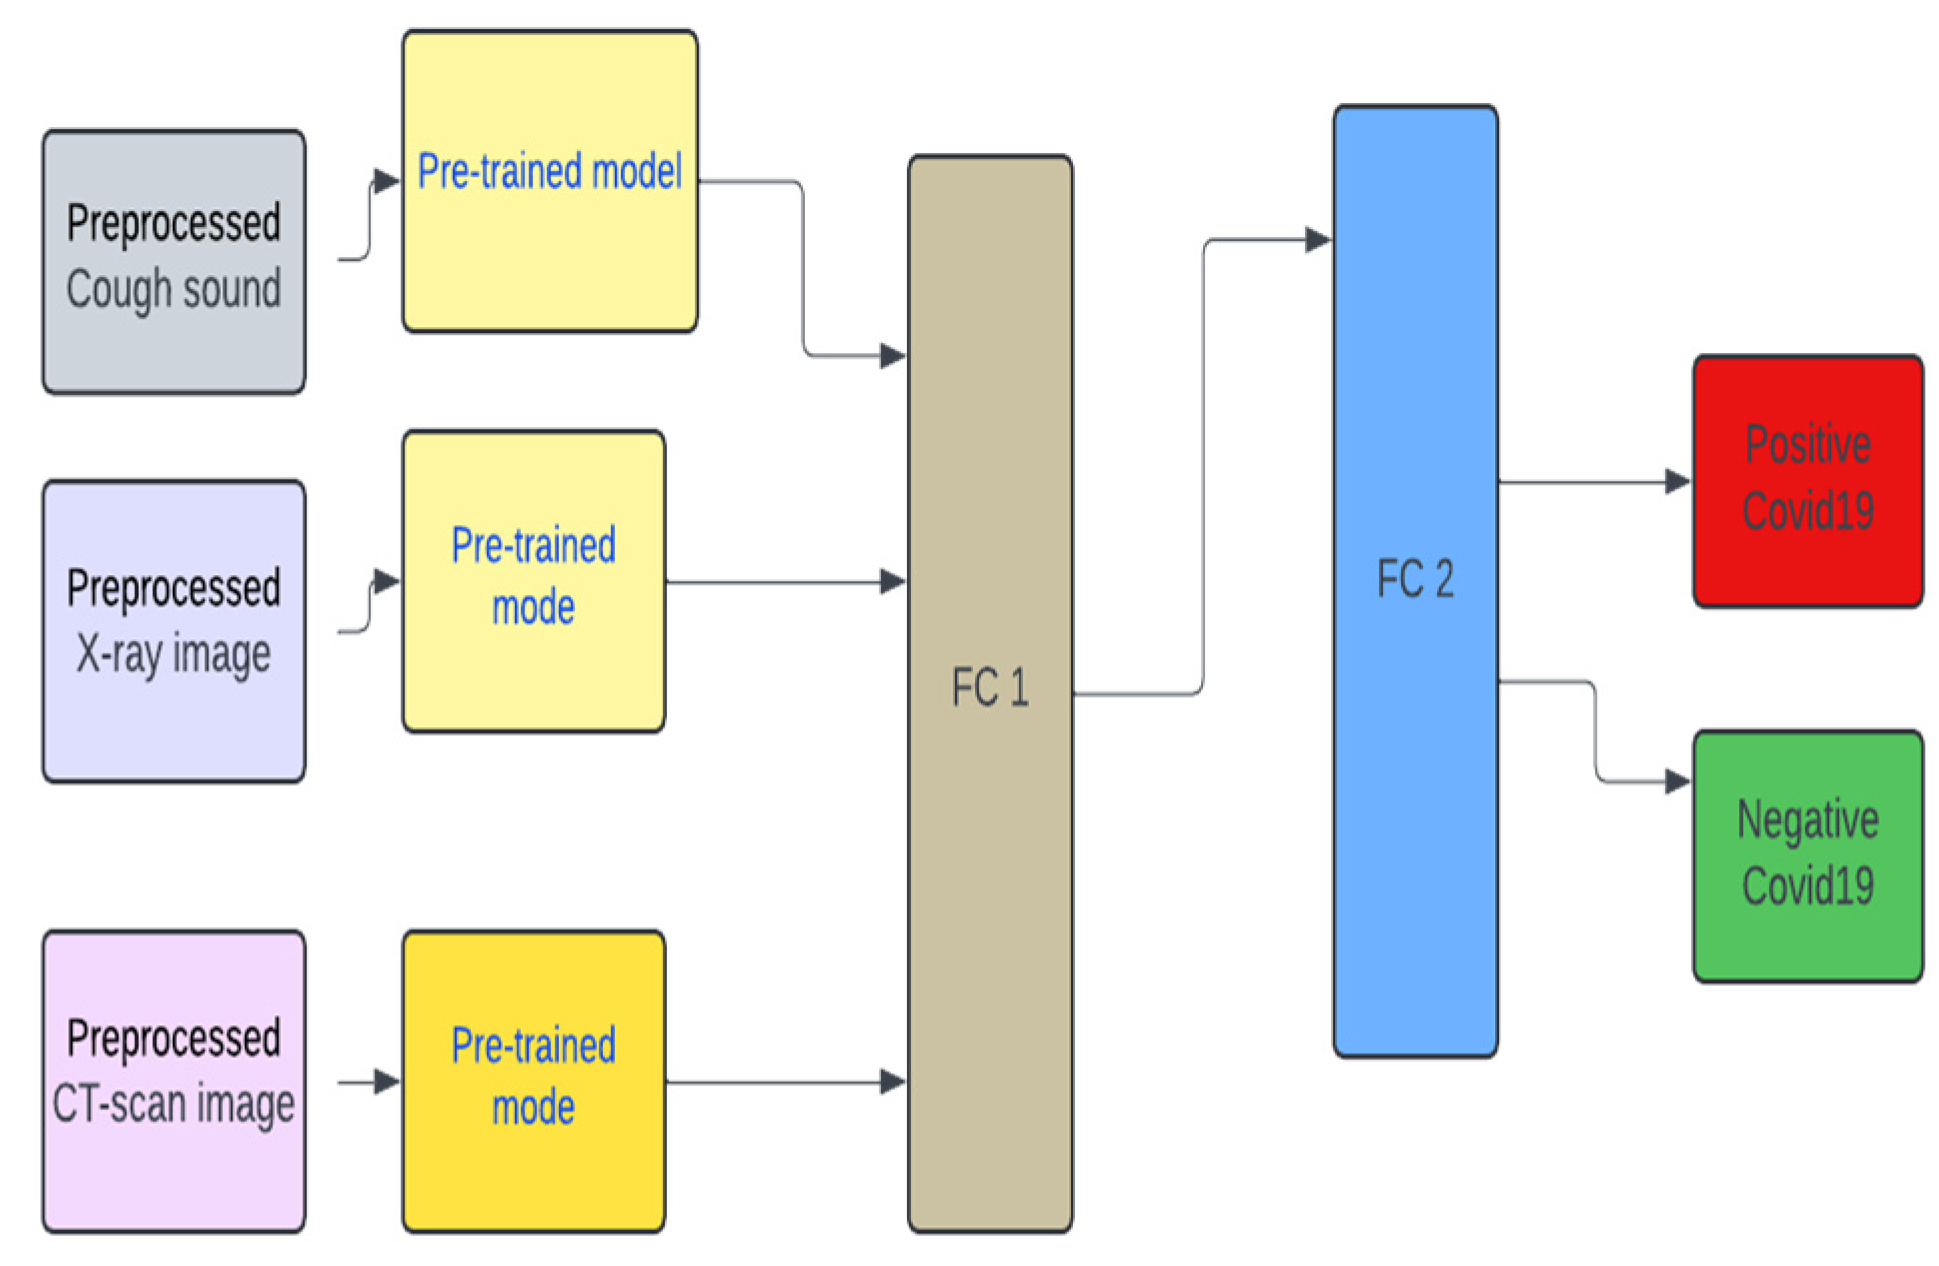
Figure 6.
Unimodal COVID-19 cough classification- training loss vs validation loss.
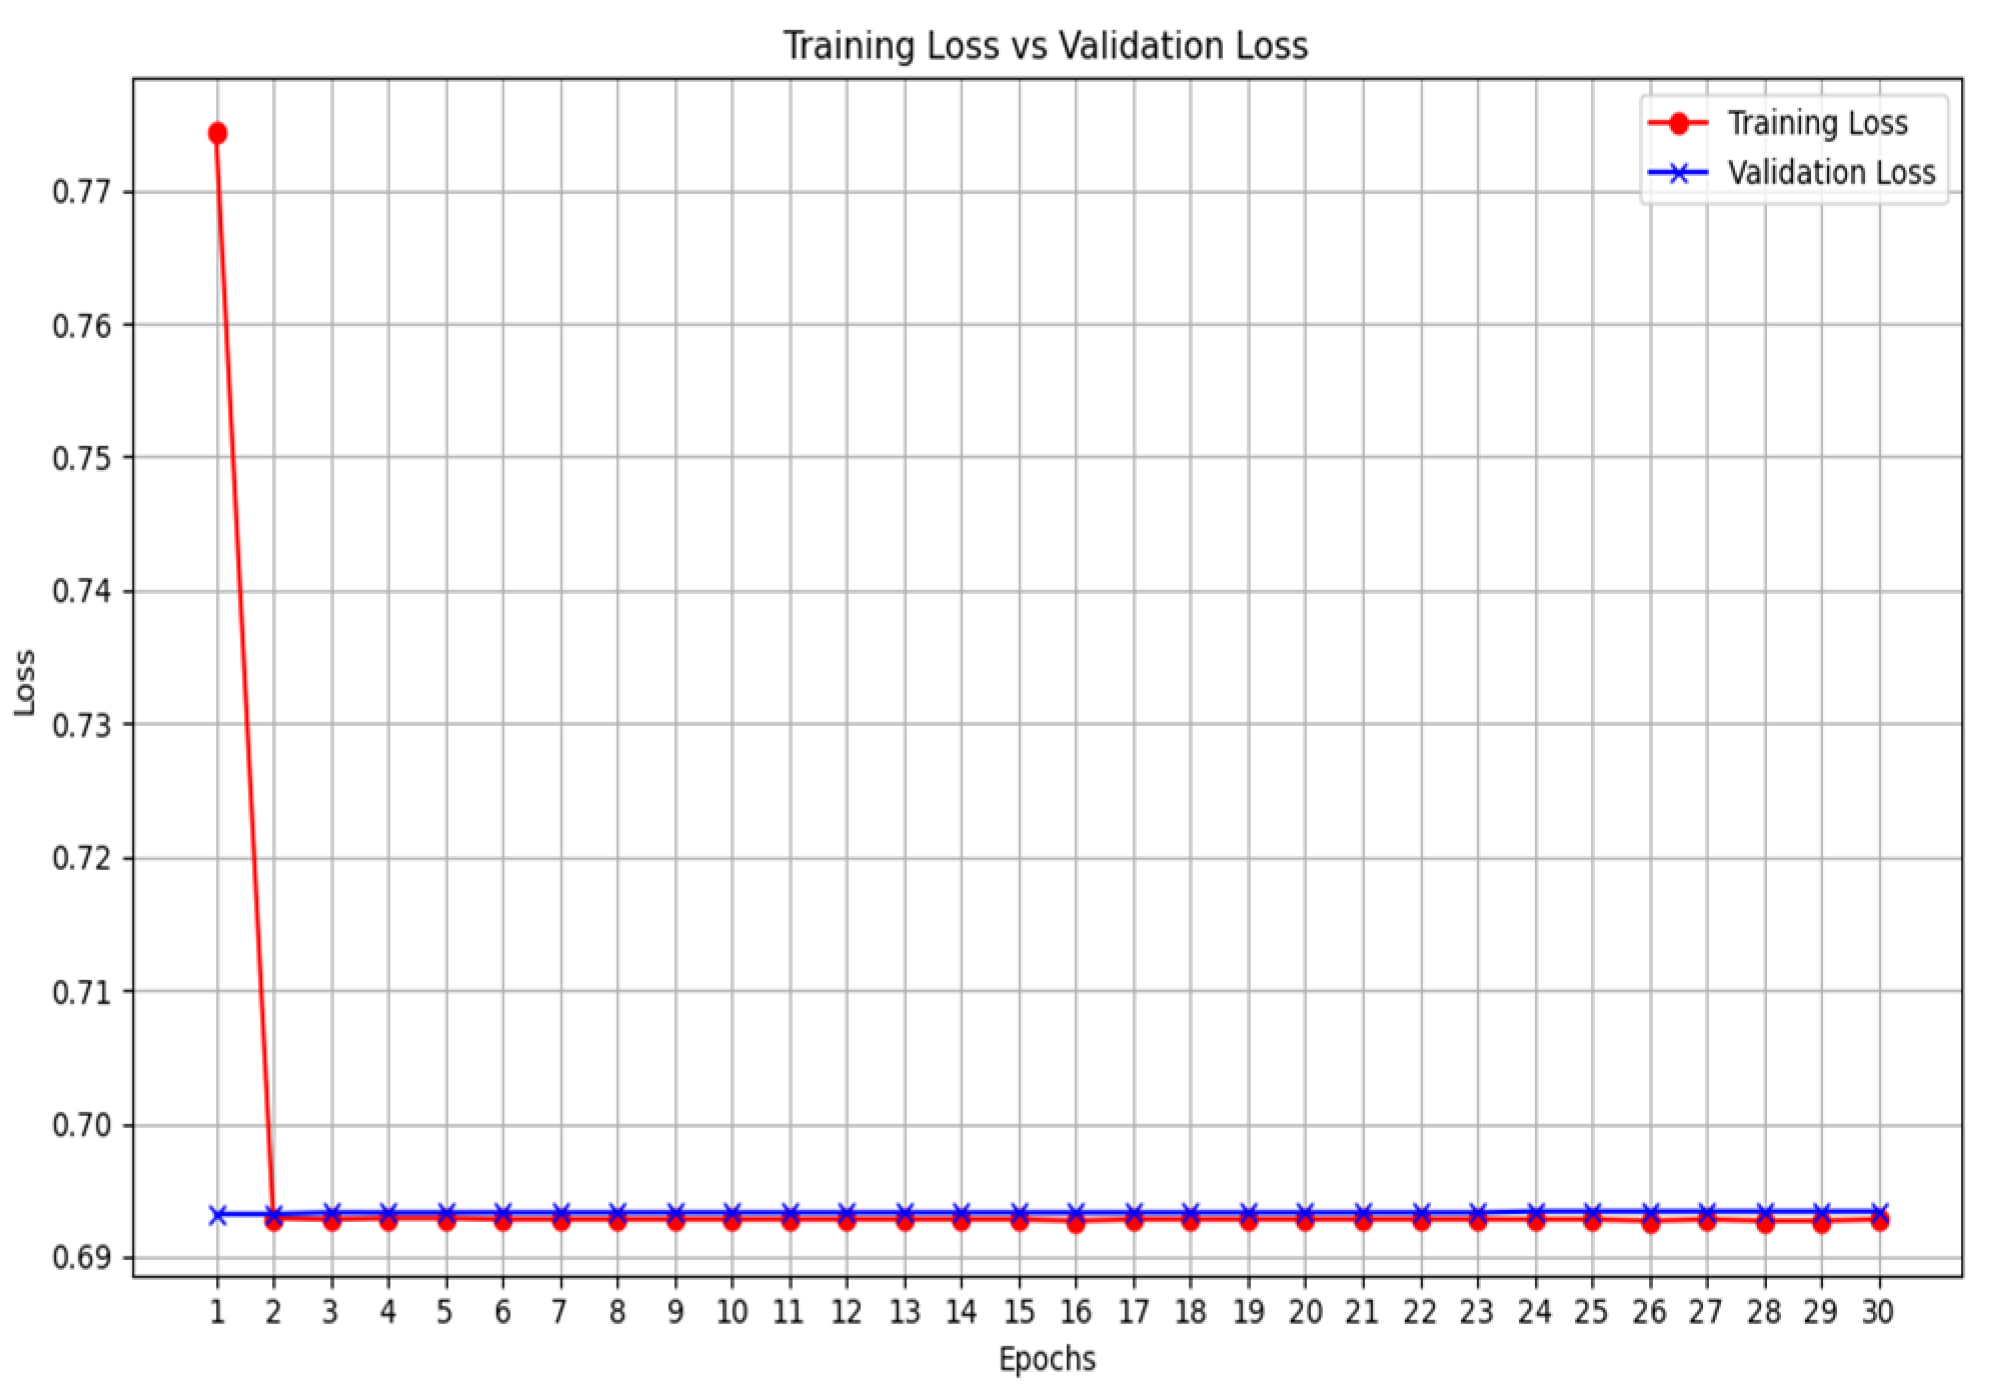
Figure 7.
Unimodal COVID-19 cough classification with VGG19 - training loss vs validation loss.
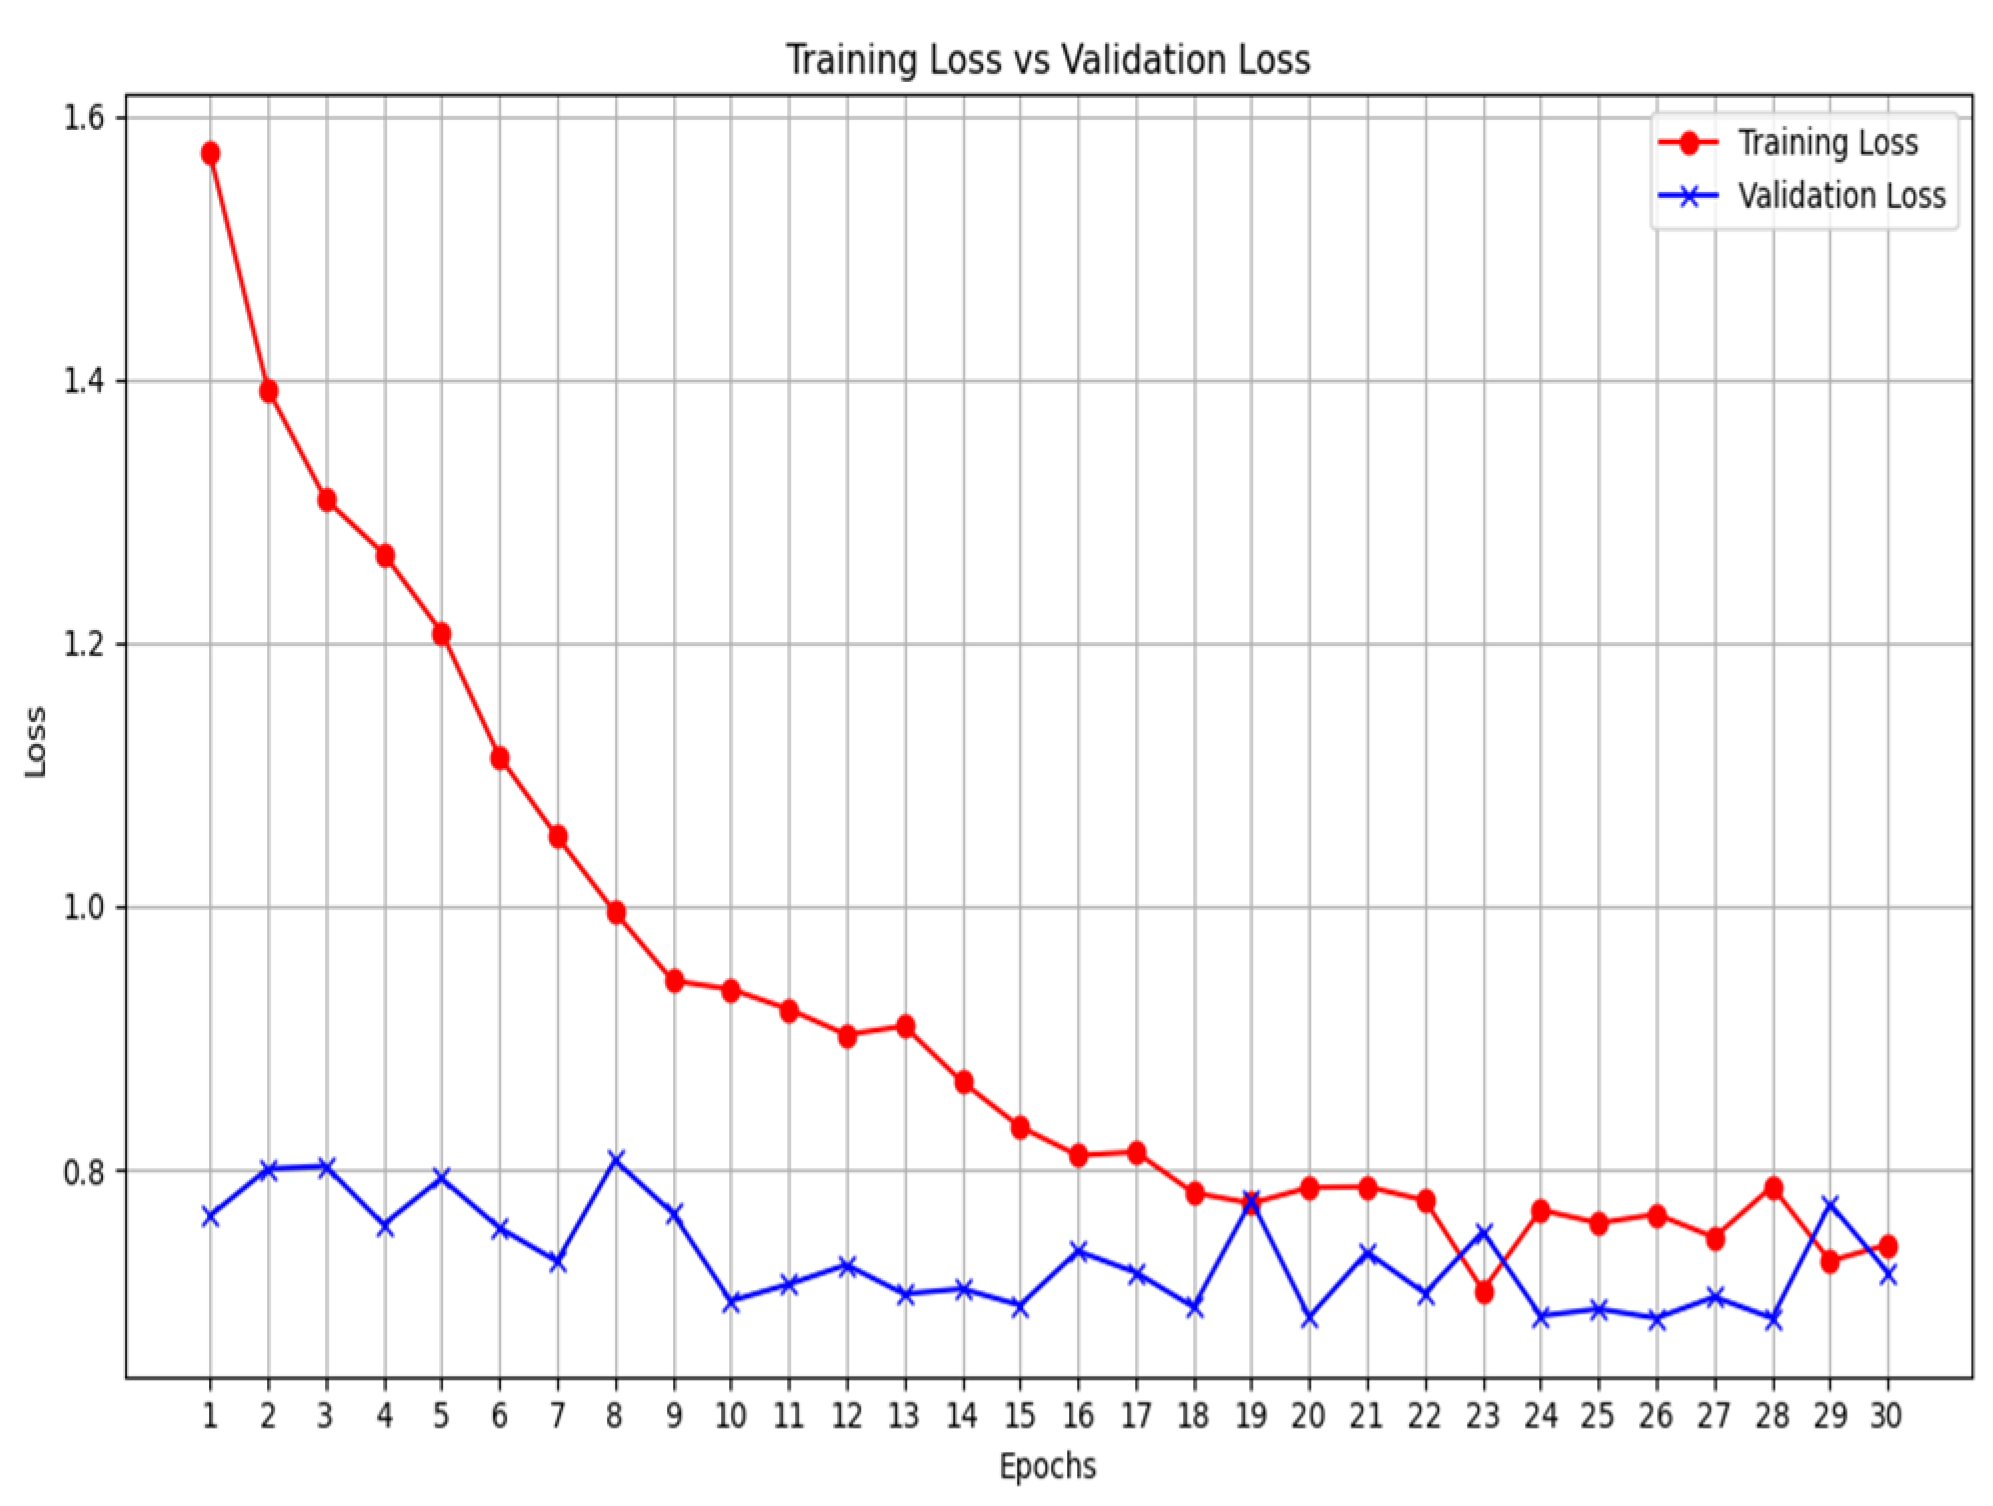
Figure 8.
Unimodal COVID-19 X-ray classification - training loss vs validation loss.
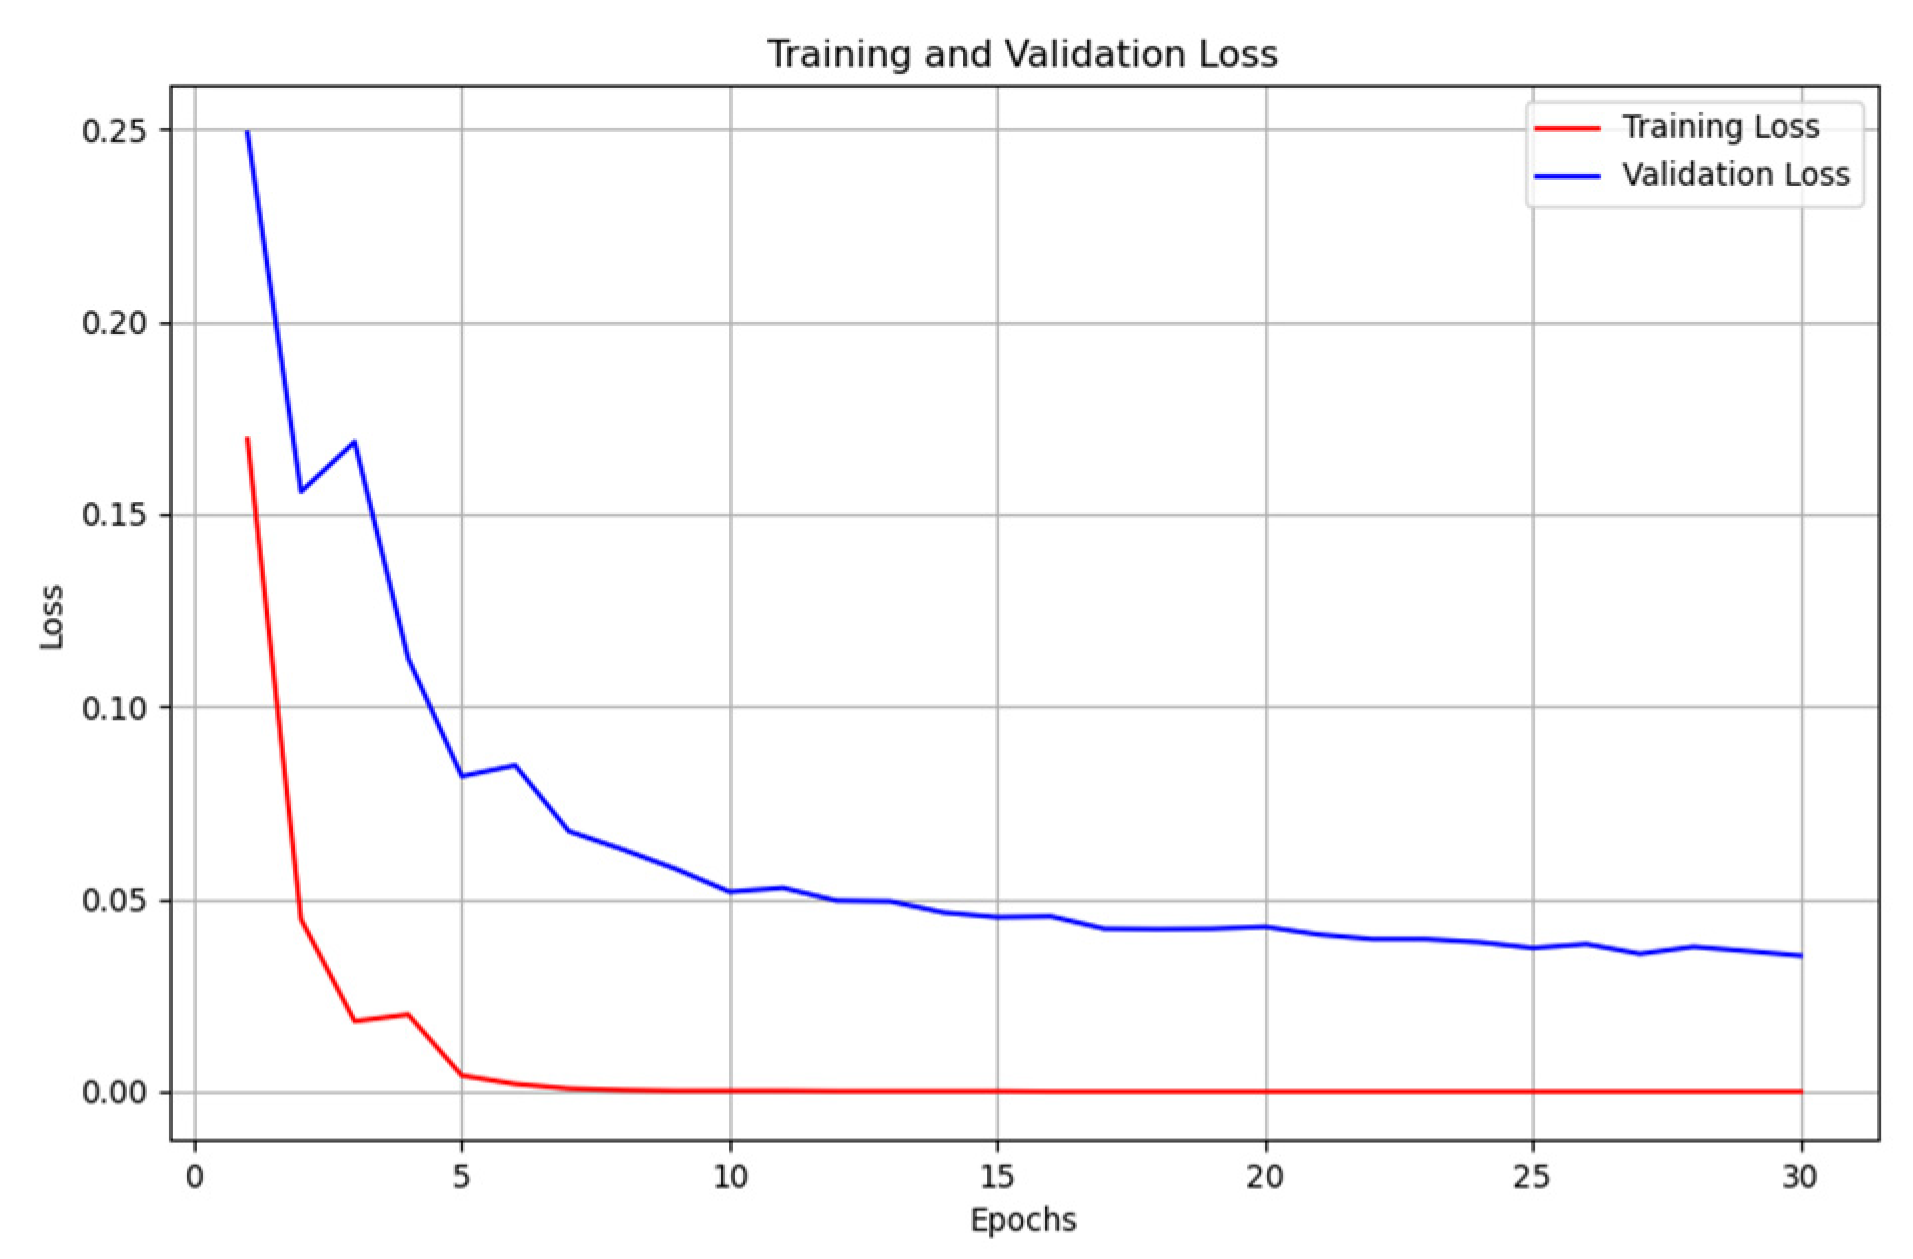
Figure 9.
Unimodal COVID-19 X-ray classification with VGG19 - training loss vs validation loss.
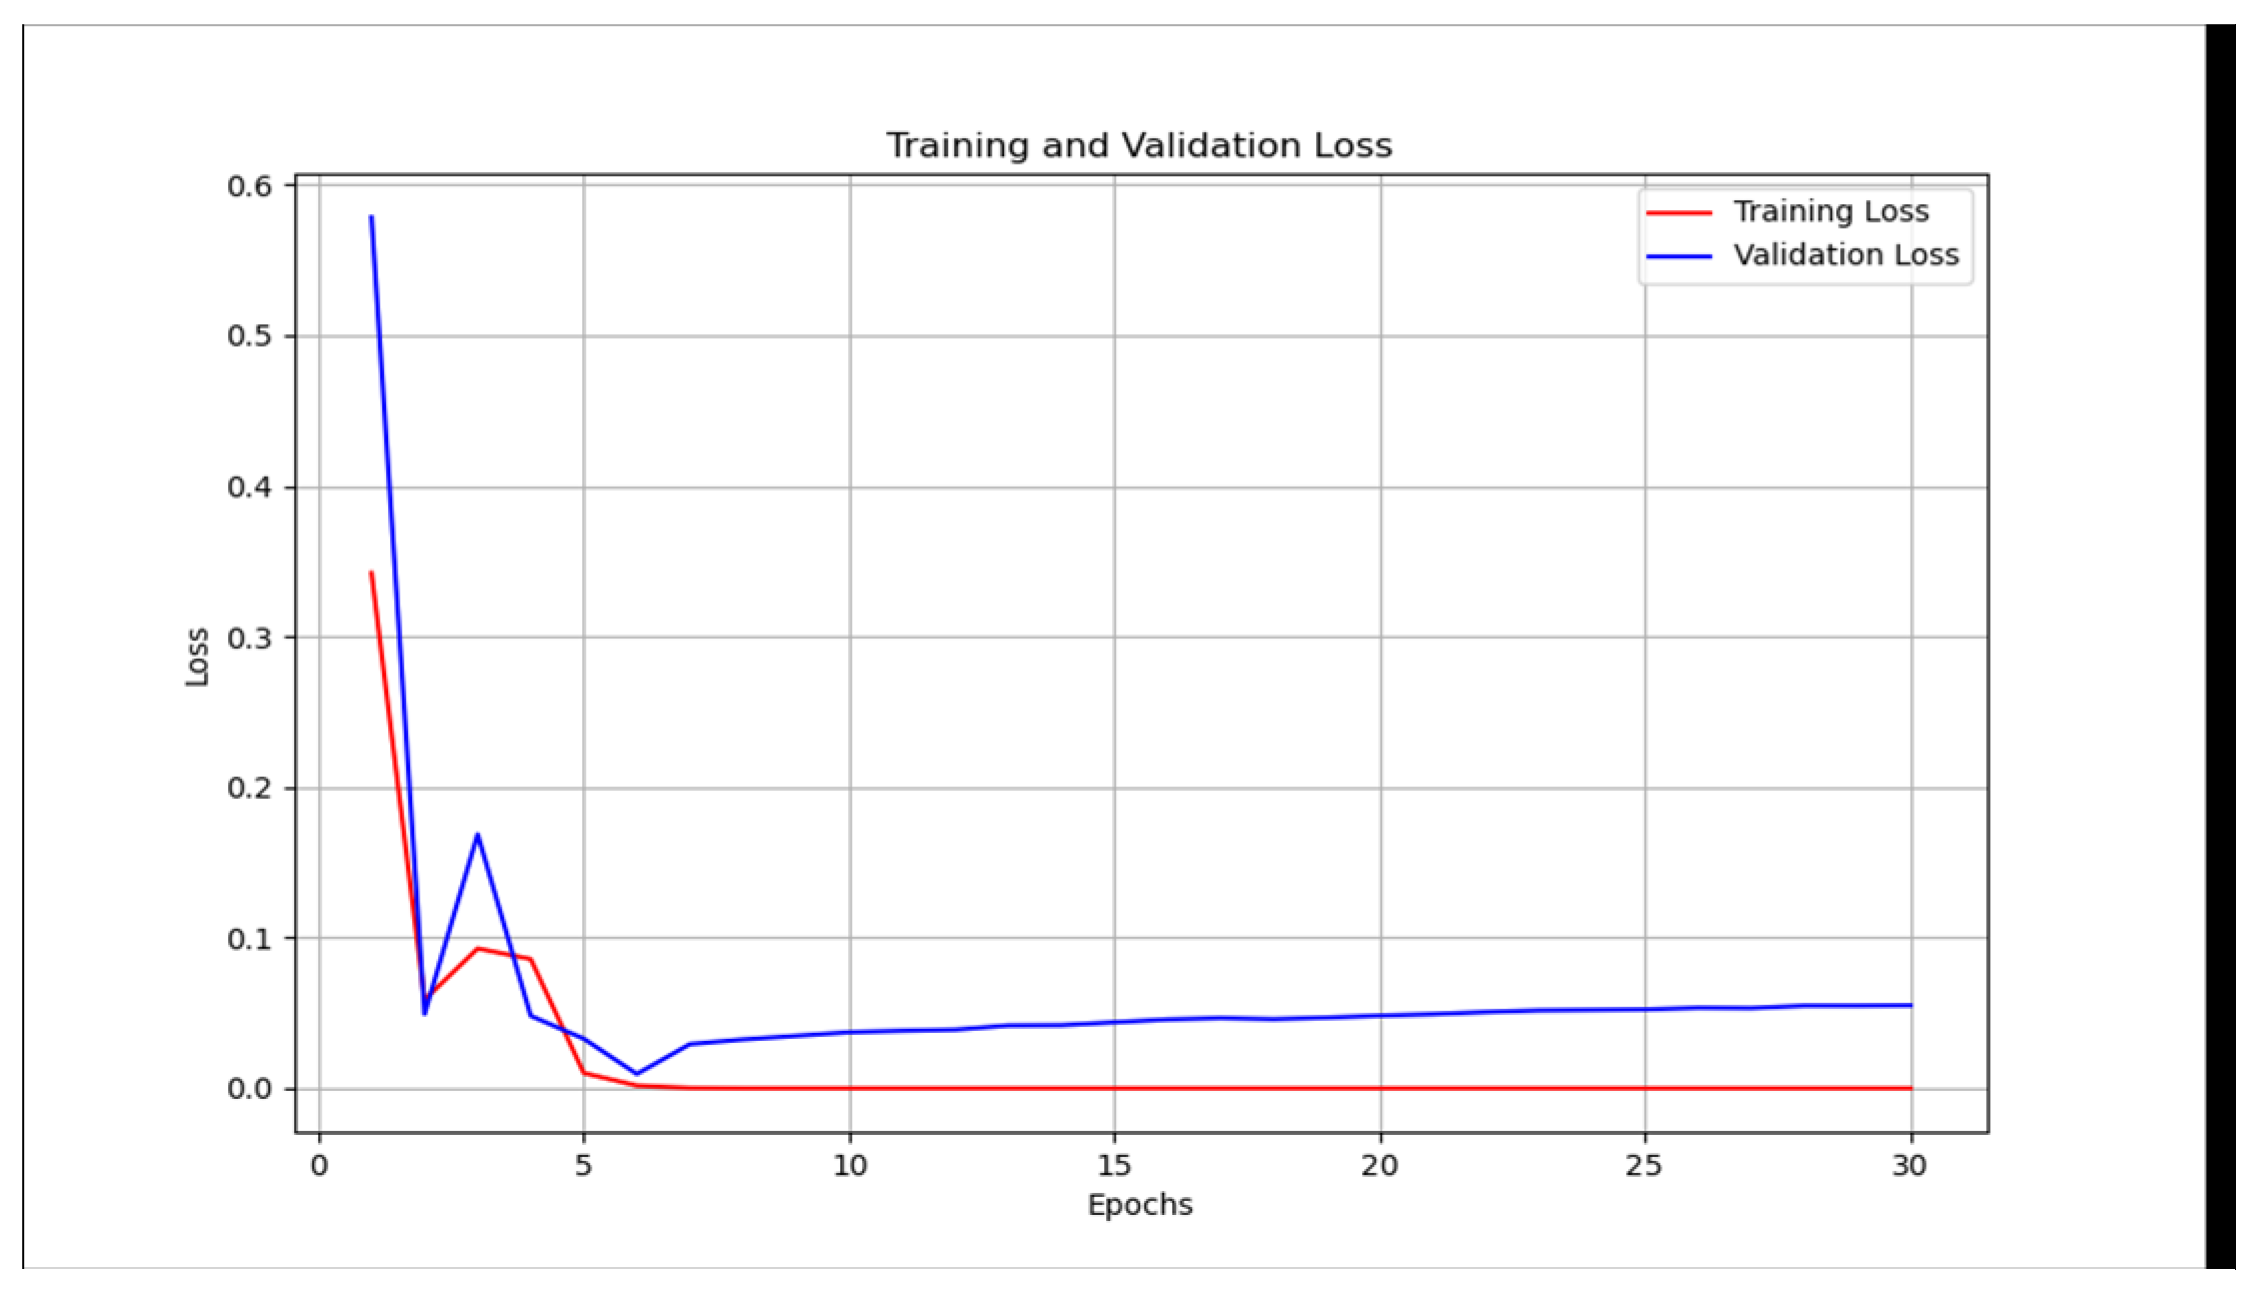
Figure 10.
Unimodal COVID-19 CT-scan classification - training loss vs validation loss.
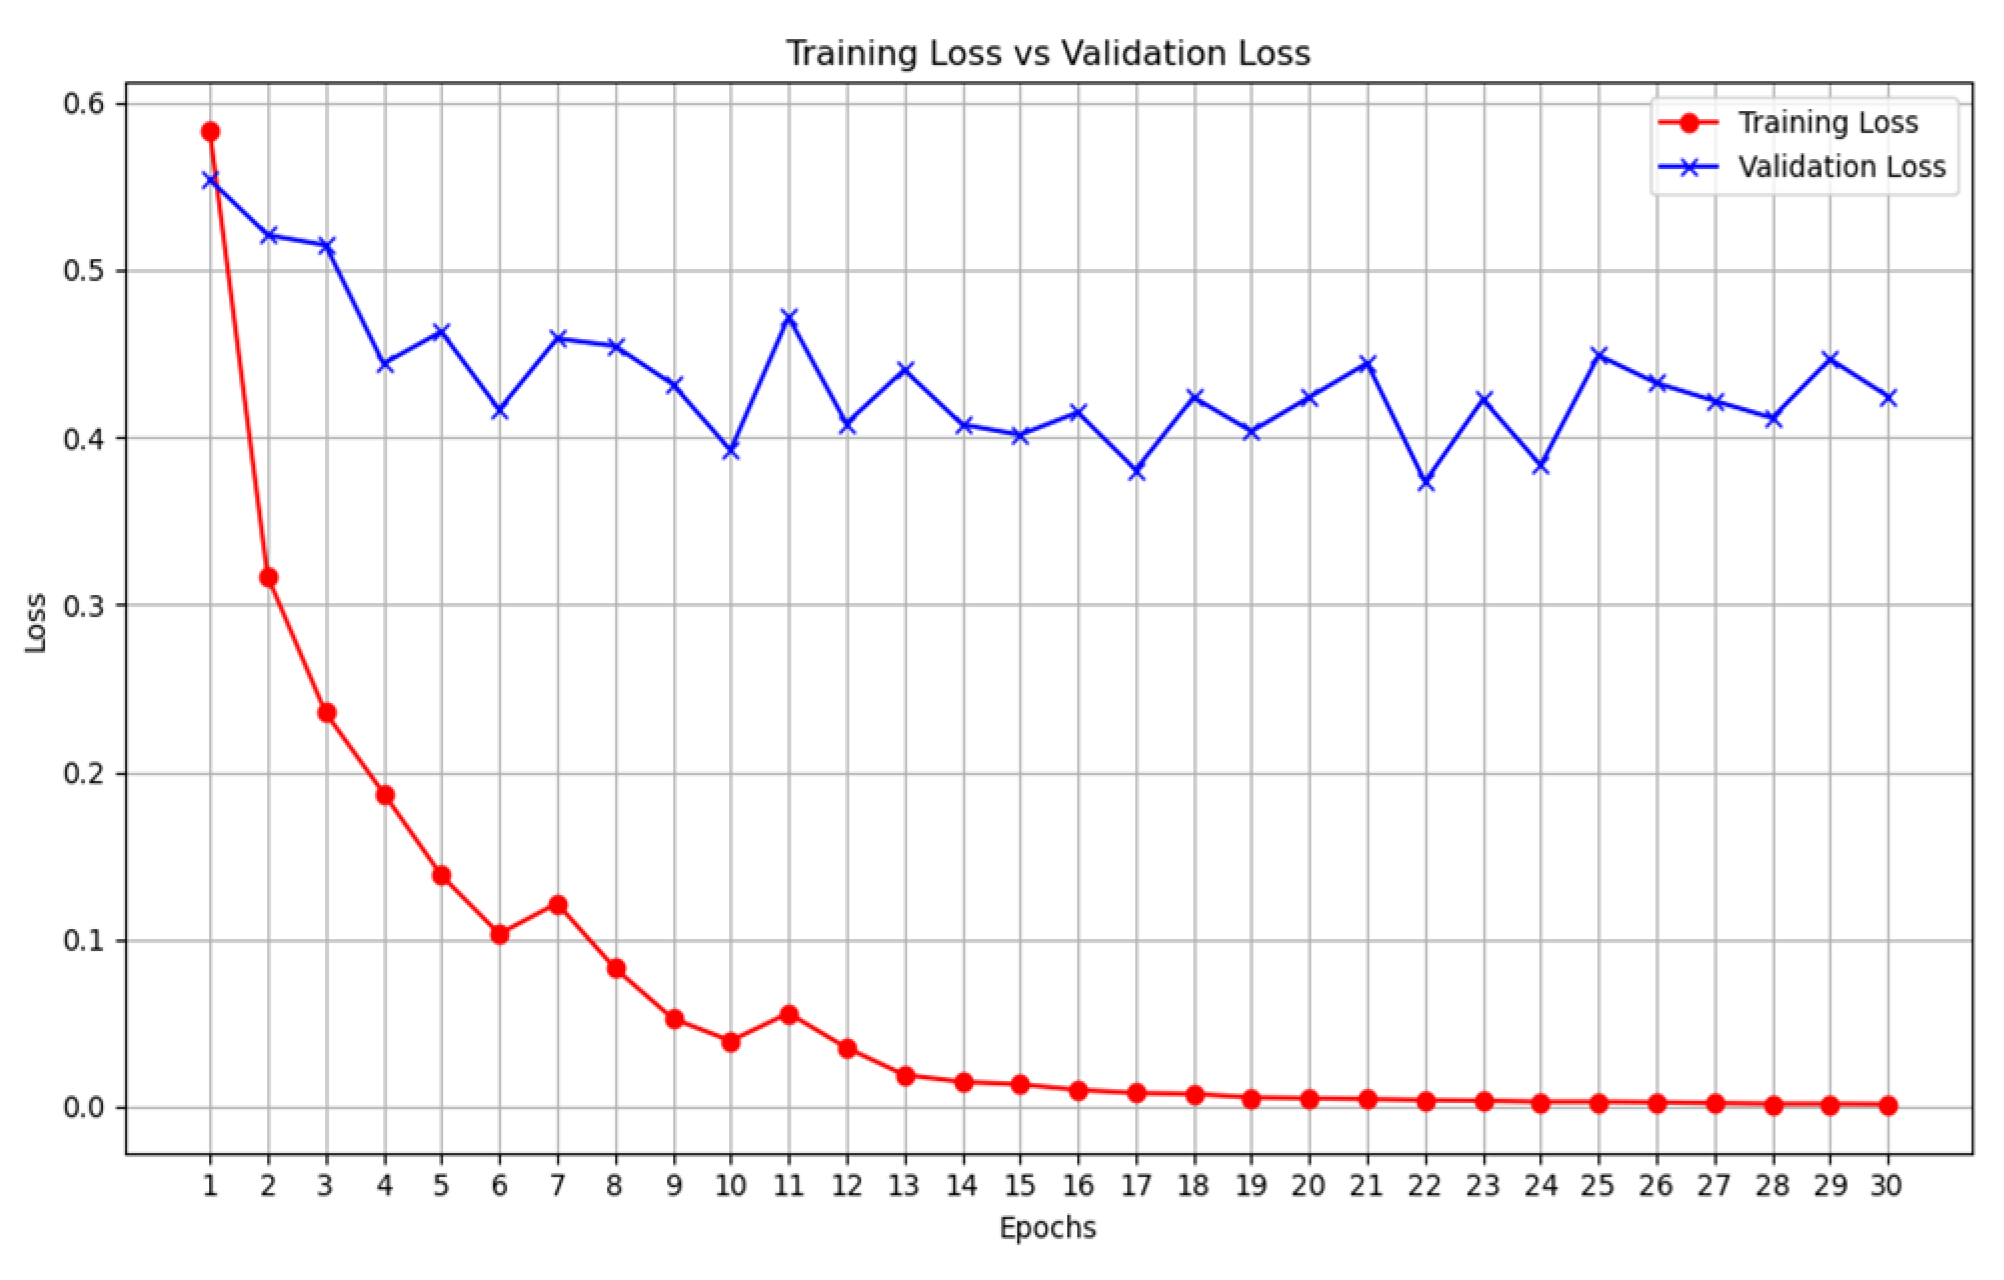
Figure 11.
Unimodal COVID-19 CT-scan classification with VGG19 - training loss vs validation loss.
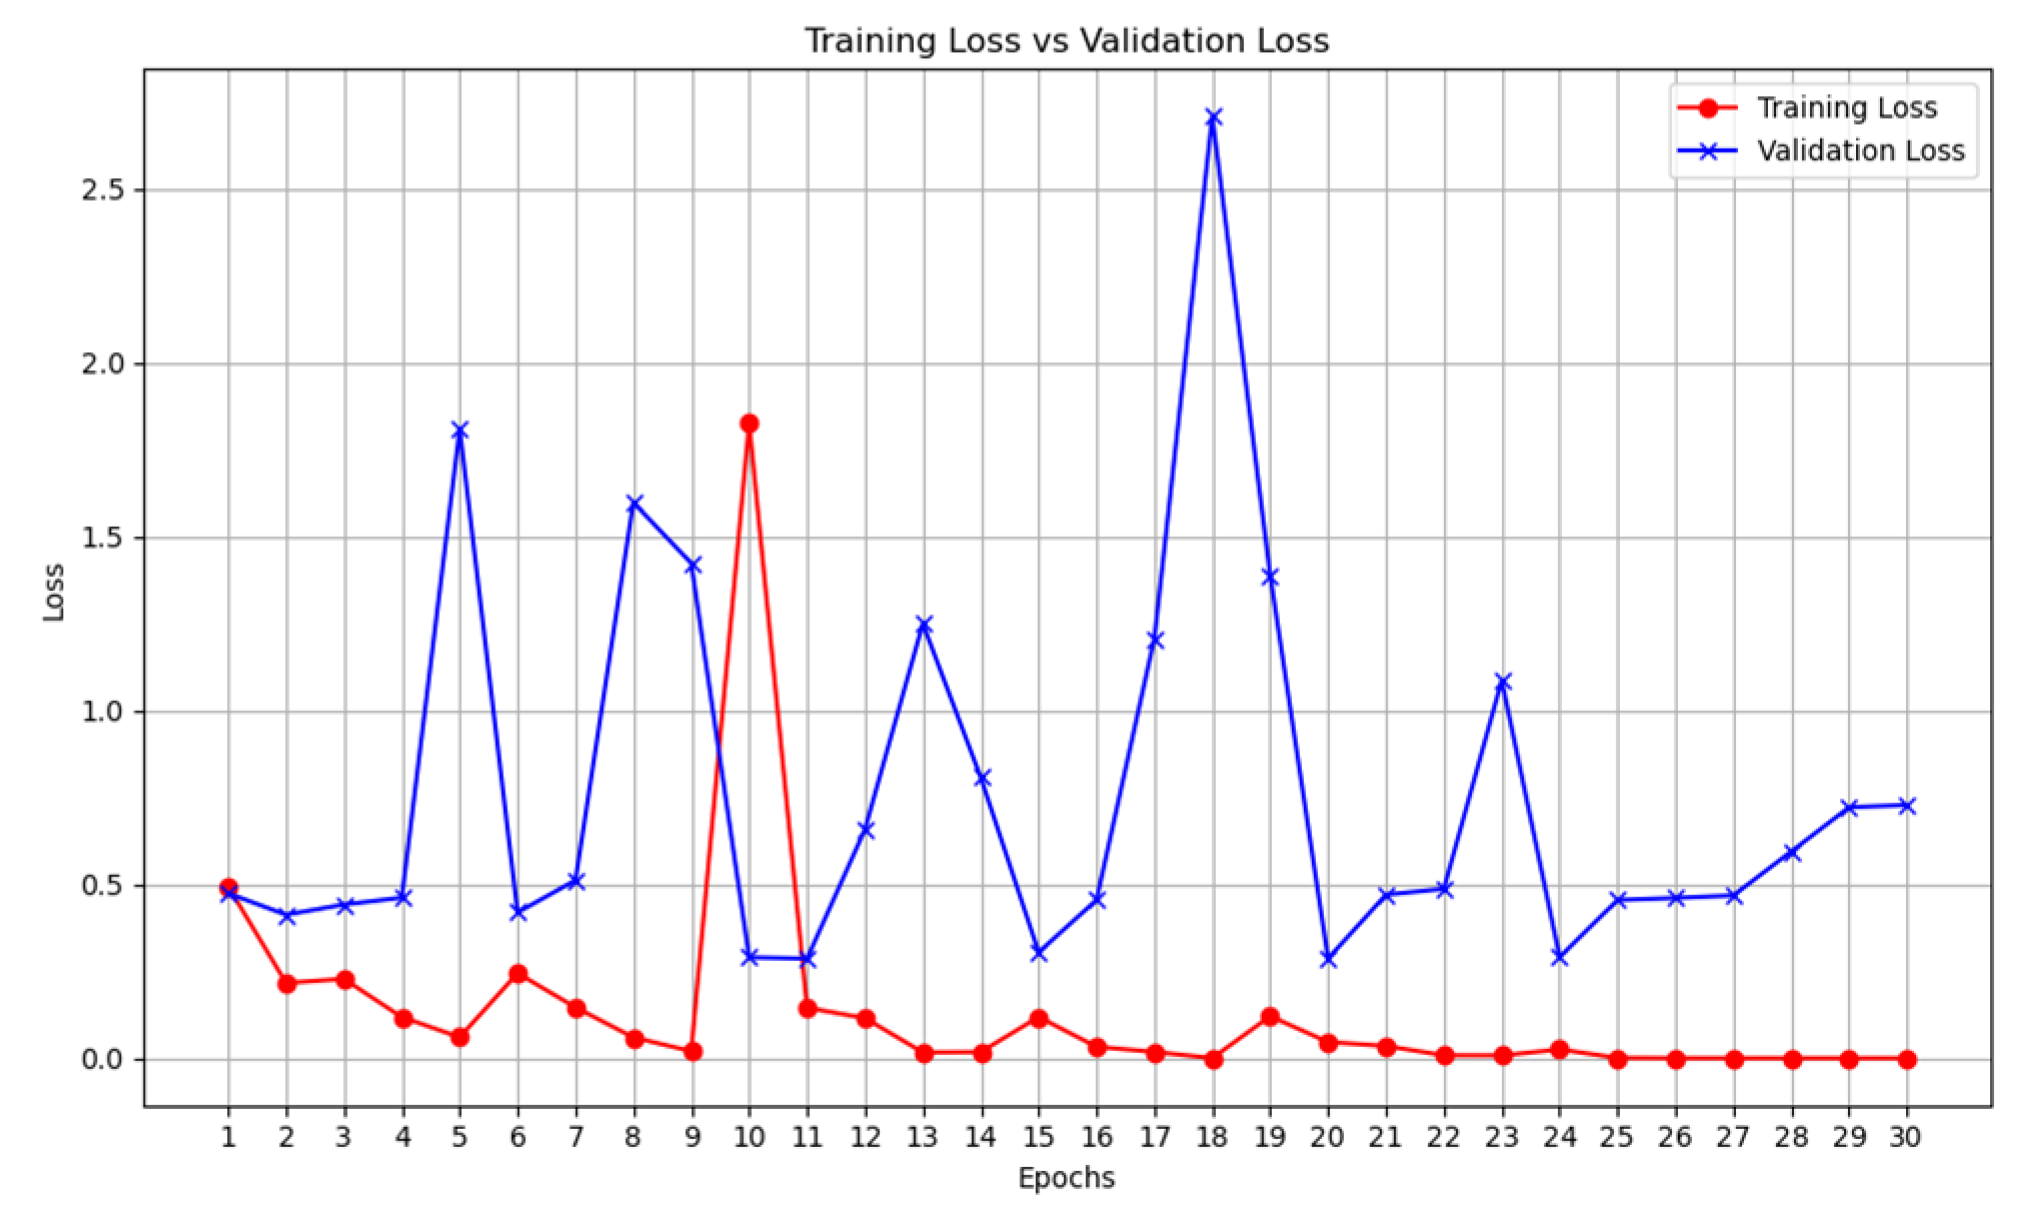
Figure 12.
Multimodal COVID-19 classification - training loss vs validation loss.
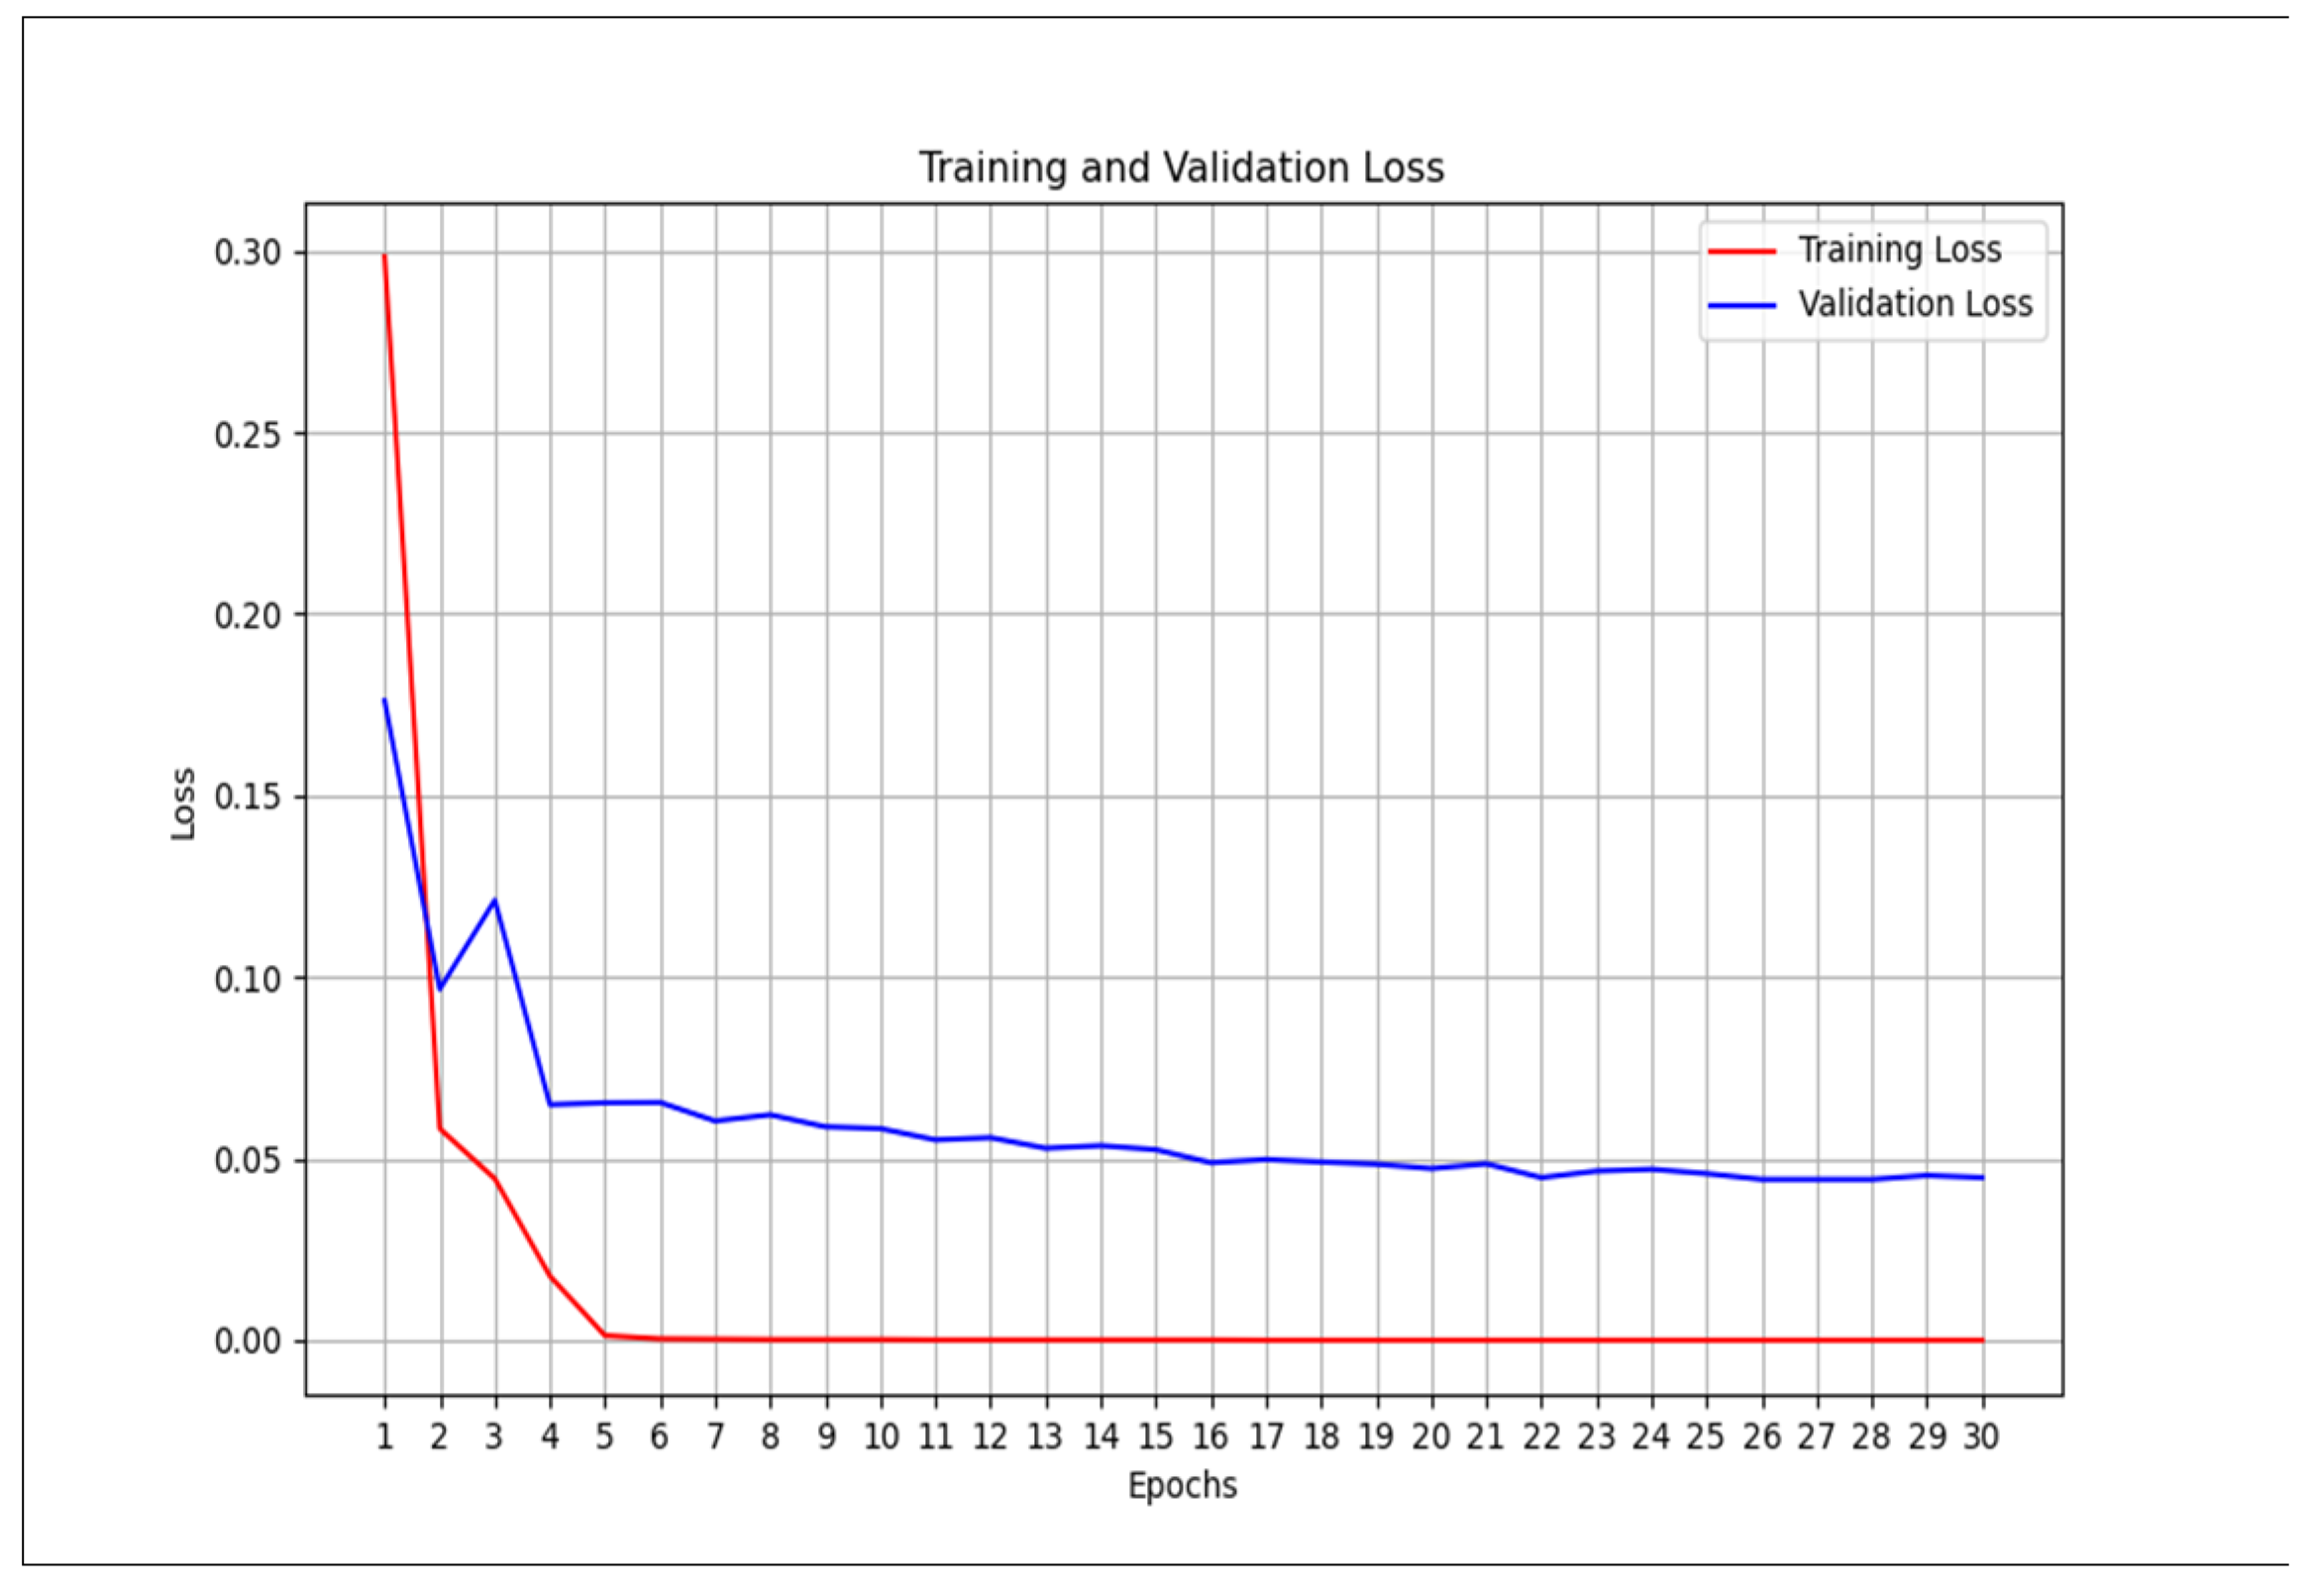
Figure 13.
Multimodal COVID-19 classification with VGG19 - training loss vs validation loss.
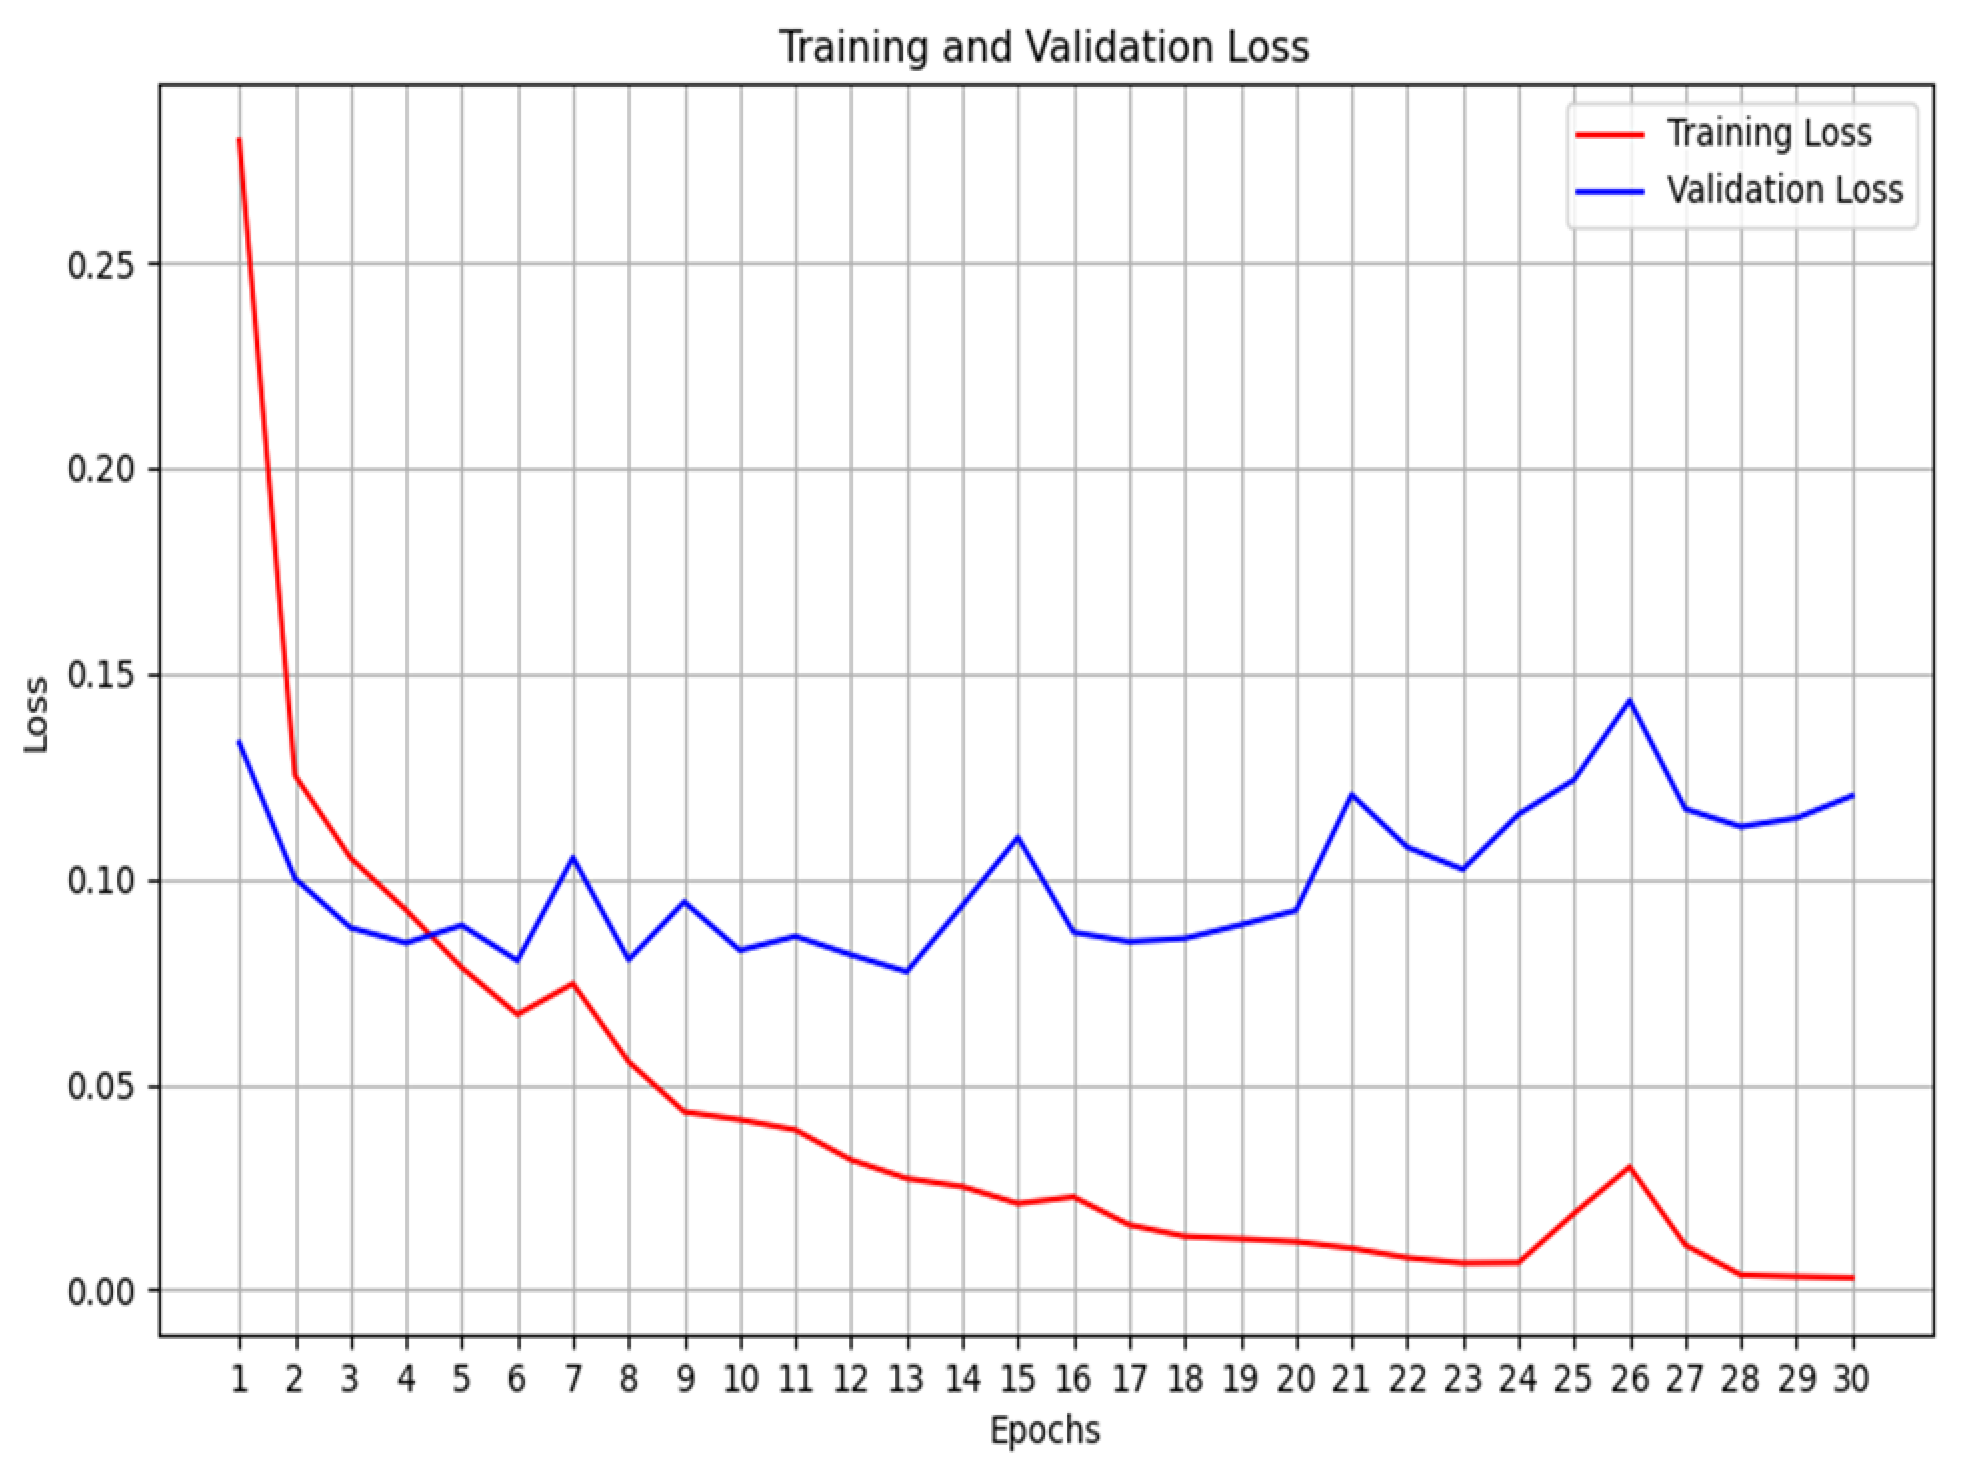

Table 1.
Evaluation for unimodal – Cough.
| Evaluation metrics | Values |
|---|---|
| Accuracy | 50% |
| Sensitivity | 1 |
| Specificity | 0 |
| F1 Score | 0.6667 |
| Confusion matrix True Positives (TP) True Negatives (TN) False Positives (FP): False Negatives (FN): |
[[0 100] [0 100]] 100 0 100 0 |
Table 2.
Evaluation for unimodal – Cough VGG-19.
| Evaluation metrics | Values |
|---|---|
| Accuracy | 57.50% |
| Sensitivity | 0.69 |
| Specificity | 0.46 |
| F1 Score | 0.6188 |
| Confusion matrix True Positives (TP) True Negatives (TN) False Positives (FP): False Negatives (FN): |
[[46 54] [32 69]] 69 46 54 32 |
Table 3.
Evaluation for unimodal – X-ray.
| Evaluation metrics | Values |
|---|---|
| Accuracy | 98.00% |
| Sensitivity | 1 |
| Specificity | 0.960 |
| F1 Score | 0.9804 |
| Confusion matrix True Positives (TP) True Negatives (TN) False Positives (FP): False Negatives (FN): |
[[96 4] [0 100]] 100 96 4 0 |
Table 4.
Evaluation for unimodal – X-ray VGG-19.
| Evaluation metrics | Values |
|---|---|
| Accuracy | 99.00% |
| Sensitivity | 1 |
| Specificity | 0.98 |
| F1 Score | 0.9901 |
| Confusion matrix True Positives (TP) True Negatives (TN) False Positives (FP): False Negatives (FN): |
[[98 2] [0 100]] 100 98 2 0 |
Table 5.
Evaluation for unimodal – CT-scan.
| Evaluation metrics | Values |
|---|---|
| Accuracy | 91.00% |
| Sensitivity | 0.91 |
| Specificity | 0.91 |
| F1 Score | 0.91 |
| Confusion matrix True Positives (TP) True Negatives (TN) False Positives (FP): False Negatives (FN): |
[[91 9] [9 91]] 91 91 9 9 |
Table 6.
Evaluation for unimodal – CT-scan VGG-19.
| Evaluation metrics | Values |
|---|---|
| Accuracy | 77.50% |
| Sensitivity | 0.55 |
| Specificity | 1 |
| F1 Score | 0.7097 |
| Confusion matrix True Positives (TP) True Negatives (TN) False Positives (FP): False Negatives (FN): |
[[100 0] [45 55]] 55 100 0 45 |
Table 7.
Evaluation for multimodal.
| Evaluation metrics | Values |
|---|---|
| Accuracy | 98.00% |
| Sensitivity | 1 |
| Specificity | 0.9600 |
| F1 Score | 0.9804 |
| Confusion matrix True Positives (TP) True Negatives (TN) False Positives (FP): False Negatives (FN): |
[[96 4] [0 100]] 100 96 4 0 |
Table 8.
Evaluation for multimodal –VGG19.
| Evaluation metrics | Values |
|---|---|
| Accuracy | 98.00 % |
| Sensitivity | 0.98 |
| Specificity | 0.98 |
| F1 Score | 0.980 |
| Confusion matrix True Positives (TP) True Negatives (TN) False Positives (FP): False Negatives (FN): |
[[98 2] [2 98]] 98 98 2 2 |
Table 9.
Evaluation for multimodal –RESNET.
| Evaluation metrics | Values |
|---|---|
| Accuracy | 50.00 % |
| Sensitivity | 1 |
| Specificity | 0 |
| F1 Score | 0.6667 |
| Confusion matrix True Positives (TP) True Negatives (TN) False Positives (FP): False Negatives (FN): |
[[0 100] [0 100]] 100 0 100 0 |
Table 10.
Evaluation for multimodal – MOBILENETV2.
| Evaluation metrics | Values |
|---|---|
| Accuracy | 96 % |
| Sensitivity | 0.96 |
| Specificity | 0.96 |
| F1 Score | 0.96 |
| Confusion matrix True Positives (TP) True Negatives (TN) False Positives (FP): False Negatives (FN): |
[[96 4] [4 96]] 96 96 4 4 |
Disclaimer/Publisher’s Note: The statements, opinions and data contained in all publications are solely those of the individual author(s) and contributor(s) and not of MDPI and/or the editor(s). MDPI and/or the editor(s) disclaim responsibility for any injury to people or property resulting from any ideas, methods, instructions or products referred to in the content. |
© 2024 by the authors. Licensee MDPI, Basel, Switzerland. This article is an open access article distributed under the terms and conditions of the Creative Commons Attribution (CC BY) license (http://creativecommons.org/licenses/by/4.0/).
Copyright: This open access article is published under a Creative Commons CC BY 4.0 license, which permit the free download, distribution, and reuse, provided that the author and preprint are cited in any reuse.


