Preprint
Article

This version is not peer-reviewed.

Catalytic Methane Decomposition for the Simultaneous Production of Hydrogen and Low Reactivity Biocarbon for the Metallurgic Industry

A peer-reviewed article of this preprint also exists.

Submitted:

03 December 2024

Posted:

04 December 2024

You are already at the latest version

Abstract

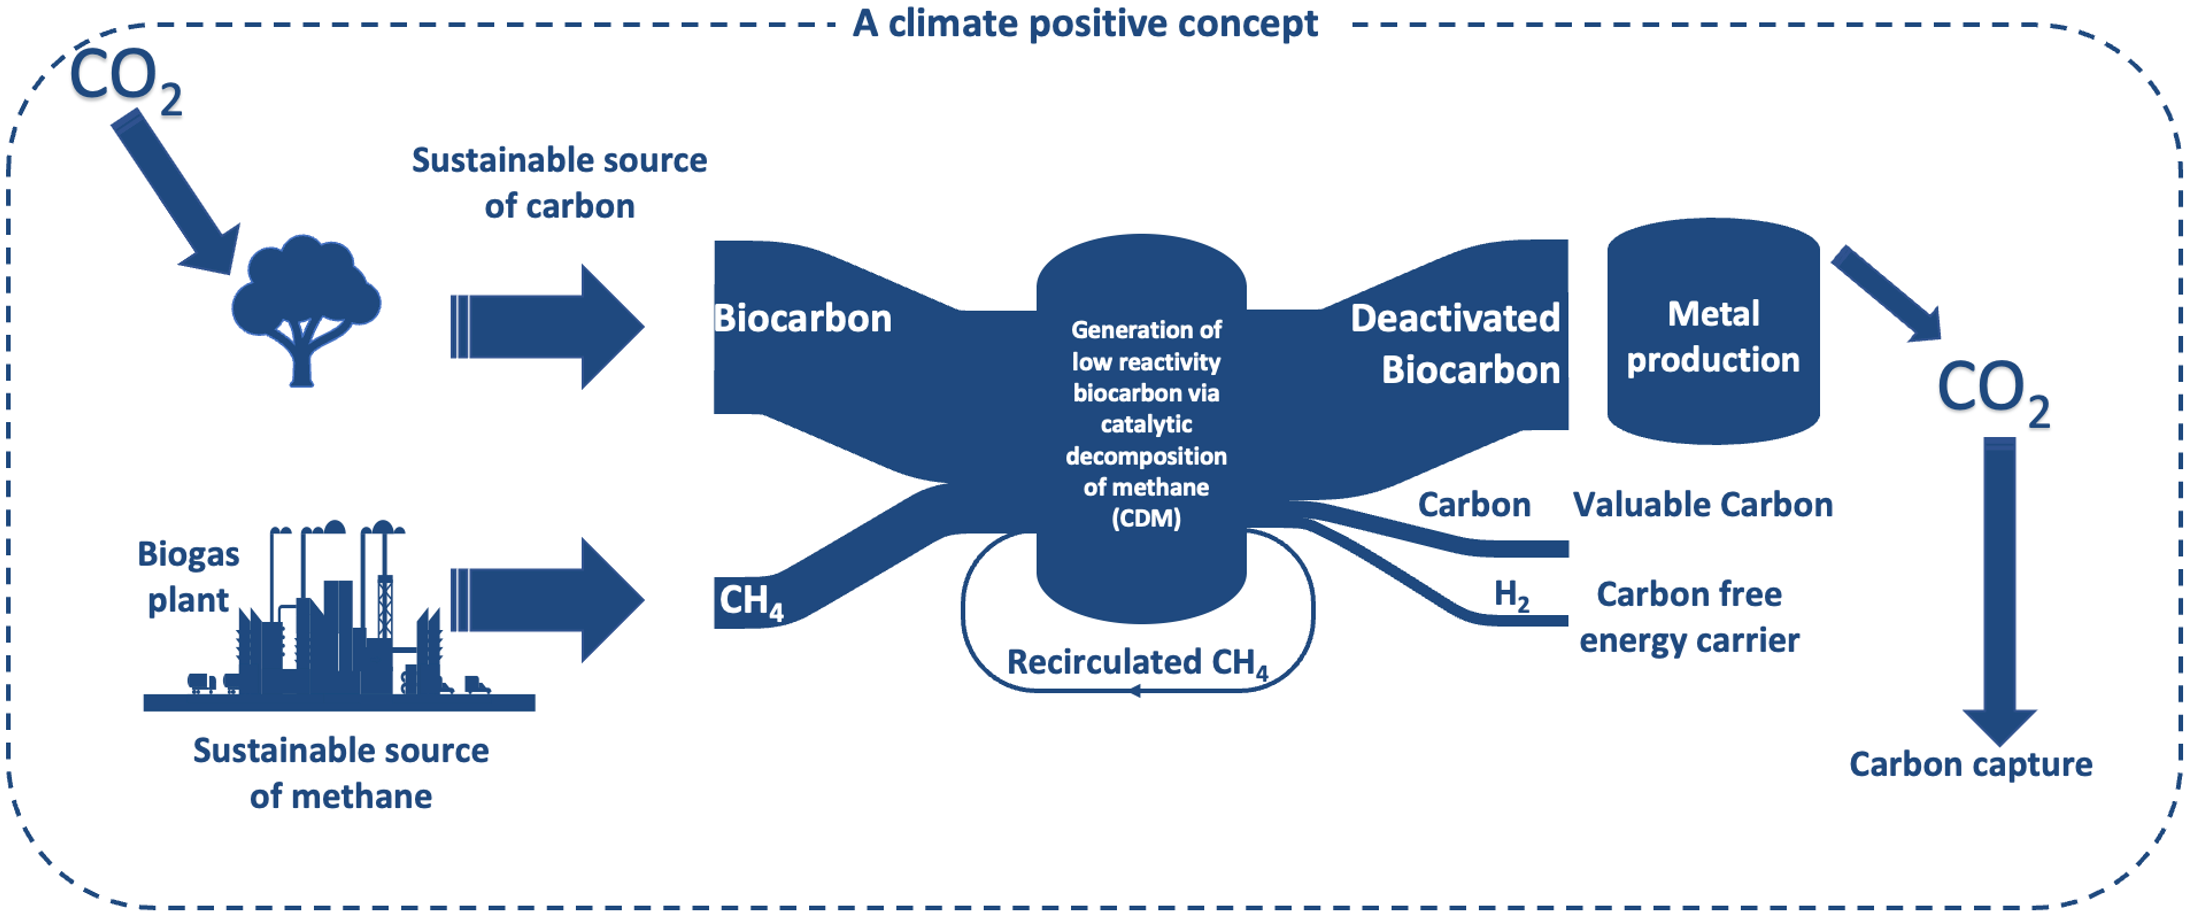
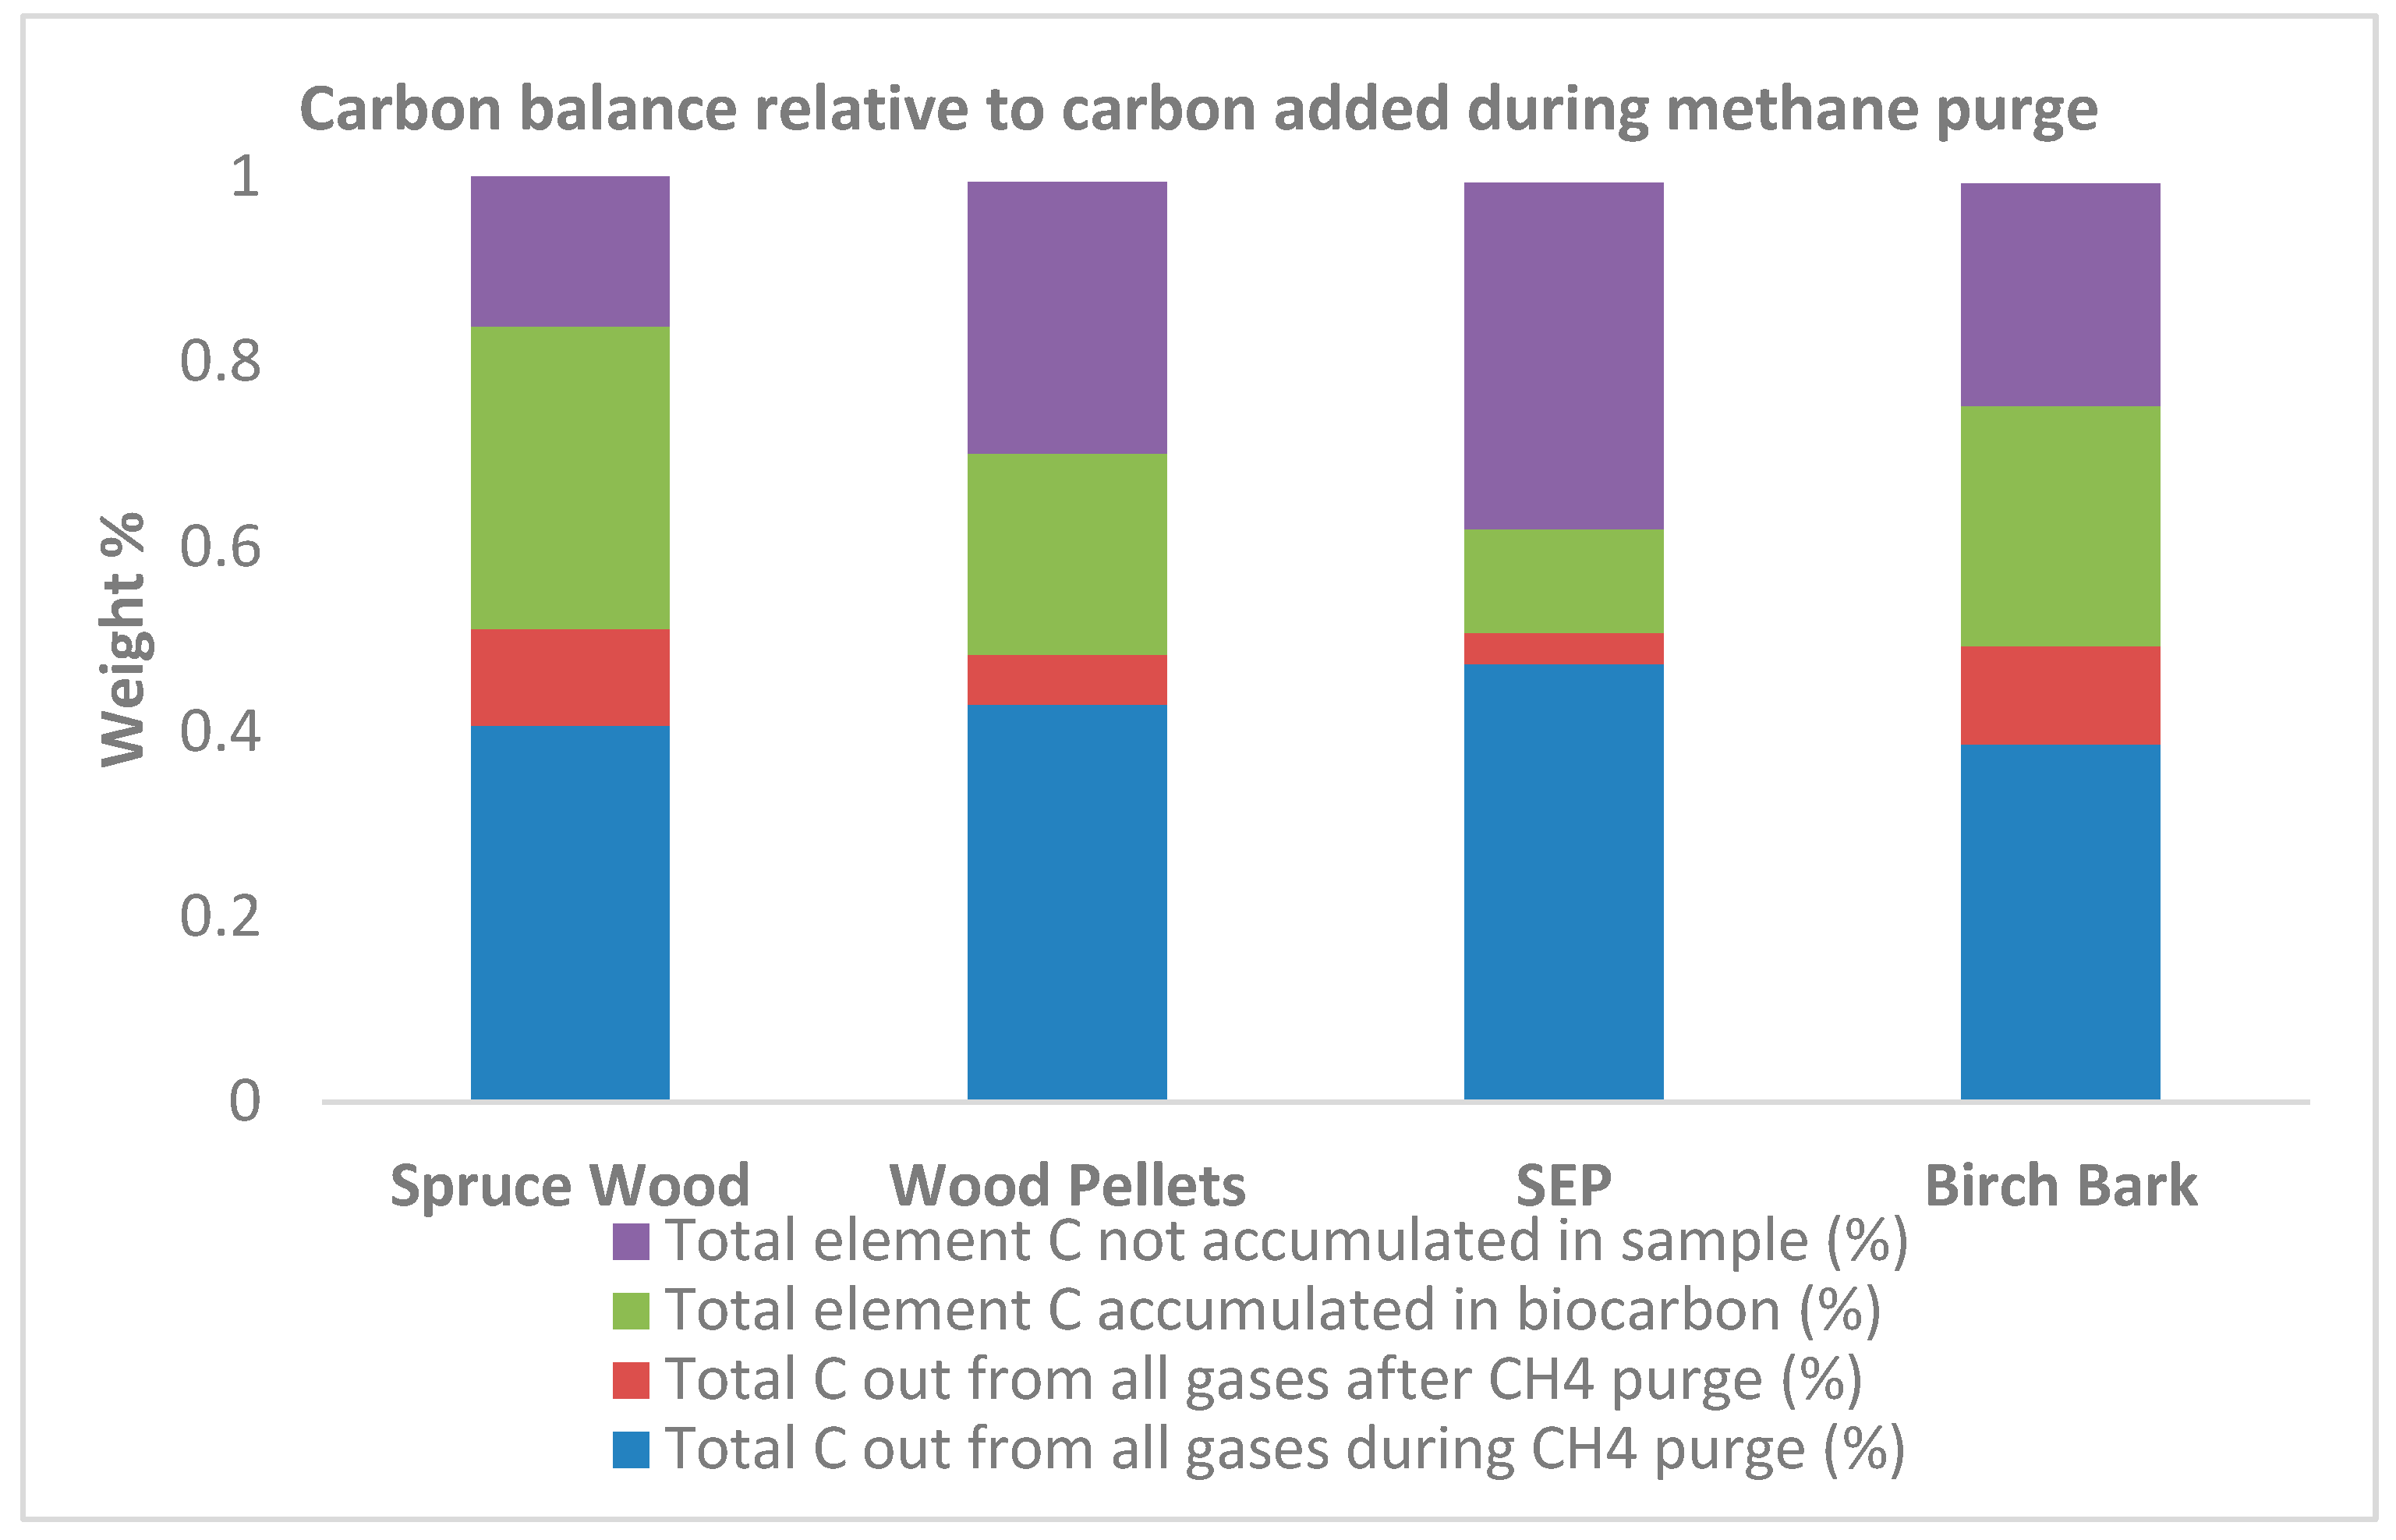
To reach agreed-on climate goals, it is necessary to develop new energy carriers and industrial materials that are carbon neutral. To combat global warming and keep Earth’s temperature below a 1.5 °C increase, some of these solutions need to be carbon negative. This study fulfills this criterion by producing clean hydrogen, and biocarbon, suitable for the metallurgic industry, through the thermal decomposition of methane using biocarbon as a catalyst. Five different biomass samples were used to prepare biocarbons, at a pyrolysis temperature of 1000 °C and a holding time of 90 minutes. When methane was cracked at 1100 °C and a holding time of 90 minutes, the highest hydrogen production was 105 mol/kg biocarbon, using birch bark. The lowest hydrogen yield, of 68 mol/kg biocarbon, was achieved with steam explosion pellets. All biocarbons showed substantial carbon deposition from cracked methane on the surface, with the highest deposition on birch bark and spruce wood biocarbon, of 42 % relative to the biocarbon start weight. The carbon deposition increased with decomposition temperature, methane-share in the purge gas and holding time. The steam explosion pellets, after deactivation, had a CO2 reactivity that is comparable to coke, a reducing agent that is commonly used in manganese producing industry.

Keywords: 
;  ;  ;  ;  

1. Introduction

To reach our agreed climate goals, it is necessary to develop new energy carriers and industrial feedstocks free of fossil CO2-emissions, and most net-zero scenarios also include significant levels of CO2 capture and sequestration (CCS). The metallurgical industry is a large emitter of CO2, a significant portion of which is directly related to key chemical reactions producing metals from ores:
MeOx + (x/2) C → (x/2) CO2 + Me
This fact means that transitioning the electricity production to 100% CO2-free energy will not alone be sufficient to decarbonize metal production. There are ongoing efforts to remove the carbon from the process, for example by using hydrogen as a reducing agent [1,2,3,4,5] or using electrolytic processes [6,7,8]. These technologies are not mature and have the drawback that they will require a completely new process design, and most likely completely new metallurgical plants. Due to the significant capital investments of metallurgical plants, the rollout of any such novel technology would most likely only proceed at the pace at which existing plants reach their end-of-life cycle. From this point of view, it is more attractive to replace fossil carbon raw materials with biogenic carbon, or to capture and sequester the CO2 from the metallurgical plant. This would allow the core process to remain largely unchanged while existing plants could continue to operate without CO2 emissions. The combination of both technologies, i.e. use of biogenic carbon with CCS, would allow for a carbon negative process.
Biocarbon from biomass is prepared by thermal treatment under inert conditions to obtain a carbon-rich solid enabling a wide variety of applications. Unsurprisingly, there has been significant efforts to use ever larger fractions of biocarbon in metallurgical plants. The success of these efforts varies between industries. There are open-hearth silicon-plants in Brazil that are operating today on 100% biocarbon [9]. To produce other metals and alloys, it has been more challenging. In the case of ferromanganese and silicomanganese for example, biocarbon-levels in furnaces remain low. This is because the properties of biocarbon differ from that of the traditional carbon sources like coal and coke, particularly in terms of chemical reactivity and physical strength. Unless these issues are solved, fractions of biocarbon used will remain limited. The high porosity (and corresponding low density) of biocarbon limits its compressive and mechanical strengths. It also increases its chemical reactivity due to increased surface area. This is at odds with its use in manganese alloys production where the carbon material, as it descends into the reaction zone, meets rising CO2 with which it may react, causing carbon loss and additional energy demand through the Boudouard reaction:
CO2 + C → 2CO,
A denser biocarbon material has the potential to have more appropriate strength and reactivity. One way of increasing the density that has been recently proposed but little studied is to deposit carbon from methane through pyrolysis [10]. At high temperature, methane will decompose into elemental carbon and hydrogen:
CH4 → C(s) + 2H2,
Methane pyrolysis has also been studied as a potential route for hydrogen production. Hydrogen is foreseen to be the energy carrier of the future as it does not contain any carbon and therefore does not produce any CO2 during its conversion. Currently, the most used method for producing hydrogen, and that with the highest energy efficiency and the lowest cost compared to other conventional methods, is steam methane reforming (SMR) [11]. In SMR, methane is first converted to syngas via reaction with steam, and the CO is then converted to CO2 and H2 via the water gas shift reaction in a subsequent reactor:
CH4 + H2O → 3H2 + CO,
CO + H2O → CO2 + H2,
The purification of hydrogen requires a further process step, typically pressure swing adsorption. A carbon neutral process would require a biogenic feedstock or the separation and stable deposition of CO2 [12]. However, as current practice is to use fossil methane and no carbon capture, SMR causes emissions of around 9 kg CO2eq/kg H2.
Catalytic decomposition of methane (CDM) is a process by which methane is thermally cracked, using a catalyst, to produce elemental carbon and H2 free of CO and CO2, with no need for carbon capture and storage. Other advantages in comparison to SMR: lower process complexity, lower theoretical energy input per produced H2 (37.8 kJ/mol H2 for CDM compared to 63.3 kJ/mol H2 for SMR), and no need for steam production. However, the hydrogen needs to be separated while the other gases, methane and other hydrocarbons can be recycled back to the CDM reactor. The thermal cracking of methane without a catalyst requires high temperatures (above 1200 °C) to achieve reasonable H2 yields. However, with the use of a catalyst, methane can be dissociated at temperatures as low as 550 °C [13]. Despite all these advantages, hydrogen production through CDM is still not commercially available due to the challenges described hereafter. Several catalysts have been investigated for the catalytic dissociation of methane, e.g., metal-based catalysts such as Ni, Co, Mo, Fe, Al, etc. and carbon-based ones such as activated carbon, carbon black and different coals.
Studies performed with metallic catalysts have shown high dissociation activity, however, the carbon deposition on the catalysts in all cases resulted in the deactivation of the catalyst [14,15,16,17]. These catalysts can be regenerated; however, this will increase the complexity of the process due to the requirement of an additional dedicated reactor operating at different pressure conditions from those of the CDM reactor. Regeneration will also result in the formation of CO2 through the combustion of the deposited carbon, which takes away the most important advantage of CDM over SMR, namely CO2-free hydrogen production.
Activated coal (AC) are carbonaceous solids usually produced from coal thermally treated using an activation medium such as steam or phosphoric acid [18]. Theses catalysts have shown a high activity for methane dissociation but a rapid deactivation due to carbon deposition [19,20,21]. AC can be regenerated by using CO2 gasification at high temperatures (900-1000 °C), though this is likely to result in additional costs and higher environmental impact [22,23].
Carbon black (CB) is fine particles consisting mainly of carbon produced by incomplete combustion of heavy petroleum products. These products have been used as catalysts in CDM studies as well. CB proved to have lower catalytic activity compared to AC, but also showed better catalytic stability despite carbon deposition [24,25,26]. Nevertheless, CB may not be regarded as an effective candidate because (1) it is fossil based, (2) it has low catalytic activity and (3) despite short-term stability, it will eventually get deactivated due to carbon deposition. Coal chars may as well be discarded based on the same reasoning, although, studies on various coal chars reported acceptable catalytic activities for the methane decomposition, but also fast deactivation [27,28].
This study aims at using charcoal (derived from forest biomass) as a catalyst for methane decomposition to densify the biocarbon while simultaneously producing hydrogen. The pretreatment method suggested in this study aims at producing a sustainable biocarbon with characteristics that are suitable for use as a reductant in metal production. It is expected that the biomass-based biocarbon will behave in a similar manner to the above-mentioned carbon-based catalysts. Throughout the process, the carbon deposition will deactivate the biocarbon. As shown in literature, the biocarbon matrix will adsorb the dissociated carbon from the methane, which will result in the closure of the particle pores, reducing the internal surface area, thus lowering the biocarbon reactivity. The temperature treatment will also improve the carbon binding order in the biocarbon matrix, giving additional strength and contributing further to lower reactivity [29].
The proposed solution provides a biocarbon with: (1) reduced inner surface area, (2) increased fixed carbon content, (3) increased strength, (4) increased volumetric mass density, (5) lower reactivity and (6) improved biocarbon uniformity (homogeneity). This study gives detailed information on methane decomposition using five different biocarbons, produced from birch woodchips (BW), spruce woodchips (SW), birch bark chips (BB), wood pellets (WP) and steam explosion pellets (SEP), all produced at a pyrolysis temperature of 1000 °C [30]. An electrically heated reactor packed with biocarbon material was used for this study. Both the potential to produce hydrogen and the treated biocarbon has been investigated as a function of biocarbon type, CDM temperature, holding time and methane concentration in the purge stream. This work is part of a larger project where the main aim is to attain negative CO2 emissions by replacing fossil coal with biocarbon and at the same time, applying CCS technology in metal production processes. It is therefore imperative to collect as much data as possible across the entire value chain, which includes biocarbon production and the detailed mapping of the CDM for the simultaneous production of hydrogen and low reactivity biocarbon. The data presented in this work, together with our previous work [30], will be used in the development of a techno-economic model which will include biocarbon production, biocarbon deactivation and H2-production and integration of CCS in a manganese production plant.

2. Materials and Methods

Two types of biomass feedstocks were used to produce the biocarbons. The first type includes spruce wood, birch wood and birch bark chips. The wood and bark chips have a size in the range of 2-4 cm and 1-2 cm, respectively. The wood pellets are produced from spruce wood, with a diameter of 8 mm and a length of 15-17 mm. The steam explosion pellets have the same diameter, but a length of 18-22 mm. The steam explosion pellets were produced from spruce wood chips that were subjected to steam explosion at a mild temperature and moderate pressure (< 200 °C and < 20 bars). The material was then fed into a pellet mill and extruded under pressure into pellets. The produced biocarbon have smaller sizes due to particle shrinkage in comparison to their parent material. The wood and bark chips biocarbons were reduced in size to 1-3 cm and 1-2 cm, respectively. The wood pellets biocarbon had a substantial decrease in size, down to a diameter of around 5.5-6 mm and a length of 13-15 mm. The diameter and length of the steam explosion pellets decreased to around 6 mm and 16-18 mm, respectively.

2.1. Biocarbon production

The biocarbon for the methane cracking experiments were produced in an electrically heated furnace. The material was put inside the cylindrical furnace which was then purged with nitrogen to ensure an oxygen free atmosphere prior to pyrolysis. Afterwards, the furnace was heated at 10 °C/min to 1000 °C at which the temperature was kept stable for 90 minutes before the reactor was cooled down. Details about the experimental apparatus, the volatiles release, and the characterization of the biocarbon have been published elsewhere [30]. In total, five different biocarbons have been produced where the raw feedstocks originated from spruce woodchips, birch woodchips, commercially available wood pellets, steam explosion pellets and birch bark.

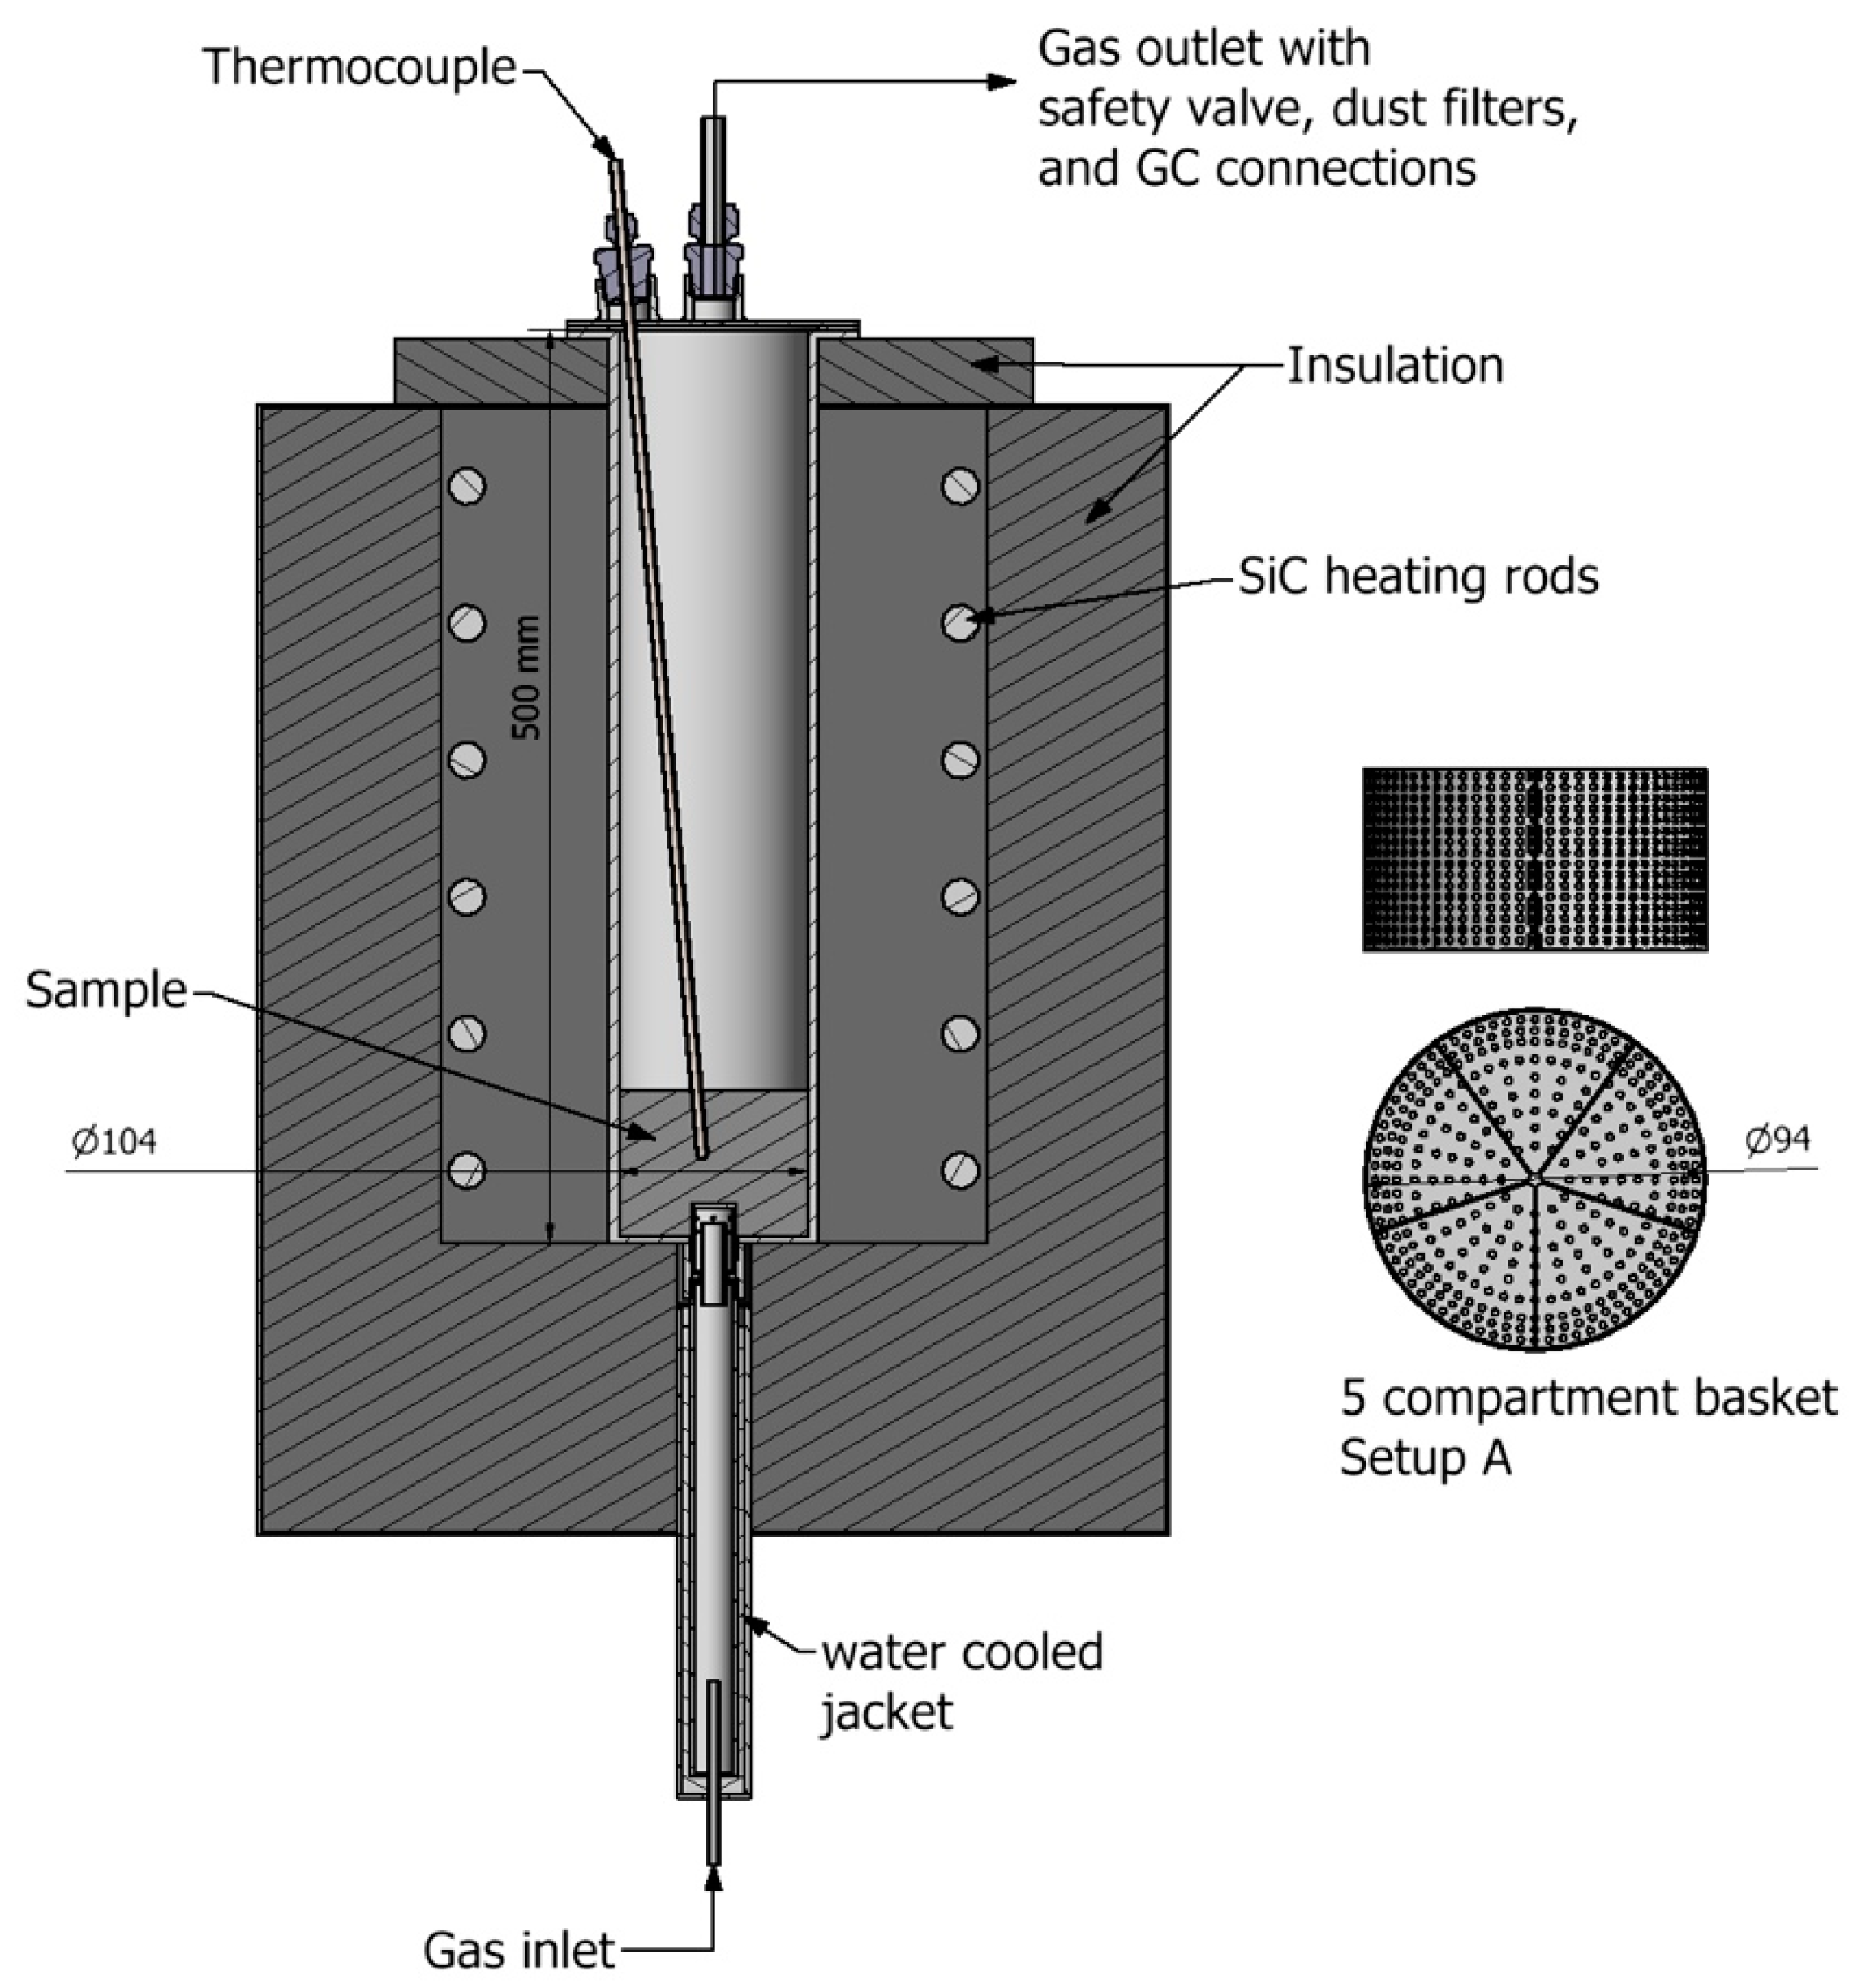
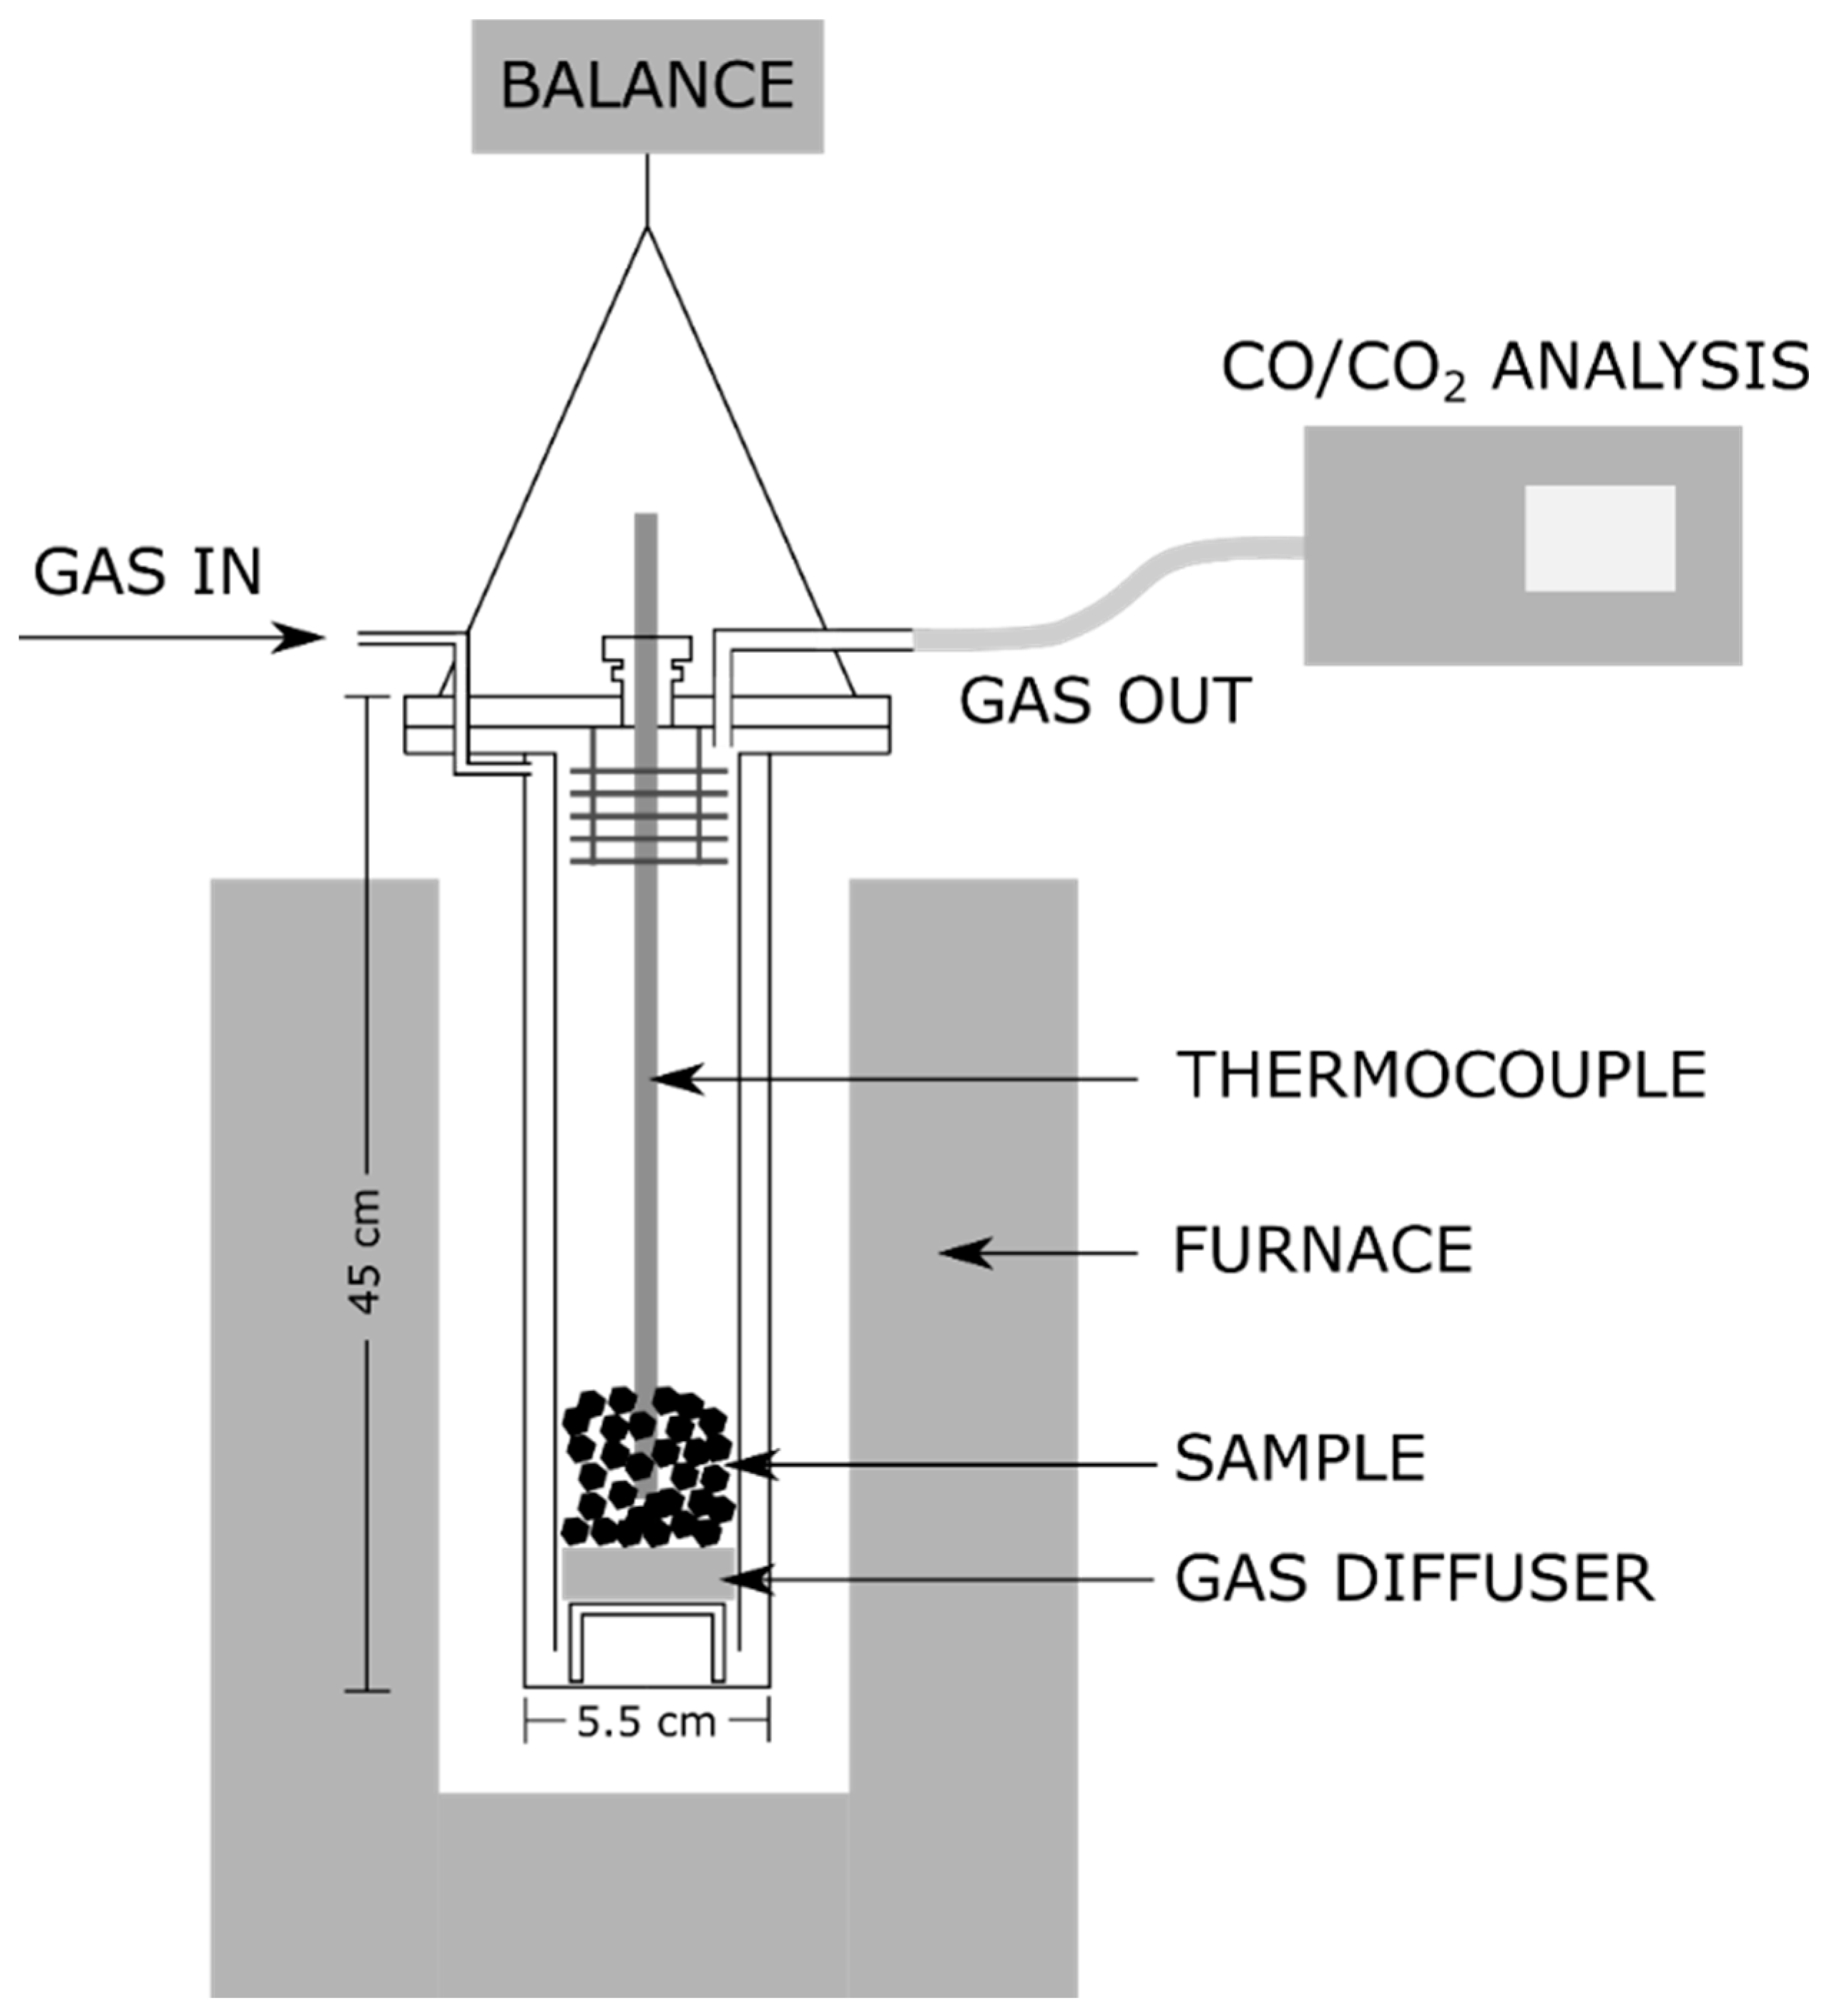
2.2. Methane cracking setups

Biocarbon samples were exposed to methane in two different setups. For both setups we use a resistance heated furnace controlled by an S-type thermocouple placed near SiC heating elements. Mass flow controllers are used to mix the process gases which are then purged through the bottom of the furnace and through an inlet gas dispersing plug at the bottom of the crucible. The gas inlet is water cooled to prevent methane cracking before methane enters the hot crucible. The experiments start with purging an inert gas at 3 NL/min to remove all traces of oxygen. When the reactor reaches the set temperature, the inert gas is replaced with a mixture of methane and either nitrogen or argon at different ratios. However, the total gas flow was always constant at 3 NL/min. The crucible used is made from a high temperature resistant FeCrAl alloy. The first setup, setup A, used a special sample holder insert with five compartments that allowed samples of all different biocarbons to be exposed to the same experimental conditions at the same time. All materials were placed at the same level and did not affect each other. The sample holder was placed on top of the gas nozzle.
The second setup, setup B, was the same as the first setup, but without the sample insert, meaning one type of material is tested each time. In this setup the amount of material is larger. Charge temperature was logged by a K-type thermocouple placed within an alumina sheet and positioned near the center of the charge. Off-gas exits in top of the crucible and a part stream is pumped into a micro-chromatograph (GC) for off-gas analysis. The crucible and off-gas system had an overpressure from 150 – 350 mbar. The sample gas was filtrated using sintered metal filters. The sample gas temperature was monitored with the help of a K-type thermocouple. A digital pressure gauge at the upstream side of the membrane pump was used to monitor the filter resistance. The micro-GC was calibrated to analyze CH4, C2H4, C2H6, CO, CO2, H2, N2 and O2. Figure 1 shows a schematic view of the setup.
Table 1 shows an overview of all performed experiments. Experiment 1-6 were performed in setup A with each experiment generating 5 treated biocarbon samples, produced at conditions depicted in Table 1. Experiments 7-11 were performed in setup B, on an individual material with a sample size of ca. 80 grams and the main goal was to study the hydrogen production potential for these five different materials.

2.3. Biocarbon characterization

2.3.1. Proximate analysis

The proximate analysis of the biocarbon was conducted in accordance with procedures described in standard D1762-84. For each sample, triplicated analyses were conducted, and the average values are presented in . The ash content was measured by keeping one gram of dried biocarbon sample at a temperature of 750 °C for 6 hours in a crucible with no lid.

2.3.2. Element analysis

The elemental composition of biocarbon samples were analyzed with an elemental analyzer of type Eurovector EA 3000 CHNS-O where the oxygen content was calculated by difference. The average values of triplicated analyses are presented in this study.

2.3.3. Ash forming element analysis

Ash forming concentration is measured using an inductively coupled plasma-atomic emission spectrometer (ICP-AES). Samples were dissolved in mixture of acids (HNO3, HF and H3BO3) and were sent afterwards to a pressurized multi-step digester. The digested solution was then analyzed by ICP-AES. The results presented in this study are the average of triplicate analyses.

2.3.4. Surface area, porosity and density analysis

The surface area of biocarbon samples was characterized with N2 adsorption using an analyzer of type Autosorb-1-MP (Quantachrome Instruments, USA). Before the adsorption measurement, the biocarbon samples were ground and degassed in vacuum at 150 °C for 12 hours. The N2 adsorption isotherms were measured at a relative pressure (p/p0) of ~5*10-6 to ~1 at 77 K. From the obtained N2 adsorption isotherms, the specific surface of one sample was determined by applying the BET method. The range of application for the BET method was selected following the recommendations provided by Maziarka et al. [31]. The true density of the biocarbon samples was analyzed using a helium pycnometer (Anton-Paar Ultrapyc 5000). Prior to analysis, the ground biocarbon was dried at 105 °C for 8 hours. More details on both the surface area and the density analysis can be found in our previous work [32].

2.3.5. Raman analysis

Raman spectroscopy was performed on the biocarbon samples to analyze the molecular structure of the biocarbon. Raman spectra were collected using a WITec Alpha300r instrument from Oxford Instruments. The laser power was set at 6 mW and spectra were collected from five different regions, with an exposure time of 120 s. The spectrum region 800-2200 cm-1 was used in all analyses. Cosmic ray spikes were removed using the method developed by Schulze and Tuner. All spectra were smoothed using Savitzky and Golay filter [33], with subtraction of baseline to eliminate the fluorescence signal, according to Cao et al. [34]. In this work, the 5-band method was used to deconvolute the Raman spectra, to improve the fitting precision of the deconvolution results and obtain more details about the structure of the carbon materials. Five bands were assigned to the relevant Raman bands, including D band at 1350 cm–1, G band at 1590 cm–1, V band at a valley around 1450 cm–1, D3 band at 1540 cm–1 and D4 band at 1185 cm–1. The D3 and D4 bands are included to identify possible amorphous carbon structures related to the formation and deposition of the products from methane cracking on the surface of the biocarbon. The 5-band method has been used and reported in other studies [35,36,37,38].

2.3.6. SEM-EDS analysis

The microstructure and morphology of biocarbon samples were examined by using a scanning electron microscope (Zeiss Ultra 55 Limited Edition). The biocarbon samples collected from the reactor before and after grinding were examined.

2.3.7. Mechanical properties analysis

The strength of the sample was estimated by tumbling the sample in a Hannover drum. For the cold strength test the biocarbons were crushed and sieved by hand; the 5-10 mm size fraction of around 20-25 g, was selected and placed in a steel drum measuring 30 cm in diameter that contained 4 risers spaced 90 degrees apart. The sample was tumbled for a total of 30 minutes in 2 steps. For step 1 the sample was tumbled for 10 minutes at 40 rpm, after which the sample was removed, sieved to 6.3, 4.75, 3.35 and 1.25-mm size fractions and the size distribution was measured. The entire sample was placed back in the drum and tumbled for 20 more minutes at 40 rpm before being removed and re-sieved. The fraction of fines formed is reported from this test. In this case fines are defined as any material with a size fraction below 3.35 mm. Cold strength indicates the fines generation during transportation as well as the ability to withstand the weight above it without undergoing crushing.

2.3.8. CO2-Reactivity

The CO2 reactivity test was conducted with 20 g of sample material which was placed in a double-walled steel crucible. The crucible, suspended from a balance, continuously recorded the sample's weight. Gas was introduced into the crucible through the double wall, flowing from the bottom up through the sample. In this manner, the gas was preheated to match the sample's temperature. The crucible and furnace setup are depicted in Figure 2. During the test, the sample is heated to 1100 °C in an argon atmosphere. Once the desired temperature is achieved, the atmosphere is switched to a 50:50 mixture of carbon monoxide and carbon dioxide, with a total flow of 4 NL/min. The sample is then kept at 1100 °C until 20% of the fixed carbon has reacted. Following this reaction, the sample is cooled to room temperature in an argon atmosphere. The mass loss curve is utilized to calculate the reactivity in terms of the percentage of fixed carbon reacting per minute (%Fix C reacted/minute).

3. Results and discussion

3.1. Hydrogen potential from catalytic methane cracking

A summary of the individual experiments performed at a reactor temperature of 1100 °C, and with purge gas input of 90/10 of CH4/N2 is shown in Table 2. The holding time with the CH4 purge was 90 minutes except for experiment #7, with spruce wood, which stopped at the 75 minutes mark due to unexpected complications. The start weight for the biocarbon catalyst was about 80 g, except for SEP which was about 100 g. During the experiments, the biocarbon catalyst is heated to the target temperature in an inert atmosphere. The gases that are released during that period are measured with a GC and are mainly composed of H2, CO, and CO2. These volatiles could be released because of CO2 adsorption from ambient air or because of volatiles that are still left in the biocarbon due to the difference in temperature at which these biocarbons were produced (1000 °C). These volatiles are depicted in row 2 in Table 2 in total grams and in weight percent relative to the initial weight, depicted in row 1. This amount is then subtracted from the initial biocarbon weight and is presented in row 3. The weight loss prior to treatment varies around 1 % relative to the initial weight, except for the experiment with spruce wood where this initial weight loss is minimal. When the holding time reaches 90 minutes, the methane is stopped and replaced with nitrogen. The electrical heating is stopped and the treated biocarbons are left to cool before they are taken out from the basket, sieved with a mesh size of 2 mm, and weighed. The weight gained in grams and relative to the start biocarbon mass are shown in row 4. It is important to mention that experiments with birch wood had some challenges with air leakage which resulted in a CO concentration of 1.2 mol % at the outlet of the reactor which was stable during the entire methane purge period. The oxygen leakage resulted in both a partial oxidation of the methane and of the deposited carbon which could explain the lower deposition rate in comparison to the experiment with spruce wood. Although there are some compositional and physical differences between the two wood species, these differences alone cannot explain the large difference in the amount of carbon deposition, which must mainly be a result of the air leakage. The results for birch wood are for this reason not included neither in Table 2 nor in the carbon balance (Figure 3). The weight gain is about 42 % for spruce wood and birch bark, 33 % for wood pellets and 13-14 % for birch wood and steam explosion pellets. The total gas amounts leaving the reactor during methane purge is also shown in Table 2. The gases are mainly composed of “uncracked” methane, hydrogen and minor amounts of ethylene and ethane. The hydrogen concentration is also calculated relative to methane input in mol/mol and relative to biocarbon weight in (mol/kg). The hydrogen production relative to the methane input lies around 0.8 mol H2/mol CH4 for all tested biocarbons, a ratio of 2 being the theoretical upper limit if all methane is cracked to elemental carbon and hydrogen. This ratio, however, is largely influenced by the entire reactor which is quite large relative to the biocarbon sample size, and which can also act as a platform for methane cracking. In all experiments and for the duration of the entire methane purge, the hydrogen and methane concentrations were stable. Hydrogen production is also shown in the same table relative to the start biocarbon weight and shows that highest production is achieved with birch bark. This biocarbon is relatively more porous which could explain its better effectiveness as a catalyst for the thermal decomposition of methane. The lowest hydrogen production relative to biocarbon weight used belongs to SEP. SEP is a compact material with high density, which is a good explanation for its lower catalytic performance. For spruce wood the hydrogen production potential is lower in comparison to the weight gained. As explained earlier, this experiment was stopped after 75 minutes of holding time which is 15 minutes shy of the 90 minutes target and could explain this deviation.
Figure 3 shows the carbon balance for the same experiments in weight percent relative to the carbon input to the rector during the methane purge. Approximately 40 % of the input carbon goes out of the reactor as unreacted methane. In a real application, it is expected that the catalyst bed would be much larger and the unreacted methane to be less. The total carbon that leaves the reactor as different gaseous species after the methane purge has been stopped, accounts for 2-11 % of the carbon input. This fraction is mainly composed of CH4 and H2. This is probably caused by a time delay that occurs when methane is replaced with nitrogen after the end of holding time and by the delay it takes for the GC to quantify the gas composition. The part of the total solid carbon that is not found in the biocarbon matrix is elemental carbon that is accumulated on reactor walls or leaves the reactor as particles along with the gases. This fraction is not measured but calculated by difference relative to the carbon input. As can be seen from the figure this share is lowest for the spruce wood sample that had a lower holding time relative to the other experiments.

3.2. Characterization of the treated biocarbon

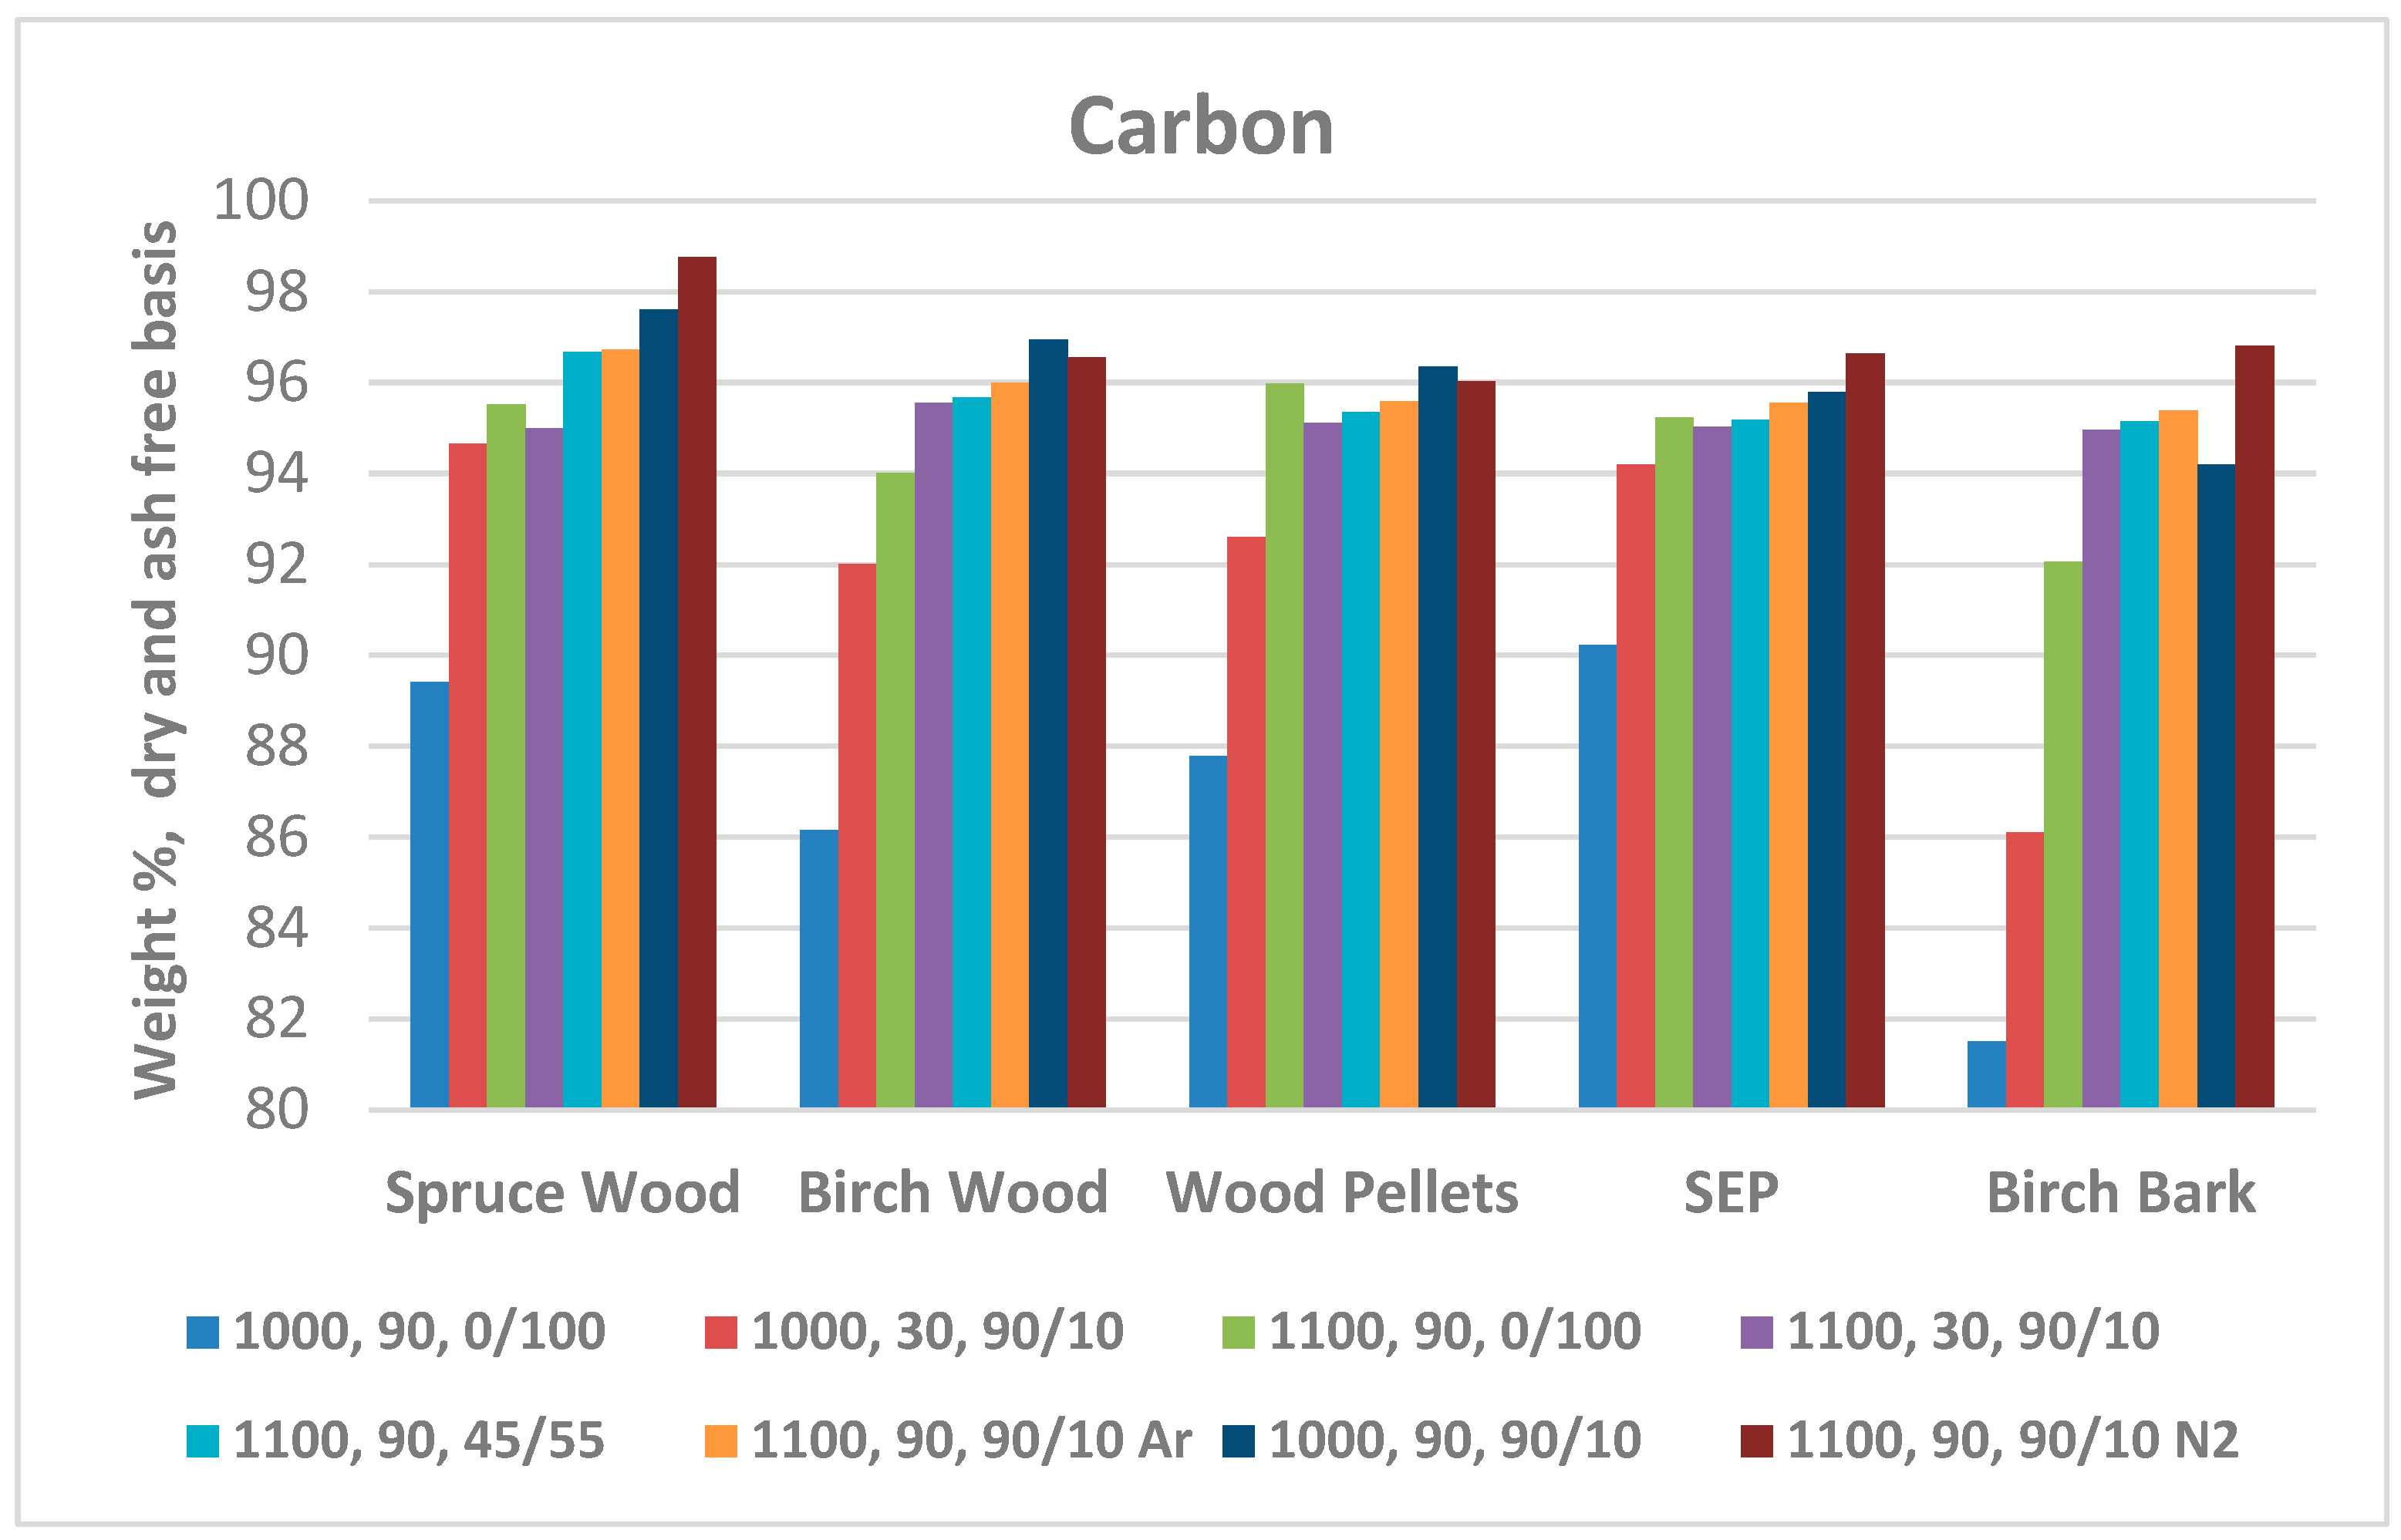
3.2.1. Proximate and element analysis

The proximate analysis was only performed on the original biocarbon and the individual experiments that were performed with gas analysis (exp 7-11). The other experiments were performed with smaller sample sizes (20 grams of each material), as there was not enough material to do a proximate analysis. The results in Table 3 show that the volatile matter decreases after the biocarbon has been used for methane cracking. The volatile loss could be due to the temperature increase in the cracking reactor which was performed at a 100 °C higher temperature than at which the biocarbon was produced. The ash content is decreasing which is due to the relative mass increase of the treated biocarbon, and the release of ash forming elements during the CDM.
The ultimate analyses for all treated biocarbons and the original biocarbons are depicted in Table 4. The original biocarbon materials, prepared at 1000 °C, have the lowest carbon content. The original material has also higher hydrogen and oxygen content with average H/C and O/C ratios of 0.1 and 0.08 respectively. After the materials were used for methane cracking, these ratios decreased substantially. For experiments with 30 minutes holding times, performed both at 1000 °C and 1100 °C, the hydrogen and oxygen content was still somewhat higher in comparison to the experiments performed at longer holding times.
Figure 4 shows the weight % of carbon on dry and ash free basis for all biocarbons, including the untreated samples. As previously mentioned, the raw biocarbon was prepared at 1000 °C and a holding time of 90 minutes in an inert atmosphere. The legend in Figure 4 shows the temperature at which the experiments were performed followed by the holding time and last the methane/inert ratio at which the reactor was purged. As can be seen from the figure the spruce wood seems to have the highest carbon content followed by the birch bark. Birch wood and wood pellets have similar carbon content, while the steam explosion pellets had the least carbon content. The third series from the left shows the carbon increase for the experiments performed in an inert atmosphere at 1100 °C. The higher carbon content for these experiments is due to the volatile release caused by the 100 °C increase of pyrolysis temperature. For the experiments performed at 1000 °C, the increase in holding time from 30 to 90 minutes seems to significantly increase the carbon concentration in the sample. The effect of holding time is less significant for the experiments performed at 1100 °C. Also, decreasing the methane purge concentration to 45 % at 1100 °C seems to have a minor effect on the carbon concentration in the biocarbon.

3.2.2. Ash forming element analysis

The ash analysis from some of the experiments are shown in Table 5. For the individual experiments #7-11 (Table 1), a metal balance could be calculated, relative to the untreated biocarbon. The calculations took into account the dilution effect due to the mass increase which was reported in Table 2. For the alkali metals, potassium and sodium, we notice that on average a 90 % decrease of the alkali content in the biocarbon after treatment with CDM at 1100 °C and for 90 minutes. The alkali metal content is also lower for the pyrolysis experiments performed at 1100 °C (no CDM), however at a much lower rate in comparison to the CDM experiment at the same temperature. As Table 5 shows, pyrolysis experiments performed at 1100 °C still retained a substantial share of the alkali metals. It is not entirely understood why these elements are removed to a larger extent under CDM, but it might be so that the presence of hydrogen and H radicals from the decomposition of methane could be causing the volatility of these metals. This is of course good news for obtaining less reactive biocarbon as alkali metals usually have a catalytic effect that would increase the carbon reactivity. The alkali effect on carbon conversion has shown to improve the carbon conversion efficiency and the syngas yield in the gasification of biomass [39]. The improved reactivity was accredited to the influence of algae addition due to its high content of alkaline and alkaline-earth metals species. Other elements that seem to be removed in significant amounts at the same experimental conditions are phosphorus and aluminum. Relative to the original biocarbon material the average removal of these compounds is 30 %.

3.2.3. Surface, and density analysis

The results from the surface area and density measurements are depicted in Table 6. The percentage numbers in the parentheses describe the decrease in surface area/density relative to the biocarbon prior to treatment. The surface area for the five samples varied between 88-203 m2/g, with SEP having the lowest and birch bark the highest. The relative decrease in surface area is highest for birch wood at 34 % and lowest for wood pellets at 11 %. The pellets feedstocks are relatively compact to begin with and treatment via carbon deposition has little effect on the surface area. It is worth noting that the reported density is the helium-based solid density, also called the skeletal density. The skeletal density is calculated by dividing the sample mass with its skeletal volume. The skeletal volume is obtained by measuring how much helium can be used to occupy the porous structure inside the particle. As shown in Table 6, the density of the untreated biocarbon is in the range of 1.7-2.04 g cm-3. These values are close to those measured from biocarbon produced with slow pyrolysis of pitch pine at a temperature of 1000 °C [40]. The skeletal density of the CDM treated biocarbon decreased in comparison to the untreated sample. This could be due to a larger pore structure of the CDM treated biocarbons, caused by the increased volatile release as the temperature is 100 °C higher in comparison to the untreated samples.

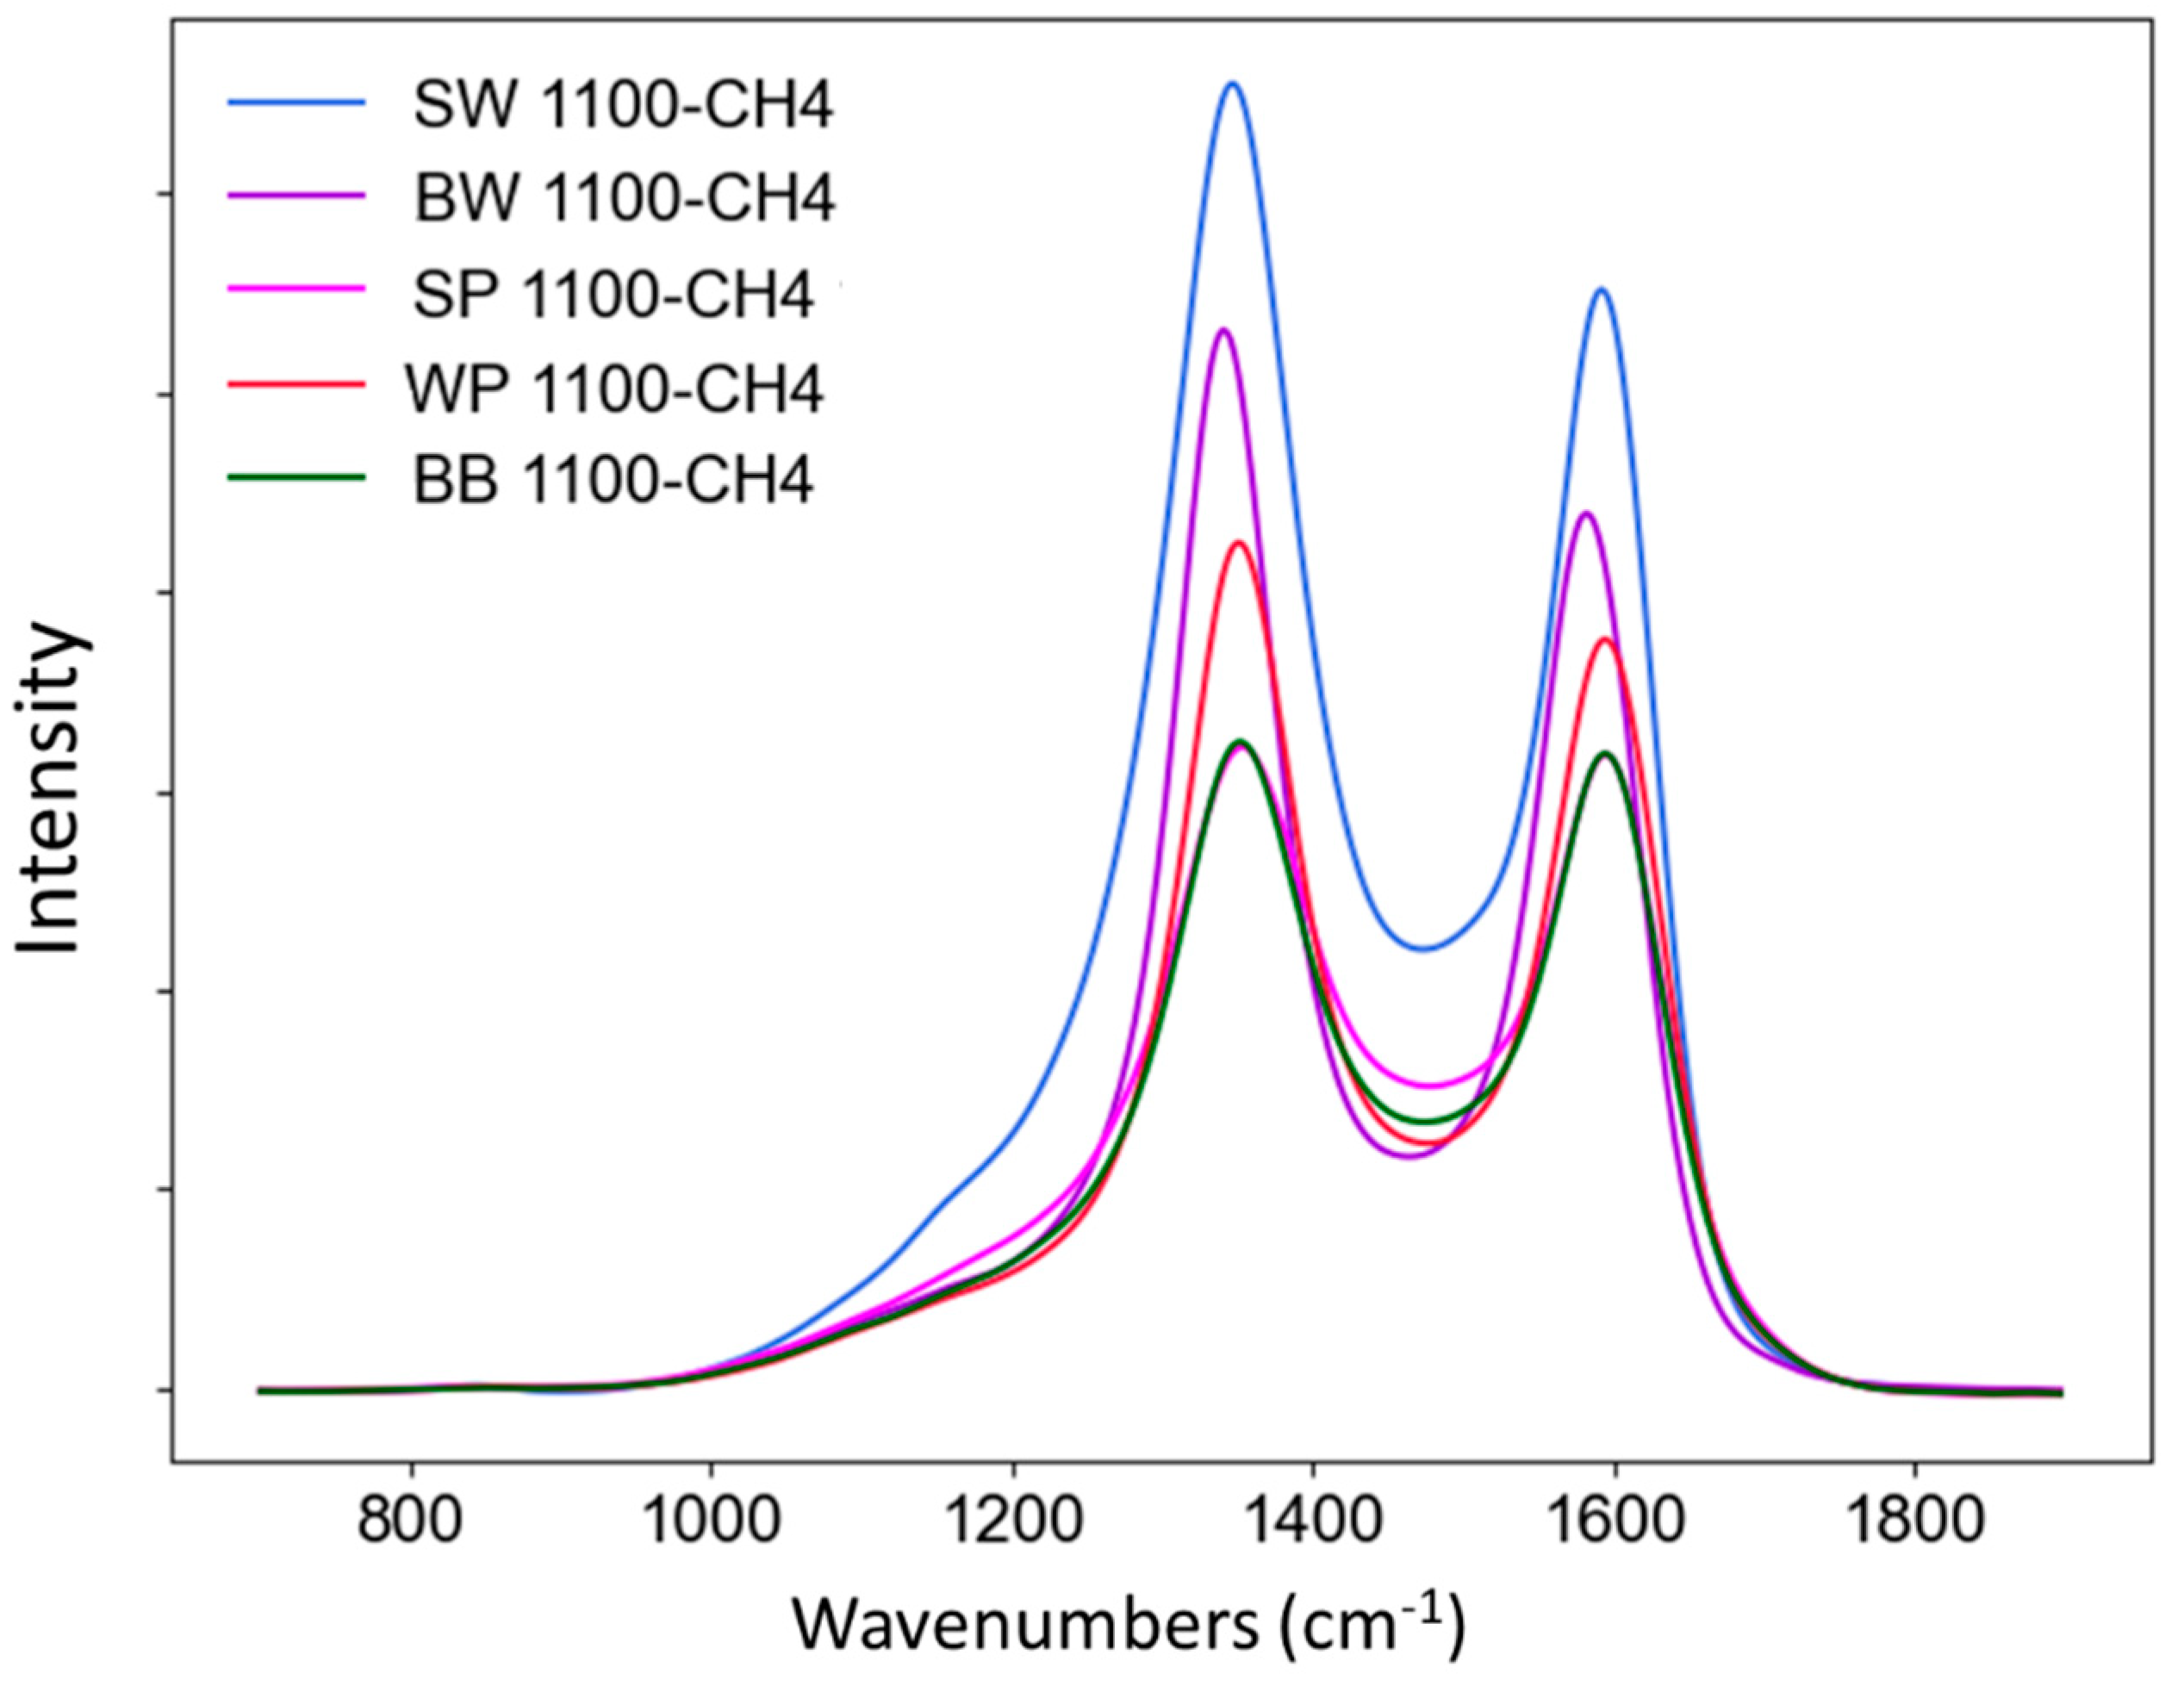
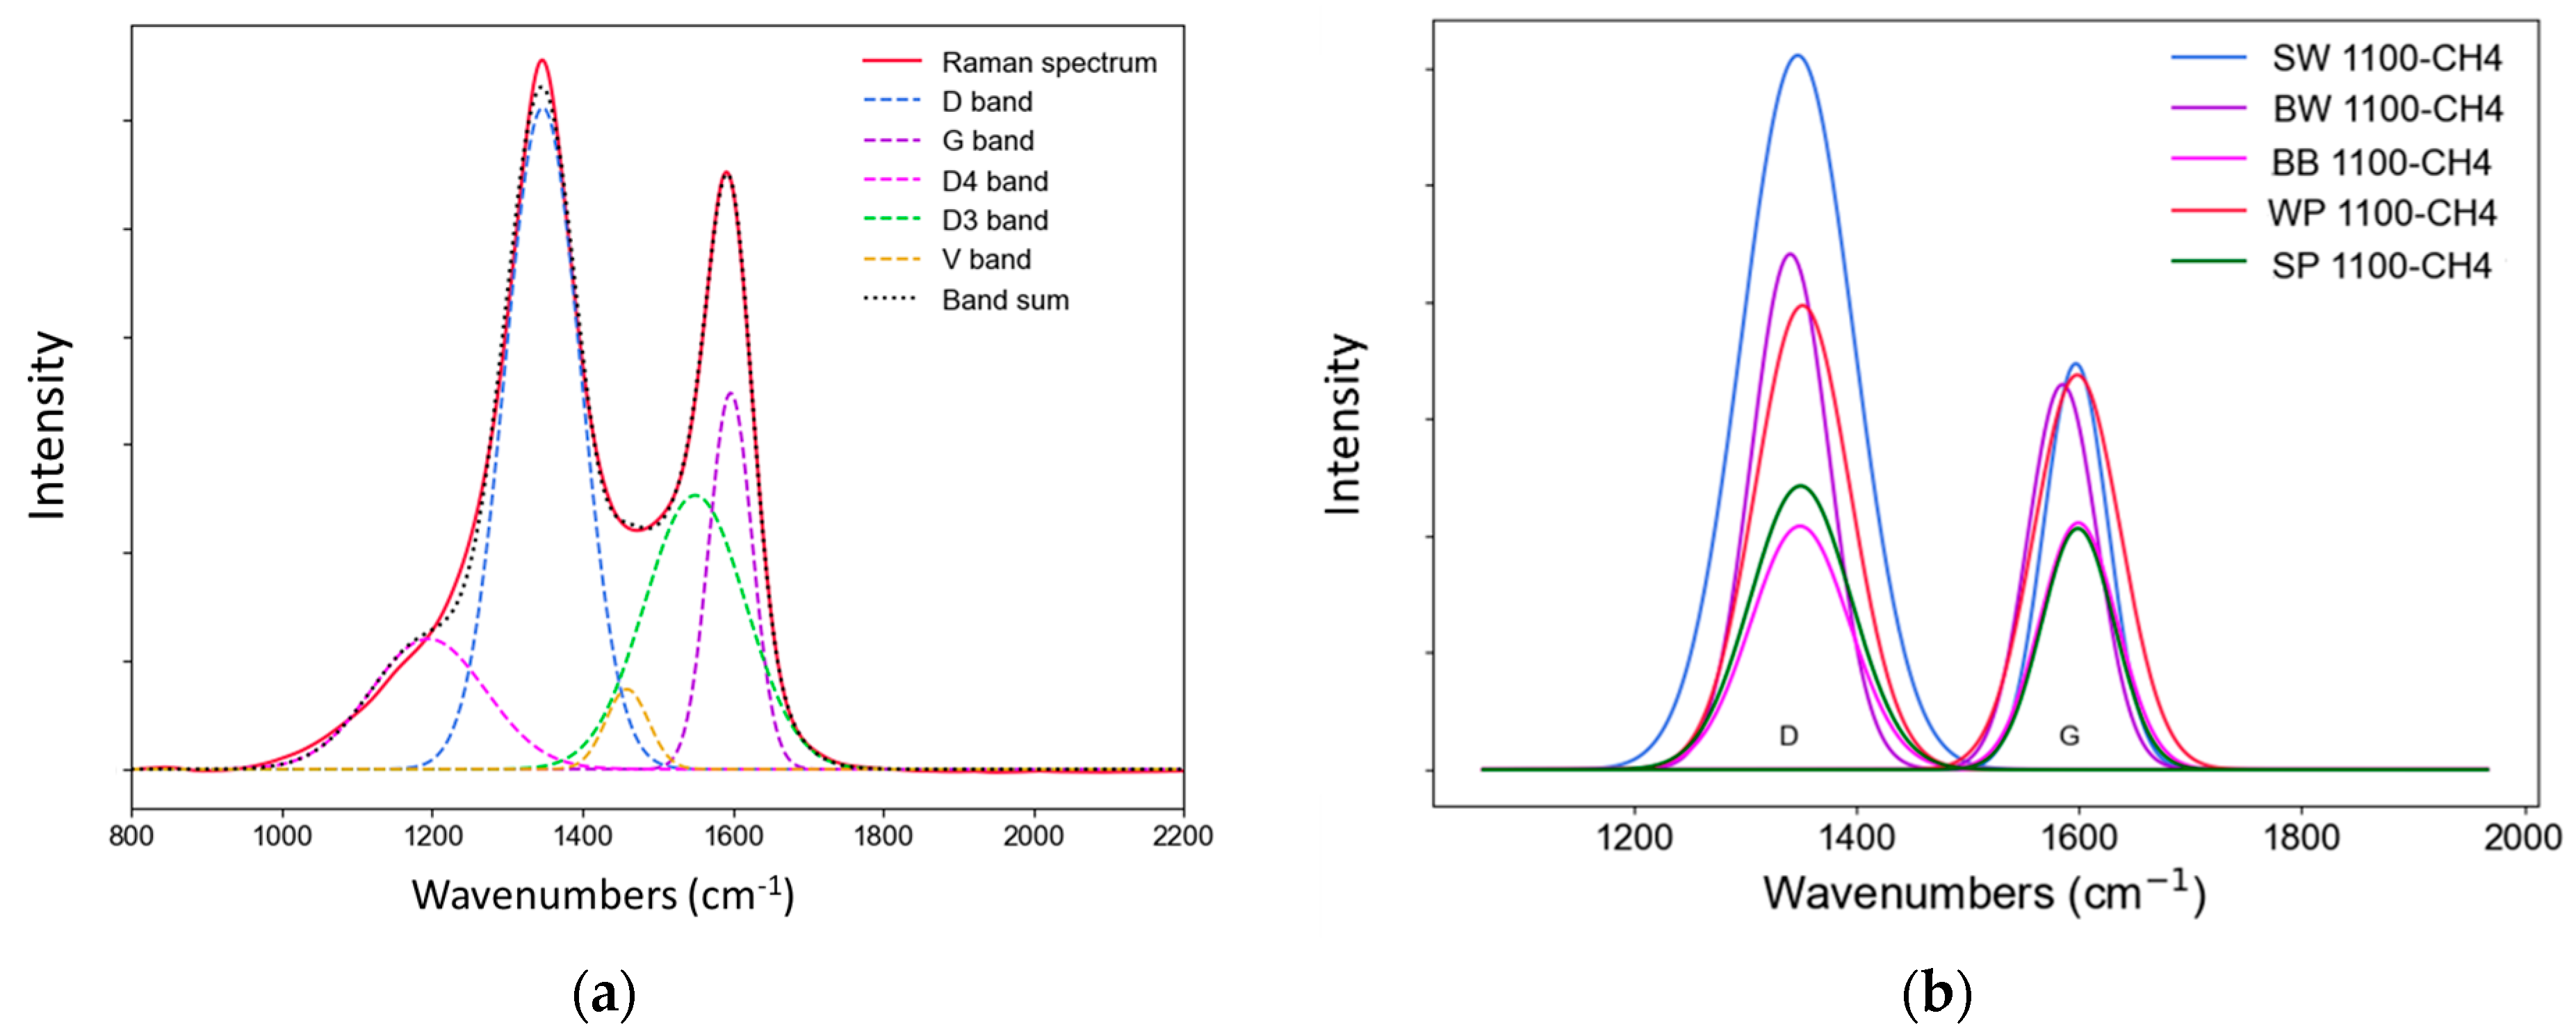
3.2.4. Raman analysis

Figure 5 shows the Raman spectra of the five biocarbon samples after methane cracking. For the current study, the main purpose of the Raman analysis is to characterize structural differences of the biocarbon after methane cracking. These D3 and D4 bands are included to identify formation and presence of amorphous carbon structures related to formation and depositions of the carbonous products from methane cracking on the surface of the biocarbon. The data for the untreated biocarbons have been published elsewhere [30]. These spectra have a common feature with detection of 2 specific bands that are common to carbon materials. Raman spectra from the studied samples are generally overlapping across the wavenumber ranges. All five spectra were further processed with deconvolution to show the hidden peak of each sub-band. Figure 6 shows an exemplary Raman spectrum for the spruce wood biocarbon, treated at 1100 °C with CH4/N2 of 90/10 (SW 1100-CH4-90) and its deconvolution by curve fitting. The first order Raman spectra of this sample is characterized by three main strong peaks: the D (or D1, Defect or Disorder) band around ~ 1350 cm−1, G (Graphite) band around ~ 1590 cm−1, and D3 (or A) band around ~ 1540 cm−1. The D band is normally related to presence of carbon with disordered structure or induced by disorders in the graphitic lattice, which can be explained by double resonant Raman scattering. The G band corresponds to the graphite band that is normally attributed to an ideal graphitic lattice vibration mode with E2g symmetry [41,42].
The spectral parameters including the ratio of integral area, integral intensity and full width at half maximum (FWHM) of the deconvoluted D and G bands are listed in Table 7. The spectral parameters indicate different microstructures of the studied biocarbon samples. The D and G band of the SW are sharper as shown in Figure 6, with much higher peak values than those from other biocarbon samples (Table 7). It implies that SW has a higher ordered carbon structure. Such high ordered structure can be related to more intensive and active deposition of carbon from the CDM, which is consistent with the higher mass gain results shown in Table 2. The carbon deposited from the methane has a more pronounced graphitic structure, which can partially explain the more ordered structure of the SW. As reported by Kameya et al. [42], the carbon deposited from the cracking of methane can lead to the formation of carbonaceous layers with more ordered and graphitic structure even after short reaction time. In addition to the carbon deposition, the difference in Raman spectral parameters can also be related to changes in the microstructure of the carbon material itself caused by the high temperature treatment (i.e., 1100 °C used in the current study) [43]. While heating at a high temperature, annealing of the carbon material will take place, which also can lead to the formation of carbon with a more ordered structure resulting in graphitization [44]. The presence of ash forming elements can also lead to the formation of carbon with different microstructures [42]. Effects of nickel catalyst on the microstructure of beech wood biocarbon and the nature of deposited carbon from methane decomposition have been studied [41]. Raman analyses showed that the biocarbon with Ni loading, had considerably lower D and G band intensities and ID/IG than the raw biocarbon. The authors implied that the presence of ash forming elements can affect deposition mechanisms and thereby, the structure of the carbon deposition[41].

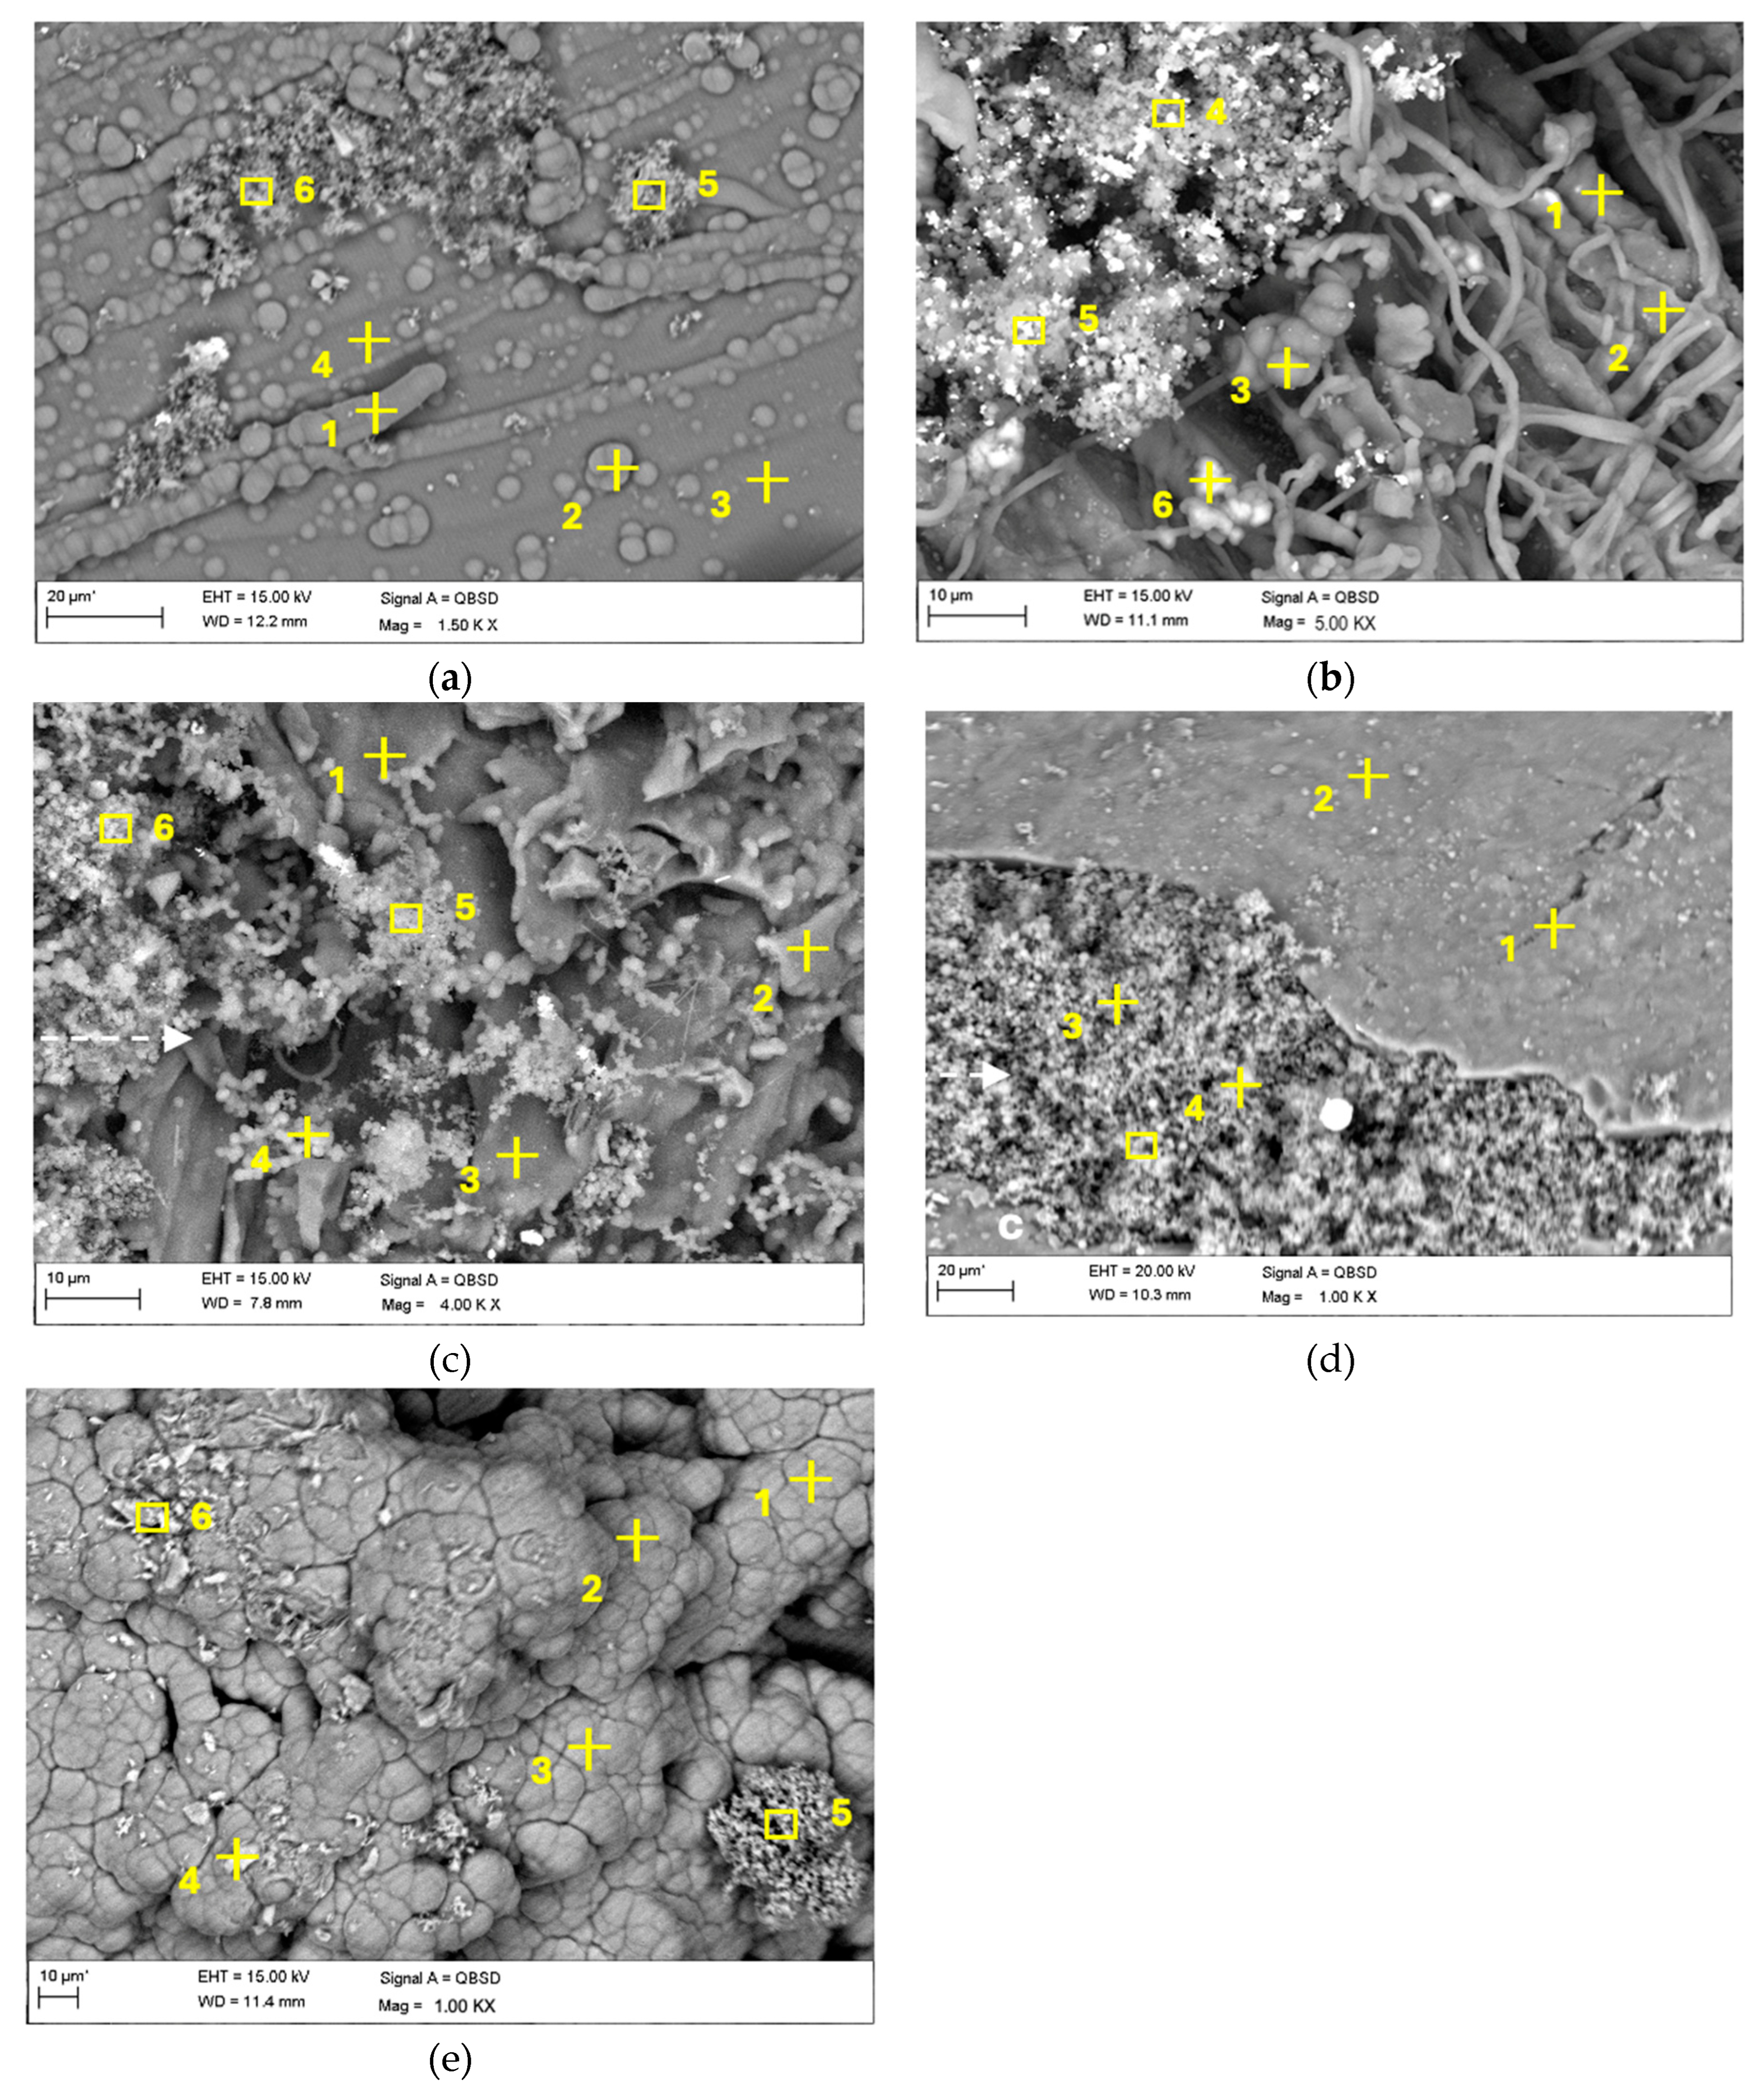
3.2.5. SEM-EDS analysis

The results of the SEM-EDS analysis are shown in Figure 7 and Table 8. Only the SEM-EDS analysis of the treated biocarbons are presented as the results of the untreated biocarbons have been published elsewhere [30]. The five biocarbon samples after carbon deposition have different morphologies. There are materials with distinguishable ''filamentous'' and ''spherical'' like structures, which can be attributed to carbon deposition on the biocarbon surface. Carbon in similar forms deposited on beech surfaces was reported by Guizani et al. [41]. The spruce biocarbon (a) has a smooth surface area with spherical and cylindrical grown structures on top. These structures are mainly composed of carbon (above 91 %) and oxygen as the balance element. In comparison, the smooth area has lower O content. The rough surface in points 5 and 6 contains small amounts of Ca and Si. The SEM image of birch biocarbon (b) shows large deposits branch shaped structures that have a high carbon concentration (99 %, point 1, 2 & 3). The analysis of spot 6 shows signs of carbon deposition forming a shell shaped structure around areas rich in Ca and Si. Guizani et al. observed the formation of a similar carbon layer on the Ni based catalyst surface[41]. In addition, high content of Ca, O and Si were detected from the microstructures with brighter color (spot 4 and 5) together with some minor amounts of other ash elements. It indicates the migration and agglomeration of ash forming elements on biocarbon surfaces during high temperature treatment, which in turn get covered by carbon from the decomposition of methane. In such a case, these elements could act as catalysts, promoting the decomposition of methane. The wood pellets biocarbon (c) has a rough surface with thin paper-like layers covering the surface. These are mostly carbon deposits (point 1, 2, & 3), while the white areas (4, 5, & 6) have higher O concentrations in addition to the elements Ca, K and Na. The surface area for the steam explosion biocarbon pellets (d) has mainly large smooth and intact surface with much less openings (spot 1 and 2). Carbon is the dominant element detected from the smooth SEP surface. On the other hand, there are clusters of fine particles in the left corner of the SEM image, which is also caused by the deposition and accumulation of carbon from the cracked methane. In comparison to the spot with the smooth area, higher content of O and Si and lower content of C were detected from these clusters of fine particles (spot 3 and 4). It indicates different formation and deposition of carbon.
The birch bark biocarbon, depicted in Figure 7 (e), seems to have also rather smooth and intact surface with some minor white spots, similar to the other biocarbons. The smooth area (point 1, 2, & 3) contains roughly 3 % of Ca in addition to the carbon. While the white spots in comparison contain higher concentration of O, Si, Na, Mg and Al, indicating aggregation of ash forming elements on the bark biocarbon surface.

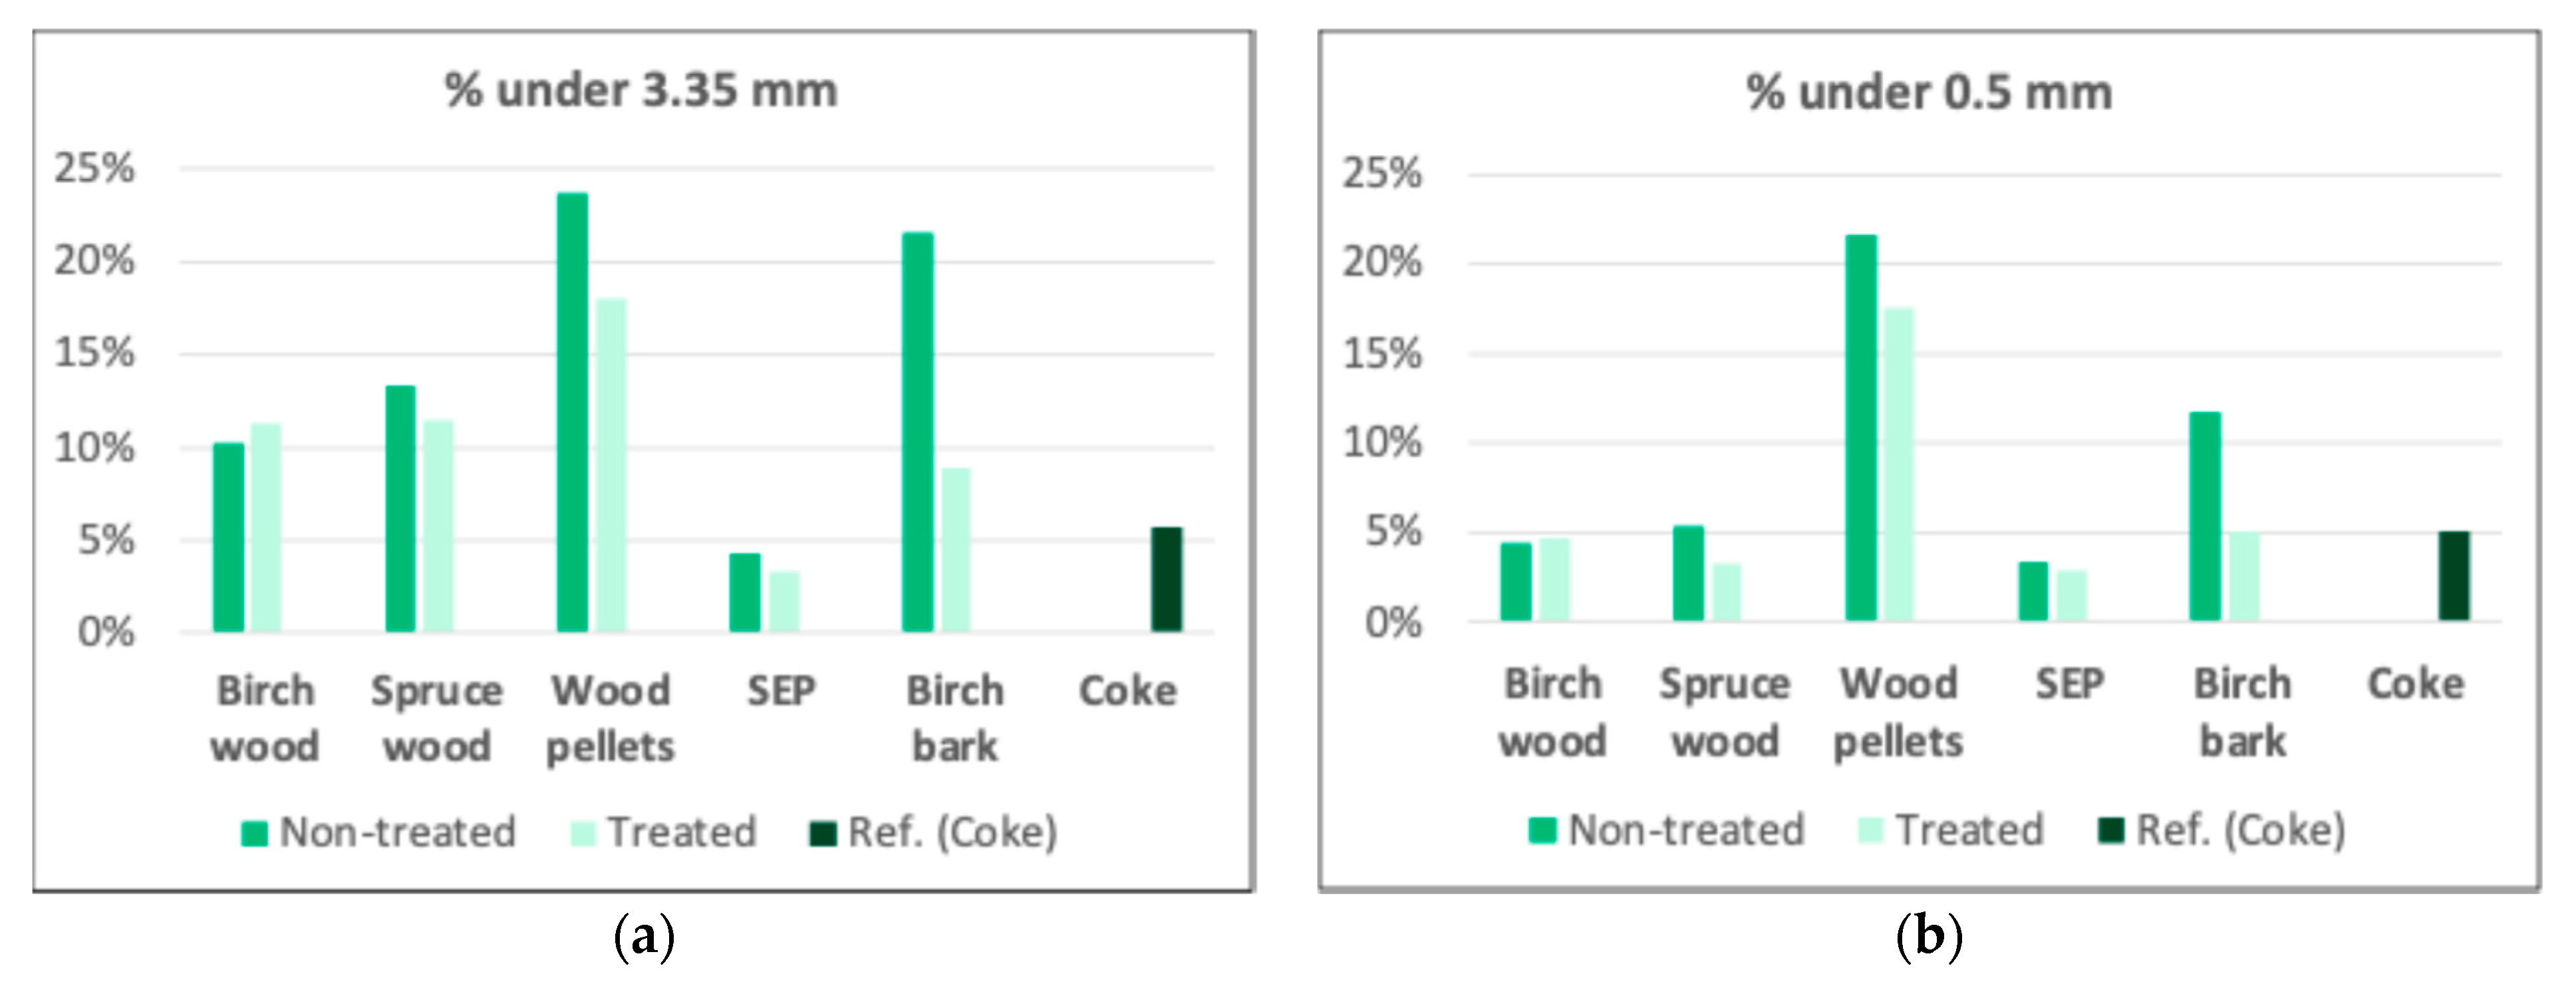
3.2.6. Mechanical properties analysis

The abrasion strength tests were performed by tumbling the samples for 30 minutes with a rotation speed of 40 rpm. Figure 8 shows the measured fine fraction that were weighed after sieving for both the raw and treated samples. Figure (a) shows the weight fraction for particles below 3.35 mm and Figure (b) for particles below 0.5 mm. A coke sample, which was also used as a reference in the CO2 reactivity tests is also here used as a reference in the mechanical property analysis. Steam explosion pellets produced the lowest number of fines for both fractions which is lower than the coke sample. Wood pellets, surprisingly, produced the largest number of fines among all materials. The wood chip species behaved in a similar manner with fines below 3.35 mm in the range of 10-14% and fines below 0.5 mm close to 5%. Birch bark produced high amounts of fines with 21% for particles below 3.35 mm (non-treated) which was second to wood pellets. The birch bark was also second to wood pellets for the fraction below 0.5 mm with 12 % for the non-treated sample. However, the birch bark seems to benefit the most from the methane cracking treatment and showed numbers close to the coke sample in the tumbling tests. In general, the treated samples have smaller fine fraction in comparison to their respective non-treated biocarbons. Carbon deposition in the treated material seem to influence the birch bark the most, where the fine fraction dropped from 20 to 10 % and from 12 to 5 % for the respective fractions of < 3.35 and < 0.5 mm. Also, wood pellets seem to have clear improvement with treatment while the rest of the samples had minor improvement.

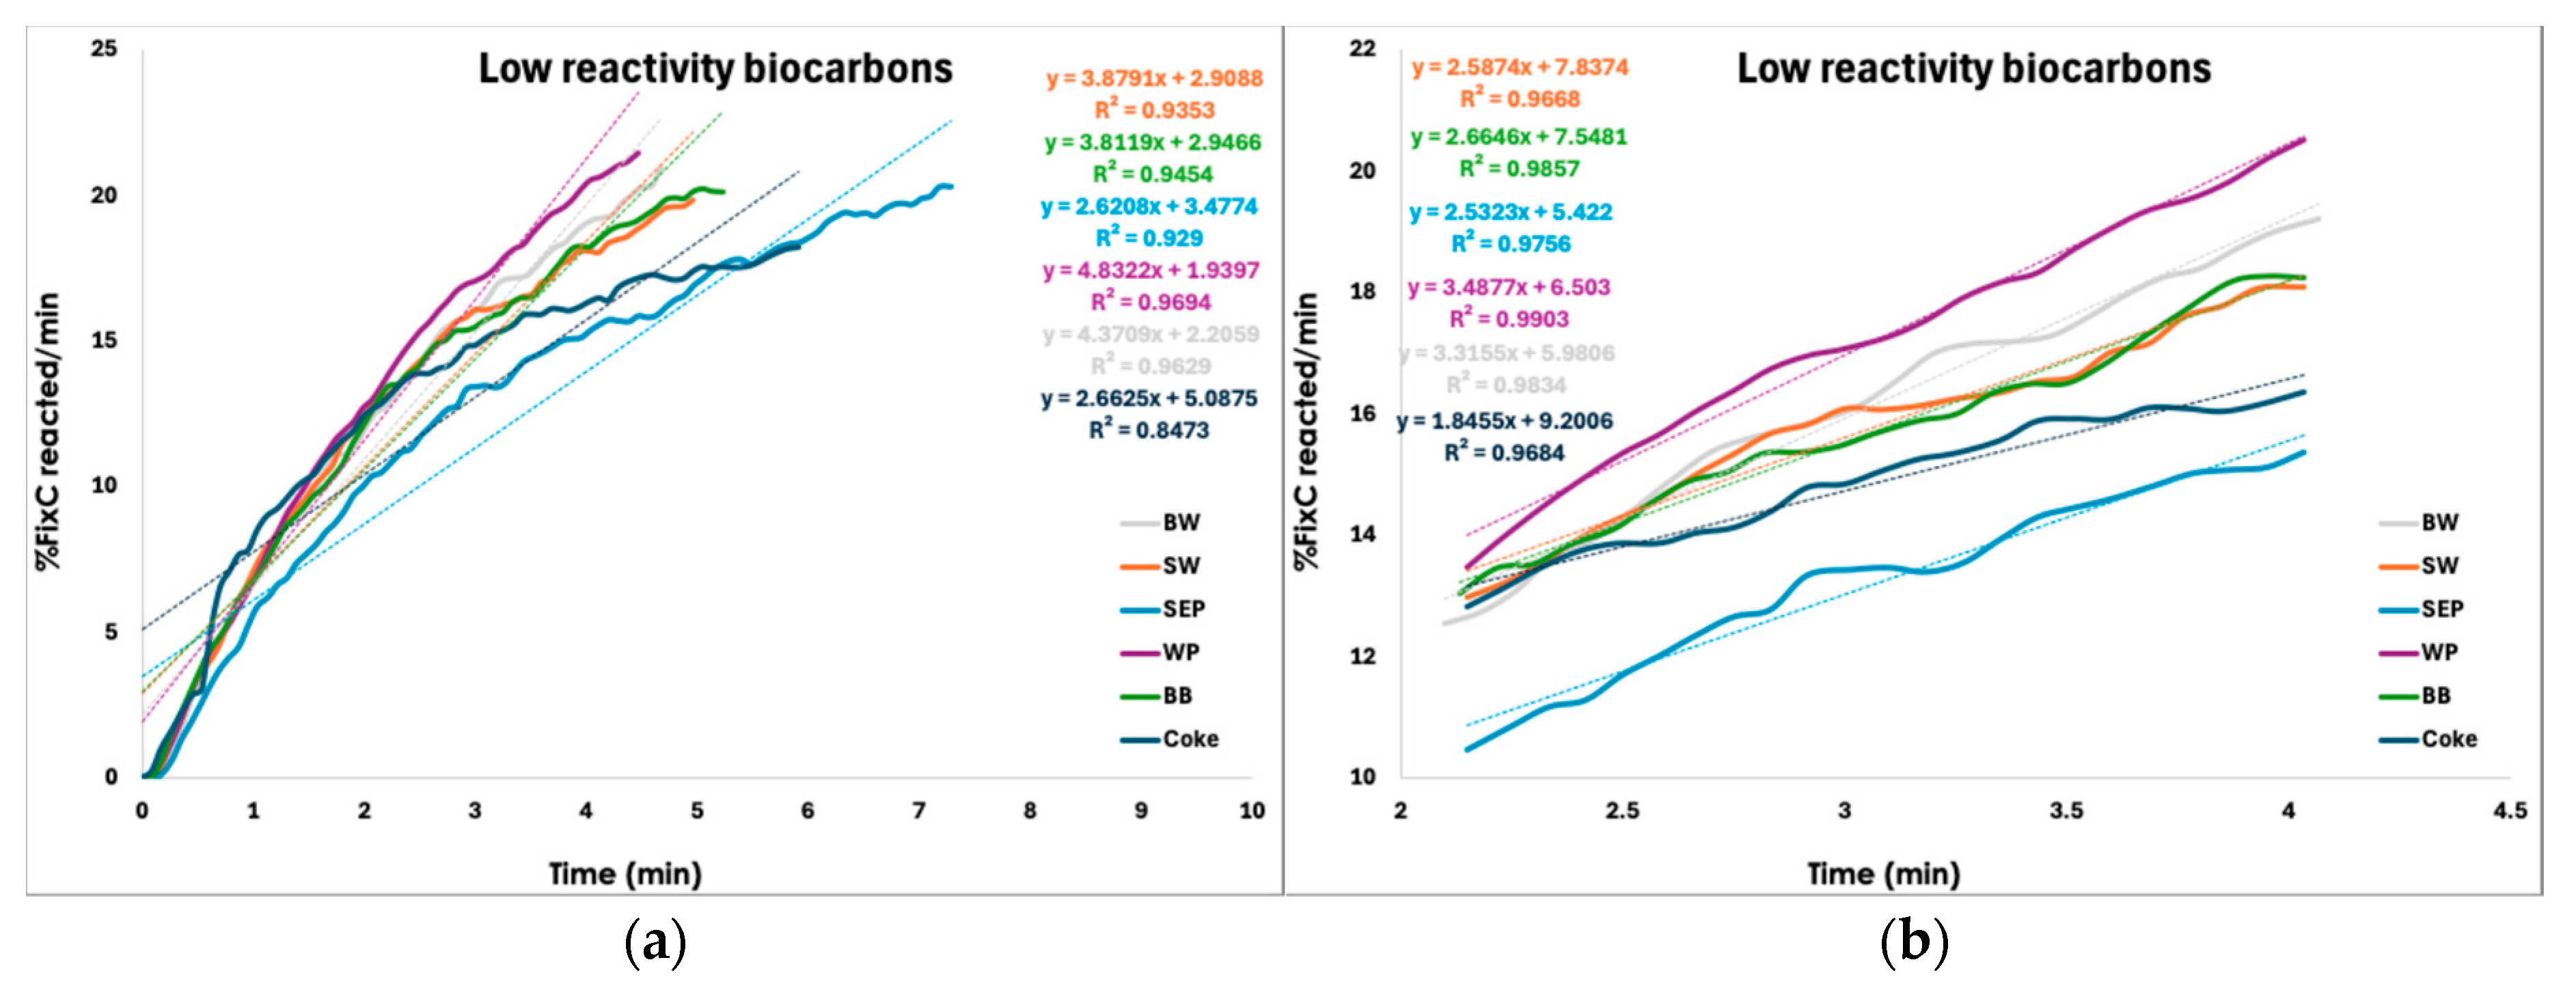
3.2.7. CO2-Reactivity

The CO2-reactivity measures the reaction rate of fixed carbon in a sample in a CO/CO2 atmosphere. Therefore, it is necessary to know the fixed C (Fix C) content in the biocarbon sample at the starting point. The proximate compositions for the treated and non-treated samples are presented in Table 3. The Fix C content in both the non-treated and treated samples is above 90%. After treatment, the Fix C increases by around 3%. Table 9 displays the CO2 reactivity characteristics of all samples. To determine the reaction rates for the different materials, the weight loss rate of the fixed carbon is plotted over time. The reaction rates are then obtained through linear interpolation of the various curves. Figure 9 shows the weight loss rates of the fixed carbon for the treated (low reactivity) samples along with their respective linear interpolation and the deducted reaction rates. Figure (a) depicts the weight loss rates and the reaction rates over the entire period, while Figure (b) shows the values between 2-4 minutes. Although the overall reaction rate is far from linear, it is possible to obtain reaction rates for shorter time intervals where the data fits a linear model more closely, as shown in Figure 9 (b). This approach aims at comparing the different materials to determine the effect of CDM on the reactivity of the treated material, as well as in comparison to the reference material, marked as coke in Figure 9. Similar figures have also been produced for the non-treated biocarbons and for different time periods, but only the deducted reaction rates are shown in Table 9. A possible explanation for the non-linearity could be that, initially, when gas is introduced into the system, a high reaction rate occurs within the first few seconds due to the immediate exposure of the sample to the gas. The gas then reacts rapidly with the sample, primarily because of its large surface area and high porosity. As the reaction progresses, the rate gradually slows down, attributed to the gas-solid reactions occurring in the denser regions of the sample.
It is observed that the non-treated sample exhibits a higher weight loss, slightly above 10%, compared to the treated samples, which show around 5%, except in the case of wood pellets, which also exhibit around 11% weight loss for both treated and non-treated material. It is important to note that the weight loss reported in Table 9 also includes the volatile loss during the heating of the sample in an inert atmosphere. To compare the results with an industrial coke sample, a reference test was performed using similar sample amounts (20 g). Empty cells in Table 9, indicated with a dash, means that there are no data available for that period. This occurs only for SW and BB for the non-treated biocarbons, during the 2-4 minute period, as the experiment was stopped when 20 % of the fixed carbon in the biocarbon had already reacted.
Although the rate of the reaction varies, the CO2 reactivity was found to be lowest for SEP followed by WP, SW, BW and BB, for the non-treated samples. However, the order for the treated samples differed slightly, with SEP still showing the lowest reactivity, followed by BB, SW, BW and WP. This shift indicates that WP is the biocarbon feedstock that benefited the least from the CDM treatment relative to BB, SW and BW. This could be due to the compact structure of the WP, where the increased temperature treatment leads to volatile release, making the interior porous, but limiting the potential for carbon deposition within. Notably, the BB sample showed the greatest improvement from the CDM treatment, moving from last place before treatment to second place after.
Many investigations on carbon sources were conducted previously to assess their reactivity in a CO/CO2 atmosphere45. However, all the charcoal types show significantly higher reactivity compared to the other tested carbon types. A study was conducted to investigate the effect of CO2 reactivity on treated industrial biocarbon by depositing 13–15% carbon from methane into the carbon matrix. This process aimed to reduce porosity and increase density to levels similar to coke10,46. The density of the biocarbon increased by 7–8%, confirming the carbon deposition. However, the CO2 reactivity of the treated biocarbon decreased compared to industrial biocarbon. This decrease in CO2 reactivity is likely due to the reduced porosity, which lowers the surface area and decrease the number of accessible active sites, as a result of increased density.
A similar trend in the reaction rates is observed for the treated samples in comparison to the non-treated samples. Overall, CO2 reactivity is very low for the treated SEP, followed by BW, SW, WP, and BB. SEP exhibits a reactivity (of 2.62 % fixed C reacted/min) matching that of industrial coke at 2.66 % fixed C reacted/min. Another noteworthy observation is that the reactivity of the treated samples is less than half compared to the non-treated biocarbon samples.

5. Conclusions

Methane cracking experiments were performed on five different biocarbons with the aim to produce low reactivity biocarbons and hydrogen. The effect of temperature (1000 and 1100 °C), holding time (30 and 90 min) and methane to (Ar or N2) ratio of the purge gas (90/10, 45/55 and 0/100) were studied. The hydrogen production potential was assessed in a limited number of experiments by measuring the gas concentration at the outlet of the laboratory scale reactor. The CDM treated biocarbons were accessed through a series of analytical characterizations that includes proximate and ultimate analysis, ash forming element analysis, surface area and density analysis, Raman analysis, SEM-EDS analysis, mechanical properties analysis, and CO2 reactivity. In general, it was shown that all biocarbons had the potential to act as a catalyst for decomposition of methane at the studied conditions. Due its high porosity, birch bark had the highest hydrogen production rate per catalyst mass at 105 mol/kg biocarbon. The lowest hydrogen production potential belonged to the SEP biocarbon. All biocarbons showed high carbon deposition that increased with reactor temperature, methane ratio in the purge gas and holding time. 90 % of the alkali metals potassium and sodium were removed from the biocarbon after treatment at 1100 °C, CH4/N2 of 90/10 and 90 minutes holding time. The alkali removal could be related to their active role in the methane decomposition and their removal will lead to lower reactivity in the treated biocarbon. Raman and SEM-EDS also showed a more structured carbon matrix and deposition on the particle surface which both should lead to lower reactivity. The reactivity analysis also confirmed that the CO2 reactivity was indeed lowered after the biocarbon densification. The treated SEP biocarbon had the lowest reactivity rate which was close to the reference coke sample that is considered suitable for as a reducing agent in manganese production.

Author Contributions

Conceptualization, R.K. and Ø.S.; methodology, R.K. And H. D.; validation, Ø.S., and H.D.; formal analysis, R.K.; investigation, L.W., P.T. and S. J.; data curation, R.K., L.W. and S.J.; writing—original draft preparation, R.K., H.D., L.W., and S.J.; writing—review and editing, R.K., H.D. and Ø.S.; visualization, R.K., L.W., P.T, and S.J.; supervision, R.K., H.D. and Ø.S.; project administration, R.K.; funding acquisition, R.K. All authors have read and agreed to the published version of the manuscript.

Funding

This research is part of the project C&H2Ar which is funded by the SINTEF Climate Fund, that supports research on solutions and technologies that reduce climate gases in the atmosphere. The research is also supported by the BioSynGas project, which is funded by the Research Council of Norway (Project Number: 319723)

Conflicts of Interest

The authors declare no conflicts of interest.

References

  1. Heintz, I.; Mousa, E.; Ye, G. Development of Fossil-Free Technologies for the Metallurgical Industry—Swerim Pilot and Industrial Experiences. In Proceedings of the Advances in Pyrometallurgy; Fleuriault, C., Steenkamp, J.D., Gregurek, D., White, J.F., Reynolds, Q.G., Mackey, P.J., Hockaday, S.A.C., Eds.; Springer Nature Switzerland: Cham, 2023; pp. 55–66. [Google Scholar]
  2. Souza Filho, I.R.; Springer, H.; Ma, Y.; Mahajan, A.; da Silva, C.C.; Kulse, M.; Raabe, D. Green Steel at Its Crossroads: Hybrid Hydrogen-Based Reduction of Iron Ores. Journal of Cleaner Production 2022, 340, 130805. [Google Scholar] [CrossRef]
  3. Abdul Quader, M.; Ahmed, S.; Dawal, S.Z.; Nukman, Y. Present Needs, Recent Progress and Future Trends of Energy-Efficient Ultra-Low Carbon Dioxide (CO2) Steelmaking (ULCOS) Program. Renewable and Sustainable Energy Reviews 2016, 55, 537–549. [Google Scholar] [CrossRef]
  4. Dalaker, H.; Hovig, E.W. Hydrogen Plasma-Based Reduction of Metal Oxides. In Proceedings of the Advances in Pyrometallurgy; Fleuriault, C., Steenkamp, J.D., Gregurek, D., White, J.F., Reynolds, Q.G., Mackey, P.J., Hockaday, S.A.C., Eds.; Springer Nature Switzerland: Cham, 2023; pp. 85–94. [Google Scholar]
  5. Schanche, T.L.; Tangstad, M. Prereduction of Nchwaning Ore in CO/CO2/H2 Gas Mixtures. Minerals 2021, 11, 1097. [Google Scholar] [CrossRef]
  6. Osen, K.S.; Dalaker, H.; Martinez, A.M.; Gudbrandsen, H.; Wang, Z.; Kero, I. CO2 Free FeMn/Mn Production Through Molten Oxide Electrolysis. In Proceedings of the Advances in Pyrometallurgy; Fleuriault, C., Steenkamp, J.D., Gregurek, D., White, J.F., Reynolds, Q.G., Mackey, P.J., Hockaday, S.A.C., Eds.; Springer Nature Switzerland: Cham, 2023; pp. 267–280. [Google Scholar]
  7. Allanore, A. Features and Challenges of Molten Oxide Electrolytes for Metal Extraction. J. Electrochem. Soc. 2014, 162, E13. [Google Scholar] [CrossRef]
  8. Wiencke, J.; Lavelaine, H.; Kane, G.J.; Panteix, P.-J.; Petitjean, C.; Rapin, C. Kinetics of Iron Electrochemical Reduction into Liquid Metal at 1823 K in a Molten Oxide Electrolyte. Materials Chemistry and Physics 2018, 212, 214–223. [Google Scholar] [CrossRef]
  9. Myrhaug, E.H. Non-Fossil Reduction Materials in the Silicon Process - Properties and Behaviour. 2003. [Google Scholar]
  10. Kaffash, H.; Surup, G.R.; Tangstad, M. Densification of Biocarbon and Its Effect on CO2 Reactivity. Processes 2021, 9, 193. [Google Scholar] [CrossRef]
  11. Abbas, H.F.; Wan Daud, W.M.A. Hydrogen Production by Methane Decomposition: A Review. International Journal of Hydrogen Energy 2010, 35, 1160–1190. [Google Scholar] [CrossRef]
  12. Zhang, J.; Li, X.; Chen, H.; Qi, M.; Zhang, G.; Hu, H.; Ma, X. Hydrogen Production by Catalytic Methane Decomposition: Carbon Materials as Catalysts or Catalyst Supports. International Journal of Hydrogen Energy 2017, 42, 19755–19775. [Google Scholar] [CrossRef]
  13. Suelves, I.; Lazaro, M.; Moliner, R.; Corbella, B.; Palacios, J. Hydrogen Production by Thermo Catalytic Decomposition of Methane on Ni-Based Catalysts: Influence of Operating Conditions on Catalyst Deactivation and Carbon Characteristics. International Journal of Hydrogen Energy 2005, 30, 1555–1567. [Google Scholar] [CrossRef]
  14. Amin, A.; Epling, W.; Croiset, E. Reaction and Deactivation Rates of Methane Catalytic Cracking over Nickel. Ind. Eng. Chem. Res. 2011, 50, 12460–12470. [Google Scholar] [CrossRef]
  15. Shah, N.; Panjala, D.; Huffman, G.P. Hydrogen Production by Catalytic Decomposition of Methane. Energy Fuels 2001, 15, 1528–1534. [Google Scholar] [CrossRef]
  16. Shen, W.; Wang, Y.; Shi, X.; Shah, N.; Huggins, F.; Bollineni, S.; Seehra, M.; Huffman, G. Catalytic Nonoxidative Dehydrogenation of Ethane over Fe–Ni and Ni Catalysts Supported on Mg(Al)O to Produce Hydrogen and Easily Purified Carbon Nanotubes. Energy Fuels 2007, 21, 3520–3529. [Google Scholar] [CrossRef]
  17. Wang, H.Y.; Lua, A.C. Development of Metallic Nickel Nanoparticle Catalyst for the Decomposition of Methane into Hydrogen and Carbon Nanofibers. J. Phys. Chem. C 2012, 116, 26765–26775. [Google Scholar] [CrossRef]
  18. Moliner, R.; Suelves, I.; Lazaro, M.; Moreno, O. Thermocatalytic Decomposition of Methane over Activated Carbons: Influence of Textural Properties and Surface Chemistry. International Journal of Hydrogen Energy 2005, 30, 293–300. [Google Scholar] [CrossRef]
  19. Kim, M. Hydrogen Production by Catalytic Decomposition of Methane over Activated Carbons: Kinetic Study. International Journal of Hydrogen Energy 2004, 29, 187–193. [Google Scholar] [CrossRef]
  20. Lee, K.K.; Han, G.Y.; Yoon, K.J.; Lee, B.K. Thermocatalytic Hydrogen Production from the Methane in a Fluidized Bed with Activated Carbon Catalyst. Catalysis Today 2004, 93–95, 81–86. [Google Scholar] [CrossRef]
  21. Bai, Z.; Chen, H.; Li, B.; Li, W. Catalytic Decomposition of Methane over Activated Carbon. Journal of Analytical and Applied Pyrolysis 2005, 73, 335–341. [Google Scholar] [CrossRef]
  22. Abbas, H.F.; Daud, W.M.A.W. Thermocatalytic Decomposition of Methane for Hydrogen Production Using Activated Carbon Catalyst: Regeneration and Characterization Studies. International Journal of Hydrogen Energy 2009, 34, 8034–8045. [Google Scholar] [CrossRef]
  23. Song, Q.; Xiao, R.; Li, Y.; Shen, L. Catalytic Carbon Dioxide Reforming of Methane to Synthesis Gas over Activated Carbon Catalyst. Ind. Eng. Chem. Res. 2008, 47, 4349–4357. [Google Scholar] [CrossRef]
  24. Lee, E.K.; Lee, S.Y.; Han, G.Y.; Lee, B.K.; Lee, T.-J.; Jun, J.H.; Yoon, K.J. Catalytic Decomposition of Methane over Carbon Blacks for CO2-Free Hydrogen Production. Carbon 2004, 42, 2641–2648. [Google Scholar] [CrossRef]
  25. Muradov, N.; Smith, F.; T-Raissi, A. Catalytic Activity of Carbons for Methane Decomposition Reaction. Catalysis Today 2005, 102–103, 225–233. [Google Scholar] [CrossRef]
  26. Suelves, I.; Pinilla, J.L.; Lázaro, M.J.; Moliner, R. Carbonaceous Materials as Catalysts for Decomposition of Methane. Chemical Engineering Journal 2008, 140, 432–438. [Google Scholar] [CrossRef]
  27. Wei, L.; Tan, Y.; Han, Y.; Zhao, J.; Wu, J.; Zhang, D. Hydrogen Production by Methane Cracking over Different Coal Chars. Fuel 2011, 90, 3473–3479. [Google Scholar] [CrossRef]
  28. Wei, L.; Zhu, M.; Ma, Y.; Zhang, Z.; Zhang, D. Hydrogen Production by Methane Cracking over Xiaolongtan Lignite Chars: The Role of Mineral Matter. Fuel 2016, 183, 345–350. [Google Scholar] [CrossRef]
  29. Hussein, A.; Larachi, F.; Ziegler, D.; Alamdari, H. Effects of Heat Treatment and Acid Washing on Properties and Reactivity of Charcoal. Biomass and Bioenergy 2016, 90, 101–113. [Google Scholar] [CrossRef]
  30. Wang, L.; Khalil, R.; Bakken, J.; Skreiberg, Ø. Production and Characterization of Biocarbon from Woody Biomasses Produced at 1000 °C 2024.
  31. Maziarka, P.; Wurzer, C.; Arauzo, P.J.; Dieguez-Alonso, A.; Mašek, O.; Ronsse, F. Do You BET on Routine? The Reliability of N2 Physisorption for the Quantitative Assessment of Biochar’s Surface Area. Chemical Engineering Journal 2021, 418, 129234. [Google Scholar] [CrossRef]
  32. Wang, L.; Olsen, M.N.P.; Moni, C.; Dieguez-Alonso, A.; de la Rosa, J.M.; Stenrød, M.; Liu, X.; Mao, L. Comparison of Properties of Biochar Produced from Different Types of Lignocellulosic Biomass by Slow Pyrolysis at 600 °C. Applications in Energy and Combustion Science 2022, 12, 100090. [Google Scholar] [CrossRef]
  33. Savitzky, A.; Golay, M. J. Smoothing and Differentiation of Data by Simplified Least Squares Procedures. Anal. Chem. 1964, 36, 1627–1639. [Google Scholar] [CrossRef]
  34. Cao, A.; Pandya, A.K.; Serhatkulu, G.K.; Weber, R.E.; Dai, H.; Thakur, J.S.; Naik, V.M.; Naik, R.; Auner, G.W.; Rabah, R.; et al. A Robust Method for Automated Background Subtraction of Tissue Fluorescence. Journal of Raman Spectroscopy 2007, 38, 1199–1205. [Google Scholar] [CrossRef]
  35. Phounglamcheik, A.; Wang, L.; Romar, H.; Kienzl, N.; Broström, M.; Ramser, K.; Skreiberg, Ø.; Umeki, K. Effects of Pyrolysis Conditions and Feedstocks on the Properties and Gasification Reactivity of Charcoal from Woodchips. Energy Fuels 2020, 34, 8353–8365. [Google Scholar] [CrossRef]
  36. Ishimaru, K.; Hata, T.; Bronsveld, P.; Nishizawa, T.; Imamura, Y. Characterization of Sp2- and Sp3-Bonded Carbon in Wood Charcoal. J Wood Sci 2007, 53, 442–448. [Google Scholar] [CrossRef]
  37. Sheng, C. Char Structure Characterised by Raman Spectroscopy and Its Correlations with Combustion Reactivity. Fuel 2007, 86, 2316–2324. [Google Scholar] [CrossRef]
  38. Lin, X.; Dong, M.; Nie, W.; Rao, G.; Lu, J. Conversion Mechanism of Organic Components during the Eucalyptus Biomass Pyrolysis Process Based on the Multispectral Association Method. Energy Fuels 2024, 38, 7929–7940. [Google Scholar] [CrossRef]
  39. Zahra, A.C.A.; Anniwaer, A.; Okura, H.; Chaerusani, V.; Zhang, P.; Rizkiana, J.; Kurnia, I.; Abudula, A.; Guan, G. Addition of Torrefied Algal Biomass to Improve Land-Based Biomass Gasification for Hydrogen-Rich Gas Production. Algal Research 2023, 74, 103236. [Google Scholar] [CrossRef]
  40. Brown, R.A.; Kercher, A.K.; Nguyen, T.H.; Nagle, D.C.; Ball, W.P. Production and Characterization of Synthetic Wood Chars for Use as Surrogates for Natural Sorbents. Organic Geochemistry 2006, 37, 321–333. [Google Scholar] [CrossRef]
  41. Guizani, C.; Escudero Sanz, F.J.; Salvador, S. The Nature of the Deposited Carbon at Methane Cracking over a Nickel Loaded Wood-Char. Comptes Rendus Chimie 2016, 19, 423–432. [Google Scholar] [CrossRef]
  42. Kameya, Y.; Hanamura, K. Kinetic and Raman Spectroscopic Study on Catalytic Characteristics of Carbon Blacks in Methane Decomposition. Chemical Engineering Journal 2011, 173, 627–635. [Google Scholar] [CrossRef]
  43. Muradov, N. Catalysis of Methane Decomposition over Elemental Carbon. Catalysis Communications 2001, 2, 89–94. [Google Scholar] [CrossRef]
  44. Yamauchi, S.; Kurimoto, Y. Raman Spectroscopic Study on Pyrolyzed Wood and Bark of Japanese Cedar: Temperature Dependence of Raman Parameters. J Wood Sci 2003, 49, 235–240. [Google Scholar] [CrossRef]
Figure 1. Methane cracking setup for the batch production of low reactivity biocarbon. In setup A we use the 5-compartment basket. Setup B is without this insert, seen to the left in the figure.
Preprints 141679 g001
Figure 2. Schematic illustration of furnace setup used for the CO2-reactivity test.
Preprints 141679 g002
Figure 3. Carbon balance from the CDM experiments.
Preprints 141679 g003
Figure 4. Weight % of carbon normalized on dry and ash free basis. The first series (1000, 90, 0/100) is that for the untreated biocarbon.
Preprints 141679 g004
Figure 5. Raman spectra of the biocarbon samples after methane cracking.
Preprints 141679 g005
Figure 6. Exemplary Raman spectrum and 5-band curve fitting result (a) and comparison of deconvoluted D and G bands from Raman spectra of biocarbon samples after CDM (b).
Preprints 141679 g006
Figure 7. SEM images from the biocarbons used for methane cracking at 1100 °C with 90 % methane and 10 % Nitrogen. The biocarbons originate from: (a) spruce wood, (b) birch wood, (c) wood pellets, (d) steam explosion pellets, (e) birch bark.
Preprints 141679 g007
Figure 8. Percentage of particles below 3.35 mm (a) and below 0.5 mm (b).
Preprints 141679 g008
Figure 9. Weight loss rates of the fixed carbon for the treated material; (a) for the entire period, (b) for the period 2-4 minutes.
Preprints 141679 g009
Table 1. The experimental matrix.
Exp. # Material Reactor T. (°C) Holding time (min) Environment Gas analysis
1 All 1000 30 90/10 CH4/Ar no
2 All 1000 90 90/10 CH4/Ar no
3 All 1100 30 90/10 CH4/Ar no
4 All 1100 90 45/55 CH4/Ar no
5 All 1100 90 90/10 CH4/Ar no
6 All 1100 90 0/100 CH4/Ar no
7 Spruce Wood 1100 75 90/10 CH4/N2 yes
8 Birch Wood 1100 90 90/10 CH4/N2 yes
9 Wood Pellets 1100 90 90/10 CH4/N2 yes
10 SEP 1100 90 90/10 CH4/N2 yes
11 Birch Bark 1100 90 90/10 CH4/N2 yes
Table 2. A summary of the weight gain and the distribution of produced gases formed in the individual experiments.
Feedstock Spruce Wood Wood Pellets SEP Birch Bark
Start weight of biocarbon (g) 81.7 80.0 100.0 82.5
Volatiles released prior to CH4 purge (g) and in % relative to start weight 0.02
(0.02%)
0.74
(0.93%)
0.82
(0.82%)
0.99
(1.2%)
Weight prior to CH4 purge (g) 81.7 79.2 99.2 81.5
Weight gained (g) and in % relative to start weight 34.36
(42.1%)
26.48
(33.4%)
13.8
(13.9%)
34.91
(42.8%)
Total H2 out (mol) 7.3 7.4 6.8 8.7
Total CH4 out (mol) 3.3 4.0 4.5 4.0
Total C2H4 out (mol) 0.1 0.1 0.1 0.1
Total H2 out (mol/mol CH4 in) 0.8 0.7 0.7 0.8
Total H2 out (mol/kg biocarbon) 89.9 92.4 68.2 105.2
Total CH4 out (mol/kg biocarbon) 40.1 50.6 44.8 48.4
Table 3. Proximate analysis in wt.% dry basis of the raw biocarbon and the biocarbons treated with CDM at 1100 °C for 90 minutes.
Spruce Wood Birch Wood Wood Pellets SEP Birch Bark
Biocarbon from pyrolysis
Volatile matter content 5.23 5.84 5.45 5.35 6.57
Ash content 0.82 1.29 0.80 1.08 3.98
Fixed carbon content 93.95 92.87 93.75 93.57 89.45
Treated biocarbon, at 1100 °C, 90 min, and 90/10 (CH4/N2)
Volatile matter content 4.74 4.72 4.40 3.49 5.09
Ash content 0.79 1.09 0.77 1.03 2.08
Fixed carbon content 94.47 94.19 94.83 95.48 92.83
Table 4. Ultimate analysis (wt. % dry, ash free basis) of raw biocarbon and biocarbon treated at different conditions.
Spruce Wood Birch Wood Wood Pellets SEP Birch Bark
Biocarbon from pyrolysis
Carbon 89.42 89.67 88.99 90.23 88.10
Hydrogen 0.79 0.80 0.78 0.68 0.82
Nitrogen 0.51 0.47 0.44 0.57 0.52
Sulphur 0.02 0.02 0.02 0.05 0.02
Oxygen 9.27 9.04 9.77 8.47 10.54
Treated biocarbon, at 1100 °C, 90 min, and 90/10 (CH4/N2)
Carbon 98.77 96.56 96.03 96.65 96.81
Hydrogen 0.08 0.23 0.29 0.15 0.12
Nitrogen 0.10 0.34 0.25 0.31 0.38
Sulphur 0.01 0.02 0.03 0.05 0.02
Oxygen 1.04 2.85 3.40 2.84 2.67
Treated biocarbon, at 1000 °C, 30 min, and 90/10 (CH4/Ar)
Carbon 94.66 92.00 92.60 94.19 91.11
Hydrogen 0.31 0.52 0.44 0.45 0.64
Nitrogen 0.50 0.68 0.72 0.77 0.91
Sulphur 0.01 0.05 0.01 0.08 0.02
Oxygen 4.52 6.75 6.23 4.51 7.33
Treated biocarbon, at 1000 °C, 90 min, and 90/10 (CH4/Ar)
Carbon 97.61 96.95 96.36 95.80 94.20
Hydrogen 0.24 0.21 0.17 0.16 0.24
Nitrogen 0.69 0.49 0.56 0.79 0.88
Sulphur 0.02 0.014 0.012 0.016 0.019
Oxygen 1.45 2.35 2.91 3.25 4.68
Treated biocarbon, at 1100 C, 30 min, and 90/10 (CH4/Ar)
Carbon 95.00 95.56 95.11 95.03 94.96
Hydrogen 0.27 0.17 0.16 0.31 0.26
Nitrogen 0.18 0.30 0.27 0.34 0.31
Sulphur 0.01 0.01 0.01 0.01 0.01
Oxygen 4.54 3.96 4.45 4.31 4.45
Treated biocarbon, at 1100 °C, 90 min, and 45/55 (CH4/Ar)
Carbon 96.67 95.68 95.36 95.19 95.16
Hydrogen 0.21 0.19 0.19 0.14 0.19
Nitrogen 0.20 0.29 0.25 0.25 0.55
Sulphur 0.014 0.013 0.016 0.02 0.019
Oxygen 2.91 3.84 4.19 4.40 4.11
Treated biocarbon, at 1100 °C, 90 min, and 90/10 (CH4/Ar)
Carbon 96.73 95.99 95.59 95.56 95.38
Hydrogen 0.24 0.21 0.21 0.19 0.23
Nitrogen 0.27 0.26 0.20 0.18 0.24
Sulphur 0.05 0.01 0.01 0.01 0.02
Oxygen 2.71 3.53 4.00 4.06 4.13
Treated biocarbon, at 1100 °C, 90 min, and 0/100 (CH4/Ar)
Carbon 95.53 94.01 95.97 95.23 93.89
Hydrogen 0.15 0.15 0.12 0.14 0.14
Nitrogen 0.55 0.68 0.63 0.47 0.44
Sulphur 0.01 0.09 0.01 0.01 0.01
Oxygen 3.77 5.07 3.26 4.15 5.52
Table 5. Ash forming elements in produced biocarbons calculated as mg/kg in dry sample.
Spruce Wood Birch Wood Wood Pellets SEP Birch Bark
Biocarbon from pyrolysis
Calcium 3620 4151 2890 3280 16549
Potassium 2770 3595 1797 1396 8048
Phosphorus 291 240 272 142 957
Silicon 134 169 122 123 340
Sodium 1861 1885 1699 1047 6831
Sulphur 158 175 98 140 637
Magnesium 381 505 352 262 1285
Manganese 352 304 346 247 859
Aluminum 212 270 142 125 353
Iron 224 330 216 139 460
Copper 3 5 1 4 5
Zinc 9 11 4 4 5
Barium 58 67 48 79 354
Titanium 7 21 11 4 21
Treated biocarbon, at 1100 °C, 90 min, and 90/10 (CH4/N2)
Calcium 2550 3706 2350 3260 14780
Potassium 340 219 199 170 4578
Phosphorus 150 143 138 89 357
Silicon 119 134 154 110 200
Sodium 106 202 135 106 180
Sulphur 98 162 113 70 287
Magnesium 273 372 408 390 1174
Manganese 151 259 260 384 406
Aluminum 64 140 88 85 156
Iron 198 441 182 102 278
Copper 3 2 3 2 6
Zinc 4 7 5 4 9
Barium 36 55 30 69 205
Titanium 3 8 7 1 13
Treated biocarbon, at 1000 °C, 30 min, and 90/10 (CH4/Ar)
Calcium 3150 3110 2620 3030 16280
Potassium 1060 840 350 850 6440
Phosphorus 210 240 206 200 1320
Silicon 108 134 139 109 441
Sodium 131 227 147 191 374
Sulphur 80 36 45 120 280
Magnesium 369 412 719 407 1196
Manganese 226 291 326 405 772
Aluminum 74 42 32 76 86
Iron 149 459 208 108 392
Copper 6 6 5 136 93
Zinc 5 4 9 4 4
Barium 53 68 33 71 308
Titanium 10 10 1 6 9
Treated biocarbon, at 1100 °C, 90 min, and 90/10 (CH4/Ar)
Calcium 3211 2182 2819 2618 11285
Potassium 123 164 218 200 143
Phosphorus 27 421 24 128 1138
Silicon 140 168 173 135 402
Sodium 151 182 100 64 160
Sulphur 112 183 128 156 224
Magnesium 340 973 357 383 1165
Manganese 94 291 87 361 446
Aluminum 59 109 97 81 172
Iron 68 466 173 284 250
Copper 2 5 2 14 5
Zinc 4 9 5 34 6
Barium 55 36 70 63 197
Titanium 5 10 5 21 13
Treated biocarbon, at 1100 °C, 90 min, and 0/100 (CH4/Ar)
Calcium 3079 2780 3710 3031 14770
Potassium 1456 1630 1410 1382 6800
Phosphorus 189 170 123 220 620
Silicon 156 187 181 143 413
Sodium 1045 1175 691 506 2288
Sulphur 118 100 60 80 210
Magnesium 282 431 341 260 1122
Manganese 312 266 297 376 989
Aluminum 95 85 37 65 311
Iron 49 138 74 178 241
Copper 7 9 6 6 12
Zinc 4 4 4 4 4
Barium 92 47 67 84 392
Titanium 1 13 1 1 21
Table 6. Surface area and density of treated biocarbons from experiments 7-11 and untreated biocarbons.
Physio-chemical property Spruce Wood Birch Wood Wood Pellets SEP Birch Bark
Biocarbon from pyrolysis
Surface area (N2) (m2 g-1) 204 223 150 105 279
Density (g cm-3) 1.97 1.99 2.04 2.02 1.70
Treated biocarbon
Surface area (N2) (m2 g-1) 167
(18%)
148 (34%) 133 (11%) 88
(16%)
203
(27%)
Density (g cm-3) 1.79
(9%)
1.81
(9%)
1.69 (17%) 1.97
(3%)
1.62
(5%)
Table 7. Main Raman spectral parameters of the biocarbon samples after CDM (at 1100 °C, 90 min, and 90/10 (CH4/N2)).
Parameter Spruce Wood Birch Wood Wood Pellets SEP Birch Bark
ID/IG 1.76 1.37 1.25 1.16 0.99
AD/AG 3.08 2.35 1.29 1.51 1.26
AD/Atotal 0.54 0.46 0.37 0.32 0.33
FWHMD (cm–1) 159.3 127.5 120.2 101.2 104.3
FWHMG (cm–1) 95.2 102.6 104.2 98.7 96.4
Table 8. EDS analysis of the SEM images in Figure 7.
C O Ca Si K Na P Mg Al Fe Fe
Spruce wood (atomic ratio %)
1 91.1 8.5 n.d. n.d. 0.1 0.2 n.d. n.d. 0 n.d. 0
2 91.2 8.3 0.4 0.06 0 n.d. n.d. n.d. n.d. n.d. 0.1
3 92.8 6.0 0.7 0.09 0.3 n.d. 0 0 0 n.d. 0.1
4 94.5 4.5 0.5 0.23 0.1 n.d. n.d. n.d. 0.2 n.d. n.d.
5 89.2 9.1 1.4 0.09 0 n.d. n.d. 0.1 0.1 n.d. n.d.
6 88.9 9.3 1.0 0.24 0.3 0.1 0 0 0.1 n.d. 0
Birch wood (atomic ratio %)
1 98.6 1.4 n.d. 0.02 n.d. n.d. n.d. n.d. n.d. n.d. n.d.
2 98.7 1.3 n.d. n.d. n.d. 0 n.d. 0 0 n.d. n.d.
3 98.9 1.0 n.d. 0.02 n.d. n.d. n.d. 0 n.d. n.d. n.d.
4 n.d. 11.3 79 0.92 n.d. 1.2 0.3 3.7 1.3 1.2 1.3
5 n.d. 10.9 80 1.27 n.d. n.d. n.d. 2.4 n.d. 4.2 1.5
6 33.2 6.3 45 11.8 n.d. n.d. n.d. 0.3 n.d. 2.5 1.1
Wood pellets (atomic ratio %)
1 93.2 1.5 3.7 n.d. 1.2 n.d. 0.2 n.d. 0.1 n.d. 0.1
2 95.7 4.2 n.d. n.d. n.d. n.d. n.d. 0 n.d. 0 n.d
3 96.4 3.5 n.d. 0.05 n.d. n.d. n.d. n.d. 0 0 n.d.
4 75.3 19.3 1.5 0.02 2.1 1.6 n.d. 0.2 0.1 n.d. n.d.
5 76.8 15.8 2.4 0.17 2.1 1.8 n.d. 0.6 0.3 n.d. n.d.
6 79.7 14.5 1.6 n.d. 0.2 3.8 n.d. n.d. 0.1 n.d. n.d.
Steam explosion pellets (atomic ratio %)
1 97.6 2.4 n.d. 0.03 0 n.d. n.d. 0 n.d. n.d. n.d.
2 94.7 4.5 0.5 0.01 0.2 0 0.1 0 0 n.d. 0.1
3 88.8 11.0 n.d. 0.1 n.d. n.d. n.d. 0 0 n.d. 0.1
4 90.6 9.0 n.d. 0.1 0.1 n.d. 0 0 0.1 n.d. 0.1
Birch bark (atomic ratio %)
1 94.6 3.5 1.6 0.07 0.2 0 n.d. 0 0.1 n.d. n.d.
2 90.6 4.3 4.4 0.23 0.4 0.1 n.d. n.d. 0.1 n.d. n.d.
3 90.9 5.4 3.2 0.13 0.3 0 n.d. n.d. 0.1 n.d. 0
4 88.7 9.9 0.2 0.24 0.2 0.3 n.d. 0.3 0.2 n.d. 0
5 83.1 14.2 0.5 0.18 0.1 0.9 n.d. 0.6 0.4 n.d. 0.1
6 88.0 9.8 0.5 0.29 0 0.5 n.d. 0.5 0.3 n.d. 0.1
Table 9. The CO2-reactivity characteristics of the non-treated and treated samples.
Start wt. (g) End wt. (g) Wt. loss (%) Overall RR 1 1-2 min RR 2 2-4 min. RR 3
Non-treated biocarbons
SW 20 17.9 10.6 9.46 8.48 -
BW 19 17.1 14.5 9.95 9.29 7.72
WP 20 17.7 11.7 6.1 6.8 4.56
SEP 20 18.1 9.5 5.05 5.17 4.02
BB 20 17.2 14.2 11.37 9.22 -
Treated biocarbons
SW 20 18.9 5.9 3.88 5.24 2.59
BW 20 18.9 5.6 4.37 4.79 3.32
WP 20 17.8 11.1 4.83 5.86 3.49
SEP 20 18.9 5.5 2.62 4.45 2.53
BB 20 19.3 3.7 3.81 5.16 2.66
SW 20 18.9 5.9 3.88 5.24 2.59
Reference (Coke)
20 17.8 1.1 2.66 4.07 1.85
1 The overall reaction rate in % Fixed C reacted/min. 2 The reaction rate in % Fixed C reacted/min., linear fit for the period 1-2 min. 3 The reaction rate in % Fixed C reacted/min., linear fit for the period 2-4 min.
Disclaimer/Publisher’s Note: The statements, opinions and data contained in all publications are solely those of the individual author(s) and contributor(s) and not of MDPI and/or the editor(s). MDPI and/or the editor(s) disclaim responsibility for any injury to people or property resulting from any ideas, methods, instructions or products referred to in the content.
Copyright: This open access article is published under a Creative Commons CC BY 4.0 license, which permit the free download, distribution, and reuse, provided that the author and preprint are cited in any reuse.
Prerpints.org logo

Preprints.org is a free preprint server supported by MDPI in Basel, Switzerland.

Subscribe

Disclaimer

Terms of Use

Privacy Policy

Privacy Settings

© 2025 MDPI (Basel, Switzerland) unless otherwise stated