
Submitted:
02 December 2024
Posted:
04 December 2024
You are already at the latest version
Preprints on COVID-19 and SARS-CoV-2
Abstract
The COVID-19 pandemic, which began in late 2019 in Wuhan, China, quickly escalated into a global crisis, affecting nearly every aspect of life. Governments worldwide implemented stringent public health measures to control its spread, including quarantines, social distancing, and lockdowns. In Spain, where the first cases emerged in January 2020, a nationwide lockdown was enforced on March 14 after infections surpassed 5,000. While these interventions were crucial for public health, they also introduced profound societal challenges, particularly for vulnerable populations. This study presents a dataset combining psychological assessments of nine mental health conditions with sociodemographic, economic, living, and health variables, aiming to identify the key factors influencing mental health outcomes during the lockdown. By analyzing this data, the research seeks to shed light on the broader psychological effects of the pandemic and the factors that may exacerbate or mitigate these impacts. The dataset performed well with different machine learning models with values over 80%. It is publicly available at https://zenodo.org/uploads/14203988.
Keywords:
COVID-19
; Mental health
; Lockdown
; SA-45 test
1. Introduction
In 2020, the COVID-19 pandemic, caused by the novel SARS-CoV-2 virus, rapidly spread worldwide after its discovery in Wuhan, China. Far more contagious than the earlier SARS outbreak, it led to over 300,000 cases and 13,000 deaths by March 2020, [1]. The virus overwhelmed healthcare systems, caused medical supply shortages, and disrupted global economies through lockdowns and business closures. Efforts to control the virus included social distancing, mask-wearing, and accelerated vaccine development, reshaping healthcare and economies globally.
According to [2], common COVID-19 symptoms include fever, fatigue, cough, and shortness of breath. The virus’s rapid human-to-human transmission was well-documented early in the pandemic ([3]). With no vaccine or effective treatments available, self-isolation and quarantine became essential strategies to contain the virus [4]. Governments globally, including Spain, implemented strict lockdowns, such as the 51-day lockdown starting on March 14, 2020 [5]. These measures, combined with prolonged isolation, significantly impacted mental health, leading to increased anxiety and depression [6]. Individuals lacking social or psychological support were especially vulnerable to distress [7], while the socioeconomic consequences worsened the mental health crisis in vulnerable populations.
The COVID-19 pandemic prompted the enforcement of quarantine measures in many countries. While these measures were essential in controlling the virus’s spread, they negatively affected individuals’ psychological well-being. These included separation from loved ones, inability to engage in normal activities, fear of infection, and a loss of personal freedom [6]. The psychological toll was especially severe in pro-longed cases, as seen in Spain, where lifestyle restrictions were imposed due to insufficient awareness and anticipation of the virus’s rapid spread [8].
Research shows that enforced isolation significantly affects many aspects of life, often leading to psychological stress and, in some cases, mental health issues. In Spain, data from the first wave of the pandemic revealed that a significant portion of the adult population experienced symptoms of depression and anxiety [7] and [9]. Older individuals, particularly those over 60, were notably affected, developing depressive symptoms and avoidant coping styles. Risk factors for poorer mental health included being female, having a history of mental illness, direct exposure to COVID-19, experiencing virus-related symptoms, or having an infected close relative [10].
The main motivation of this working is having a dataset to better understand these effects and how to assess the mental health impact of the COVID-19 lockdown in Spain. The contribution fo this work is providing a dataset that integrates psychological assessments, such as the SA-45, with detailed socioeconomic, living, and health information. By analyzing this rich combination of data, researchers can explore how various socioeconomic and personal factors influenced mental health during the lockdown. Apart from that, we show the performance of data in different Machine Learning (ML) models. We consider this dataset a total novelty because it is the only one as far as we know that can measure the impact of COVID’s lockdown in the mental health of Spanish population as data was gathered when experiencing this particular situation
Our dataset aims to address gaps in the literature, particularly regarding the role of sociodemographic, living, economic and health determinants in mental health outcomes. These factors, which include income level, employment status, living conditions, and general health conditions, can have a profound influence on an individual’s ability to cope with stress, depression, or anxiety. By providing a comprehensive dataset that captures these dimensions, we offer a valuable resource for exploring the complex interactions between mental health and social conditions during the lockdown that took place in Spain due to COVID-19.
This paper details the methodology used to compile and validate the dataset and provides initial insights into the observed trends. The dataset allows for the evaluation of psychological processes during the lockdown and opens avenues for using artificial intelligence models to predict mental health outcomes based on individual and societal factors. This resource will support future research to develop more targeted mental health interventions during crises or implement social benefits for vulnerable groups.
The rest of the paper is organized as it follows. Section 2 compiles different work using or presenting similar datasets. Section 3 describes how data was gathered and the methods to demonstrate the usefulness of the dataset. Section 4 shows different results of the dataset in Machine Learnig models. Finally, section 5 makes some conclusions and propose few future works.
2. Related Work
The impact of COVID-19 has led to the publication of numerous studies utilizing datasets like the one described in this paper, which measure the influence of various features on mental health due to the disease and its consequences. Below, we review several studies that use such datasets.
[11] uses the COVID Impact Survey dataset1 which compiles demographic and social factors such as income, education, trust, and social connections, collected in April, May, and June 2020. This data is analyzed using Random Forest (RF), Support Vector Machines (SVM), Naïve Bayes (NB), and Logistic Regression (LR) models, with the target variable based on the frequency of psychological issues (anxiety, depression, and physical reactions) over 1, 3, or 5 days per week. [12] examines the mental health of 5,108 Chinese medical workers2 during the pandemic, using 32 features such as age, employment type, sleep duration, and work intensity to predict conditions like anxiety and depression with a novel neural model. [13] explores risk and resilience factors affecting mental health outcomes, including depression, anxiety, Post-Traumatic Stress Disorder (PTSD), and somatic symptoms, using a non-public dataset of 467 U.S. adults. Features include demographic, medical, COVID-related, and psychological resilience factors, with Machine Learning models like RF, XGBoost, and Support SVM. [14] uses a public dataset3 of 518 frontline healthcare workers, incorporating features such as demographics, professional roles, behavioral habits, and COVID-19 impact, to train models like RF, Gradient Boosting (GB), and XGBoost. The target variable measures mood changes during the pandemic. [15] analyzes a non-public dataset of psychological distress among 2,787 participants during the COVID-19 pandemic, focusing on factors like anxiety, depression, and PTSD, using RF and Regression Tree models. The dataset includes features such as demographics, childhood trauma, emotion regulation strategies, and somatization. While these datasets measure the impact of COVID-19 on mental health, none focus on Spanish individuals under confinement, and some datasets are not publicly available.
Other studies have specifically examined mental health during the COVID-19 lockdown. [16] explores mental health, personality, and behavioral changes in university students from Germany and Egypt during the first lockdown in May 2020 (data is not publicly available). The target variables in the Machine Learning gureguremodels are the Big Five personality traits, analyzed using Support Vector Regression (SVR) and Gradient Boosting Regression (GBR). [17] investigates the impact of lohline Regarding the mental health impact of COVID-19 on the Spanish population, several studies are noteworthy. [18] examines the relationship between lifestyle behaviors and mental health, particularly depression and anxiety, during the early stages of the pandemic. This study uses data from 22,562 participants from Spain and Brazil, available upon request, to train Elastic Net, RF, and XGBoost models. [19] focuses on Spanish patients with Obsessive-Compulsive Disorder (OCD), using ML models to predict Y-BOCS scores, self-perceived anxiety, depression, and suicidal thoughts. The same dataset is used by [20]., complemented by data from 237 controls, to train linear regression models. In both cases, the dataset is available upon request. studies the mental health of 523 Spanish adolescents (ages 13–17), focusing on emotional symptoms such as depression, anxiety, and stress, measured using the DASS-21 scale and analyzed with Multiple Logistic Regression. The dataset is only available by contacting the authors. Finally, [21]. investigates how Social Determinants of Health (SDH) influenced depression during the strict seven-week lockdown in Zaragoza, Spain. Features include living conditions, access to green spaces, housing quality, social support, and access to healthcare. However, no ML models are applied in this study and the dataset is not publicly available. Although these datasets involve Spanish populations, the data was not collected during lockdown.
As far as we know the dataset described in this paper is a total novelty due to the following features. Openness, most of the datasets described in this section are only available upon request. Particular use case, individuals are restricted to the Spanish population that has filled in the questionnaires while being under the lockdown. Considering both features neither of the datasets of this section is accomplished with both.
3. 3. LOCKED dataset
The dataset consists of information from 1,030 individuals, collected via a 96-item questionnaire addressing personal, living, economic and health conditions before and during the COVID-19 quarantine. The inclusion criteria required participants to be over 18 years old and residents of Spain. The questionnaire was launched on May 2, 2020, and data collection ended a week later May 9, 2020. On this date, some regions of Spain entered stage 0, which marked the easing of strict lockdown measures, allowing people to walk during designated time slots.
Due to lockdown constraints, the data was gathered through Google Forms without expert supervision, and all participants gave their consent to use the information in the study. The experiment was promoted through various social networks and research mailing lists.
The questionnaire had two main components: the Ad hoc Sociodemographic Survey and the Symptom Assessment-45 Questionnaire (SA-45), [22] & [23]. The first section consisted of 51 questions designed to capture participants’ personal, living, economic conditions and health conditions (see first Appendix). The second part, the SA-45, is the Spanish version of a tool designed to assess general psychopathology, [24]. It is a self-administered questionnaire with 45 items (see second Appendix), measuring nine symptom dimensions: obsession-compulsion, interpersonal sensitivity, hostility, anxiety, somatization, paranoid ideation, phobic anxiety, psychoticism, and depression. Each condition contains five items, with responses rated on a Likert scale from 0 ("Not at all") to 4 ("Very much or extremely"). The total score ranges from 0 to 180, while the dimension scores range from 0 to 20, with higher scores indicating a higher level of psychopathological symptoms.
3.1. Preprocessing Stage
During the data cleaning process, outliers and individuals with insufficient or poorly collected information were removed, and missing values were inputted. First, instances with critical errors due to formatting issues have been removed, reducing the dataset to a total of 981 observations.
In terms of the variables, open-ended fields with high variability, such as place of birth, current postal code, and specific job titles, 10 features were excluded due to their broad nature and the excessive noise they introduced into the analysis.
In the cases of finding an empty values in cells, we have implemented the following strategies. There are 51 cases, which have been filled with the value 0 because it is possible that the absence of a value could be interpreted as 0 (e.g., having children). In one of the cell columns, an outlier was detected and replaced with the median of the established values. Meanwhile, there are 43 categorical cells whose null values have been filled with the most frequent value within each column.
3.2. Data Labeling
Initially, it was necessary to define the classes of the target feature to enable the application of ML models for classifying individuals based on the collected features. The primary objective was to label individuals according to psychological processes. To achieve this, we employed the SA-45 test that follows clinical methodologies commonly used in practice. The SA-45 test consists of 45 items, each assigned to one of the nine dimensions of psychological distress. The sum of the scores for the items in each scale yields a scale-specific score.
- Hostility (items 7, 34, 35, 39, 43): This dimension reflects anger, irritability, and aggression. A high score may suggest a tendency to react with anger or experience feelings of hostility toward others.
- Somatization (items 18, 23, 26, 29, 31): This refers to the experience of physical symptoms without an apparent medical cause, often linked to emotional or psychological factors. A high score may indicate a tendency to report multiple physical complaints.
- Depression (items 9, 10, 11, 27, 42): This scale measures symptoms of depression, including profound sadness, loss of interest, fatigue, and hopelessness. A high score suggests a significant presence of depressive symptoms.
- Obsessive-Compulsive (items 16, 20, 21, 25, 28): T This dimension relates to the presence of intrusive thoughts (obsessions) or ritualistic behaviors (compulsions). A high score indicates a greater tendency toward obsessive-compulsive patterns.
- Anxiety (items 6, 12, 30, 38, 41): This scale assesses symptoms of anxiety, such as excessive worry, tension, and fear. A high score reflects a high presence of anxiety symptoms. (11 features)
- Interpersonal Sensitivity (items 14, 15, 17, 32, 36): This dimension evaluates feelings of inferiority and self-criticism in social interactions. A high score indicates heightened sensitivity to criticism and feelings of inadequacy in social situations.
- Agoraphobia (items 3, 8, 22, 24, 37): This refers to the fear of being in situations where escape might be difficult or help unavailable, particularly in the case of a panic attack. A high score suggests a stronger presence of these fears.
- Paranoid Ideation (items 2, 5, 19, 40, 44): This scale measures paranoid thoughts, such as excessive distrust or beliefs of being persecuted. A high score reflects a significant tendency toward paranoia.
- Psychoticism (items 1, 4, 13, 33, 45): This dimension assesses symptoms associated with psychotic disorders, such as hallucinations, unusual thoughts, and eccentric behaviors. A high score indicates a greater presence of psychotic symptoms.
Currently, there is no normative data available for interpreting the SA-45 scores, but elevated scores can be referenced as the mean plus one standard deviation. The score for each of the nine scales can be calculated by dividing the total score by the number of items in the scale.
3.3. 3.3 Studied features
The remaining variables were encoded for use as input in classifiers. The dataset comprises 41 variables, including 20 multicategorical and 7 binary. To enhance model performance, the original variables were grouped into the following categories while maintaining logical separation. Efforts were made to balance the number of features across categories.
Demographic Characteristics (11 features): This category includes participants’ gender, age, marital status, place of birth, documentation status, nationality, educational attainment, and family structure.
Living Environment (10 features): Variables in this category describe the type of housing, housing characteristics, number of cohabitants, and the frequency of social interactions before and after the quarantine period.
Economic Status (11 features): This category encompasses employment status before and after quarantine, job type, working hours before and after quarantine, income levels across the same periods, and the capacity to manage monthly expenses and debts.
Health Impact (9 features): This category includes information on general health conditions and the specific impacts of COVID-19, including personal health outcomes and caregiving responsibilities during the pandemic.
By applying this, our dataset is split into four different datasets which compile similar features for a more focused analysis (see third Appendix).
4. Experimental Benchmarks
As the dataset was collected to diagnose the nine psychological conditions in the SA-45 test, measuring its performance in classifier models makes sense. In this case, we have established a benchmark formed by six well-known supervised ML models. Following we formalized those implemented in this section.
Decision Trees (DT) employ a "divide and conquer" strategy by splitting data into nodes based on features until a class is assigned at the leaves [25]. RF, an ensemble method, constructs multiple decision trees on random data samples and subsets of features, combining their outputs to enhance accuracy and reduce overfitting [26]. SVM, defined by [27], aims to maximize the margin between classes by identifying the optimal hyperplane in high-dimensional space. GB, introduced by [28], sequentially builds a strong model by combining weaker ones, typically decision trees, with each new model correcting errors from the previous one to minimize loss. NB assumes that the features are conditionally independent given the target class, calculating the overall probability as the product of individual probabilities [29]. LR, a linear classification model, predicts the probability of a class using a logistic function and can be extended to handle nonlinear data through polynomials or interaction terms [30]. Finally, the Multilayer Perceptron (MLP), described in [31], is a neural network with multiple layers of neurons, where each connection is weighted and adjusted during training to minimize prediction errors.
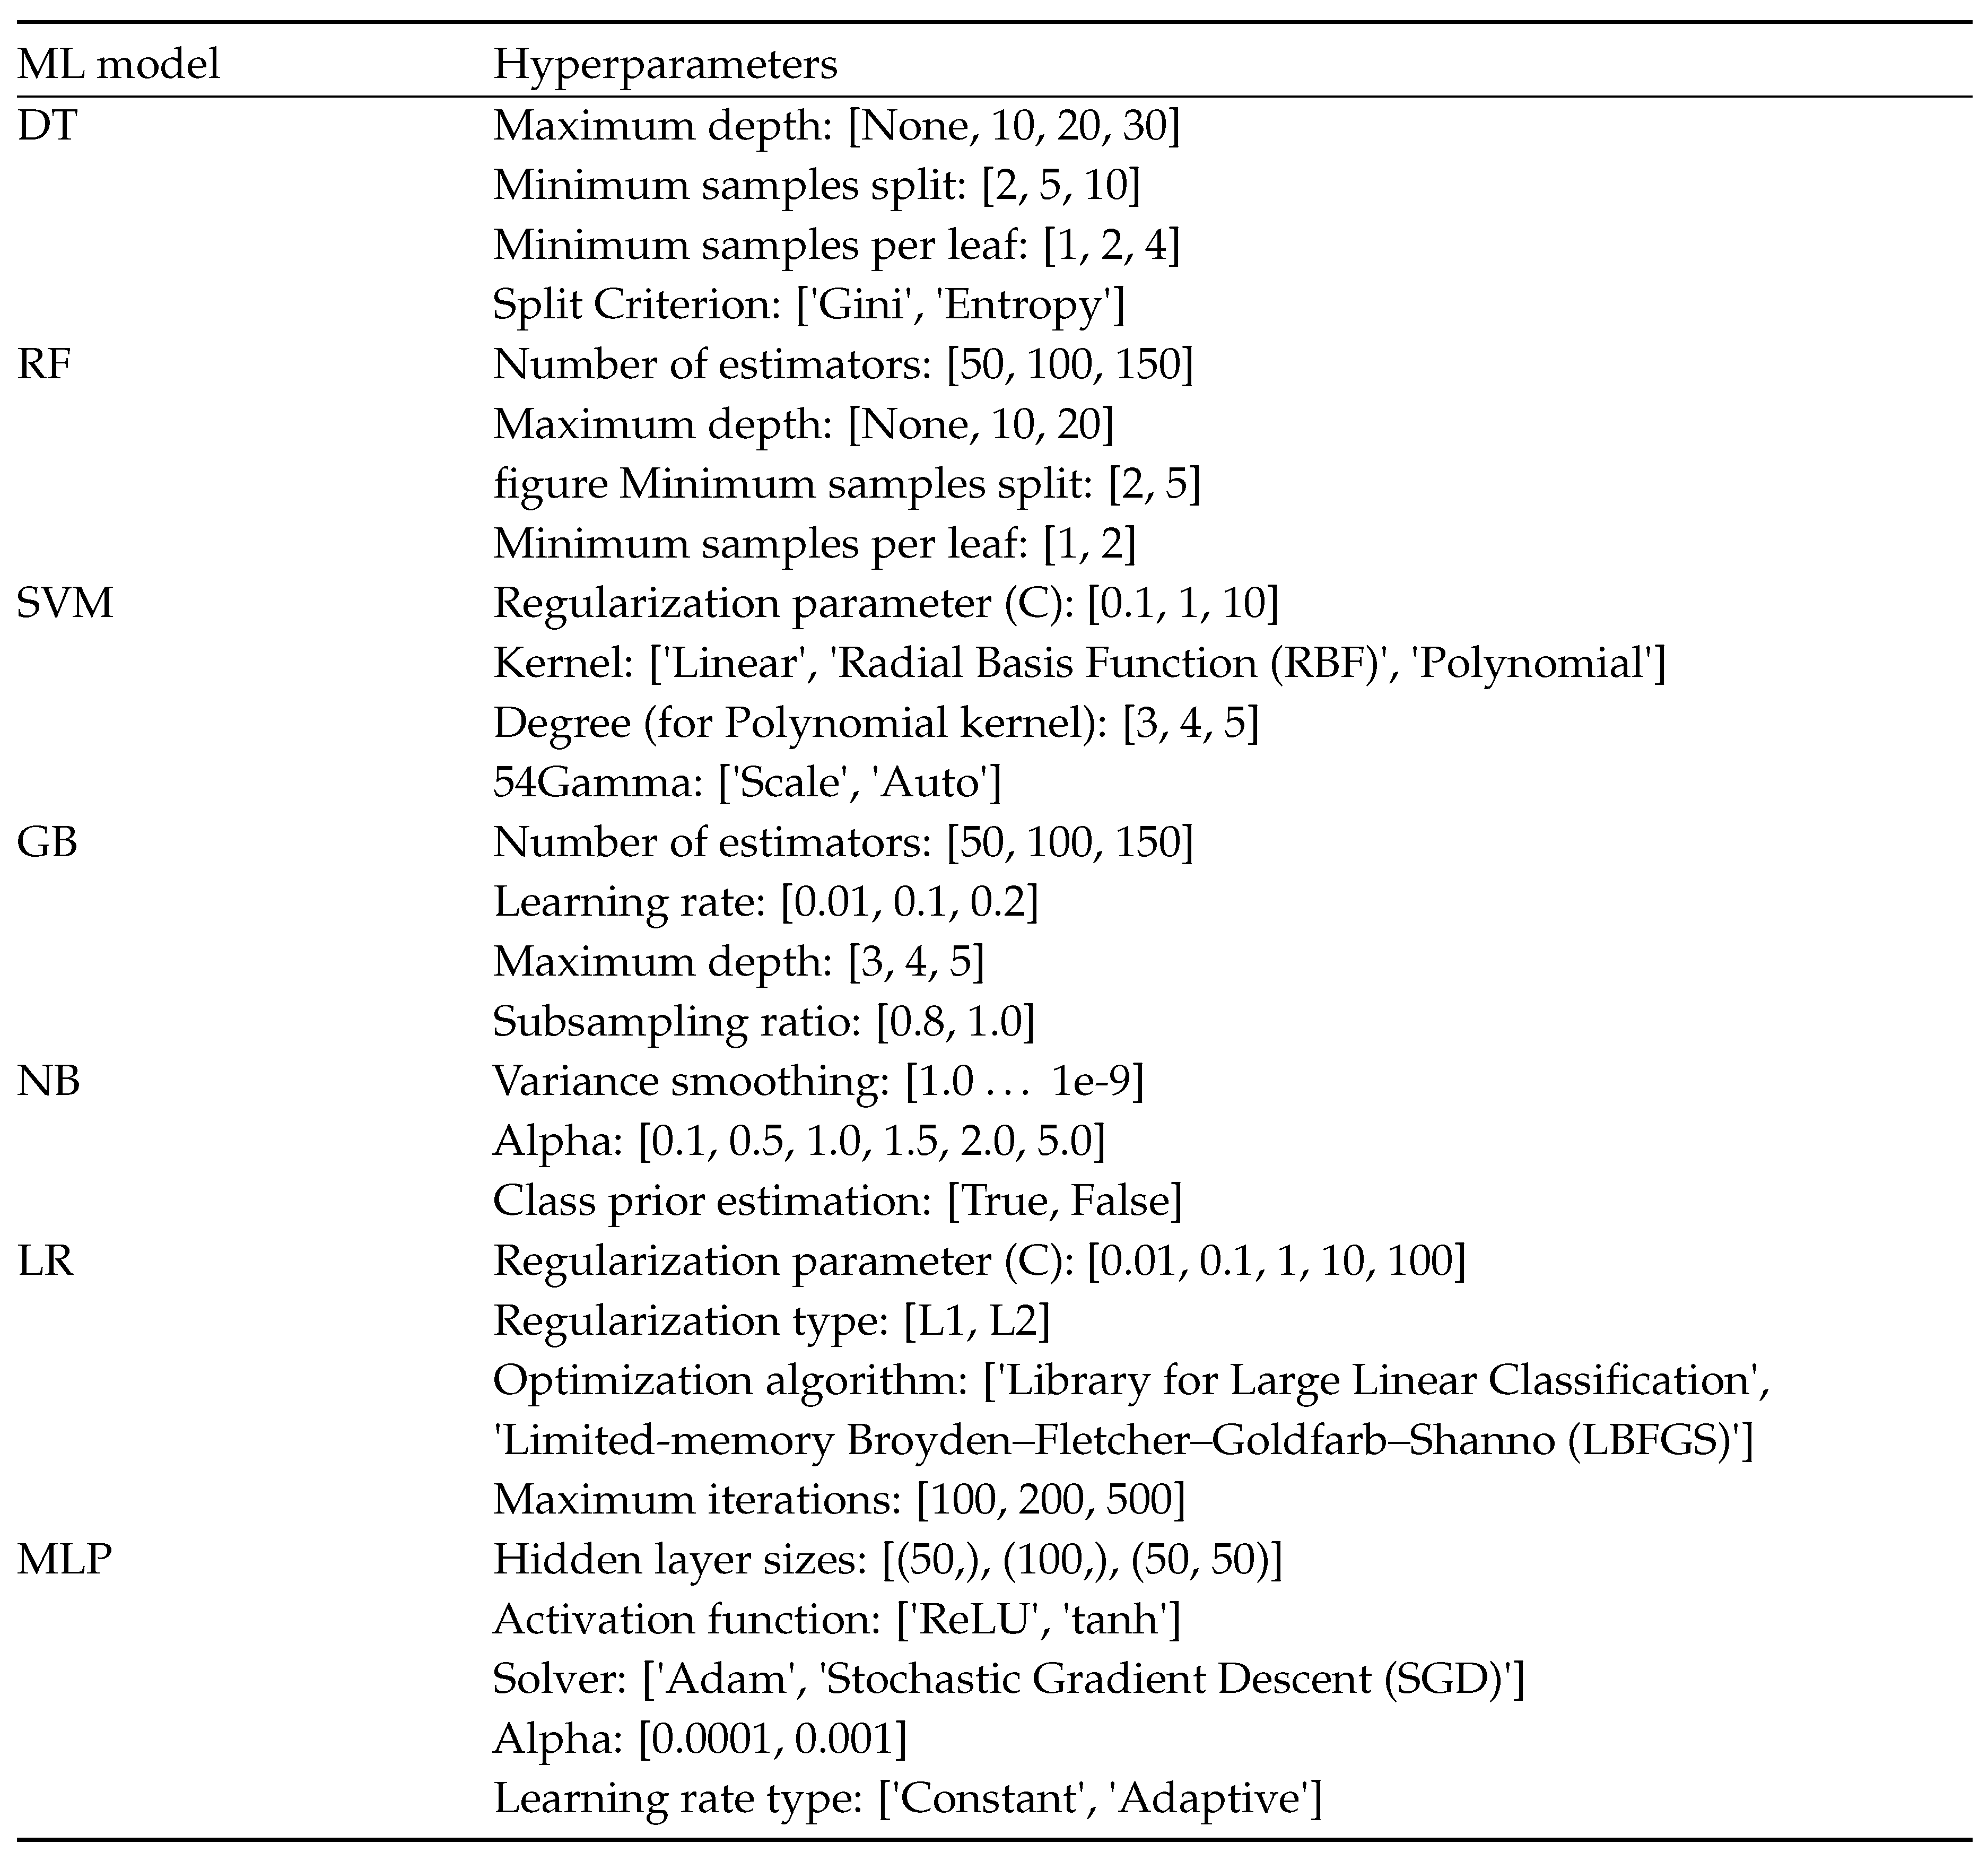
For each of the four subsets, we have trained one of the previous models and have applied the following best practices. First, the datasets were partitioned into training, validation, and test sets, with the training and validation sets used to optimize model hyperparameters, and the test set reserved for evaluating the final model performance. Table 1 shows hyperparameters and values used to fine-tune each model.

Table 1.
ML models’ hyperparameters for grid search
 |
An 80-20% split was applied to split the dataset into training and test subsets, ensuring randomized instance allocation to minimize bias. As people that are experiencing no psychological condition is the majority class, an undersampling strategy has been applied to stratify number of instances in each class for the different classifiers. This information is found in Table 2.
Table 2.
Train and split sets for each classifier
| ML model | Training set | Test set |
| Hostility | 233 | 59 |
| Somatization | 252 | 64 |
| Depression | 252 | 64 |
| Obsession-Compulsion | 267 | 67 |
| Anxiety | 270 | 68 |
| Interpersonal Sensitivity | 270 | 68 |
| Agoraphobia | 198 | 50 |
| Paranoid Ideation | 208 | 52 |
| Psychoticism | 224 | 56 |
Hyperparameter optimization was conducted using a grid search strategy, which systematically explored multiple parameter combinations [32]. To enhance the robustness of the evaluation, k-fold cross-validation was employed, allowing for a more comprehensive assessment of model performance. Since certain ML models initialize hyperparameters randomly, this combined with randomized data partitioning may contribute positively to model performance. Model performance was evaluated using the accuracy metric, defined as the proportion of correctly predicted instances.
The outcomes of this approach are presented in Table 3, which summarizes the accuracy of the training, validation, and test sets across four subsets for each of the eight classifiers. The results are reported as the mean and standard deviation, reflecting the variability introduced by k-fold cross-validation. Training and evaluation code is available in https://github.com/ufvceiec/LOCKED. The Table also identifies the best-performing model for each case, alongside the corresponding accuracy values.
The training of the ML models was conducted on a desktop computer equipped with an Intel(R) Core(TM) i5-4590 CPU running at 3.30 GHz. The system features 16 GB of RAM (15.9 GB usable). In total 196 models (combinations of subsets, classes and ML models) plus its grid search were trained resulting in a total duration of 1 hour, 3 minutes and 23 seconds. Fourth appendix compiles the training times, used RAM and hyperparameters to be tunned in each of the best models.
Table 3.
Accuracy applying benchmarks.
| Training subset | Binary classifier | Best ML model | Train | Validation | Test |
| Hostility | DT | 91.15% ± 2.50 | 85.16% ± 1.48 | 81.36% | |
| Somatization | SVM | 81.70% ± 5.86 | 76.36% ± 3.09 | 87.50% | |
| Depression | SVM | 85.09% ± 4.47 | 80.27% ± 2.85 | 87.50% | |
| Obsession-Compulsion | RF | 90.96% ± 2.40 | 82.40% ± 1.50 | 89.55% | |
| Demographic characteristics | Anxiety | SVM | 81.89% ± 5.42 | 77.81% ± 3.47 | 89.71% |
| Interpersonal Sensitivity | DT | 89.60% ± 2.42 | 87.59% ± 1.01 | 85.29% | |
| Agoraphobia | RF | 92.76% ± 1.25 | 85.89% ± 0.53 | 90% | |
| Paranoid Ideation | DT | 92.23% ± 1.69 | 84.52% ± 1.1 | 92.31% | |
| Psychoticism | MLP | 86.83% ± 7.37 | 79.95% ± 3.07 | 87.50% | |
| Hostility | SMV | 83.94% ± 10.16 | 76.75% ± 6.93 | 88.14% | |
| Somatization | SVM | 84.14% ± 9.7 | 76.85% ± 7.98 | 87.5% | |
| Depression | MLP | 73.34% ± 3.67 | 71.04% ± 3.46 | 84.38% | |
| Obsession-Compulsion | RF | 95.35% ± 2.12 | 88.36% ± 0.78 | 89.55% | |
| Living environment | Anxiety | SVM | 82.2% ± 10.67 | 75.35% ± 7.49 | 94.12% |
| Interpersonal Sensitivity | GB | 94.44% ± 5.40 | 80.75% ± 1.74 | 83.82% | |
| Agoraphobia | MLP | 90.60% ± 7.83 | 81.22% ± 3.77 | 90.00% | |
| Paranoid Ideation | RF | 96.09% ± 1.98 | 85.63% ± 0.67 | 90.38% | |
| Psychoticism | RF | 96.50% ± 1.63 | 79.53% ± 1.35 | 92.86% | |
| Hostility | SVM | 89.22% ± 7.89 | 83.76% ± 5.56 | 91.52% | |
| Somatization | RF | 96.3% ± 1.3 | 87.86% ± 0.91 | 87.5% | |
| Depression | DT | 93.12% ± 2.29 | 78.73% ± 1.25 | 85.29% | |
| Obsession-Compulsion | RF | 97.64% ± 0.98 | 88.20% ± 0.71 | 88.06% | |
| Economic status | Anxiety | RF | 97.17% ± 1.12 | 85.75% ± 0.51 | 85.29% |
| Interpersonal Sensitivity | DT | 91.98% ± 3.01 | 81.55% ± 1.48 | 91.18% | |
| Agoraphobia | SVM | 87.94% ± 9.88 | 80.12% ± 6.78 | 94% | |
| Paranoid Ideation | RF | 95.66% ± 1.56 | 85.4% ± 1.37 | 96.15% | |
| Psychoticism | NB | 83.92% ± 4.15 | 82.60% ± 3.74 | 87.50% | |
| Hostility | DT | 95.74% ± 1.15 | 93.12% ± 0.35 | 96.61% | |
| Somatization | RF | 96.7% ± 0.15 | 96.15% ± 0.68 | 92.19% | |
| Depression | GB | 96.84% ± 0.79 | 95.37% ± 0.78 | 95.31% | |
| Health impacts | Obsession-Compulsion | DT | 94.01% ± 0.61 | 93.51% ± 0.7 | 98.51% |
| undersampling | Anxiety | RF | 95.4% ± 0.16 | 95.31% ± 0.41 | 92.65% |
| Interpersonal Sensitivity | DT | 95.68% ± 0.63 | 94..69% ± 0.7 | 92.65% | |
| Agoraphobia | NB | 92.79% ± 8.67 | 92.61% ± 8.91 | 98% | |
| Paranoid Ideation | DT | 92.3% ± 0.68 | 92% ± 1.13 | 100% | |
| Psychoticism | SVM | 87.33% ± 7.45 | 85.89% ± 7.39 | 91.07% |
A fundamental objective in training ML models is to avoid overfitting and underfitting. This is achieved by addressing the bias-variance trade-off [33], which involves balancing model complexity with its ability to generalize to unseen data. This trade-off is critical for optimizing both performance and robustness in Machine Learning. Bias represents the model’s capacity to capture the underlying patterns in the data, whereas variance reflects its sensitivity to small variations during training. The performance (bias) of all the ML models evaluated was satisfactory, with accuracy values exceeding 80% and many models achieving accuracies above 90%. Variance was considered acceptable if it did not exceed a difference of 10 percentage points.
While accuracy is a widely used metric for evaluating model performance, more comprehensive metrics such as sensitivity and specificity provide deeper insights into model behavior by accounting for False Positives (FP) and False Negatives (FN). Sensitivity quantifies the proportion of actual positives correctly identified, whereas specificity measures the proportion of actual negatives correctly identified. These metrics are crucial for understanding the nature of the errors made by the model, particularly in scenarios where FP or FN have significant implications. Tables 4 and 5 present sensitivity and specificity results analogous to those in Table 3. Since the best-performing model remains consistent across these evaluations, the corresponding column has been omitted from these tables.
Table 4.
Sensitivity applying benchmarks.
| Training subset | Binary classifier | Train | Validation | Test | |
| Hostility | 88.61% ± 0.19 | 81.76% ± 0.84 | 65.52% | ||
| Somatization | 78.19% ± 0.09 | 72.03% ± 1.01 | 81.25% | ||
| Depression | 97.81% ± 0.02 | 94.09% ± 0.14 | 81.25% | ||
| Obsession-Compulsion | 83.02% ± 0.06 | 75.55% ± 0.79 | 81.82% | ||
| Demographic characteristics | Anxiety | 76.77% ± 0.05 | 98.10% ± 0.04 | 79.41% | |
| Interpersonal Sensitivity | 83.40% ± 0.16 | 67.63% ± 0.22 | 73.53% | ||
| Agoraphobia | 91.67 % ± 0.01 | 96.41% ± 0.02 | 90.00% | ||
| Paranoid Ideation | 89.41% ± 0.05 | 78.61% ± 1.77 | 96.15% | ||
| Psychoticism | 96.26% ± 0.05 | 87.44% ± 0.53 | 82.14% | ||
| Hostility | 82.28% ± 0.04 | 78.52% ± 1.22 | 79.31% | ||
| Somatization | 83.13% ± 0.03 | 77.86% ± 0.43 | 81.25% | ||
| Depression | 74.38% ± 2.72 | 69.23% ± 2.71 | 84.38% | ||
| Obsession-Compulsion | 88.25% ± 0.05 | 81.33% ± 0.54 | 87.88% | ||
| Living environment | Anxiety | 83.25% ± 0.04 | 76.32% ± 0.56 | 91.18% | |
| Interpersonal Sensitivity | 88.26% ± 0.02 | 75.43% ± 0.78 | 81.25% | ||
| Agoraphobia | 86.85% ± 0.06 | 78.68% ± 0.18 | 88.00% | ||
| Paranoid Ideation | 95.13% ± 0.03 | 78.07% ± 0.24 | 92.31% | ||
| Psychoticism | 94.37% ± 0.04 | 80.58% ± 0.21 | 89.29% | ||
| Hostility | 90.60% ± 0.01 | 86.11% ± 1.20 | 86.21% | ||
| Somatization | 93.43% ± 0.01 | 83.05% ± 0.29 | 84.38% | ||
| Depression | 90.04% ± 0.04 | 71.44% ± 0.48 | 78.13% | ||
| Obsession-Compulsion | 97.76% ± 0.00 | 88.09% ± 0.30 | 93.94% | ||
| Economic status | Anxiety | 96.32% ± 0.00 | 86.70% ± 0.25 | 82.35% | |
| Interpersonal Sensitivity | 88.31% ± 0.03 | 78.29% ± 0.06 | 88.24% | ||
| Agoraphobia | 93.43% ± 0.01 | 90.21% ± 0.29 | 88.00% | ||
| Paranoid Ideation | 89.66% ± 0.01 | 80.03% ± 0.58 | 92.31% | ||
| Psychoticism | 76.33% ± 0.05 | 76.70% ± 0.40 | 75.00% | ||
| Hostility | 94.02% ± 0.00 | 91.05% ± 0.15 | 93.10% | ||
| Somatization | 93.66% ± 0.01 | 93.71% ± 0.22 | 84.38% | ||
| Depression | 94.44% ± 0.00 | 92.00% ± 0.29 | 90.63% | ||
| Health impacts | Obsession-Compulsion | 90.29% ± 0.02 | 86.31% ± 0.65 | 96.97% | |
| Anxiety | 91.87% ± 0.00 | 91.94% ± 0.06 | 91.18% | ||
| Interpersonal Sensitivity | 93.28% ± 0.02 | 90.19% ± 0.28 | 88.24% | ||
| Agoraphobia | 92.88% ± 0.02 | 92.22% ± 0.22 | 96.00% | ||
| Paranoid Ideation | 85.61% ± 0.03 | 86.18% ± 0.64 | 100.00% | ||
| Psychoticism | 83.98% ± 0.08 | 83.92% ± 0.92 | 82.14% | ||
The results above allow us to assess whether the models encounter difficulties in correctly identifying healthy individuals, potentially misdiagnosing them as having a psychological condition. Such misdiagnoses could lead to unnecessary treatments, incurring economic and psychological consequences. Overall, most models achieve accuracy levels above 80%, with many exceeding 90%. However, some specific cases show lower performance. For the demographic characteristics’ subset, challenges arise in diagnosing hostility, interpersonal sensitivity, and anxiety. In the living environment subset, diagnosing hostility presents difficulties. Finally, for the economic status subset, the models struggle with diagnosing depression and psychoticism. Although the classifiers generally perform well, the demographic characteristics subset exhibits the most inconsistent values, particularly for the psychological condition of hostility. Notably, the health impacts subset demonstrates robust performance across all conditions, with no significant issues observed.
Table 5.
Specificity applying benchmarks.
| Training subset | Binary classifier | Train | Validation | Test |
| Hostility | 94.35% ± 0.07 | 91.92% ± 0.50 | 96.67% | |
| Somatization | 99.19% ± 0.01 | 92.69% ± 0.20 | 93.75% | |
| Depression | 97.81% ± 0.02 | 94.09% ± 0.14 | 93.75% | |
| Obsession-Compulsion | 97.93% ± 0.01 | 94.09% ± 0.44 | 97.06% | |
| Demographic characteristics | Anxiety | 98.10% ± 0.04 | 95.86% ± 0.08 | 100.00% |
| Interpersonal Sensitivity | 95.56% ± 0.05 | 90.28% ± 0.45 | 97.06% | |
| Agoraphobia | 96.41% ± 0.02 | 90.09% ± 0.50 | 92.00% | |
| Paranoid Ideation | 97.82% ± 0.01 | 90.34% ± 0.50 | 88.46% | |
| Psychoticism | 96.89% ± 0.02 | 82.98% ± 0.76 | 92.86% | |
| Hostility | 100.00% ± 0.00 | 99.26% ± 0.02 | 96.67% | |
| Somatization | 99.41% ± 0.00 | 97.46% ± 0.10 | 93.75% | |
| Depression | 88.41% ± 1.24 | 81.01% ± 3.88 | 84.38% | |
| Obsession-Compulsion | 98.30% ± 0.01 | 92.49% ± 0.17 | 91.18% | |
| Living environment | Anxiety | 98.68% ± 0.01 | 95.54% ± 0.15 | 97.06% |
| Interpersonal Sensitivity | 98.11% ± 0.02 | 85.69% ± 0.59 | 94.12% | |
| Agoraphobia | 94.96% ± 0.02 | 88.03% ± 0.84 | 92.00% | |
| Paranoid Ideation | 100.00% ± 0.00 | 87.03% ± 0.63 | 88.46% | |
| Psychoticism | 98.00% ± 0.03 | 83.93% ± 0.58 | 96.43% | |
| Hostility | 100.00% ± 0.00 | 99.00% ± 0.04 | 96.67% | |
| Somatization | 98.82% ± 0.01 | 86.01% ± 0.56 | 93.75% | |
| Depression | 98.41% ± 0.01 | 86.70% ± 0.02 | 93.75% | |
| Obsession-Compulsion | 98.13% ± 0.01 | 89.41% ± 0.09 | 82.35% | |
| Economic status | Anxiety | 99.28% ± 0.00 | 87.16% ± 0.35 | 88.24% |
| Interpersonal Sensitivity | 94.39% ± 0.05 | 85.42% ± 0.60 | 94.12% | |
| Agoraphobia | 100.00% ± 0.00 | 96.67% ± 0.44 | 100.00% | |
| Paranoid Ideation | 100.00% ± 0.00 | 91.89% ± 0.37 | 100.00% | |
| Psychoticism | 93.76% ± 0.01 | 93.87% ± 0.09 | 100.00% | |
| Hostility | 100.00% ± 0.00 | 100.00% ± 0.00 | 100.00% | |
| Somatization | 100.00% ± 0.00 | 100.00% ± 0.00 | 100.00% | |
| Depression | 100.00% ± 0.00 | 100.00% ± 0.00 | 100.00% | |
| Health impacts | Obsession-Compulsion | 99.25% ± 0.00 | 99.29% ± 0.02 | 100.00% |
| Anxiety | 99.26% ± 0.00 | 99.33% ± 0.02 | 94.12% | |
| Interpersonal Sensitivity | 99.26% ± 0.00 | 99.33% ± 0.02 | 97.06% | |
| Agoraphobia | 100.00% ± 0.00 | 100.00% ± 0.00 | 100.00% | |
| Paranoid Ideation | 100.00% ± 0.00 | 100.00% ± 0.00 | 100.00% | |
| Psychoticism | 100.00% ± 0.00 | 100.00% ± 0.00 | 100.00% |
The metrics presented in Table 5 are particularly significant due to their direct implications for mental health. Low values indicate that individuals suffering from a psychological condition may be incorrectly diagnosed as healthy, which poses serious challenges to their well-being and access to appropriate care. Analyzing the subsets, it is evident that the health impacts subset demonstrates the best performance, aligning with the sensitivity values observed. For the rest of the cases, results are good enough with no values under 82% and with many of them over 90%.
To facilitate a comparative analysis of the models across subsets and psychological conditions, a bar chart summarizing these results is provided in Figure 1.
The Figure cited above provides an overview of model performance across the three evaluated metrics. Ideally, the models should demonstrate high accuracy with minimal differences between specificity and sensitivity. In cases where one metric significantly outperforms accuracy, this mustn’t be specificity, for the problems this could cause as previously discussed. Upon analyzing the differences, only five cases show noteworthy deviations, such as anxiety within demographic features and psychoticism within economic characteristics. Instances, where specificity exceeds accuracy, are limited to three cases: paranoid ideation within demographic features, obsession-compulsion within economic characteristics, and paranoid ideation within living features. Overall, most models exhibit stable performance with reliable metrics, with only three cases identified as potentially less trustworthy.
To provide a more detailed analysis of the performance of the ML models, Figure 2 and Figure 3 were generated. Figure 2 identifies the best-performing model for each use case across the four subsets.
The Figure cited above illustrates that RF and SVM consistently appear as the best-performing models across all four subsets, indicating their adaptability to diverse data characteristics. DT also demonstrates strong performance, ranking as the top model in three subsets. Notably, LR is the only model that never achieves the highest performance in any subset.
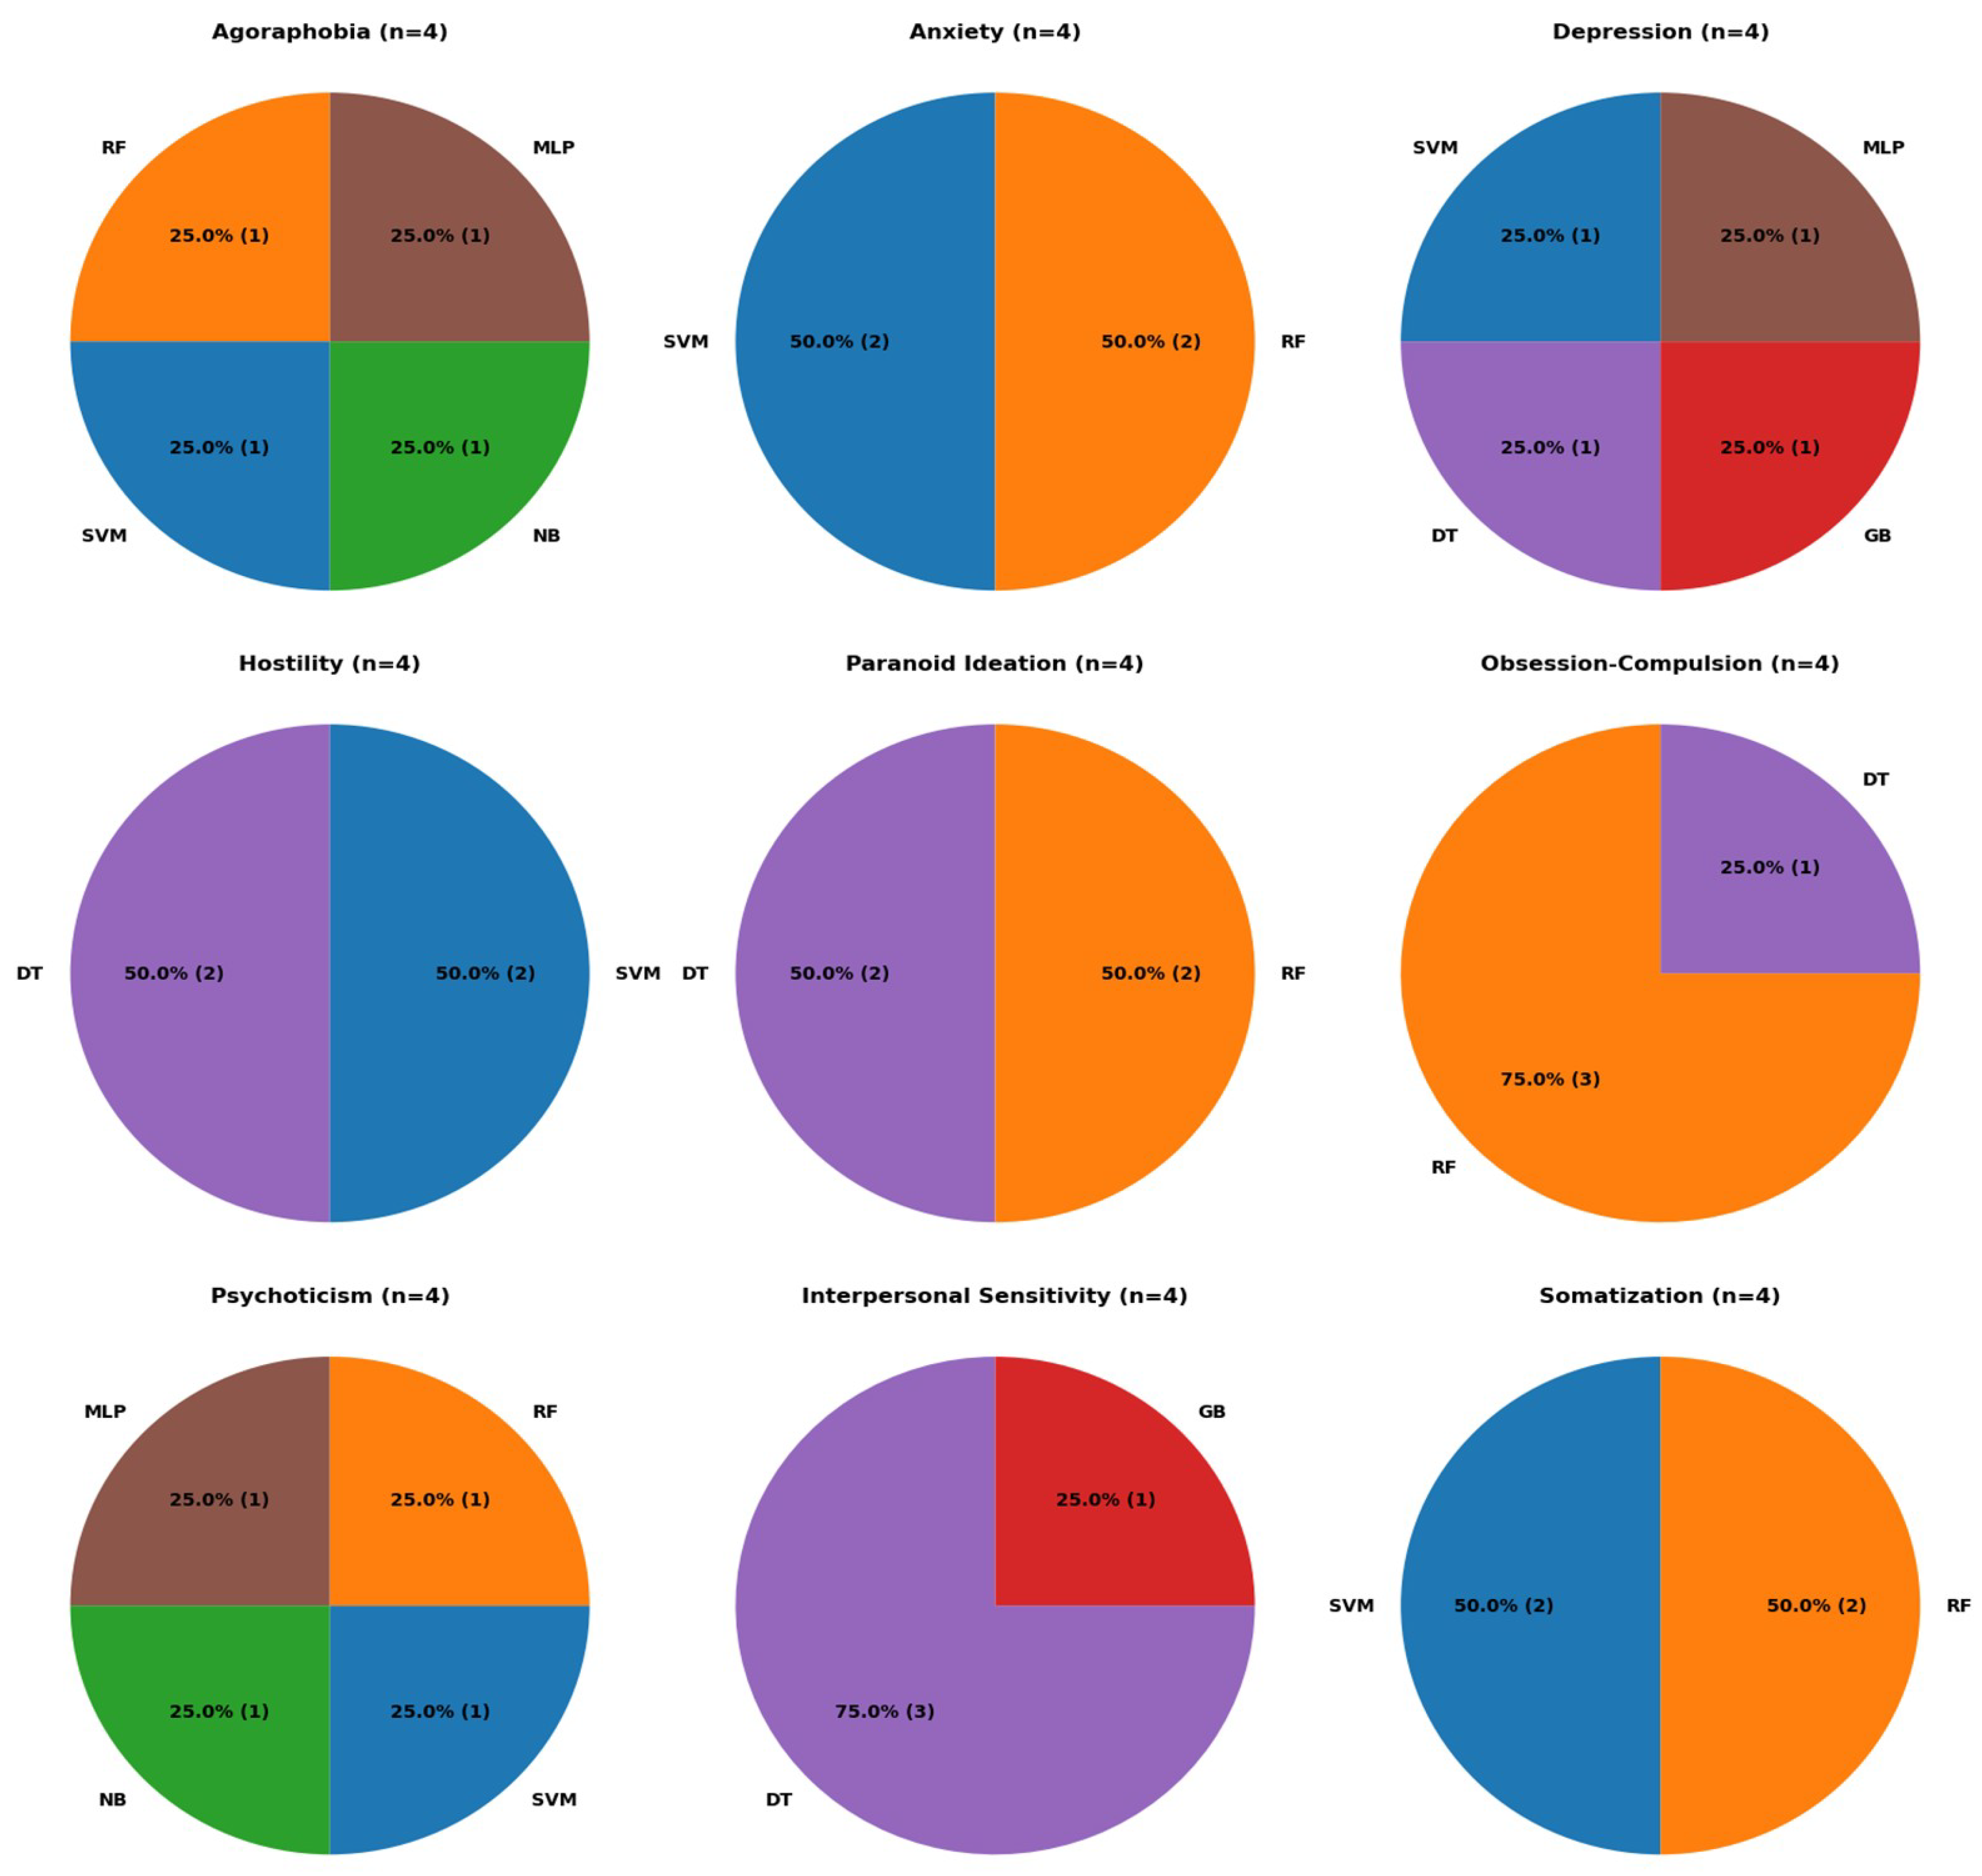
Figure 3 presents a similar analysis; however, it focuses on identifying the best-performing models for each psychological condition.
Figure 3 reveals that for three psychological conditions, no ML model outperforms the others. In four of the psychological conditions, performance is distributed between two models. Lastly, in two subsets, a single model achieves the best performance in 75% of the cases: RF for obsession-compulsion and DT for interpersonal sensitivity. Overall, RF and SVM perform best across six psychological conditions, while DT excels in five. In summary, RF emerges as the most suitable model, leading in 11 cases, followed by SVM and DT, each with nine.
5. Conclusions and Future Works
This work aims to introduce a dataset that connects features from four different domains—demographic characteristics, living environment, economic status, and health impacts with nine psychological conditions. A unique aspect of this dataset is not only the variety of features collected but also the specific context in which the data was gathered: during the strict quarantine measures in Spain during the outbreak of COVID-19 in 2020. This context provides valuable insights into how these factors might have influenced psychological well-being during an unprecedented global crisis.
To assess the utility of this dataset, we divided it into four subsets based on the nature of the features and trained various ML models to evaluate their performance. The results demonstrate that the ML models perform well in terms of accuracy across all subsets. However, challenges were observed in sensitivity and specificity values, highlighting the need for improved identification of positive cases. In terms of model performance, RF emerged as the top performer, followed by SVM and DT.
Looking ahead, future work will focus on a deeper exploration of which specific features within each subset have the most significant impact on predicting the nine psychological conditions. Identifying these influential features could provide valuable insights for mental health professionals, enabling more targeted interventions. Additionally, further analysis could include the exploration of other ML techniques, such as ensemble methods or deep learning models, to enhance prediction accuracy and address the sensitivity and specificity challenges identified in this study. Understanding the dynamic relationships between these features and psychological health will also open up possibilities for future research in mental health diagnostics. personalized treatment strategies and prevention in the cases of vulnerable pupulations.
This work contributes a unique dataset aimed at understanding the mental health impacts of the COVID-19 lockdown in Spain, offering a rich combination of psychological assessments and sociodemographic data. By providing an open-access resource, this research supports further exploration of the interplay between living conditions, economic factors, and mental health during crises, potentially informing public health policies and targeted interventions. On the positive side, this dataset enables the development of predictive models for mental health outcomes, advancing tools that can identify vulnerable populations early. These insights could be vital for designing equitable mental health interventions during future public health emergencies. However, we acknowledge potential risks. The use of Machine Learning models for predicting mental health outcomes may raise concerns about data privacy, the stigmatization of individuals based on predictions, and the risk of overgeneralization if the models are applied without accounting for nuanced individual circumstances. These risks highlight the need for ethical considerations and the responsible application of findings to avoid unintended harm. Overall, this study underscores the potential of integrating data-driven approaches to address complex societal challenges while urging caution in the deployment of such technologies to ensure their benefits are maximized equitably.
Acknowledgments
No funding was received during this research.
Appendix A Personal questionnaire
1. Please indicate the gender you identify with.
2. Date of birth (to select your year, click on the arrow next to the date and then scroll down the sidebar).
3. Indicate your marital status.
4. Please specify your place of birth.
5. What is the current status of your documentation?
6. Do you have European nationality?
7. What is the highest level of education you have completed?
8. Please provide details of your studies, if applicable.
9. Please indicate your usual living arrangements during the 12 months BEFORE the Lockdown.
10. Please indicate your usual living arrangements DURING the lockdown.
11. Please indicate the number of MINORS in your care DURING the quarantine.
12. Please indicate the number of dependents over 18 years old in your care (including elderly individuals, and people with disabilities) DURING the quarantine.
13. Please indicate how many people you usually had face-to-face contact with on a normal day BEFORE the quarantine (including at home, work, and socially).
14. Please indicate how many people you usually had face-to-face contact with on a normal day DURING the quarantine (including at home, work, and socially).
15. Please indicate your Postal Code during the lockdown.
16. Please specify the type of space you were living in DURING the lockdown.
17. Please indicate if you own your home or if you are renting.
18. How many usable square meters (that you can walk on) did your residence have DURING the quarantine?
19. Would you say your living space DURING the quarantine had adequate ventilation?
20. Would you say your living space DURING the quarantine had sufficient natural light?
21. Please indicate if these elements were present in your living space DURING the Quarantine.
22. Considering your place of residence DURING the lockdown, please indicate the number of rooms (not counting the bathroom and kitchen).
23. Considering your place of residence DURING the lockdown, please indicate the number of people you lived with.
24. Considering your place of residence DURING the lockdown, please indicate the number of people in your bedroom, excluding yourself.
25. Employment status BEFORE (in the 12 months before the start of the quarantine or most of the time).
26. Please provide details of the type of job during that period, if applicable.
27. What was the duration of your workday BEFORE (in the 12 months before the start of the quarantine or most of that time)?
28. What was your employment status DURING the quarantine?
29. What do you consider could be your employment or academic status AFTER the crisis caused by the coronavirus (in the 12 months following the end of the quarantine or most of that time)?
30. In the 12 months BEFORE the lockdown, what was the main occupation of the PERSON who contributed the most economic support to the HOUSEHOLD?
31. What was the approximate level of regular MONTHLY net income in your HOUSEHOLD (unit where expenses are shared: individual, couple, family) BEFORE the quarantine (in the 12 months before the start of the quarantine or most of that time)?
32. What was the approximate level of regular MONTHLY net income in your HOUSEHOLD (unit where expenses are shared: individual, couple, family) DURING the quarantine?
33. DURING the confinement in your home, did you experience any significant changes in your financial situation?
34. Suppose you (and your spouse or partner) convert all your funds in current and/or savings accounts, stock market investments, bonds, real estate, and sell your house, vehicles, and all your valuable items into money. Then, suppose you use the money from all these transactions to pay your mortgage and other credits, loans, debts, and credit cards. Would you still have money left after paying all your debts, or would you still owe money (a rough estimate is sufficient)?
35. Please indicate if you currently have any of the following health conditions.
36. If you have ever received a psychiatric diagnosis, please indicate which one.
37. Are you currently receiving psychiatric treatment or medication?
38. Are you currently receiving psychological treatment or therapy?
39. If you have consumed substances weekly in the last 6 months, please specify which ones.
40. Please indicate if you need help with daily self-care tasks such as shopping, household chores, bathing, grooming, cooking, managing money, etc.
41. Please indicate, if applicable, the degree of disability according to your certificate ª42. Please indicate if you have ever attempted suicide.
43. Please indicate if you have been diagnosed with a coronavirus infection.
44. If you have had a coronavirus diagnosis, how would you rate the severity of the illness?
45. In this case, did you remain isolated inside your home (without leaving a room and without company during the duration of symptoms and 15 more days)?
46. If any member of the family unit has been diagnosed with a coronavirus infection, please indicate who it is (check more than one option if applicable).
47. If so, please assess the severity of the disease (consider the most severe case if there are multiple cases).
48. Has any member of your family diagnosed with a coronavirus infection lived in your home during their illness?
49. How many times a week did you leave the house during the quarantine?
50. For what reasons did you leave the house during the quarantine?
51. Do you consider that the measures taken to prevent the pandemic’s progression are adequate and fair?
Appendix B SA-45 Test
1. The idea that another person can control your thoughts.
2. Believing that most of your problems are someone else’s fault.
3. Feeling scared in open spaces or on the street.
4. Hearing voices that other people do not hear.
5. The idea that most people cannot be trusted.
6. Feeling sudden and irrational fear.
7. Outbursts of anger or rage that you cannot control.
8. Fear of going out alone.
9. Feeling lonely.
10. Feeling sad.
11. Losing interest in things.
12. Feeling nervous or very anxious.
13. Believing that others are aware of your thoughts.
14. Feeling that others do not understand or listen to you.
15. Having the impression that people are unfriendly or that you are disliked.
16. Having to do things very slowly to be sure you are doing them right.
17. Feeling inferior to others.
18. Muscle pain.
19. The feeling that others are watching or talking about you.
20. Having to check everything you do repeatedly.
21. Having difficulty making decisions.
22. Feeling afraid to travel by bus, subway, or train.
23. Feeling hot or cold suddenly.
24. Having to avoid certain places or situations because they scare you.
25. Mind going blank.
26. Numbness or tingling in any part of your body.
27. Feeling hopeless about the future.
28. Having difficulty concentrating.
29. Feeling weak in any part of your body.
30. Feeling worried, tense, or agitated.
31. Heaviness in arms or legs.
32. Feeling uncomfortable when people look at you or talk about you.
33. Having thoughts that are not yours.
34. Feeling the urge to hit, hurt, or harm someone.
35. Feeling like breaking something.
36. Feeling very shy among other people.
37. Feeling scared or anxious in crowded places (like a cinema or supermarket).
38. Panic or terror attacks.
39. Having frequent arguments.
40. Feeling that others do not adequately recognize your achievements.
41. Feeling restless or uneasy.
42. The feeling of being useless or worthless.
43. Shouting or throwing things.
44. The impression that people would try to take advantage of you if they could.
45. The idea that you should be punished for your sins.
Appendix C Distribution of initial features among the four subsets
Demographic characteristics:
- Gender
- Age
- Nationality
- Marital Status
- Current Documentation Status
- Education Level
- Family Structure before COVID
- Family Structure during COVID
- Change in Family Structure
- Number of Minors in Care During COVID
- Adults in Care Over 18
Living environment:
- Type of Living Space During Confinement
- Property Ownership
- Square Meters of Living Space
- Light During Quarantine
- Ventilation During Quarantine
- Number of Rooms
- Number of Cohabitants
- Number of Cohabitants in the Same Room
- Outings During Quarantine
- Assessment of COVID Measures
Economic status:
- Employment Status Before Quarantine
- Employment Status During Quarantine
- Employment Status After Quarantine
- Change in Employment Status
- Working Hours Before Quarantine
- Occupation of the Person with the Highest Economic Contribution
- Net Monthly Income Before COVID
- Net Monthly Income During COVID
- Change in Net Monthly Income
- Financial Sufficiency and Situation During COVID
- Financial Sufficiency and Situation After COVID
Health impacts:
- Health Condition and Specific Needs
- Disability Degree
- Suicide Attempt
- COVID Diagnosis
- COVID Severity
- Isolation During COVID Diagnosis
- Family Member Diagnosed with COVID
- Family Member COVID Severity
- Co-living with a Diagnosed Family Member
Appendix D Information related to computational resources used for the best ML models.
| Training subset | Binary classifier | Time (s) | Memory space (KB) | Tunned hyperparameters |
| Hostility | 0.750003 | 6 | - | |
| Somatization | 25.170890 | 15 | - | |
| Depression | 32.415980 | 13 | - | |
| Obsession-Compulsion | 10.62998 | 457 | - | |
| Demographic characteristics | Anxiety | 89.17416 | 16 | - |
| Interpersonal Sensitivity | 0.842999 | 7 | - | |
| Agoraphobia | 8.176015 | 262 | - | |
| Paranoid Ideation | 0.715997 | 9 | - | |
| Psychoticism | 43.589999 | 89 | - | |
| Hostility | 40.453997 | 15 | - | |
| Somatization | 42.414486 | 13 | - | |
| Depression | 16.899999 | 87 | - | |
| Obsession-Compulsion | 8.106001 | 514 | - | |
| Living environment | Anxiety | 48.644653 | 15 | - |
| Interpersonal Sensitivity | 13.537016 | 98 | - | |
| Agoraphobia | 47.707595 | 74 | - | |
| Paranoid Ideation | 8.211001 | 285 | - | |
| Psychoticism | 8.212002 | 250 | - | |
| Hostility | 14.565359 | 10 | - | |
| Somatization | 9.50388 | 813 | - | |
| Depression | 0.887095 | 10 | - | |
| Obsession-Compulsion | 8.809057 | 809 | - | |
| Economic status | Anxiety | 13.53503 | 547 | - |
| Interpersonal Sensitivity | 0.772601 | 7 | - | |
| Agoraphobia | 17.598321 | 8 | - | |
| Paranoid Ideation | 8.533304 | 546 | - | |
| Psychoticism | 3.693993 | 4 | - | |
| Hostility | 0.646555 | 4 | - | |
| Somatization | 11.578461 | 76 | - | |
| Depression | 9.281631 | 426 | - | |
| Health impacts | Obsession-Compulsion | 0.664224 | 5 | - |
| Anxiety | 8.356251 | 99 | - | |
| Interpersonal Sensitivity | 0.827175 | 5 | - | |
| Agoraphobia | 7.309343 | 3 | - | |
| Paranoid Ideation | 0.716712 | 4 | - | |
| Psychoticism | 8.846613 | 10 | - |
References
- Radovanovic, D.; Rizzi, M.; Pini, S.; Saad, M.; Chiumello, D.A.; Santus, P. Helmet CPAP to treat acute hypoxemic respiratory failure in patients with COVID-19: a management strategy proposal. Journal of clinical medicine 2020, 9, 1191. [Google Scholar] [CrossRef]
- Grant, M.C.; Geoghegan, L.; Arbyn, M.; Mohammed, Z.; McGuinness, L.; Clarke, E.L.; Wade, R.G. The prevalence of symptoms in 24,410 adults infected by the novel coronavirus (SARS-CoV-2; COVID-19): A systematic review and meta-analysis of 148 studies from 9 countries. PloS one 2020, 15, e0234765. [Google Scholar] [CrossRef] [PubMed]
- Ahmed, F.; Zviedrite, N.; Uzicanin, A. Effectiveness of workplace social distancing measures in reducing influenza transmission: a systematic review. BMC public health 2018, 18, 1–13. [Google Scholar] [CrossRef] [PubMed]
- Livingston, E.; Bucher, K.; Rekito, A. Coronavirus disease 2019 and influenza 2019-2020. Jama 2020, 323, 1122–1122. [Google Scholar] [CrossRef]
- Shah, S.G.S.; Nogueras, D.; Van Woerden, H.C.; Kiparoglou, V. The COVID-19 pandemic: a pandemic of lockdown loneliness and the role of digital technology. Journal of medical Internet research 2020, 22, e22287. [Google Scholar] [CrossRef]
- Brooks, S.K.; Webster, R.K.; Smith, L.E.; Woodland, L.; Wessely, S.; Greenberg, N.; Rubin, G.J. The psychological impact of quarantine and how to reduce it: rapid review of the evidence. The lancet 2020, 395, 912–920. [Google Scholar] [CrossRef]
- Rodríguez-Rey, R.; Garrido-Hernansaiz, H.; Collado, S. Psychological impact of COVID-19 in Spain: Early data report. Psychological Trauma: Theory, Research, Practice, and Policy 2020, 12, 550. [Google Scholar] [CrossRef]
- Gismero-González, E.; Bermejo-Toro, L.; Cagigal, V.; Roldán, A.; Martínez-Beltrán, M.J.; Halty, L. Emotional impact of COVID-19 lockdown among the Spanish population. Frontiers in Psychology 2020, 11, 616978. [Google Scholar] [CrossRef] [PubMed]
- González-Sanguino, C.; Ausín, B.; Castellanos, M.Á.; Saiz, J.; López-Gómez, A.; Ugidos, C.; Muñoz, M. Mental health consequences during the initial stage of the 2020 Coronavirus pandemic (COVID-19) in Spain. Brain, behavior, and immunity 2020, 87, 172–176. [Google Scholar] [CrossRef] [PubMed]
- Miranda-Mendizabal, A.; Recoder, S.; Calbo Sebastian, E.; Casajuana Closas, M.; Leiva Ureña, D.; Manolov, R.; Matilla Santander, N.; Forero, C.G.; Castellví, P. Socio-economic and psychological impact of COVID-19 pandemic in a Spanish cohort BIOVAL-D-COVID-19 study protocol. Gaceta Sanitaria 2022, 36, 70–73. [Google Scholar] [CrossRef]
- Sadegh-Zadeh, S.A.; Bahrami, M.; Najafi, A.; Asgari-Ahi, M.; Campion, R.; Hajiyavand, A.M. Evaluation of COVID-19 pandemic on components of social and mental health using machine learning, analysing United States data in 2020. Frontiers in Psychiatry 2022, 13, 933439. [Google Scholar] [CrossRef]
- Wang, X.; Li, H.; Sun, C.; Zhang, X.; Wang, T.; Dong, C.; Guo, D. Prediction of mental health in medical workers during COVID-19 based on machine learning. Frontiers in public health 2021, 9, 697850. [Google Scholar] [CrossRef] [PubMed]
- Samuelson, K.W.; Dixon, K.; Jordan, J.T.; Powers, T.; Sonderman, S.; Brickman, S. Mental health and resilience during the coronavirus pandemic: A machine learning approach. Journal of Clinical Psychology 2022, 78, 821–846. [Google Scholar] [CrossRef] [PubMed]
- Rezapour, M.; Hansen, L. A machine learning analysis of COVID-19 mental health data. Scientific reports 2022, 12, 14965. [Google Scholar] [CrossRef] [PubMed]
- Prout, T.A.; Zilcha-Mano, S.; Aafjes-van Doorn, K.; Békés, V.; Christman-Cohen, I.; Whistler, K.; Kui, T.; Di Giuseppe, M. Identifying predictors of psychological distress during COVID-19: a machine learning approach. Frontiers in psychology 2020, 11, 586202. [Google Scholar] [CrossRef]
- Herbert, C.; El Bolock, A.; Abdennadher, S. How do you feel during the COVID-19 pandemic? A survey using psychological and linguistic self-report measures, and machine learning to investigate mental health, subjective experience, personality, and behaviour during the COVID-19 pandemic among university students. BMC psychology 2021, 9, 90. [Google Scholar]
- Glowacz, F.; Schmits, E. Psychological distress during the COVID-19 lockdown: The young adults most at risk. Psychiatry research 2020, 293, 113486. [Google Scholar] [CrossRef] [PubMed]
- Simjanoski, M.; Ballester, P.L.; da Mota, J.C.; De Boni, R.B.; Balanzá-Martínez, V.; Atienza-Carbonell, B.; Bastos, F.I.; Frey, B.N.; Minuzzi, L.; Cardoso, T.d.A.; others. Lifestyle predictors of depression and anxiety during COVID-19: a machine learning approach. Trends in Psychiatry and Psychotherapy 2022, 44, e20210365. [Google Scholar] [CrossRef]
- Tubío-Fungueiriño, M.; Cernadas, E.; Gonçalves, Ó.F.; Segalas, C.; Bertolín, S.; Mar-Barrutia, L.; Real, E.; Fernández-Delgado, M.; Menchón, J.M.; Carvalho, S.; others. Viability study of machine learning-based prediction of covid-19 pandemic impact in obsessive-compulsive disorder patients. Frontiers in Neuroinformatics 2022, 16, 807584. [Google Scholar] [CrossRef] [PubMed]
- Alonso, P.; Bertolín, S.; Segalàs, J.; Tubío-Fungueiriño, M.; Real, E.; Mar-Barrutia, L.; Fernández-Prieto, M.; Carvalho, S.; Carracedo, A.; Menchón, J. How is COVID-19 affecting patients with obsessive–compulsive disorder? A longitudinal study on the initial phase of the pandemic in a Spanish cohort. European Psychiatry 2021, 64, e45. [Google Scholar] [CrossRef] [PubMed]
- Aguilar-Latorre, A.; Oliván-Blázquez, B.; Porroche-Escudero, A.; Méndez-López, F.; García-Gallego, V.; Benedé-Azagra, B.; Magallón-Botaya, R. The impact of the COVID-19 lockdown on depression sufferers: a qualitative study from the province of Zaragoza, Spain. BMC Public Health 2022, 22, 780. [Google Scholar] [CrossRef] [PubMed]
- Holgado-Tello, F.P.; Vila-Abad, E.; Barbero-Garcia, M. Estructura interna del Symptom Assessment-45 Questionnaire (SA-45). Acción psicológica 2019, 16, 31–42. [Google Scholar] [CrossRef]
- Sandín, B.; Valiente, R.M.; Chorot, P.; Santed, M.A.; Lostao, L. SA-45: a brief form of the SCL-90. Psicothema 2008, 20, 290–296. [Google Scholar] [PubMed]
- Davison, M.L.; Bershadsky, B.; Bieber, J.; Silversmith, D.; Maruish, M.E.; Kane, R.L. Development of a brief, multidimensional, self-report instrument for treatment outcomes assessment in psychiatric settings: Preliminary findings. Assessment 1997, 4, 259–276. [Google Scholar] [CrossRef]
- Breiman, L. Classification and regression trees; Routledge, 2017.
- Breiman, L. Random forests. Machine learning 2001, 45, 5–32. [Google Scholar] [CrossRef]
- Cortes, C. Support-Vector Networks. Machine Learning 1995. [Google Scholar] [CrossRef]
- Friedman, J.H. Stochastic gradient boosting. Computational statistics & data analysis 2002, 38, 367–378. [Google Scholar]
- Mitchell, H. Bayesian Decision Theory. In Multi-Sensor Data Fusion: An Introduction; Springer, 2007; pp. 201–219.
- McCullagh, P. Generalized linear models; Routledge, 2019.
- Rumelhart, D.E.; Hinton, G.E.; Williams, R.J. Learning representations by back-propagating errors. nature 1986, 323, 533–536. [Google Scholar] [CrossRef]
- Bergstra, J.; Bardenet, R.; Bengio, Y.; Kégl, B. Algorithms for hyper-parameter optimization. Advances in neural information processing systems 2011, 24. [Google Scholar]
- Belkin, M.; Hsu, D.; Ma, S.; Mandal, S. Reconciling modern machine-learning practice and the classical bias–variance trade-off. Proceedings of the National Academy of Sciences 2019, 116, 15849–15854. [Google Scholar] [CrossRef]
| 1 | |
| 2 | |
| 3 |
Figure 1.
Comparison of different metrics in ML models’ performance across subsets.
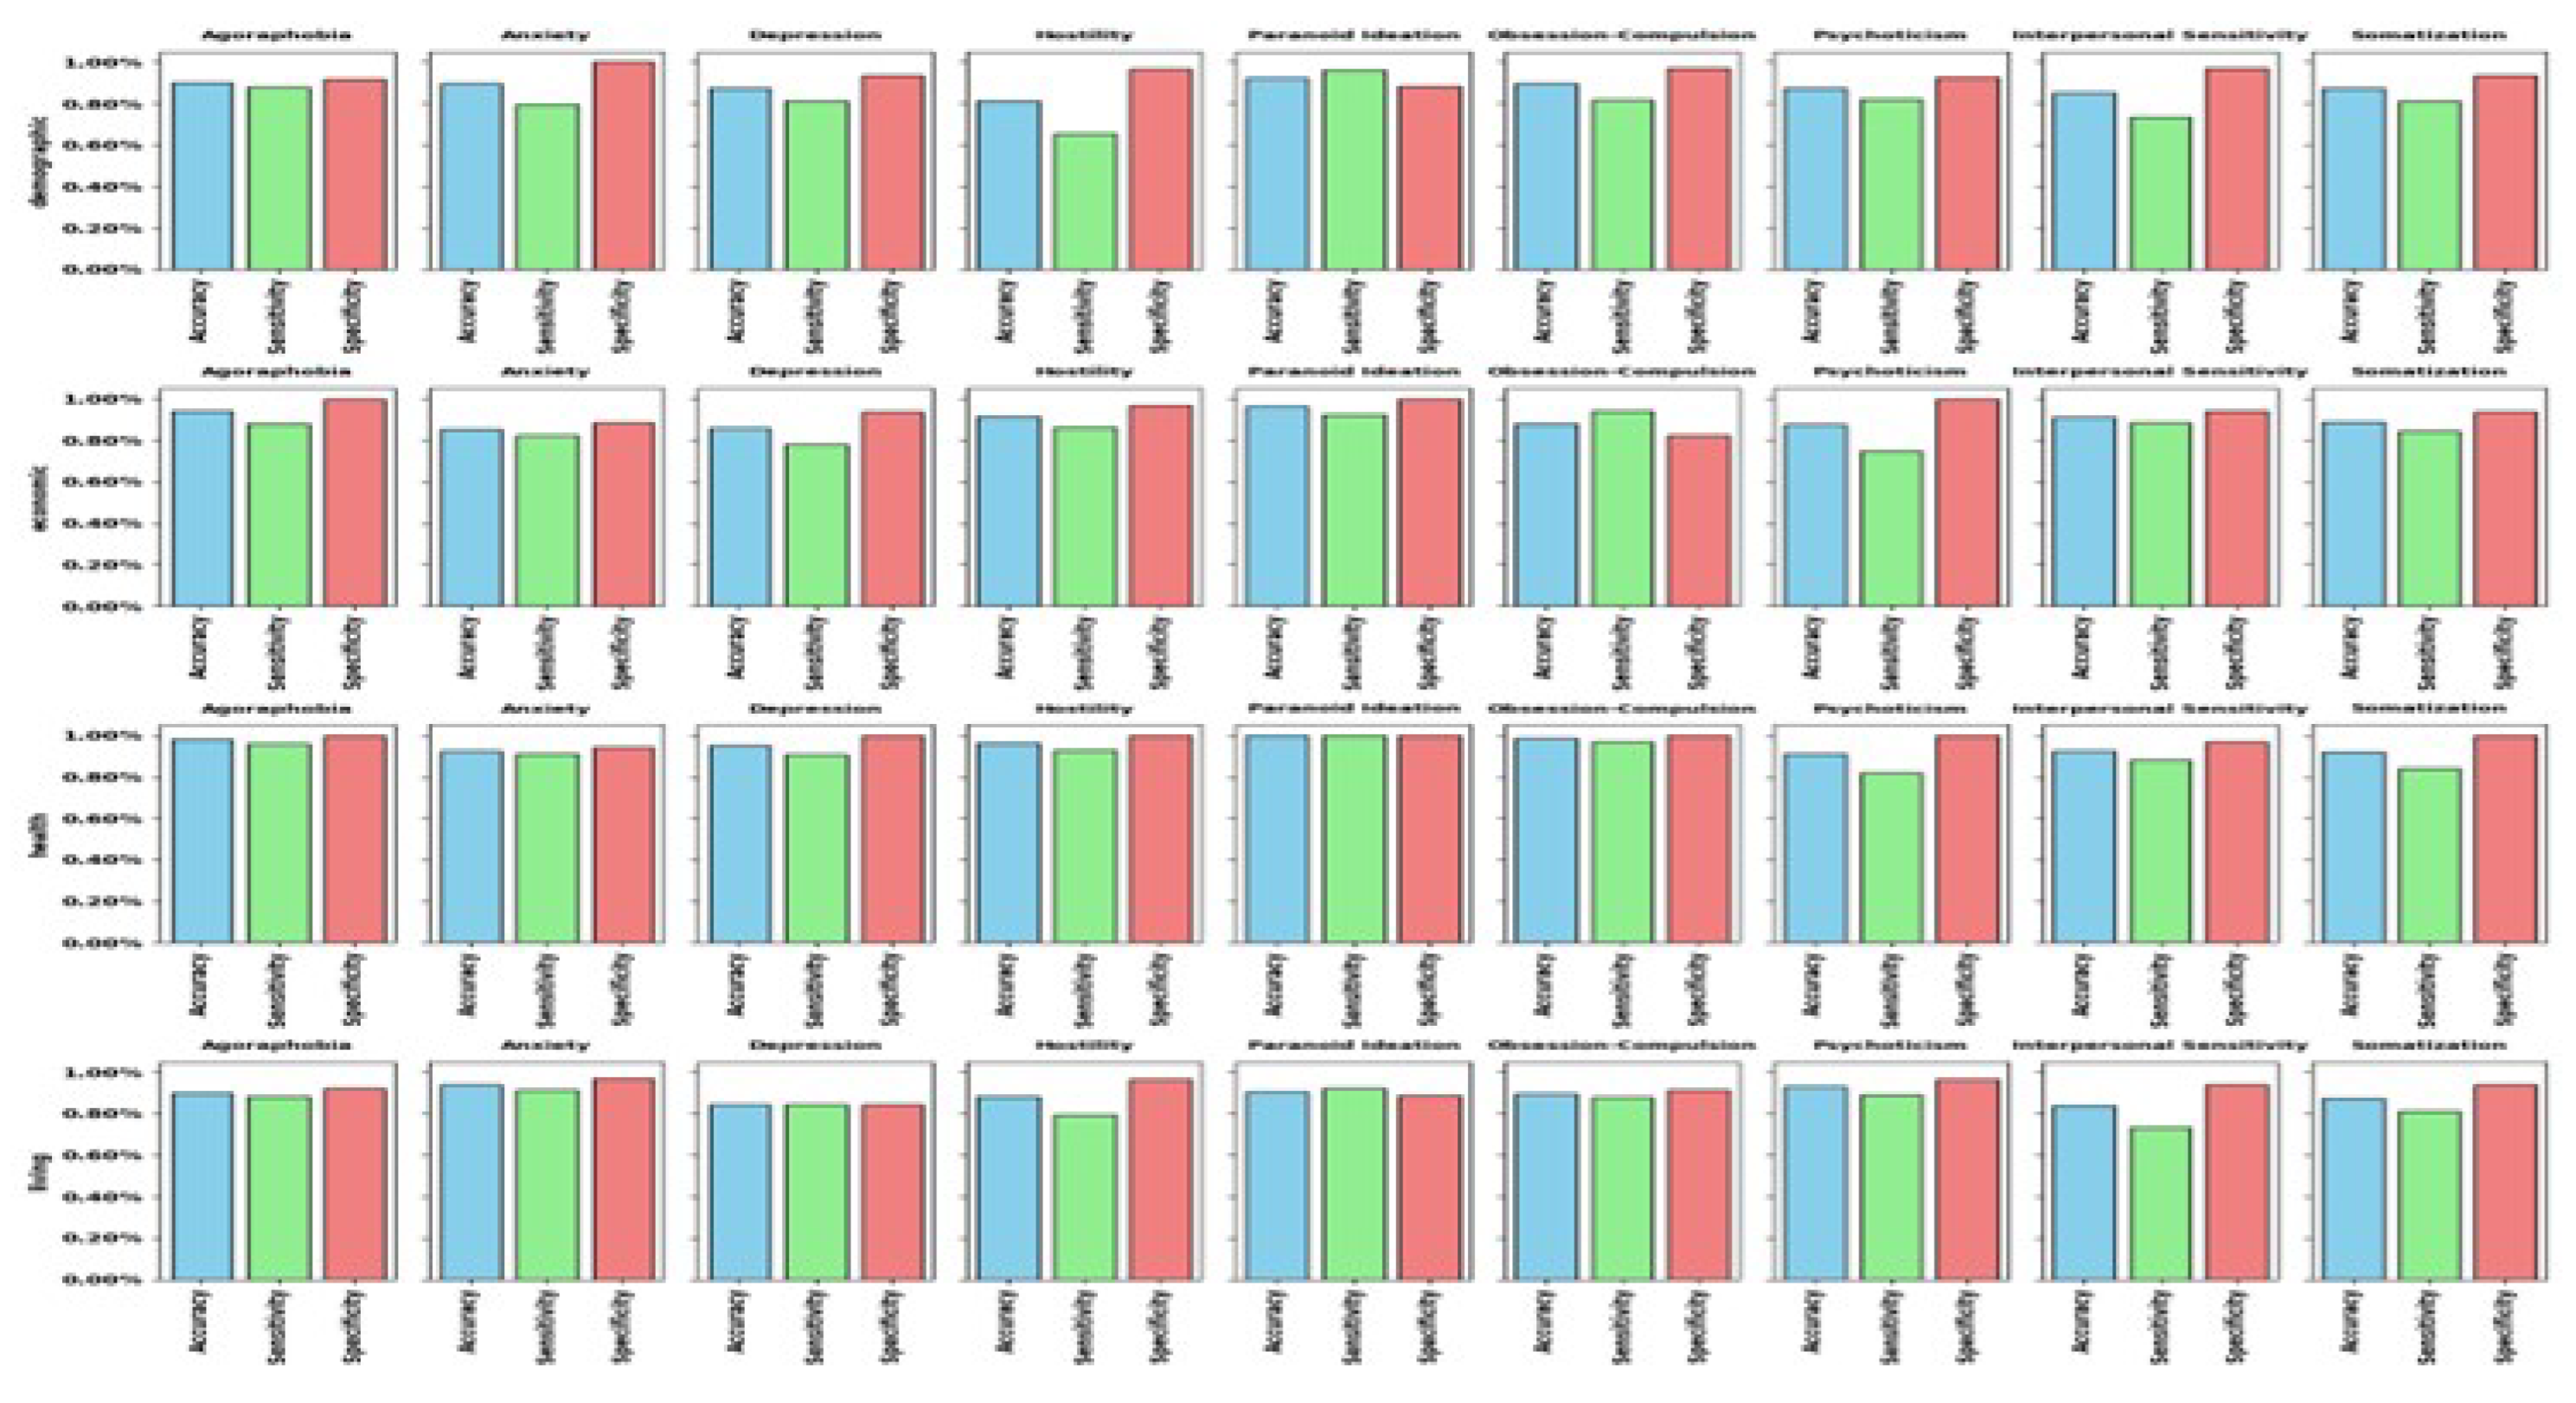
Figure 2.
Distribution of the best ML models across the 4 subsets.
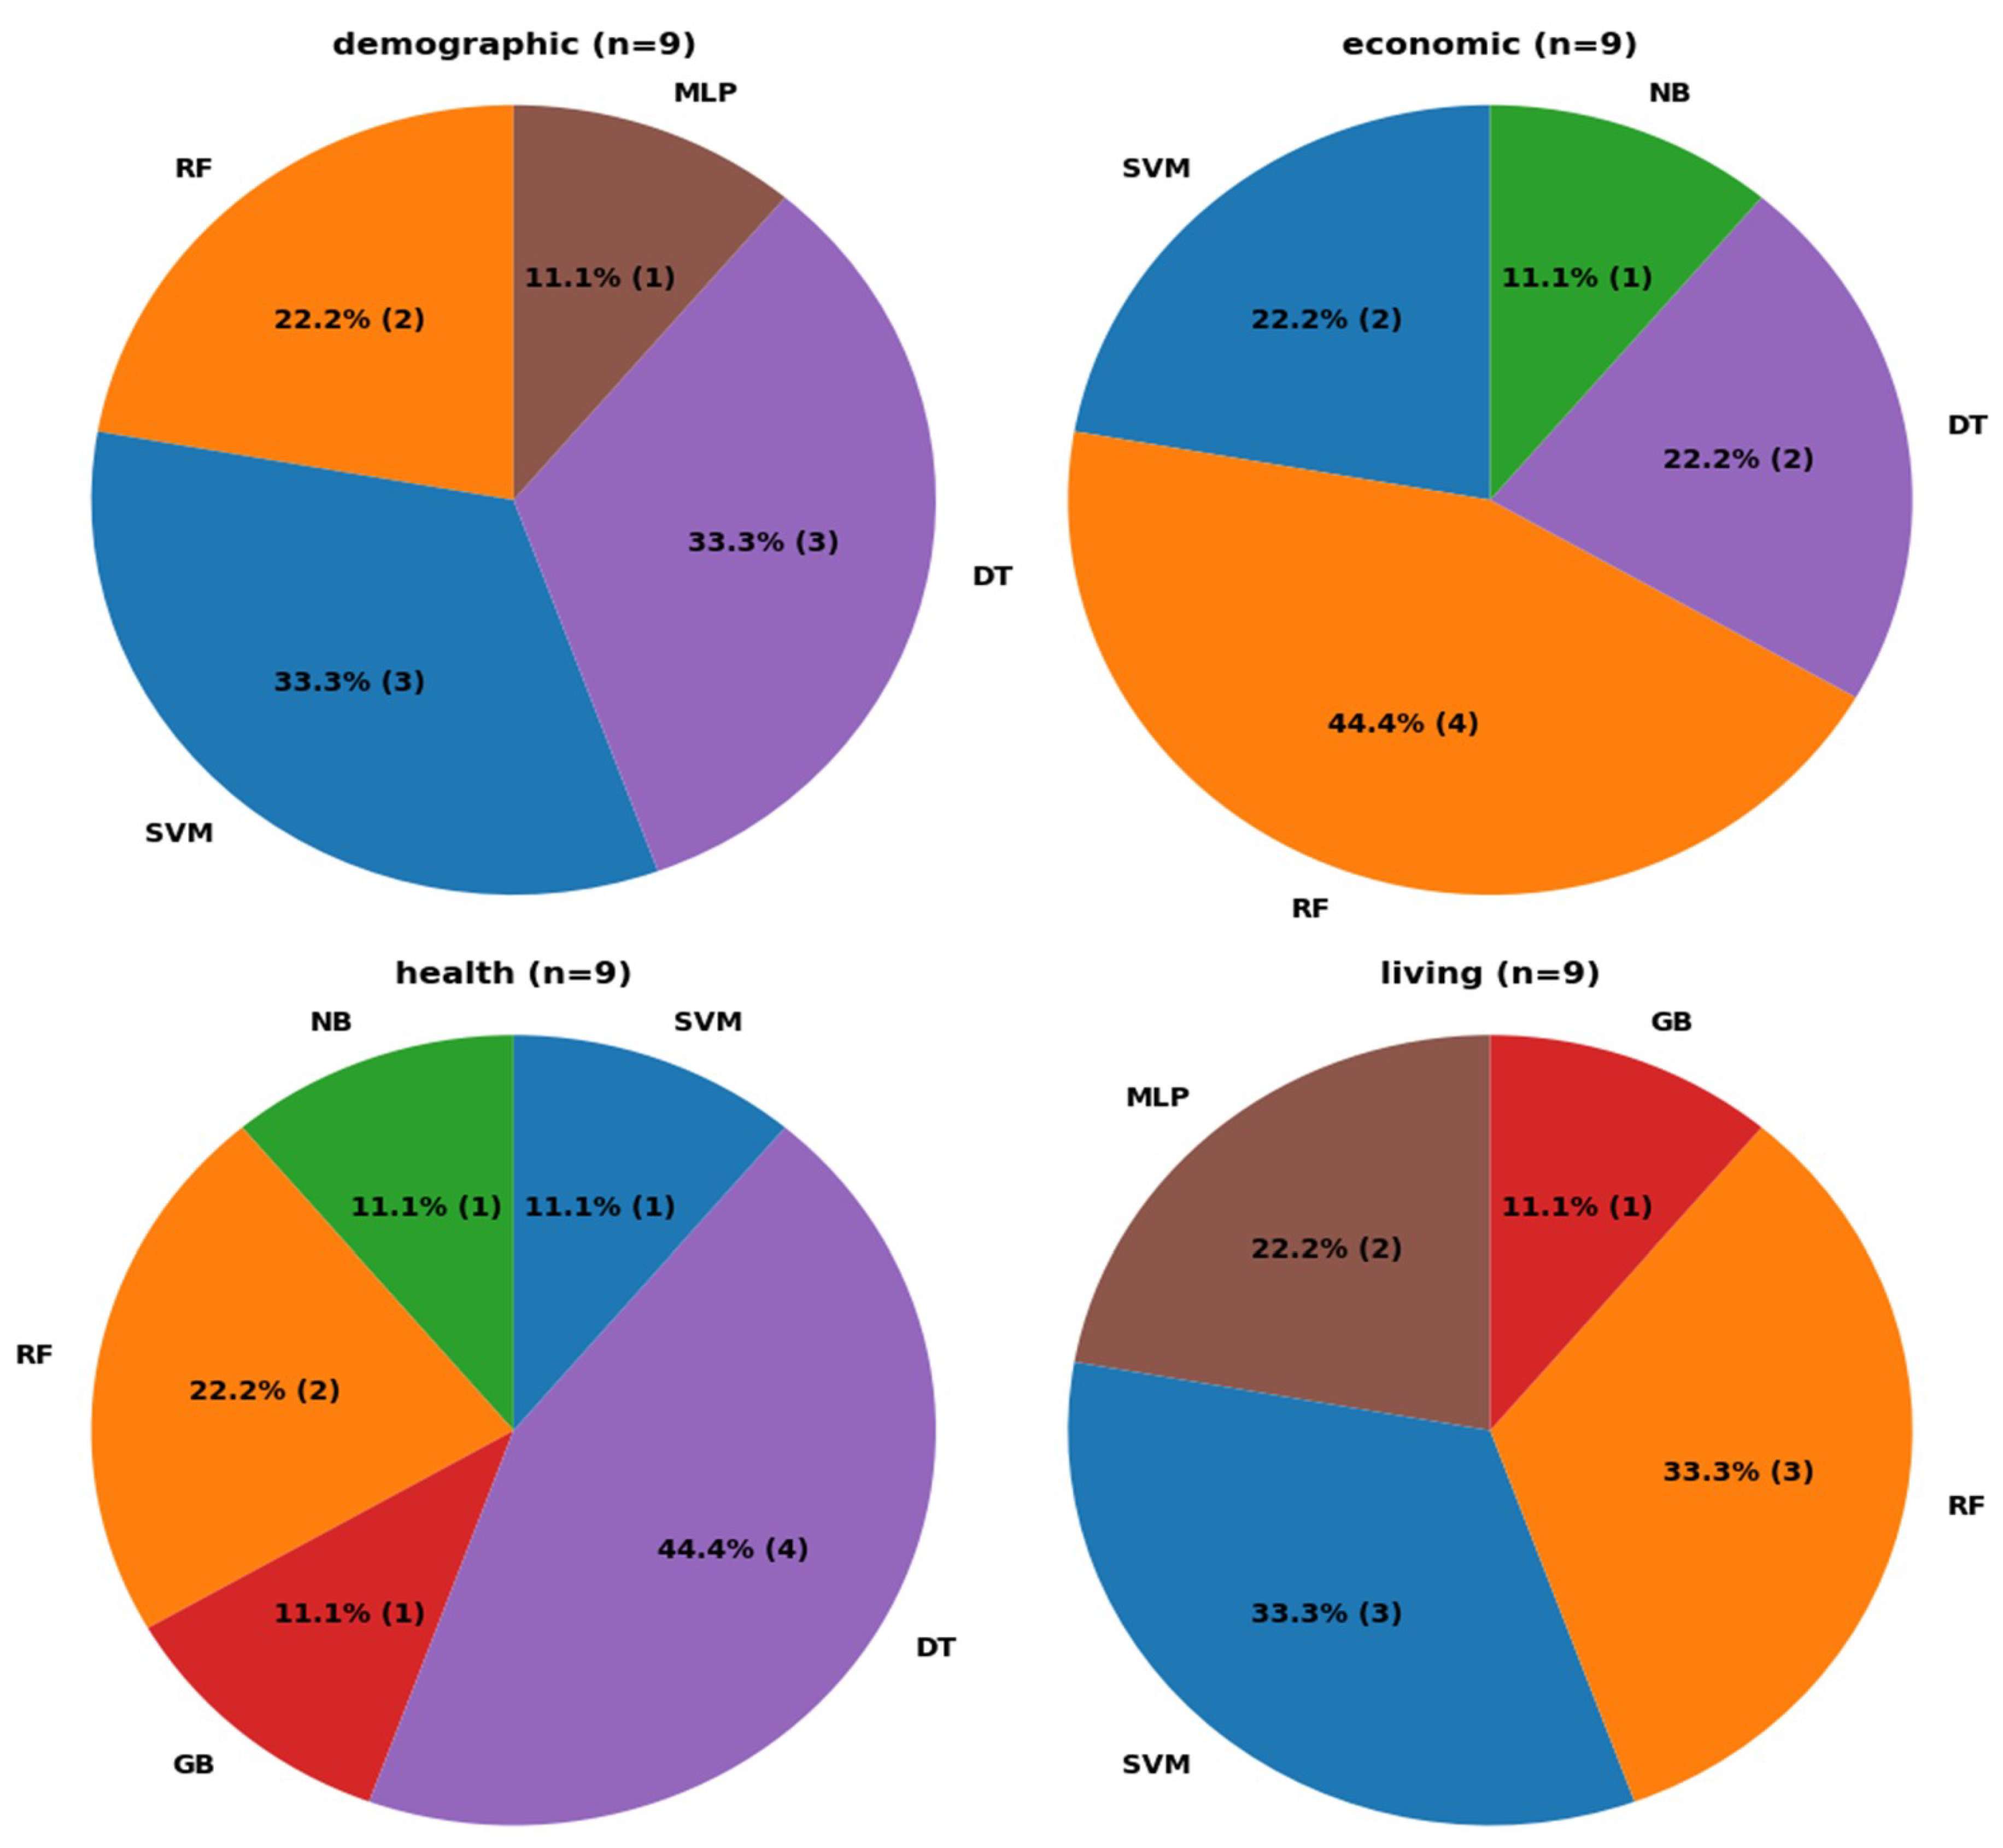
Figure 3.
Distribution of the best ML models across the 9 psychological conditions.
Disclaimer/Publisher’s Note: The statements, opinions and data contained in all publications are solely those of the individual author(s) and contributor(s) and not of MDPI and/or the editor(s). MDPI and/or the editor(s) disclaim responsibility for any injury to people or property resulting from any ideas, methods, instructions or products referred to in the content. |
© 2024 by the authors. Licensee MDPI, Basel, Switzerland. This article is an open access article distributed under the terms and conditions of the Creative Commons Attribution (CC BY) license (http://creativecommons.org/licenses/by/4.0/).
Copyright: This open access article is published under a Creative Commons CC BY 4.0 license, which permit the free download, distribution, and reuse, provided that the author and preprint are cited in any reuse.


