3. Results and Discussion
In recent decades, the demographic situation in the Republic of Kazakhstan has faced new challenges, the most significant of which is the polarization and regionalization of key demographic processes. This study examined the demographic situation in the regions of Kazakhstan and its impact on regional social infrastructure, using preschool and school education as examples.
In the early 2000s, with the stabilization of the political, socio-economic situation, positive changes in the country's demographic development began to emerge. Since 2003, the population of Kazakhstan has been steadily growing, reaching 19.7 million people at the beginning of 2023. The primary driver of this growth has been natural population increase.
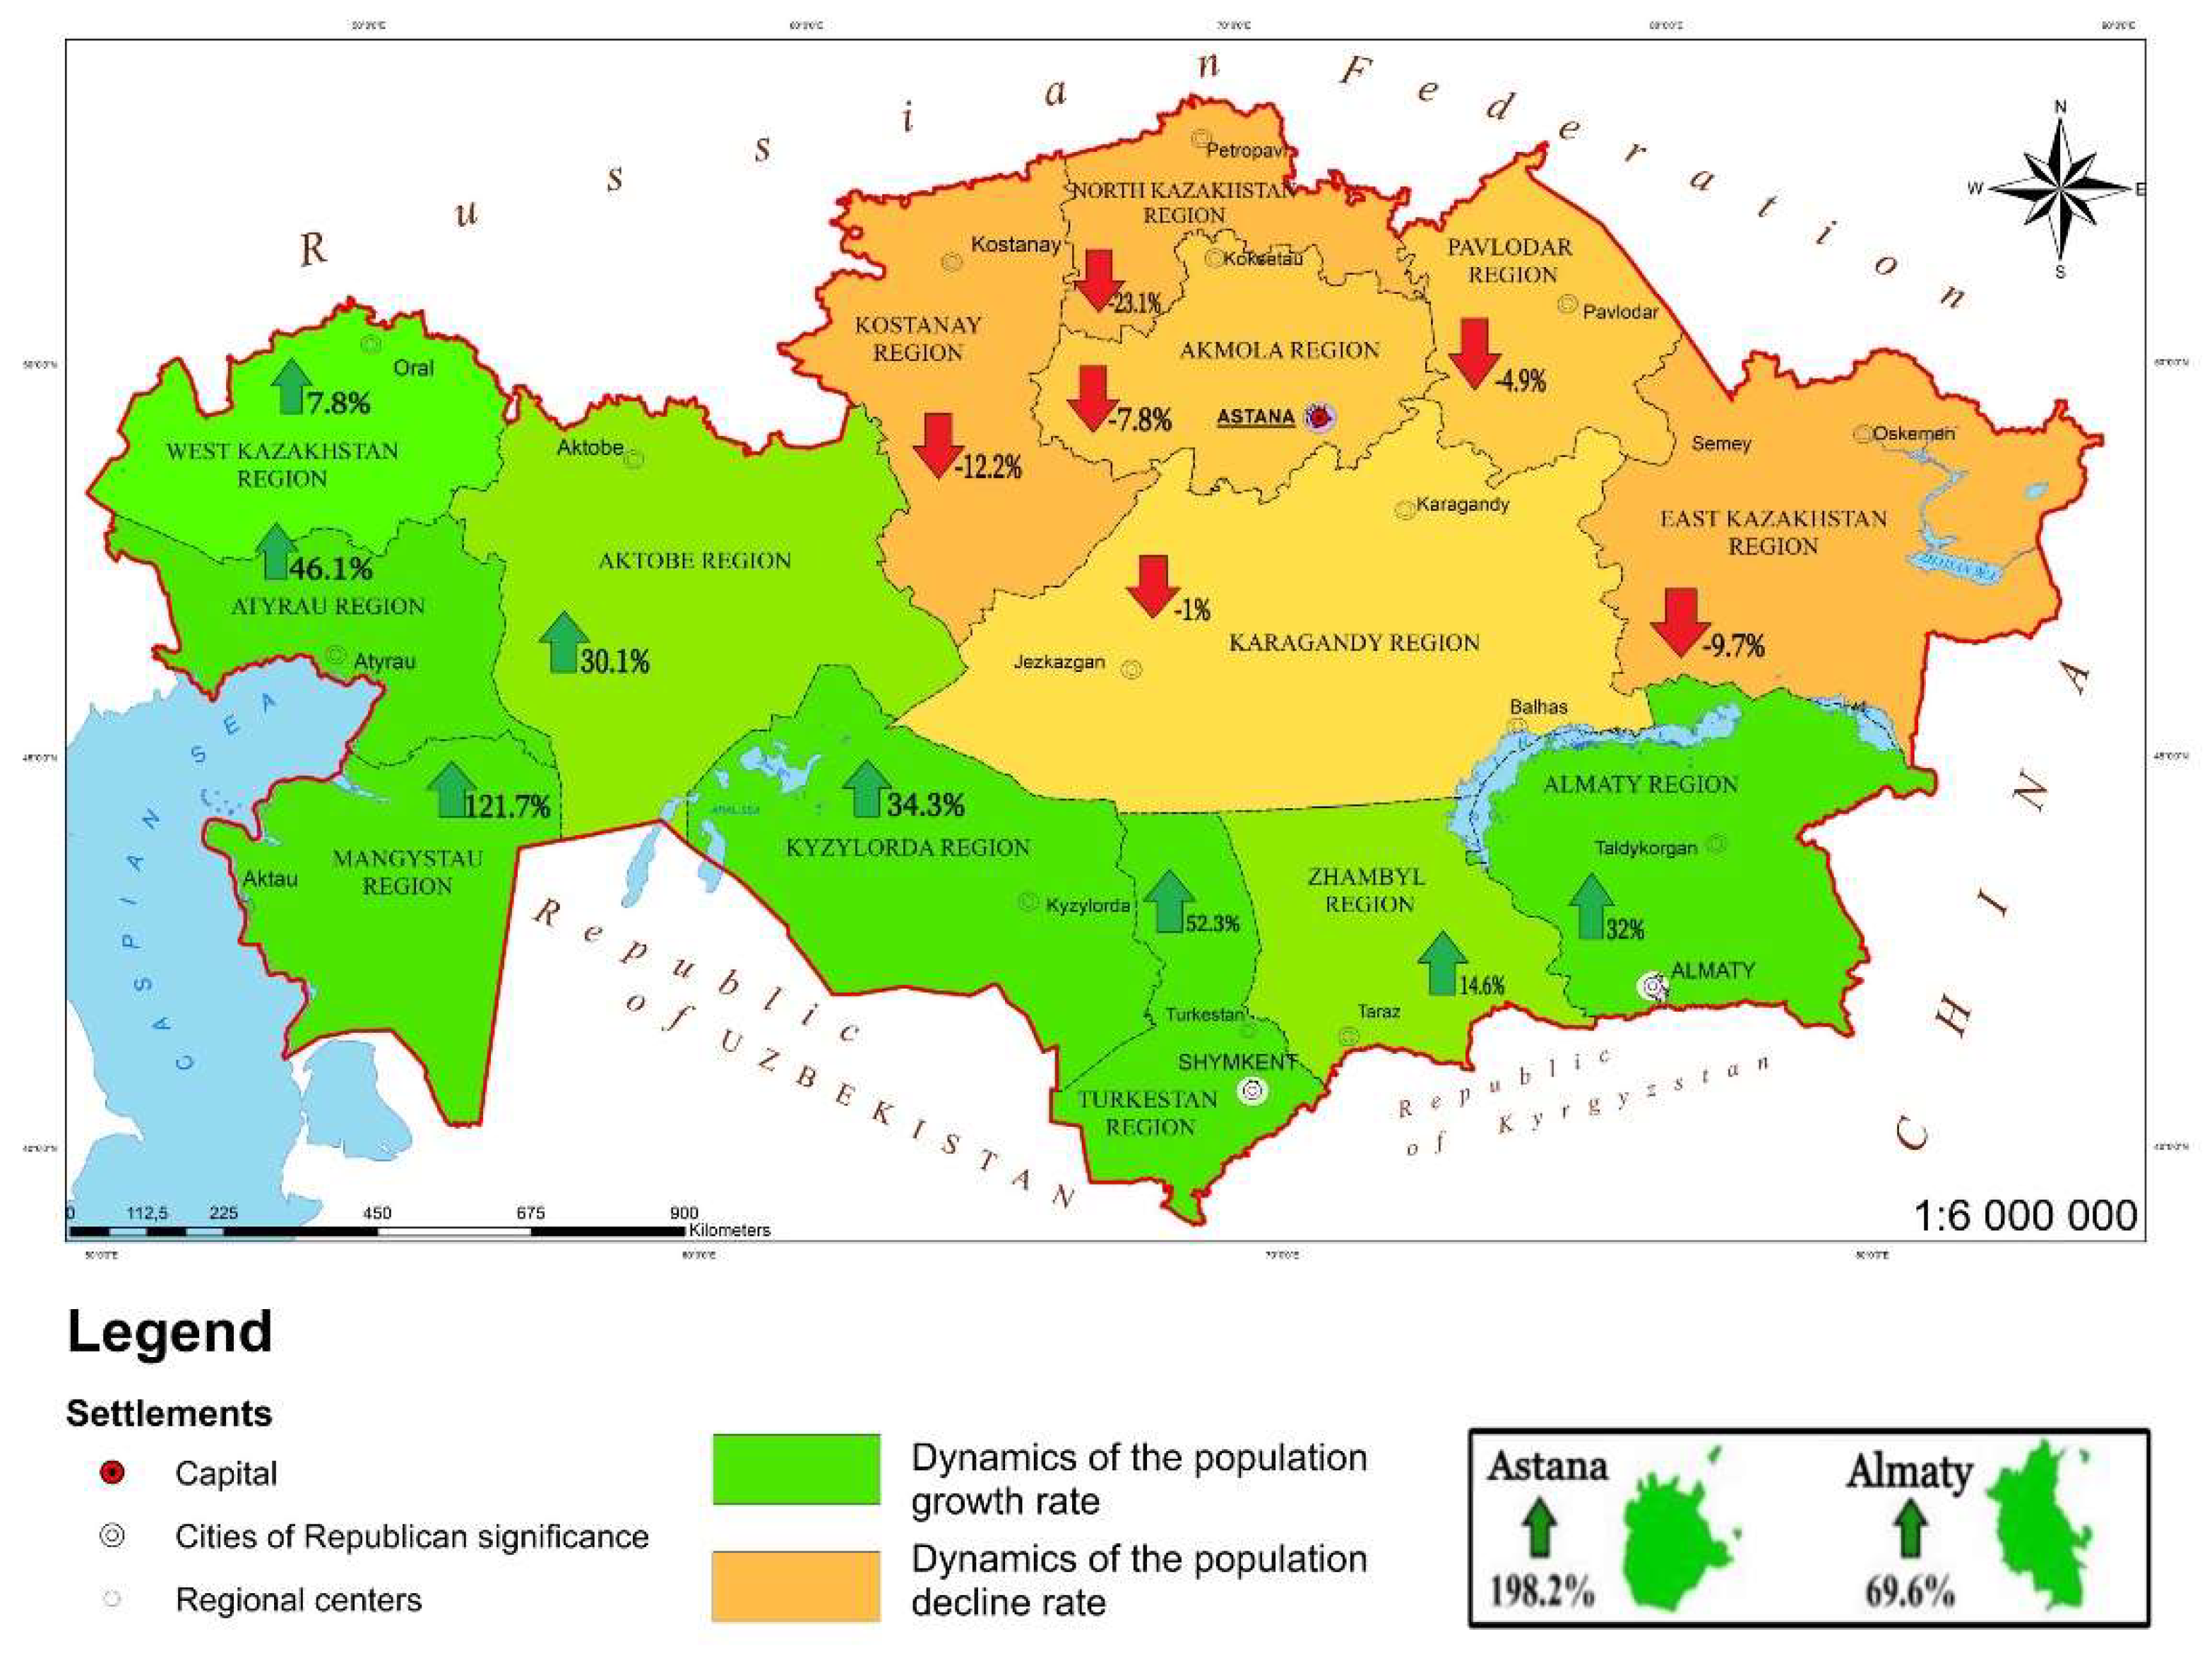
Although the national dynamics show a positive trend, regional analysis reveals significant disparities. Between 2000 and 2020, positive population growth was observed only in the western and southern regions, while the northern, central, and eastern regions experienced a decline in population (
Figure 1).
Although the negative demographic trends of the 1990s were largely overcome, their "legacy" continued to affect the age structure during the 2000–2009 period. From 2009 to 2020, there has been a growing burden on the working-age population: the share of the population aged 0 to 15 years and those of retirement age has increased, leading to a decrease in the proportion of the working-age population in the overall structure of the country's population.
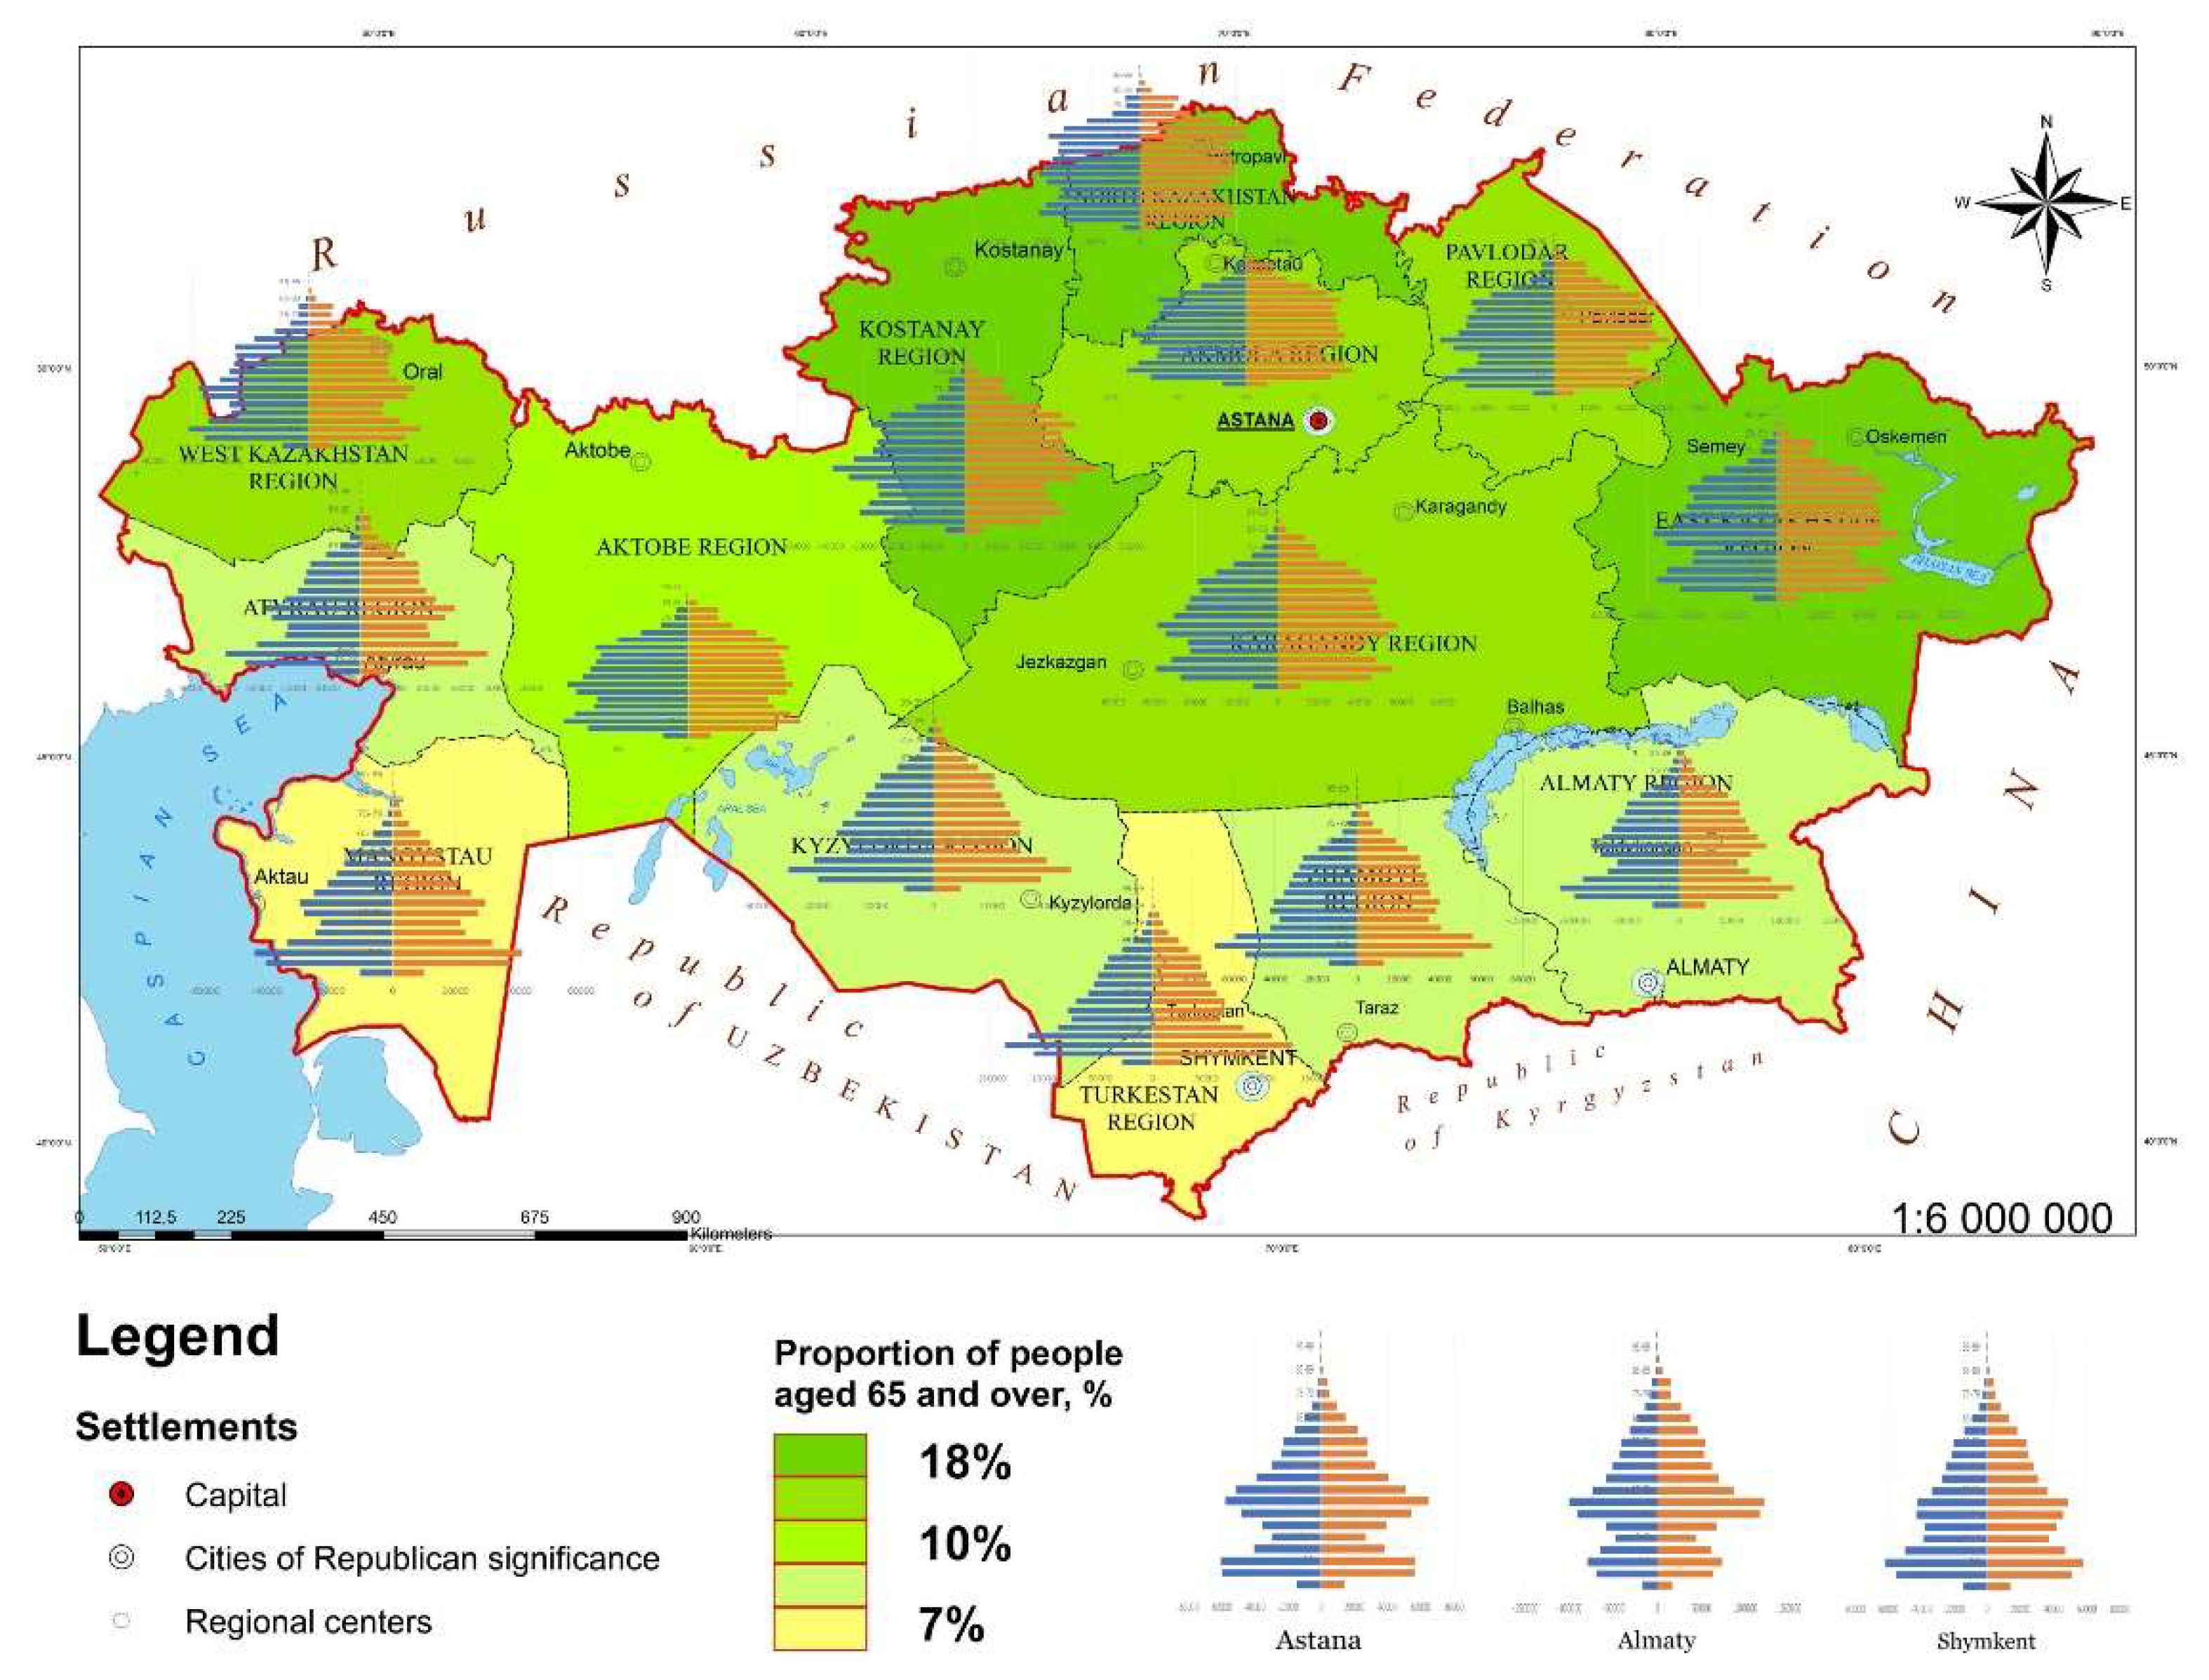
The regions of North Kazakhstan, East Kazakhstan, Pavlodar, and Kostanay are characterized by a rapidly aging population (
Figure 2). In addition to the above factors, these regions are home to a significant portion of the European population, which includes a large number of older individuals. The share of people aged 65 and older in these regions exceeds 10%, and the aging process is progressing at a considerable pace.
At the same time, the proportion of children and youth in the age structure of the population is increasing. The 2020 age structure indicates that the group approaching working age (10–14 years) is 1.8 times larger than the group exiting working age (60–64 years). The issue of youth unemployment, already pressing today, will become even more pronounced. This problem is most acute in the regions of Almaty, Atyrau, Zhambyl, Kyzylorda, Mangystau, and Turkestan, which are predominantly inhabited by Kazakhs. In these regions, the share of children exceeds 30%. The high growth rate of the older population is overshadowed by an even faster increase in the younger and youth age groups.
Figure 2.
Age and Gender Structure of the Population in the Regions of the Republic of Kazakhstan in 2020.
Figure 2.
Age and Gender Structure of the Population in the Regions of the Republic of Kazakhstan in 2020.
Between 1991 and 1998, Kazakhstan experienced a decline in natural population growth. The natural increase, which amounted to 218.9 thousand people (9.73‰) in 1991, fell to 68.1 thousand people (4.52‰) by 1998 [
17]. Over the following years, the growth rate remained at this level. Starting in 2002, natural growth rates began to rise, with the most significant increase occurring between 2003 and 2008, when the rate doubled from 6.22‰ to 13.01‰. Subsequently, the pace of natural population growth slowed, and since 2014, a declining trend in the natural growth rate has been observed.
The natural growth rate varies significantly across the regions of Kazakhstan. The northern regions of the country show the lowest rates of natural increase, while the highest rates are observed in the southern and western regions, as well as in the cities of Astana and Shymkent, where the natural growth rate significantly exceeds the national average.
In 2020, natural population growth rates increased not only on average across the country but also in regions with already high growth rates (Mangystau, Turkestan, Atyrau, Kyzylorda, Almaty, Zhambyl, Aktobe, and West Kazakhstan regions). Conversely, these rates declined in regions with traditionally low growth rates (North Kazakhstan, Kostanay, Pavlodar, Karaganda, East Kazakhstan, and Akmola regions), indicating further polarization in the dynamics of natural population growth.
According to 2020 data [
18], for the first time since 2008, a natural population decline was recorded in the North Kazakhstan region (-1.2‰). The lowest overall natural growth rate in 2020 was in Kostanay region (1.2‰). Relatively low rates were also observed in Pavlodar (4.0‰), East Kazakhstan (4.4‰), Akmola (5.4‰), and Karaganda (5.8‰) regions, where the overall natural growth rate was 3 to 3.5 times lower than the national average. The highest overall natural growth rates were recorded in the Mangystau (24.7‰), Turkestan (23.8‰), and Atyrau (20.4‰) regions, as well as in the cities of Shymkent (23.6‰) and Astana (20.2‰).
This regional differentiation is attributed to the ethno-demographic and age structure of the population in these regions. In the North Kazakhstan, Pavlodar, Akmola, Kostanay, East Kazakhstan, and Karaganda regions, the age structure is characterized by a decreasing proportion of young and middle-aged populations and an increasing proportion of those aged 60 and older. Consequently, birth rates are declining, while mortality rates are rising. Internal migration also plays a role, as young people leave these regions.
While the average reproductive indicators for Kazakhstan appear relatively favorable, two crisis scenarios have emerged. The first, in the northeast, is observed in Akmola, Pavlodar, East Kazakhstan, and Karaganda regions, where the lowest natural growth rates are recorded, particularly in North Kazakhstan and Kostanay regions, which are experiencing population depopulation.
The second, in the southwest, is observed in Kyzylorda, Mangystau, and Turkestan regions, as well as in Shymkent city. Here, the indicators are approaching a demographic explosion. The natural growth rate increase of 20% or more annually is nearing a critical state, as the pace of socio-economic development is significantly lower and unable to ensure an adequate standard of living for the new generations.
Migration is also an integral part of socio-demographic development in the country. Alongside natural growth, it determines population increase or decrease, influencing the scale of demographic potential and the labor market.
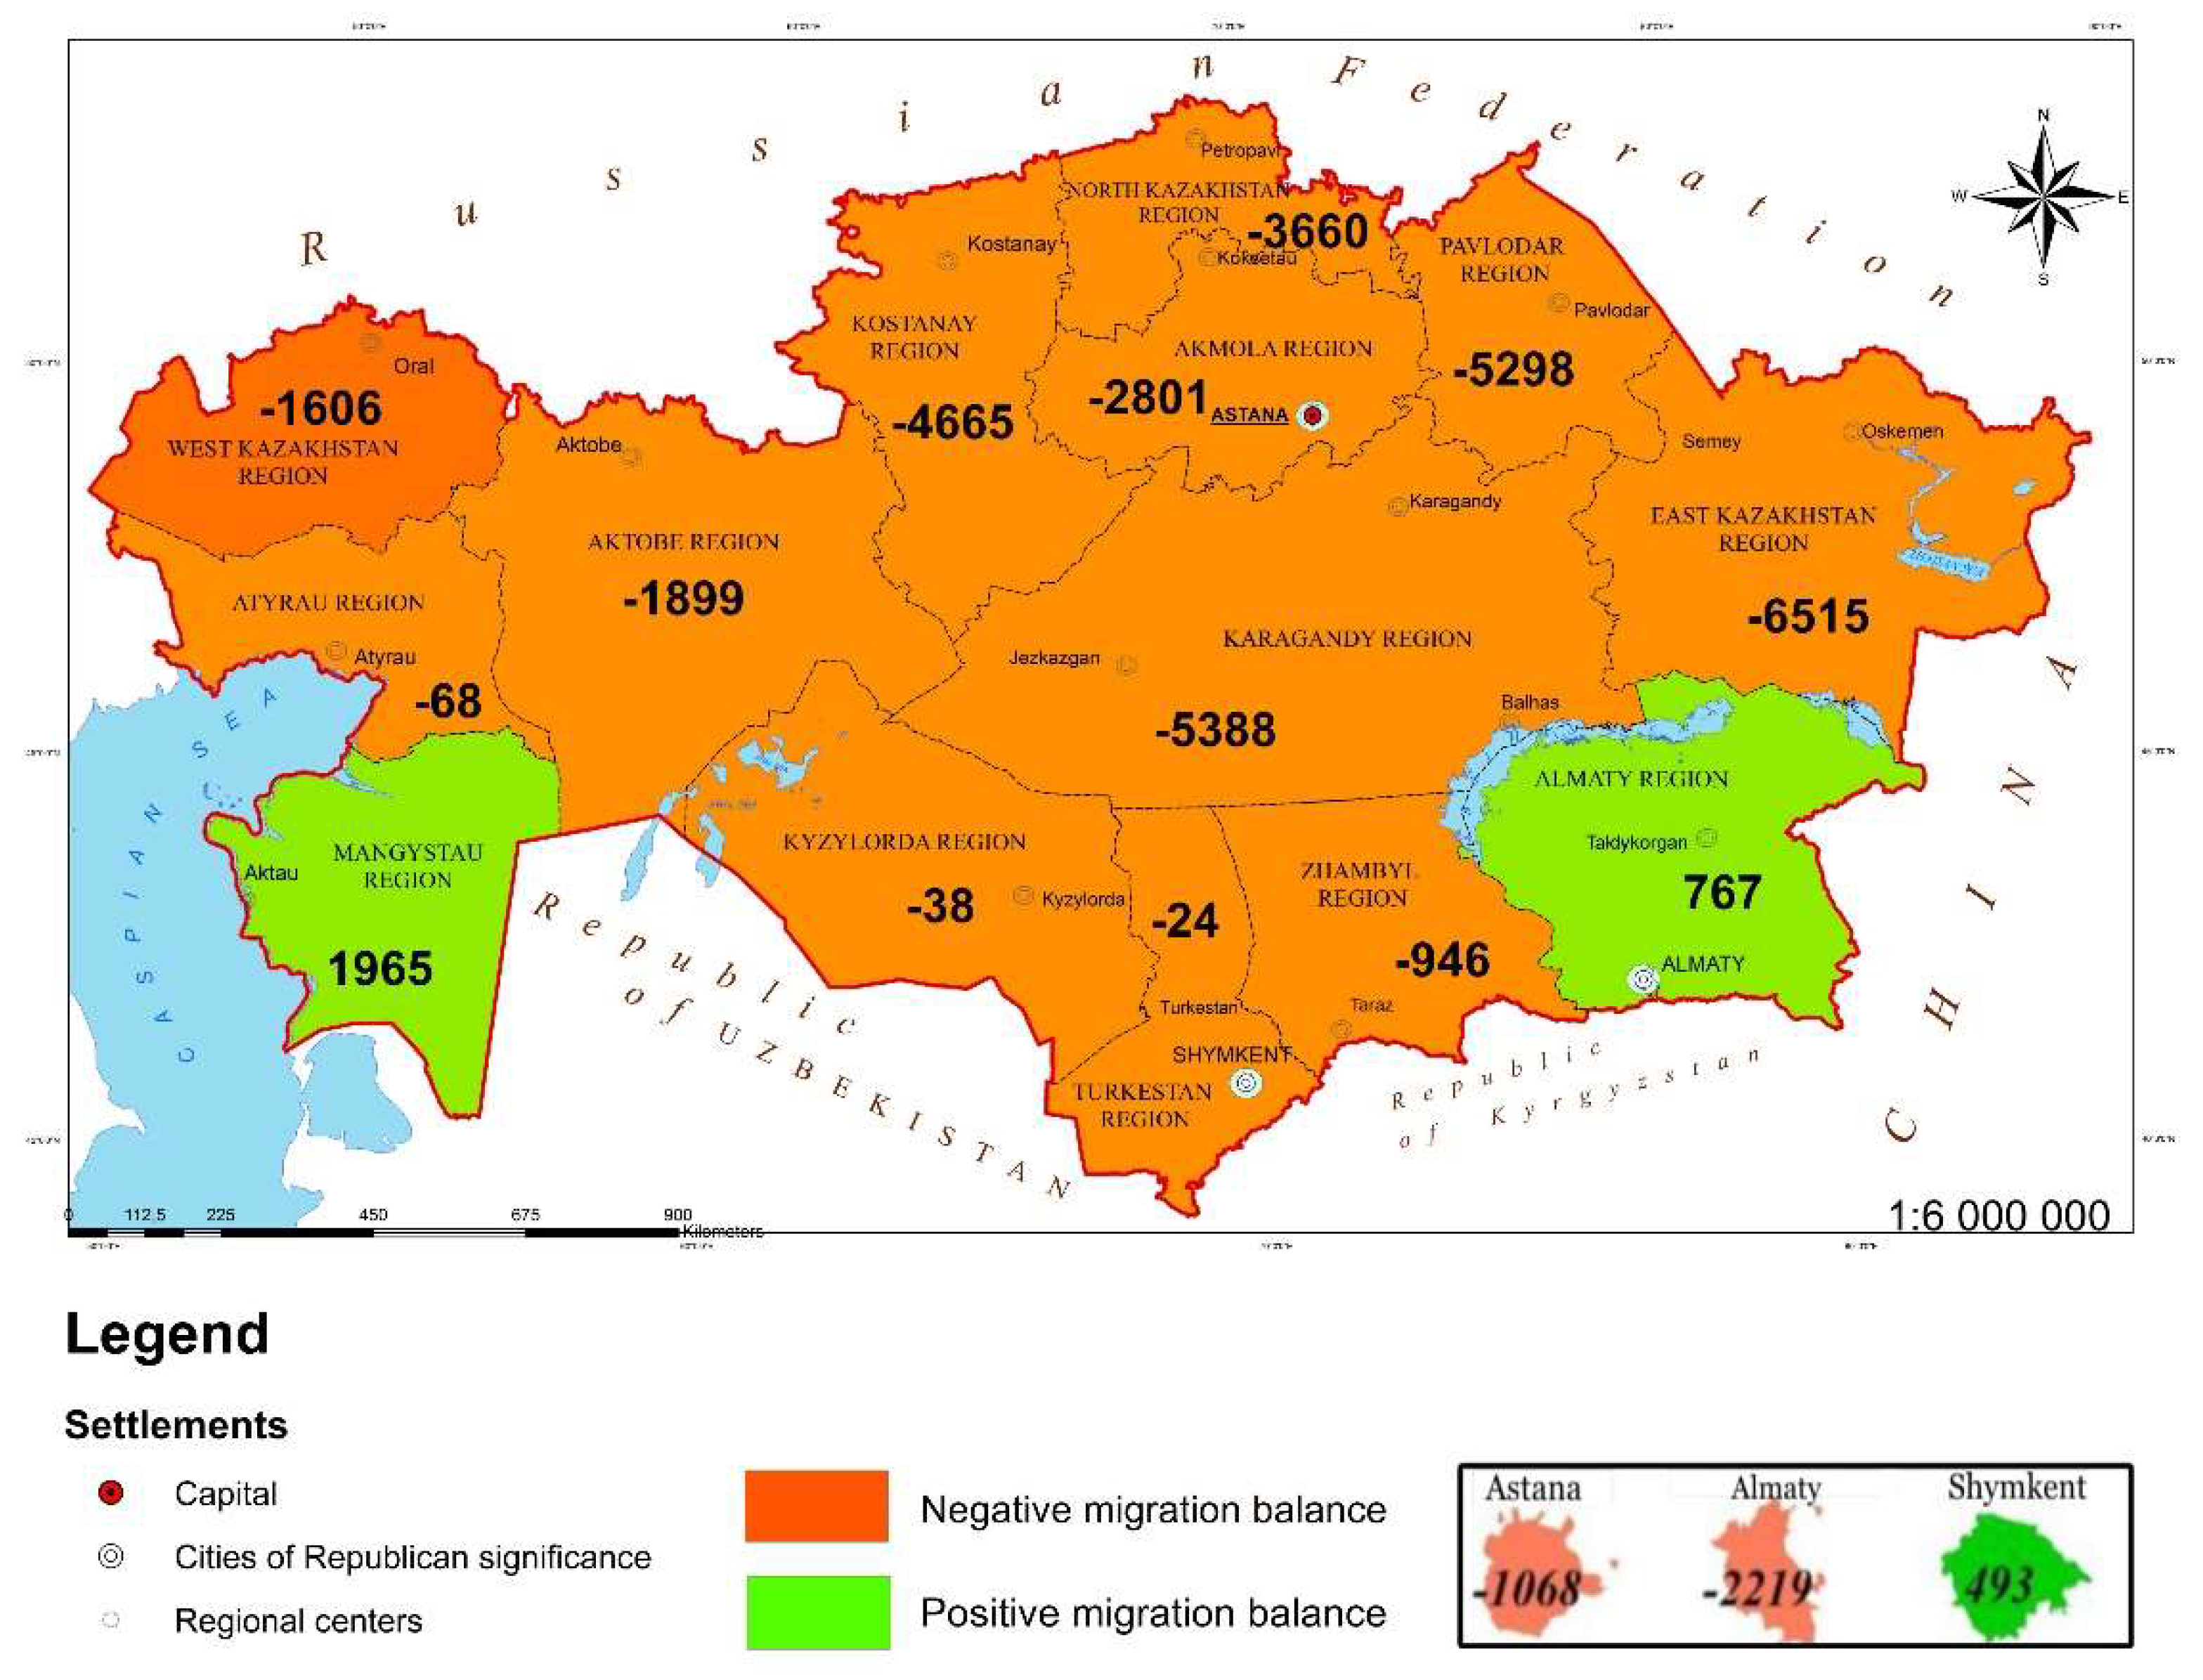
In the 2000s, with economic stabilization, the number of people wishing to permanently leave the country decreased slightly. From 2004 to 2011, the migration balance showed positive dynamics, but since 2012, it has consistently shown negative statistics. The largest population outflow abroad is mainly observed in the eastern, central, and northern regions of Kazakhstan. This is explained by the higher percentage of the European ethnic component in the demographic structure of their populations. For instance, in 2019, 7143 people emigrated from East Kazakhstan region for permanent residence. Slightly fewer emigrants were recorded in Karaganda region, with 5776 people. Kostanay, Pavlodar, and North Kazakhstan regions also ranked high in population outflows, with 5708, 5594, and 4315 people emigrating in 2019, respectively (
Figure 3) [
17].
Even during the restrictive measures introduced in 2020, the highest population outflow beyond the borders of the Republic was observed in the same regions, albeit on a smaller scale. At the same time, an inflow of immigrants from other countries was predominantly observed in the southern and western regions of the country. For example, in 2019, 2532 people moved to the Mangystau region, while 567 people emigrated abroad from the region. Similarly, 2147 people relocated to the Almaty region, with 1,380 leaving the region. A positive migration balance was also recorded in the city of Shymkent (+493 people), with 890 arrivals and 397 departures [
17]. In 2019, a positive migration balance was observed only in these three regions. For the first time in 20 years, a negative migration balance was recorded in the Turkestan region (-24 people). In 2020, Turkestan once again joined the list of regions with a positive external migration balance.
This trend poses a threat to the economic potential of the regions experiencing the highest population outflows, primarily the northern regions. Overall, a decline in population is perceived as a threat to national security, including the supply of new labor resources for the economy.
Thus, based on an analysis of Kazakhstan's demographic situation, regional differences have been identified in population dynamics, structure, natural reproduction processes, and migration movements, as well as risks and threats not only to the demographic sphere but also to socio-economic development.
The study identified two major regions with contrasting demographic risks: the Southwest (Mangystau, Turkestan, Atyrau, Kyzylorda, Almaty, Zhambyl, Aktobe, and West Kazakhstan regions) and the Northeast (North Kazakhstan, Kostanay, Pavlodar, Karaganda, East Kazakhstan, and Akmola regions).
The primary threats to the demographic situation in the Southwest region are linked to expanded population reproduction. This region has the highest natural population growth rates and general fertility rates in the country.
However, such population growth and mass urbanization also create several issues. Firstly, the high level of natural increase and birth rates in the region leads to a proliferation of large families, which require special attention from the state.
Secondly, the age and gender structure of the Southwest region is characterized by a high concentration of youth. This results in unemployment challenges and an underdeveloped social and economic environment for young people.
The demographic situation is further exacerbated by the inflow of the majority of ethnic repatriates to the southern and western regions of Kazakhstan. This leads to the problem of agrarian overpopulation in these areas, causing unregulated urbanization and acute socio-economic inequality.
Consequently, the high birth rates and natural increase typical of the southern and western regions of Kazakhstan present certain demographic risks and challenges associated with social needs:
– Increasing regional imbalance in the age structure;
– Growing child dependency burden on the working-age population;
– Shortages of qualified personnel, including preschool educators, teachers, lecturers, social workers, additional education specialists, pediatricians, medical staff, and other Supplementary personnel;
– Insufficient institutions for preschool, secondary, and vocational education, as well as additional education services, summer recreation facilities, medical, and specialized social institutions;
– Rising rates of illness and disability in younger age groups;
– Reduced accessibility and quality of education;
– Potential future growth in youth unemployment;
– Increased budgetary pressure in the form of subsidies and other social benefits for the care and upbringing of children.
In the northern and eastern regions of Kazakhstan, an opposite demographic trend is observed, where mortality exceeds birth rates, leading to a population decline. Negative net migration also significantly contributes to this process of population reduction.
In addition to the direct loss of population, primarily among the young and reproductive age groups, there are also indirect losses. These are mainly associated with the increasing number of elderly people and the growing proportion of retirees in the total population. As a result, the following risks and potential negative consequences arise:
– Narrowing of the population's reproductive base;
– Formation of a potentially broader mortality base;
– Reduction in the expected average life expectancy;
– Increased demographic burden of the elderly on the working-age population;
– Heightened strain on healthcare systems and social support/social protection systems for older age groups;
– Social neglect of the elderly (the phenomenon of "lonely old age"), disruption of social connections, and reduced quality of life for older age groups;
– Increased budget expenditures on public pension benefits.
An analysis of the development of the social sector in the region shows that social infrastructure is lagging behind population growth, which limits access to medical and educational services. This could negatively affect the socio-demographic sustainability of the region in the long term.
According to the Bureau of National Statistics, in 2020 there were 10871 preschool institutions operating in Kazakhstan [
17]. Data from the Ministry of Education of the Republic of Kazakhstan indicates that the coverage of children aged 3 to 6 years with preschool education in 2020 was 99% [
19].
However, the overall coverage of children aged 0 to 6 years with preschool education in 2020 was 51.8%. In other words, nearly half of the children in this age group do not attend preschool institutions.
Regionally, the highest preschool education coverage was recorded in the Akmola (65.1%) and Turkestan (63.7%) regions. The lowest coverage was observed in the Mangystau (45.3%) and Almaty (45.7%) regions, as well as in the cities of Astana (39.2%) and Almaty (43.5%), all of which are below the national average of 51.8% [
19].
Despite active efforts in this area, there remains a need to establish more preschool institutions in the regions. In 2020, there were 364206 children on waiting lists for preschool admission, representing 12% of the total number of children aged 1 to 6 years and 48% of those lacking preschool education [
19].
Most of the children on waiting lists (79.2%) were in urban areas rather than rural areas. The highest numbers of waitlisted children were in Almaty (80008 children), Astana (24639 children), Karaganda (47538 children), and Mangystau (34239 children) regions, reflecting high population density and active migration processes [
19]. Furthermore, an analysis of birth rates in the country shows a steady increase from 2000 to 2021, which will exacerbate the shortage of preschool places.
One of the key factors for the development of preschool education is financing. As part of the planned projects, 82.6 billion tenge has been allocated for the development of preschool education from 2021 to 2025. Overall, there has been an annual increase in funds allocated to preschool education. In 2020, expenditures on preschool education amounted to 0.51% of GDP, while the OECD and UNICEF recommended level is at least 1–2% of GDP.
UNDP experts note that school education is becoming increasingly significant in global trends. They emphasize that it is during the stage of prolonged education that a person’s character is shaped, the foundations of psychological resilience are established, and potential for future development is created.
As of September 1, 2020, there were 7440 schools in Kazakhstan, which is 913 fewer (11%) than in 2000. The dynamics of the number of schools across the country showed a downward trend until 2018 [
19].
Between 2000 and 2020, the reduction in the network of educational institutions mainly occurred due to the closure or reorganization of rural schools (a decrease of 996 units or 16%). During the same period, the number of urban schools initially decreased from 2051 to 1883 between 2000 and 2010. However, starting in 2010, the network of urban schools grew by 394 units (20.8%), reaching 2178 schools [
19].
Between 2000 and 2020, the number of students in day schools increased by 224823. In 2000, 25% of state day schools were located in urban areas, accommodating 51% of the country’s total students. By 2020, 30% of urban schools were serving 57% of students. Data analysis shows that while the total number of schools decreased by 913 units between 2000 and 2020, the number of students grew by 208488. Thus, the number of students has been increasing annually due to rising birth rates, which places additional strain on urban schools, further exacerbated by urbanization. Nevertheless, almost 100% enrollment in primary and secondary education has been achieved across all regions of Kazakhstan.
Regional differences in the number of students are a result of demographic and migration processes. In 2020, significant increases in student numbers were recorded in Almaty region (+81400), Mangystau region (+77,100), Astana (+139100), Shymkent (+128100), and Almaty city (+105000). Conversely, decreases were observed in East Kazakhstan region (-103400), Kostanay region (-74300), and North Kazakhstan region (-69200) [
20].
Despite the importance of primary and secondary education for human capital in a rapidly changing world, reliable metrics for assessing the quality of this level of education have yet to be developed. Kazakhstan participates in various international programs for assessing student achievement, such as PISA, ICILS, PIRLS, and TIMSS. In addition, Kazakhstan has national systems for assessing education quality, such as the Unified National Testing (UNT). The average UNT score is suitable for regional comparisons since the testing conditions are uniform nationwide. In 2019, the average UNT score for Kazakhstan was 65.5 points. The lowest results were recorded in Atyrau (63.56 points), Mangystau (62.81 points), and Shymkent (61 points). It should be noted that these regions also ranked lowest in Kazakhstan according to the 2018 PISA international study. Combined scores for reading literacy, mathematics, and science totaled 362.3 in Atyrau region, 372.3 in Mangystau region, and 380.7 in Turkestan region (at the time, including Shymkent). In contrast, northern and eastern regions demonstrated higher scores, ranging from 432.0 to 418.3. High average UNT-2019 scores were also observed in East Kazakhstan, North Kazakhstan, Pavlodar regions, and the cities of Astana and Almaty [
19]. Thus, regions with low UNT and PISA scores are characterized by high birth rates, large families, and the fastest demographic growth rates.
Thus, the analysis of preschool and school education in the regions of the Republic of Kazakhstan has revealed several serious issues:
– Overall preschool education coverage for children aged 0 to 6 in 2020 was 51.8%, meaning nearly half of the children in this age group do not attend preschool institutions. This is explained by home-based childcare, and in some cases, parents in low-income families cannot afford additional expenses such as meals and transportation. As a result, many children cannot be enrolled in preschools and are not included in waiting lists.
– Most children on waiting lists are in urban areas (79.2%). The highest numbers of children on waiting lists were recorded in Almaty (80 008 children), Astana (24 639 children), Karaganda (47 538 children), and Mangystau (34 239 children) regions. This is due to high population density and active migration inflows. Furthermore, an analysis of birth rates in the country shows a steady increase from 2000 to 2021, which will exacerbate the shortage of preschool places.
– Between 2000 and 2020, the number of schoolchildren increased, with a significant burden on urban schools driven by urbanization. Nevertheless, almost 100% enrollment in primary and secondary education has been achieved across all regions of Kazakhstan. Regional differences in the number of schoolchildren reflect demographic and migration processes. Each year, the number of schoolchildren increases due to rising birth rates, leading to greater demand for schools and teachers, particularly in high-birth-rate regions.
– Regional disparities in the quality of secondary education are observed, as indicated by UNT and PISA results.
The analysis demonstrates that many social issues, such as a shortage of places in preschools, low preschool coverage, a lack of school places, and a shortage of teaching staff, are driven by demographic processes. Therefore, it is essential to include a demographic aspect in the regional development planning of the Republic of Kazakhstan to identify relevant and pressing social needs in each region and address them effectively.
Kazakhstan has already implemented a set of systemic measures to develop education and science. Many significant initiatives have been declared and are being carried out by the state, with regional institutions playing a key role as primary implementers. The responsibility and competence of these regional institutions are crucial in shaping and executing development strategies for their regions. A more accurate forecast of future social infrastructure demands, based on modern analytical tools, will enable regional institutions to prepare for these challenges in a timely manner.
As part of the study, an analysis of potential and existing information systems for the collection, processing, interpretation, and visualization of large datasets was conducted, in addition to geographic information systems. Business Intelligence (BI) systems were identified as the most optimal tools for this purpose. Traditionally, BI systems facilitate the collection and integration of diverse data related to business development, their processing, and conversion into a unified format suitable for further use (Extract Transform and Load, or ETL). This study explored the integration of BI systems for analyzing and visualizing socio-demographic processes within the framework of geographic science.
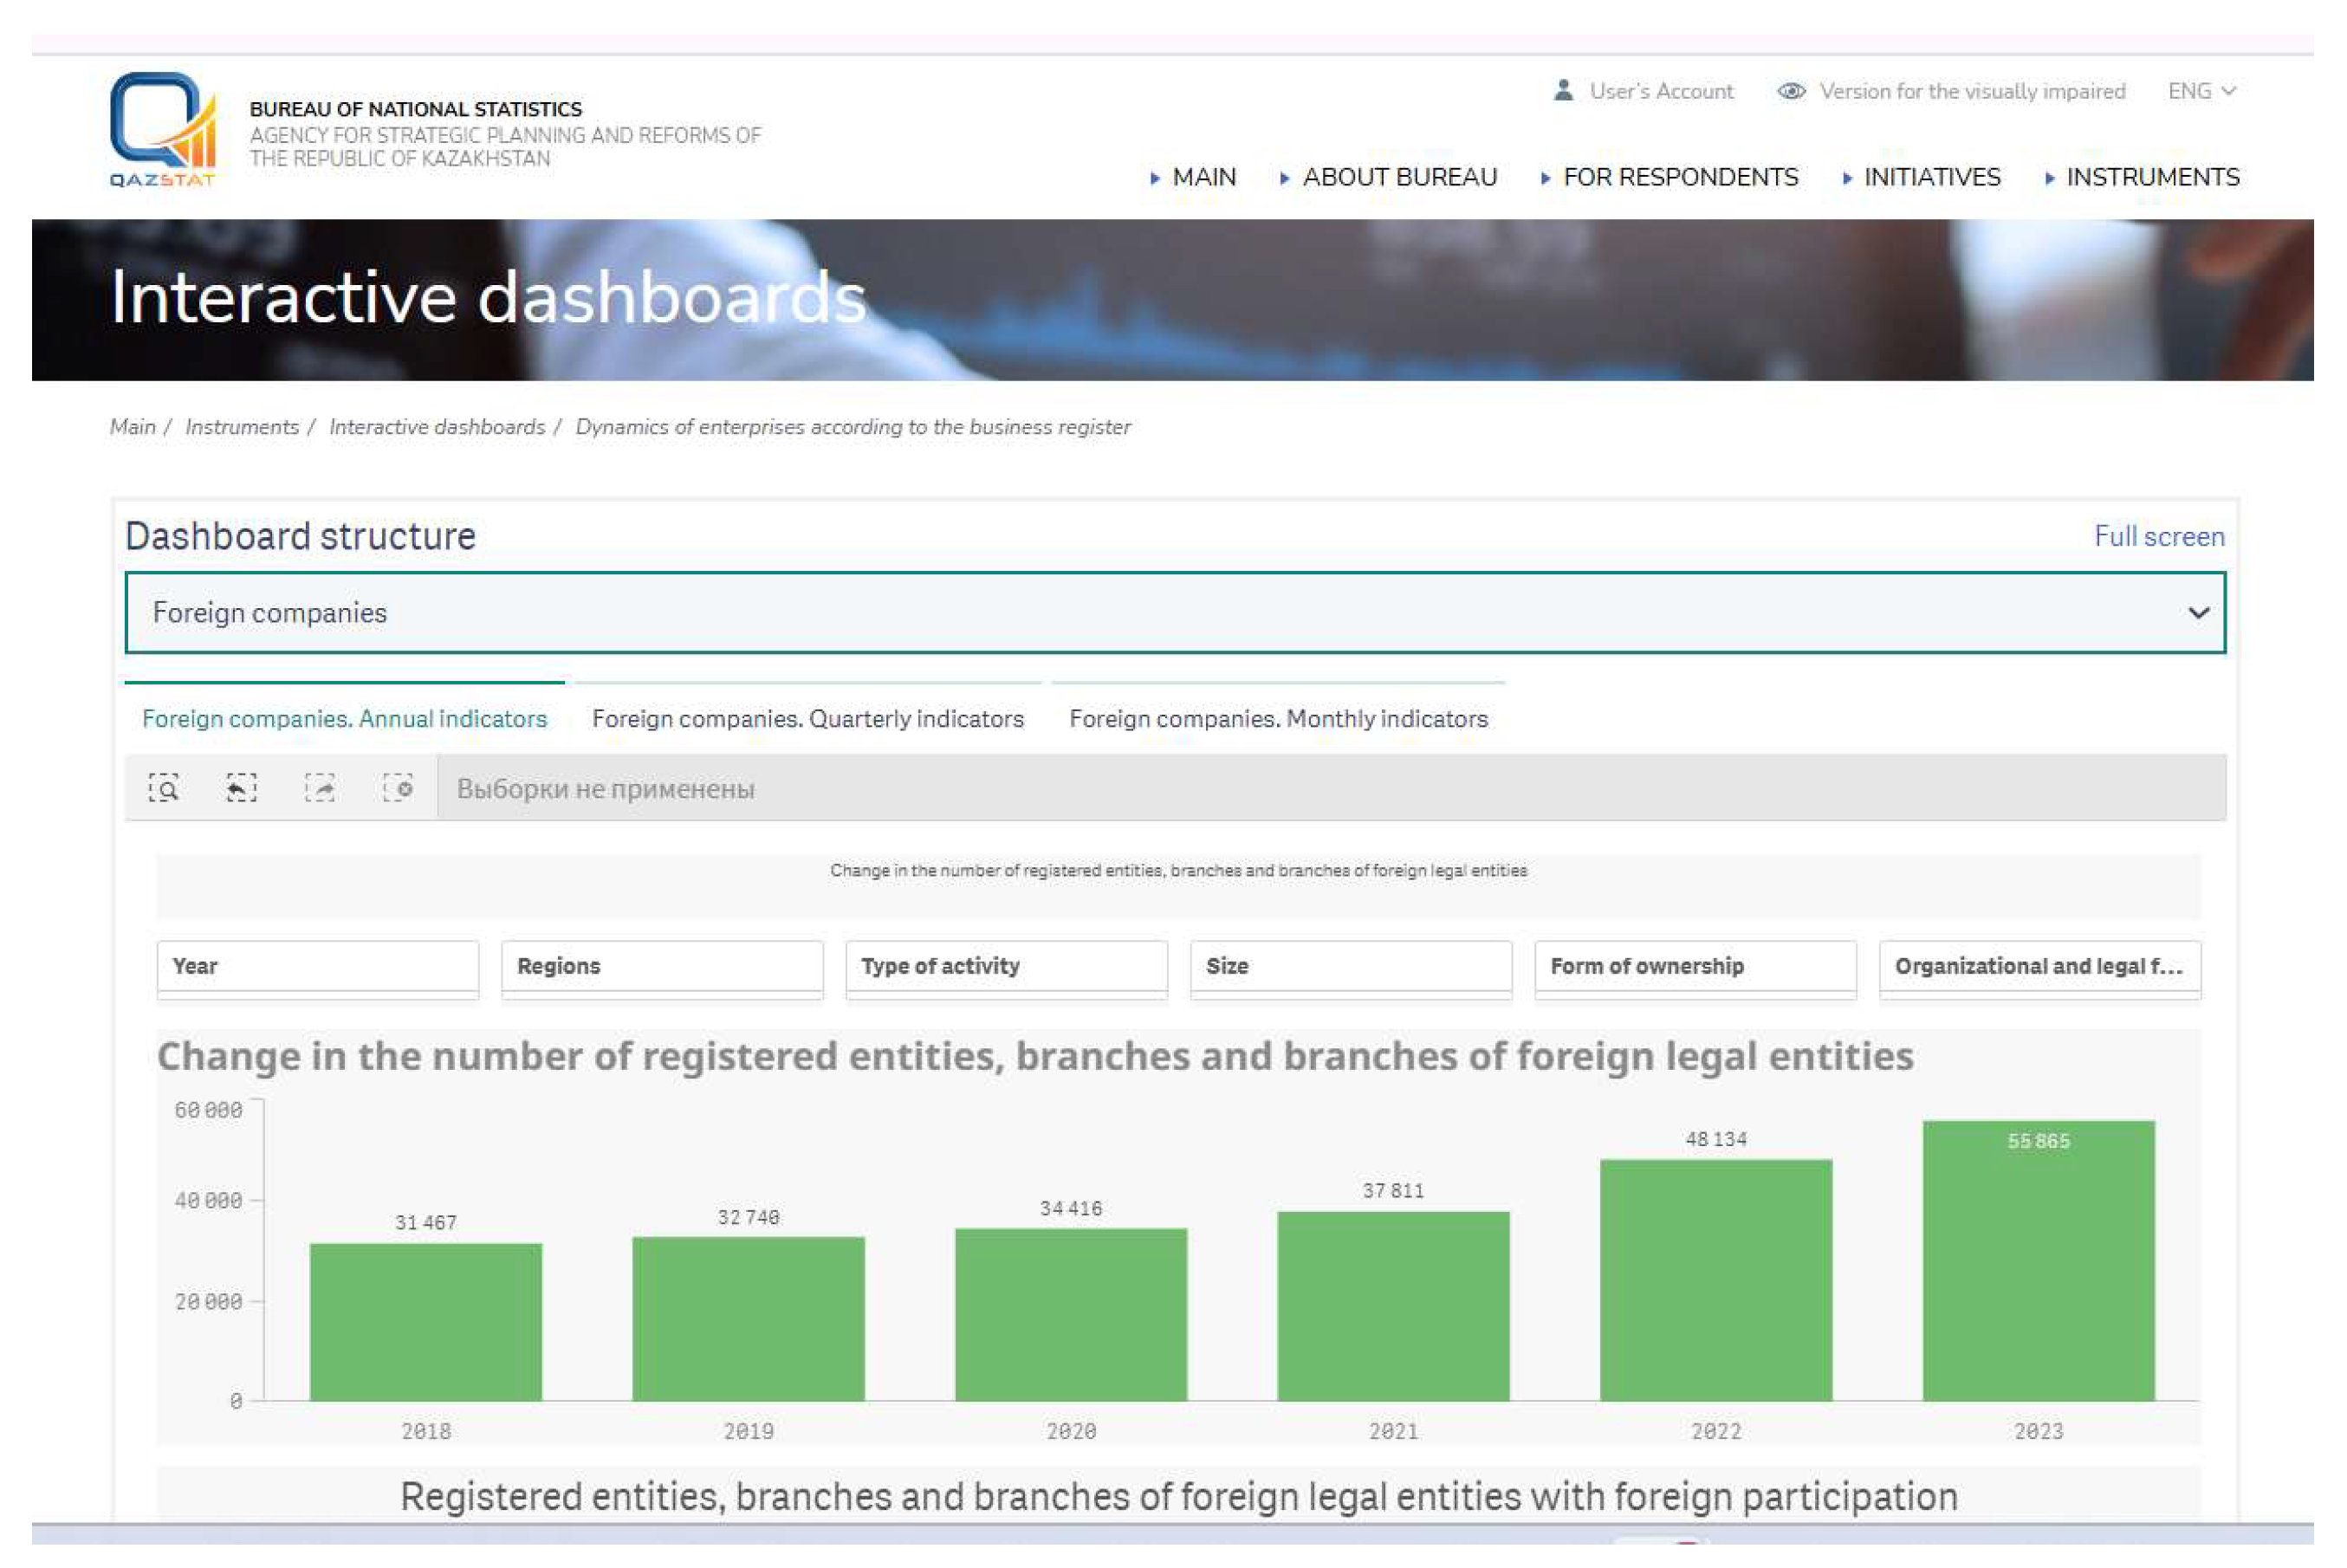
In Kazakhstan, the Bureau of National Statistics under the Agency for Strategic Planning and Reforms has already started using the Microsoft Power BI tool to visualize statistical data (
Figure 4).
The analysis of socio-demographic indicators in the regions of the Republic of Kazakhstan revealed an existing demographic dividend. However, in regions with high birth rates, challenges with the burden on social infrastructure were identified.
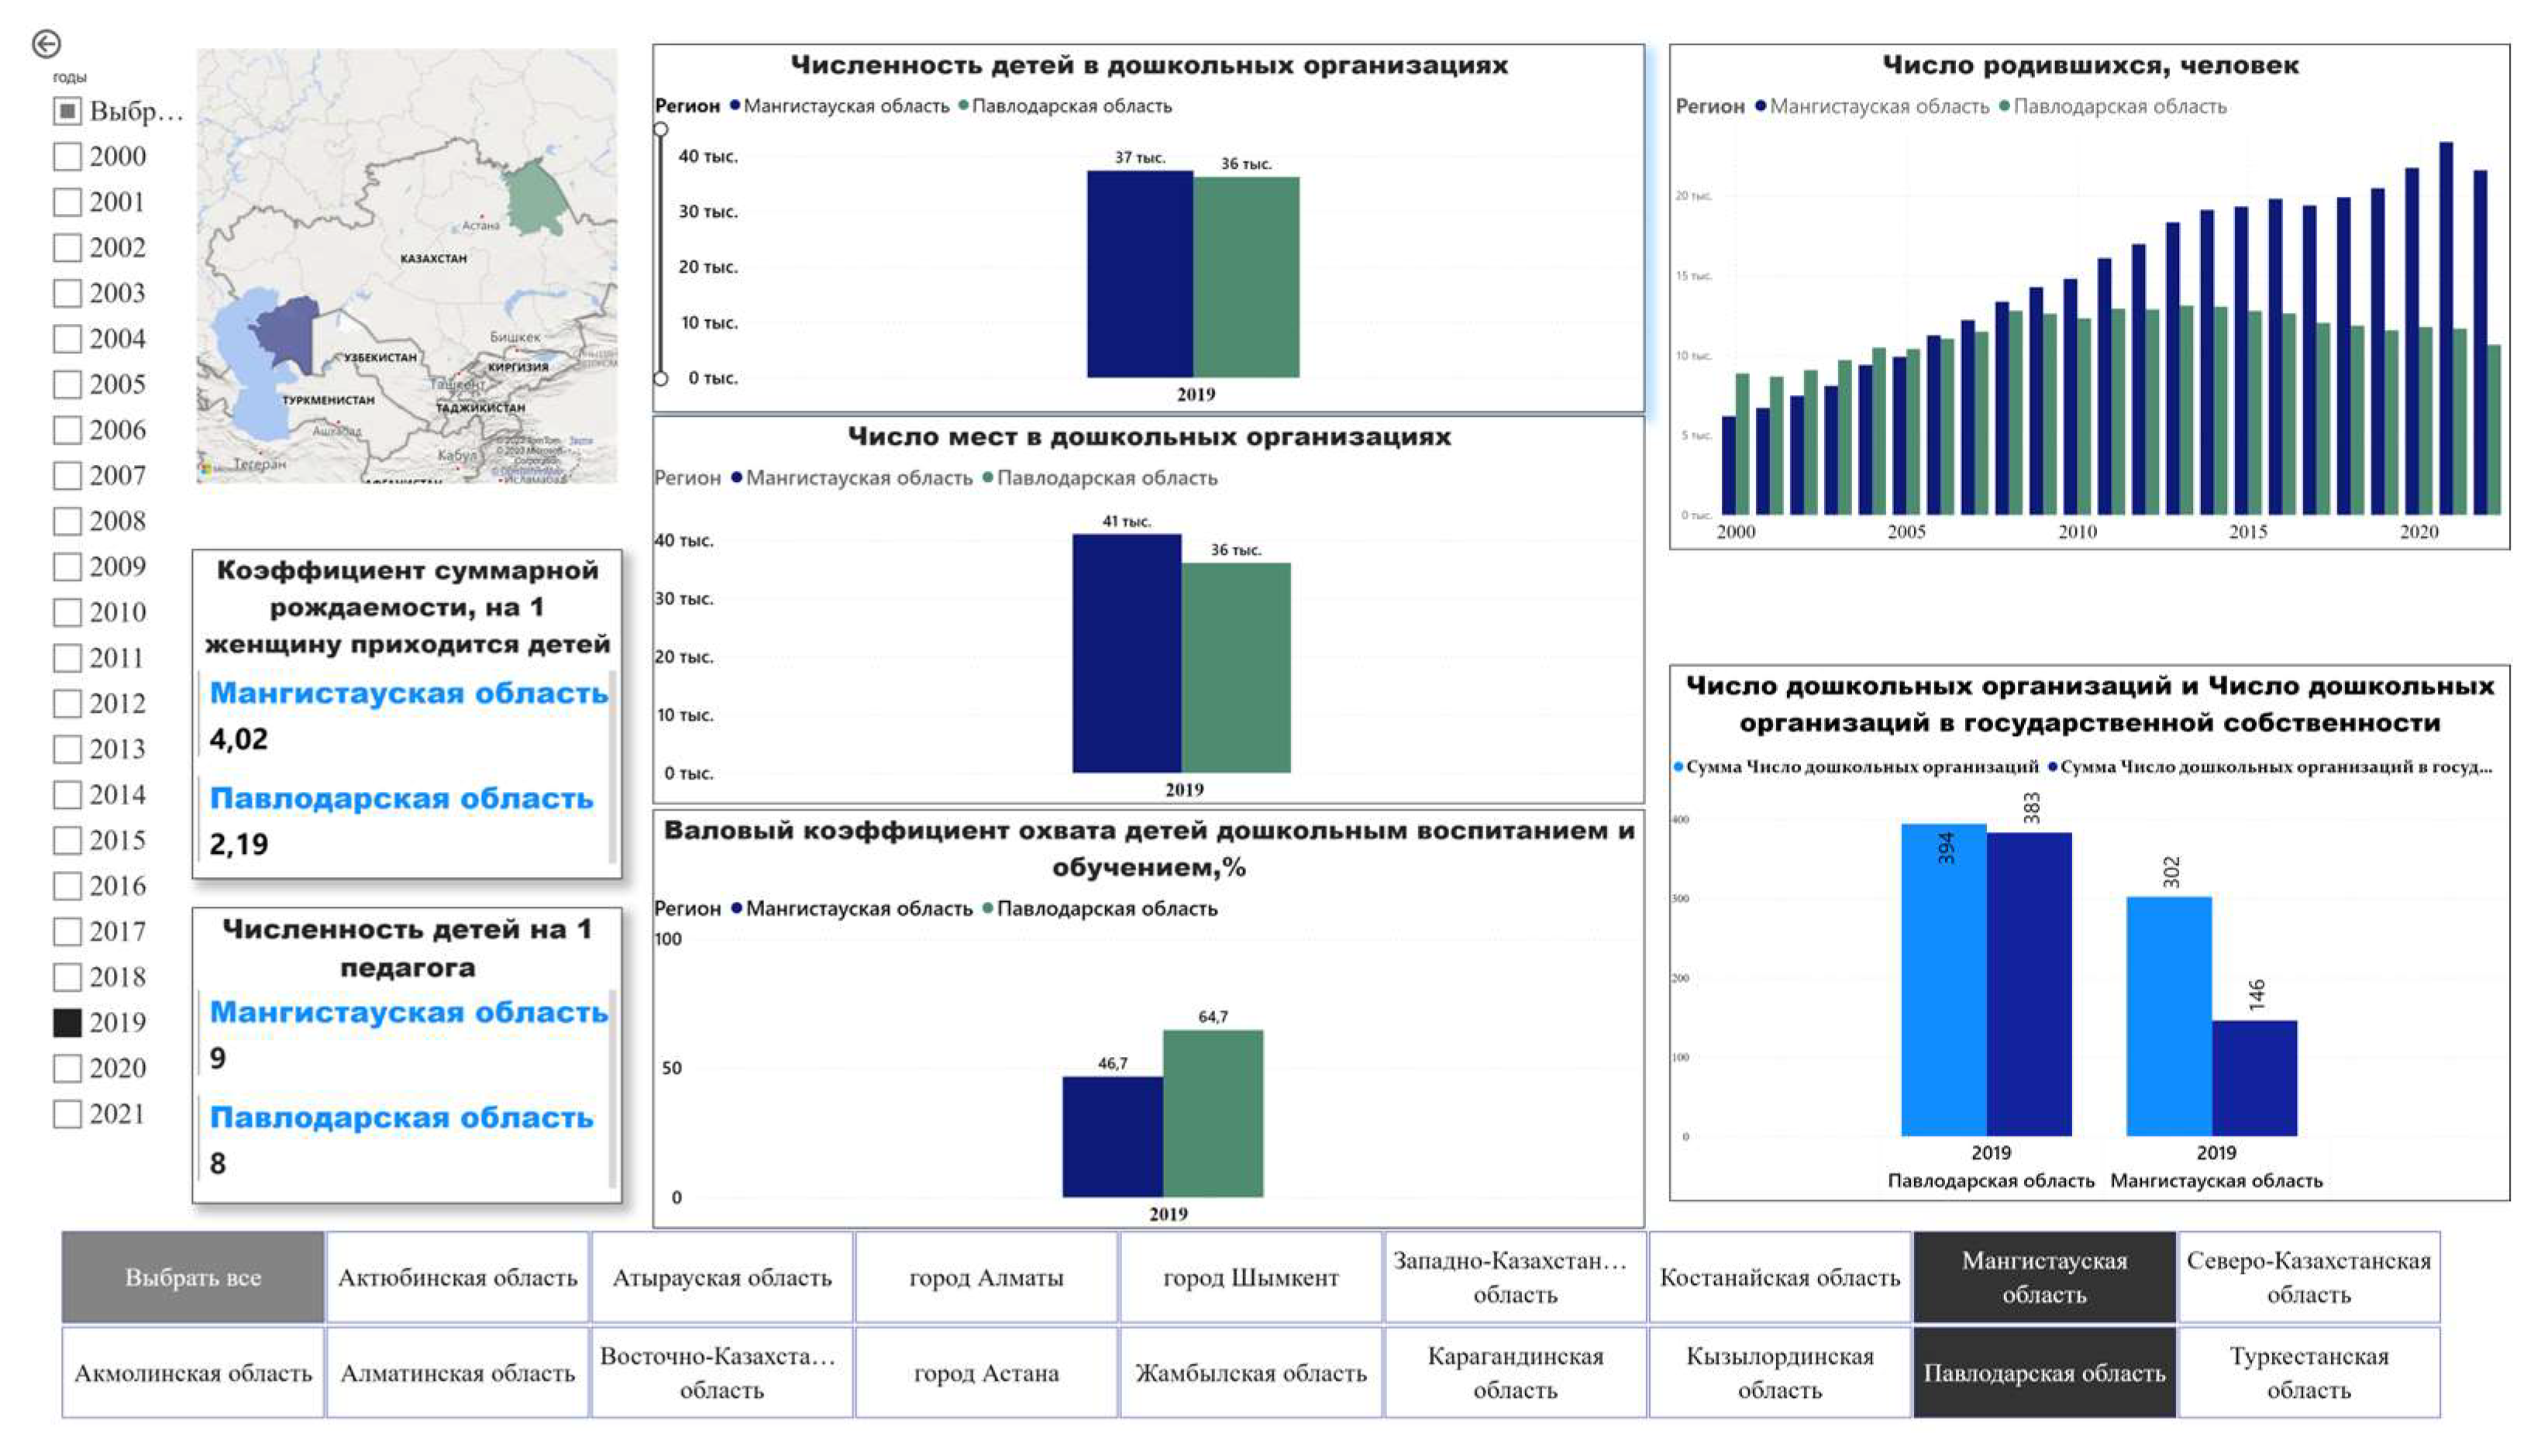
Using Microsoft Power BI, a visual representation of statistical data on birth rates and preschool education for 2019 was created for the Mangystau region and, for comparison, the Pavlodar region, which has contrasting demographic characteristics (
Figure 5). The Pavlodar region is characterized by a declining birth rate trend since 2013 and a total fertility rate of 2.19, whereas the Mangystau region demonstrates dynamically growing birth rates, with a total fertility rate nearly twice as high at 4.02 [
20].
Unfortunately, for preschool education indicators, we see the opposite trend: the Pavlodar region has 394 preschool institutions, 383 of which are state-owned, while the Mangystau region has 23% fewer (302 preschool institutions), with only half of them being state-owned.
As a result, the gross preschool education coverage in the Mangystau region is lower than in the Pavlodar region, at 46.7% compared to 64.7%. The insufficiency of preschool institutions in the Mangystau region, which increasingly lags behind the pace of rising birth rates, and the low gross preschool education coverage in the region negatively impact the quality of its human capital.
Figure 5.
Visualization of Birth Rates and Key Preschool Education Indicators for 2019 Using Microsoft Power BI: A Comparison of Mangystau and Pavlodar Regions.
Figure 5.
Visualization of Birth Rates and Key Preschool Education Indicators for 2019 Using Microsoft Power BI: A Comparison of Mangystau and Pavlodar Regions.
Thus, for the sustainable development of regions, it is necessary to incorporate their demographic component using the tool proposed in this article for calculating the load on social infrastructure. One of the suggested approaches is to forecast the expected burden on social infrastructure based on birth rate indicators.
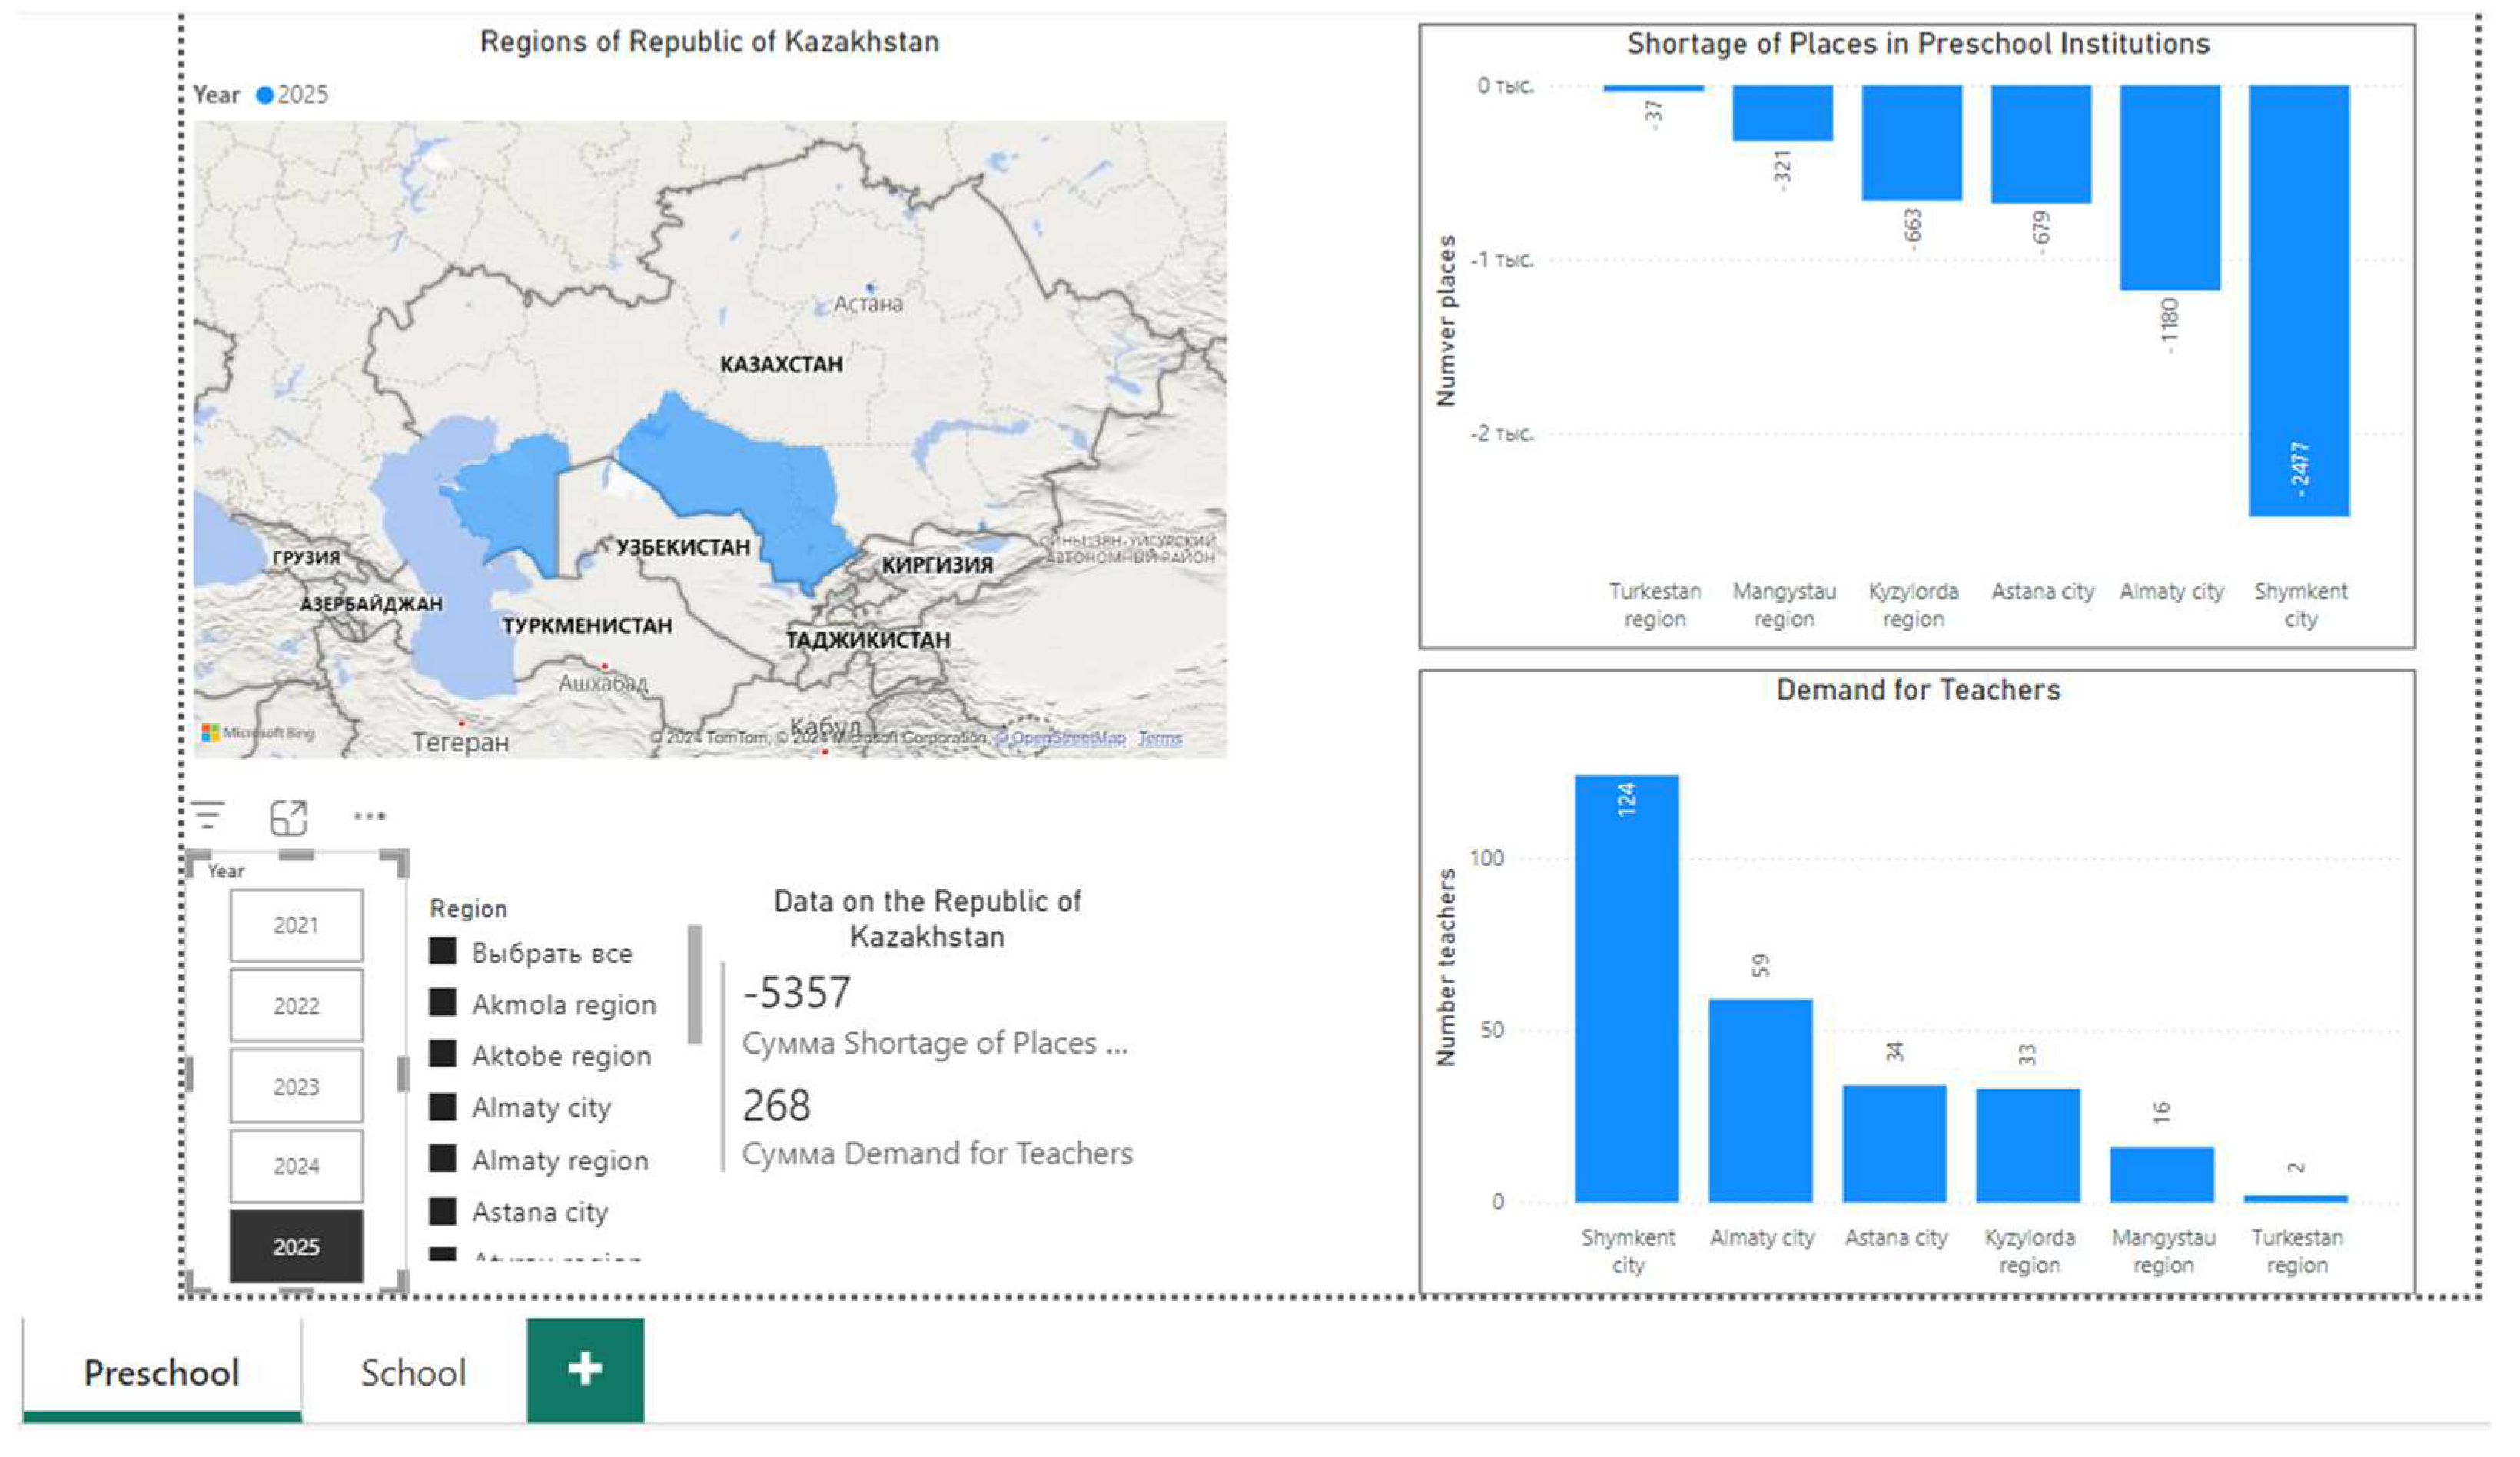
As part of this study, a medium-term forecast of the potential load on preschool institutions and primary schools (Grade 1) was conducted, along with calculations of teacher demand across the regions of the Republic of Kazakhstan (Appendix A). These findings were visualized using Microsoft Power BI software.
Using the proposed tool, it is possible to forecast the expected number of children in preschool institutions with 100% preschool education coverage, identify shortages of places in advance, and prepare personnel. According to the tool for calculating the load on social infrastructure, by 2025, the Ministry of Education of the Republic of Kazakhstan needed to prepare an additional 5 357 places in preschool institutions and 268 teachers nationwide (
Figure 6).
For example, using this tool, it is possible to forecast the volume of subsidies required for preschool institutions by region, which would allow for a rapid reduction in the shortage of places in kindergartens at a significantly lower cost to the budget than building new public preschools. Additionally, such a measure would provide valuable support for private businesses.
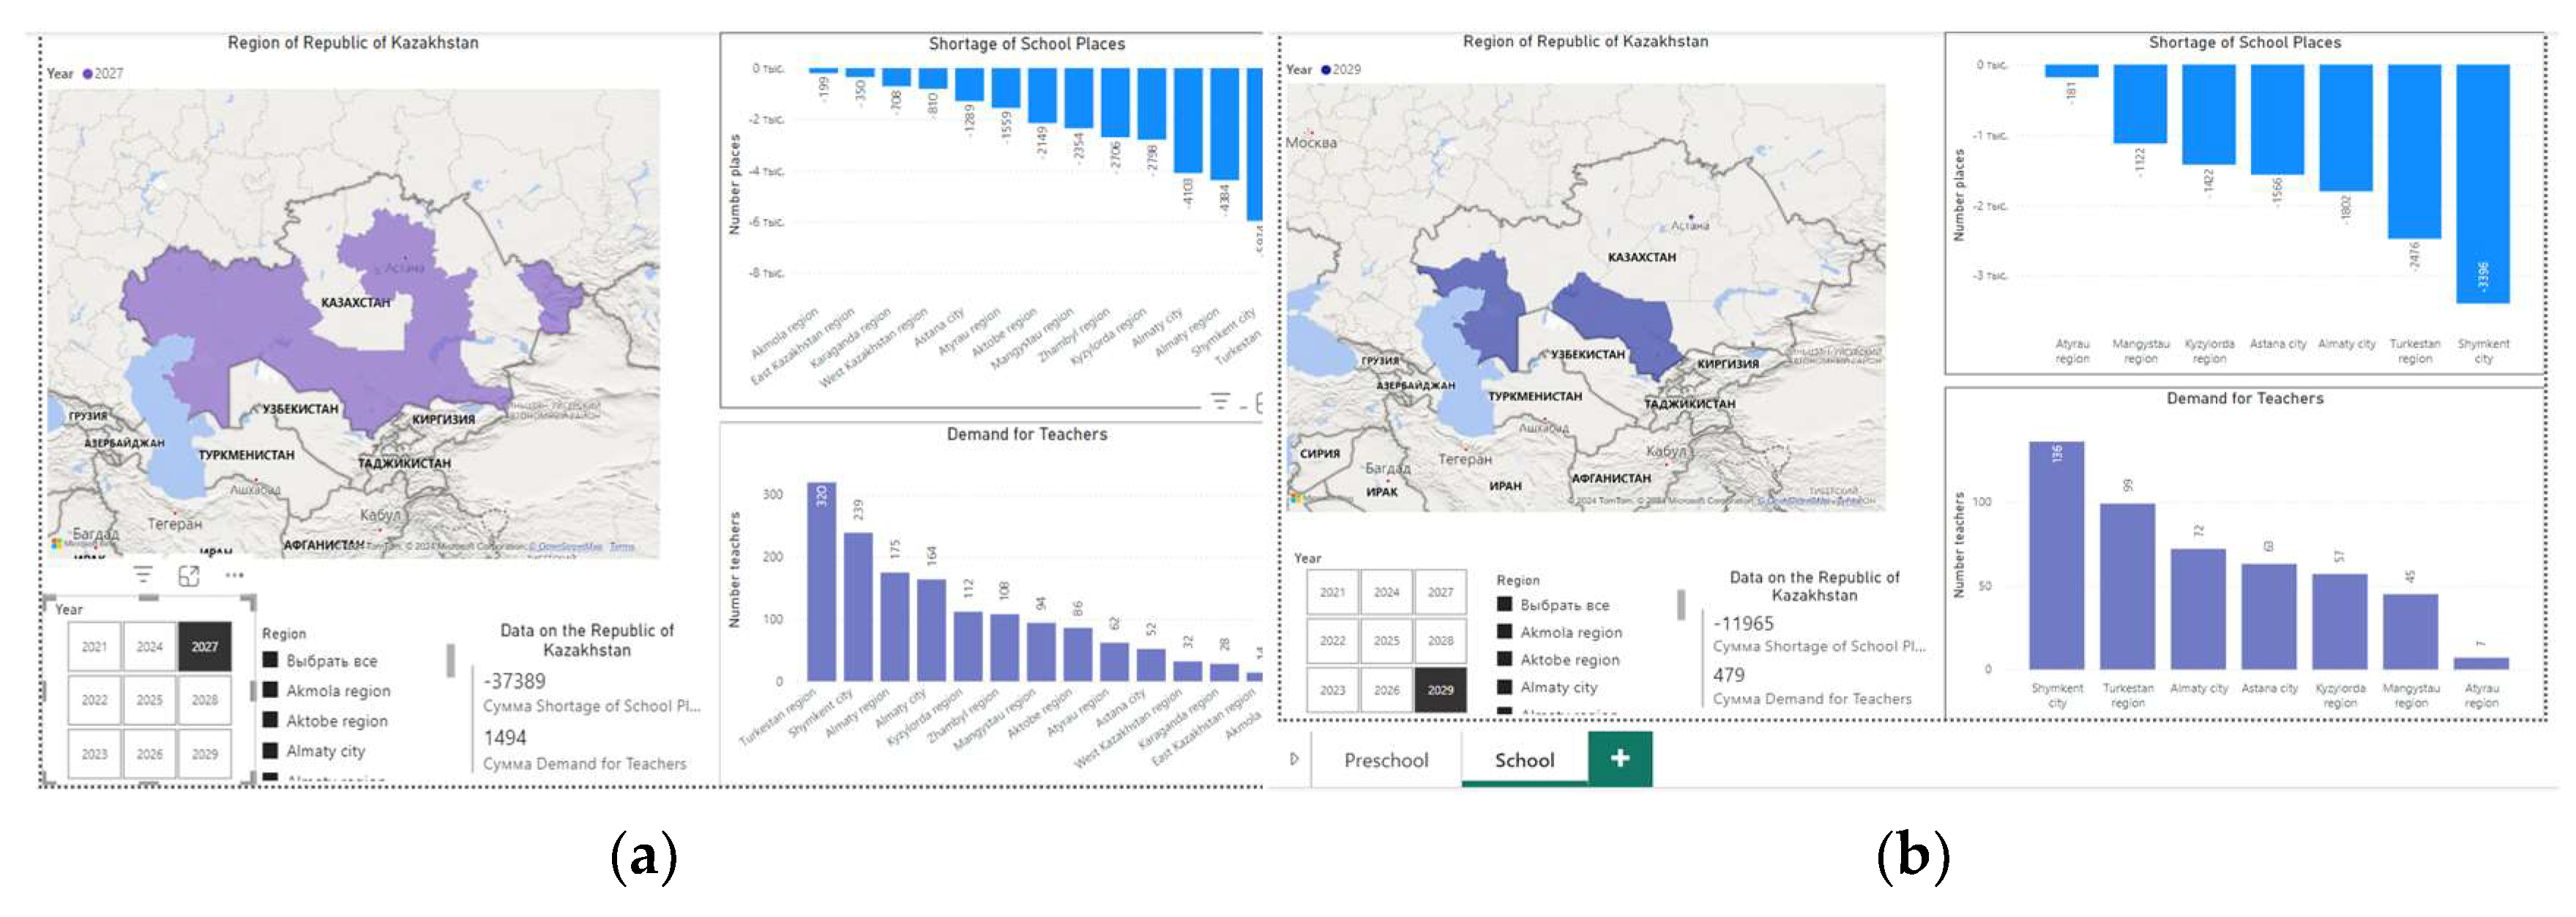
Similarly, it is possible to forecast a region’s future demand for schools and teachers in advance. This, in turn, would enable the government of the Republic of Kazakhstan, represented by the Ministry of Education and Science, to preemptively account for the required number of teachers when allocating grants. By 2025, the Ministry needs to allocate at least 479 grants for the specialty "Primary School Teacher" to ensure their preparation by 2029. According to the tool, by 2029, additional places for 11 965 first-grade students must be organized, and 479 teachers must be prepared for them. The largest shortages of places are expected in Shymkent (3396 students) and Turkestan Region (2476 students) (
Figure 7).
Based on the study and identification of the dynamics, structure, trends, and patterns in the development of demographic indicators, a tool for assessing and forecasting the load on the social infrastructure of the regions of the Republic of Kazakhstan has been proposed. The purpose of this tool is to provide a more accurate forecast of the upcoming load on preschool and primary education infrastructure, enabling government bodies to prepare for this demand in a timely manner.
We believe that this tool, based on demographic indicators, will also allow forecasting other future regional demands, such as the allocation of subsidies to private preschool organizations, the need for medical institutions and personnel, potential youth unemployment, i.e., the need for new jobs, and more.