
Submitted:
02 December 2024
Posted:
03 December 2024
You are already at the latest version
Abstract
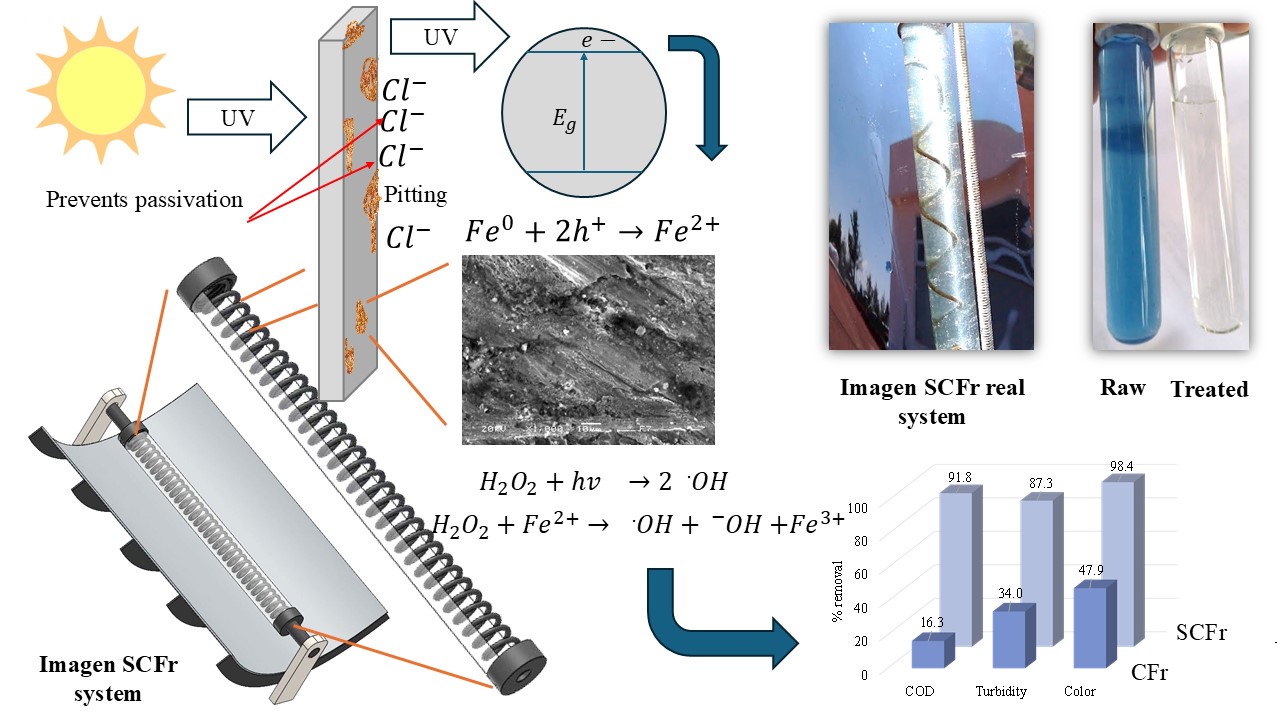
A solar corrosion Fenton reactor (SCFr) was developed by packing an iron-carbon steel filament inside the reactor to enable the in-situ release of Fe2+. A Box-Behnken experimental design was used to optimize the effect of HRT (20, 30, and 40 min), the mass ratios of the packed filament inside the reactor with respect to volume (0.1, 0.2, 0.3 w/v) and the peroxide dosage added (500, 1000, and 1500 mg/L), the response variables were % removal of COD, Color and Turbidity. The optimum conditions for SCFr were HRT of 24.5 min, a ratio of 0.16, and a peroxide dose of 1006.9 mg/L. The removal was 91.8%, 98.4%, and 87.3% COD, Color and Turbidity respectively. Without solar radiation, the % removal was reduced, 16.3%, 47.9%, and 34.0% COD, color and turbidity respectively. The concentration Fe2+ released was 25.4 mg/L of Fe2+. The w/v ratio was the most significant factor, the release of the Fe is stimulated by UV radiation and the chloride concentration of the wastewater which prevents the formation of an oxide layer, thus allowing its continuous release, it takes advantage of solar radiation, pH and chloride concentration of the raw sample.
Keywords:
Advanced oxidation processes (AOPs)
; Fenton
; Blue indigo
; Solar energy
; UV corrosion
1. Introduction
The denim industry represents a very important economic sector [1], the value of world textile exports has been between $284-443 billion USD [2] because this industry is crucial to economic growth [3]. However, this generates a high water consumption [4], used in various stages such as fabric production and garment washing [5,6].
The water footprint of the textile industry has been estimated at 11,000 L per pair of jeans [7]. The impact of wastewater is characterized by its high levels of COD 107-4400 mg/L [8,9], color of 1147-3547 Pt-Co [7], pH 5.2 at 12.3 [10,11], and the presence of metals such as Cr, Cd, Pb, Hg and Cu is possible [2,12]. The characteristic color of the wastewater is due to the presence of the dye indigo blue (BI) [13,14], the persistence of the dye is related to its low biodegradability [15].
Prolonged exposure to toxic elements such as As, Cd, Hg, and Pb derived from the textile industry, even at trace concentrations, can generate adverse effects on human health [2]. It is known that the azo dyes used in the industry are derivatives of aromatic amines (AA), which may have carcinogenic and genotoxic properties [2]. Textile wastewater reaching an untreated water body may prevent the photosynthesis of aquatic plants due to light obstruction, impede oxygenation, clog soil pores, minimize soil fertility, and restrict root penetration. [3]. This untreated wastewater represents contamination of natural water bodies. Increased demand, costs, water quality standards, and scarcity of clean water sources [16,17] make it necessary to develop technologies that offer sustainable solutions and allow for their safety.
Biological treatments have demonstrated dye removal efficiencies of 87.3% in a time of 15 h. These systems can be very efficient, economical, and practical to operate, but their application requires large space availability and process feed even without the continuous operation of denim washing factories [18]. Physicochemical treatments are a more practical alternative when manufacturers have different operating times, however, these processes generate residues such as sludge and saturated adsorbents that must be treated afterward [19,20,21,22].
Advanced oxidation processes (AOP) can generate a large number of radicals such as hydroxyl radicals to achieve mineralization of a persistent organic pollutant such as dyes [23]. Fenton-type reactions have demonstrated high efficiency in color removal, especially in processes where UVA radiation is applied through a lamp or applying natural sunlight, because it stimulates the recovery of the catalyst and the high consumption of hydrogen peroxide, avoiding waste, optimizing its consumption and reducing costs [24,25]. These reactions are catalyzed by ferrous ions that are added in the form of salts, which may involve the addition of sulfate or chloride ions to the treated water [26,27]. To avoid this, the in-situ addition of the catalyst should be promoted without the addition of these ions.
Ferrous ions have been released in situ in the Galvano-Fenton and electro-Fenton processes, however, the use of Cu in the galvanic cell and the energy consumption could be a disadvantage in a large-scale application [28,29,30]. Solar corrosion of metallic Fe has been extensively studied to prevent corrosion of structures [31]. It has been shown that corrosion can be favored by acidic media conditions, the presence of oxygen, temperature, and the presence of chlorides[32,33,34], so these conditions could be applied in the in-situ release of iron in wastewater to act as a catalyst in the Fenton reaction.
Therefore, the objective of this study was to design, evaluate, and optimize a Solar Corrosion Fenton reactor (SCFr) process that allows the solar corrosion of an iron filament for the removal of color, COD, and y turbidity from a denim washing textile wastewater by determining the effect of temperature, presence of UVA light and chlorides on the in situ release of Fe2+ and the efficiency of the treatment. The operating conditions were optimized, considering the hydraulic retention time (HRT), peroxide dosage, and the Fe filament weight/reactor volume ratio (w/v) applying a Box-Behnken experimental design. The SCFr does not require electrical energy for Fe release like its analogous Electro-Fenton, it takes advantage of solar radiation, pH and chloride concentration of the raw sample. The system allows compliance with different regulations about the maximum COD and color limits for textile wastewater, hence treated wastewater could be recirculated in the same textile process.
2. Results and Discussion
2.1. Characterization of Raw
The physicochemical characteristics of raw textile wastewater are shown in Table 1. The pH of the raw water was 3.4, which may be caused by the use of acids in the denim washing process to favor the removal of excess color, the pH of the water is adjusted to improve the oxidation potential of oxidative bleaching agents applied in the denim bleaching process [5,35] which causes the acidic medium in the textile wastewater. If wastewater is not treated, this very low pH value can modify the physicochemistry of water in lagoons and rivers, causing fish kills [36] and stimulating the corrosion [5] altering the equilibrium of the carbonate system in water bodies (initial alkalinity 77.2 mg/L as CaCO3 and acidity 1200.0 mg/L as CaCO3, Table 1) [37].
COD is the amount of oxygen required to oxidize the organic materials contained in a water sample with a strong chemical oxidizing agent, [38]. An elevated COD value (1020 mg/L) is characteristic of textile wastewater and may be due to the presence of dye and starches that come from the raw fabric, the starch is placed to prevent loss of color, firmness, and durability to the fabric before processing [9]. The color of 1808.3 Pt-Co indicates the presence of indigo blue dye, which is characteristic of this type of wastewater [39]. The presence of such high levels of color could limit the passage of sunlight to the deeper layers in a body of water, preventing photosynthesis of underwater plants and favoring the death of fish due to the decrease of dissolved oxygen, thus dyes represent an environmental risk because they represent toxicity [40].
Turbidity was 237 NTU, TS of 3540.0 ppm, and SS of 412.0 ppm, these high levels can have several direct and indirect environmental effects, including reducing sunlight penetration into water bodies, limiting photosynthesis, and impeding aeration. Physical damage to fish and toxic effects from other contaminants attached to these solids that may be deposited to the bottom of the water body represent a long-term risk due to their accumulation [41]. The levels of nitrogenous matter such as nitrate (4 mg/L) and ammoniacal nitrogen (0.7 mg/L) can favor eutrophication phenomena by increasing the growth of algae that limit the passage of sunlight, causing high fish mortality [42]. Ammonia can be oxidized to nitrate, increasing oxygen demand and reducing its availability to living organisms [41]. The accumulation of nitrogenous matter could cause the formation of amines that generate by-products that are classified as carcinogenic [2].
The presence of TDS (1.483 g/L), chlorides (345 mg/L), and EC (2.9 µS/cm) may be related to the use of different salts in the textile process, including common salt and Glauber’s salt that increase the total dissolved solids and EC in the wastewater. The presence of TDS in wastewater can modify the osmotic balance, causing swelling or dehydration in aquatic organisms [40]. The hardness in the raw water was 200 mg/L, which according to the United States Geological Survey (USGS) [43] is very hard water, the hardness of the water reflects the presence of the elements calcium and magnesium and does not represent a risk to health and the environment, however, in some washing processes it causes the high use of reagents due to the inability of the water to generate foam [44], however, this would imply a high consumption of reagents and a greater impact on the quality of the wastewater produced. Textile wastewater is characterized by high levels of color, COD, inorganic salts, total dissolved solids, and salinity [45]. The complex nature of textile wastewater makes it difficult to analyze and treat. However, knowing the composition of the effluent is important for selecting an appropriate treatment [38].
3.2. SCFr Process Optimization
3.2.1. COD Removal
The effect of the independent variables on COD removal is shown in Figure 1. The estimated maximum COD removal efficiency was 96.8% according to the model obtained (Supplementary Material 1), at an HRT of 24.5 min, a ratio of 0.16 and a peroxide dosage of 1006.9 mg/L. The coefficient of determination of the model was 0.8656 (R2) and its adjusted value for degrees of freedom was 0.6263 (), which indicates that the model is adequate to predict the % COD removal of the SCFr treatment due to the influence of the factors on COD removal, additionally, the lack of fit tests was not significant (P= 0.2480). The experimental % removal optimum conditions was 91.8% (Table 2, observed value). ANOVA showed that the ratio at 0.16 (g of catalyst: reactor volume) had a statistically significant effect on COD removal (P= 0.0243) which may indicate that the presence of the Fe filament stimulates the Fenton reaction.
The carbon steel filament can release ferrous ions (Fe2+ and Fe3+) which in the presence of solar UV light favors the Fenton reaction as described in Equations (1) and (2) through the generation of radicals [46,47,48]:
Figure 1a shows the interaction between the factor ratio and peroxide dose, as the ratio increases efficiency. It has been shown that exposure to acidic media such as raw wastewater (Table 1) and UV radiation increases pitting corrosion by releasing metal ions into the medium and that the amount of Fe released is dependent on the exposure time [32]. Qian et al., (2020), demonstrated that the corrosion rate on a stainless-steel plate increases in the presence of UV light at different illumination conditions.
Figure 1b, shows the interaction of the ratio and HRT, as the treatment time and the ratio increase, the efficiency decreases, and a higher amount of packed filament inside the reactor could release a higher concentration of Fe, so at prolonged times the excess of Fe released could generate an inorganic interference in the efficiency by increasing the COD [50]. A dose of 200 mg/L Fe2+ was used in the treatment of textile wastewater with an efficiency of 93.2% COD removal, the Fe dose can be lower with UV radiation (50 mg/L) while maintaining high efficiencies [51].
Finally, Figure 1c, shows the interaction between HRT and peroxide dose, this interaction does not show a significant statistical effect (P=0.9231), however, its evaluation is important because the time should be adjusted according to the oxidant dose, a treatment time less than optimal could generate the presence of residual peroxide [52]. This would mean a disadvantage for the process due to the excessive consumption of reagent, likewise, an excess in the peroxide dose could generate parasitic reactions that do not have a positive effect on the removal of the pollutant because they consume the hydroxyl radicals generated [53].
Tuncer & Sönmez, (2023), obtained a COD removal of 87.9% in textile wastewater, applying a dose of H2O2 and Fe2+ of 1 mg/L, at a time of 30 min, and pH < 3.5, with an initial COD of 397 mg/L, in this study, the initial COD was 1020 mg/L. The contamination levels of the wastewater influence the treatment conditions, the lower the COD initial the doses of reagents used can be lower.
2.2.2. Color Removal
Figure 2 shows the % color removal of the SCFr. The model obtained had a fit of 0.8436 (R2), calculating efficiency of 96.6% at a dose of 1134 mg/L peroxide, a ratio of 0.18, and an HRT of 28.2 min. The adjusted R2 is a statistic that indicates how close the experimental data are to the fitted regression line, values close to 1 are desirable because they indicate that the model adequately describes the response, and a high value indicates good agreement between the predicted and experimental data [55]. The was 0.5261, indicating a lack of influence of the control variables on the measured response, so lack-of-fit tests were performed. The lack of fit test is designed to determine whether the selected model is adequate to describe the observed data. The test is performed by comparing the variability of the residuals of the current model with the variability between observations obtained under repeated factor conditions. Since the P-value for the lack of fit is less than 0.05 (P= 0.0324), there is a statistically significant lack of fit at a 95.0% confidence level. This means that the model thus fitted does not adequately represent the data for color removal.
Figure 2a,b show that with increasing rate and time, color removal efficiencies tend to decrease. Solar radiation stimulates the release of Fe in the treated water, an excess can increase color and turbidity in the sample due to the formation of suspended colloidal particles and complexes with residual organic matter, increasing the color [56]. Excess Fe released by the filament can decrease the aesthetic quality of treated water, commonly leading to reddish color, odor, and increased turbidity. Oxidized water is usually attributed to ferric hydroxide, which upon contact with oxygen or chlorides during water treatment, Fe2+ ions are oxidized to the insoluble form Fe3+ following Equations (3) and (4) and are responsible for the colored water [57].
Due to the nature of the SCFr, it can be significantly influenced by radiation which generates variability in the results, causing a lack of fit in the model (Supplementary Material 2) for color removal. Table 3 shows the experimental matrix with the efficiencies obtained for each response variable and the average UVA radiation measured during the optimization experiments, which were performed in random order. An ANOVA and a multiple range test (Tukey test) were performed to determine the significant differences between the radiation measured in each experiment. The results show that the solar UVA radiation was statistically different between tests, this variability depended on the weather conditions and cloud cover over the period of the optimization tests [58]. The oxidation processes in which solar radiation is applied are subject to the noise effect of the natural variability of the radiation, this factor is not possible to control in the SCFr system, so processes that apply natural solar radiation tend to present variation due to the nature of the process itself. However, in the validation tests of the color removal % model (Table 2), an efficiency of 98.4% was observed and the standard error of the estimate was 13.6%, indicating that although the variability is high, the experimental value was close to the value calculated by the model.
Finally, Figure 2c shows the interaction between HRT (P= 0.2136) and peroxide dose (P= 0.2136), these factors individually and together had no significant effect on the response. The ratio is a factor with a statistically significant effect on color removal (P=0.0204), which may be closely related to the amount of Fe released by the SCFr process.
The removal of color and dye is usually very efficient in advanced oxidation processes, the removal of 99% of the indigo carmine dye present in textile wastewater was obtained, at a pH 3.2, H2O2 concentration of 0.32 mM/L, composite concentration (FeO-NPs þ iS-WEPS) 2 g/L, a reaction time 20 min and an initial COD of 2422 mg/L [59]. Generally high color removal efficiencies are obtained through advanced oxidation processes in real textile wastewater [60]. However, it does not necessarily indicate a removal of toxicity from the water or a significant decrease in COD; dye removal does not always mean complete mineralization of contaminants.
2.2.3. Turbidity Removal
Turbidity represents the colloidal particles present in the sample [61] which can be caused by wear of the fabric or detachment of the starch used to protect the color in the fabric, which occurs naturally in the washing and softening of the denim, additionally, salts and metal ions can represent this parameter [38]. The calculated efficiency was 85.6% (Table 2), at an HRT of 28.4 min, a ratio of 0.18 and a peroxide dose of 1277 mg/L. The value observed in the model validation tests averaged 87.3%. The coefficient of determination of the model obtained was 0.9565 (R2), the fitted coefficient )value was 0.8222 and the lack of fit test was not significant (P=0.0856), indicating that the model is adequate (Supplementary Material 3) to predict the % turbidity removal.
According to ANOVA, HRT and ratio had a significant effect (P= 0.0017 and 0.0034 respectively, Supplementary Material 3) on turbidity removal. Figure 3a,b shows the interactions between these two factors and the peroxide dose. The H2O2 concentration evaluated did not have a significant effect (P= 0.1787) as shown in Figure 3c, this factor influences the generation of hydroxyl radicals which improves the efficiency [62]. It has been shown that the production of hydroxyl radicals increases with increasing H2O2 concentration if there is sufficient catalyst (Fe2+). When the oxidant dose is in excess, a decrease in efficiency is observed, since the hydroxyl radicals change to forms with lower oxidation potential and this causes a decrease in oxidation [63] as shown in Equation (5) [53].
The HRT and ratio of the packed iron filament can favor the consumption of the reagent, optimizing the treatment costs by maximizing the peroxide dose supplied to the process. In the corrosion process, the release of the catalyst is dependent on the time of exposure to radiation [32]. The optimization of the Fe2+ concentration is crucial for the SCFr process because radical formation occurs efficiently in the presence of the catalyst, the hydroxyl radical increases as the ion ferrous increases until it reaches its optimum value [63].
The removal of colloidal particles by coagulation processes has been a method of water and wastewater treatment for its high efficiencies (98.5%), the removal of colloidal particles is possible by the neutralization of charges, generating an aggregation and formation of sludge containing contaminants which must be treated for final disposal, the treated water is then clarified to remove traces of clots formed [64]. Bener et al., (2019) obtained an 83.5% turbidity removal in a real textile wastewater, applying an electrocoagulation process, with Al-Fe electrodes, pH 5, with an initial turbidity of 24.3 NTU and initial COD of 295 mg/L. The SCFr process obtained a maximum removal of 87.3% with an initial value of 237.0 NTU (Table 1) and does not lead to the formation of residual sludge.
2.3. Kinetic Models
The first, second order and BMG models were evaluated to determine the kinetic parameters for COD, Color and Turbidity removal (Table 4) for the SCFr system at maximum COD removal conditions. The coefficient of determination (R2) was used to determine the adequacy of the model fit. The BMG model had the best fit for all three response variables, indicating that the oxidation process in the SCFr reactor occurs in two stages. The first stage presents the maximum concentration of H2O2 that is present at the beginning of the reaction and consequently the maximum generation of radicals is possible, generating the maximum removal and rate (dotted lines, Figure 4, indicate the kinetic phases). The second stage is characterized by being slower due to the depletion of the reagents, therefore the efficiency in this stage will have already reached its maximum value and usually remains unchanged [66,67].
Figure 4a–c shows the experimental data, and the fitted model obtained. The maximum COD removal occurs rapidly in the first 5 min at 55.5 kJ/L of accumulated energy. Low values for the 1/m constant indicate the highest degradation rate, consequently high values of 1/b indicate a slower rate compared to the previous one [67]. Lima et al., (2021) indicated that the presence of mediators in the oxidation reaction can contribute to decrease the slope of the curves for zero-order and first-order reaction kinetics and increase for second-order ones, an increase in the value of the slope would indicate a higher speed in the reaction. According to Chan & Chu, (2003), in the degradation of atrazine, the oxidation rate depends on the increase in Fe concentration or on the increase in H2O2 dosage, however, they concluded that the degradation is more sensitive to the Fe dosage, when the concentration decreases the peroxide dosage becomes more critical, when iron concentrations are low the peroxide dosage becomes more important. In the SCFr, because of solar UV radiation the significance of peroxide is less evident due to the reduction of the catalyst as described in Equation (6), which again stimulates reactions 1 and 2, due to the ratio is the factor that had the greatest significance in the removal of COD, color and turbidity (Supplementary Material 1).
In the BMG model a decrease of the slope is possible, so that intermediary compounds can improve the reaction rate. In Color and Turbidity removal, the two kinetic stages are not clearly observed. The decrease in the fit (R2) of these variables is due to the low decomposition based on the experimental data [67] because the optimum removal conditions correspond to maximum COD removal and not to color and turbidity.
Previously Fenton reactions were defined as second order, it was considered that the radical concentration remained constant over time during the treatment process, new models have been proposed including new variables allowing a better approximation [70]. The BMG model has been extensively studied to explain what happens in the Fenton-type oxidation process, despite its good performance, the model is completely empirical [66], and the predictions are not based on the set of chemical reactions that occur in the Fenton process [70]. New models should be evaluated more clearly considering the effect of light, Fe3+ to Fe2+ reduction, complex formation, the effect of temperature, or the partitioning of other radicals with lower potential. Better models will allow a clearer and deeper understanding of the degradation of contaminants, which could contribute to optimizing treatment conditions [70].
2.4. Effect of Sunlight
It has been widely demonstrated the effect that UV light has on the kinetics of Fenton reactions due to the reduction of Fe3+ to Fe2+ which allows greater availability of the catalyst, additionally, the presence of UV allows the formation of radicals from the peroxide as shown in Equations 2 and 7 [58,71].
The SCFr was evaluated in the presence and absence of sunlight, the results are shown in Figure 5. In the absence of sunlight (classical Fenton H2O2/Fe2+) the efficiencies were 16.3%, 34% and 47% of COD, turbidity, and color, respectively. The efficiencies of the system operated under the same conditions, but in the presence of sunlight (H2O2/Fe2+/UV solar) were 91.8, 87.3, and 98.4% COD, turbidity and color, respectively. The COD removal efficiency improved by 75.5% because of UV light. UV light emitted by LED lamps (365 nm and 405 nm) has shown to have a positive effect on the efficiency of the Fenton reaction [72,73], Therefore, the application of these devices in combination with sunlight should be evaluated in a continuous operation to demonstrate the effect of sunlight and LED light on the stability of the SCFr efficiency.
De Souza et al., (2021), evaluated the effect of natural light and LED light on the removal of COD (i=475.1 mg/L) in a textile industry wastewater, and indicated that LED light has a positive effect on the decrease in reagent consumption compared to sunlight and additionally the use of LED lamps could reduce the cost of electricity consumption in a large-scale process. The kinetics in this study indicated that the maximum removals with LED light, UVA lamp, and sunlight reached a steady state at 5 min of reaction. In the SCFr system, the maximum COD removal was achieved at 55 kJ/L at a similar time, so this low energy may be sufficient to stimulate the photo-Fenton reactions.
Shirato et al., (2012), reported that thermal energy has a positive effect on the generation of hydroxyl radicals (55 °C) and Duan et al., (2018) reported that the temperature can contribute to stimulating the efficiency of radical regeneration in the range of 5 to 75 °C in oxidation processes. Sakthi (2020) reported that the temperature between 50 ºC to 90 ºC generated the highest COD removal efficiency. Omi et al. (2022) indicated that temperature may influence the removal of persistent contaminants. Temperature may contribute to a reduction in peroxide half-life, which increases the rate of homolytic cleavage and causes the Fenton reaction to release hydroxyl radicals. [79]. In oxidation processes with sunlight, the temperature is increased. In the SFCr system the temperature was 40 °C with a UVA radiation of 29 W/m2 and the temperature inside the SCFr without the effect of light was 23°C.
Herrera-Ibarra et al., (2022), evaluated the effect on COD removal in the presence and absence of sunlight by applying copper slag as a catalyst in textile industrial water, with an initial COD of 1486 mg/L, a pH of 10.25 and color of 9550 Pt-Co, operating the system at 240 min, 133. 3 g/L of Cu slag, 6290 mg/L of H2O2 and pH 7. 3 g/L of Cu slag, 6290 mg/L H2O2 and pH 7. The efficiencies in the absence of sunlight were 36% COD removal and color (Abs) at 515 nm of 59.9%, and in the presence of sunlight were 85.7% and 99.8%, respectively.
2.5. Fe2+ Release
The presence of Fe2+ enhances the generation of hydroxyl radicals in Fenton reactions, as shown in Equations 1 and 2 [23,54]. In Electro-Fenton processes this catalyst is added in situ by the flow of electrons generated by the oxidation of the sacrificial electrode, however, a challenge of this process is the electrical energy consumption when scaled up [81]. Usually, the Fe supplied is a ferrous salt that is added to the process in solution, its disadvantage is the addition of sulfates, chlorides, or nitrates that increase the ionic charge in the treated water [54]. Therefore, strategies have been developed to fix the catalyst to a surface avoiding the addition of salts and the loss of the catalyst [80]. In situ release has been evaluated by applying galvanic cells in Galvanic Fenton-type processes, which through the potential differential between the Cu and Fe electrodes generate the energy necessary for the catalyst release [28,82].
Fe does not represent a health and environmental risk, it has been indicated that it may be the most environmentally friendly catalyst, is not a heavy metal, does not represent a risk to public health, efficient and affordable [26,83], its application has many advantages compared to other metals. The SCFr can release in situ Fe to catalyze the Fenton reaction, this process was evaluated in the removal of persistent organic compounds obtaining up to 80 mg/L of Fe2+ [84], however, the mechanisms have not been discussed.
The concentration of Fe2+ released by the SCFr was evaluated in a deionized water solution to avoid the interference of contaminants in the determination, keeping the chloride concentration, temperatures, and pH of the raw wastewater sample, the results are shown in Figure 6a. The Fe2+ was released because of corrosion was 6. 6 mg/L at the optimum HRT of the SCFr, the acid corrosion of the packed iron filament inside is possible due to the high concentration of by the pH of the raw sample (Table 1), under this condition, the corrosion of the packed iron filament occurs spontaneously as described in Equation (8) [85]:
At pH 3.44, the effect of UVA light, temperature, and temperature + UVA released 6.9, 7.3, and 7.0 mg/L Fe2+ respectively, the HRT no significant change was observed. When evaluating the effect of the presence of chlorides, the final Fe2+ concentration was 13.0 mg/L. The chlorides contained in the textile wastewater (Table 1: 345 mg/L) can enhance the release of Fe2+ because they can prevent the formation of ferric oxide on the filament surface. P. Li & Du, (2022) concluded that by increasing the concentration of chloride ions in solution, the oxygen concentration decreases, which limits the formation of ferric oxides on the surface of a high-strength steel plate. Cl- is one of the most important factors in the corrosion of steel structures in the marine environment, it is an activator of pitting corrosion and can destroy the oxide layers on the steel surface [87], thus releasing Fe2+.
When SCFr was irradiated with UVA-LED and Solar light, the concentration of iron released was 23.5 and 25.4 mg/L respectively, so irradiation dramatically enhances the release. Qian et al., (2020), observed that the presence of ultraviolet light and chlorides accelerates corrosion in steel because it decreases the stability of the passivating film after illumination, and further concluded that UV accelerates pitting growth. According to Zhao et al., (2022), the corrosion process of 304 stainless steel under a thin electrolytic layer of NaCl irradiated with UV was influenced by a photovoltaic effect, because the energy of UV radiation (312 nm) can be sufficient to excite electrons from the conduction valence band, and the presence of chloride ions by electrostatic adsorption of Cl- by the positively charged surface of the metal can reduce the energy barrier initiating pitting.
Figure 6b shows the results of the mass % of O and Fe on the surface of the filaments used in the above tests. Tukey’s tests indicate that there is a significant difference in the mass % of these two elements. In the control, iron filament before testing (carbon steel filament), the presence of oxygen is lower, followed by the tests where chloride ion is present. On the filament surface, when the % of O increases, the mass % of Fe decreases, which could indicate the formation of an iron oxide layer preventing the release of Fe.
Figure 7 shows the SEM micrographs of the carbon steel filaments, evaluated on Fe2+ release. Figure 7a shows the untreated filament, a flat and smooth surface could be an indicator of the absence of corrosion and oxides. In an SEM analysis the morphology of oxides usually depends on the type of metal. The presence of particles, bumps, irregular white spots, or agglomerates is usually an indicator of metal oxides or hydroxides [89]. Characteristic structures such as rosettes, dendritic spines, crystalline agglomerates, and hexagonal plates in spherical or octahedral shapes are usually characteristic of magnetite, hematite, or goethite (Amiri et al., 2022; Tadic et al., 2022). In Figure 7b, c, and d, this morphology is observed in smaller proportion, however, pitted zones are observed. In Figure 7e,f, the presence of chloride ion increases the density of corrosion products as white spots and pitting zones, it is evident that the presence of the ion is included in the corrosion density, finally in Figure 7g,h, corrosion pitting zones are observed, in both images the corrosion could be homogeneous on the surface, so the SCFr could operate in diurnal cycles using a LED lamp.
3.6. Final Characterization
Table 1 shows the characterization of the treated water under optimum conditions. COD removal was 91.8%, Color 98.4%, and Turbidity 87.3%, Figure 8 shows the raw and treated water. According to these results, the treated water has a final COD of 83.5 mg/L. The NOM-001-SEMARNAT-2021[90], establishes a maximum permissible limit for treated water and its final disposal in rivers, streams, and drains of 210 mg/L as an instantaneous value in Mexico. The standards QCVN 13-MT: 2015/BTNMT, for the effluent of the textile industry de Tailandia whose maximum limit is 100 mg/L [91]. Water Pollution Control, No. 25687 which establishes a COD limit of 250 mg/L for water textile industry (cotton textile and alike) in Turkey [92]. The final color was 29.3 Pt-Co U in the treated water, according to The effluent of the textile industry of Thailand the limit is 50-75 Pt-Co [91]. The system allows compliance with different regulations about the maximum COD and color limits for textile wastewater.
The concentration of ammonia nitrogen increased up to 5.15 mg/L, due to the presence of the amino group that is part of the structure of the dye (indigo blue), the oxidation process could increase its concentration in the treated water [45,93], this contaminant has not been regulated in textile wastewater. Also, the increase may be related to the reduction of nitrate ion, which had a removal of 52.5% and may occur in the presence of Fe0 (Equation (9)) [94]:
The initial chloride concentration was 345 mg/L, after treatment it was 280.7 mg/L, representing a removal of 18.7%. The removal could be due to the adsorption of Cl- by the positive charges on the surface of the metal packed inside the reactor or to the possible formation of FeCl3 on the surface of the metal [95].
The final hardness was 22 mg/L with a removal of 89%, the oxidation processes are not related to the hardness removal, however, an indirect mechanism was observed. The presence of oxides on the surface of the Fe filament (Figure 7b) could generate an adsorption process retaining the cations Ca2+ and Mg2+ [96]. Acidity, alkalinity and final pH decreased to 629.2 mg/L, 0.0 mg/L, and 2.6, respectively. The pH is regulated between 6-9 [90], SCFr does not allow this parameter to be increased, so an additional step to adjust this value is necessary.
3. Materials and Methods
3.1. Physicochemical Characterization
The raw water samples and the effluent obtained from SCFr treatment operated under optimal COD removal conditions were physiochemically characterized. Textile wastewater was obtained from a denim-washing factory in, Mexico. Sampling was performed in the autumn-winter season according to peak factory production; samples were stored at 4 ◦C until analysis and treatment. The pH and electrical conductivity (EC) were measured with a HANNA HI 2550 potentiometer [84]. The color, chlorides, alkalinity, acidity, hardness, electrical conductivity, turbidity, total dissolved solids (TDS), total suspended solids (TSS), and total solid (TS) were determined according to standard methods [97]. The HACH TNT-831 method was used for ammoniacal nitrogen () and HACH TNT-835 for nitrates (). COD was determined using the peroxide-based method to avoid interference from residual peroxide in the standarized method and avoidance of hazardous waste generation as dichromate [98].
3.2. Solar Corrosion Fenton Reactor (SCFr)
A SCFr reactor was designed and constructed using a 20 X 2 cm ID (internal diameter) Kimax® borosilicate tube. It was fed downflow. Figure 8 shows the experimental unit. In the operation with sunlight, through a cylindrical parabolic concentrator (CPC) with a 70° inclination, using Mirosun® films with a reflectance of 90% light transmittance at wavelengths of 340 nm to 500 nm, the focal length was 7 cm with a parabola length of 32 cm, for a reflective area of 638 cm [84], and an angle of inclination of the base of the concentrator of 20°. The reactor body was placed at the focal point of the CPC and focused every 15 min. An ASTM A853 carbon/Fe steel filament was packed inside the reactor at different reactor weight/volume (w/v) ratios, and the operation volume was adjusted for each ratio assessed. The internal temperature was monitored with a thermocouple. The experiments were evaluated from 10:00 to 14:00 h, this was to control the variability of the results because of changes in natural solar radiation.
3.3. Optimization of the SCFr
A methodology surface response through design Box-Behnken was employed to determine the optimum operating conditions of the SCFr reactor to allow maximum % color, turbidity, and COD removal and were calculated using the Equation (11)., where C% represents the removal efficiency, Ci represents the initial value, Cf represents the value at the end of the treatment.
The independent variables (factors) were the concentration of peroxide (H2O2) at concentrations of 500 at 1500 mg/L (J. T. Baker, 30%); HRT 20 at 40 min, and ratio w/v (g of Fe filament / mL reactor volume) from 0.1 to 0.3, with a total of 15 experiments, with 5 degrees of freedom of error (DF), initial pH 2.8-3.2 (sample pH). The program Statgraphics Centurion (version XIX) was used for mathematical modeling and optimization of the SCFr operating parameters [24]. The levels of independent variables are displayed in Figure 9a, and the spatial distribution of the tests in the experimental space is shown in Figure 1b. The concentration of the dosed H2O2 was adjusted using the iodometric method (Castillo–suárez et al., 2019).
UVA radiation was monitored in W/m2 using a Model PMA2100 Dual-Input Data Logging Radiometer, spectrum sensor (PMA2110 Digital UVA) having a spectral response of 320–400 nm, a resolution a resolution of 0.001 mW/cm2 and a full scale of 200 mW/cm2. The energy accumulated by the CPC was estimated using Equation (12) [84]:
Here, QUVA,n is the accumulated energy (in kJ/L), QUVA,n-1 is the previously accumulated energy (in J/L), Δt is the sampling time (s), is the average solar UVA radiation measured during the Δt = tn– tn-1 period in W/m2, Ar is the illuminated collector surface area of the parabolic concentrator
3.4. Kinetic Models
The first order, second order, and Behnajady-Modirshahla-Ghanbery (BMG) models were used to determine the kinetic parameters of the Color, Turbidity, and COD removal reactions in the SCFr (Equations (13)–(15). The system was operated under optimum conditions for maximum COD removal. Samples were taken every 5 min until the optimum HRT. The response variables were Color/Color0, Turbidity/Turbidity0, and COD/COD0 concentration. StatSoft® Statistics 10 software was used to fit the experimental data and calculate the kinetic constants [66,100].
First-order kinetic model:
Second-order kinetic model:
Behnajady-Modirshahla-Ghanbery (BMG) model:
where C0 is the initial concentration, is the final concentration at the accumulated energy sampled, and k, m and b are the constants of the models.
3.5. Effect of the Solar Light
The SCFr system was operated under optimal conditions for COD removal in the presence and absence of sunlight. The response variables were % removal of Color, Turbidity, and COD. An analysis of variance (ANOVA) with Tukey’s test (α=0.05) was used to establish the significant differences between the two treatments.
3.6. Fe2+ Release
Fe2+ released in situ by the SCFr system was evaluated at optimum conditions for COD removal and an acid solution at textile sample pH was fed to determine the individual effect of acid corrosion, The effects evaluated were:
1) Acid corrosion effect: the deionized water solution at the pH of the textile wastewater sample acidified with H2SO4 1N (JT. Backer®) was used.
2) Effect of UVA light: the acid solution was fed into the reactor; it was irradiated with a UVA LED light lamp with a dose of 20 W/m2.
3) Effect of temperature: the acid solution was fed into the reactor at 40°C, this temperature was the average obtained in the optimization tests.
4) Effect of light and temperature: an acid solution was fed at 40°C, the reactor was irradiated with UVA LED light with a dose of 20 W/m2.
5) Effect of temperature and chlorides: an acid solution was fed to the reactor at 40°C with a chloride concentration equal to the crude sample using NaCl (JT. Backer®).
6) Effect of temperature, UVA LED radiation, and chlorides: an acid solution was fed to the reactor at 40°C with a chloride concentration equal to the raw sample and the reactor was irradiated with UVA LED light at a dose of 20 W/m2.
7) The SCFr was operated with sunlight and fed with an acid solution at the pH and chloride concentration of the textile water sample, with a dosage of 29 W/m2 of solar UVA (radiationobtained during the test).
Fe2+ concentrations were analyzed using the 110-phenanthroline ferrous colorimetric method at 510 nm [84,101].
The surface area of the Fe filament used in each test was analyzed by scanning electron microscopy (SEM) coupled with an electron X-ray dispersive spectroscopy (EDS), which was realized using a JEOL JSM-6610LV microscope, to determine crystallinity, morphology, and the elemental composition at 1000, 3000 and 5000 X, taking 6 measurements per effect assessed.
5. Conclusions
The SCFr was optimized by applying a Box-Behnken experimental design, obtaining a removal of 91.8% COD, 98.4% color, and 87.3% turbidity of textile wastewater at HRT of 24.5 min, a ratio of 0.16, a peroxide dose of 1006.9 mg/L and 25.4 mg/L of Fe2+. Without the effect of sunlight, the system had an efficiency of 16.3%, 47.9%, and 34% COD, Color, and turbidity respectively, so UV radiation plays an important role in the efficiency.
The most significant factor in the treatment was the ratio because this factor in the SCFr defines the amount of Fe2+ released, making the process more sensitive to iron concentrations. The in-situ release of the catalyst was made by corrosion due to the presence of chlorides that prevent the passivation of the surface of the iron filament packed inside the reactor. UV LED or solar light can generate sufficient energy through a photocatalytic effect that in the presence of chloride ions stimulates pitting corrosion on the metal surface and prevents the formation of oxides allowing the continuous release of Fe2+, so it is not necessary to apply an electric potential as in an Electro-Fenton process. The system allows compliance with different regulations about the maximum COD and color limits for textile wastewater, hence treated wastewater could be recirculated in the same textile process.
Supplementary Materials
The following supporting information can be downloaded at the website of this paper posted on Preprints.org.
Author Contributions
All the authors contributed to the conception and design of the study. Ana Fernanda Tenorio-Hernández and Luis Antonio Castillo-Suarez performed the literature search and data analysis. Luis Antonio Castillo-Suarez, and Ivonne Linares-Hernández, wrote the first draft, conceptualized, and designed the manuscript. Veronica’ Martínez-Miranda and Carolina Álvarez Bastida commentary or revision – including pre- or post-publication stages. All authors commented on the previous versions of the manuscript. All authors read and approved of the final manuscript.
Data Availability Statement
All data generated or analyzed during this study are included in this published article.
Acknowledgments
This work was supported by Universidad Autónoma del Estado de México (project 6994 /2024/CIB).
Conflicts of Interest
The authors declare that they have no known competing financial interests or personal relationships that could have appeared to influence the work reported in this paper.
References
- B. Hajjar, “How the textile industry can help countries recover from COVID-19,” Word Economic Forum. Islamic Development Bank.Islamic Development Bank., 2020. https://www.weforum.org/agenda/2020/08/how-the-textile-industry-can-help-countries-recover-from-covid-19/.
- J. Rovira and J. L. Domingo, “Human health risks due to exposure to inorganic and organic chemicals from textiles: A review,” Environ. Res., vol. 168, no. September 2018, pp. 62–69, 2019. [CrossRef]
- W. U. Khan, S. Ahmed, Y. Dhoble, and S. Madhav, “A critical review of hazardous waste generation from textile industries and associated ecological impacts,” J. Indian Chem. Soc., vol. 100, no. 1, p. 100829, 2023. [CrossRef]
- M. Koszewska, “Circular Economy - Challenges for the Textile and Clothing Industry,” Autex Res. J., 2018. [CrossRef]
- A. P. Periyasamy and J. Militky, Denim processing and health hazards. Elsevier Ltd., 2017.
- A. K. Roy Choudhury, “Finishing of denim fabrics,” in Principles of Textile Finishing, Elsevier, 2017, pp. 383–415.
- D. Sharma, Water footprint of denim industry (Read from pg 111) in Sustainability in denim (Elsevier), no. July. 2020.
- M. C. Tomei, J. Soria Pascual, and D. Mosca Angelucci, “Analysing performance of real textile wastewater bio-decolourization under different reaction environments,” J. Clean. Prod., vol. 129, pp. 468–477, Aug. 2016. [CrossRef]
- D. A. Yaseen and M. Scholz, “Textile dye wastewater characteristics and constituents of synthetic effluents: a critical review,” Int. J. Environ. Sci. Technol., vol. 16, no. 2, pp. 1193–1226, Feb. 2019. [CrossRef]
- A. Sánchez-Sánchez, M. Tejocote-Pérez, R. M. Fuentes-Rivas, I. Linares-Hernández, V. Martínez-Miranda, and R. M. G. Fonseca-Montes De Oca, “Treatment of a textile effluent by electrochemical oxidation and coupled system electooxidation- salix babylonica,” Int. J. Photoenergy, vol. 2018, 2018. [CrossRef]
- R. O. Ramos, M. V. C. Albuquerque, W. S. Lopes, J. T. Sousa, and V. D. Leite, “Degradation of indigo carmine by photo-Fenton, Fenton, H2O2/UV-C and direct UV-C: Comparison of pathways, products and kinetics,” J. Water Process Eng., vol. 37, p. 101535, Oct. 2020. [CrossRef]
- R. P. Singh, P. K. Singh, R. Gupta, and R. L. Singh, Treatment and Recycling of Wastewater from Textile Industry. 2019.
- A. Othmani, A. Kesraoui, and M. Seffen, “The alternating and direct current effect on the elimination of cationic and anionic dye from aqueous solutions by electrocoagulation and coagulation flocculation,” Euro-Mediterranean J. Environ. Integr., vol. 2, no. 1, p. 6, Oct. 2017. [CrossRef]
- B. Keskin, M. E. Ersahin, H. Ozgun, and I. Koyuncu, “Pilot and full-scale applications of membrane processes for textile wastewater treatment: A critical review,” J. Water Process Eng., vol. 42, no. March, 2021. [CrossRef]
- E. GilPavas and S. Correa-Sanchez, “Assessment of the optimized treatment of indigo-polluted industrial textile wastewater by a sequential electrocoagulation-activated carbon adsorption process,” J. Water Process Eng., vol. 36, Aug. 2020. [CrossRef]
- Ö. Kahraman and İ. Şimşek, “Color removal from denim production facility wastewater by electrochemical treatment process and optimization with regression method,” J. Clean. Prod., vol. 267, Sep. 2020. [CrossRef]
- H. Yin et al., “Textile wastewater treatment for water reuse: A case study,” Processes, vol. 7, no. 1, 2019. [CrossRef]
- M. F. Chowdhury, S. Khandaker, F. Sarker, A. Islam, M. T. Rahman, and M. R. Awual, “Current treatment technologies and mechanisms for removal of indigo carmine dyes from wastewater: A review,” J. Mol. Liq., vol. 318, p. 114061, 2020. [CrossRef]
- V. B. de Leon, B. A. F. de Negreiros, C. Z. Brusamarello, G. Petroli, M. Di Domenico, and F. B. de Souza, “Artificial neural network for prediction of color adsorption from an industrial textile effluent using modified sugarcane bagasse: Characterization, kinetics and isotherm studies,” Environ. Nanotechnology, Monit. Manag., vol. 14, no. October, 2020. [CrossRef]
- K. Hendaoui, M. Trabelsi-Ayadi, and F. Ayari, “Optimization and mechanisms analysis of indigo dye removal using continuous electrocoagulation,” Chinese J. Chem. Eng., vol. 29, pp. 242–252, 2021. [CrossRef]
- S. Leila et al., “Fertilization value of municipal sewage sludge for Eucalyptus camaldulensis plants,” Biotechnol. Reports, vol. 13, no. 2017, pp. 8–12, 2017. [CrossRef]
- O. S. Djandja, L. X. Yin, Z. C. Wang, and P. G. Duan, “From wastewater treatment to resources recovery through hydrothermal treatments of municipal sewage sludge: A critical review,” Process Saf. Environ. Prot., vol. 151, pp. 101–127, 2021. [CrossRef]
- Z. U. H. Khan et al., “Removal of organic pollutants through hydroxyl radical-based advanced oxidation processes,” Ecotoxicol. Environ. Saf., vol. 267, no. July, p. 115564, 2023. [CrossRef]
- T. Wang, Y. Zhou, S. Cao, J. Lu, and Y. Zhou, “Degradation of sulfanilamide by Fenton-like reaction and optimization using response surface methodology,” Ecotoxicol. Environ. Saf., vol. 172, no. 130, pp. 334–340, 2019. [CrossRef]
- M. Castañeda-Juárez et al., “Oxidation of N-acetyl-para-aminophenol (acetaminophen) by a galvanic Fenton and solar galvanic Fenton processes,” Sol. Energy, vol. 199, no. November 2019, pp. 731–741, Mar. 2020. [CrossRef]
- Y. Chen, C. J. Miller, R. N. Collins, and T. D. Waite, “Key Considerations When Assessing Novel Fenton Catalysts: Iron Oxychloride (FeOCl) as a Case Study,” Environ. Sci. Technol., vol. 55, no. 19, pp. 13317–13325, 2021. [CrossRef]
- X. Cheng, L. Liang, J. Ye, N. Li, B. Yan, and G. Chen, “Influence and mechanism of water matrices on H2O2-based Fenton-like oxidation processes: A review,” Sci. Total Environ., vol. 888, p. 164086, Aug. 2023. [CrossRef]
- K. Kerboua, N. Haddour, I. Gasmi, and O. Hamdaoui, “Water Remediation from Recalcitrant Pollution Using the Galvano-Fenton Process: A Modeling Approach of the Hydroxyl Radical Generation and the Energy Efficiency,” Eurasia Proc. Sci. Technol. Eng. Math., vol. 21, pp. 506–516, 2022. [CrossRef]
- I. Gasmi, K. Kerboua, N. Haddour, O. Hamdaoui, A. Alghyamah, and F. Buret, “Kinetic pathways of iron electrode transformations in Galvano-Fenton process: A mechanistic investigation of in-situ catalyst formation and regeneration,” J. Taiwan Inst. Chem. Eng., vol. 116, pp. 81–91, 2020. [CrossRef]
- Y. S. Tadayozzi, F. A. dos Santos, E. F. Vicente, and J. C. Forti, “Application of oxidative process to degrade paraquat present in the commercial herbicide,” J. Environ. Sci. Heal. - Part B Pestic. Food Contam. Agric. Wastes, vol. 56, no. 7, pp. 670–674, 2021. [CrossRef]
- G. Lazorenko, A. Kasprzhitskii, and T. Nazdracheva, “Anti-corrosion coatings for protection of steel railway structures exposed to atmospheric environments: A review,” Constr. Build. Mater., vol. 288, p. 123115, Jun. 2021. [CrossRef]
- Q. Zhang, Z. Ye, Z. Zhu, X. Liu, J. Zhang, and F. Cao, “Separation and kinetic study of iron corrosion in acidic solution via a modified tip generation/substrate collection mode by SECM,” Corros. Sci., vol. 139, no. January, pp. 403–409, 2018. [CrossRef]
- A. Gomes, M. Navas, N. Uranga, T. Paiva, I. Figueira, and T. C. Diamantino, “High-temperature corrosion performance of austenitic stainless steels type AISI 316L and AISI 321H, in molten Solar Salt,” Sol. Energy, vol. 177, no. November 2018, pp. 408–419, 2019. [CrossRef]
- J. C. Gomez-Vidal and R. Tirawat, “Corrosion of alloys in a chloride molten salt (NaCl-LiCl) for solar thermal technologies,” Sol. Energy Mater. Sol. Cells, vol. 157, pp. 234–244, 2016. [CrossRef]
- M. R. Alam and M. R. Islam, “Pre-post Bleaching Behaviors of Cotton Knits Using Reductive and Oxidative bleaches,” Int. J. Polym. Text. Eng., vol. 7, no. 1, pp. 42–53, 2020. [CrossRef]
- D. Reddythota and, M. Teferi Timotewos, “Evaluation of Pollution Status and Detection of the Reason for the Death of Fish in Chamo Lake, Ethiopia,” J. Environ. Public Health, vol. 2022, 2022. [Google Scholar] [CrossRef]
- D. Allemand and D. Osborn, “Ocean acidification impacts on coral reefs: From sciences to solutions,” Reg. Stud. Mar. Sci., vol. 28, p. 100558, Apr. 2019. [CrossRef]
- A. Azanaw, B. Birlie, B. Teshome, and M. Jemberie, “Textile effluent treatment methods and eco-friendly resolution of textile wastewater,” Case Stud. Chem. Environ. Eng., vol. 6, no. July, p. 100230, 2022. [CrossRef]
- S. Ben Salah, M. Missaoui, A. Attia, G. Lesage, M. Heran, and R. Ben Amar, “Treatment of real textile effluent containing indigo blue dye by hybrid system combining adsorption and membrane processes,” Front. Membr. Sci. Technol., vol. 3, no. March, pp. 1–14, 2024. [CrossRef]
- F. Uddin, “Environmental hazard in textile dyeing wastewater from local textile industry,” Cellulose, vol. 28, no. 17, pp. 10715–10739, 2021. [CrossRef]
- M. Ilyas, W. Ahmad, H. Khan, S. Yousaf, M. Yasir, and A. Khan, “Environmental and health impacts of industrial wastewater effluents in Pakistan: A review,” Rev. Environ. Health, vol. 34, no. 2, pp. 171–186, 2019. [CrossRef]
- Bijay-Singh and E. Craswell, “Fertilizers and nitrate pollution of surface and ground water: an increasingly pervasive global problem,” SN Appl. Sci., vol. 3, no. 4, pp. 1–24, 2021. [CrossRef]
- United States Geological Survey, “Hardness of Water,” official website of the United States government, 2018. https://www.usgs.gov/special-topics/water-science-school/science/hardness-water (accessed Jun. 25, 2024).
- S. A. Ibrahim, M. B. Hasan, I. M. Al-Tameemi, T. A. Ibrahim, and M. N. Abbas, “Optimization of adsorption unit parameter of hardness remediation from wastewater using low-cost media,” Innov. Infrastruct. Solut., vol. 6, no. 4, pp. 1–12, 2021. [CrossRef]
- C. F. Couto, L. S. Marques, J. Balmant, A. P. de Oliveira Maia, W. G. Moravia, and M. C. Santos Amaral, “Hybrid MF and membrane bioreactor process applied towards water and indigo reuse from denim textile wastewater,” Environ. Technol. (United Kingdom), vol. 39, no. 6, pp. 725–738, 2018. [CrossRef]
- H. Zheng, Y. Pan, and X. Xiang, “Oxidation of acidic dye Eosin Y by the solar photo-Fenton processes,” J. Hazard. Mater., vol. 141, no. 3, pp. 457–464, 2007. [CrossRef]
- P. T. Almazán-Sánchez et al., “Treatment of Indigo-Dyed Textile Wastewater Using Solar Photo-Fenton with Iron-Modified Clay and Copper-Modified Carbon,” Water, Air, Soil Pollut., vol. 228, no. 8, p. 294, Aug. 2017. [CrossRef]
- M. S. Mansour, Y. Farid, S. A. Nosier, O. Adli, and M. H. Abdel-Aziz, “Removal of Eosin Yellow dye from industrial wastewater using UV/H2O2 and photoelectro-Fenton techniques,” J. Photochem. Photobiol. A Chem., vol. 436, no. October 2022, p. 114411, 2023. [CrossRef]
- S. Qian et al., “The Acceleration of Pitting Corrosion of AISI 304 Stainless Steel by Ultraviolet Light Illumination in Acidic Chloride Solution,” J. Electrochem. Soc., vol. 167, no. 2, p. 021506, 2020. [CrossRef]
- S. Singh, J. Singh, and H. Singh, “Chemical oxygen demand and biochemical oxygen demand,” in Green Sustainable Process for Chemical and Environmental Engineering and Science, Elsevier, 2021, pp. 69–83.
- Ç. Çalık and D. İ. Çifçi, “Comparison of kinetics and costs of Fenton and photo-Fenton processes used for the treatment of a textile industry wastewater,” J. Environ. Manage., vol. 304, p. 114234, Feb. 2022. [CrossRef]
- R. M. R. Santana et al., “Photo-Fenton process under sunlight irradiation for textile wastewater degradation: monitoring of residual hydrogen peroxide by spectrophotometric method and modeling artificial neural network models to predict treatment,” Chem. Pap., vol. 75, no. 6, pp. 2305–2316, 2021. [CrossRef]
- M. Lanzarini-Lopes, S. Garcia-Segura, K. Hristovski, and P. Westerhoff, “Electrical energy per order and current efficiency for electrochemical oxidation of p-chlorobenzoic acid with boron-doped diamond anode,” Chemosphere, vol. 188, pp. 304–311, 2017. [CrossRef]
- N. Tuncer and G. Sönmez, “Removal of COD and Color from Textile Wastewater by the Fenton and UV/H2O2 Oxidation Processes and Optimization,” Water. Air. Soil Pollut., vol. 234, no. 2, 2023. [CrossRef]
- F. Hussin, M. K. Aroua, and M. Szlachtac, “Combined solar electrocoagulation and adsorption processes for Pb(II) removal from aqueous solution,” Chem. Eng. Process. - Process Intensif., vol. 143, no. March, p. 107619, 2019. [CrossRef]
- Q. Guo et al., “A green solar photo-Fenton process for the degradation of carbamazepine using natural pyrite and organic acid with in-situ generated H2O2,” Sci. Total Environ., vol. 784, p. 147187, Aug. 2021. [CrossRef]
- M. S. Rahman and G. A. Gagnon, “Bench-scale evaluation of drinking water treatment parameters on iron particles and water quality,” Water Res., vol. 48, no. 1, pp. 137–147, 2014. [CrossRef]
- M. D. N. Ramos, C. S. Santana, C. C. V. Velloso, A. H. M. da Silva, F. Magalhães, and A. Aguiar, “A review on the treatment of textile industry effluents through Fenton processes,” Process Saf. Environ. Prot., vol. 155, pp. 366–386, 2021. [CrossRef]
- C. A. De León-Condés et al., “Sulfonated and gamma-irradiated waste expanded polystyrene with iron oxide nanoparticles, for removal of indigo carmine dye in textile wastewater,” Heliyon, vol. 5, no. 7, 2019. [CrossRef]
- L. A. Castillo-Suárez, A. G. Sierra-Sánchez, I. Linares-Hernández, V. Martínez-Miranda, and E. A. Teutli-Sequeira, “A critical review of textile industry wastewater: green technologies for the removal of indigo dyes,” Int. J. Environ. Sci. Technol., no. Ic, Mar. 2023. [CrossRef]
- B. U. Okoro, S. Sharifi, M. A. Jesson, and J. Bridgeman, “Natural organic matter (NOM) and turbidity removal by plant-based coagulants: A review,” J. Environ. Chem. Eng., vol. 9, no. 6, p. 106588, 2021. [CrossRef]
- T. T. Nguyen et al., “Synthesis of natural flowerlike iron-alum oxide with special interaction of Fe-Si-Al oxides as an effective catalyst for heterogeneous Fenton process,” J. Environ. Chem. Eng., vol. 9, no. 4, 2021. [CrossRef]
- L. Ferreira da Silva, A. Daniane Barbosa, A. E. Da Hora Machado, and L. Santos Andrade, “Combining Chemical and Photo-Fenton Solar Coagulation Processes in the Treatment of Real Wastewater from Paint Industry,” Orbital Electron. J. Chem., vol. 11, no. 2, pp. 1–25, Apr. 2019. [CrossRef]
- M. S. S. Abujazar, S. U. Karaağaç, S. S. Abu Amr, M. Y. D. Alazaiza, and M. J. Bashir, “Recent advancement in the application of hybrid coagulants in coagulation-flocculation of wastewater: A review,” J. Clean. Prod., vol. 345, p. 131133, Apr. 2022. [CrossRef]
- S. Bener, Ö. Bulca, B. Palas, G. Tekin, S. Atalay, and G. Ersöz, “Electrocoagulation process for the treatment of real textile wastewater: Effect of operative conditions on the organic carbon removal and kinetic study,” Process Saf. Environ. Prot., vol. 129, pp. 47–54, Sep. 2019. [CrossRef]
- N. Ertugay and F. N. Acar, “Removal of COD and color from Direct Blue 71 azo dye wastewater by Fenton’s oxidation: Kinetic study,” Arab. J. Chem., vol. 10, pp. S1158–S1163, 2017. [CrossRef]
- F. Li, T. S. Y. Choong, S. Soltani, L. C. Abdullah, and S. N. A. M. Jamil, “Kinetic Study of Fenton-Like Degradation of Methylene Blue in Aqueous Solution Using Calcium Peroxide,” Pertanika J. Sci. Technol., vol. 30, no. 2, pp. 1087–1102, 2022. [CrossRef]
- J. P. P. Lima, C. H. B. Tabelini, M. D. N. Ramos, and A. Aguiar, “Kinetic Evaluation of Bismarck Brown Y Azo Dye Oxidation by Fenton Processes in the Presence of Aromatic Mediators,” Water. Air. Soil Pollut., vol. 232, no. 8, 2021. [CrossRef]
- K. H. Chan and W. Chu, “Modeling the reaction kinetics of Fenton’s process on the removal of atrazine,” Chemosphere, vol. 51, no. 4, pp. 305–311, 2003. [CrossRef]
- Y. Li and H. Cheng, “Chemical kinetic modeling of organic pollutant degradation in Fenton and solar photo-Fenton processes,” J. Taiwan Inst. Chem. Eng., vol. 123, pp. 175–184, Jun. 2021. [CrossRef]
- M. Umar, H. A. Aziz, and M. S. Yusoff, “Trends in the use of Fenton, electro-Fenton and photo-Fenton for the treatment of landfill leachate,” Waste Manag., vol. 30, no. 11, pp. 2113–2121, 2010. [CrossRef]
- M. Ahmadi, F. Ghanbari, A. Alvarez, and S. Silva Martinez, “UV-LEDs assisted peroxymonosulfate/Fe2+ for oxidative removal of carmoisine: The effect of chloride ion,” Korean J. Chem. Eng., vol. 34, no. 8, pp. 2154–2161, 2017. [CrossRef]
- N. López-Vinent et al., “Synergies, radiation and kinetics in photo-Fenton process with UVA-LEDs,” J. Hazard. Mater., vol. 380, p. 120882, Dec. 2019. [CrossRef]
- Z. S. B. de Souza, M. P. Silva, T. J. M. Fraga, and M. A. Motta Sobrinho, “A comparative study of photo-Fenton process assisted by natural sunlight, UV-A, or visible LED light irradiation for degradation of real textile wastewater: factorial designs, kinetics, cost assessment, and phytotoxicity studies,” Environ. Sci. Pollut. Res., vol. 28, no. 19, pp. 23912–23928, 2021. [CrossRef]
- M. Shirato et al., “Synergistic effect of thermal energy on bactericidal action of photolysis of H 2O 2in relation to acceleration of hydroxyl radical generation,” Antimicrob. Agents Chemother., vol. 56, no. 1, pp. 295–301, 2012. [CrossRef]
- X. Duan et al., “Temperature-dependent evolution of hydroxyl radicals from peroxymonosulfate activation over nitrogen-modified carbon nanotubes,” Sustain. Mater. Technol., vol. 18, p. e00082, Dec. 2018. [CrossRef]
- P. M. Sakthi, “ENHANCEMENT OF WASTE ACTIVATED SLUDGE REDUCTION POTENTIAL BY THERMO-FENTON TREATMENT,” Int. Res. J. Eng. Technol., vol. 07, no. 08 | Aug 2020, pp. 3600–3605, 2020, doi: https://www.irjet.net/archives/V7/i8/IRJET-V7I8616.pdf.
- F. R. Omi, M. Rastgar, and M. Sadrzadeh, “Synergistic effect of thermal dehydrating on the emerging contaminants removal via Electro-Fenton,” J. Clean. Prod., vol. 356, p. 131880, Jul. 2022. [CrossRef]
- G. Y. Yew et al., “Thermal-Fenton mechanism with sonoprocessing for rapid non-catalytic transesterification of microalgal to biofuel production,” Chem. Eng. J., vol. 408, p. 127264, 2021. [CrossRef]
- L. M. Herrera-Ibarra, R. M. Ramírez-Zamora, A. Martín-Domínguez, M. Piña-Soberanis, D. Schnabel-Peraza, and J. A. Bañuelos-Díaz, “Treatment of Textile Industrial Wastewater by the Heterogeneous Solar Photo-Fenton Process Using Copper Slag,” Top. Catal., vol. 65, no. 9–12, pp. 1163–1179, 2022. [CrossRef]
- M. M. Bello, A. A. Abdul Raman, and A. Asghar, “A review on approaches for addressing the limitations of Fenton oxidation for recalcitrant wastewater treatment,” Process Saf. Environ. Prot., vol. 126, pp. 119–140, 2019. [CrossRef]
- I. Gasmi, K. Kerboua, N. Haddour, O. Hamdaoui, A. Alghyamah, and F. Buret, “The Galvano-Fenton process: Experimental insights and numerical mechanistic investigation applied to the degradation of acid orange 7,” Electrochim. Acta, vol. 373, p. 137897, Mar. 2021. [CrossRef]
- O. García-Rodríguez, J. A. Bañuelos, A. El-Ghenymy, L. A. Godínez, E. Brillas, and F. J. Rodríguez-Valadez, “Use of a carbon felt-iron oxide air-diffusion cathode for the mineralization of Malachite Green dye by heterogeneous electro-Fenton and UVA photoelectro-Fenton processes,” J. Electroanal. Chem., vol. 767, pp. 40–48, 2016. [CrossRef]
- L. A. Castillo-Suárez et al., “Commercial herbicide degradation by solar corrosion Fenton processes of iron filaments in a continuous flow reactor and its computational fluid dynamics (CFD) simulation,” J. Photochem. Photobiol. A Chem., vol. 412, no. August 2020, 2021. [CrossRef]
- K. C. Namkung, A. E. Burgess, and D. H. Bremner, “A fenton-like oxidation process using corrosion of iron metal sheet surfaces in the presence of hydrogen peroxide: A batch process study using model pollutants,” Environ. Technol., vol. 26, no. 3, pp. 341–352, 2005. [CrossRef]
- P. Li and M. Du, “Effect of chloride ion content on pitting corrosion of dispersion-strengthened-high-strength steel,” Corros. Commun., vol. 7, pp. 23–34, 2022. [CrossRef]
- R. Kaczmarczyk and S. Gurgul, “Thermodynamic Analysis of Chloride Corrosion in Steel for Energy System Applications in Fe-O-Cl-Na Environments,” 2024.
- C. Zhao, K. Dai, P. Li, Z. Cheng, and K. Xiao, “Effect of UV Illumination on the Corrosion Behavior of Under a Thin NaCl Electrolyte Layer,” Int. J. Electrochem. Sci., vol. 17, no. 11, p. 221164, 2022. [CrossRef]
- K. Kanjana, P. Ampornrat, and J. Channuie, “Gamma-radiation-induced corrosion of aluminum alloy: low dose effect,” J. Phys. Conf. Ser., vol. 860, p. 012041, Jun. 2017. [CrossRef]
- S. de M. A. y R. N. SEMARNAT, “NOM-001-SEMARNAT-2021 Límites permisibles de contaminantes en las descargas de aguas residuales en cuerpos recptores propiedad de la nacion.,” 2021. https://www.dof.gob.mx/nota_detalle.php?codigo=5645374&fecha=11/03/2022#gsc.tab=0 (accessed Jul. 10, 2024).
- B. T. N. VÀ and M. TRƯỜNG, “C Ộ NG HÒA XÃ H Ộ I CH Ủ NGH Ĩ A VI Ệ T NAM QCVN 13-MT: 2015 / BTNMT QUY CHU Ẩ N K Ỹ THU Ậ T QU Ố C GIA QUY CHU Ẩ N K Ỹ THU Ậ T QU Ố C GIA V Ề N ƯỚ C TH Ả I CÔNG NGHI Ệ P D Ệ T NHU Ộ M National technical regulation on the effluent of textile industry,” 2015. https://thuvienphapluat.vn/van-ban/Tai-nguyen-Moi-truong/Thong-tu-13-2015-TT-BTNMT-Quy-chuan-ky-thuat-quoc-gia-ve-moi-truong-270027.aspx (accessed Jun. 25, 2021).
- “Official Newspape, W. National Water Pollution Control Reg ulation..,” 2004. https://www.mfa.gov.tr/turkiye_s-policy-on-water-issues.en.mfa (accessed Jul. 10, 2024).
- V. Katheresan, J. Kansedo, and S. Y. Lau, “Efficiency of various recent wastewater dye removal methods: A review,” J. Environ. Chem. Eng., vol. 6, no. 4, pp. 4676–4697, 2018. [CrossRef]
- C. Alvarez-Bastida, V. Martínez-Miranda, M. Solache-Ríos, I. Linares-Hernández, A. Teutli-Sequeira, and G. Vázquez-Mejía, “Drinking water characterization and removal of manganese. Removal of manganese from water,” J. Environ. Chem. Eng., vol. 6, no. 2, pp. 2119–2125, 2018. [CrossRef]
- S. Shekoohiyan, S. Rtimi, G. Moussavi, S. Giannakis, and C. Pulgarin, “Enhancing solar disinfection of water in PET bottles by optimized in-situ formation of iron oxide films. From heterogeneous to homogeneous action modes with H2O2 vs. O2 – Part 1: Iron salts as oxide precursors,” Chem. Eng. J., vol. 358, no. October 2018, pp. 211–224, 2019. [CrossRef]
- S. El-Nahas, A. I. Osman, A. S. Arafat, A. H. Al-Muhtaseb, and H. M. Salman, “Facile and affordable synthetic route of nano powder zeolite and its application in fast softening of water hardness,” J. Water Process Eng., vol. 33, p. 101104, Feb. 2020. [CrossRef]
- American Public Health Association, Standard methods for the examination of water and wastewater, 21st ed. Washington, DC.: Water Environment Federation, W, 2005.
- P. Carbajal-Palacios, P. Balderas-Hernández, G. Roa-Morales, and J. G. Ibanez, “A Greener UV and Peroxide-Based Chemical Oxygen Demand Test,” Water. Air. Soil Pollut., vol. 228, no. 8, 2017. [CrossRef]
- L.A. Castillo-suárez, V. Lugo-lugo, I. Linares-hernández, V. Martínez-miranda, M. Esparza-soto, and M. D. L. Á. Mier-quiroga, “Biodegradability index enhancement of land fi ll leachates using a Solar Galvanic-Fenton and Galvanic-Fenton system coupled to an anaerobic – aerobic bioreactor,” Sol. Energy, vol. 188, no. March, pp. 989–1001, 2019. [CrossRef]
- I. Linares-Hernández et al., “Degradation of commercial paraquat in a solar-Fenton pilot lagoon using iron oxalate as a chelating agent: Hydro-thermal analysis with CFD,” J. Photochem. Photobiol. A Chem., vol. 429, no. October 2021, p. 113914, 2022. [CrossRef]
- A. Ruíz-Delgado, M. A. Roccamante, I. Oller, A. Agüera, and S. Malato, “Natural chelating agents from olive mill wastewater to enable photo-Fenton-like reactions at natural pH,” Catal. Today, vol. 328, pp. 281–285, May 2019. [CrossRef]
Figure 1.
Response surfaces for % COD removal at optimum operating conditions.
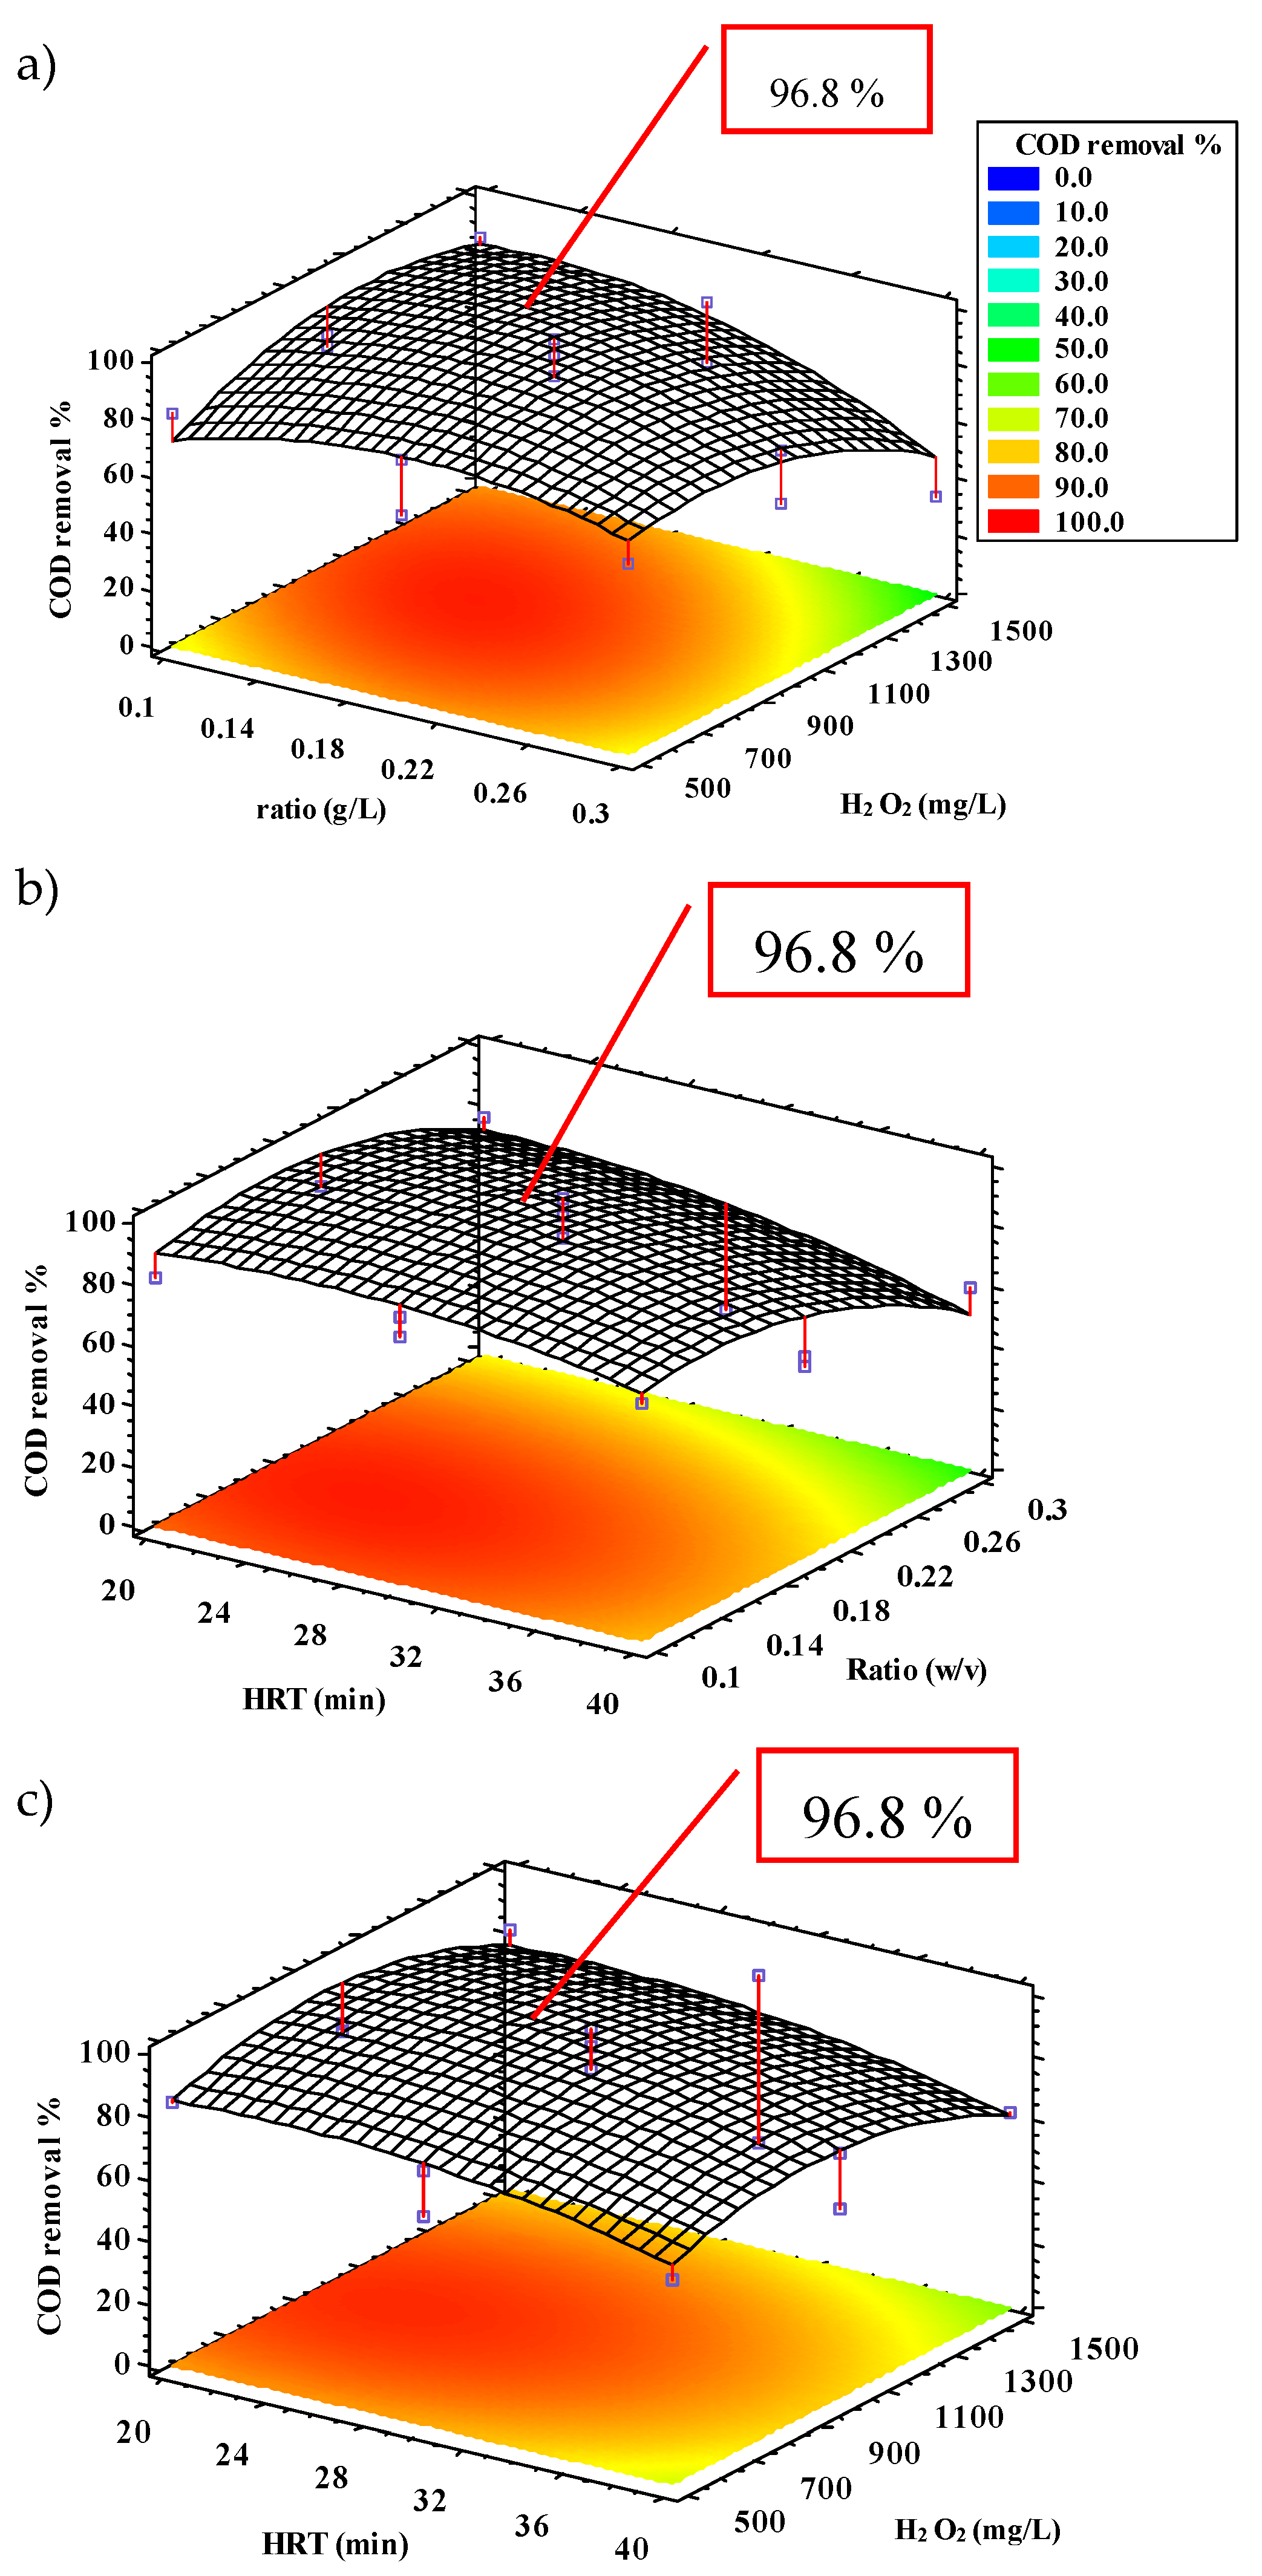
Figure 2.
Response surfaces for % Color removal at optimum operating conditions.
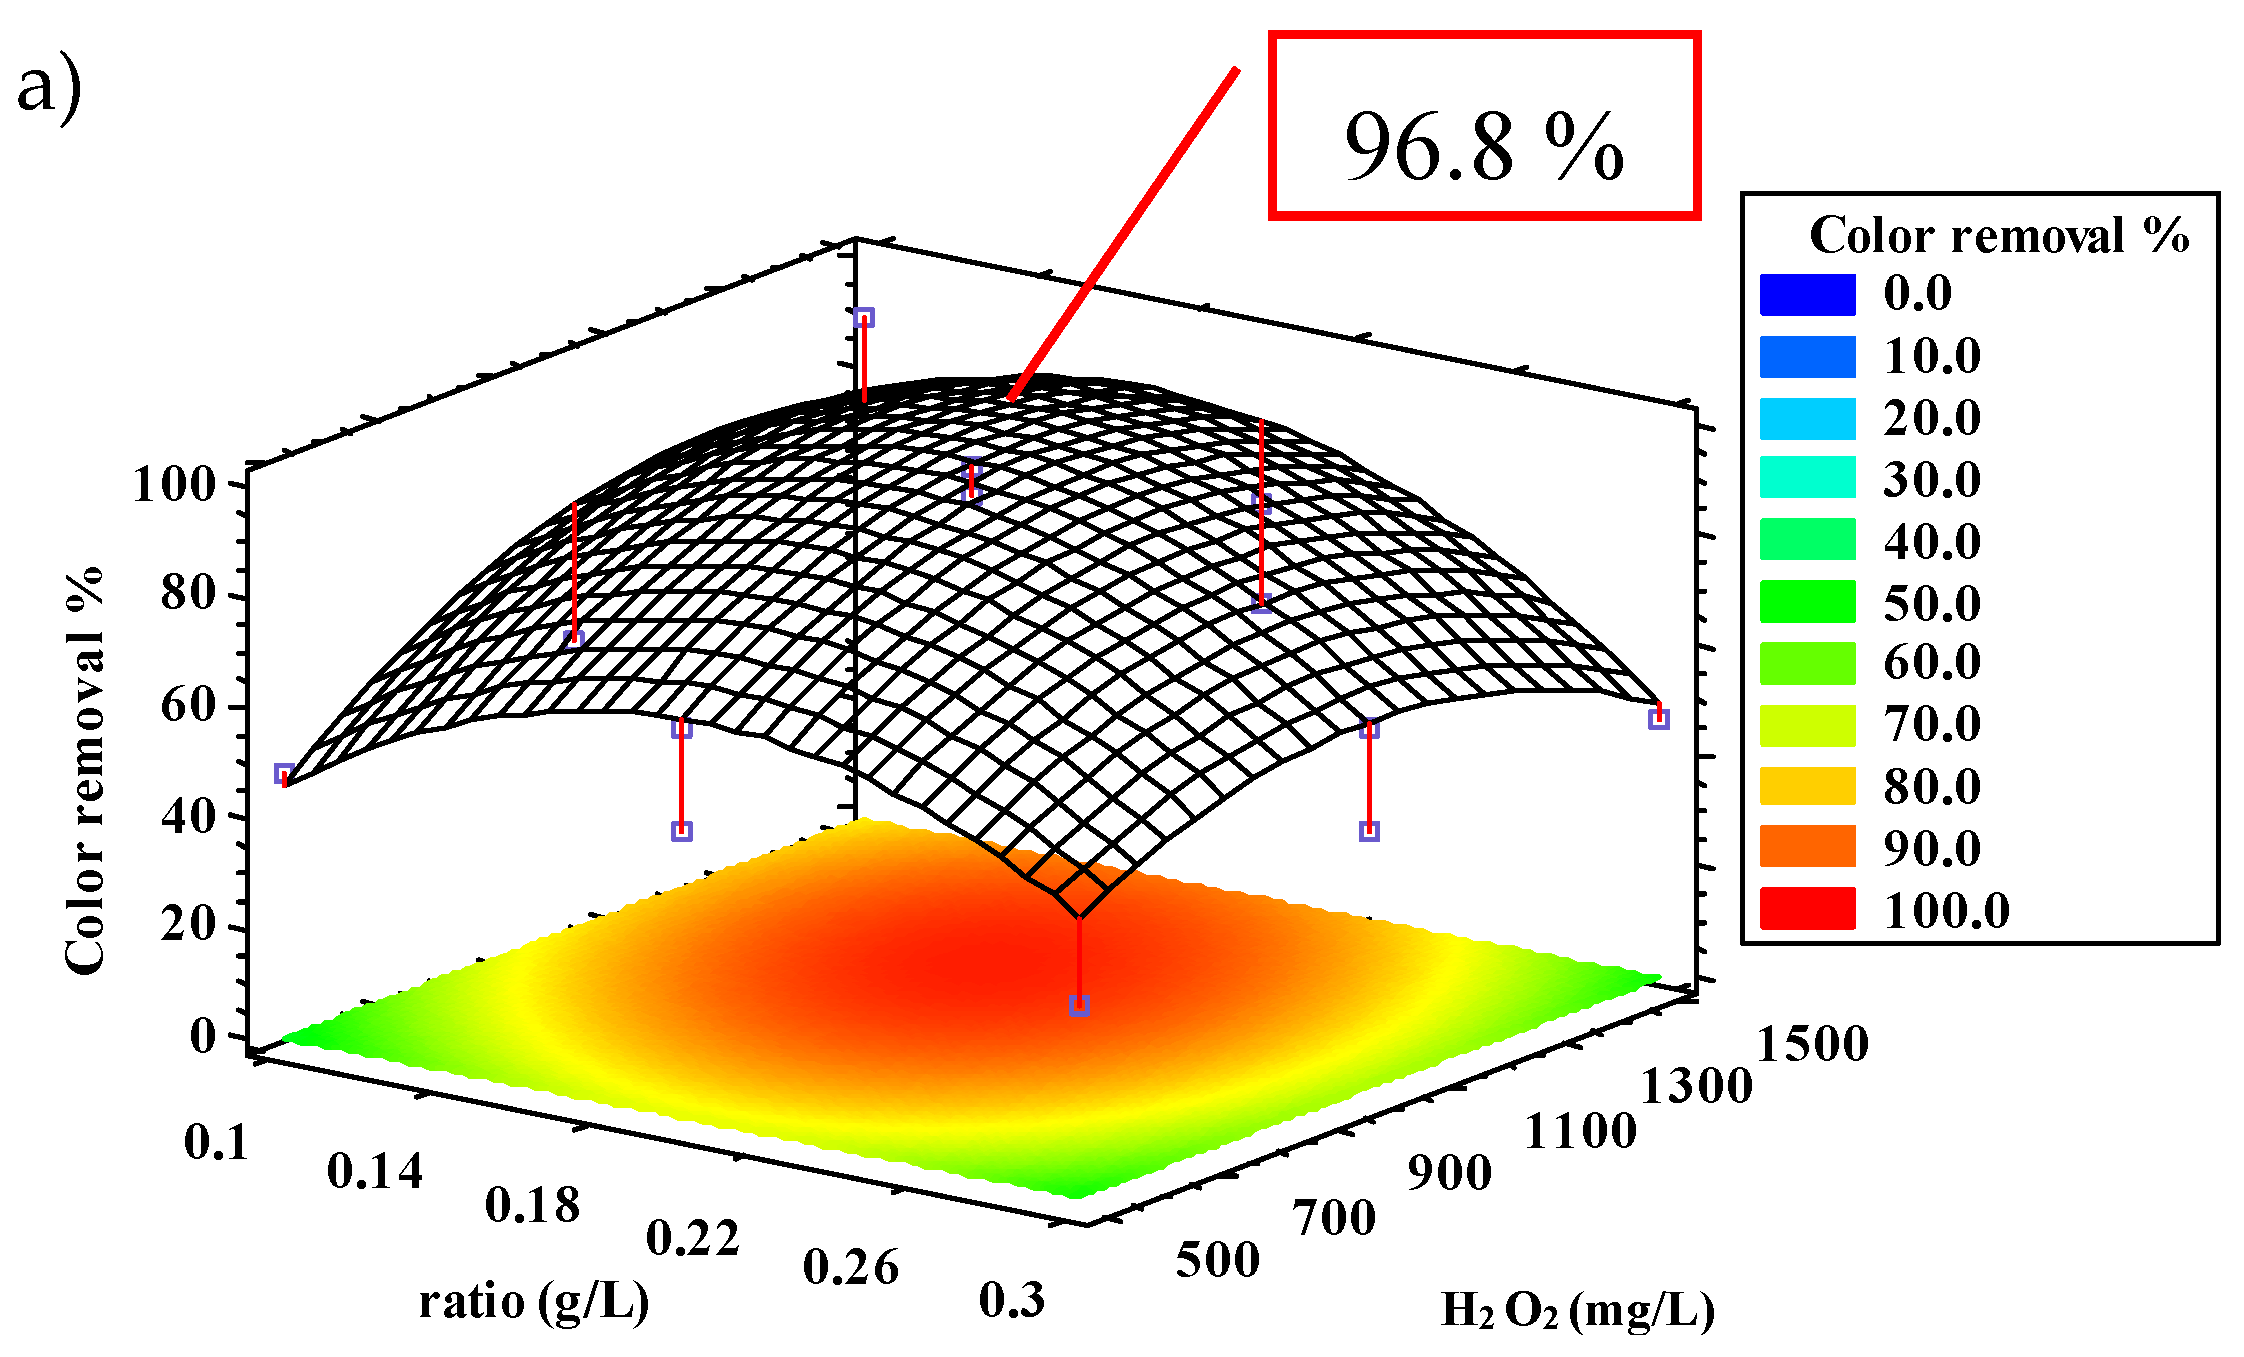
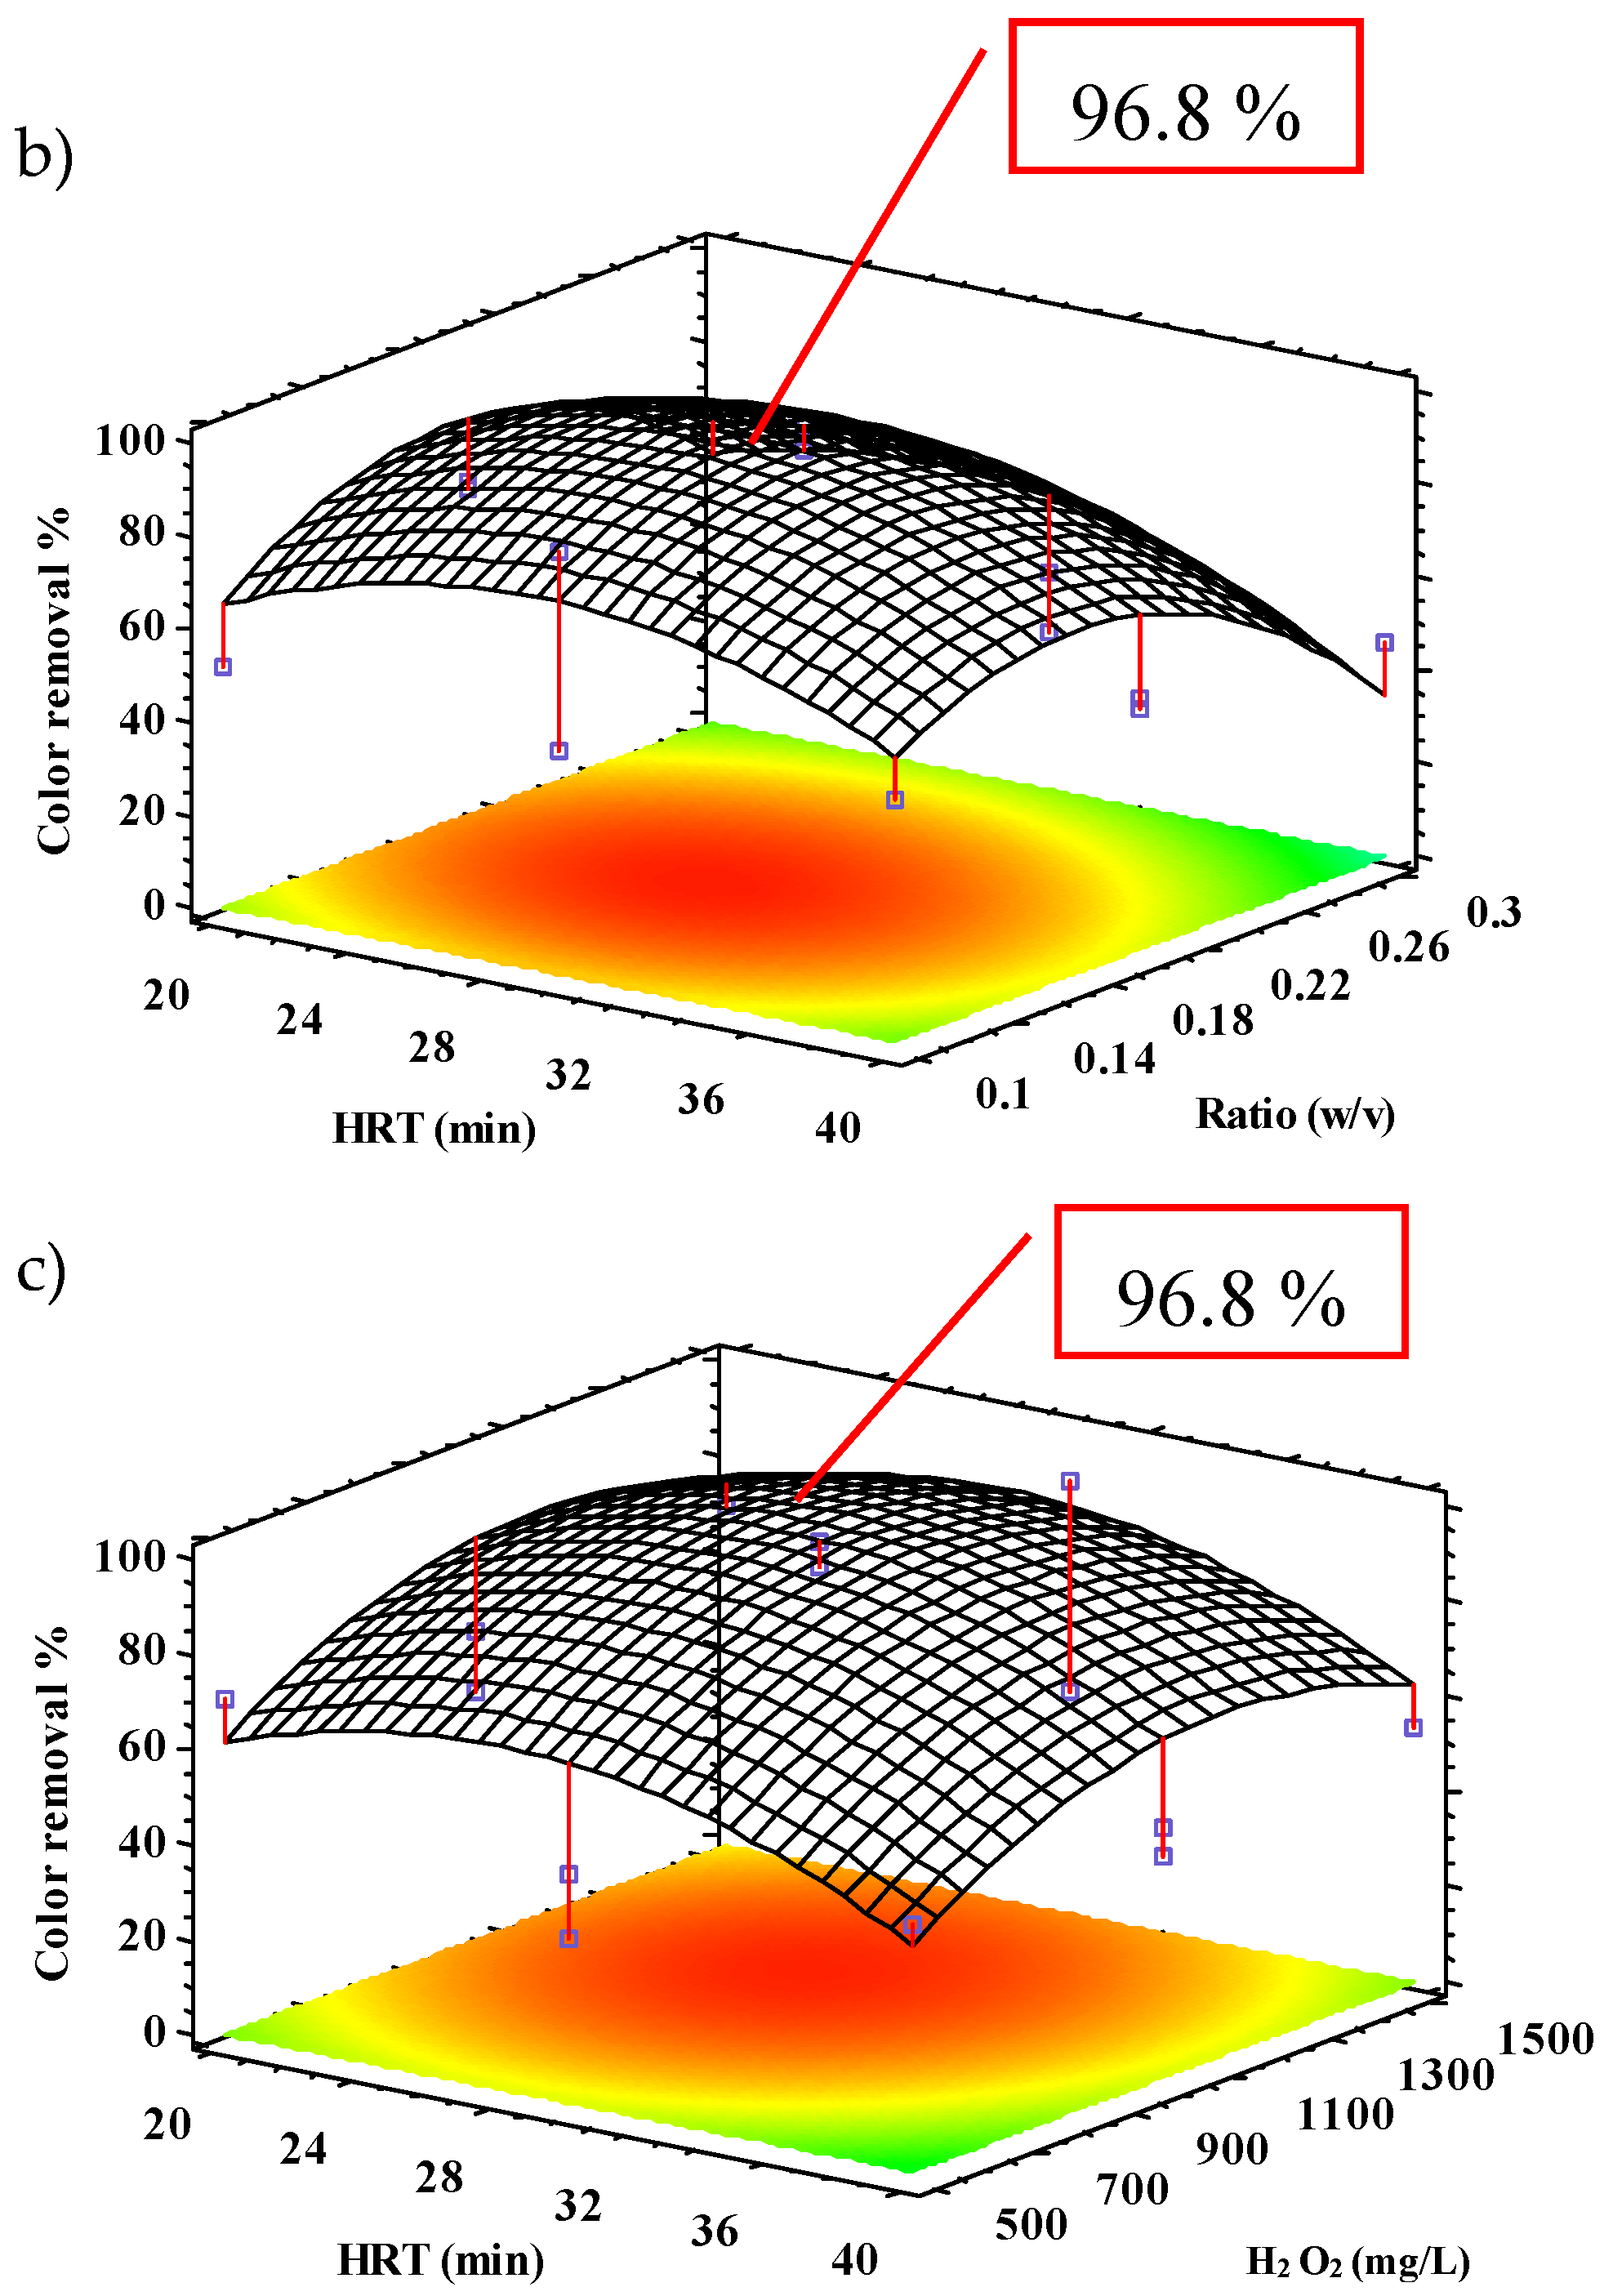
Figure 3.
Response surfaces for % Turbidity removal at optimum operating conditions.
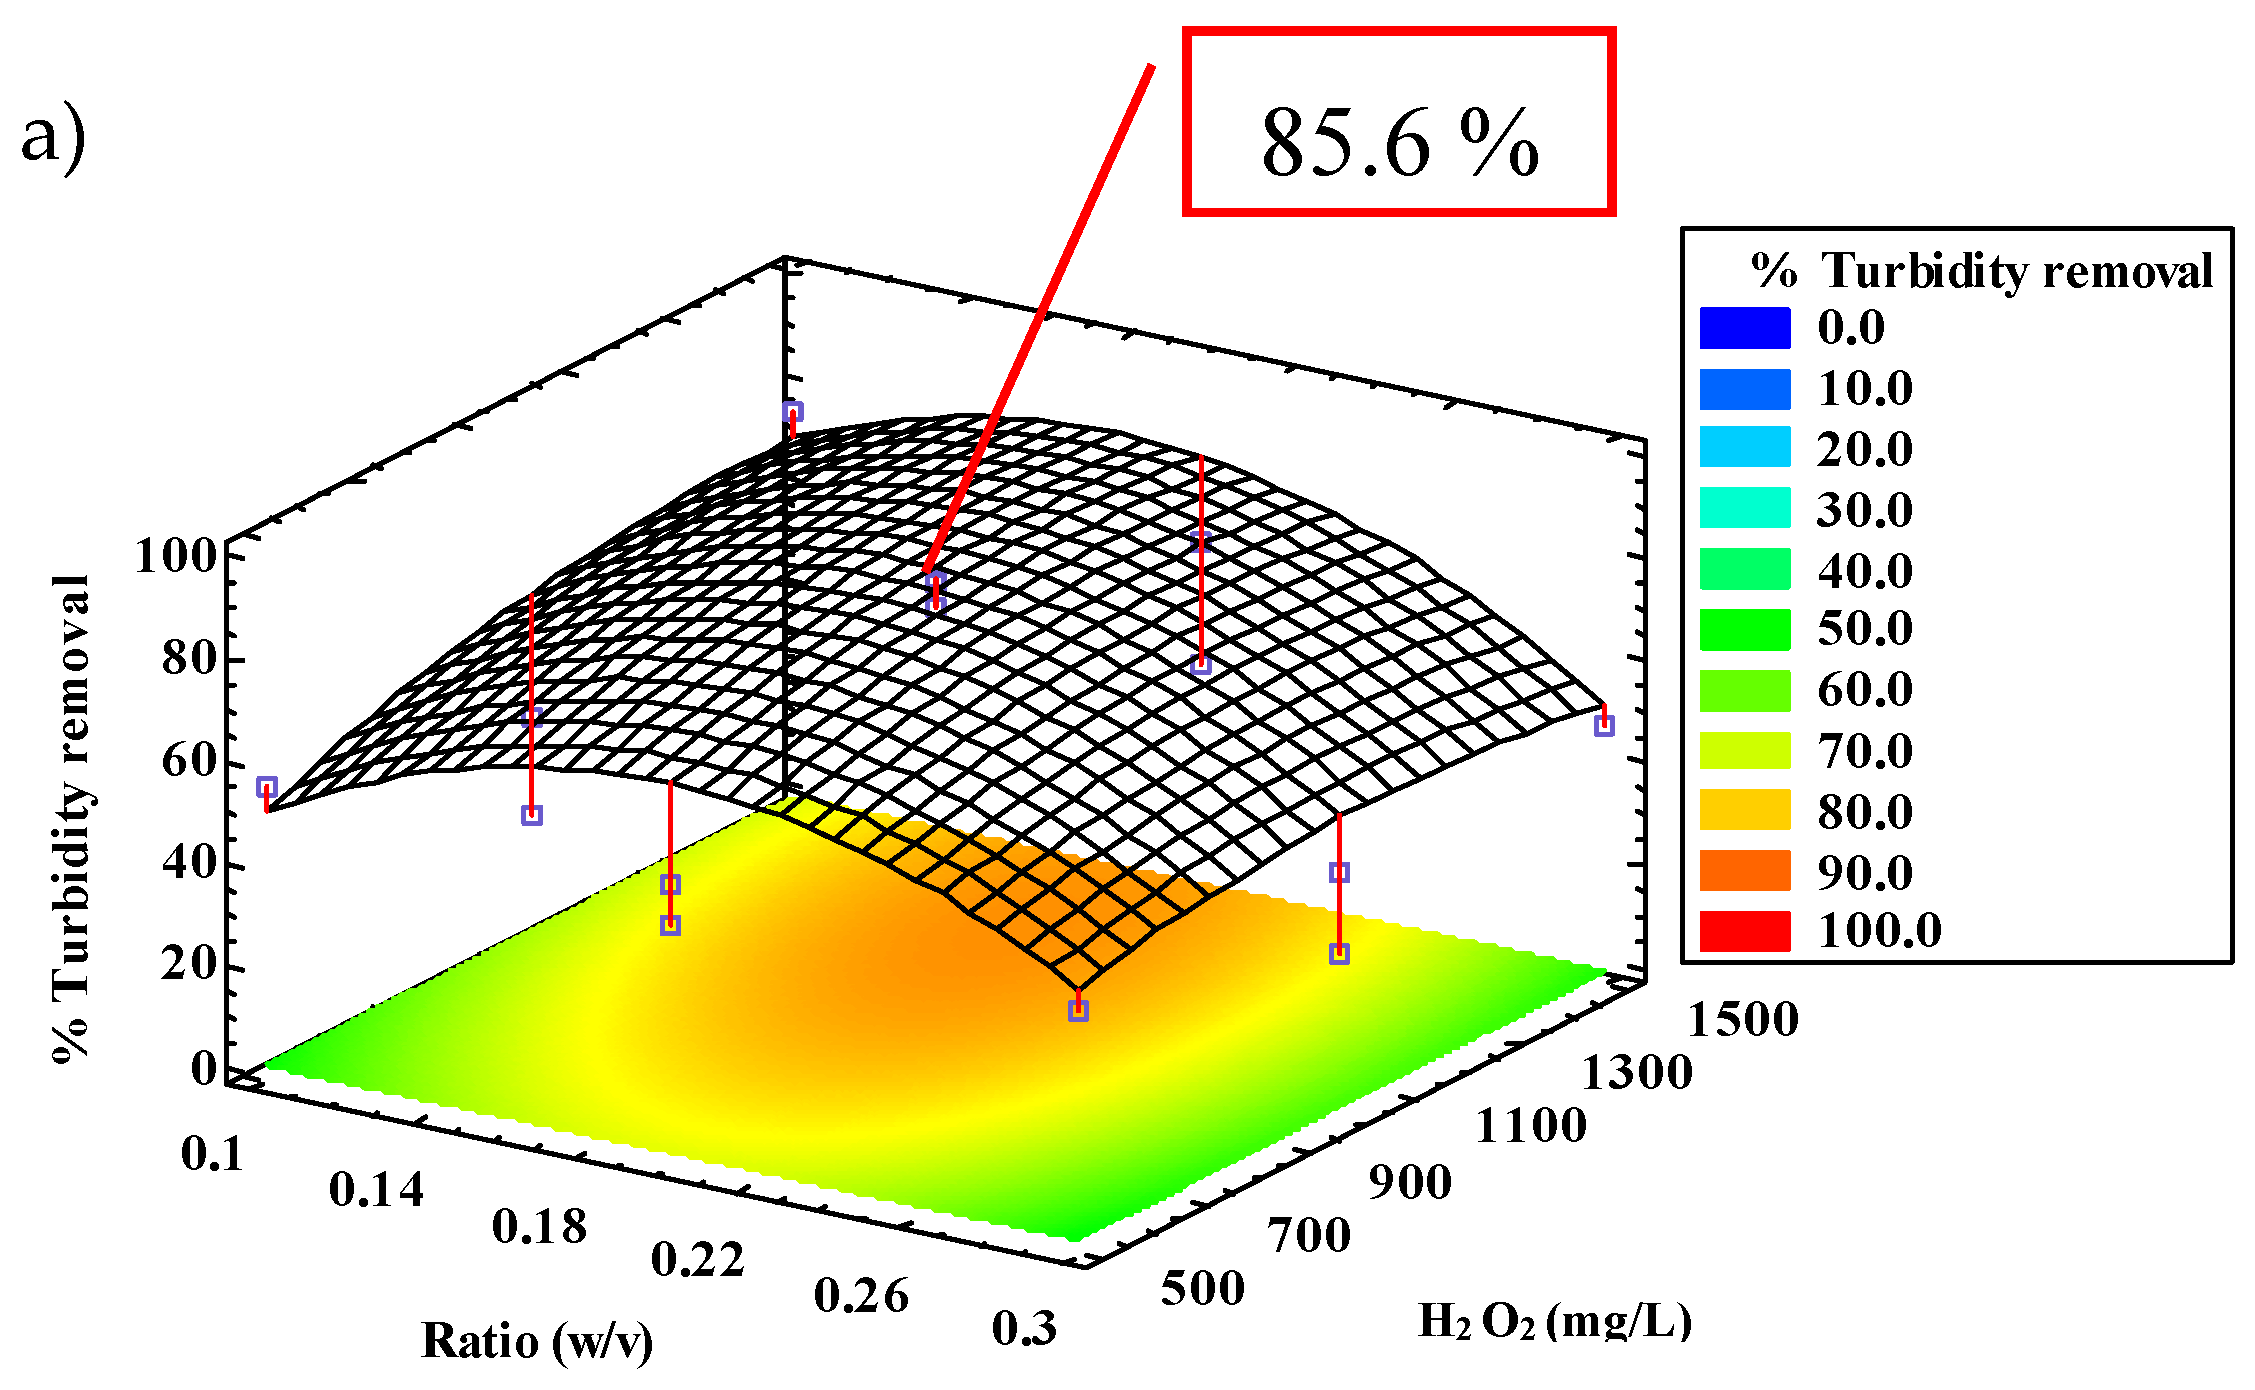
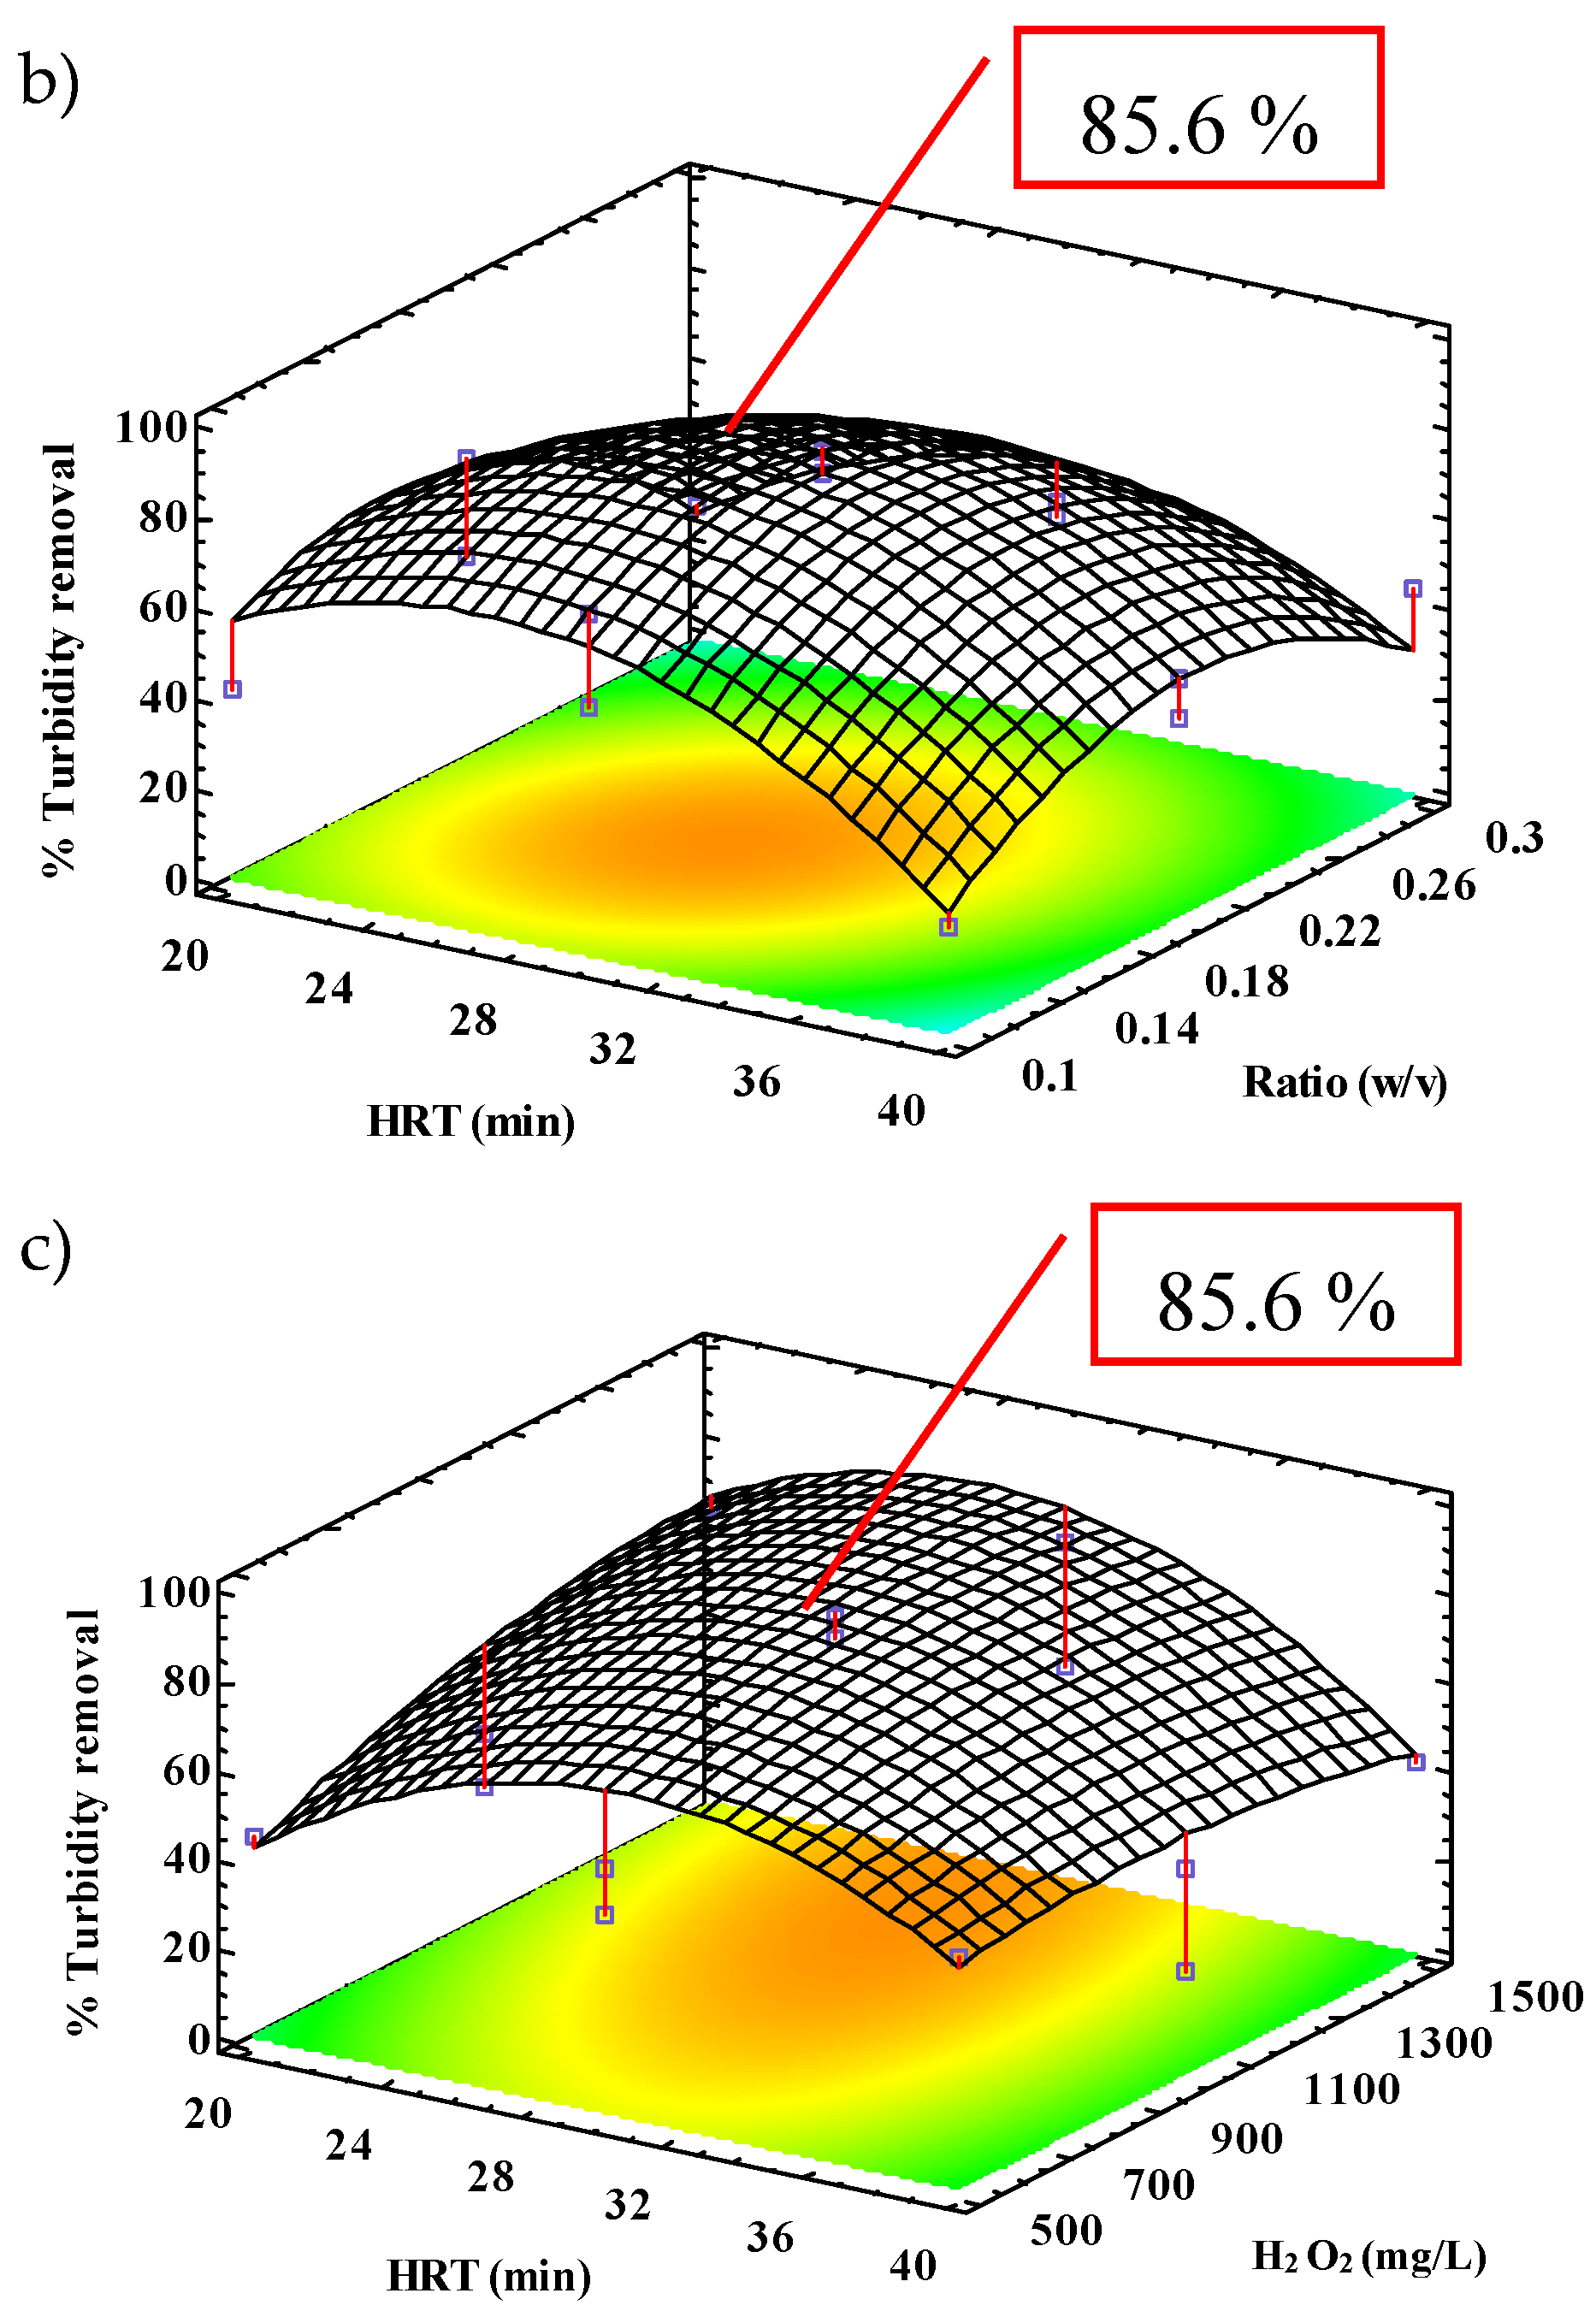
Figure 4.
BMG fitted kinetic model (green line) as a function of COD, color, and turbidity vs. accumulated energy:(•) experimental data and (◦) calculated data, --- the kinetic phases.
Figure 4.
BMG fitted kinetic model (green line) as a function of COD, color, and turbidity vs. accumulated energy:(•) experimental data and (◦) calculated data, --- the kinetic phases.
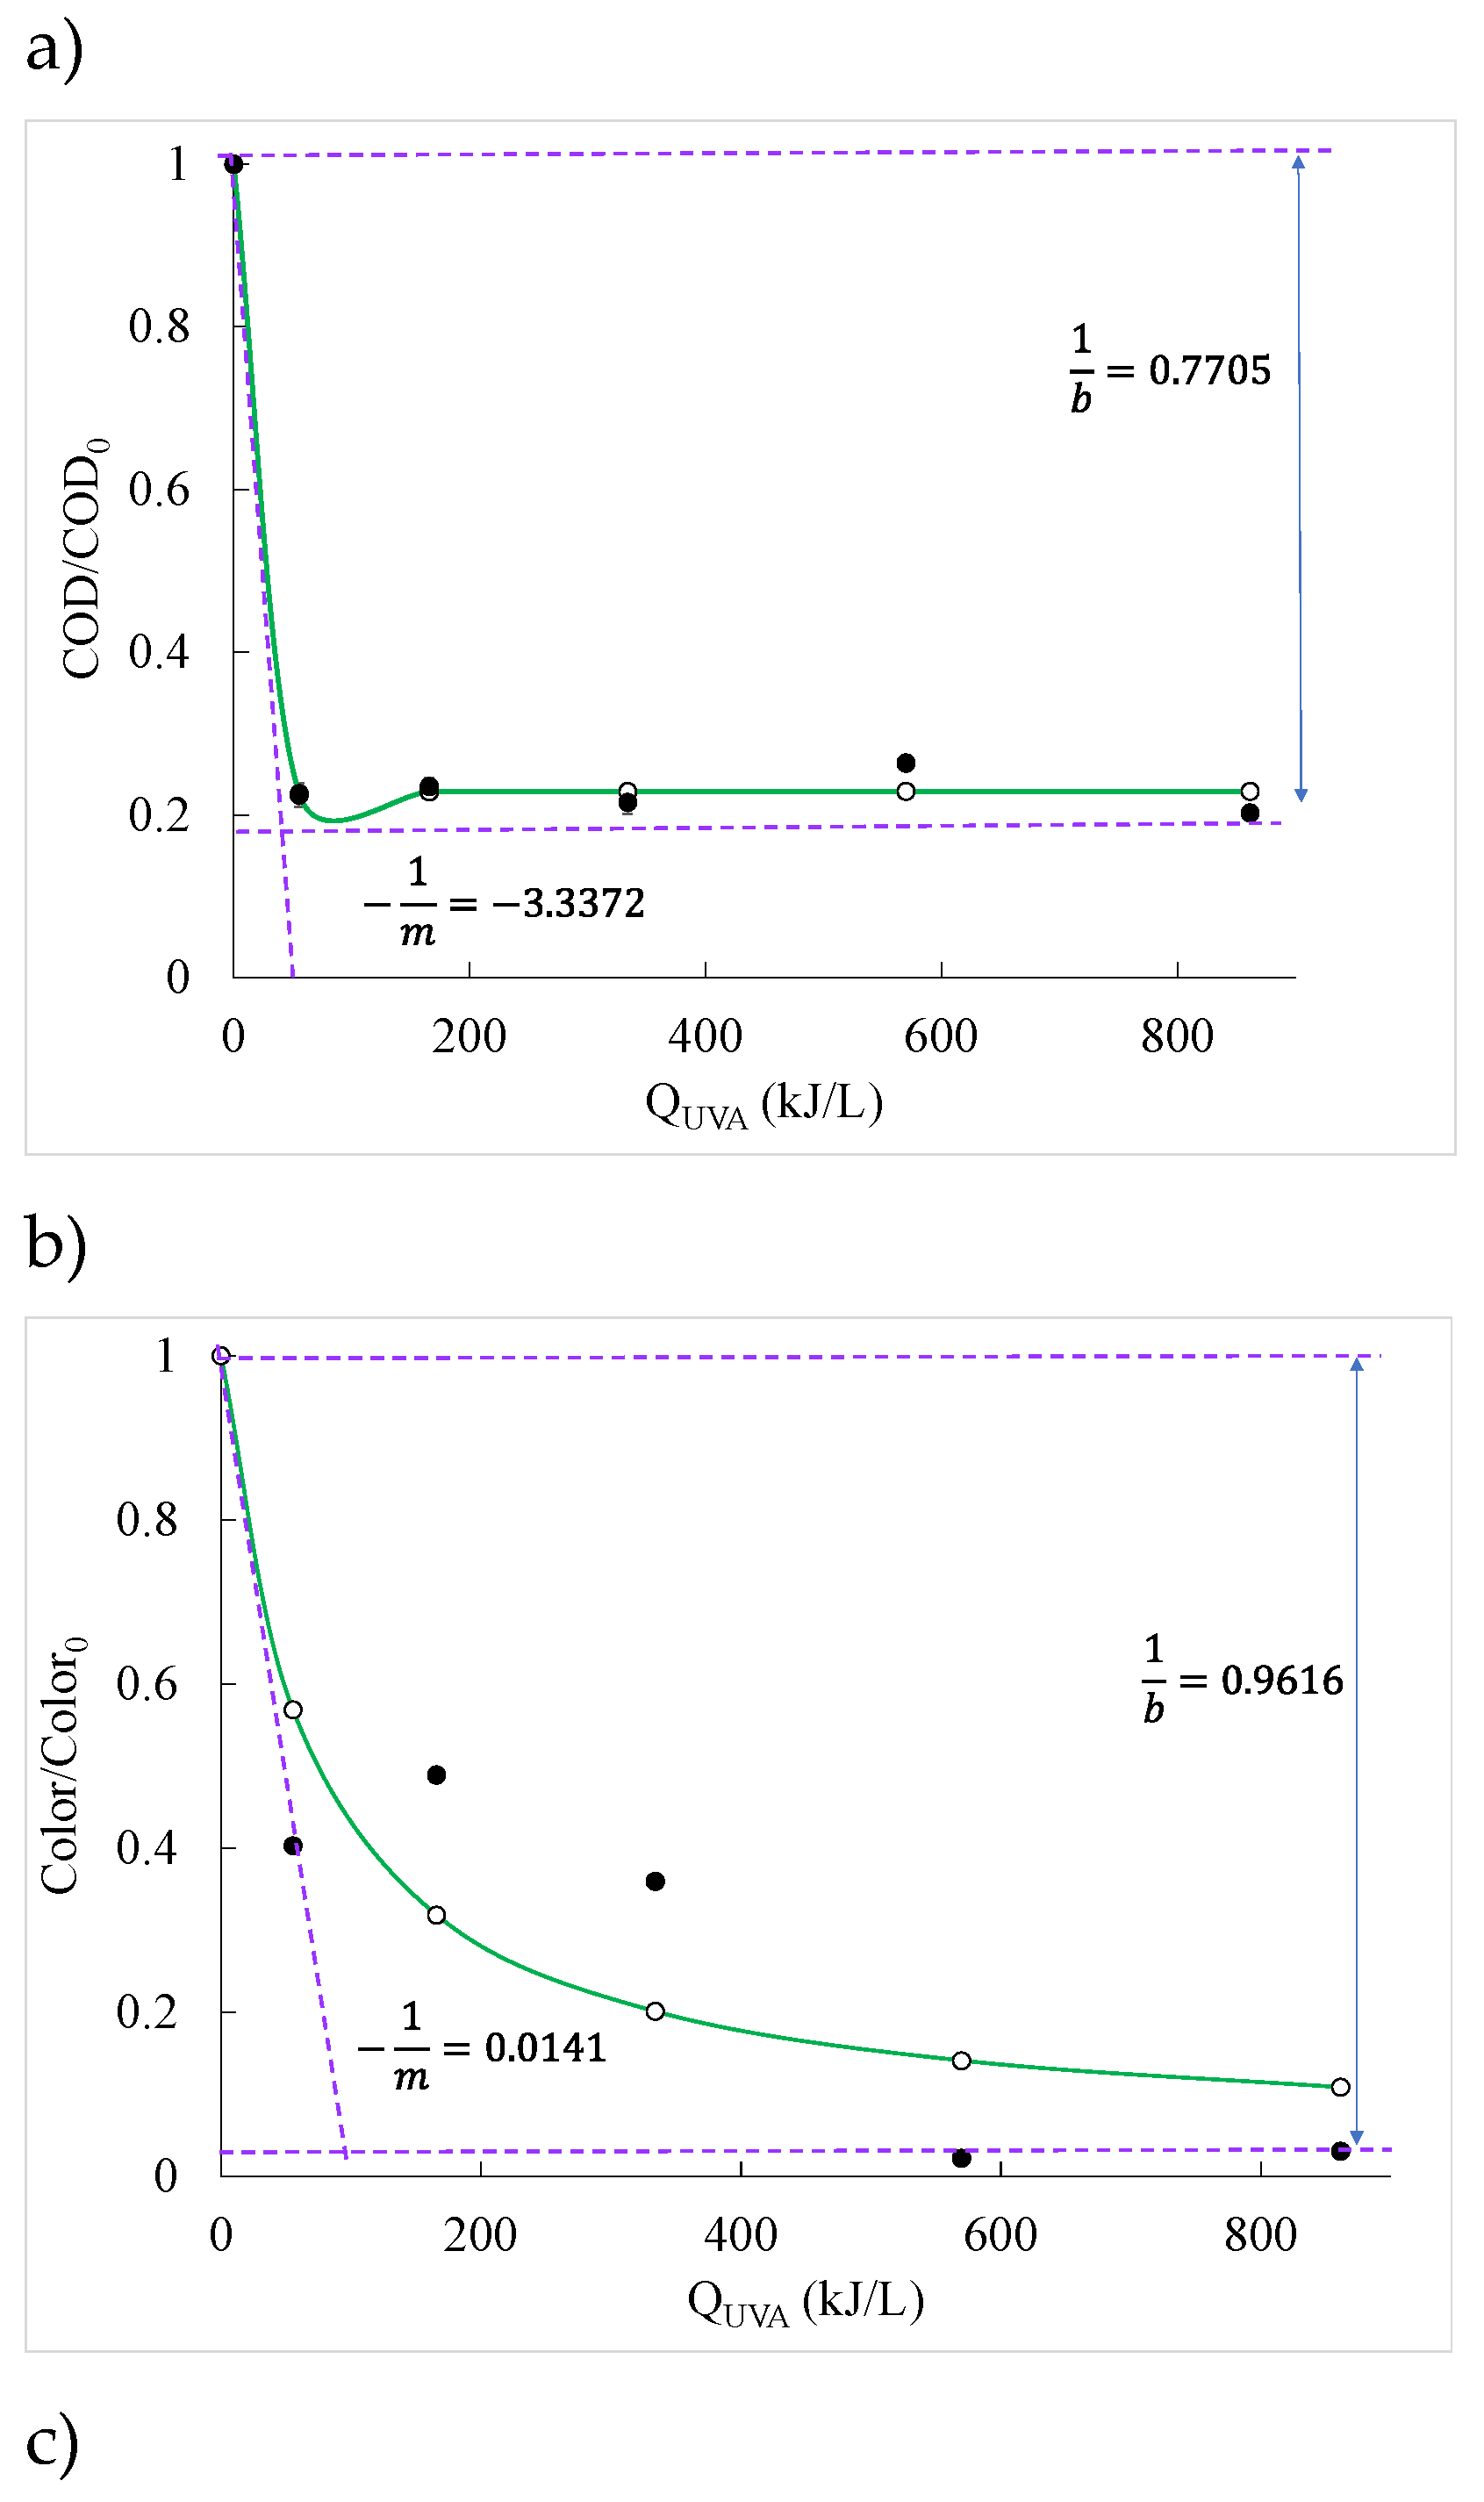
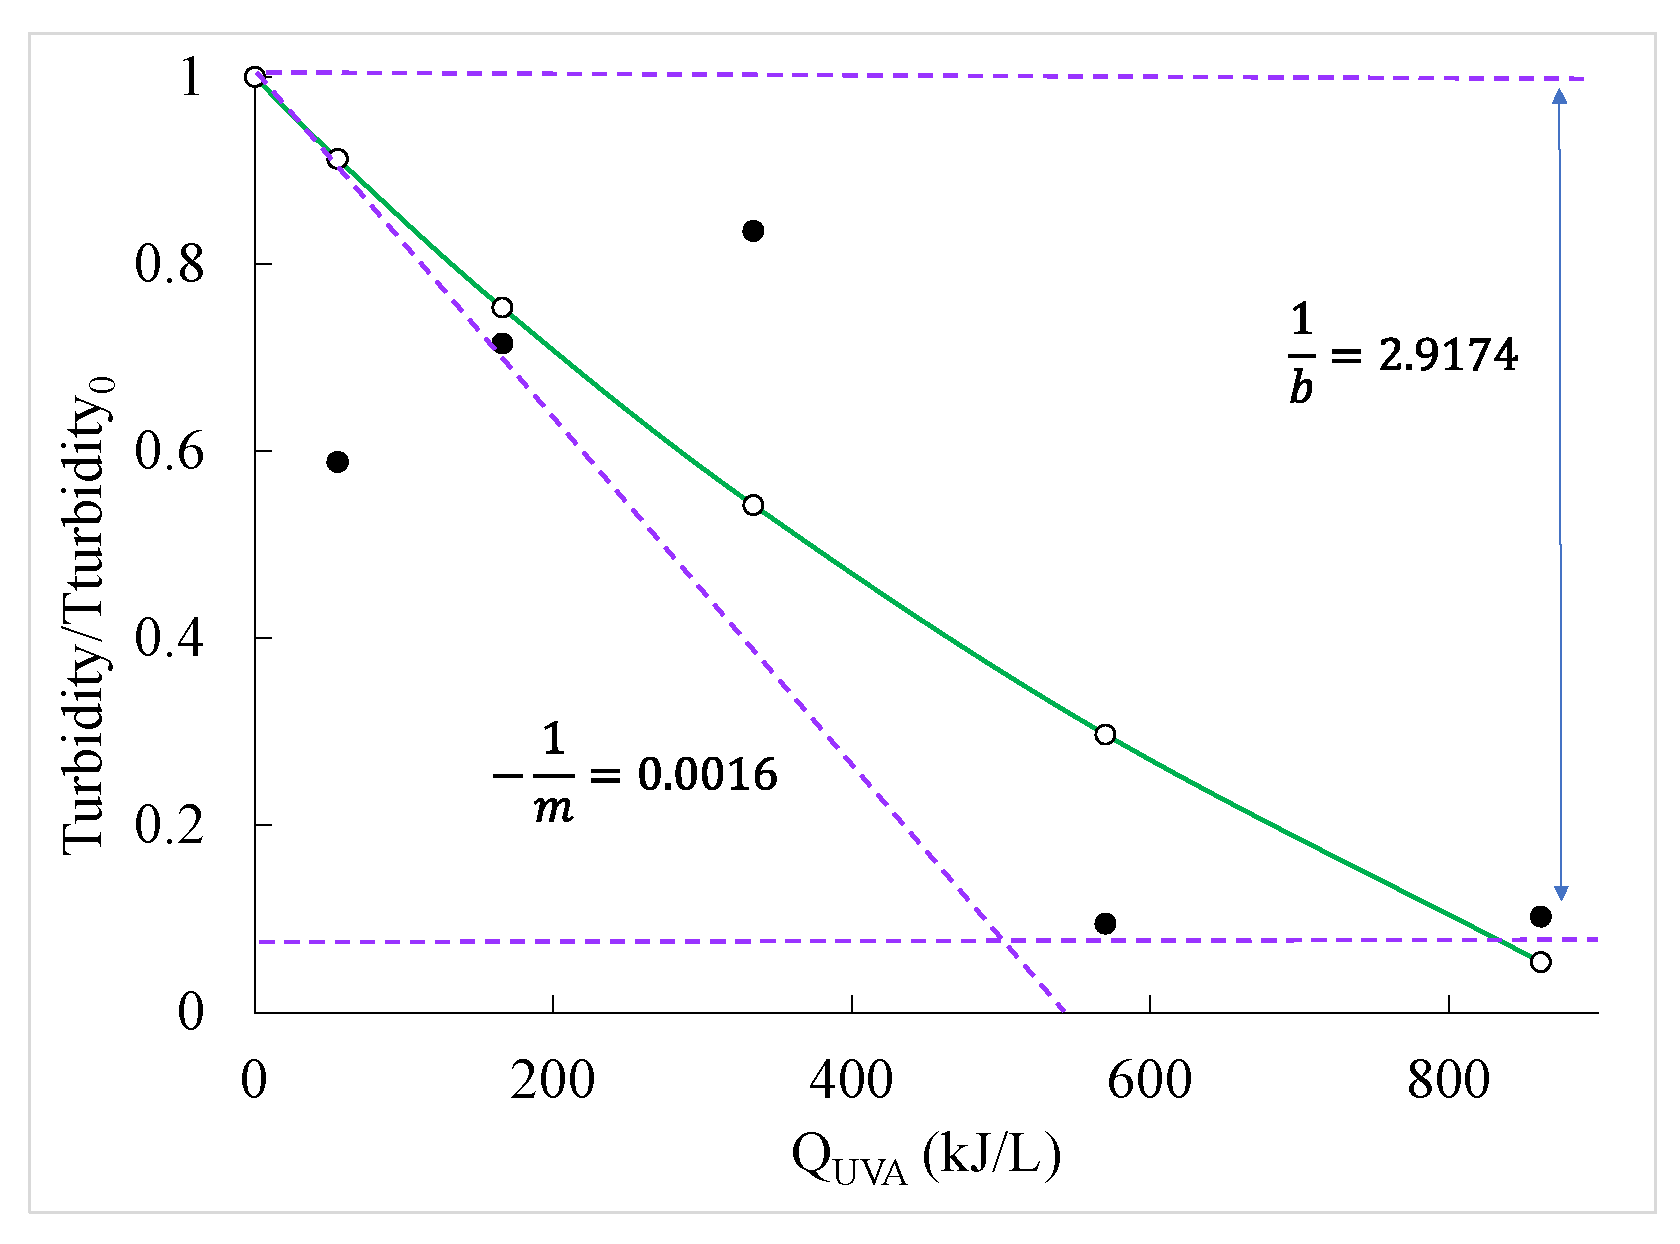
Figure 5.
Efficiency of the SCFr system in the presence and absence of sunlight, operating conditions: HRT of 24.5 min, a ratio of 0.16, and a peroxide dosage of 1006.9 mg/L.
Figure 5.
Efficiency of the SCFr system in the presence and absence of sunlight, operating conditions: HRT of 24.5 min, a ratio of 0.16, and a peroxide dosage of 1006.9 mg/L.
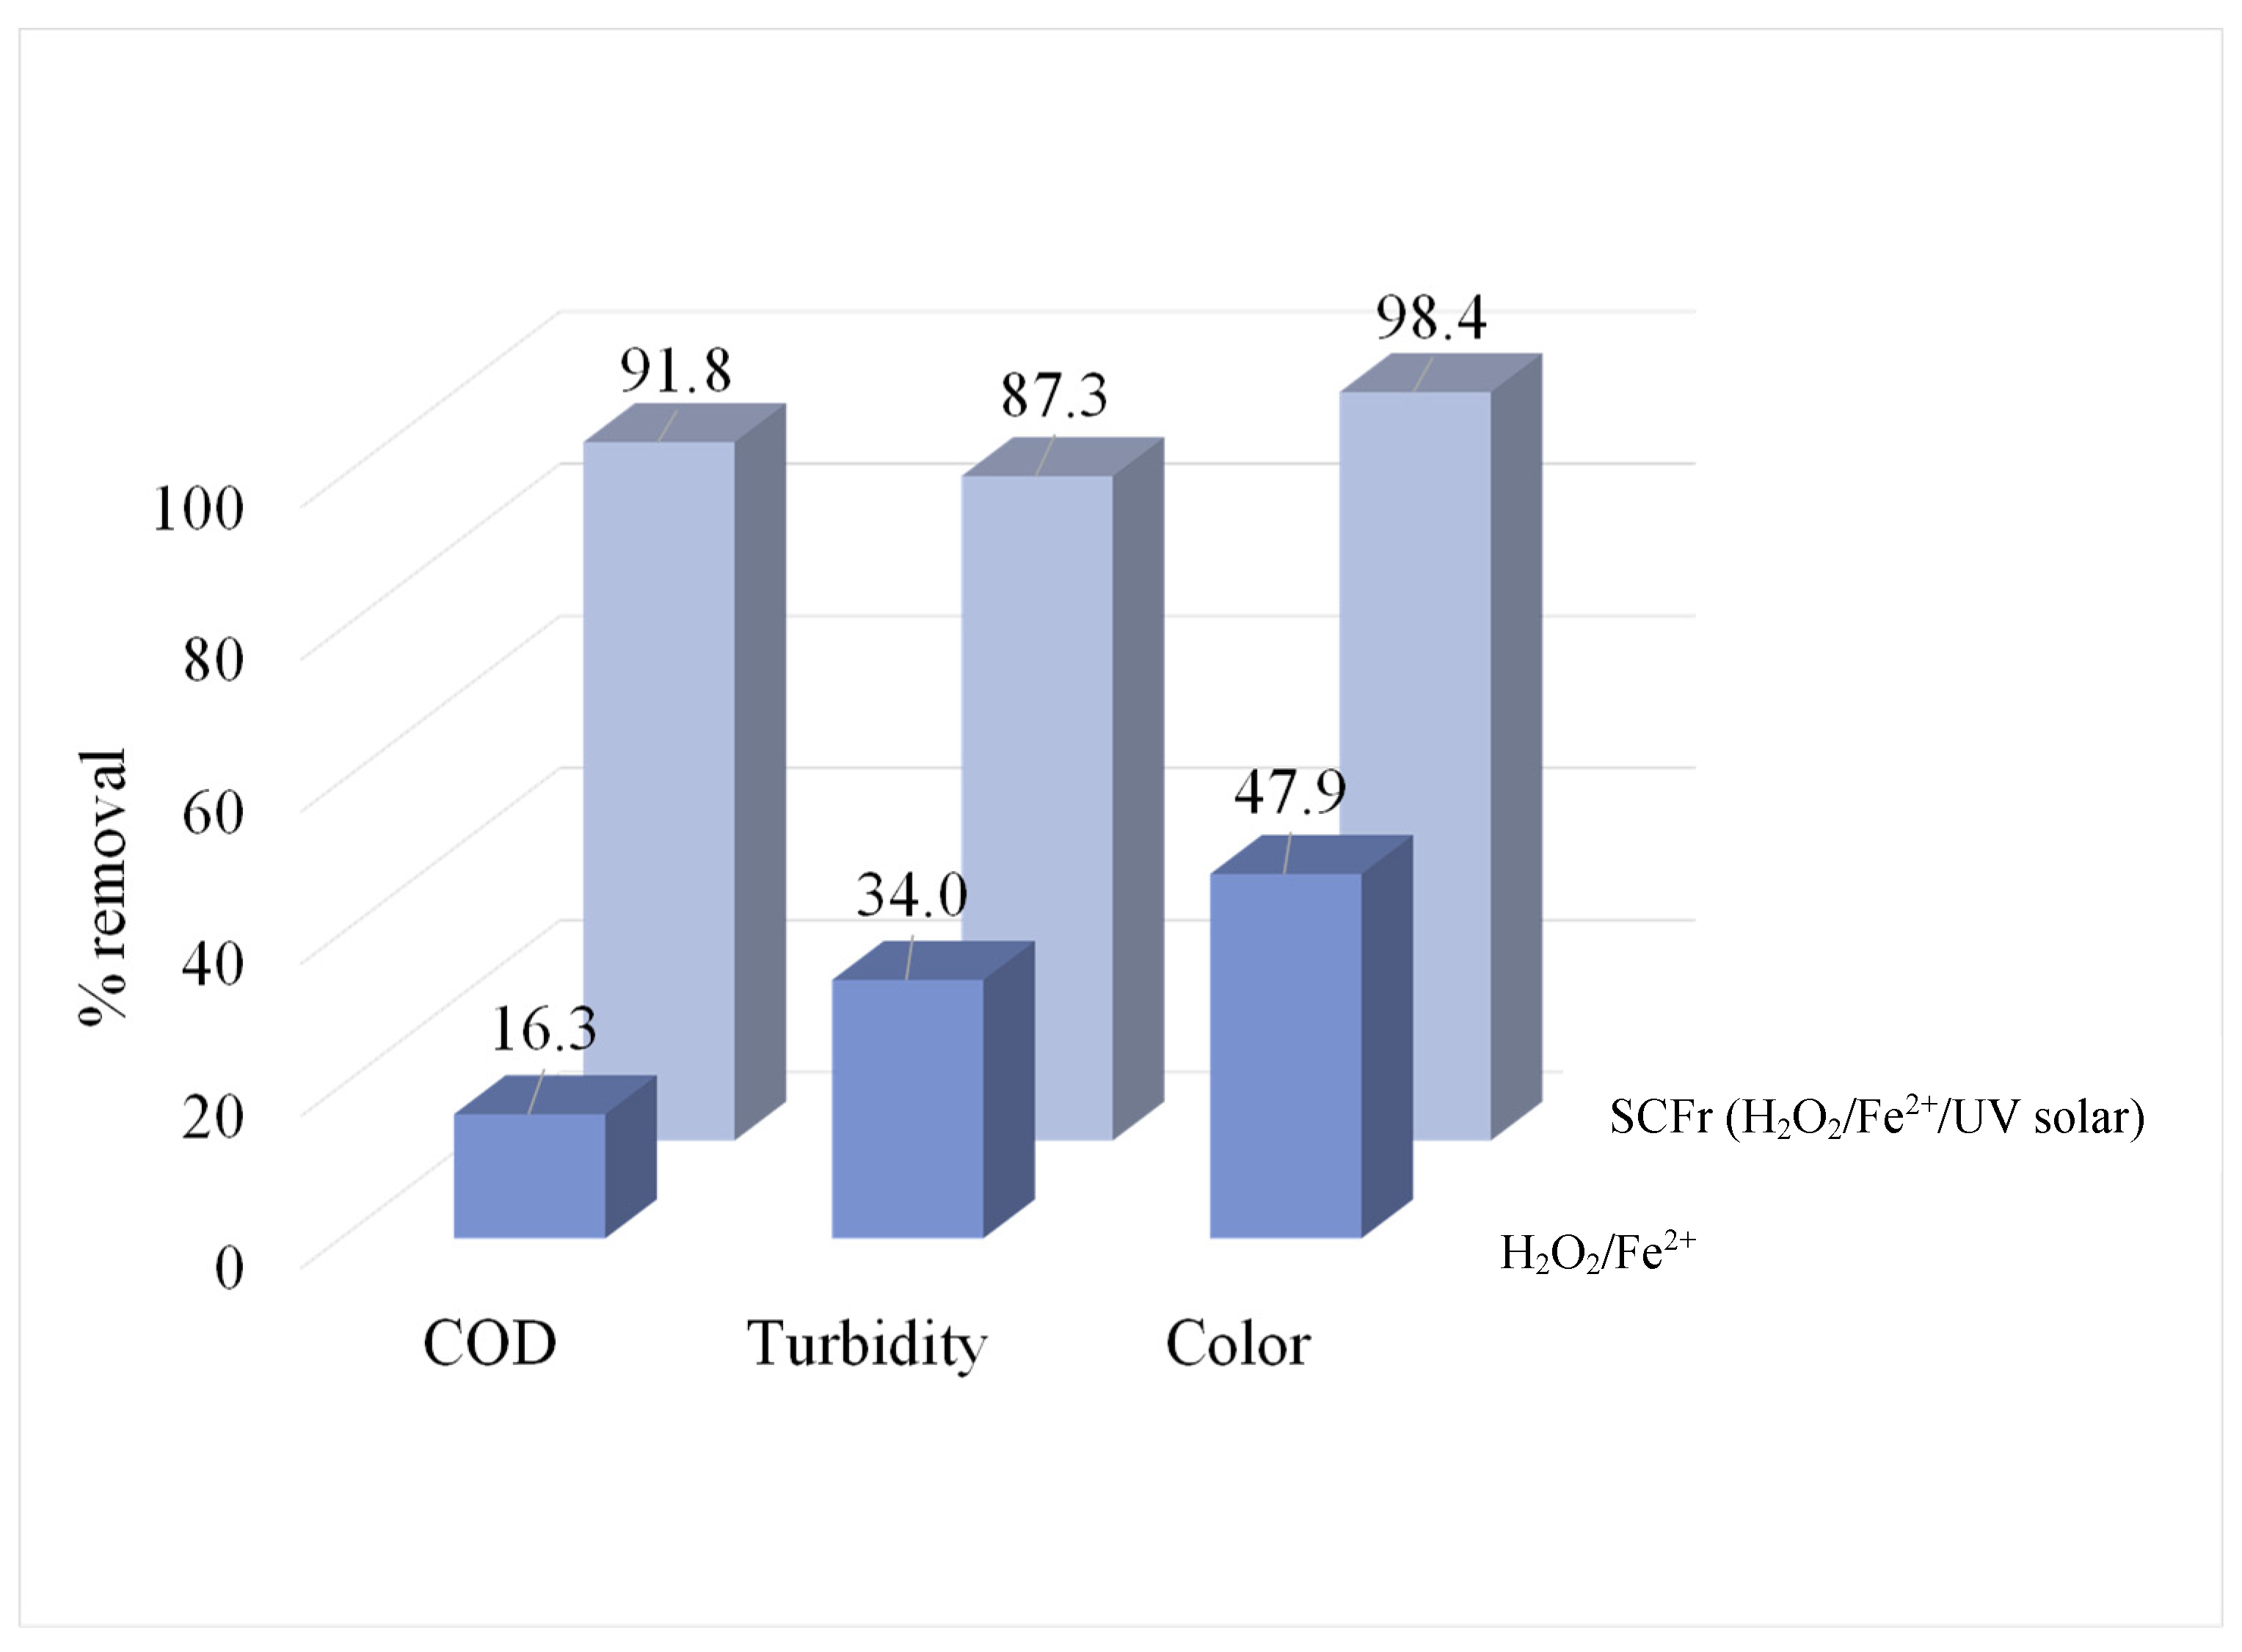
Figure 6.
Effect of light, pH, temperature, and solar radiation on Fe2+ release and oxide formation at HRT 24.6 min, 0.16 ratio and without a dose of H2O2. Values with the same letter do not significantly differ (a, b, c, and d), Tukey test (p < 0.05).
Figure 6.
Effect of light, pH, temperature, and solar radiation on Fe2+ release and oxide formation at HRT 24.6 min, 0.16 ratio and without a dose of H2O2. Values with the same letter do not significantly differ (a, b, c, and d), Tukey test (p < 0.05).
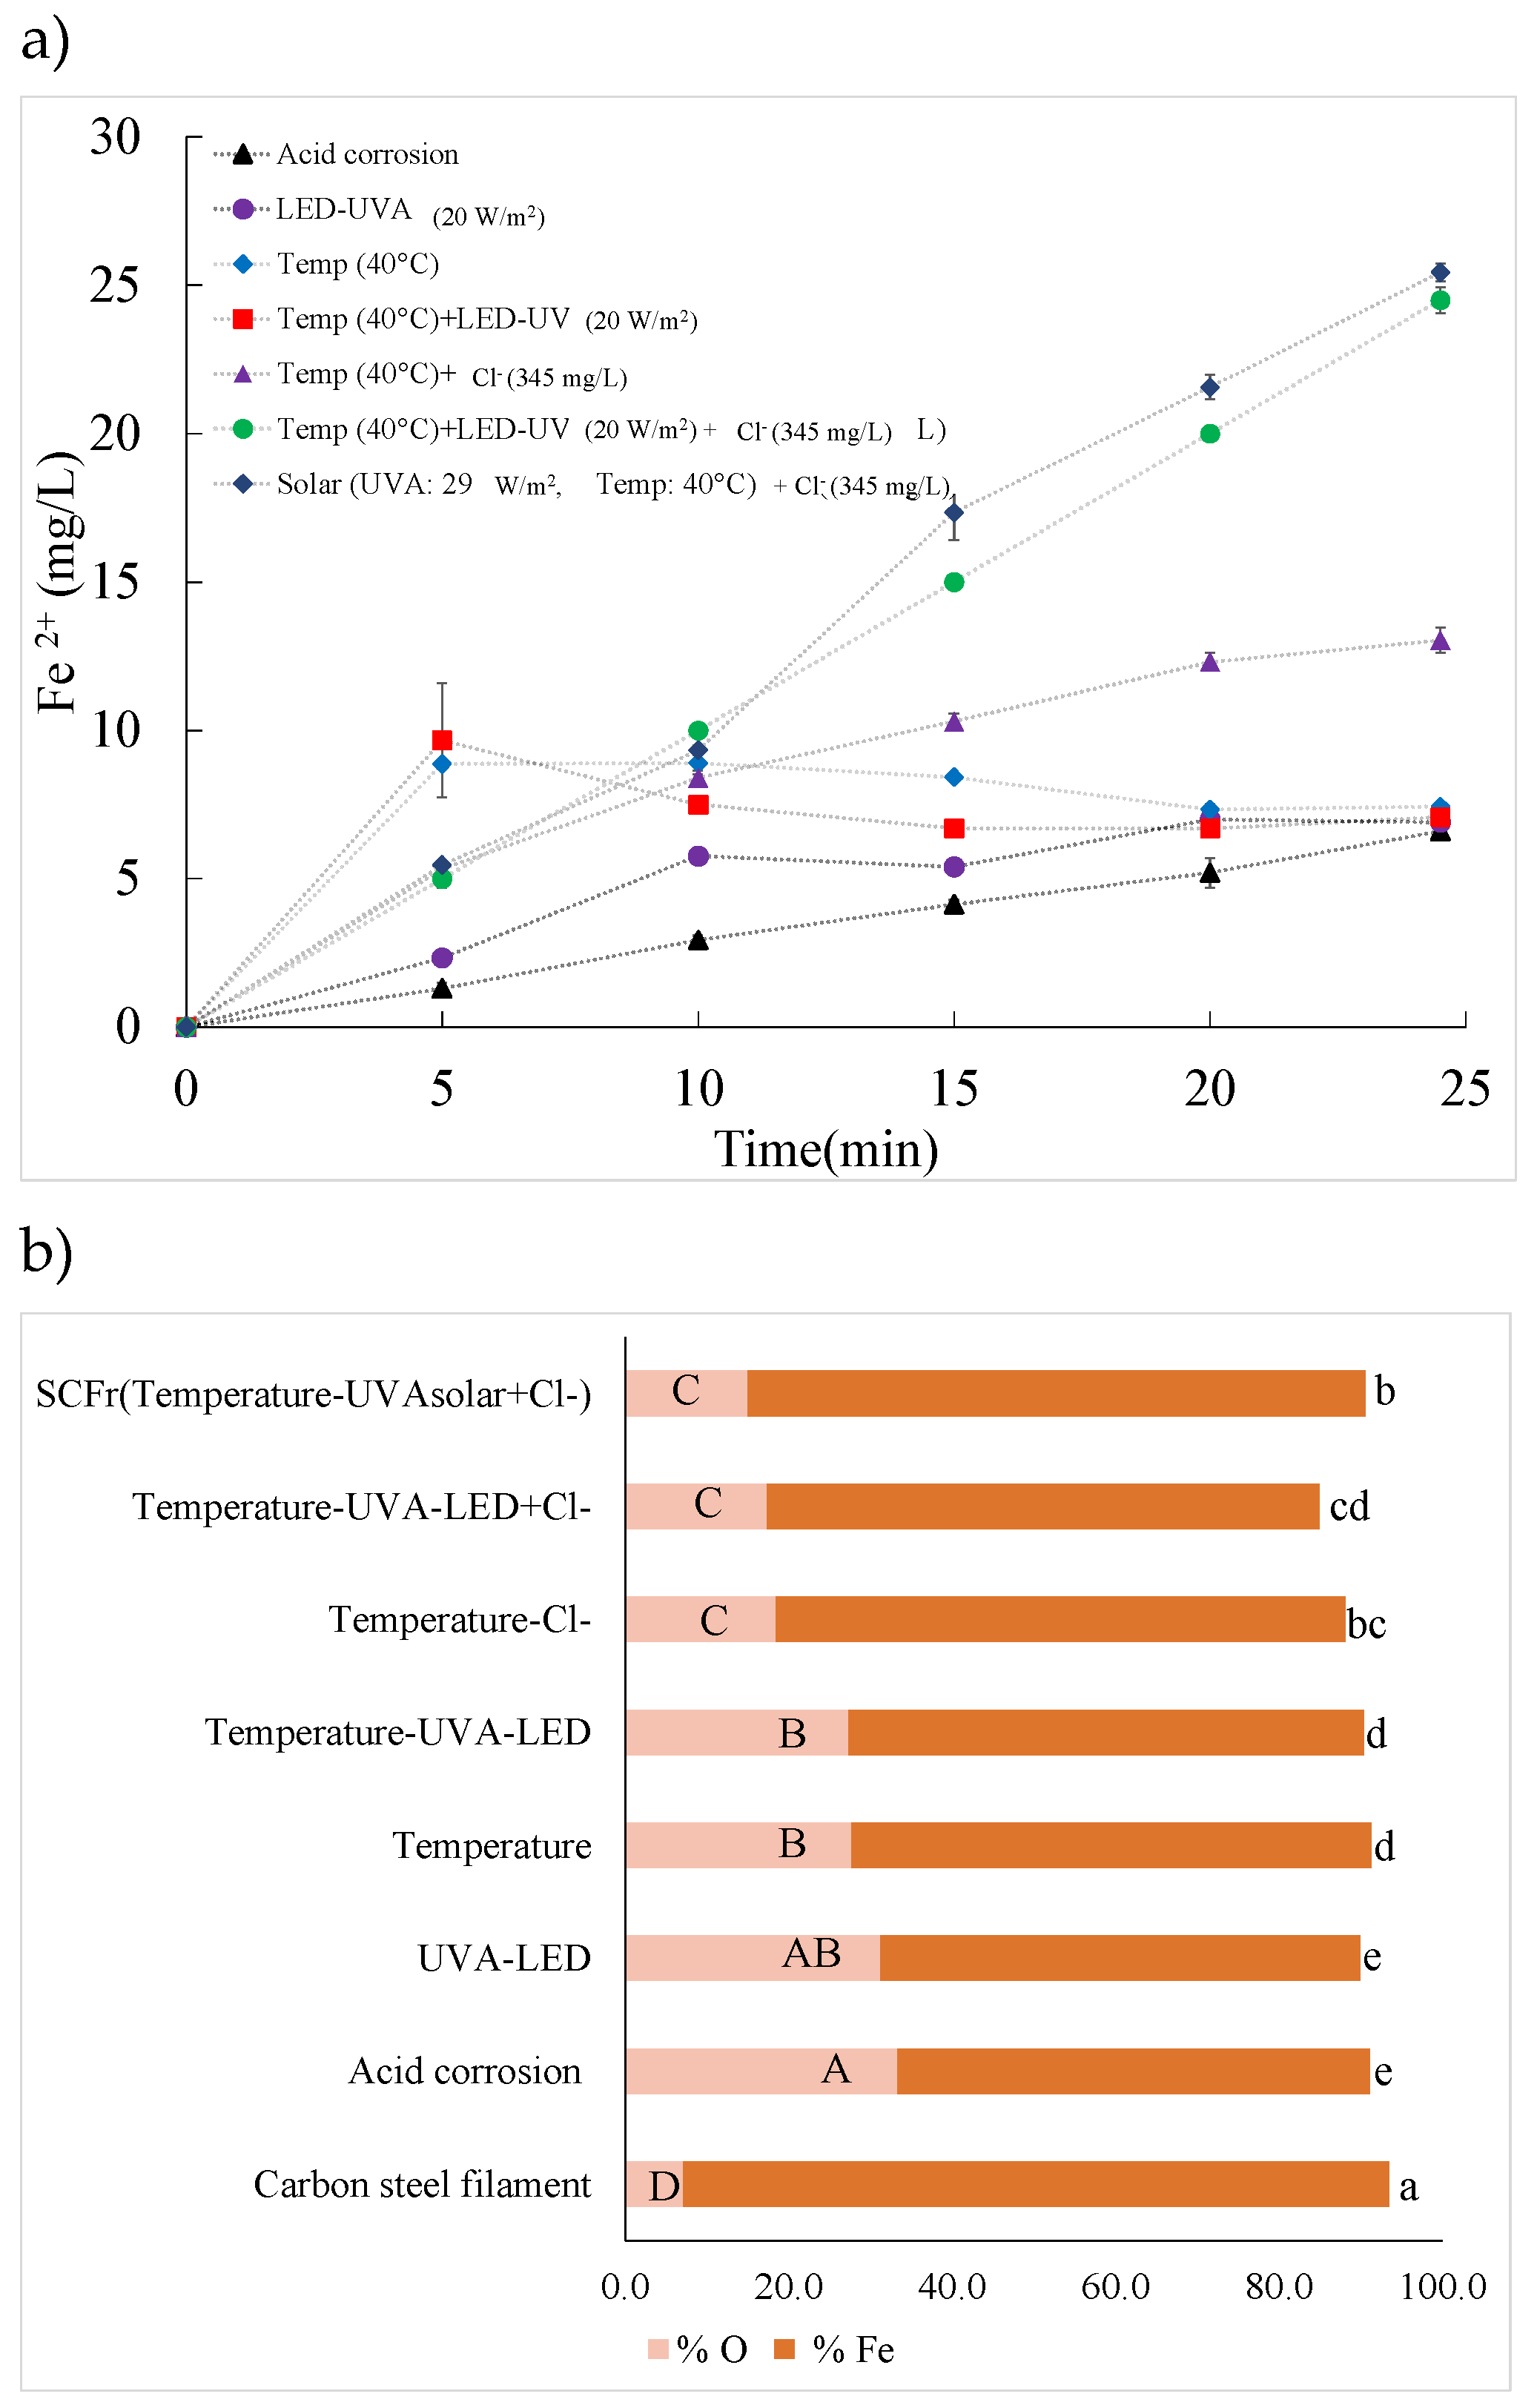
Figure 7.
SEM micrographs of carbon steel strands packed in the SCFr: a) carbon steel filament (without treatment), b) acid corrosion, c) UVA-LED, d) Temperature, e) Temperature-UVA-LED, f) Temperature-Cl-, g) Temperature-UVA-LED+Cl-, and h) SCFr (Temperature-UVA Solar+Cl-).
Figure 7.
SEM micrographs of carbon steel strands packed in the SCFr: a) carbon steel filament (without treatment), b) acid corrosion, c) UVA-LED, d) Temperature, e) Temperature-UVA-LED, f) Temperature-Cl-, g) Temperature-UVA-LED+Cl-, and h) SCFr (Temperature-UVA Solar+Cl-).
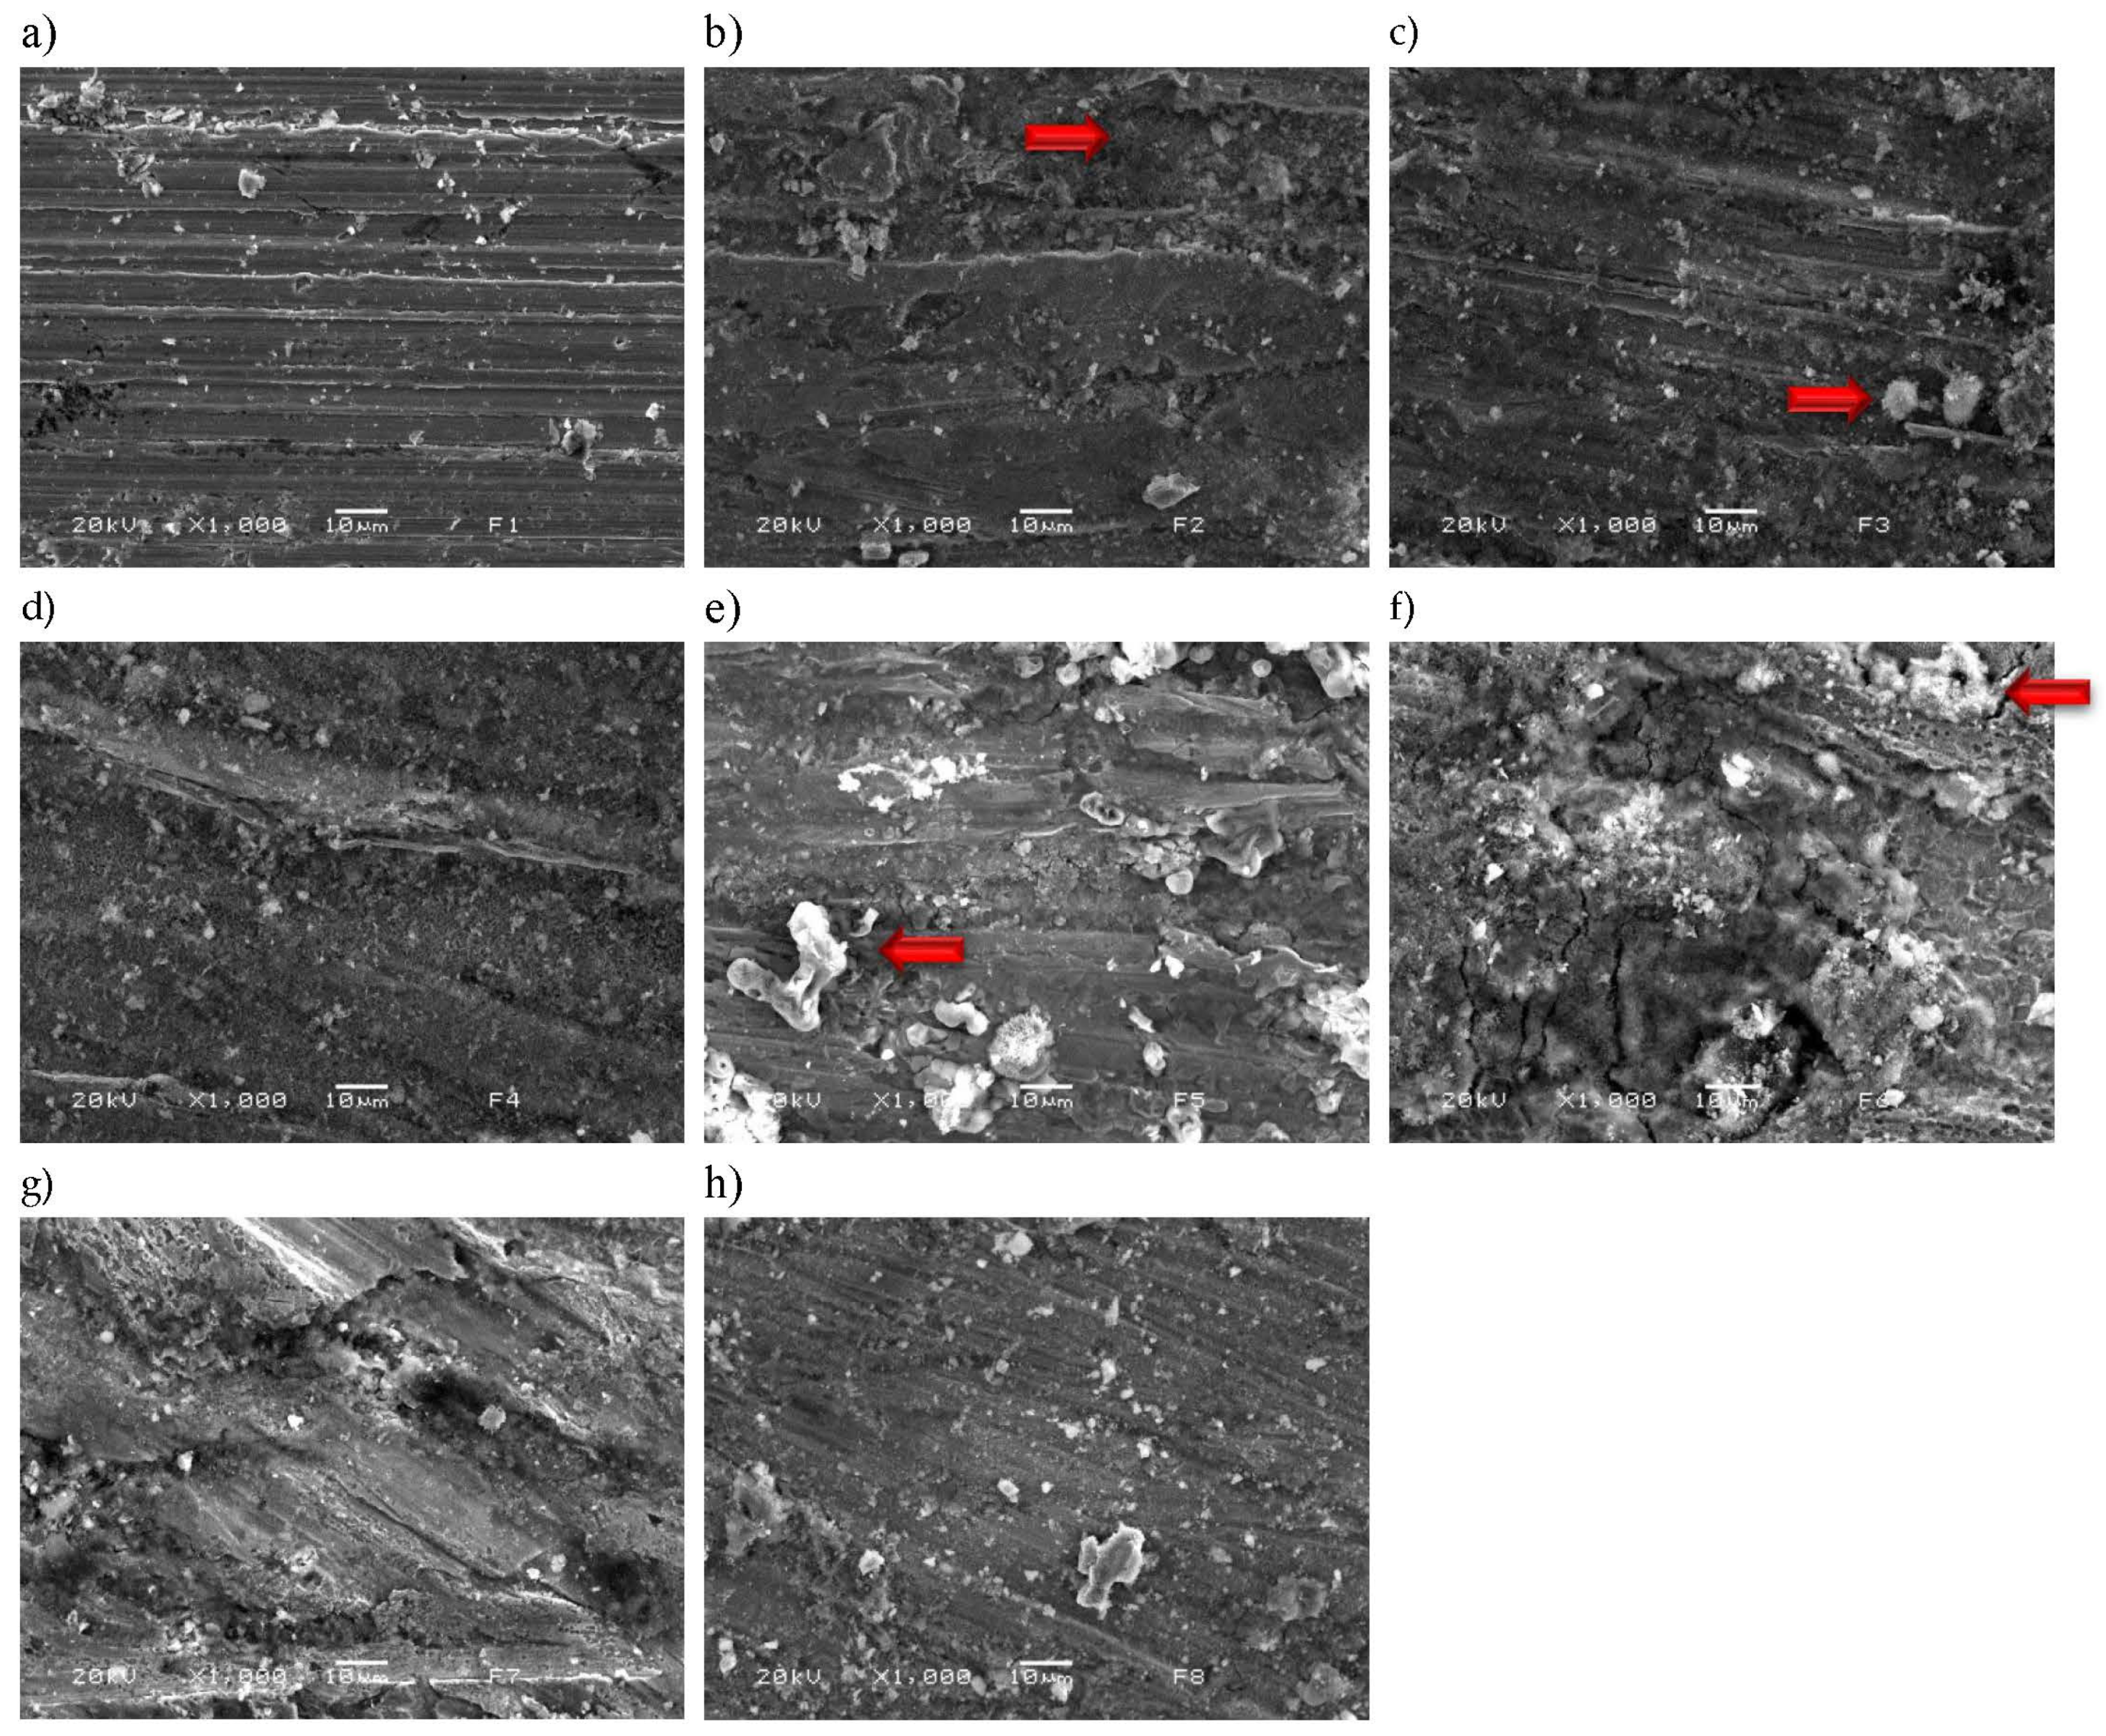
Figure 8.
System of SCFr: a) influent, b) peroxide feed, c) SCFr, d) Mirosun® films, e) carbon steel filament, f) Kimax® borosilicate tube, g) thermocouple, and h) effluent.
Figure 8.
System of SCFr: a) influent, b) peroxide feed, c) SCFr, d) Mirosun® films, e) carbon steel filament, f) Kimax® borosilicate tube, g) thermocouple, and h) effluent.
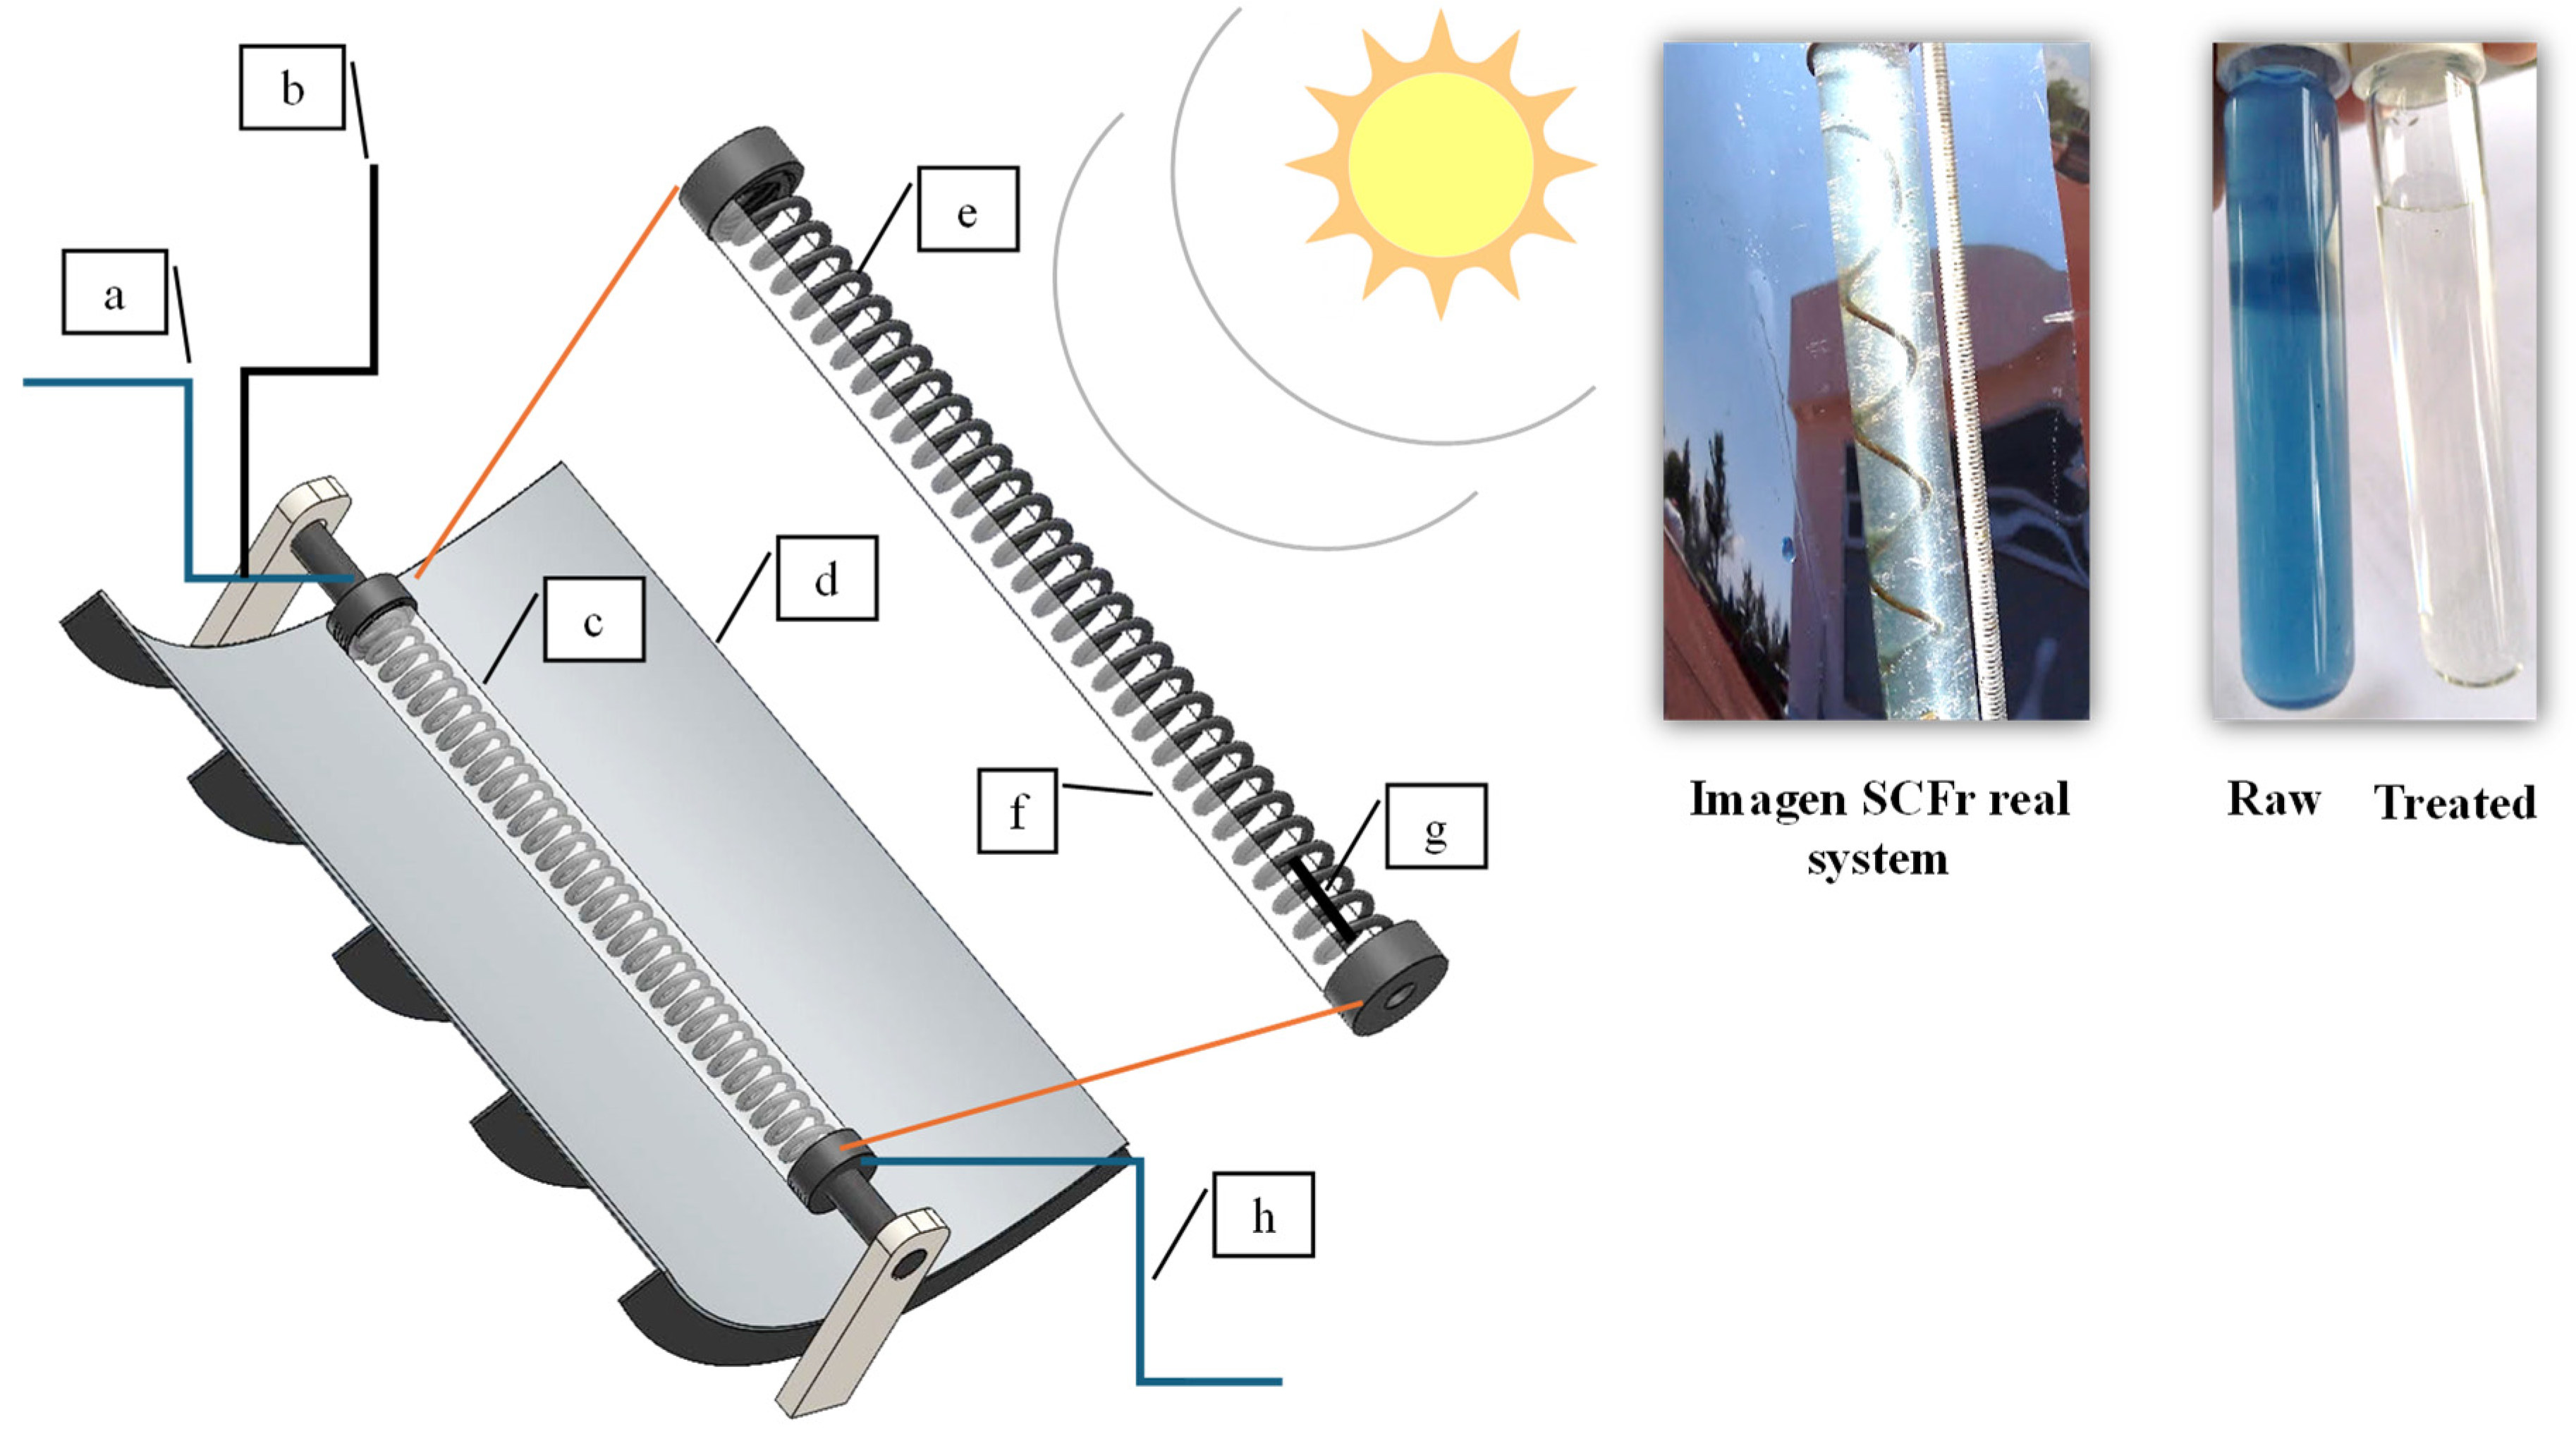
Figure 9.
The experimental values and level of independent variables a) and b) special distribution of the points of the experimental matrix for 3 factors, * central point, ■ factorial point.
Figure 9.
The experimental values and level of independent variables a) and b) special distribution of the points of the experimental matrix for 3 factors, * central point, ■ factorial point.
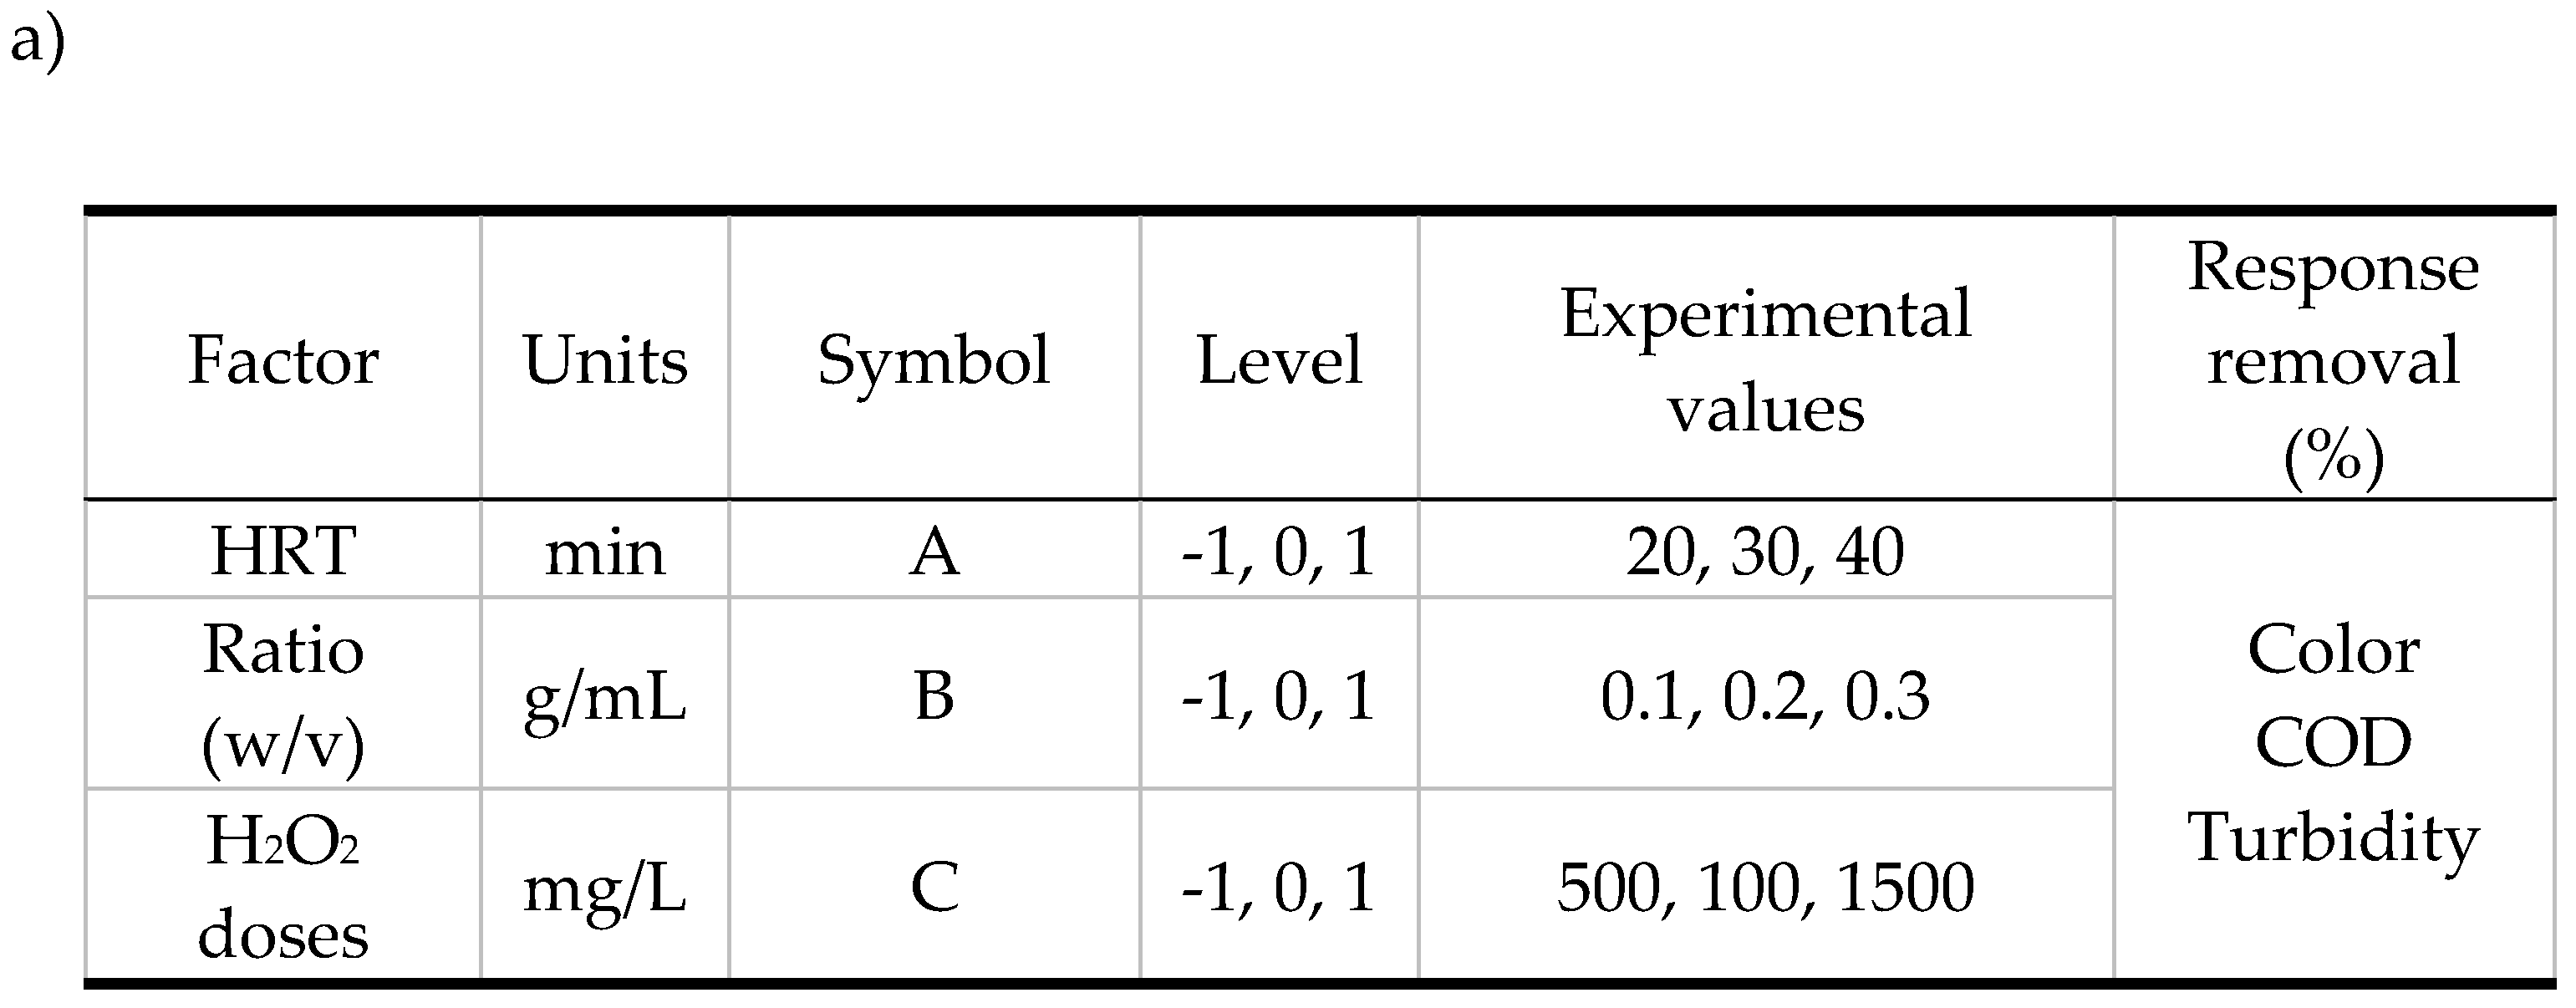
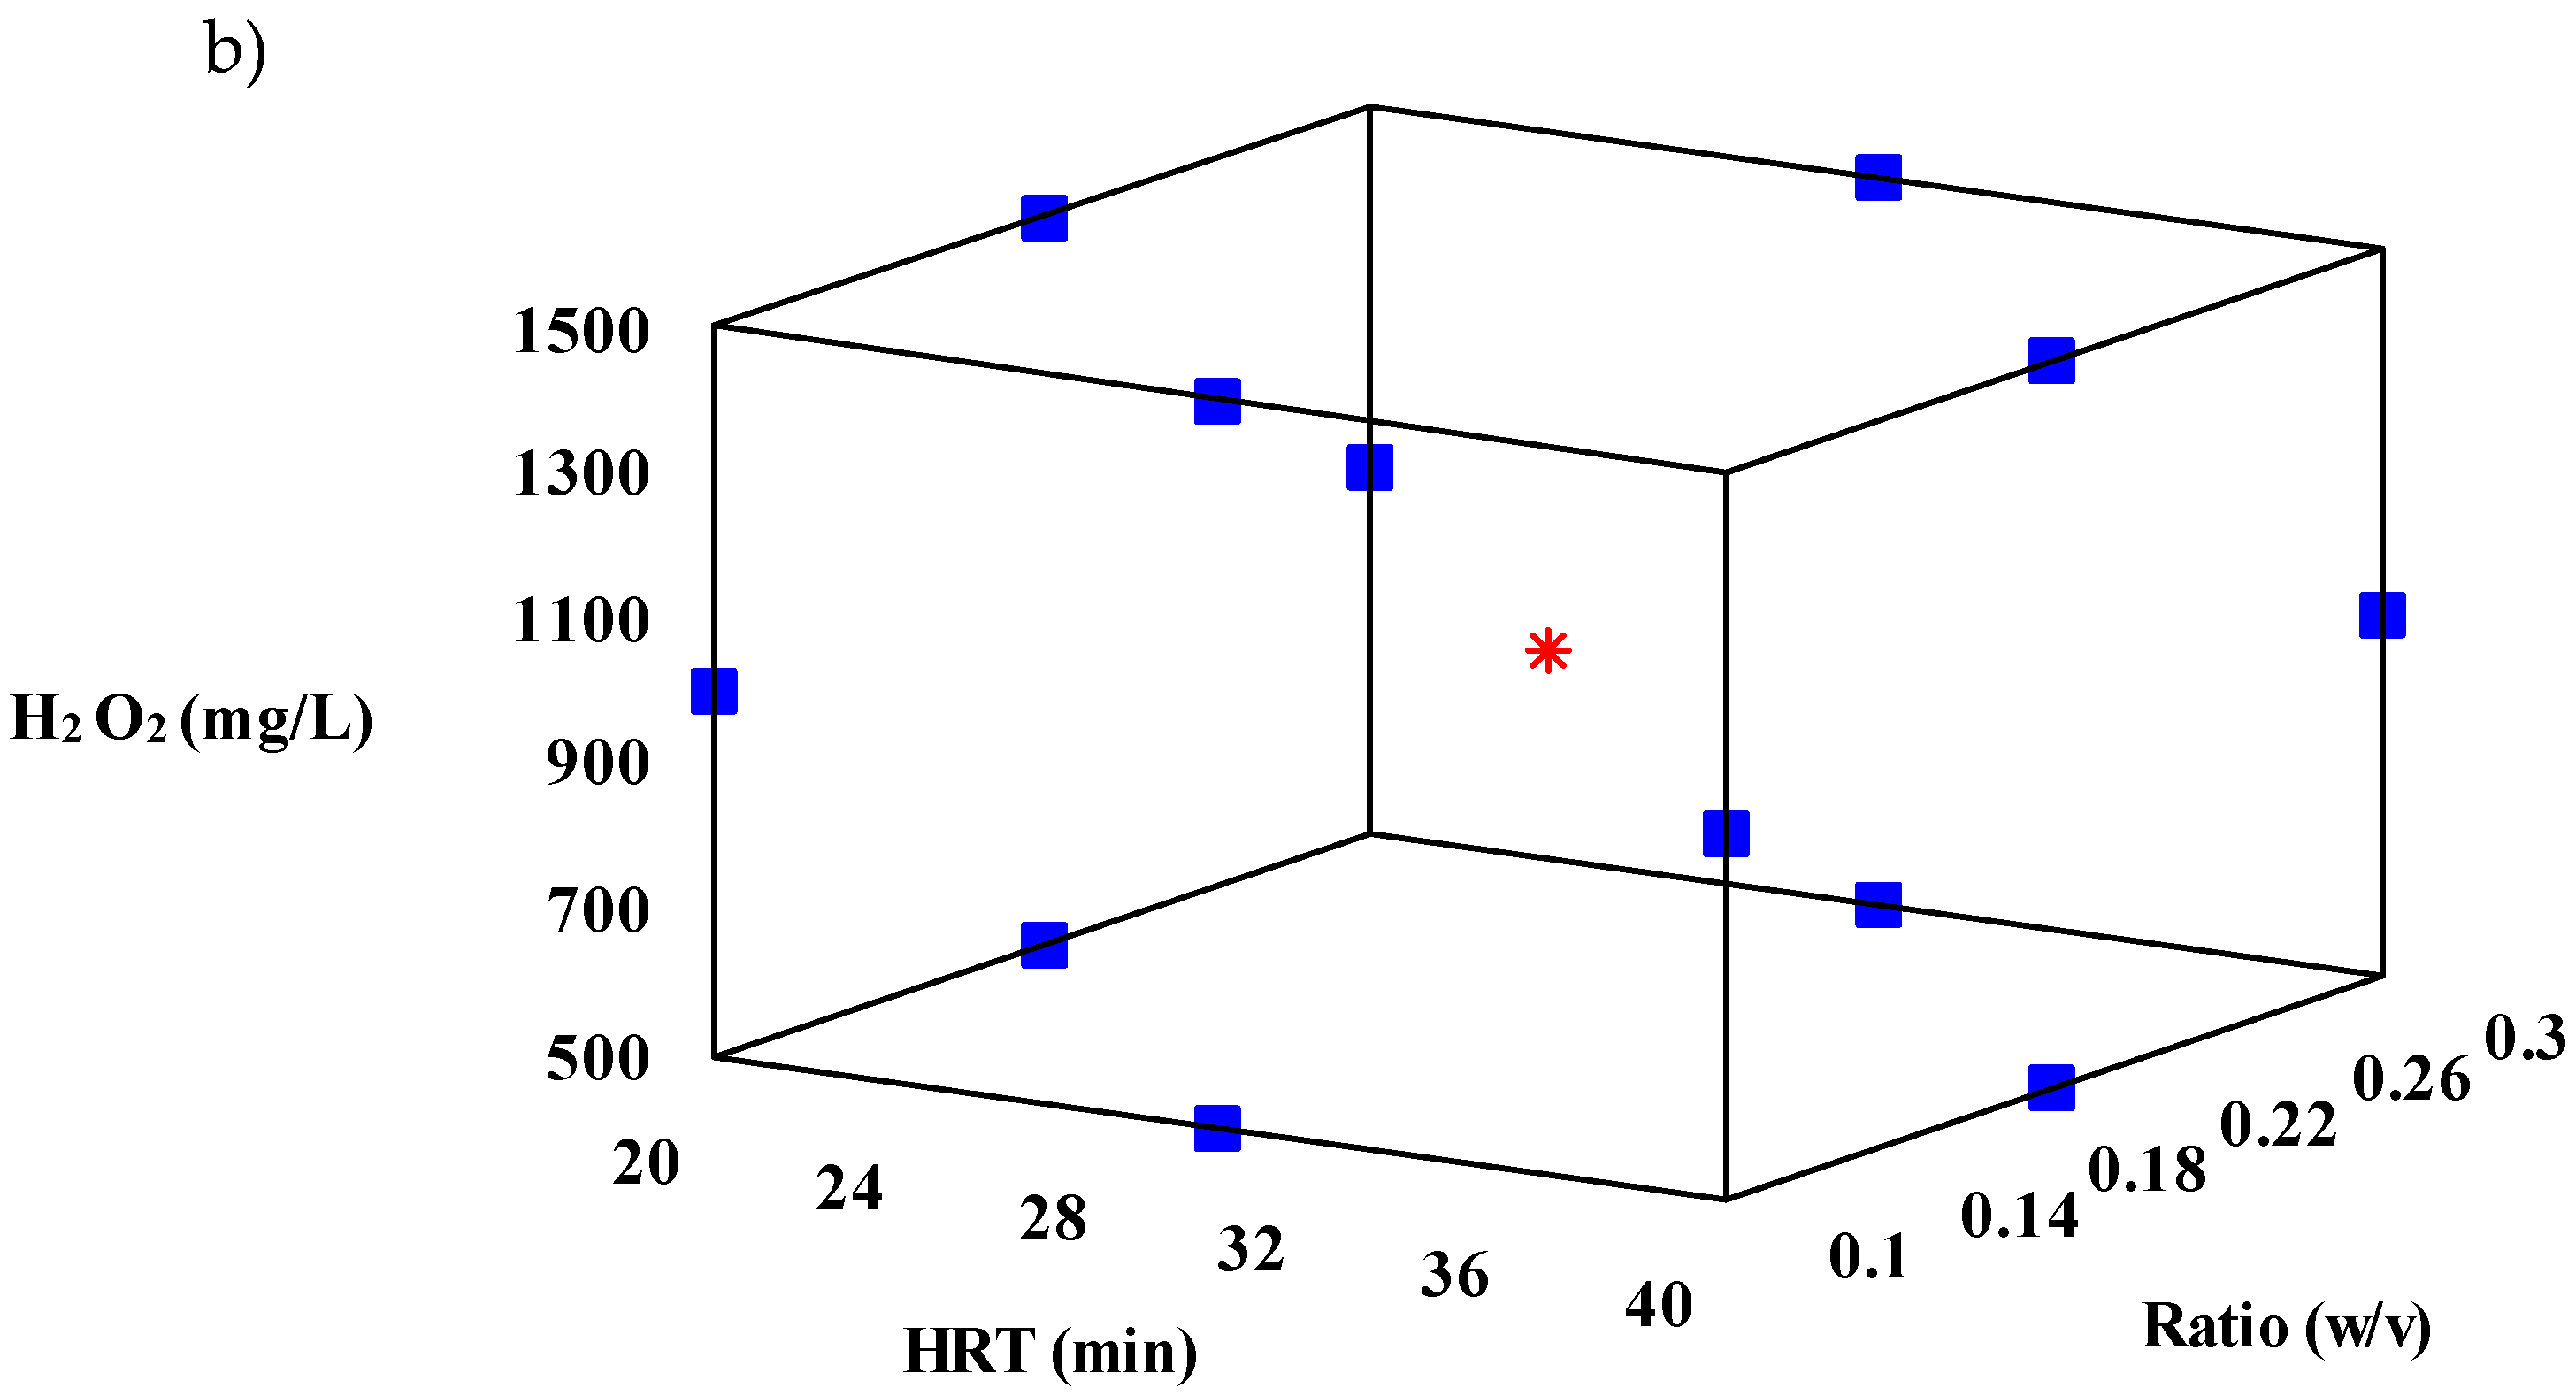

Table 1.
Characterization of raw and treated wastewater in SCFr.
| Parameter | Raw | + | Treatment† | + | % removal |
|---|---|---|---|---|---|
| pH | 3.44 | 0.06 | 2.6 | 0.07 | - |
| COD (mg/L) | 1020.0 | 10.1 | 83.5 | 6.1 | 91.8 |
| Color (Pt-Co) | 1808.3 | 23.5 | 29.3 | 0.7 | 98.4 |
| Turbidity (NTU) | 237.0 | 1.5 | 30.0 | 0.0 | 87.3 |
| Electrical conductivity (µS/cm) | 2.971 | 0.15 | 4.12 | 0.12 | - |
| Chlorides (mg/L) | 345.4 | 3.6 | 280.7 | 1.9 | 18.7 |
| Nitrates (mg/L) | 4.0 | 0.2 | 1.9 | 0.01 | 52.5 |
| Ammoniacal nitrogen (mg/L) | 0.7 | 0.01 | 5.15 | 0.02 | - |
| Hardness (mg/L) | 200.0 | 1.5 | 22.0 | 1.4 | 89.0 |
| Alkalinity (mg/L as CaCO3) | 77.2 | 5.2 | 0.0 | 0.54 | 100.0 |
| Acidity (mg/L as CaCO3) | 1200.0 | 10.2 | 629.2 | 4.4 | 47.5 |
| Total dissolved solids (g/L) | 1.483 | 0.01 | 2.018 | 0.06 | - |
| Total solids (mg/L) | 3540.0 | 70.8 | 3160.0 | 63.2 | 10.7 |
| Suspended solids (mg/L) | 412.0 | 2.8 | 28.0 | 0.56 | 93.2 |
† Optimal conditions for removal COD: HRT of 24.5 min, a ratio of 0.16, a peroxide dosage of 1006.9 mg/L, 25.4 mg/L of Fe2+.
Table 2.
Optimal conditions of SCFr processes.
| % Removal (Predicted) | % Removal (Observed) | HRT (min) | Ratio (w/v) | H2O2 doses (mg/L) |
R2 | SEE (%) * | |
|---|---|---|---|---|---|---|---|
| COD | 96.8 | 91.8 | 24.5 | 0.16 | 1006.9 | 86.6 | 9.8 |
| Color | 96.6 | 98.4 | 28.2 | 0.18 | 1134.9 | 84.3 | 13.6 |
| Turbidity | 85.6 | 87.3 | 28.4 | 0.18 | 1277.0 | 93.6 | 8.2 |
*SEE: standard error of the estimate.
Table 3.
Experimental matrix and solar UVA radiation for % removal of COD, color and turbidity.
| # run | HRT (min) | Ratio | Dose H2O2 (mg/L) | COD removal (%) | Color removal (%) | Turbidity removal (%) | Solar UVA radiation (W/m2) |
|---|---|---|---|---|---|---|---|
| 1 | 30 | 0.2 | 1000 | 93.40% | 92.6% | 80.3% | 46.5abcd |
| 2 | 30 | 0.2 | 1000 | 98.71% | 98.2% | 85.2% | 53.2ab |
| 3 | 30 | 0.2 | 1000 | 85.84% | 92.8% | 86.2% | 55.3a |
| 4 | 20 | 0.1 | 1000 | 81.51 | 51.9% | 41.8% | 50.7abc |
| 5 | 40 | 0.1 | 1000 | 77.79 | 52.1% | 22.8% | 30.5cde |
| 6 | 20 | 0.3 | 1000 | 78.94 | 65.1% | 29.8% | 26.5de |
| 7 | 40 | 0.3 | 1000 | 60.31 | 46.3% | 45.4% | 40.5abcd |
| 8 | 20 | 0.2 | 500 | 84.21% | 70.2% | 44.7% | 33.4 bcde |
| 9 | 40 | 0.2 | 500 | 65.17 | 51.6% | 52.1% | 51.2abc |
| 10 | 20 | 0.2 | 1500 | 83.72% | 71.4% | 66.7% | 13.6e |
| 11 | 40 | 0.2 | 1500 | 62.72 | 53.7% | 43.2% | 46.7abcd |
| 12 | 30 | 0.1 | 500 | 81.51% | 47.6% | 54.6% | 47.0abcd |
| 13 | 30 | 0.3 | 500 | 66.72% | 34.3% | 44.6% | 40.7abcd |
| 14 | 30 | 0.1 | 1500 | 88.09% | 90.9% | 75.2% | 33.8abcde |
| 15 | 30 | 0.3 | 1500 | 34.12% | 46.9% | 47.6% | 25.2de |
*Values with the same letter do not significantly differ (a, b, c and d), Tukey test (p < 0.05).
Table 4.
Kinetic constants and models of SCF.
| First order | Second order | BMG | |||||
|---|---|---|---|---|---|---|---|
| k(L/kJ) | R2 | k2(L/mg L/kJ) | R2 | 1/m (L/kJ) | 1/b | R2 | |
| COD | 0.0893 | 0.7667 | 0.1133 | 0.8784 | -3.3372 | 0.7705 | 0.9978 |
| Color | 0.0198 | 0.8680 | 0.0474 | 0.9171 | 0.0141 | 0.9616 | 0.9179 |
| Turbidity | 0.0081 | 0.8053 | 0.0136 | 0.7750 | 0.0016 | 2.9174 | 0.8202 |
Disclaimer/Publisher’s Note: The statements, opinions and data contained in all publications are solely those of the individual author(s) and contributor(s) and not of MDPI and/or the editor(s). MDPI and/or the editor(s) disclaim responsibility for any injury to people or property resulting from any ideas, methods, instructions or products referred to in the content. |
© 2024 by the authors. Licensee MDPI, Basel, Switzerland. This article is an open access article distributed under the terms and conditions of the Creative Commons Attribution (CC BY) license (http://creativecommons.org/licenses/by/4.0/).
Copyright: This open access article is published under a Creative Commons CC BY 4.0 license, which permit the free download, distribution, and reuse, provided that the author and preprint are cited in any reuse.


