Submitted:
29 November 2024
Posted:
02 December 2024
You are already at the latest version
Abstract
This paper is devoted to designing, modeling, and analyzing a solar-powered street lighting system using artificial intelligence technologies to predict energy consumption. The system involves the integration of solar panels, batteries, and sensors to efficiently control the brightness of LED lamps depending on the illumination level and the presence of motion in the lighting area. The use of artificial neural networks (LSTM, GRU, Random Forest) provided accurate prediction of solar energy generation and the need to connect to the city power grid during periods of low solar activity. The developed model was implemented in MATLAB Simulink, considering actual weather data. The results showed that the system can operate autonomously for up to three days under unfavorable weather conditions, reducing power by 30%. The need for connection to the external network is no more than 10% in summer and up to 30% in winter. The prototype will be implemented in Kazakhstan to validate the model and further optimize its operation.
Keywords:
Street lighting
; solar energy
; energy efficiency
; solar system simulation
; artificial neural networks
; energy prediction
; MATLAB Simulink
; generation prediction
; energy management
1. Introduction
Public street lighting systems consume a substantial portion of urban energy, making them a prime target for energy efficiency improvements. The urbanization process and the increase in life comfort require more power. Even in remotely located rural areas, lighting is needed during the presence of men. As governments worldwide focus on reducing carbon footprints, solar-powered lighting systems present a sustainable alternative. PV panels' lifetime is relatively long (20 to 35 years), and their efficiency is growing. This makes such a system potentially very suitable and effective.
However, these systems are subject to challenges, including weather variations and potential energy shortages. As stated in [1], using renewable sources is difficult due to their intermittent nature: “These require advanced digital technologies to maintain overall electricity grid balance.”
This paper describes a simulation model that evaluates the efficiency of solar-powered streetlights and provides information for integrating an artificial neural network (ANN) to predict power consumption and optimize load distribution. Some AI models were offered for power generation prediction based on accumulated data.
Literature Review
Lighting public zones and streets is a notable part of the city's electrical consumption. With the growing interest in power-effective technologies, many efforts are dedicated to this area, and many publications are available on this topic.
In general, prominent authors offer several common ideas. First, they recommend replacing different lamps with more energy-effective LEDs. Many publications demonstrate such replacement advantages and short pay-back periods [5]. The https://www.zgsm-china.com/blog/how-much-do-the-street-lights-cost.html calculates 2.1 years for LEDs and 2.85 for solar-powered lamps. In conclusion, it is strongly recommended that all the lights be replaced with LEDs and that savings be calculated.
Others offer to implement sophisticated control algorithms for the lamps [6, 4]. In this case, the economy is achieved by reducing each unit’s consumed power. It is proposed that the time spent on active hours or brightness should be reduced [4] depending on some conditions. In most cases, it is the presence of someone or a car in the lighted area. In some articles, the present object is evaluated, and the decision is made based on its recognition—is it an animal or man?
Another big group of authors suggests using alternative power sources for street lighting. It can be solar PV panels or wind turbines [7]. These lighting systems, as usual, are proposed to be entirely independent of other power sources [2, 7], which could cause trouble in harsh weather conditions for a long time. If no backup power source is provided, all batteries will discharge simultaneously, and the region could fall into the dark. These can be dangerous in many ways. Predict this moment in terms of time [2] or remaining power capacity to decrease the negative consequences.
Many authors provide measured data from their devices and installations recorded during some period [8, 2]. In [6], researchers use more standard industrial solutions available on the local market. In some cases, this could be beneficial from a repetition and standardization point of view. In the case of serial implementation, this solution is much more expensive than the developed system based on budget components. Authors often use various modeling tools to prove or test their concepts, like MATLAB, Simulink, etc. [9, 7].
In [13], it is proposed that PV power be predicted based only on historical data. The historical PV power measurement outputs are analyzed so that inter-day parameters are separated from intra-day parameters of the power measurements. Then, RNN is trained, and the results allow for predicting PV power in the range from 15 to 90 minutes using only historical data with good results compared with other methods.
In [14], the authors compare different model architectures for forecasting, using one universal model for all hours ahead with separate models for each hour in the coming day. They also study the effect of model retraining frequency on prediction quality.
A branch of research is devoted to solving the problem of weather prediction quality.
In [16], the structure of NN is adapted to this task, and some neural network hyperparameters are changed to maximize accuracy. LSTM is improved with the time-weighted coefficients matrix to improve the model's correlation; the on-activation function is applied to enhance the gradient calculation. The training procedure is improved with Momentum Resistance Weight Estimation and Learning Factor adaptation. As a result of this research, the AHPA-LSTM model is proposed with the qualities of the existing models improved.
The Smart City concept could be implemented using intelligent communication devices, like street lighting poles.
The modeling and simulation of solar lighting systems are not extensively covered in the literature. In [9], the authors presented a simulation model of the distribution network based on the matrix iteration method, with a detailed description of its implementation. Their approach involved calculating light intensity using a point-based method. Two control strategies were proposed: a switching-based method governed by a timetable and an intensity-controlled operation based on real-time light measurements. Additionally, traffic intensity was incorporated as a factor influencing the operation of the lighting devices. The simulation was performed using MATLAB Simulink, although no specific model or schematic was provided. The model's validity was confirmed through measurements taken from an actual street under natural operating conditions.
Another approach was outlined in [23], where the authors constructed a spatial laboratory to measure solar-powered lighting systems' voltage-current (V-I) characteristics. They developed a MATLAB-based simulation tool to model and characterize the operation of smart solar lighting systems. A dedicated control device was designed to manage solar-powered LED lamps in conjunction with battery storage. However, the article does not include the model's schematic or detailed description. The authors successfully implemented this control device in a real-world project, where the model could predict lamp performance based on known weather data, enabling more accurate operation in varying environmental conditions.
After implementing any project, it is essential to assess its impact and evaluate the public perception of the results. In [23], the authors propose a comprehensive framework for conducting such an analysis. They recommend evaluating the costs and savings associated with the project, including factors like CO2 emissions reduction, maintenance expenses, and other relevant financial metrics. While the absolute values may vary and differ from those in the current study, the approach and estimation algorithm outlined in [23] can also be applied to the present research.
A precious aspect of the study in [23] is its inclusion of social analysis and the evaluation of public feedback. The research also highlights the results of a survey conducted among stakeholders to assess preferences regarding the power source for street lighting systems. The findings revealed that most (62%) respondents favored a hybrid solution, combining solar and grid power for street lighting.
It was observed that few publications address lighting system simulations from a meteorological perspective, and, to the authors' knowledge, none explore the connection between weather parameters, system behavior, and AI-based predictive modeling. This study examines the accuracy and reliability of power generation predictions. A simulation framework is presented to encourage further research in this area.
This article is the first in a series by the author focused on this topic. Future studies will address optimizing the lighting device and its physical implementation.
Methodology
Energy-Efficient Lighting Technologies
One of the most discussed energy-saving technologies is replacing traditional lamps with LEDs. Research shows that LEDs offer substantial savings and a short payback period, often less than three years, compared to conventional lamps. Many studies strongly recommend replacing all older lamps with LEDs to realize these benefits.
Control Systems for Street Lighting
Another focus is advanced control systems that use sensors to detect presence or movement. These systems reduce power consumption by adjusting lighting levels based on real-time activity, such as dimming lights when no pedestrians or vehicles are detected.
Renewable Energy for Street Lighting
Solar and wind power have been proposed as alternatives to traditional grid-powered lighting systems. Fully independent systems, powered solely by renewable energy, offer potential energy savings but may face challenges during prolonged adverse weather conditions, such as overcast skies or insufficient wind.
Forecasting and Neural Network Applications
Recent studies focus on using artificial intelligence, particularly neural networks, to forecast solar power generation and predict the energy consumption of lighting systems. This allows for more efficient energy management, ensuring the system can balance supply and demand more effectively.
System Design
The solar-powered street lighting system is modeled using Simulink. The model incorporates various components, including photovoltaic (PV) panels, sensors, and batteries. Weather conditions are simulated using sinusoidal functions and actual weather data inputs.
The logic of the LED lamp operation is the following: the lamp’s battery is charged during the daytime. The duration of this phase depends on the season and geographical location. Then, when the sun is down, the LED is 100% On from sunset till 24:00. Starting from 00:00, the LED is in night mode. This means it is on 33% brightness if no presence is detected and 100% if the presence signal arrives. This could be a signal from its PIR detector, the nearest lamp pole’s system, or a supervisory system. If no new presence signal arrives, the LED is on at maximum power during some period – 5 min, for example, and then goes back to 33% of brightness. This operation mode is active till 06:00. From 6:00 to sunrise, the LED is on 100% again. During the day, the system is in charging mode.
Figure 1.
Model power flow.
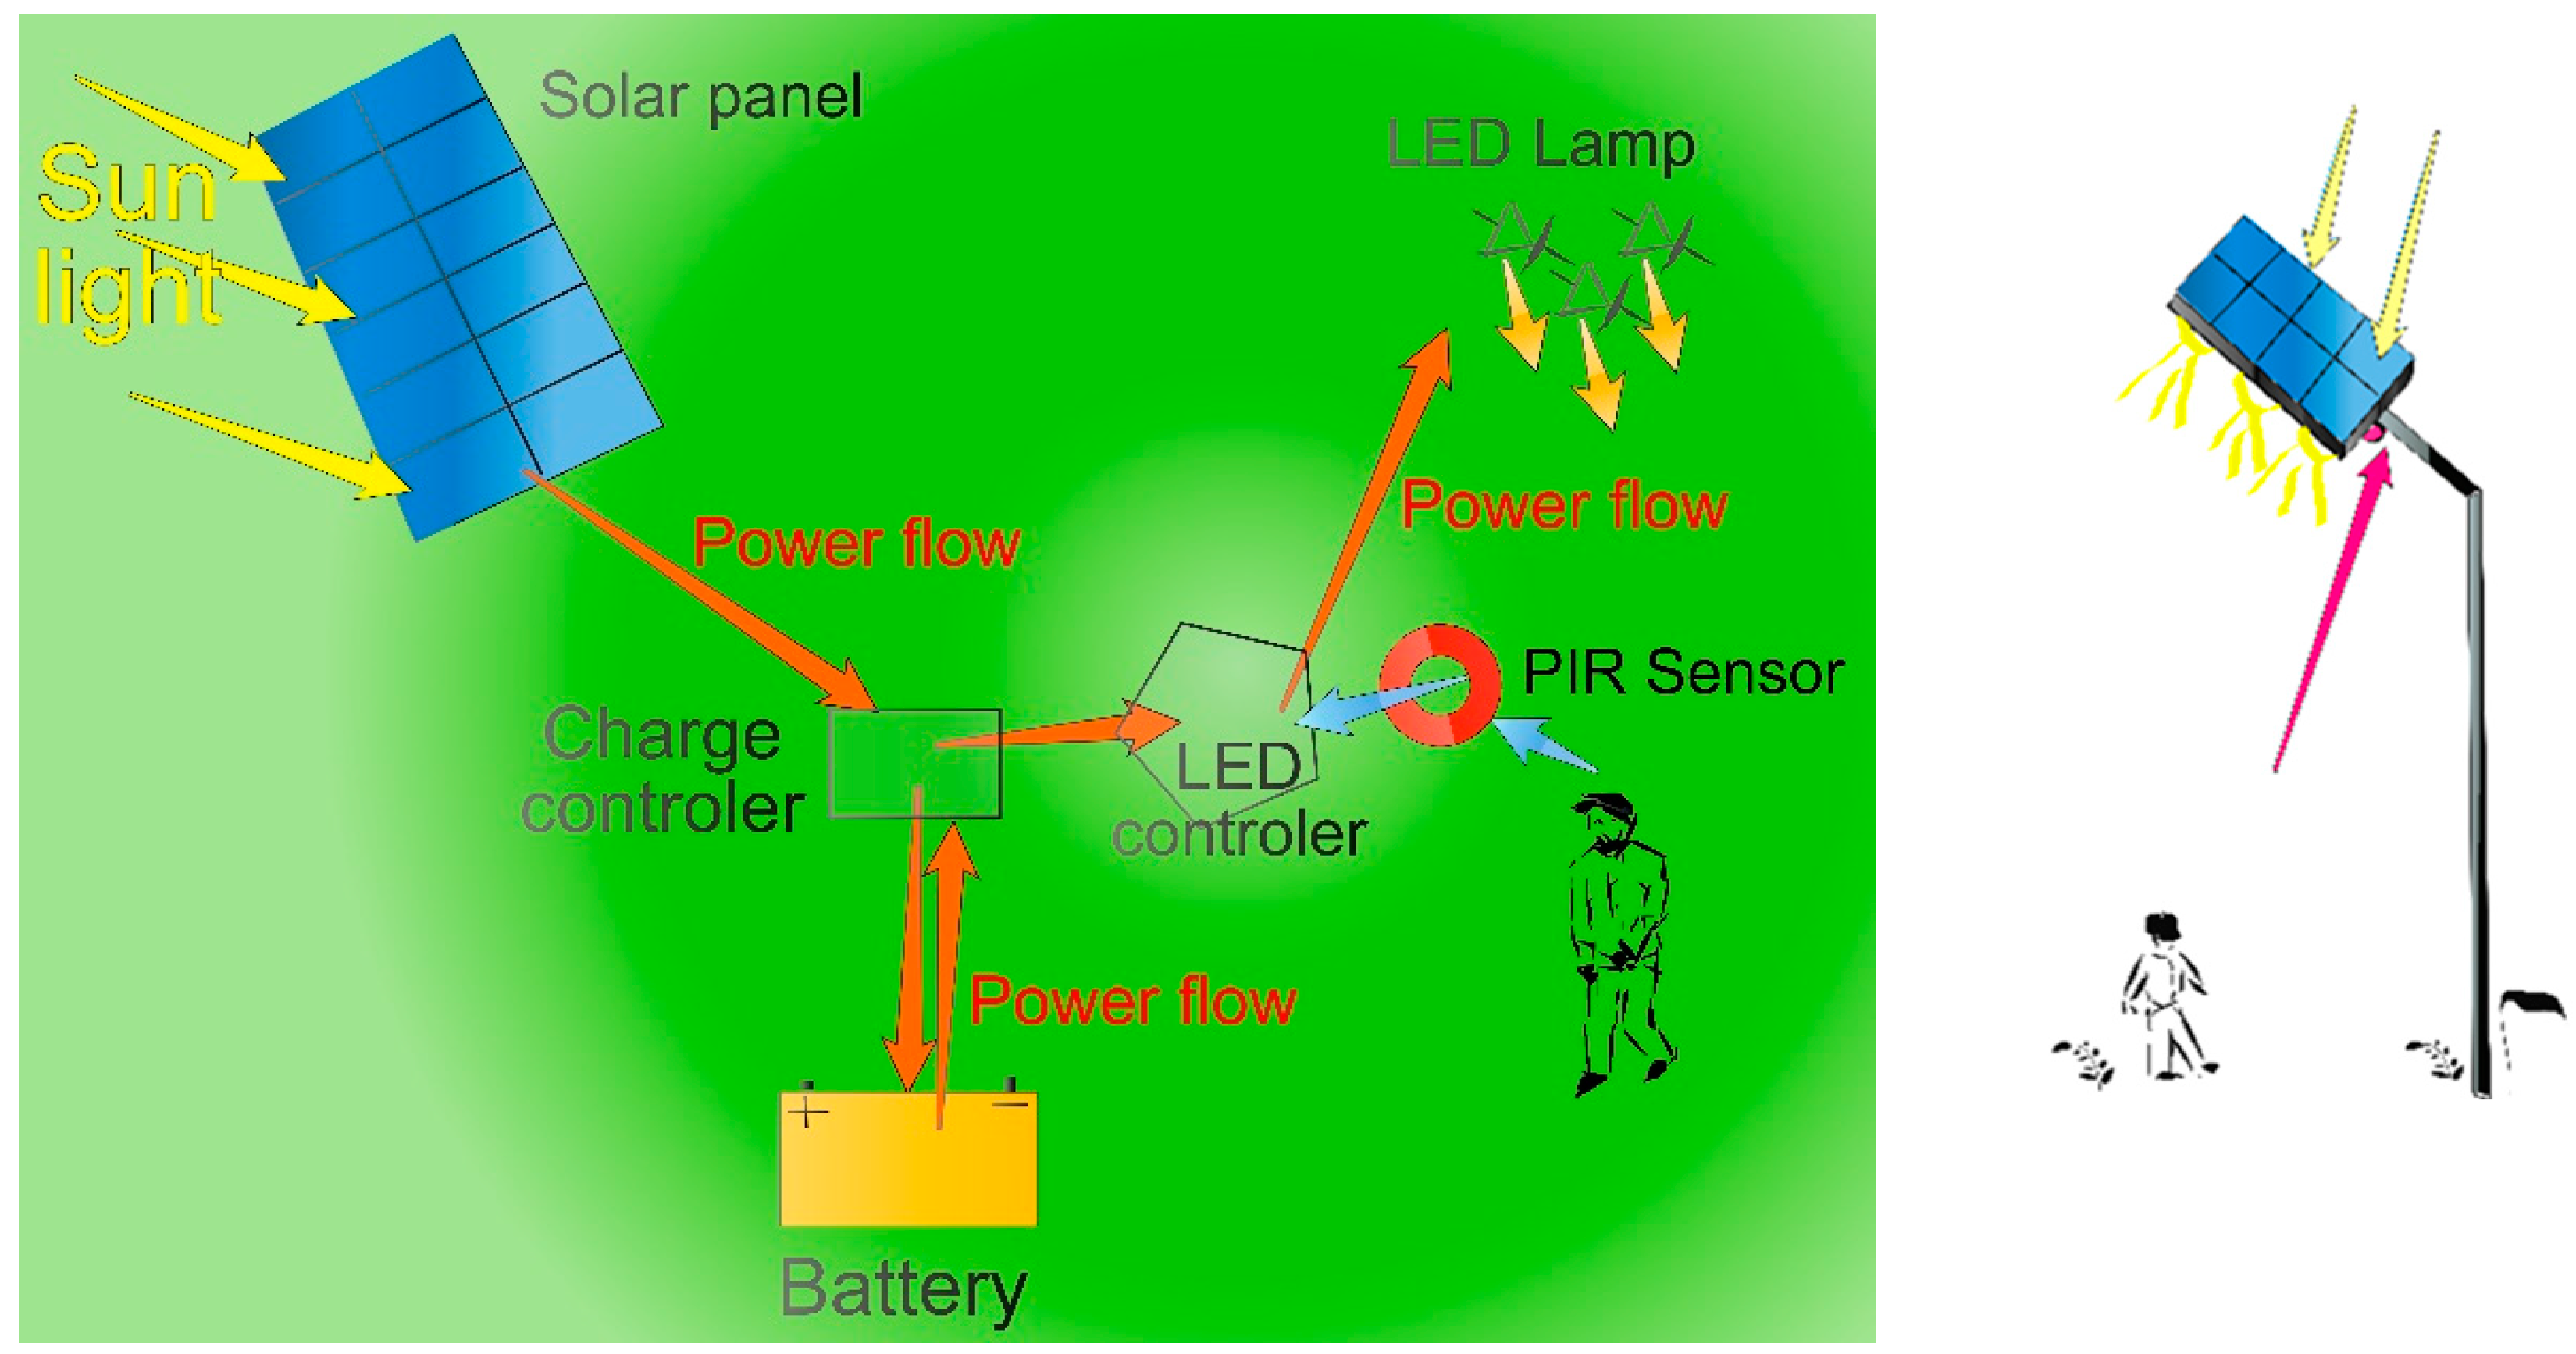
As the sunlight intensity values the measured dataset from [20,21], synthetic and forecast data from the OpenWeatherMap were used.
The operation logic with the external power source transitions to the network power supply if the battery voltage goes below a certain level, for example, 30%. The external charge is possible at night and daytime in cloudy weather.
In equation (1): does the panel generate the energy, - energy from an external power source, – losses, including control system and communication consumption, – power to the LED light.
Materials and Methods
The following software tools were used in this research: MATLAB 2016a, with Simulink version 8.7, was employed for simulation modeling. For artificial intelligence (AI) training and verification, Python 3.10 was used, along with the following libraries: Keras 3.6, NumPy 1.26.4, Pandas 2.2.3, and TensorFlow 2.18.0. The Python environment was run on Ubuntu 22.04.5 on a Vector GP 68 HX laptop. The neural network training was accelerated using a GPU.
Simulation Method
The primary methodology employed involves simulating actual system behavior using Simulink. Solar power at the input is represented by a sinusoidal waveform with added random components to mimic realistic variations. The photovoltaic (PV) panel’s voltage and consumed/generated power values are obtained as outputs.
As detailed below, a second method for simulating solar power input leverages online data services. The third method incorporates actual solar power measurements obtained from a local weather station in the Almaty region.
After the simulations, output values are extracted from MAT files, processed, and utilized for model training and validation (with a validation split 0.3). The performance of the AI models is then evaluated using standard metrics and compared for accuracy and reliability.
The Imitational System Model includes several key components:
Weather Simulation: This component combines sinusoidal functions and random variables to mimic weather patterns. Using different rhythms, the model simulates transitions in weather conditions, such as shifts from cloudy to sunny intervals. A primary sinusoidal function emulates daily changes in daylight, enabling the model to replicate the climate dynamics of any specific region.
For enhanced realism, actual meteorological data from a weather station and satellite data were also incorporated into the simulation [20]. The use of real-world data yielded results closely matching those from synthetic data. Additionally, forecasted weather data can be utilized to refine simulation accuracy further.
The simulated data generated through sinusoidal functions provides results that align well with real-world observations. For instance, data collected from the İkitelli Solar Power Plant [21] closely follows the simulated patterns. Figure 2 illustrates actual data obtained from the İBB Open Data Platform, recorded in August 2018. This dataset comprises 15-minute interval measurements from a 1200 kW solar power plant in the Istanbul Water and Sewerage Administration (ISKI) Ikitelli Drinking Water Treatment Plant. The data spans from May 2018 to May 2019 and supports the model's efficacy in reproducing realistic solar power generation patterns based on weather simulations.
Similar patterns are observed in data from online sources such as the Photovoltaic Geographical Information System (PVGIS) [21], which provides solar power intensity data for various global locations. PVGIS offers time series data on solar radiation and photovoltaic (PV) performance, available hourly, daily, or monthly for selected regions. Historical data ranges from 2005 to 2023, with intervals available for solar radiation, estimated PV system performance, and other metrics. This data, derived from satellite measurements and, in some cases, reanalysis, enables extensive solar power simulation and analysis.
Figure 3 presents a sample dataset from PVGIS for the Almaty region, showing hourly values over 54 days in 2005, the initial period from the available dataset. The resulting data demonstrates a sinusoidal-like pattern in shape and distribution, reinforcing the similarity between our model's PVGIS-derived values and sinusoidal patterns.
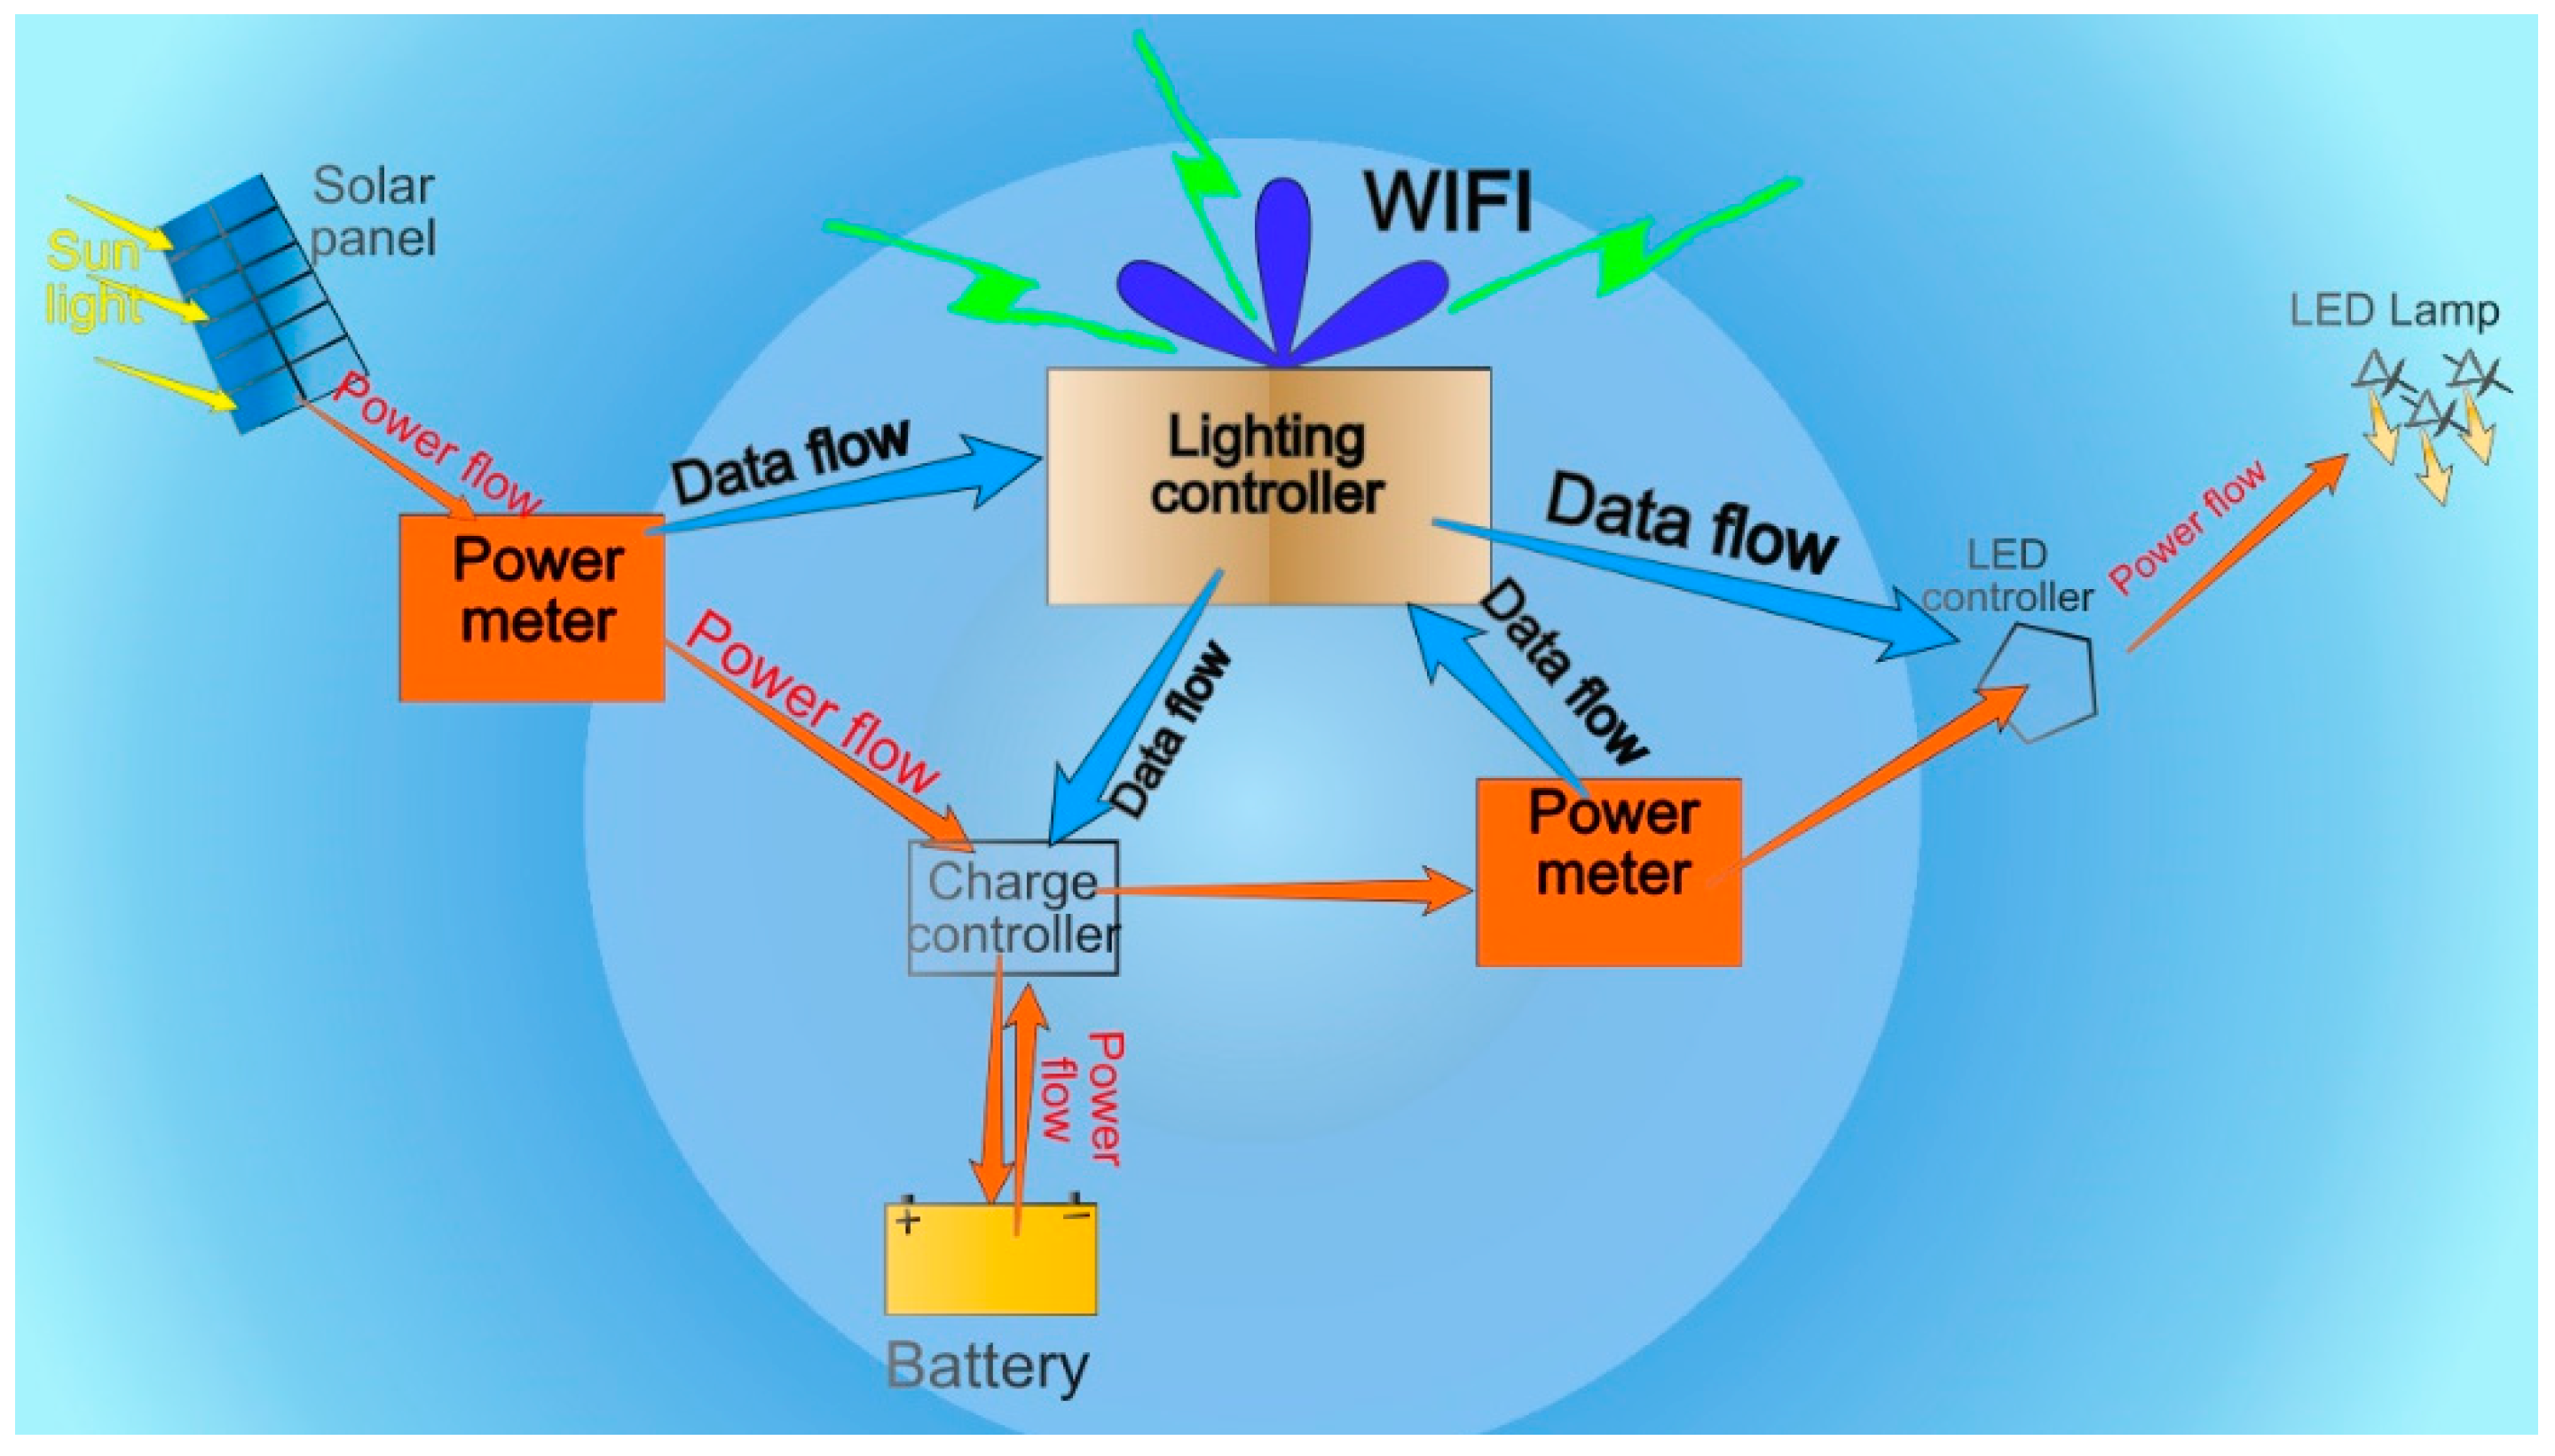
Figure 4 shows the data transmission between the model components in the model.
Presence Simulation: At night, the presence of objects such as cars or people within the lamppost area is simulated using a periodic pulse source. Each pulse represents an instance of object presence, activating the PV panel model accordingly.
PV Panel Model: This model, built using library components from the Simulink library, simulates photovoltaic performance in response to changes in light intensity. Key adjustable parameters include short-circuit current, open-circuit voltage, irradiance, quality factor, series resistance, number of series-connected cells, and temperature coefficients (kept at default values).
Simulation Methodology: The model utilizes a solver with a finely adjusted step size to accommodate the complexity of the simulation. The small step size is necessary due to the model’s multiple feedback loops, non-linear components, and interdependent systems.
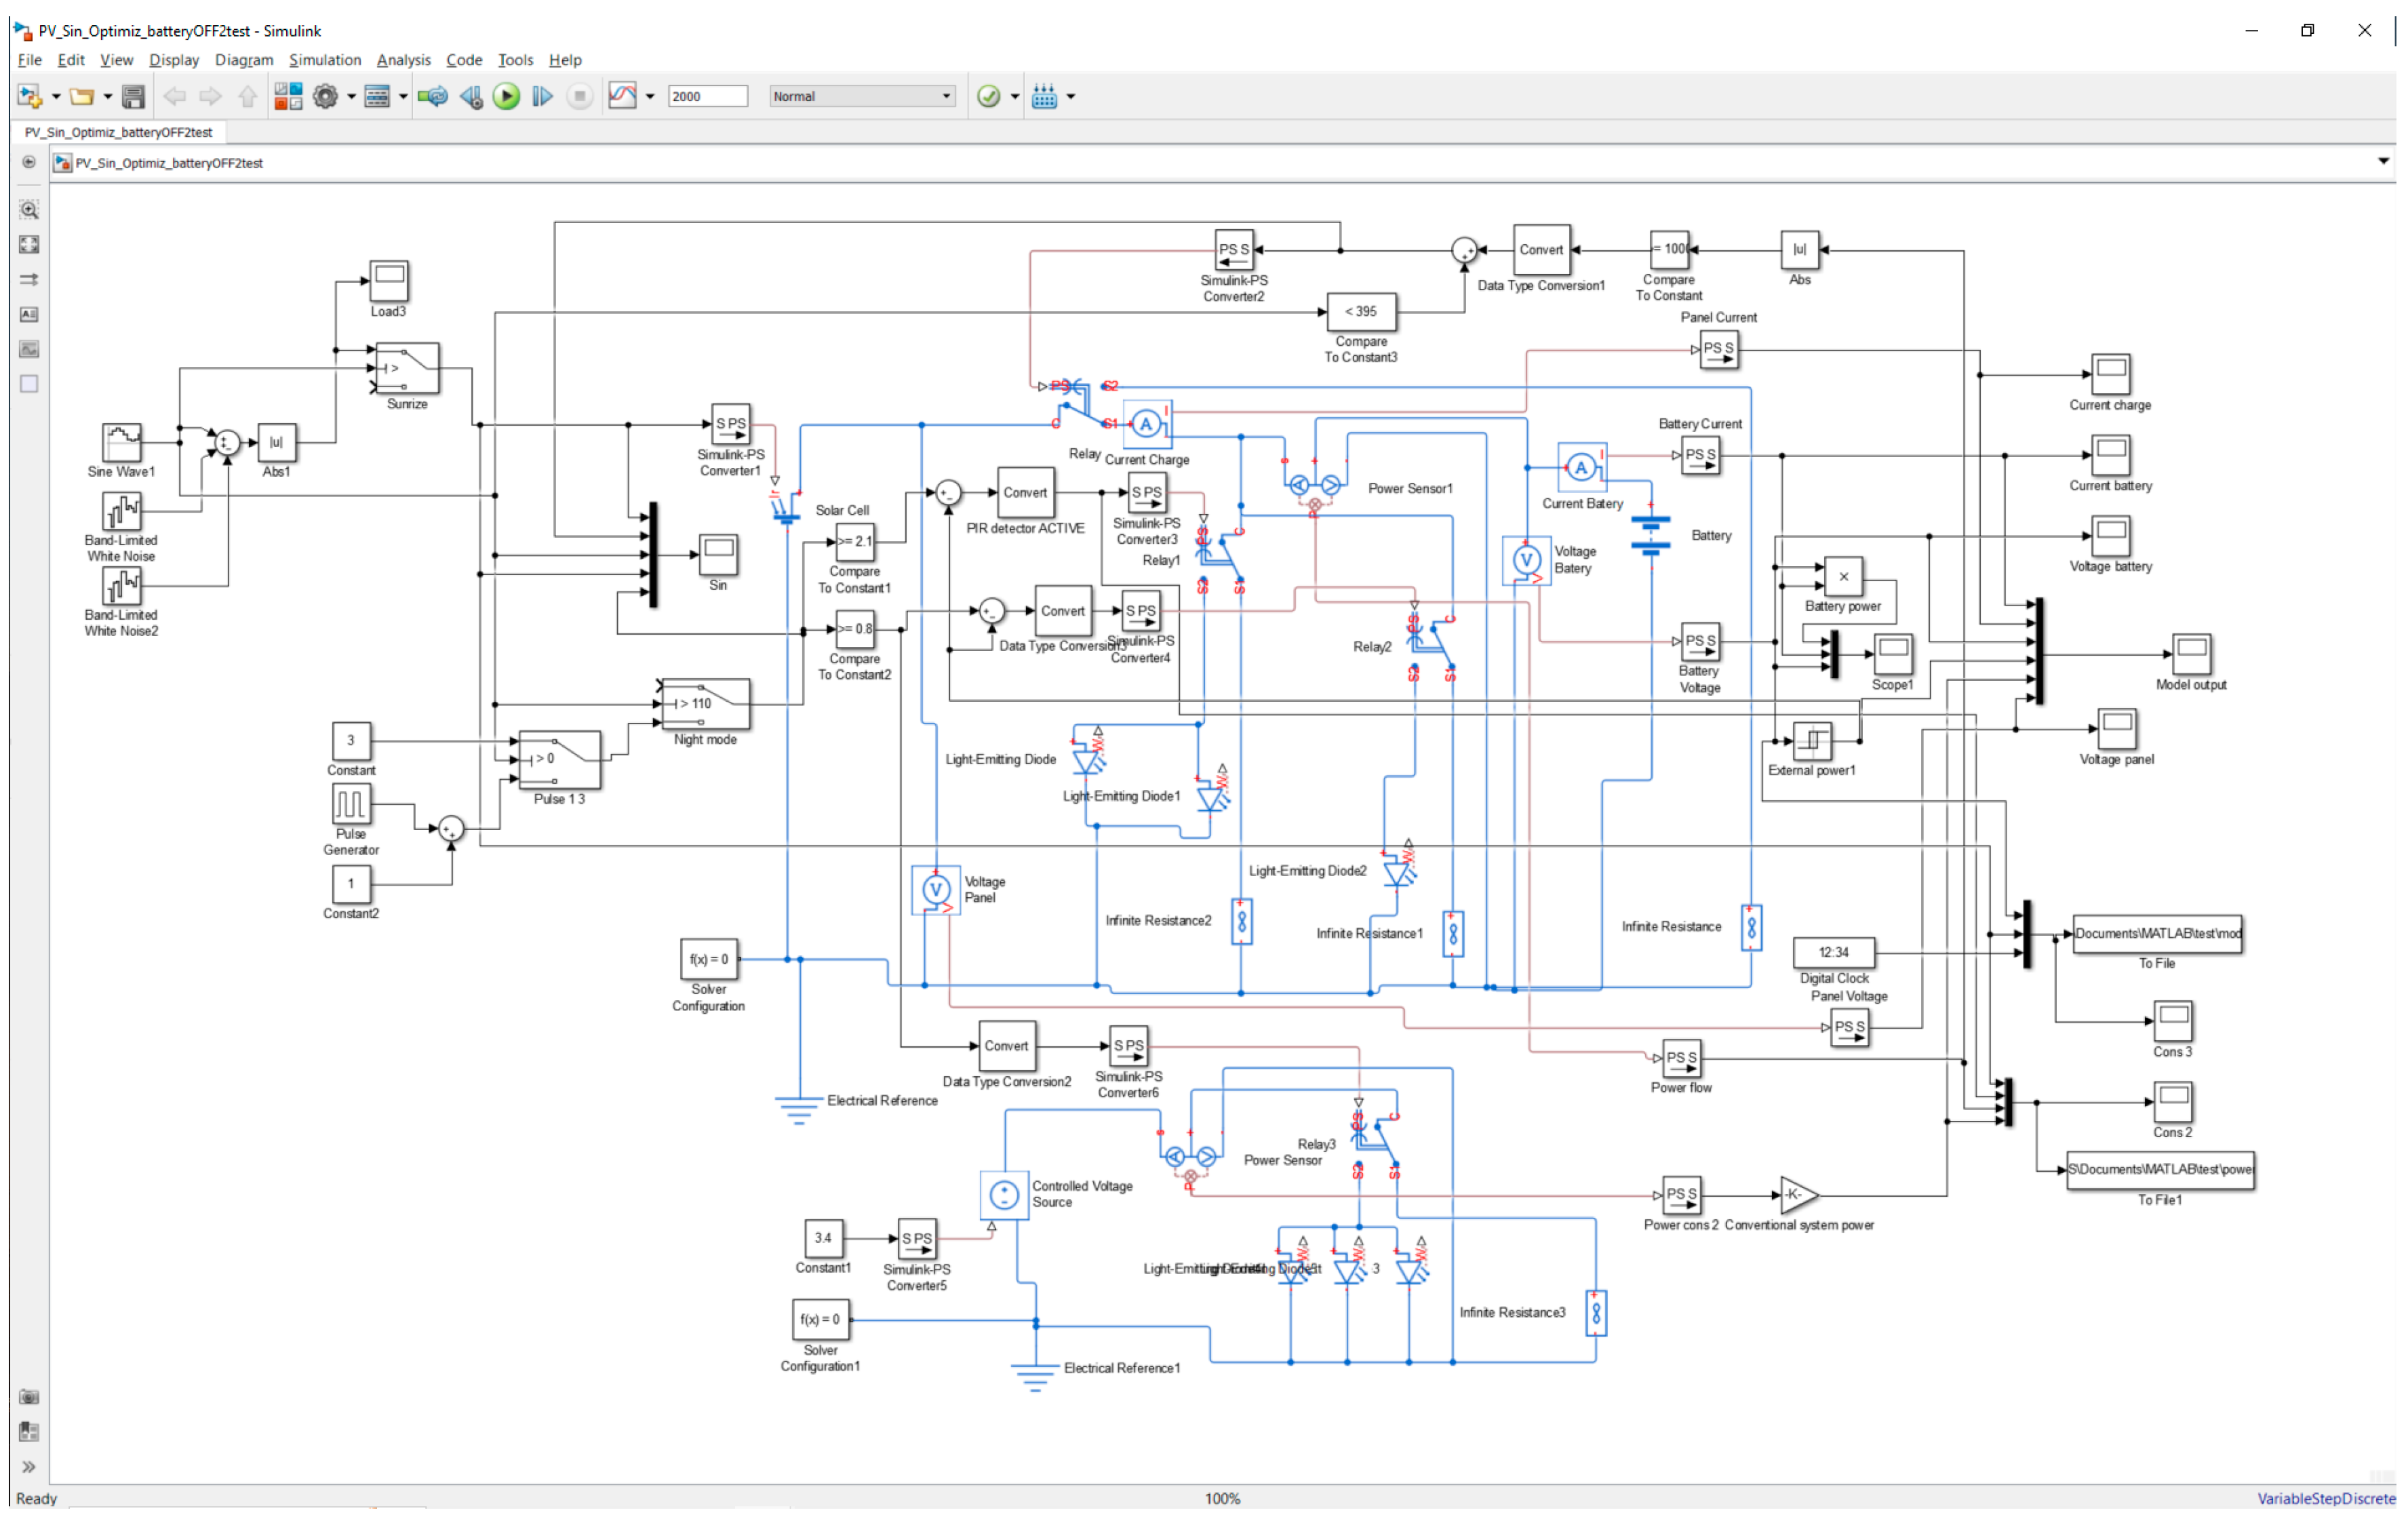
Figure 5.
Lighting system imitational model in Simulink.
Model Logic: The system's core synchronization relies on a sinusoidal signal representing the daily cycle. This sine wave coordinates the charge-discharge cycles, presence sensor signals, and LED control logic and has a period of 24 hours in relative time units. Additional sinusoidal waves with shorter periods and random multipliers are used to simulate variable weather conditions, while long-period sine waves model annual variations in solar intensity, ideal for year-long simulations. Band-limited white noise further randomizes weather conditions, enhancing the simulation’s realism.
Presence Signal Simulation: A constant pulse generator with a 50% pulse width simulates object presence near the pole during nighttime. This generator is active throughout the standby night, representing nighttime activity around the pole or external signals to increase brightness. This includes emergency signals from a control center or nearby poles detecting cars or pedestrians.
Commutation Overvoltage Effect: During the Simulink simulations, an overvoltage phenomenon was observed during the PV power supply connection and disconnection. In these instances, the PV voltage spikes significantly, reaching up to ten times its nominal value. This effect will be further investigated and documented in future studies. A protective feedback signal from the power sensor is incorporated to mitigate this overvoltage, disconnecting the power supply when overvoltage is detected. This protection mechanism can also be implemented in natural systems for enhanced safety.
Power Measurement and Data Logging: Power, current, and voltage are measured using standard Simulink power meters from the library, and the values are saved to an output MAT file for analysis.
Energy Efficiency Estimation: A basic model of a conventional LED lighting system with constant LED brightness is used as the load to evaluate energy efficiency.
Figure 6.
Data transmission in the lamp control system.
Commutation Overvoltage Effect: During the Simulink simulations, an overvoltage phenomenon was observed during the PV power supply connection and disconnection. In these instances, the PV voltage spikes significantly, reaching up to ten times its nominal value. This effect will be further investigated and documented in future studies. A protective feedback signal from the power sensor is incorporated to mitigate this overvoltage, disconnecting the power supply when overvoltage is detected. This protection mechanism can also be implemented in natural systems for enhanced safety.
In Figure 7, the colored areas represent the model's function blocks. Their functions are the following: 1. Solar intensity simulation; 2. Presence detection sensor; 3. PV panel model; 4. Battery charger and power meter; 5. Controlled LED lamp; 6. Battery model; 7. Data collection, preparation, visualization, and storage; 8. Conventional LED lamp with a single switch.
Weather Simulation
Weather simulation involves varying climatic conditions to test the lighting system's performance. This includes daylight intensity, cloud cover, and other variables. Actual weather data from local stations and synthetic data were used to validate the model. Input data can be either measured or predicted values. If predicted values are used, it is possible to forecast future photovoltaic (PV) generation with reasonable accuracy.
Figure 8.
Data output from the simulation model in Simulink. Blue – Power (positive during the charge period and negative while the lamp is lighting), Orange – PV panel output, Light blue – battery voltage.
Figure 8.
Data output from the simulation model in Simulink. Blue – Power (positive during the charge period and negative while the lamp is lighting), Orange – PV panel output, Light blue – battery voltage.
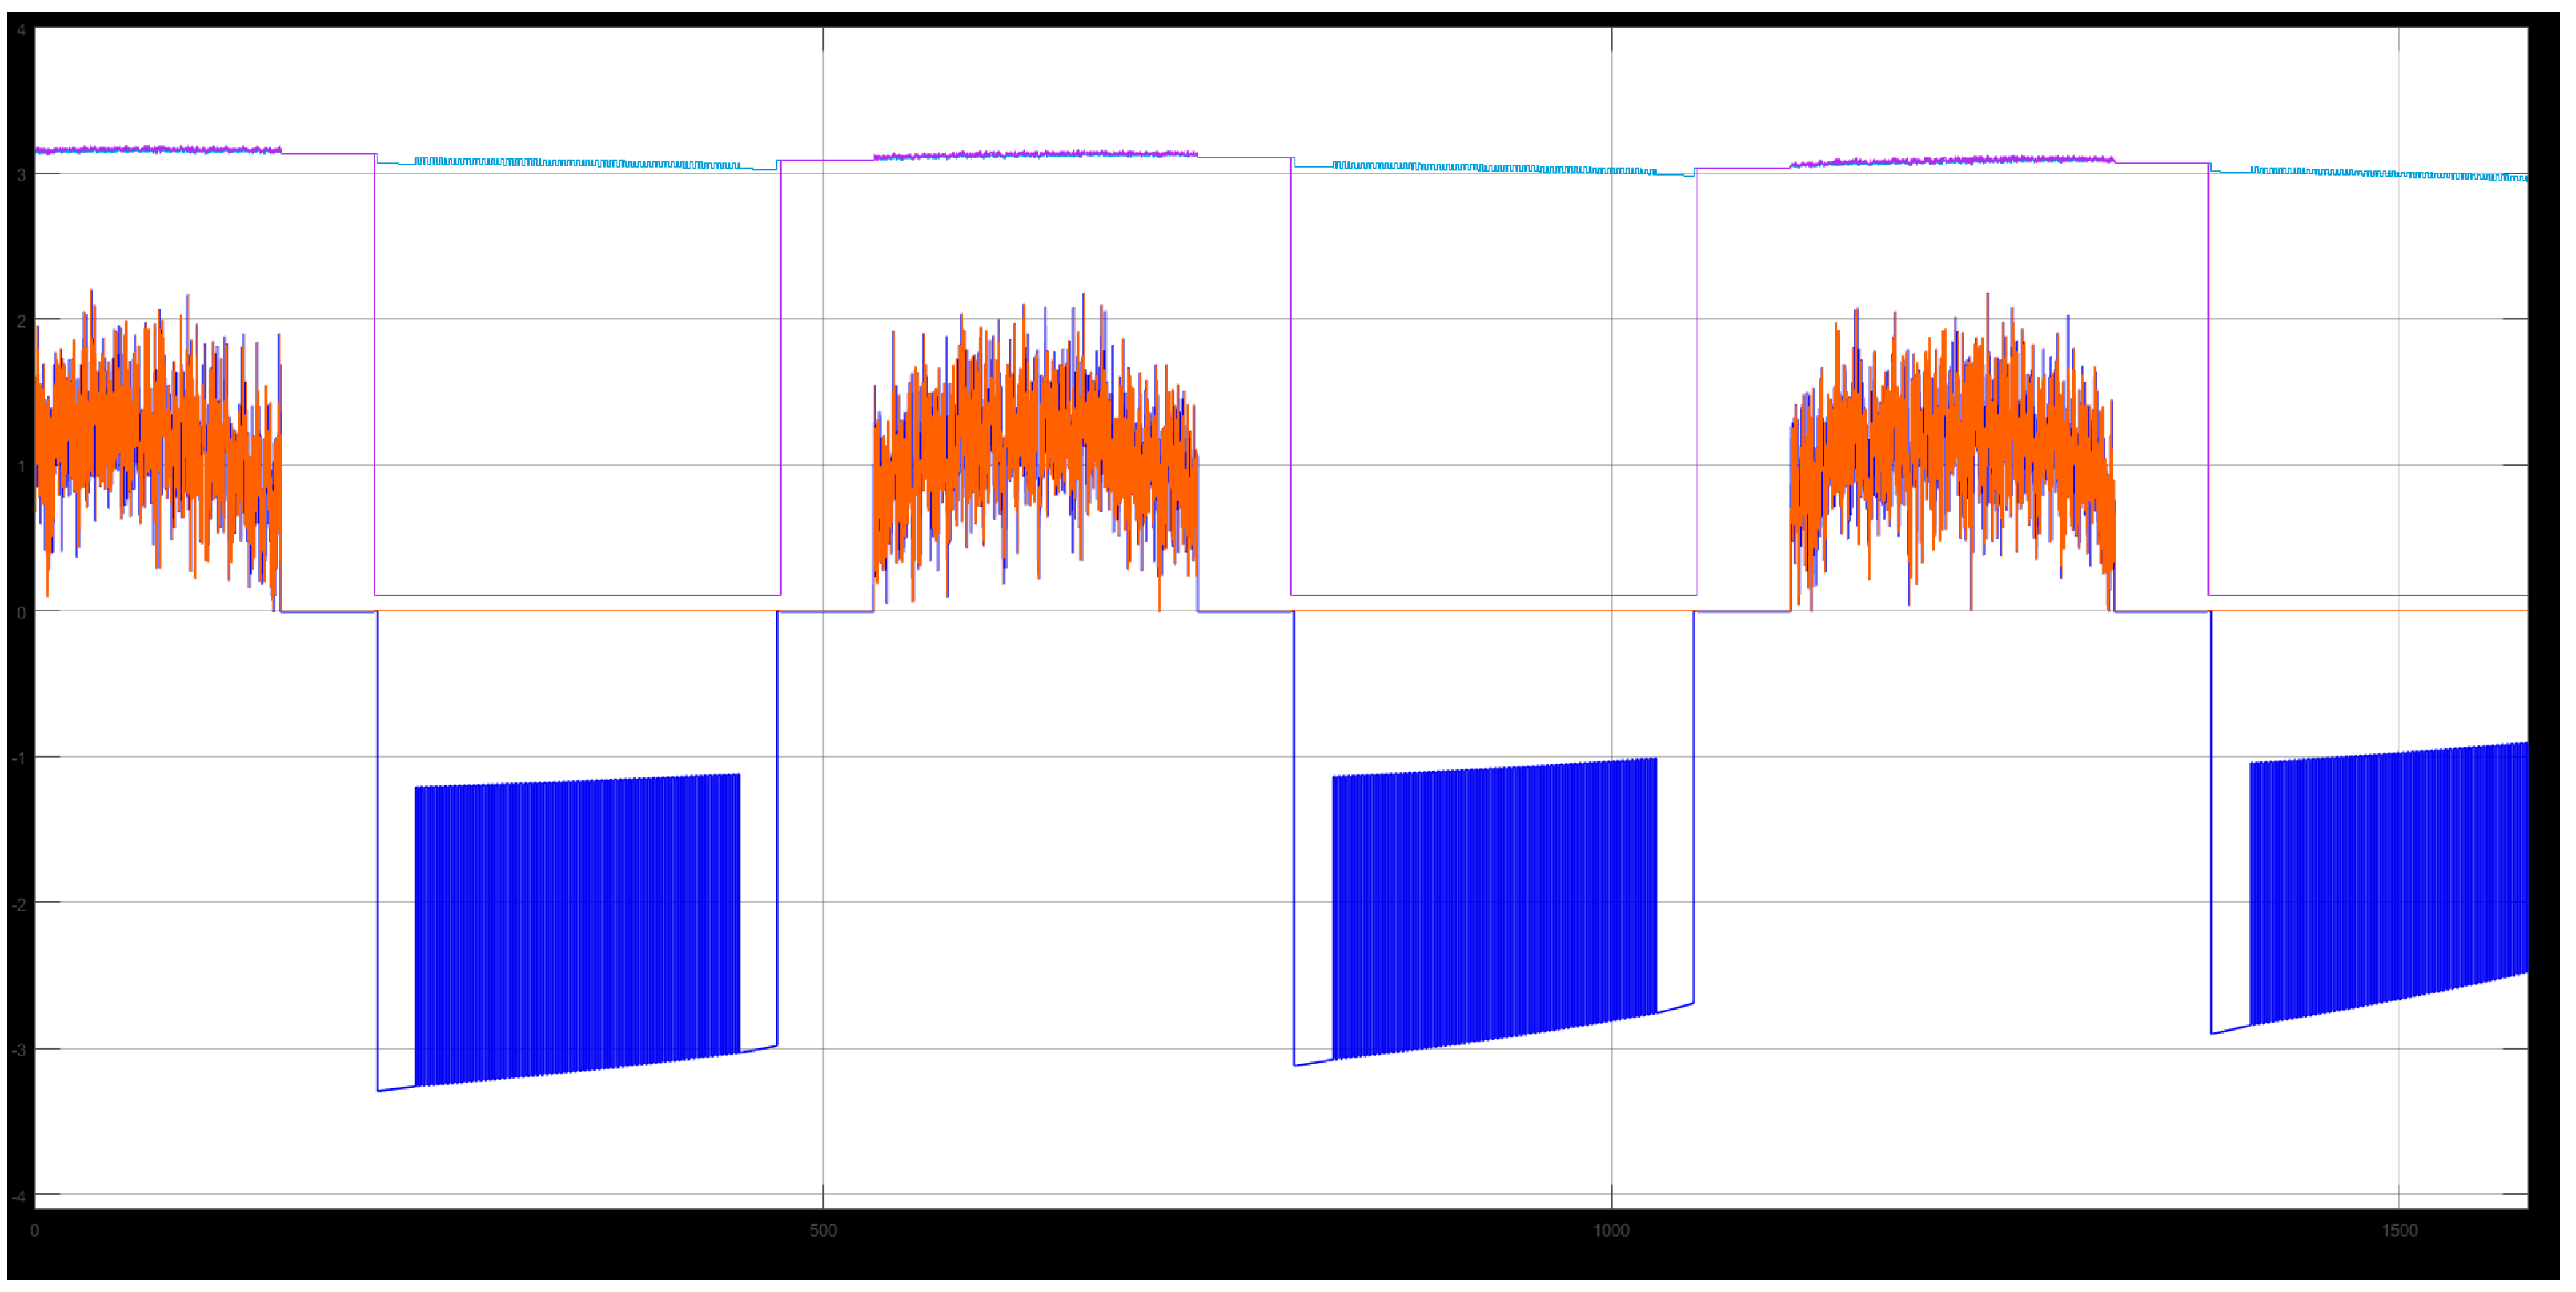
Data Flow: Model-generated data is saved to a MAT file as output, containing time values, solar intensity, and power consumption. Using Python, this data is extracted into a CSV file for further processing, including normalization, preparation, and splitting.
Machine Learning Models for Simulation and Forecasting: Several machine learning models—LSTM, Random Forest, GRU, and Linear Regression—are applied to predict power consumption. The model is trained on data from the simulated MATLAB model, using solar intensity and time as input parameters and power output as the target variable.
The following experiments were implemented:
1. Synthetic random values are used as sunlight intensity input for the solar panel simulation model in Simulink to model power generation. The output power values from the simulated model are then used as input for the RNN model. Both generated and consumed power are measured and utilized for training the machine learning (ML) model. The presence sensor signal is simulated at a preset frequency.
Figure 9.
Simulink solar-powered lamp model output with random simulated solar intensity for 11 days. Here: Red – conventional system power consumption, black – battery current (positive during charge cycle), orange – PV panel current, violet – panel voltage, yellow – battery voltage.
Figure 9.
Simulink solar-powered lamp model output with random simulated solar intensity for 11 days. Here: Red – conventional system power consumption, black – battery current (positive during charge cycle), orange – PV panel current, violet – panel voltage, yellow – battery voltage.
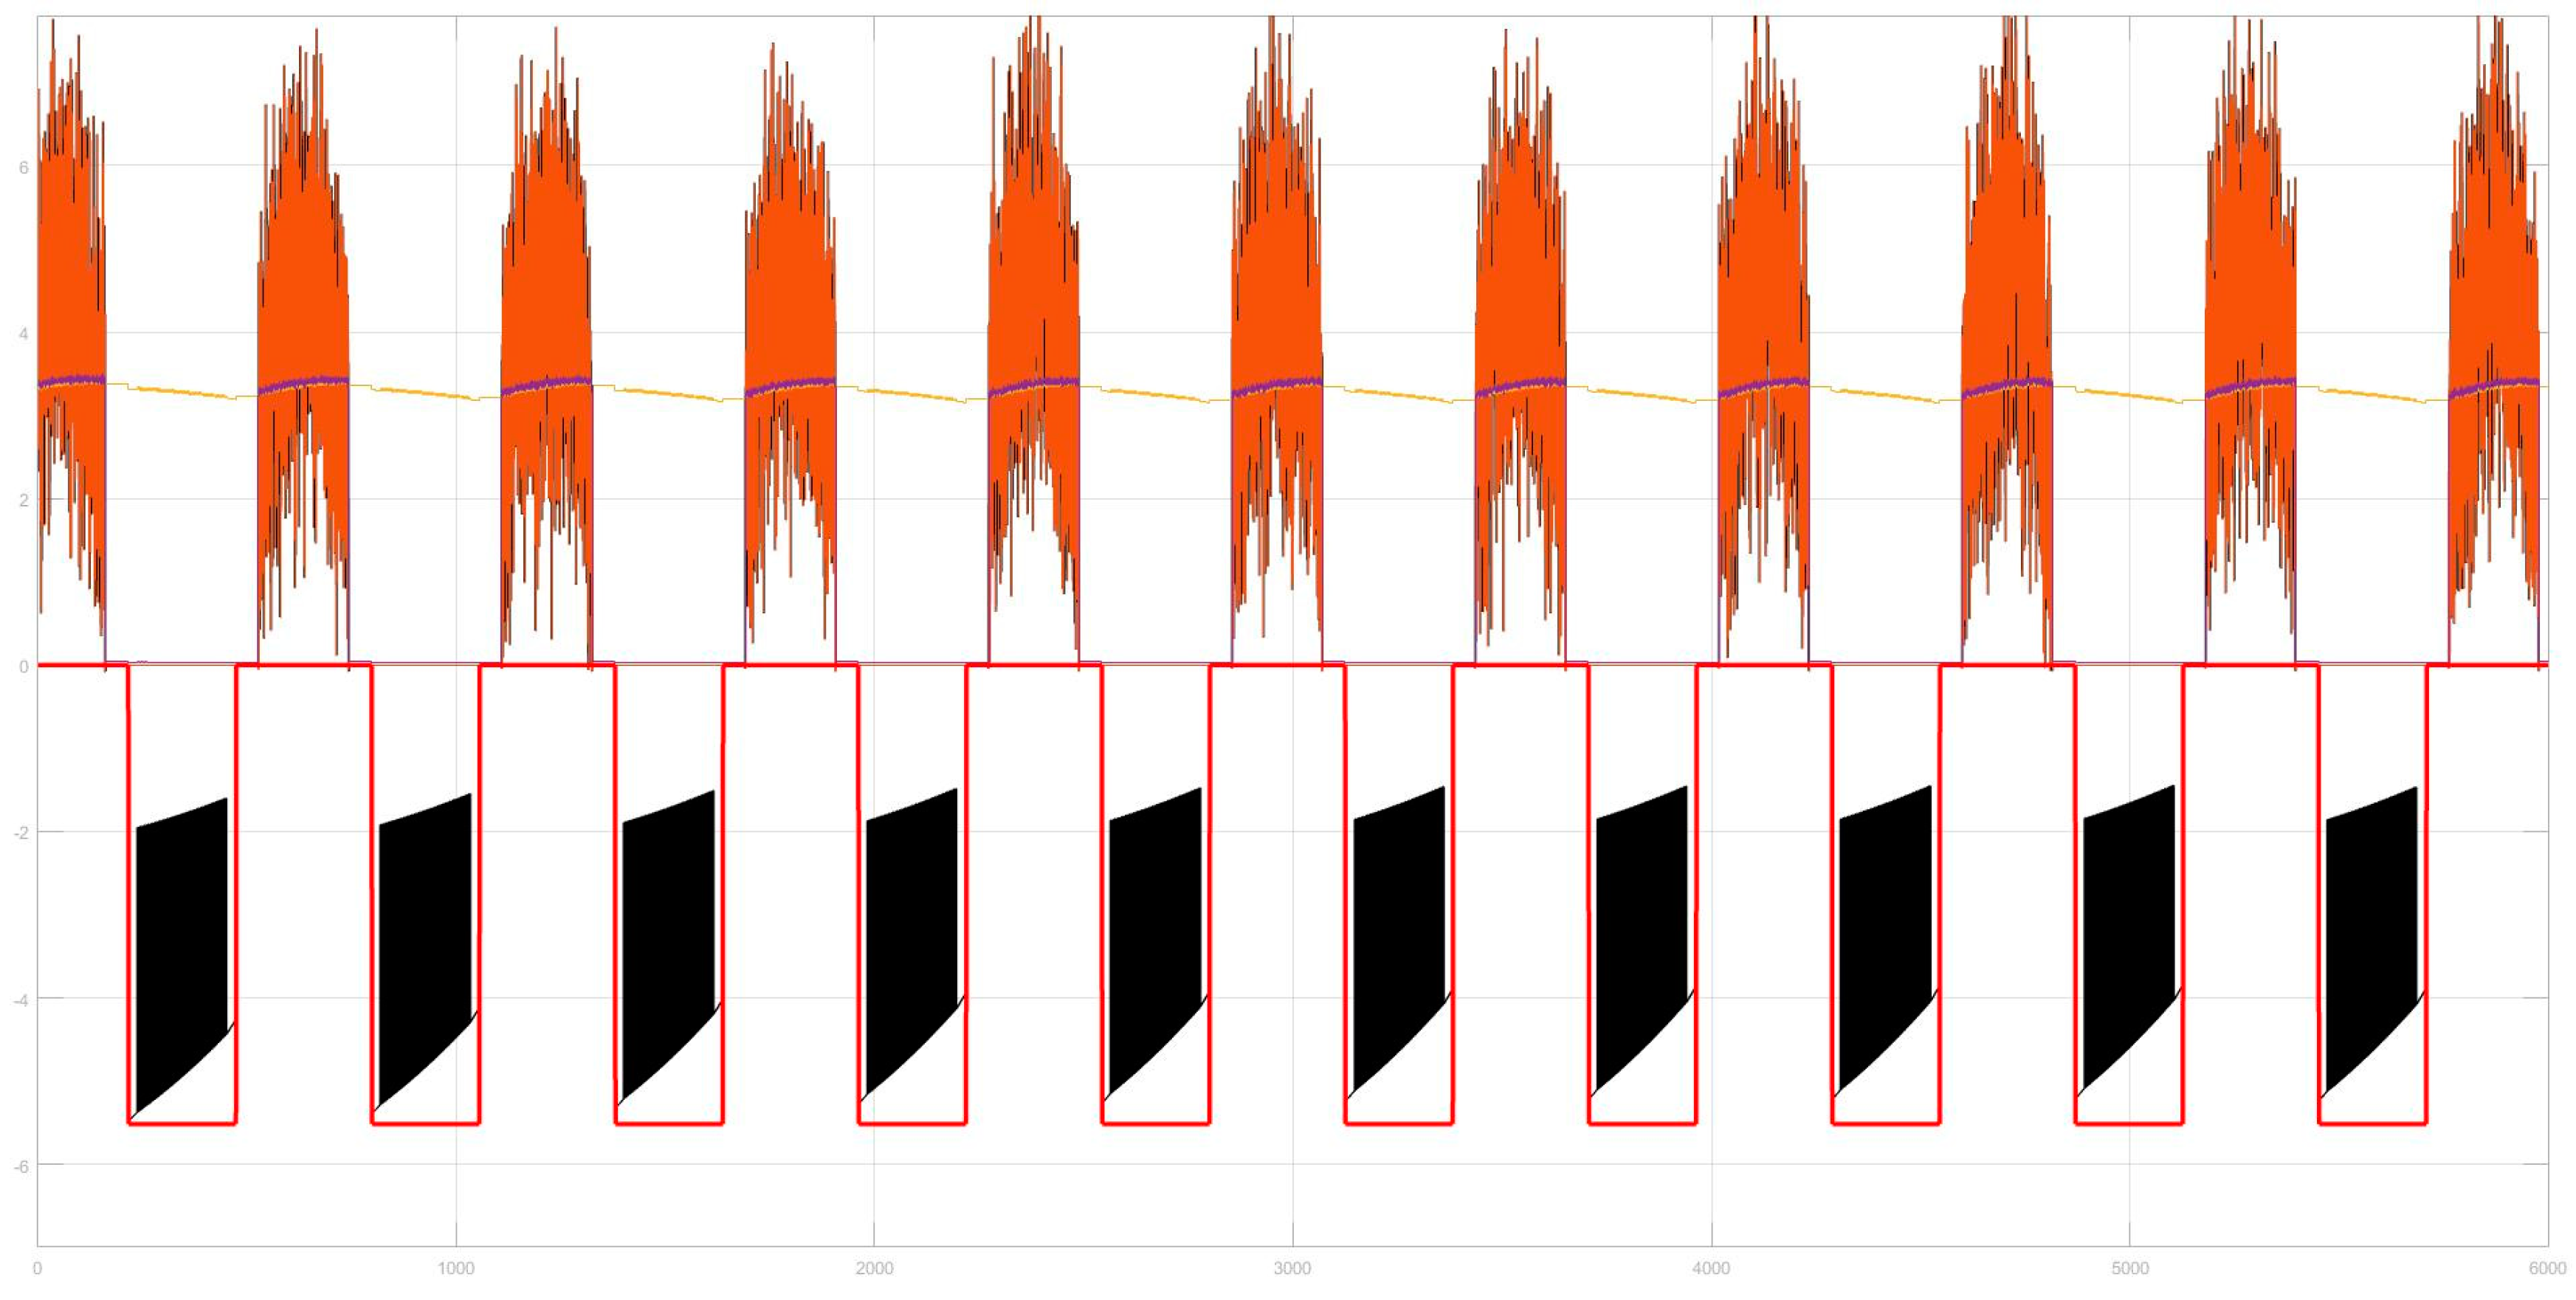
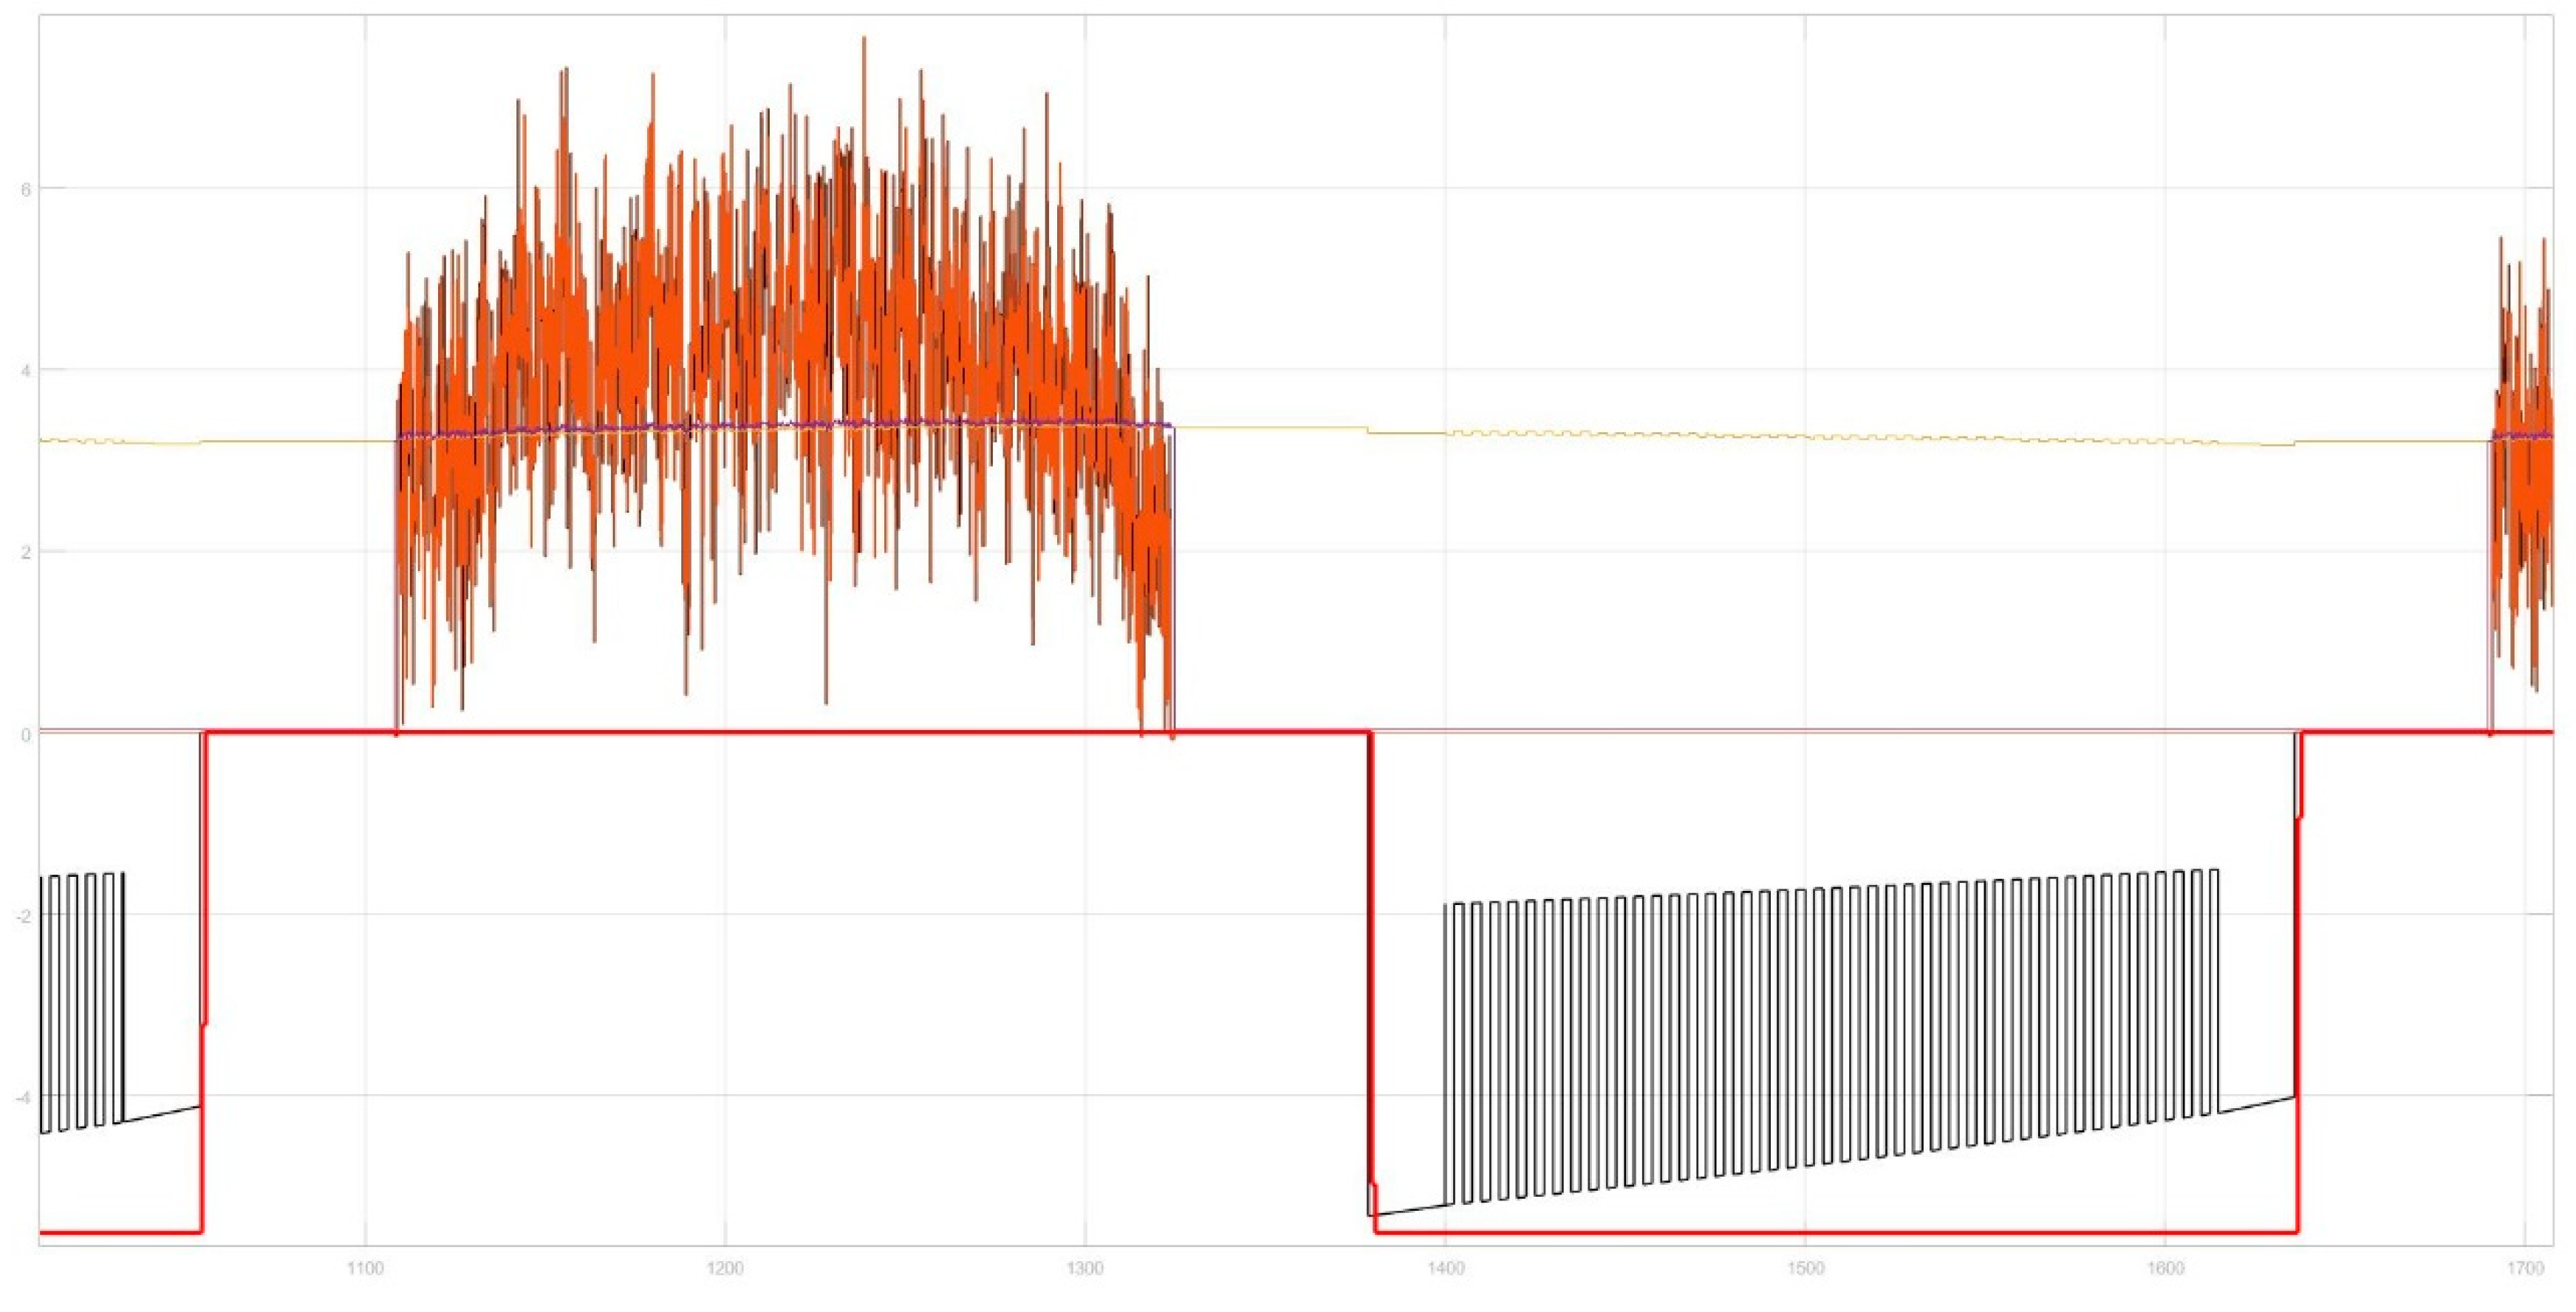
Figure 10 shows the power flow to and from the battery. As the battery discharges, the voltage and LED power decrease within certain limits. After the charge cycle, the voltage is restored. The decrease rate depends on the relation to LED power/battery capacity. The logic of the lamp’s control system is that external power will be supplied if the voltage decreases below a certain level.
The energy of the lamp during the daytime includes
Where – stored from the previous day, – produced during the current day, – losses, including control system consumption, battery self-discharge, leakage, etc.
The energy of the sun panel is the function of solar irradiation intensity During the i-th day.
Losses are the function of the temperature Which influences the panel efficiency and battery capacity.
Energy consumed by LED during the i-th day is a function of the sensor frequency activation .
ANN Training for Panel Power Generation Prediction
Artificial intelligence (AI) is trained using climatic data and power values as output from the simulation model.
Figure 11.
AI predicted values and Simulink model data comparison randomized solar radiation input data.
Figure 11.
AI predicted values and Simulink model data comparison randomized solar radiation input data.
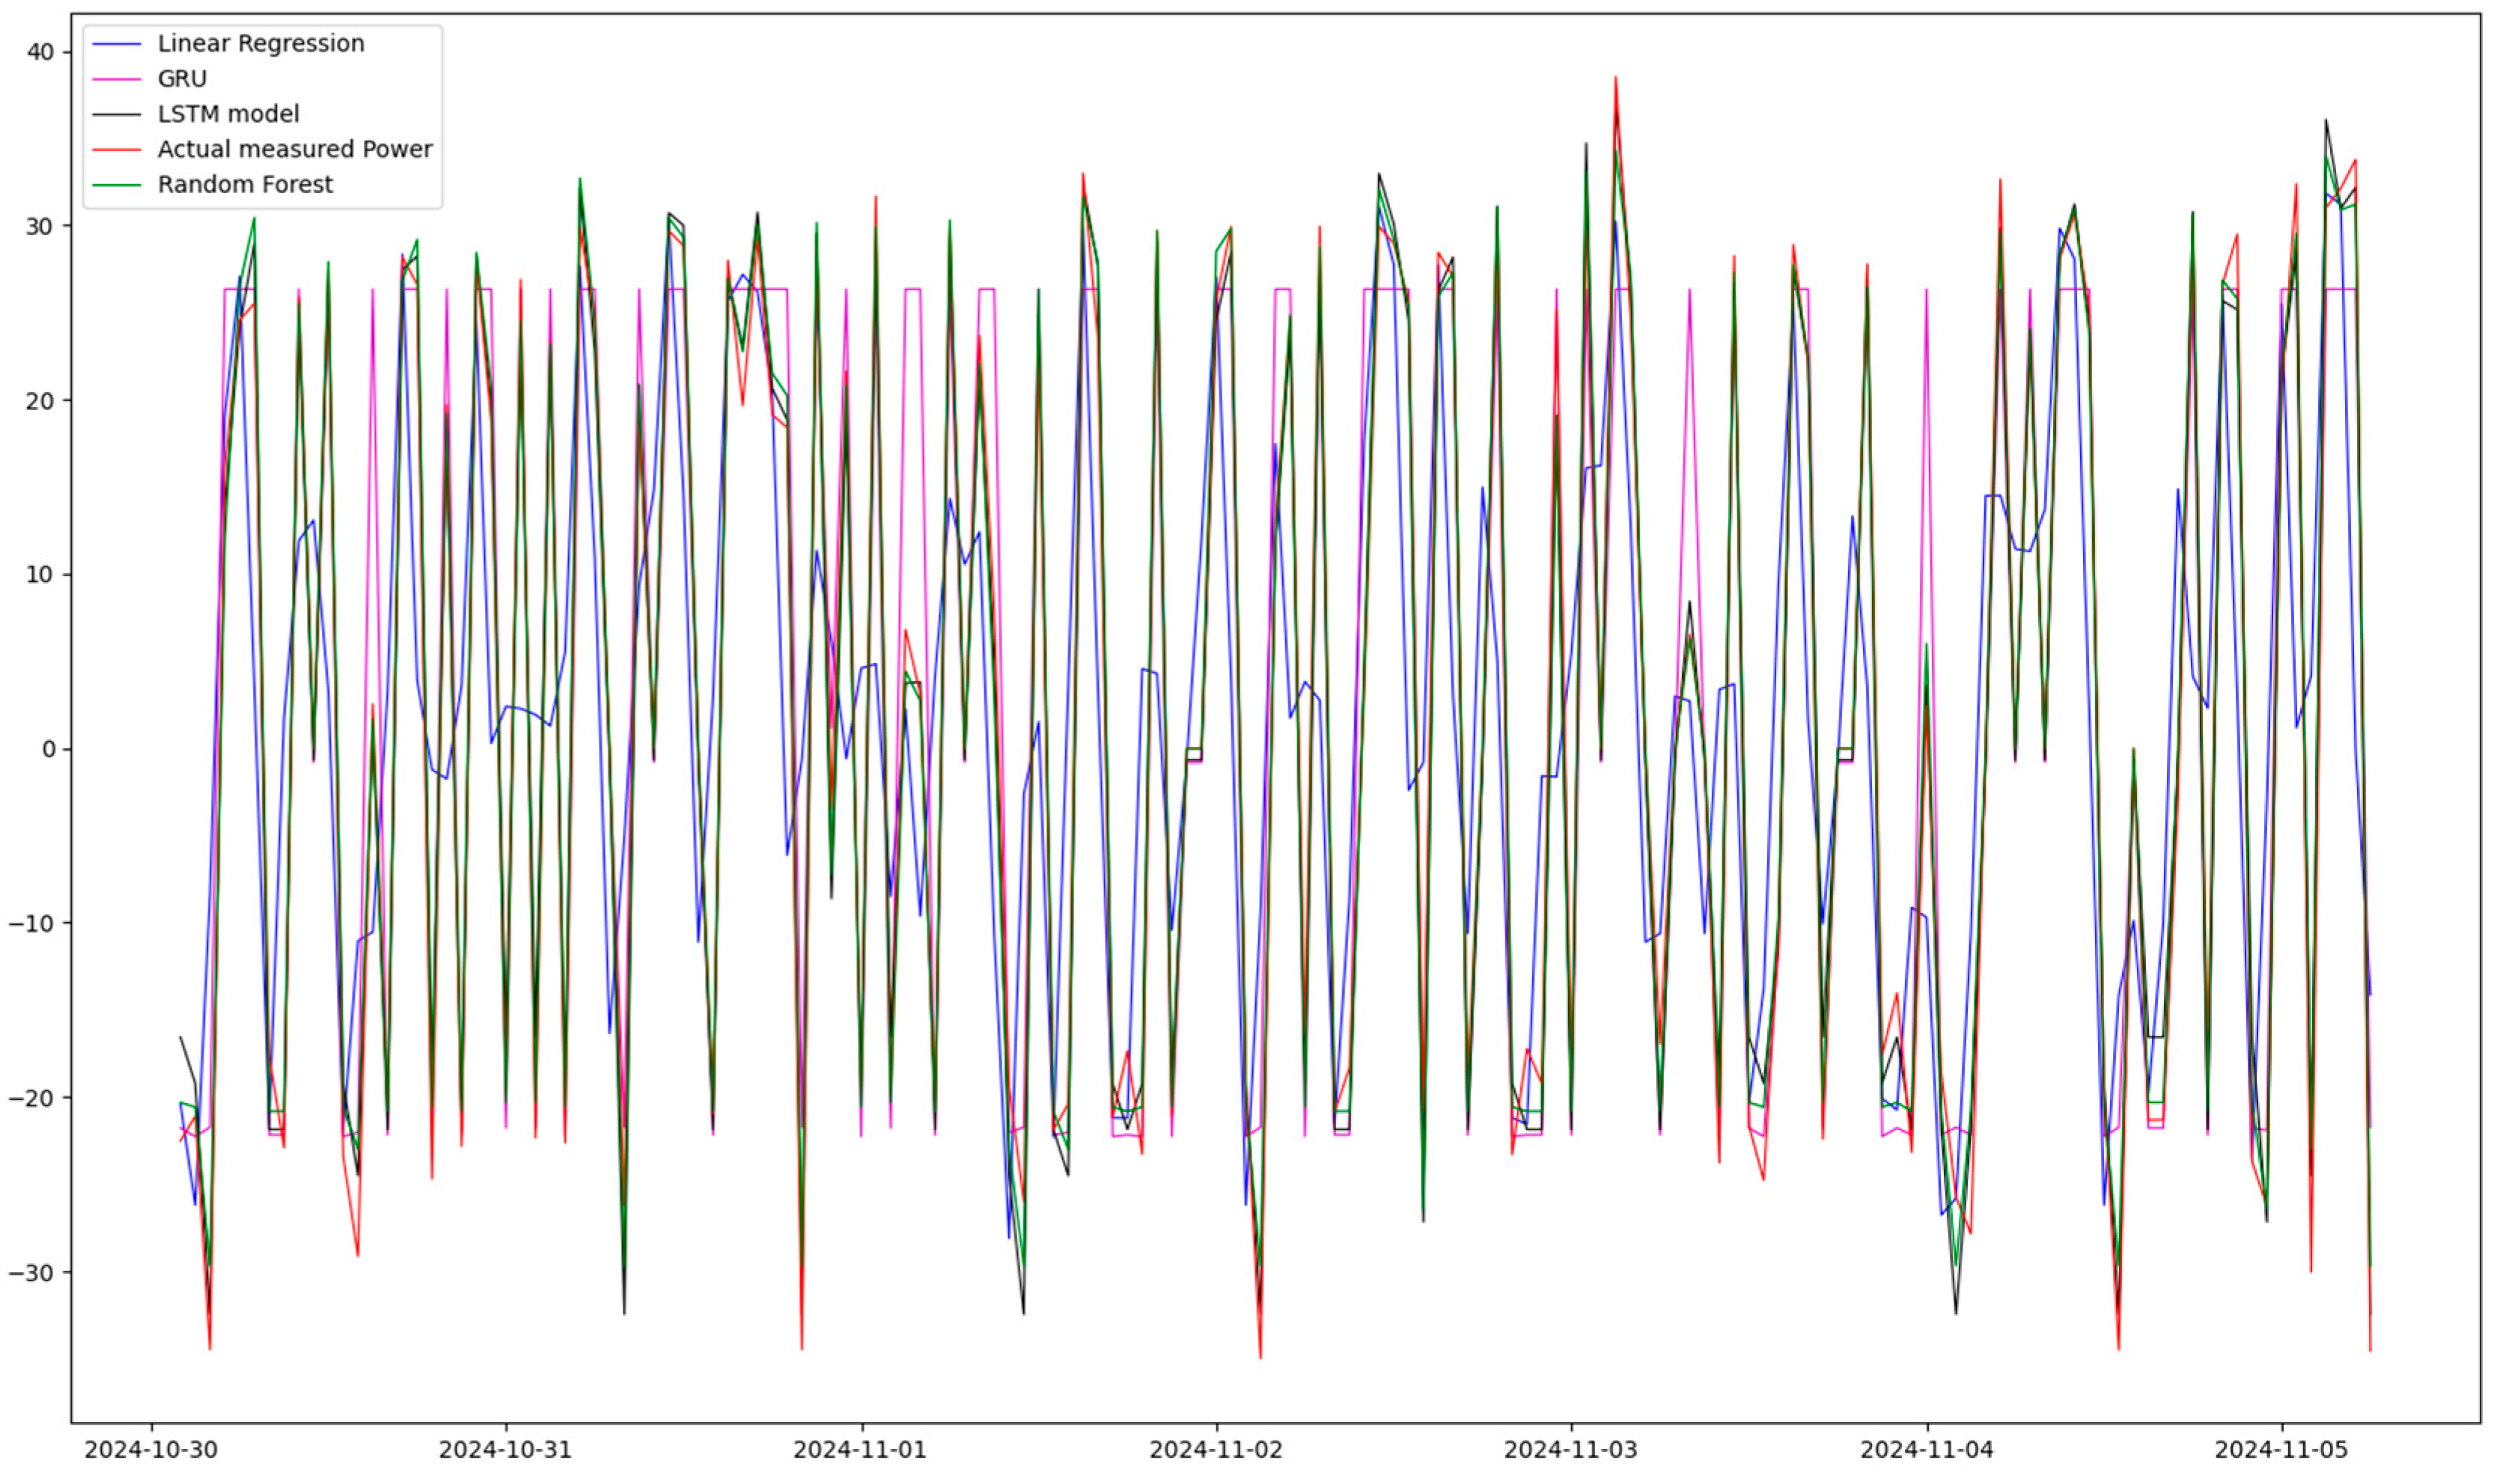
As shown in [18], advanced and more complex algorithms can provide the best results for predicting solar irradiation with high variability for prolonged periods. Simple regression methods are often unsuitable for this task.
Random Forest regression, LSTM, Gated Recurrent Unit, and linear regression models are tested to predict power consumption. The model is trained using data generated by the Simulink model, with solar intensity and power consumption as the output.
The following table contains the metrics for different AI models used for power prediction.

Table 1.
Models’ performance comparison.
| Models | Test score | MSE | Test score train | MSE train |
|---|---|---|---|---|
| Lin Regression | 2,631 | 6,923 | 2,590 | 6,707 |
| LSTM | 16,408 | 269,230 | 15,671 | 245,590 |
| Rand Forest | 2,212 | 4,894 | 1,980 | 3,919 |
| GRU | 5,160 | 26,627 | 4,980 | 24,798 |
2. Measured values of solar intensity from a local weather station are used as input to the PV panel in Simulink. This provides a more accurate simulation of the actual operation of the PV panel in the selected area. The presence sensor signal is simulated at a preset frequency.
3. The solar radiation intensity data from the Photovoltaic geographical information system [21] service for the Almaty location (43.253; 76.961) is used as input for the simulation model.
Figure 12.
Model output for Almaty region.
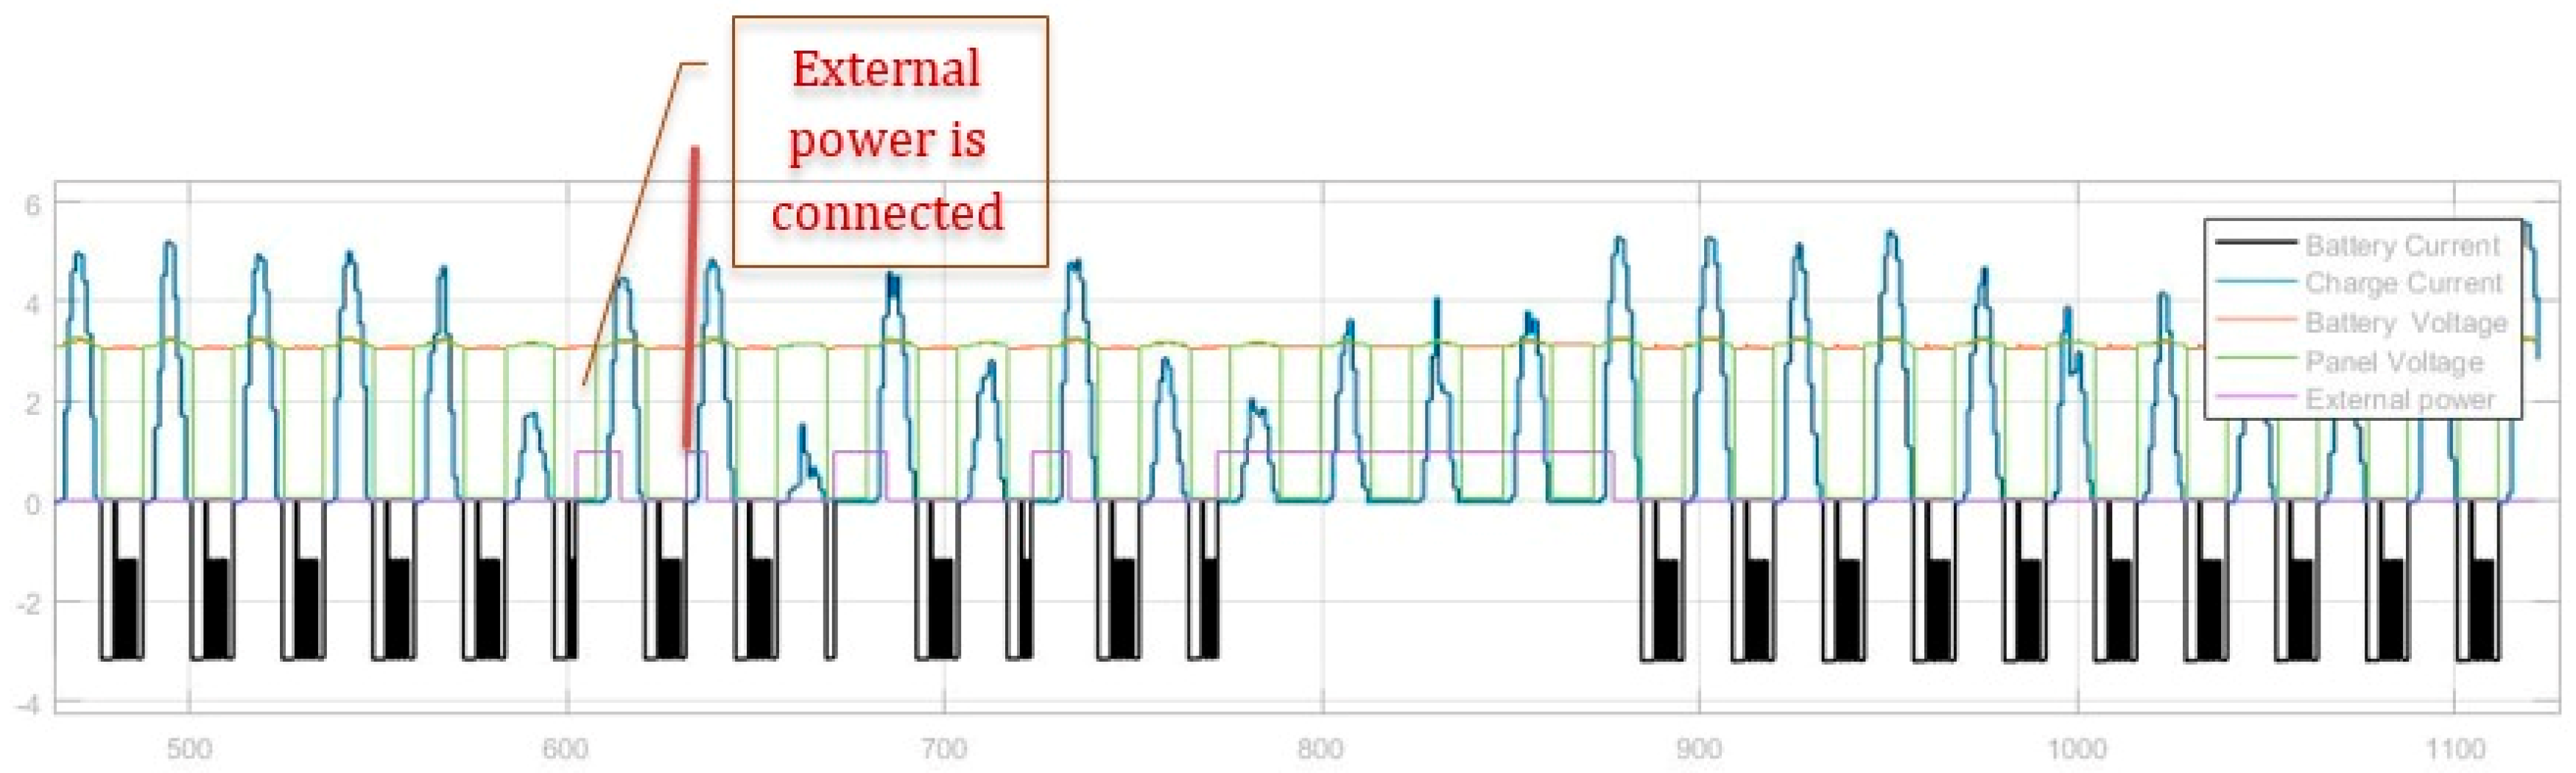
Simulation Output for Almaty Region (January 1–28, 2005): Figure 13 shows the model’s output for January 2005 in the Almaty region. The chart illustrates that the stored battery power is depleted on certain days with low solar irradiation as charging capacity remains insufficient. During these discharge periods, the battery voltage drops below a predefined threshold. In such cases, the LED lamp is powered by an external power source (represented by the ‘External Power’ line in Figure 13) during dark hours, and the battery current drops to zero (illustrated by the ‘Battery Current’ line). Once sufficient solar charging occurs the LED lamps resume operation on battery power. This transition may follow several days of severe weather conditions.
Predictive Power Management Using AI: Using artificial intelligence, the model can predict instances of battery discharge based on weather data. By leveraging weather forecasts as input, AI models can anticipate the need for external power support. The model output and measured solar irradiation data serve as training inputs for these AI models, enabling accurate predictions of battery voltage and the timing for external power activation.
Results and Discussion
Simulation Results
Simulation Outcomes and System Performance: The simulation indicates that the solar-powered LED lighting system performs effectively under typical weather conditions, with significant energy savings achieved when integrated with intelligent control systems. However, the system's dependence on a backup power source becomes essential in cloudy or overcast conditions.
Study Scope: This research examines the operational characteristics of a solar-powered LED street lighting system tailored for the Almaty region, utilizing meteorological data from the OpenWeatherMap online service. The system configuration includes three 90 W LED lamps, a 3.2 V, 2.4 Ah battery, and nine photovoltaic (PV) modules connected in series, each providing 0.505 V. A motion sensor is incorporated to optimize energy consumption further.
Simulation Results: Findings demonstrate that the proposed system can maintain functionality under cloudy conditions for up to three consecutive days, reducing power by 30% during low-generation periods. Given Almaty’s continental climate's considerable seasonal variation, predictive modeling indicates that external power support remains under 10% during summer, with a peak requirement of up to 30% during winter.
Implications and Future Work: These results highlight the potential for implementing solar-powered lighting systems in regions with similar climate conditions. Future research will involve deploying a prototype lamp to capture real-world performance data, facilitating a comprehensive comparison between actual operational parameters and simulation outcomes.
ANN Prediction Accuracy
Artificial Neural Network-Based Prediction of Power Consumption: This study demonstrates the efficacy of an Artificial Neural Network (ANN) model in accurately predicting power consumption for solar-powered street lighting systems, mainly when using real-time weather data. Among the algorithms tested, the Long Short-Term Memory (LSTM) model exhibited the highest predictive accuracy, followed by Random Forest and Linear Regression.
Model Development and Training: Through a comprehensive training process, we developed an AI model capable of forecasting electrical load and power generation for solar street lighting. The model was trained on three distinct datasets, enhancing its adaptability to selecting the most appropriate dataset for specific environmental conditions. The prediction framework includes LSTM, linear regression, and random forest algorithms.
Versatility and Transparency of the Simulink Model: The proposed Simulink simulation model is designed to be adaptable for forecasting the performance of new street lighting systems based on local requirements. The fully transparent model captures internal interactions and external parameter influences, which can be fine-tuned to meet specific system demands—such as battery capacity, LED brightness levels, and PV panel output.
System Design Optimization: Using this simulation model, designing a solar-powered street lighting system—including all associated components—becomes streamlined. Given adequate weather and climate data for the target location, the model enables precise estimation of required PV panel output and visualizes system performance. It also allows for accurate analysis of the necessary battery capacity to maintain system load 95% of the time, accommodating specified cloudy periods without external power reliance. The model provides critical insights into system design and performance by visualizing the interactions between climate, PV power, and battery capacity.
Future Work: The next phase of this research involves implementing the proposed system. A prototype will be installed in Kazakhstan, where real-world data will be collected to refine the predictive model further. An article documenting this implementation phase is currently being prepared.
An article on finding optimal system parameters will be issued. Other research will be done on system losses and modeling the temperature effect on the overall lamp’s effectiveness.
Impact on External Power Sources
When the system is connected to an external power source, it ensures a consistent power supply, even during periods of low solar intensity. This feature is significant in regions with prolonged periods of low sunlight.
Conclusion
This study successfully demonstrates the feasibility of using a solar-powered street lighting system with sensor-based control and power consumption prediction. The ANN model provides accurate predictions of system load and can help optimize energy use in urban areas. Future research will focus on real-world implementation and further system optimization based on climatic data from different regions.
Funding
This research is funded by the Science Committee of the Ministry of Science and Higher Education of the Republic of Kazakhstan (Grant No. AP19679604 "Intelligent street lighting - optimized common system of controlled autonomous LED lamps with highly efficient and durable electronic control mechanism”).
References
- Impact of Artificial Intelligence on the digital and data transformation in the electricity sector Economic Commission for Europe Committee on Sustainable Energy Group of Experts on Energy Efficiency Group of Experts on Cleaner Electricity Systems Eleventh session Geneva, 16-17 September 2024 ECE_ENERGY_GE.6_2024_3_ECE_ENERGY_GE.5_2024_3e.
- Tukymbekov, D.; Saymbetov, A.; Nurgaliyev, M.; Kuttybay, N.; Dosymbetova, G.; Svanbayev, Y. Intelligent autonomous street lighting system based on weather forecast using LSTM. Energy 2021, 231, 120902. [Google Scholar] [CrossRef]
- Mohandasa, P.; Dhanaraj, J.S.A.; Gao, X.-Z. Artificial Neural Network based Smart and Energy Efficient Street Lighting System: A Case Study for Residential area in Hosur. Sustainable Cities and Society 2019, 48, 101499. [Google Scholar] [CrossRef]
- Maronchuk, I.I.; Shirokov, I.V.; Velchenko, A.A.; Mironchuk, V.I. Intelligent LED Lighting System. ENERGETIKA. Proc. CIS High. Educ. institutions Power Eng. Assoc. 2018, 61, 440–450. [Google Scholar] [CrossRef]
- Subramani, C.; Surya, S.; Gowtham, J.; Chari, R.; Srinivasan, S.; Siddharth, J.P.; Shrimali, H. Energy efficiency and pay-back calculation on street lighting systems. C. Subramani; S. Surya; J. Gowtham; Rahul Chari; S. Srinivasan; J. P. Siddharth; Hemant Shrimali AIP Conf. Proc. 2112, 020082 (2019).
- The Street Lighting Integrated System Case Study, Control Scenarios, Energy Efficiency. Ożadowicz A. Eng.D., Grela J. MSc.
- Abu Adma, M.A.; Elmasry, S.S.; Ahmed, M.H.S.; Ghitas, A. Practical investigation for road lighting using renewable energy sources "Sizing and modelling of solar/wind hybrid system for road lighting application". Renew. Energy Sustain. Dev. 2017, 3, 258–266. [Google Scholar] [CrossRef]
- Solar Energy Utilization Analysis on Public Street Lighting in Sulur Kulon Progo Novi Caroko1, Lilis Kurniasari PROCEEDING INTERNATIONAL CONFERENCE OF TECHNOLOGY ON COMMUNITY AND ENVIRONMENTAL DEVELOPMENT « Green Technology for Future 4.0 Community and Environment ».
- Valiullin, K.R.; Orenburg State University. Imitational Modeling of a Street Lighting System. Electrotech. Syst. Complexes 2018. [Google Scholar] [CrossRef]
- Pantoni, R.; Brandão, D. A confirmation-based geocast routing algorithm for street lighting systems. Comput. Electr. Eng. 2011, 37, 1147–1159. [Google Scholar] [CrossRef]
- Carli, R.; Dotoli, M.; Pellegrino, R. A decision-making tool for energy efficiency optimization of street lighting. Comput. Oper. Res. 2018, 96, 223–235. [Google Scholar] [CrossRef]
- Beccali, M.; Bonomolo, M.; Ciulla, G.; Galatioto, A.; Brano, V.L. Improvement of energy efficiency and quality of street lighting in South Italy as an action of Sustainable Energy Action Plans. The case study of Comiso (RG). Energy 2015, 92, 394–408. [Google Scholar] [CrossRef]
- Li, G.; Wang, H.; Zhang, S.; Xin, J.; Liu, H. Recurrent Neural Networks Based Photovoltaic Power Forecasting Approach. Energies 2019, 12, 2538. [Google Scholar] [CrossRef]
- Dewangan, C.L.; Singh, S.; Chakrabarti, S. Combining forecasts of day-ahead solar power. Energy 2020, 202, 117743. [Google Scholar] [CrossRef]
- Lau, S.P.; Merrett, G.V.; Weddell, A.S.; White, N.M. A traffic-aware street lighting scheme for Smart Cities using autonomous networked sensors. Comput. Electr. Eng. 2015, 45, 192–207. [Google Scholar] [CrossRef]
- Chai, M.; Xia, F.; Hao, S.; Peng, D.; Cui, C.; Liu, W. PV Power Prediction Based on LSTM With Adaptive Hyperparameter Adjustment. IEEE Access 2019, 7, 115473–115486. [Google Scholar] [CrossRef]
- Modeling of Battery Charging Algorithms Martyanov A.S., Korobatov D.V., Sirotkin E.A. South Ural State University 2016 2nd International Conference on Industrial Engineering, Applications and Manufacturing (ICIEAM).
- Fouilloy, A.; Voyant, C.; Notton, G.; Motte, F.; Paoli, C.; Nivet, M.-L.; Guillot, E.; Duchaud, J.-L. Solar irradiation prediction with machine learning: Forecasting models selection method depending on weather variability. Energy 2018, 165, 620–629. [Google Scholar] [CrossRef]
- Jia, H.; Feng, P.X.L. Huang X, Shi J, Gao B, Tai Y, Chen Z, Zhang J. Forecasting hourly solar irradiance using hybrid wavelet transformation and Elman model in smart grid. IEEE Access 2019, 7, 139909e23. [Google Scholar] [CrossRef]
- https://www.kaggle.com/datasets/ferhatmetin34/solar-power-electricity-production/data.
- https://re.jrc.ec.europa.eu/pvg_tools/en/#TMY.
- Okonta, D.E.; Vukovic, V. Smart cities software applications for sustainability and resilience. Heliyon 2024, 10, e32654. [Google Scholar] [CrossRef]
- Impact of Artificial Intelligence on the digital and data transformation in the electricity sector Economic Commission for Europe Committee on Sustainable Energy Group of Experts on Energy Efficiency Group of Experts on Cleaner Electricity Systems Eleventh session Geneva, 16-17 September 2024 ECE_ENERGY_GE.6_2024_3_ECE_ENERGY_GE.5_2024_3e.
- Tukymbekov, D.; Saymbetov, A.; Nurgaliyev, M.; Kuttybay, N.; Dosymbetova, G.; Svanbayev, Y. Intelligent autonomous street lighting system based on weather forecast using LSTM. Energy 2021, 231, 120902. [Google Scholar] [CrossRef]
- Mohandasa, P.; Dhanaraj, J.S.A.; Gao, X.-Z. Artificial Neural Network based Smart and Energy Efficient Street Lighting System: A Case Study for Residential area in Hosur. Sustainable Cities and Society 2019, 48, 101499. [Google Scholar] [CrossRef]
- Maronchuk, I.I.; Shirokov, I.V.; Velchenko, A.A.; Mironchuk, V.I. Intelligent LED Lighting System. ENERGETIKA. Proc. CIS High. Educ. institutions Power Eng. Assoc. 2018, 61, 440–450. [Google Scholar] [CrossRef]
- Subramani, C.; Surya, S.; Gowtham, J.; Chari, R.; Srinivasan, S.; Siddharth, J.P.; Shrimali, H. Energy efficiency and pay-back calculation on street lighting systems. C. Subramani; S. Surya; J. Gowtham; Rahul Chari; S. Srinivasan; J. P. Siddharth; Hemant Shrimali AIP Conf. Proc. 2112, 020082 (2019). [CrossRef]
- The Street Lighting Integrated System Case Study, Control Scenarios, Energy Efficiency. Ożadowicz A. Eng.D., Grela J. MSc.
- Abu Adma, M.A.; Elmasry, S.S.; Ahmed, M.H.S.; Ghitas, A. Practical investigation for road lighting using renewable energy sources "Sizing and modelling of solar/wind hybrid system for road lighting application". Renew. Energy Sustain. Dev. 2017, 3, 258–266. [Google Scholar] [CrossRef]
- Solar Energy Utilization Analysis on Public Street Lighting in Sulur Kulon Progo Novi Caroko1, Lilis Kurniasari PROCEEDING INTERNATIONAL CONFERENCE OF TECHNOLOGY ON COMMUNITY AND ENVIRONMENTAL DEVELOPMENT « Green Technology for Future 4.0 Community and Environment ».
- IMITATIONAL MODELING OF A STREET LIGHTING SYSTEM Kamil R. Valiullin. [CrossRef]
- Pantoni, R.; Brandão, D. A confirmation-based geocast routing algorithm for street lighting systems. Comput. Electr. Eng. 2011, 37, 1147–1159. [Google Scholar] [CrossRef]
- Carli, R.; Dotoli, M.; Pellegrino, R. A decision-making tool for energy efficiency optimization of street lighting. Comput. Oper. Res. 2018, 96, 223–235. [Google Scholar] [CrossRef]
- Beccali, M.; Bonomolo, M.; Ciulla, G.; Galatioto, A.; Brano, V.L. Improvement of energy efficiency and quality of street lighting in South Italy as an action of Sustainable Energy Action Plans. The case study of Comiso (RG). Energy 2015, 92, 394–408. [Google Scholar] [CrossRef]
- Li, G.; Wang, H.; Zhang, S.; Xin, J.; Liu, H. Recurrent Neural Networks Based Photovoltaic Power Forecasting Approach. Energies 2019, 12, 2538. [Google Scholar] [CrossRef]
- Dewangan, C.L.; Singh, S.; Chakrabarti, S. Combining forecasts of day-ahead solar power. Energy 2020, 202, 117743. [Google Scholar] [CrossRef]
- Lau, S.P.; Merrett, G.V.; Weddell, A.S.; White, N.M. A traffic-aware street lighting scheme for Smart Cities using autonomous networked sensors. Comput. Electr. Eng. 2015, 45, 192–207. [Google Scholar] [CrossRef]
- Chai, M.; Xia, F.; Hao, S.; Peng, D.; Cui, C.; Liu, W. PV Power Prediction Based on LSTM With Adaptive Hyperparameter Adjustment. IEEE Access 2019, 7, 115473–115486. [Google Scholar] [CrossRef]
- Modeling of Battery Charging Algorithms Martyanov A.S., Korobatov D.V., Sirotkin E.A. South Ural State University 2016 2nd International Conference on Industrial Engineering, Applications and Manufacturing (ICIEAM).
- Fouilloy, A.; Voyant, C.; Notton, G.; Motte, F.; Paoli, C.; Nivet, M.-L.; Guillot, E.; Duchaud, J.-L. Solar irradiation prediction with machine learning: Forecasting models selection method depending on weather variability. Energy 2018, 165, 620–629. [Google Scholar] [CrossRef]
- Huang X, Shi J, Gao B, Tai Y, Chen Z, Zhang J. Forecasting hourly solar irradiance using hybrid wavelet transformation and Elman model in smart grid. IEEE Access 2019, 7, 139909e23. [CrossRef]
- https://www.kaggle.com/datasets/ferhatmetin34/solar-power-electricity-production/data.
- https://re.jrc.ec.europa.eu/pvg_tools/en/#TMY.
- Okonta, D.E.; Vukovic, V. Smart cities software applications for sustainability and resilience. Heliyon 2024, 10, e32654. [Google Scholar] [CrossRef]
- Nymann, P., Svane, F., Poulsen, P. B., Thorsteinsson, S., Lindén, J., Ploug, R. O., Mira Albert, M. D. C., Knott, A., Mogensen, I., & Retoft, K. (2016). Design, Characterization, and Modelling of High Efficient Solar Powered Lighting Systems. In Proceedings of the 2016 European Photovoltaic Solar Energy Conference and Exhibition 2016 (pp. 2827-31).
- Lima, M.A.F.; Carvalho, P.C.; Fernández-Ramírez, L.M.; Braga, A.P. Improving solar forecasting using Deep Learning and Portfolio Theory integration. Energy, 2020; 195, 117016. [Google Scholar] [CrossRef]
- Akindipe, D.; Olawale, O.W.; Bujko, R. Techno-Economic and Social Aspects of Smart Street Lighting for Small Cities – A Case Study. Sustain. Cities Soc. 2022, 84. [Google Scholar] [CrossRef]
- Palomba, V.; Borri, E.; Charalampidis, A.; Frazzica, A.; Karellas, S.; Cabeza, L.F. An Innovative Solar-Biomass Energy System to Increase the Share of Renewables in Office Buildings. Energies 2021, 14, 914. [Google Scholar] [CrossRef]
Figure 2.
Sun power values from the solar power station in Turkey in August 2018 were measured in 15 15-minute steps.
Figure 2.
Sun power values from the solar power station in Turkey in August 2018 were measured in 15 15-minute steps.

Figure 3.
Irradiance values from Photovoltaic geographical information system for Almaty region one hour step.
Figure 3.
Irradiance values from Photovoltaic geographical information system for Almaty region one hour step.
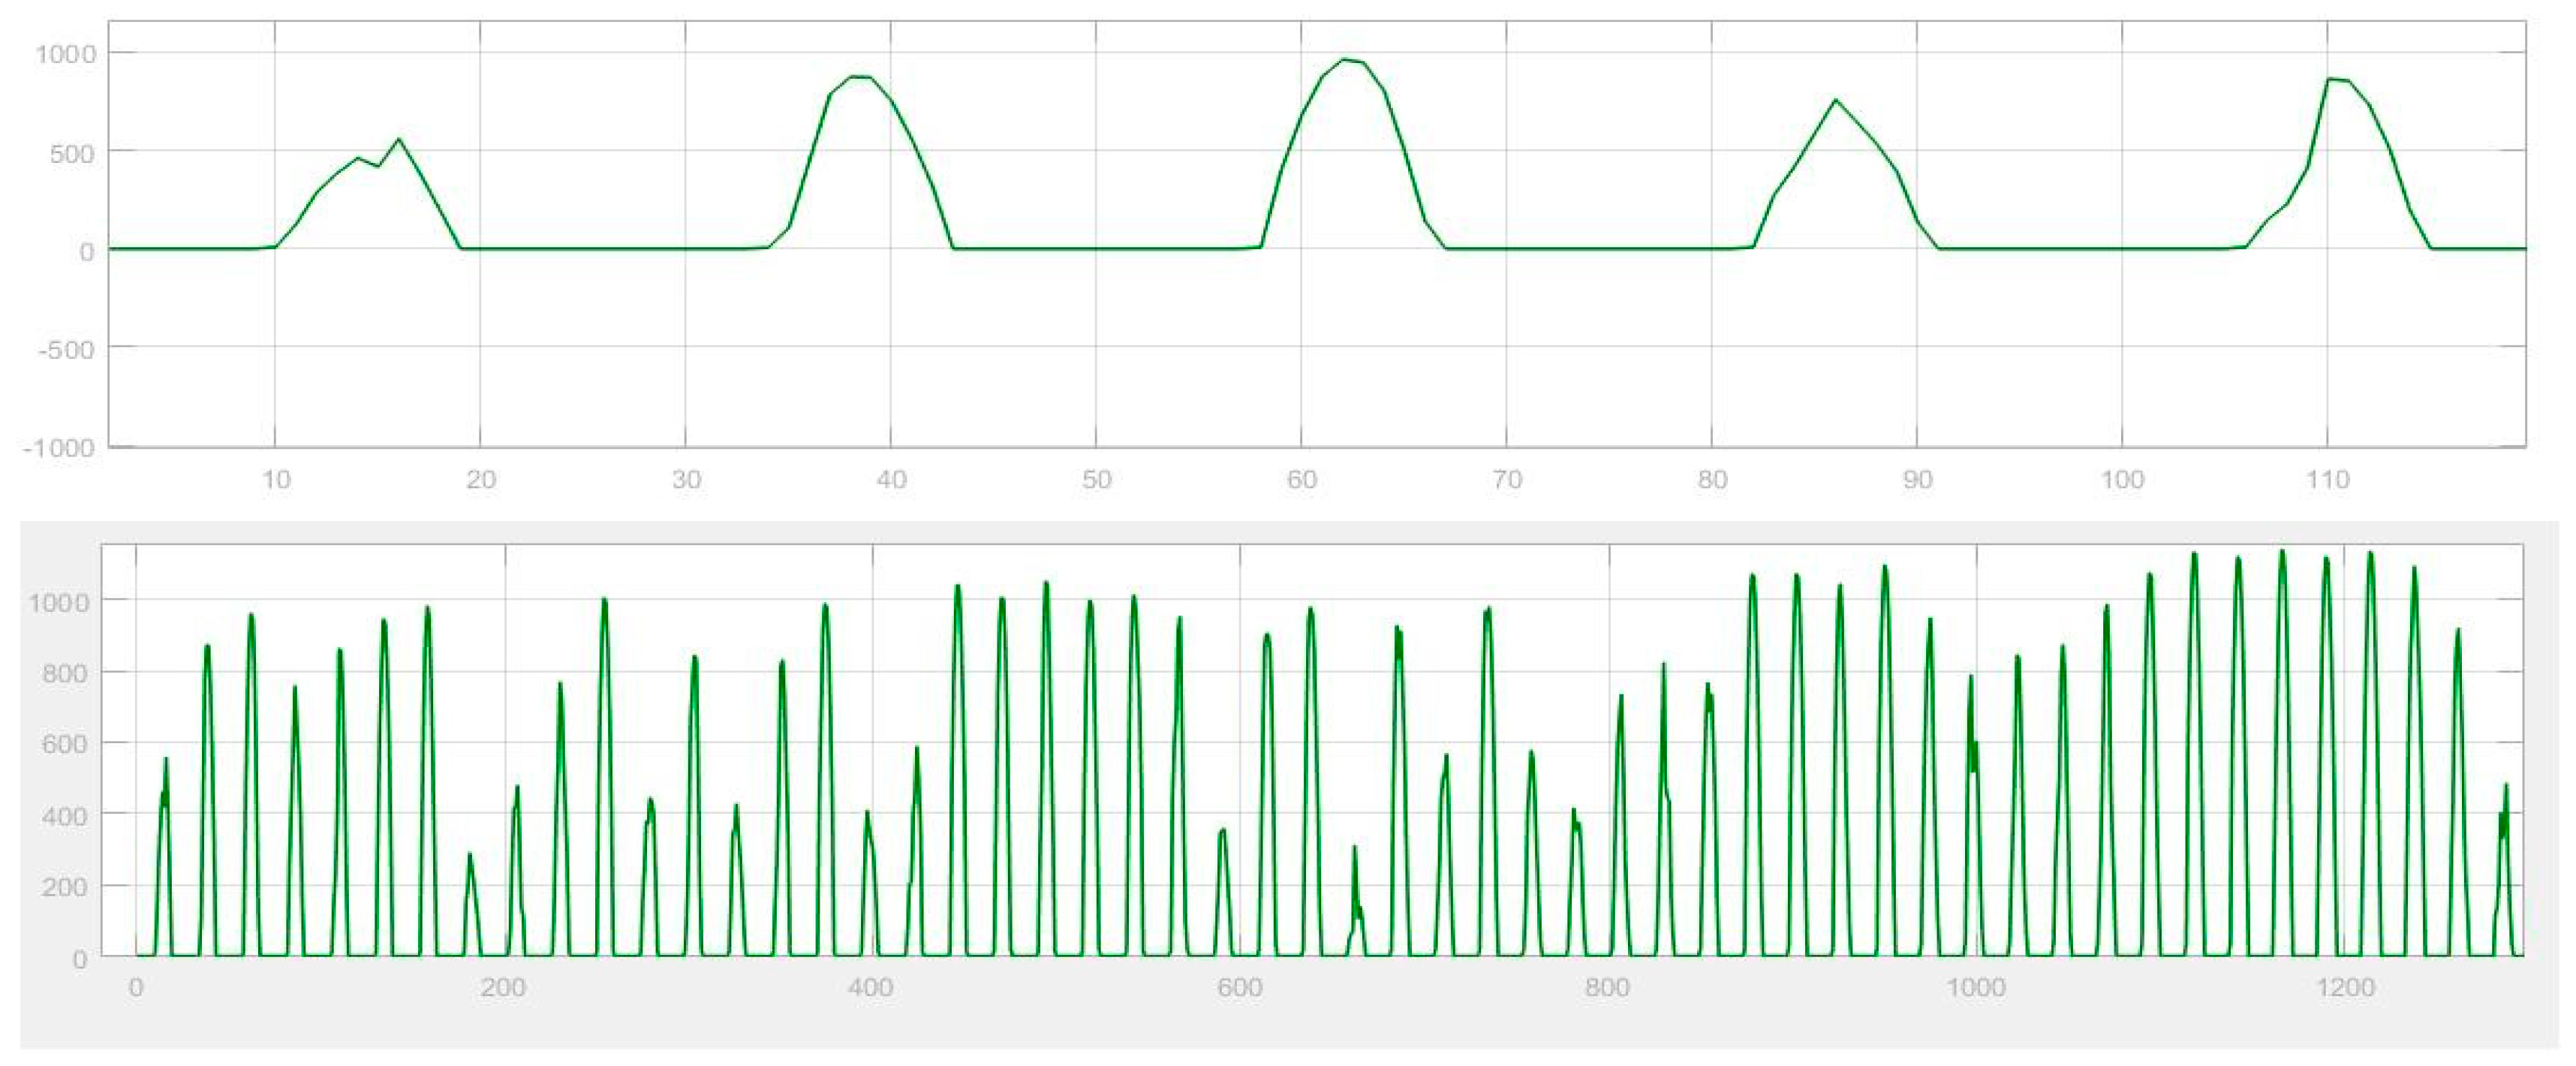
Figure 4.
Model data flow.
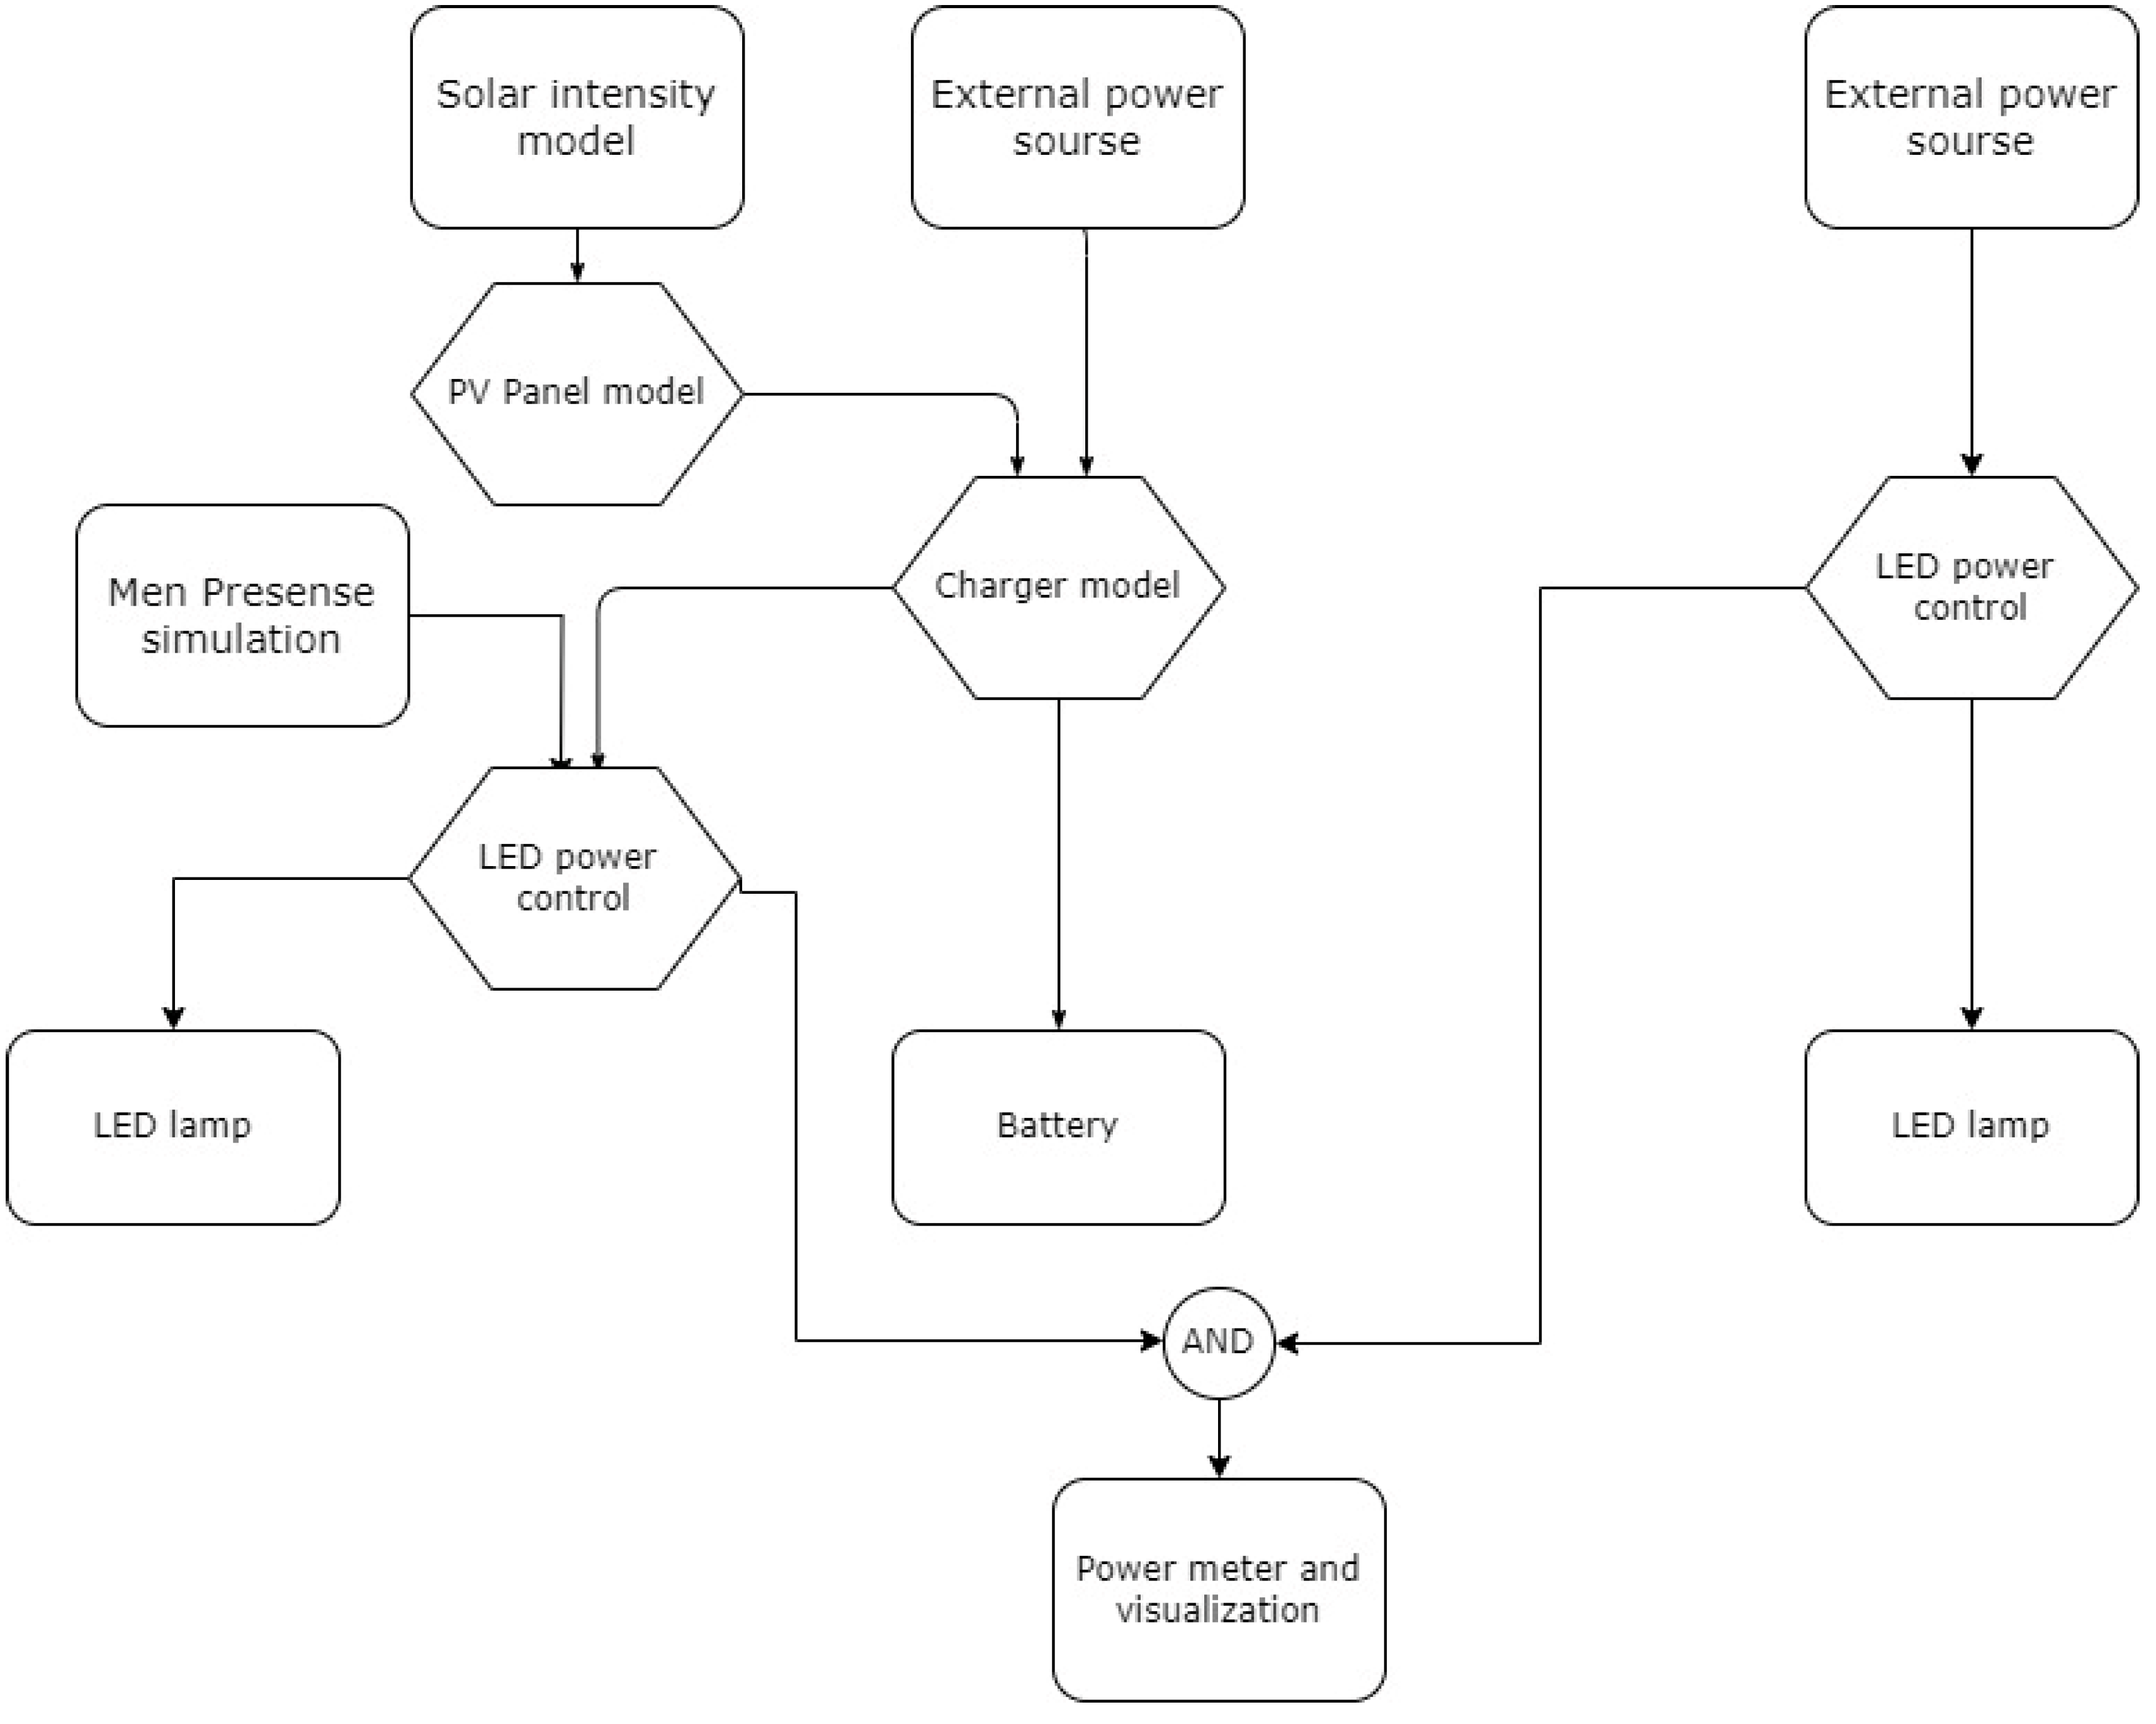
Figure 7.
Lighting system imitational model structure.
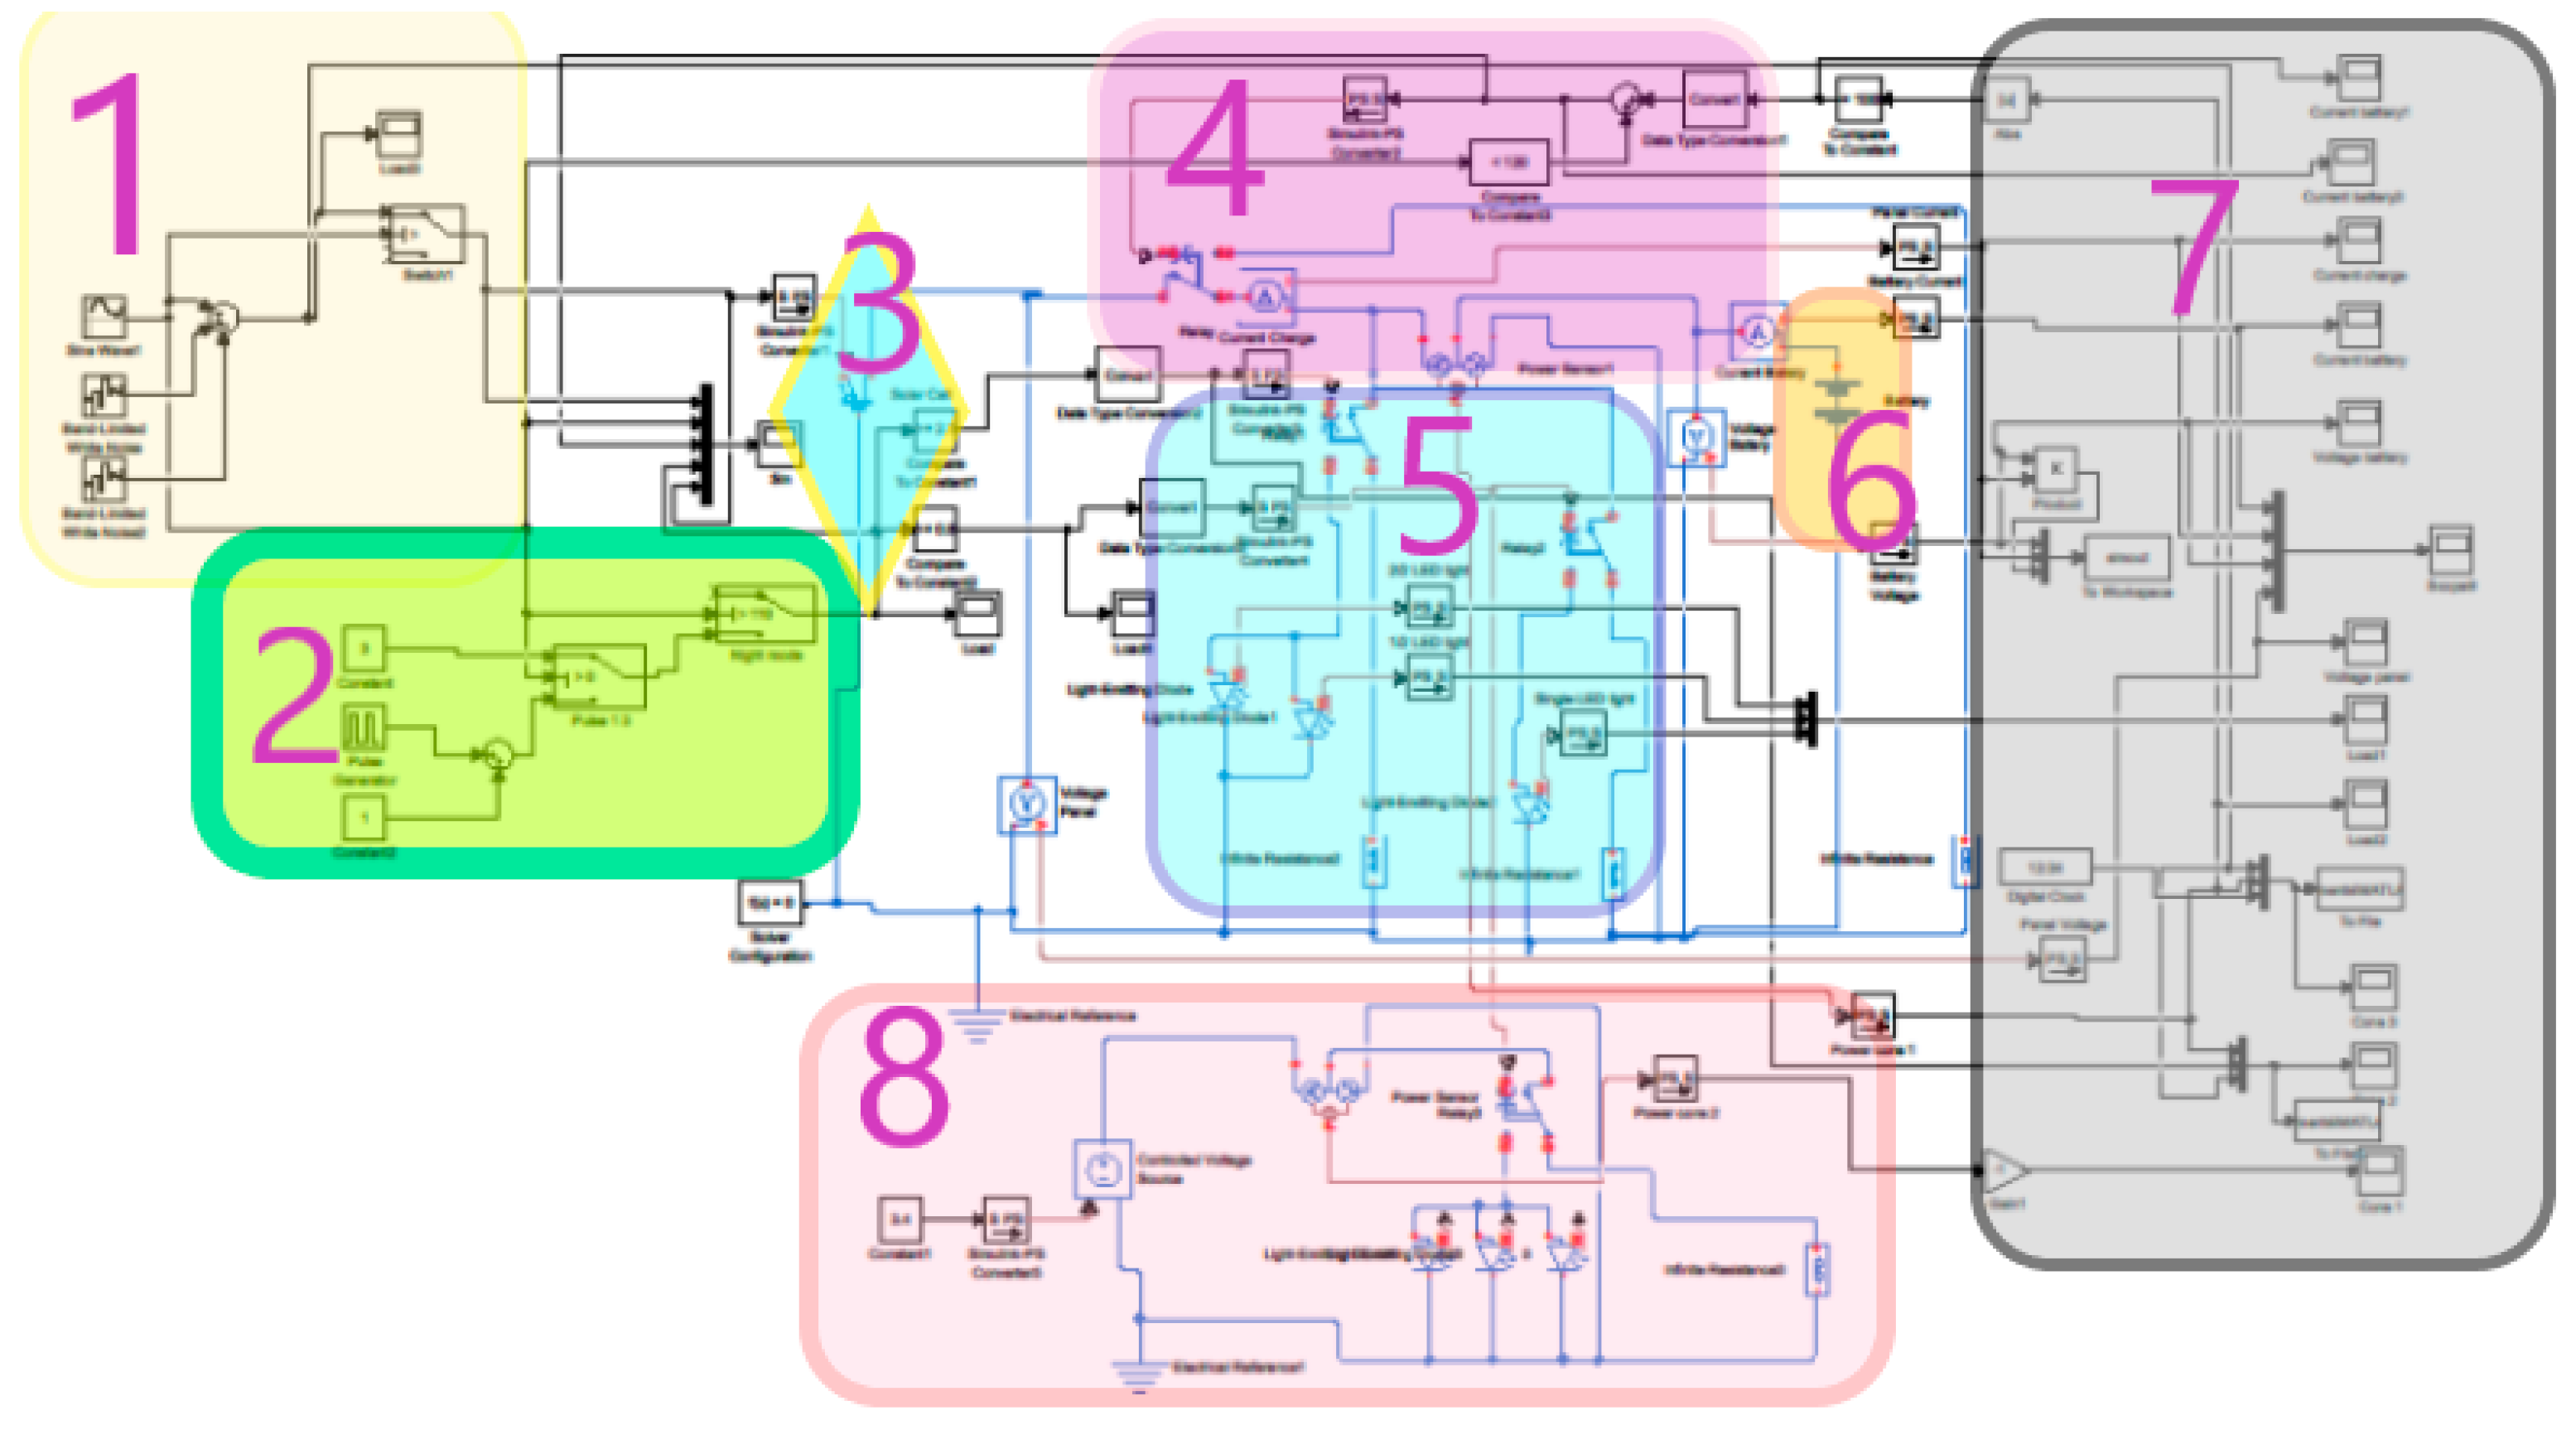
Figure 10.
Simulink solar-powered lamp model output with random simulated solar intensity for 1 day. Here: Red – conventional system power consumption, black – battery current (positive during charge cycle), orange – PV panel current, violet – panel voltage, yellow – battery voltage.
Figure 10.
Simulink solar-powered lamp model output with random simulated solar intensity for 1 day. Here: Red – conventional system power consumption, black – battery current (positive during charge cycle), orange – PV panel current, violet – panel voltage, yellow – battery voltage.
Disclaimer/Publisher’s Note: The statements, opinions and data contained in all publications are solely those of the individual author(s) and contributor(s) and not of MDPI and/or the editor(s). MDPI and/or the editor(s) disclaim responsibility for any injury to people or property resulting from any ideas, methods, instructions or products referred to in the content. |
© 2024 by the authors. Licensee MDPI, Basel, Switzerland. This article is an open access article distributed under the terms and conditions of the Creative Commons Attribution (CC BY) license (http://creativecommons.org/licenses/by/4.0/).
Copyright: This open access article is published under a Creative Commons CC BY 4.0 license, which permit the free download, distribution, and reuse, provided that the author and preprint are cited in any reuse.


