
Submitted:
28 November 2024
Posted:
28 November 2024
You are already at the latest version
Abstract
Misfolding and amyloid aggregation of proteins have attracted scientific interest from a few decades, due to their link with several diseases, in particular neurodegenerative diseases. Proteins can assemble and result in insoluble aggregates that, together with intermediate oligomeric species, modify extracellular environment. Many efforts have been and are devoted to the search of cosolvents and cosolutes able to interfere with amyloid aggregation. In this work we intensively study the effect of saponins, bioactive compounds, on human insulin aggregation. To monitor the kinetic of amyloid aggregation following secondary structure changes we performed fluorescence and UV-Visible absorption spectroscopies, using Thioflavin T and Congo Red as amyloid specific probes, and Circular Dichroism. To study the overall structural features and size of aggregates we performed Synchrotron Small Angle X-ray Scattering and Dynamic Light Scattering experiments. The morphology of the aggregates was assessed by Atomic Force Microscopy. To deepen the understanding of saponins interaction with insulin, a Molecular Dynamics investigation was performed, too. Reported data demonstrate that saponins interfere with the amyloid aggregation by inducing a strong inhibition on the formation of insulin fibrils, likely through specific interactions with insulin monomers. A dose dependent effect is evident and amyloid inhibition is already clear when saponins are just 0.01 % w/w in solution. We suggest that saponins, which are natural metabolites present in a wide range of foods ranging from grains, pulses, and green leaves to sea stars and cucumbers, can be promising metabolites to inhibit human insulin aggregation. This basic research work can pave the way to further investigations concerning insulin amyloidosis, suggesting the use of saponins as amyloid inhibitors and/or stabilizing agents in solution.
Keywords:
amyloids
; proteins
; saponins
; human insulin
; Small Angle X-ray Scattering
; Circular Dichroism
; aggregation
; Molecular Dynamics
1. Introduction
Saponins and their derivatives are glycosidic compounds playing several roles in food, agriculture and pharmaceutical industries. Although they have been suggested to have therapeutic potential as hypolipidemic [1], hypoglycemic [2], anti-asthmatic [3], antioxidant [4], anti-hypertensive [5], and anti-microbial activity [6], they show a few adverse effects due to their citotoxicity. Their toxicity depends on their dosage, and it must be clearly declared that saponins varies much in their toxicity [7].
Saponins were recently supposed to play a role against neurodegenerative diseases, like Alzheimer Disease (AD) [8]. AD patients evidence the lacking in the neuro-transmitters within the brain cells, due to the increase of the Acetylcholinesterase activity. As a consequence, Acetylcholinesterase inhibitors (AchEI) are believed to be among the best treatments of AD. A recent work compared the AchEI and apoptotic activities of fenugreek saponins against AD in vivo. Sprague Dawley rats were allocated in several experimental groups including untreated animals, supplemented animals with different doses of fenugreek saponin, and animals treated to induce AD. The results suggested that the ability of fenugreek saponin to inhibit AD might be attributed to antioxidants increase[8]. Even more recently, a few papers suggested the promising role of saponins against neurodegenerative diseases [9,10]. 40 different types of saponins have been studied for their effects on AD, suggesting their potential to ameliorate AD by reducing amyloid peptide deposition, inhibiting phosphorylation, modulating oxidative stress, reducing inflammation, and antiapoptosis [10]. However, at our knowledge there is no systematic study on their effects on amyloid aggregation pattern in vitro, with the exceptions of two works dedicated to amyloid peptide aggregation. In the first one, triterpenoid saponins from the cactus Polaskia chichipe were tested on amyloid peptide [11], and in a second one, triterpene saponins from the cactus Stenocereus pruinosus were used on the same protein [12]. However, no biophysical characterization of the structure of aggregated species was reported in both the above mentioned works, and a possible dose effect was not evidenced. On the other side, biophysical characterization of protein species produced in presence of saponins should improve the knowledge of the process and the understanding of the changes of molecular mechanisms leading to the formation of amyloid fibrils.
In order to get the picture of the potential inhibitory effect of saponins toward amyloidogenesis, we planned a set of experiments considering a mix of saponins, because they can represent a reproducible set already present in food and extracts. Also, we choose to investigate a protein whose amyloid aggregation is easily recordable and related to a pathological condition: human insulin. Insulin is considered a good model protein to study amyloid aggregation [13,14], and several investigations considered its amyloidogenesis at acidic pHs [15,16,17,18]. Also, it is known that during insulin production the solution pH is acidic (between 2 and 4 [19] ), hence these chemical conditions facilitate aggregation, determining a reduction of functional activity and undesired immunological responses in patients [20]. Our investigation aims to study human insulin aggregation in conditions quite similar to those found in vivo, hence at physiological pH. Although insulin aggregation at pH 7.4 follows a different pathway compared to acidic pH, involving distinct intermediates and the formation of morphologically diverse aggregates, the resulting fibrils still exhibit amyloid-like properties [17,21]. Insulin exists in solution in various oligomeric forms, including monomers, dimers, and hexamers, with their equilibrium depending on factors such as pH, ionic strength, protein concentration, and zinc ion levels, both in vitro and in vivo [17,21]. Under physiological conditions (37 °C and neutral pH), insulin amyloid formation is believed to originate from dimeric species, which are highly stabilized at this pH [22]. The propensity of insulin to aggregate even under these conditions makes it a suitable model system for studying pathological assembly phenomena under physiological conditions. Noteworthy, although insulin amyloidosis is uncommon in mammals, several cases of amyloid deposits derived from insulin at injection sites have been linked to diabetes mellitus [23]. Human insulin fibrils structure deserves attention because its knowledge can be a starting point for the development of drugs that binding to the fibril surface can disrupt secondary nucleation, and very recently their atomic resolution structure was solved by magic angle spinning solid-state NMR spectroscopy [24]. However, in the above mentioned study, insulin amyloid fibrils were obtained at quite high temperature (60°C), and at acidic pHs. On the other side, since insulin can aggregate at physiological temperature after injection, we focused on its propensity to aggregate at 37°C and physiological pH. We performed biophysical techniques able to monitor secondary, tertiary and quaternary structure evolution, as well as molecular dynamics to understand the basis of insulin-saponin interactions. In particular, Thioflavin T fluorescence and Congo Red absorption spectroscopy provided the structure changes during the aggregation by using probes, while Circular Dichroism determined the amount of different secondary structure without the potential interference of probes. Dynamic Light Scattering obtained the average size of the final products of the aggregation phenomena in presence and absence of saponins, while Synchrotron Small Angle X-ray Scattering monitored the aggregation obtaining the gyration radius of intermediate species. By usinf Atomic Force Microscopy we assessed the morphology of the insulin species formed in the presence and in the absence of saponins under amyloid aggregation conditions. Finally, by Molecular Dynamics we pay attention to the interaction between saponins and insulin molecules, suggesting the molecular basis of the inhibitory effect of saponins towards insulin amyloid aggregation.
2. Materials and Methods
2.1. Sample Preparation
Human Insulin recombinant was purchased from Sigma Aldrich, and it was used at concentration 0.5 mg/ml dissolved in Phosphate buffer saline (50 mM) at pH 7.4, without further purification. Insulin solution was maintained at 4°C for one hour, and fibrillation process was induced at 37°C with gentle agitation, according to the literature protocols [25]. Saponins were purchased from Sigma Aldrich as a mixture (CAS-No: 8047-15-2) . Samples were prepared with and without saponins, at various desired concentrations ranging from 0.01 mg/ml to 1 mg/ml, which are similar to those used for different saponins with A peptide in literature [11].
2.2. UV-Visible Spectroscopy
We performed UV-Visible absorption spectra at regular time intervals, using Congo Red (CR) as amyloid specific probe, to monitor the kinetics of amyloid aggregation of human insulin. CR binding with -structures induces a characteristic shifting of its absorption maximum in UV/Vis spectrum, from 490 nm to 540 nm. Because to its strong affinity for -structures, distinctive of fibrillated proteins, CR dye has been employed as a recognizer for amyloidogenesis from many decades and this approach has recently been considered valid for semi-quantitative analysis. To prepare CR solution, it was firstly obtained a solution of ethanol (80% w/w), brought to saturation with NaCl. This solution was filtered and then saturated with the dye powder and filtered again with Millipore filters of pore size 0.2 m to remove possible aggregates. We prepared each sample by adding 400 l of Phosphate buffer at pH 7.4, 50 l of the selected protein sample with 50 l of the Congo Red solution, in a quartz cuvette with 10 mm optical path. The amount of CR that we used for this kind of investigations was selected in previous works [26]. The ratio between absorption intensity at =538 nm and at = 505 nm was calculated for each sample condition and reported as a function of time.
2.3. ThT Spectrofluorometric Measurements
Fluorescence emission of Thioflavin T (ThT, Sigma-Aldrich) was monitored in time using a 96-well microplate with thermostatic control at 37°C. We selected as excitation and emission wavelengths 450 and 485 nm, respectively. All measurements were performed in triplicate. Human insulin (Sigma-Aldrich) was dissolved in a Phosphate saline buffer 50 mM, at pH 7.4 at 0.5 mg/mL, as in the other experiments. In order to monitor the insulin amyloid aggregation kinetics, the protein samples in the presence of ThT were incubated at 37 °C under agitation with teflon beads, for at least 40 hours. The protein solution was investigated in the presence and in the absence of increasing amounts of saponins.
2.4. Circular Dichroism
Circular Dichroism (CD) measurements were performed at room temperature by using a JASCO J-810 spectrometer (JASCO Corporation, Tokyo, Japan) equipped with a temperature control unit. The investigated protein solutions were exactly the same monitored by ThT fluorescence. Quartz cells with 0.5 mm path lengths were used for registering CD spectra in the far UV region. Each CD spectrum was corrected for the baseline by subtracting the spectral contribution of the buffer solutions. The estimation of the secondary structure was carried out using the BestSel web server [27].
2.5. Dynamic Light Scattering
Dynamic Light Scattering (DLS) measurements were performed on a Malvern Zetasizer Pro instrument (Malvern Panalytical, UK) configured in back-scattering geometry (scattering angle, =173°), using an incident wavelength =633 nm, produced by a He–Ne laser. The main advantage of this detection geometry, when compared to the more conventional 90°, is that it is less sensitive to multiple scattering effects. Human insulin solutions at 0.5 mg/ml were loaded into standard quartz cuvettes (10 mm optical path) and kept at 25°C for the measurements after 5 hours of the aggregation kinetics, which was performed in the same way we used for UV/Vis spectroscopy experiments. Each experiment was performed in three replicas. The intensity auto-correlation function was computed automatically by the instrument, where is the correlation constant. To obtain the size distribution, the measured autocorrelation functions were analyzed using the CONTIN algorithm [28].
2.6. Small Angle X-Ray Scattering
Small Angle X-rays Scattering (SAXS) data were collected at the Austrian beamline of Elettra Synchrotron in Trieste, Italy [29]. Kinetics in presence and in absence of saponins were monitored in time using microplate with thermostatic control at 37°C. Protein solutions (at concentration c = 0.5 mg/mL) and buffers were measured at the same conditions concerning temperature and exposure time. The data collected were corrected for sample transmission and primary beam fluctuations. We carefully checked each set of scattering patterns and performed the average after a positive control over radiation damage. We did not observe radiation damage on samples presented in this study. Single scattering patterns are derived from the average of all images in each sample; the respective medium backgrounds, treated in the same way, have been subtracted from the average of all images. The sample was collected and then injected by the µ-Drop Sample Changer developed in the Austrian beamline [30]. Each measurement was performed by averaging the results of 3 injections of 20 l of the same sample. For each injection, we obtained 18 images, each one resulting from an exposure time of 10 s. To minimize the radiation damage effects in the protein sample, each SAXS acquisition was followed by 3 s of dead time. Buffer measurements were always performed before and after sample measurements. Protein solutions and buffers were measured under the same conditions regarding temperature and exposure time.
2.7. Atomic Force Microscopy
Atomic Force Microscopy (AFM) measurements were acquired on an AIST-NT scanning probe microscope (Horiba Scientific, Kyoto, Japan) in non - contact mode. A silicon pyramid tip with a radius of 8 nm was used to perform the measurements. Samples were prepared after reaching the fibrillation end point and diluted from the original concentration by a factor of 1:10. This factor has been optimized to avoid the deposition of aggregates and artifacts on the mica surface. 10 l of the diluted solution was deposited on the freshly cleaved mica and allowed to incubate for 10 minutes. Next, the mica surface was rinsed with milli-Q water and dried with nitrogen flushing. All images were acquired with a scan rate of 1 Hz and a resolution of 512 x 512 pixels. Image analysis was performed with Gwyddion software [31]. For each sample, at least 5 images were acquired and analyzed.
2.8. Molecular Dynamics
Insulin 3D structure was retrieved from PDB data Bank (code 1ev3 [32]) and prepared for the subsequent computational simulations in its monomeric form, adding hydrogen and charges using AM1-BCC methods (within CHIMERA software [33]) followed by minimization using GB/SA implicit solvent method for water [34]. Chichipegenin B structure as saponin representative compound was built and modeled using GaussView/G09 software and its charges calculated at B3LYP/6-311G(d,p) level of theory [35]. Then, docking calculations were carried out to evaluate the saponin-protein binding affinity, performing blind docking all over the insulin surface by MGLTols/Autodock 4.2 (GA algorithm for cluster generations, LA-GA for subsequent analysis) [36]. The docking parameters were set to default values except for the number of GA runs (100), the energy evaluations (25 000 000), the maximum number of top individuals that automatically survive (0.1), and the step size for translation (0.2 Å). The best clusters underwent a focused docking protocol in order to refine the binding energy and pose centering the grid maps on the ligand. The clusters’ analysis showed the prevalence of one docking pose configuration that was then used for the subsequent molecular dynamics (MD) simulations.
MD of the protein and saponin system was carried out in Periodic boundary conditions (PBCs) using explicit TIP3P water models. The simulated system consists of four unities of the insulin-saponin complexes as obtained from the previous docking calculations, put randomly within the cubic water TIP3P box. The GROMACS 2020.6 suite of programs was used to perform all the simulations using CHARMM36 force field parameter sets, and the Chichigenin B’s charges and parameters previously calculated by DFT methods by using CHARMM-GUI Solution Builder. After minimization, the system underwent an NVT equilibration of 5 ns followed by the 200 ns production phase carried out on the NPT ensemble at 1 atm and 310 K (37 °C). The Parrinello–Rahman barostat was used to keep the pressure constant isotropically and the Nosè-Hoover thermostat [37], setting the time constant for coupling to 0.5 ps. Electrostatic interactions were taken into account by Particle-Mesh Ewald algorithm, with a 1.2 nm distance for the Coulomb cut-off, to calculate the long-range electrostatic interactions in the periodic system; the LINCS algorithm was used to freeze the H-bond stretching during the simulation.
3. Results
3.1. Secondary Structure
UV-Vis Spectroscopy in presence of Congo Red (CR) and Fluorescence Spectroscopy in presence of Thioflavin T (ThT) were used as complementary tools to evaluate secondary structure changes during insulin aggregation. Furthermore we performed CD experiments on the same set of samples in order to demonstrate that the two probes (CR and ThT) did not affect the kinetic pattern and saponins effect on protein aggregation into amyloid fibrils.
In Figure 1 the relative quantity of -structures was obtained from the ratio of the absorption intensity at =538 nm and the one at = 505 nm, as in previous works [26,38]. The presence of 1 mg/ml of saponins in solution clearly inhibits insulin aggregation. Also, results at increasing saponins concentration reported in Figure SM1 indicate a dose dependent effect.
ThT results, reported in Figure 2, provide the amount of structure during human insulin aggregation at saponins concentrations ranging from 0 to 1 mg/ml. Even these data confirm that saponins intefere by a dose dependent mechanism with amyloidogenesis. The sigmoidal growth of the signal can be quantitatively evaluated, obtaining the time needed to reach the first half of the process. The halftime is considered as a measure of mutational effects on nucleation, as well as an indicator for the overall nucleation rate when both primary and secondary nucleation reactions are present [39,40]. Halftimes resulting from the theoretical fit reported in Figure 2 are shown in Table 1. Human insulin aggregation at pH 7.4 and at physiological temperature (37°C) performed for fluorescence spectroscopy presents a kinetic whose halftime is about 20 hours. We underline that this value is highly affected by the environment and by the aggregation scenario, as it happens for each induced amyloid pattern [25,41]. That is why we appreciate more the differences in halftimes obtained in various solvent conditions, and we pay less attention to the absolute time values. Just a very low amount of saponins, 0.1 mg/ml (hence 0.01% w/w), determines the double of the halftimes. Increasing again the saponins content in solution, halftimes increase again, and no real sigmoidal curve appears (see green triangles in Figure 2).
To confirm that the saponins effect in inhibiting human insulin amyloid formation is not affected by the presence of CR and/or ThT, we performed a set of CD experiments in absence of probes. Human insulin aggregation has been induced at physiological pH and temperature, and exactly at the same conditions adopted for ThT fluorescence experiments (but in absence of ThT and teflon beads). CD spectra resulting from the average of at least 3 replicas are shown in Figure 3. The green thick continuous line reports human insulin CD fingerprint at physiological pH, which shows two characteristic minima, at 211 nm and 222 nm, in agreement with literature [17,42]. Taking into account previous ThT fluorescence results (see Figure 2), all the insulin stocks including different amounts of saponins were collected after 24 and 48 hours from the onset of induced aggregation. It can be easily appreciate that without saponins (cyan line in Figure 3), after 48 hours insulin CD spectrum is completely changed. While a similar behavior can be traced in the sample at low saponin content (0.1 mg/ml, blue curve in Figure 3), when saponin concentration doubles at 0.25 mg/ml, CD spectra is nearer to the native one. Increasing again saponins content, we observe that CD spectra are getting closer together to the native one. In particular, at 1 mg/ml of saponins in solution, after 48 hours CD spectrum practically overlaps the native one. To better understand CD spectra evolutions and the dose dependence of saponins effect, CD data were theoretically fitted in order to estimate the content in secondary structures (see Table 1). In Figure 4 the -helix content and the -sheet content are reported as a function of time for saponins concentrations ranging from 0 to 1.0 mg/ml. With or without saponins, human insulin at the beginning of the aggregation process shows -helix content and a low percentage of -sheet structure. Significant -helix to -sheet transition was observed already after 24 hours, in absence of saponins. After 48 hours, almost of secondary structures correspond to -sheets, for human insulin in aggregation without saponins. On the other side, when 1 mg/ml of saponins are dissolved in solution, the trend of secondary structures (cyan circles and yellow triangles in Figure 4) is practically constant until 48 hours. These data strongly reinforce previous UV-Vis and fluorescence results, confirming the inhibitory effect of saponins and its dose dependent impact.
3.2. 3D Structure
The aggregation pattern of proteins leading to amyloid fibrils is commonly and mainly characterized by the evolution of secondary structures and in particular of -sheets. However, the overall structure of amyloid aggregates, which can resemble fibrils, protofibrils and oligomers, is really important for citotoxicity [43,44], and consequentely is something that deserves investigation.
Firstly, we performed DLS experiments on human insulin solutions after 5 hours of kinetics of aggregation performed as for UV/Vis spectroscopy experiments, but in absence of CR. Autocorrelation functions were analysed by Malvern Zetasizer software and provided a well defined size distribution for each set of experiments. Results are shown in Figure 5: size distribution curves refer to insulin at the supposed end of the aggregation processes induced by agitation. It is evident that the blue curve, referred to the sample without saponins, shows the presence of big aggregates, whose average size is in the range of m. On the other side, the pink curve, which refers to the final aggregation product obtained in presence of 1 mg/ml saponins, corresponds to native insulin average size. Note that particle size distribution obtained by DLS data is obtained by Stokes-Einstein approximation, hence according to the hypothesis of presence of almost spherical nanoparticles. This approximation does not completely agree neither with insulin native conformation, neither with amyloid products. However, size estimated difference of the aggregation products is so relevant that we can neglect the bareness of the approximation.
To improve the characterization of the species resulting from the aggregation process, we took advantage of synchrotron SAXS, a technique able to describe amyloidogenesis at different resolutions, according to the considered theoretical model [45,46,47,48]. We performed SAXS experiments along the aggregation pattern, which are summarized at the top panels of Figure 6. Saponins presence in solution at a concentration of 1 mg/ml, even in this experiment is able to noticeably interfere with insulin aggregation, inhibiting almost completely the amyloidogenesis. At fixed temporal intervals of two hours, SAXS curves were collected for each condition (with and without saponins). SAXS data were analysed according to a model-free approach, in order not to overestimate the intrinsic structural content of experimental results. Hence, a Guinier approximation was used if experimental data could be successfully fitted, confirming the presence of species with spherical simmetry whose gyration radius is . On the other side, a Guinier rod-like approximation was adopted at higher aggregation times, where is the cross-sectional radius of gyration, which is related the overall size of the cross section of the particle. At the beginning of the aggregation process, the estimated gyration radius is , in agreement with insulin dimer size previously reported [49], as shown in Figure 6, bottom panel. In absence of saponins, Guinier approximation of spherical particles dispersed in solution fails after 6 hours of kinetics, when a Guinier rod-like approach can provide a (blue triangles in Figure 6, bottom panel). The analysis of SAXS curves corresponding to human insulin during the aggregation process induced in absence of saponins, shows that the cross section radius slightly increases until 12 hours from the beginning of the phenomenon, reaching . When 1 mg/ml saponins are added to human insulin solutions, on the contrary the gyration radius is maintained at about the starting values (cyan triangles in Figure 6, bottom panel), confirming their ability to interfere with amyloid aggregation. In particular, they are able not just to deny the conversion of -helix structures to -sheets, but even to prevent proteins from amorphous aggregation.
To deeper investigate the morphology of the human insulin aggregation products, we performed atomic force microscopy (AFM) imaging of batches at the endpoint of aggregation kinetics, in presence and in absence of saponins in solution. We performed AFM experiments on insulin without saponins, and insulin with saponins, at the end of the aggregation process (24 hours), and on saponins solutions without insulin, too. The height of the fibers reported in the images in the gray panel of Figure 7, which correspond to human insulin at the end of the aggregation phenomenon, is within a few nanometers, in agreement with previous works [26,50,51]. AFM images are shown in Figure 7: while fibrillar aggregates are clearly evident in the gray panel, as the result of human insulin aggregation process, in the light cyan panel, corresponding to insulin aggregated in presence of saponins, no fibril appears. On the other side, several aggregates whose shape is similar to spheres appear. In order to check if these aggregates could be associated to saponins or to proteins, further AFM experiments were carried out on saponins solutions at the same concentration adopted to inhibit amyloidogenesis. In the pink powder panel of Figure 7, almost spherical aggregates can be evidenced, very similar to those detected in the cyan panel. Saponins can self-assemble to form spherical micelles above a critical micelle concentration (cmc), whose value for Quillaja Saponin ranges between 0.5 and 0.8 mg/ml [52], hence the deposition of saponins solutions on mica surface can induce a self-assembly which did not appear in solution.
To quantitatively compare the aggregates visualized in the central panel of Figure 7 (insulin with saponins) to the ones reported on the right (saponins alone), we reported the heights of the aggregates, as average of 20 height measurements for each samples (Figure SM3). Average height of aggregates in samples of insulin with saponins is slightly lower than that in samples with saponins alone. This result can be related to the hypothesis that protein particles bind to saponins molecules in solution, lowering their absolute concentration as free molecules dispersed in the buffer, and determining the formation of micelles of smaller size. However, all the above mentioned biophysical techniques cannot provide proves neither hypothesis on saponins binding to insulin.
3.3. Molecular Findings
Molecular Dynamics simulations were performed in order to understand possible direct interactions between human insulin and saponins thus unveiling the molecular mechanisms underlying their amyloid inhibitory action. Since human insulin aggregation according to our protocols is not proved to be determined by protein misfolding, we supposed that saponins can somehow bind to insulin inhibiting their aggregation by stabilizing their structure and energetic landscape.
Along the simulation trajectory we can observe increasing intermolecular interactions between the four protein-ligand unities, that came closer along the trajectory till reaching the equilibrium state (see Figure 8 and Figure 9). As can be seen in Figure 8, we can assist to an intercalation of the Chichigenin B molecules within the insulin protein unities. We have calculated the intermolecular minimum distances (center of mass) between Chichigenin B unities (Figure 9a) and Insulin proteins (Figure 9b).
More specifically, MD simulations indicate that Chichigenin B may specifically interact with residues Phe24, Phe25, and Tyr26 (see Figure 10), which play a critical role in dimer formation [53]. The distance between these specific residues and the Chichigenin B are reported in Fig. SM5. It is easy to observe that, despite fluctuating throughout the time of the dynamic evolution, the interaction is maintained, in agreement with the hypothesis that saponins strongly interfere with monomers association into dimers.
Hence, we could suggest that the stabilization of the dimerization interface may hinder protein dimerization itself and, as a result, inhibit amyloid aggregation in human insulin, confirming previous hypothesis [17].
4. Discussion
Human insulin aggregation pattern leading to amyloid fibrils has been here investigated in conditions quite similar to those in vivo, i.e. at physiological pH and temperature. At the light of recent findings on insulin fibrils structure [24] and on insulin-derived amyloidosis [54], it appears important to look for potential inhibitors of its aggregation. In fact while insulin treatment has become increasingly essential for patients living with diabetes over the past few decades, insulin-derived amyloidosis (AIns) is a skin complication of insulin therapy. Although AIns was discovered about 40 years ago, no pharmacological therapy is available. The main concern is that AIns causes poor glycemic control and leads to increased insulin dosage in patients with diabetes due to impaired insulin absorption. Nowadays most common therapies were changing injection side and surgery, but with our study we propose the possibility to add a natural cosolute, saponins, to meaningfully decrease insulin aggregation propensity.
Our biophysical experiments demonstrate the ability of saponins to inhibit insulin amyloid aggregation monitoring secondary structures changes, by ThT fluorescence and CR absorption spectroscopy, and by CD spectra analysis. Also, DLS and SAXS demonstrate that saponins do not induce the formation of other kind of aggregates, and this result is confirmed by AFM images. In order to provide a potential molecular explanation to this effect, MD was performed on insulin and a specific saponin, demonstrating a direct interaction that could stabilize certain insulin conformations. The dissociation of an insulin dimer to two monomers is an important life process [55] because although the monomer is the biologically active form of the hormone, it is stored in the pancreas in the hexameric form. The latter dissociates to dimers and the dimers in turn to monomers to maintain the endogenous delivery of the hormone. Previous MD work calculated the free energy landscape and determined the minimum free energy pathway of dissociation, providing a pathway involving multiple minima and multiple barriers [55]. It has been shown that the insulin dimer, the predominant association state at neutral pH, is the species responsible for triggering amyloid formation at neutral pH by transitioning into a nucleus through an unidentified intermediate state [17,22]. MD results indicate that saponins may directly interact with monomers at the dimerization region, particularly involving Phe24, Phe25, and Tyr26 residues [53]. This interaction appears to stabilize the monomers and prevent dimer formation, thereby blocking the fibrillation pathway and halting amyloid aggregation in insulin. According to our results, the aggregation evidenced at physiological pH and temperature can be activated by a conformational change, likely involving dimers transition into on pathway intermediates, which weakly resembles a misfolding event, and it can be triggered by the induced agitation. Saponins can preferentially bind to insulin monomers at the dimerization interface limiting their conformational freedom and consequent aggregation. This can be furtherly confirmed by the presence of a dose-dependent effect. Our results limit to a basic research investigation, but we consider that saponins addition to insulin injected for therapies, as well as saponins used as active principles for topic application, could be a promising possibility for AIns disease.
Supplementary Materials
The following supporting information can be downloaded at the website of this paper posted on Preprints.org.
Author Contributions
Conceptualization, E.M. and M.G.O.; methodology, M.G.O. and S.V.; validation, E.M., S.V., M.R.M., G.G. and P.M.; formal analysis, E.M., S.V., R.G. and M.G.O.; investigation, E.M., S.V., G.G., M.R.M., P.M.; resources, M.G.O. and R.G.; data curation, E,M, and S.V.; writing—original draft preparation, M.G.O., E.M., S.V. and R.G.; writing—review and editing, all the authors; visualization, E.M., R.G., P.M. and M.G.O.; supervision, M.G.O., R.G. and S.V.; project administration, M.G.O., S.V. and R.G.; funding acquisition, M.G.O. All authors have read and agreed to the published version of the manuscript.
Funding
This research received no external funding.
Data Availability Statement
The raw data supporting the conclusions of this article will be made available by the authors on request.
Acknowledgments
The authors acknowledge the CERIC-ERIC Consortium for the access to experimental facilities and financial support (20217136) and Heinz Amenitsch and Barbara Sartori for their great support at Elettra SAXS beamline.
Conflicts of Interest
The authors declare no conflicts of interest.
Abbreviations
The following abbreviations are used in this manuscript:
| MDPI | Multidisciplinary Digital Publishing Institute |
| DOAJ | Directory of open access journals |
| AD | Alzheimer Disease |
| AchEI | Acetylcholinesterase inhibitors |
| ThT | Thioflavin T |
| CR | Congo Red |
| CD | Circular dichroism |
| SAXS | Small Angle X-ray Scattering |
| DLS | Dynamic Light Scattering |
| AFM | Atomic Force Microscopy |
| MD | Molecular Dynamics |
| AIns | Insulin-derived amyloidosis |
References
- Weng, Y.; Yu, L.; Cui, J.; Zhu, Y.R.; Guo, C.; Wei, G.; Duan, J.L.; Yin, Y.; Guan, Y.; Wang, Y.H.; et al. Antihyperglycemic, hypolipidemic and antioxidant activities of total saponins extracted from Aralia taibaiensis in experimental type 2 diabetic rats. Journal of Ethnopharmacology 2014, 152, 553–560. [Google Scholar] [CrossRef] [PubMed]
- Luo, J.; Jiang, L.; Gao, B.; Chai, Y.; Bao, Y. Comprehensive in silico analysis of the probiotics, and preparation of compound probiotics-Polygonatum sibiricum saponin with hypoglycemic properties. Food Chemistry 2023, 404, 134569. [Google Scholar] [CrossRef] [PubMed]
- Xue, K.; Ruan, L.; Hu, J.; Fu, Z.; Tian, D.; Zou, W. Panax notoginseng saponin R1 modulates TNF-α/NF-κB signaling and attenuates allergic airway inflammation in asthma. International Immunopharmacology 2020, 88, 106860. [Google Scholar] [CrossRef] [PubMed]
- Khan, M.I.; Karima, G.; Khan, M.Z.; Shin, J.H.; Kim, J.D. Therapeutic Effects of Saponins for the Prevention and Treatment of Cancer by Ameliorating Inflammation and Angiogenesis and Inducing Antioxidant and Apoptotic Effects in Human Cells. International Journal of Molecular Sciences 2022, 23. [Google Scholar] [CrossRef]
- Ibarrola, D.; Arrua, W.; Gonzalez, J.; Soverina Escobar, M.; Centurión, J.; Campuzano Benitez, A.; Ovando Soria, F.; Rodas González, E.; Arrúa, K.; Acevedo Barrios, M.; et al. The antihypertensive and diuretic effect of crude root extract and saponins from Solanum sisymbriifolium Lam., in L-NAME-induced hypertension in rats. Journal of Ethnopharmacology 2022, 298, 115605. [Google Scholar] [CrossRef]
- Li, J.; Monje-Galvan, V. In Vitro and In Silico Studies of Antimicrobial Saponins: A Review. Processes 2023, 11, 2856. [Google Scholar] [CrossRef]
- Sharma, K.; Kaur, R.; Kumar, S.; Saini, R.K.; Sharma, S.; Pawde, S.V.; Kumar, V. Saponins: A concise review on food related aspects, applications and health implications. Food Chemistry Advances 2023, 2, 100191. [Google Scholar] [CrossRef]
- Khalil, W.K.; Roshdy, H.M.; Kassem, S.M. The potential therapeutic role of Fenugreek saponin against Alzheimer’s disease: Evaluation of apoptotic and acetylcholinesterase inhibitory activities. Journal of Applied Pharmaceutical Science 2016, 6, 166–173. [Google Scholar] [CrossRef]
- Abduljawad, A.A.; Elawad, M.A.; Elkhalifa, M.E.M.; Ahmed, A.; Hamdoon, A.A.E.; Salim, L.H.M.; Ashraf, M.; Ayaz, M.; Hassan, S.S.u.; Bungau, S. Alzheimer’s Disease as a Major Public Health Concern: Role of Dietary Saponins in Mitigating Neurodegenerative Disorders and Their Underlying Mechanisms. Molecules 2022, 27. [Google Scholar] [CrossRef]
- Zhang, R.; Zeng, M.; Zhang, X.; Zheng, Y.; Lv, N.; Wang, L.; Gan, J.; Li, Y.; Jiang, X.; Yang, L. Therapeutic Candidates for Alzheimer’s Disease: Saponins. International Journal of Molecular Sciences 2023, 24. [Google Scholar] [CrossRef]
- Fujihara, K.; Koike, S.; Ogasawara, Y.; Takahashi, K.; Koyama, K.; Kinoshita, K. Inhibition of amyloid β aggregation and protective effect on SH-SY5Y cells by triterpenoid saponins from the cactus Polaskia chichipe. Bioorganic & Medicinal Chemistry 2017, 25, 3377–3383. [Google Scholar] [CrossRef]
- Fujihara, K.; Shimoyama, T.; Kawazu, R.; Sasaki, H.; Koyama, K.; Takahashi, K.; Kinoshita, K. Amyloid β aggregation inhibitory activity of triterpene saponins from the cactus Stenocereus pruinosus. Journal of Natural Medicine 2021, 75, 284–298. [Google Scholar] [CrossRef] [PubMed]
- Brange, J.; Andersen, L.; Laursen, E.D.; Meyn, G.; Rasmussen, E. Toward Understanding Insulin Fibrillation. Journal of Pharmaceutical Sciences 1997, 86, 517–525. [Google Scholar] [CrossRef] [PubMed]
- Manno, M.; Craparo, E.F.; Martorana, V.; Bulone, D.; Biagio, P.L.S. Kinetics of Insulin Aggregation: Disentanglement of Amyloid Fibrillation from Large-Size Cluster Formation. Biophysical Journal 2006, 0, 4585–4591. [Google Scholar] [CrossRef]
- Fagihi, M.H.A.; Bhattacharjee, S. Amyloid Fibrillation of Insulin: Amelioration Strategies and Implications for Translation. ACS Pharmacology & Translational Science 2022, 5, 1050–1061. [Google Scholar] [CrossRef]
- Foderà, V.; Librizzi, F.; Groenning, M.; van de Weert, M.; Leone, M. Secondary Nucleation and Accessible Surface in Insulin Amyloid Fibril Formation. The Journal of Physical Chemistry B 2008, 112, 3853–3858. [Google Scholar] [CrossRef] [PubMed]
- Iannuzzi, C.; Borriello, M.; Portaccio, M.; Irace, G.; Sirangelo, I. Insights into Insulin Fibril Assembly at Physiological and Acidic pH and Related Amyloid Intrinsic Fluorescence. International Journal of Molecular Sciences 2017, 18. [Google Scholar] [CrossRef]
- Ziaunys, M.; Mikalauskaite, K.; Sakalauskas, A.; Smirnovas, V. Study of Insulin Aggregation and Fibril Structure under Different Environmental Conditions. International Journal of Molecular Sciences 2024, 25. [Google Scholar] [CrossRef]
- Nielsen, L.; Khurana, R.; Coats, A.; Frokjaer, S.; Brange, J.; Vyas, S.; Uversky, V.N.; Fink, A.L. Effect of Environmental Factors on the Kinetics of Insulin Fibril Formation: Elucidation of the Molecular Mechanism. Biochemistry 2001, 40, 6036–6046. [Google Scholar] [CrossRef] [PubMed]
- Wilhelm, K.R.; Yanamandra, K.; Gruden, M.A.; Zamotin, V.; Malisauskas, M.; Casaite, V.; Darinskas, A.; Forsgren, L.; Morozova-Roche, L.A. Immune reactivity towards insulin, its amyloid and protein S100B in blood sera of Parkinson’s disease patients. European Journal of Neurology 2007, 14, 327–334. [Google Scholar] [CrossRef]
- Pizzo, F.; Mangione, M.; Librizzi, F.; Manno, M.; Martorana, V.; Noto, R.; Vilasi, S. The Possible Role of the Type I Chaperonins in Human Insulin Self-Association. Life (Basel) 2022, 12, 448. [Google Scholar] [CrossRef] [PubMed]
- Yoshihara, H.; Saito, J.; Tanabe, A.; Amada, T.; Asakura, T.; Kitagawa, K.S. Characterization of Novel Insulin Fibrils That Show Strong Cytotoxicity Under Physiological pH. J Pharm Sci. 2016, 105, 1419–26. [Google Scholar] [CrossRef] [PubMed]
- Nilsson, M.R. Insulin amyloid at injection sites of patients with diabetes. Amyloid Int. J. Exp. Clin. Investig. 2016, 23, 139–147. [Google Scholar] [CrossRef] [PubMed]
- Suladze, S.; Sarkar, R.; Rodina, N.; Bokvist, K.; Krewinkel, M.; Scheps, D.; Nagel, N.; Bardiaux, B.; Reif, B. Atomic resolution structure of full-length human insulin fibrils. Proceedings of the National Academy of Sciences 2024, 121, e2401458121. [Google Scholar] [CrossRef]
- Vilasi, S.; Iannuzzi, C.; Portaccio, M.; Irace, G.; Sirangelo, I. Effect of Trehalose on W7FW14F Apomyoglobin and Insulin Fibrillization: New Insight into Inhibition Activity. Biochemistry 2008, 47, 1789–1796. [Google Scholar] [CrossRef]
- Mari, E.; Ricci, C.; Pieraccini, S.; Spinozzi, F.; Mariani, P.; Ortore, M.G. Trehalose Effect on The Aggregation of Model Proteins into Amyloid Fibrils. Life 2020, 10. [Google Scholar] [CrossRef]
- Micsonai, A.; Moussong, E.; Wien, F.; Boros, E.; Vadászi, H.; Murvai, N.; Lee, Y.H.; Molnár, T.; Réfrégiers, M.; Goto, Y.; et al. BeStSel: webserver for secondary structure and fold prediction for protein CD spectroscopy. Nucleic Acids Res 2022, 50(1), 90–98. [Google Scholar] [CrossRef]
- Provencher, S.W. A constrained regularization method for inverting data represented by linear algebraic or integral equations. Computer Physics Communications 1982, 27, 213–227. [Google Scholar] [CrossRef]
- Amenitsch, H.; Rappolt, M.; Kriechbaum, M.; Mio, H.; Laggner, P.; Bernstorff, S. First performance assessment of the small-angle X-ray scattering beamline at ELETTRA. Journal of Synchrotron Radiation 1998, 5, 506–508. [Google Scholar] [CrossRef]
- Haider, R.; Sartori, B.; Radeticchio, A.; Wolf, M.; Dal Zilio, S.; Marmiroli, B.; Amenitsch, H. μDrop: a system for high-throughput small-angle X-ray scattering measurements of microlitre samples. Journal of Applied Crystallography 2021, 54, 132–141. [Google Scholar] [CrossRef]
- Nečas, D.; Klapetek, P. Gwyddion: an open-source software for SPM data analysis. Central European Journal of Physics 2012, 10, 181–188. [Google Scholar] [CrossRef]
- Smith, G.D.; Ciszak, E.; Magrum, L.A.; Pangborn, W.A.; Blessing, R.H. R6 hexameric insulin complexed with m-cresol or resorcinol. Acta Crystallographica Section D 2000, 56, 1541–1548. [Google Scholar] [CrossRef] [PubMed]
- Pettersen, E.F.; Goddard, T.D.; Huang, C.C.; Couch, G.S.; Greenblatt, D.M.; Meng, E.C.; Ferrin, T.E. UCSF Chimera—A visualization system for exploratory research and analysis. Journal of Computational Chemistry 2004, 25, 1605–1612. [Google Scholar] [CrossRef]
- Qiu, D.; Shenkin, P.S.; Hollinger, F.P.; Still, W.C. The GB/SA Continuum Model for Solvation. A Fast Analytical Method for the Calculation of Approximate Born Radii. The Journal of Physical Chemistry A 1997, 101, 3005–3014. [Google Scholar] [CrossRef]
- Frisch, M.J.; Trucks, G.W.; Schlegel, H.B.; Scuseria, G.E.; Robb, M.A.; Cheeseman, J.R.; Scalmani, G.; Barone, V.; Petersson, G.A.; Nakatsuji, H.; Gaussian˜16 Revision, C.; et al. Gaussian˜16 Revision C.01, 2016. Gaussian Inc. Wallingford CT.
- Morris, G.M.; Huey, R.; Lindstrom, W.; Sanner, M.F.; Belew, R.K.; Goodsell, D.S.; Olson, A.J. AutoDock4 and AutoDockTools4: Automated docking with selective receptor flexibility. Journal of Computational Chemistry 2009, 30, 2785–2791. [Google Scholar] [CrossRef]
- Nose, S. A unified formulation of the constant temperature molecular dynamics methods. The Journal of Chemical Physics 1984, 81, 511–519. [Google Scholar] [CrossRef]
- Mastrella, L.; Moretti, P.; Pieraccini, S.; Magi, S.; Piccirillo, S.; Ortore, M.G. Taurine Stabilizing Effect on Lysozyme. Life 2022, 12. [Google Scholar] [CrossRef]
- Knowles, T.P.J.; White, D.A.; Abate, A.R.; Agresti, J.J.; Cohen, S.I.A.; Sperling, R.A.; De Genst, E.J.; Dobson, C.M.; Weitz, D.A. Observation of spatial propagation of amyloid assembly from single nuclei. Proceedings of the National Academy of Sciences 2011, 108, 14746–14751. [Google Scholar] [CrossRef]
- Burrelli, A.; Moretti, P.; Gerelli, Y.; Ortore, M.G. Effects of model membranes on lysozyme amyloid aggregation. Biomolecular Concepts 2023, 14, 20220034. [Google Scholar] [CrossRef]
- Bernson, D.; Mecinovic, A.; Abed, M.; Lime, F.; Jageland, P.; Palmlof, M.; Esbjorner, E. Amyloid formation of bovine insulin is retarded in moderately acidic pH and by addition of short-chain alcohols. Eur. Biophys. J. 2020, 49, 145–153. [Google Scholar] [CrossRef]
- Amaral, M.; Martins, A.S.; Catarino, J.; Faísca, P.; Kumar, P.; Pinto, J.F.; Pinto, R.; Correia, I.; Ascensão, L.; Afonso, R.A.; et al. How Can Biomolecules Improve Mucoadhesion of Oral Insulin? A Comprehensive Insight using Ex-Vivo, In Silico, and In Vivo Models. Biomolecules 2020, 10. [Google Scholar] [CrossRef] [PubMed]
- Karen E Marshall, Ricardo Marchante, W.F.X.; Serpell, L.C. The relationship between amyloid structure and cytotoxicity. Prion 2014, 8, 192–196. [CrossRef] [PubMed]
- Ye, Z.; Geng, X.; Wei, L.; Li, Z.; Lin, S.; Xiao, L. Length-Dependent Distinct Cytotoxic Effect of Amyloid Fibrils beyond Optical Diffraction Limit Revealed by Nanoscopic Imaging. ACS Nano 2021, 15, 934–943. [Google Scholar] [CrossRef] [PubMed]
- Ortore, M.G.; Spinozzi, F.; Vilasi, S.; Sirangelo, I.; Irace, G.; Shukla, A.; Narayanan, T.; Sinibaldi, R.; Mariani, P. Time-resolved small-angle x-ray scattering study of the early stage of amyloid formation of an apomyoglobin mutant. Physical Review E 2011, 84, 1–10. [Google Scholar] [CrossRef]
- Langkilde, A.E.; Vestergaard, B. Methods for structural characterization of prefibrillar intermediates and amyloid fibrils. FEBS Letters 2009, 583, 2600–2609. [Google Scholar] [CrossRef]
- Ricci, C.; Barone, G.; Bulone, D.; Burgio, G.; Carrotta, R.; Librizzi, F.; Marino Gammazza, A.; Rosalia Mangione, M.; Palumbo Piccionello, A.; San Biagio, P.L.; et al. Structure and Stability of Hsp60 and Groel in Solution. Biophysical Journal 2016, 110, 368a. [Google Scholar] [CrossRef]
- Herranz-Trillo, F.; Groenning, M.; van Maarschalkerweerd, A.; Tauler, R.; Vestergaard, B.; Bernadó, P. Structural Analysis of Multi-component Amyloid Systems by Chemometric SAXS Data Decomposition. Structure 2017, 25, 5–15. [Google Scholar] [CrossRef]
- Wang, P.; Wang, X.; Liu, L.; Zhao, H.; Qi, W.; He, M. The Hydration Shell of Monomeric and Dimeric Insulin Studied by Terahertz Time-Domain Spectroscopy. Biophysical Journal 2019, 117, 533–541. [Google Scholar] [CrossRef]
- Mauro, M.; Craparo, E.F.; Podestà, A.; Bulone, D.; Carrotta, R.; Martorana, V.; Tiana, G.; San Biagio, P.L. Kinetics of Different Processes in Human Insulin Amyloid Formation. Journal of Molecular Biology 2007, 366, 258–274. [Google Scholar] [CrossRef]
- Adamcik, J.; Mezzenga, R. Study of amyloid fibrils via atomic force microscopy. Current Opinion in Colloid & Interface Science 2012, 17, 369–376. [Google Scholar] [CrossRef]
- Mitra, S.; Dungan, S.R. Micellar Properties of Quillaja Saponin. 1. Effects of Temperature, Salt, and pH on Solution Properties. Journal of Agricultural and Food Chemistry 1997, 45, 1587–1595. [Google Scholar] [CrossRef]
- Desmond, J.; Koner, D.; Meuwly, M. Probing the Differential Dynamics of the Monomeric and Dimeric Insulin from Amide-I IR Spectroscopy. J Phys Chem B. 2019, 123, 6588–6598. [Google Scholar] [CrossRef] [PubMed]
- Karkhaneh, L.; Hosseinkhani, S.; Azami, H.; Karamlou, Y.; Sheidaei, A.; Nasli-Esfahani, E.; Razi, F.; Ebrahim-Habibi, A. Comprehensive investigation of insulin-induced amyloidosis lesions in patients with diabetes at clinical and histological levels: A systematic review. Diabetes & Metabolic Syndrome: Clinical Research & Reviews 2024, 18, 103083. [Google Scholar] [CrossRef]
- Banerjee, P.; Mondal, S.; Bagchi, B. Insulin dimer dissociation in aqueous solution: A computational study of free energy landscape and evolving microscopic structure along the reaction pathway. The Journal of Chemical Physics 2018, 149, 114902. [Google Scholar] [CrossRef] [PubMed]
Figure 1.
UV/Vis spectroscopy results on the effects of saponins on human insulin aggregation. To monitor the relative amount of -sheet structures in solution, the ratio between the intensity of the absorption peak due to Congo Red (CR) bound to fibrils and the one due to CR free in solution was calculated as a function of time. -sheet structures as a function of time, during fibrillation: blue markers correspond to human insulin in solution in the absence of saponins, and purple markers correspond to human insulin in solution in the presence of 1 mg/ml of saponins. Error bars are estimated on the average of several replicas of the same experiment.
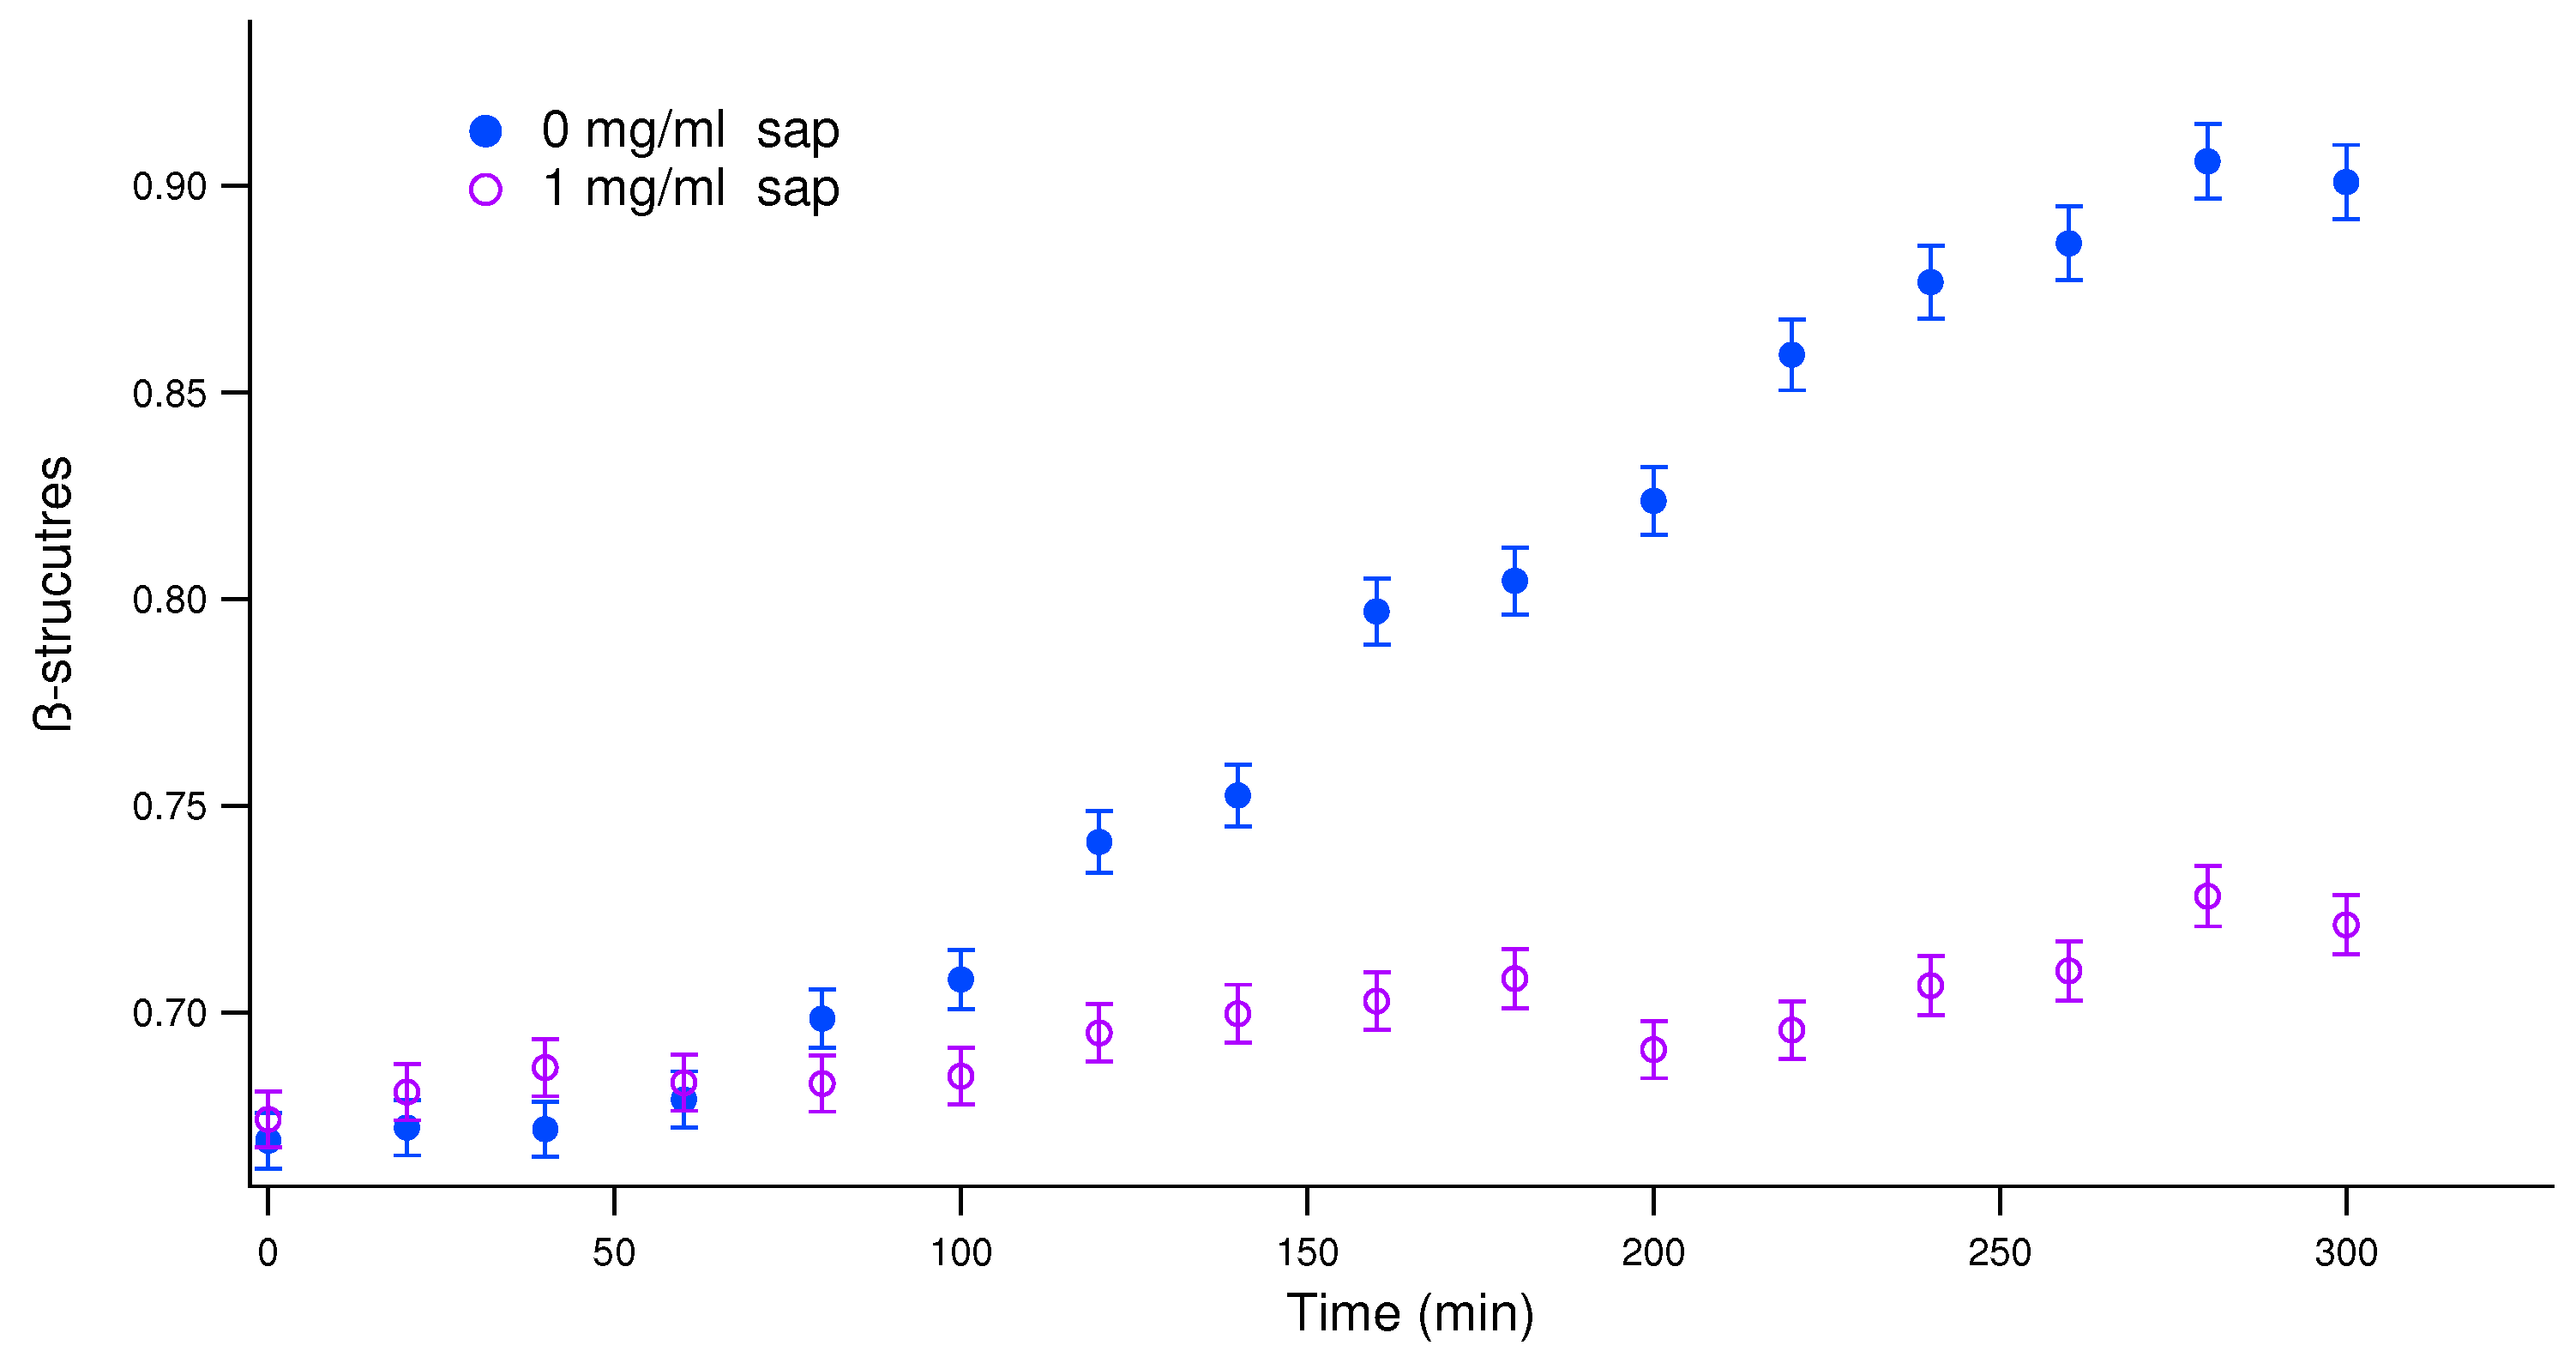
Figure 2.
In situ real-time ThT fluorescence assay for monitoring the aggregation kinetics of insulin incubated at 37°C under agitation in the absence and in the presence of increasing concentration of saponins, as indicated in the legend. Continuous lines are the theoretical fitting curves obtained by the analysis that provides the halftime featuring each kinetic pattern.
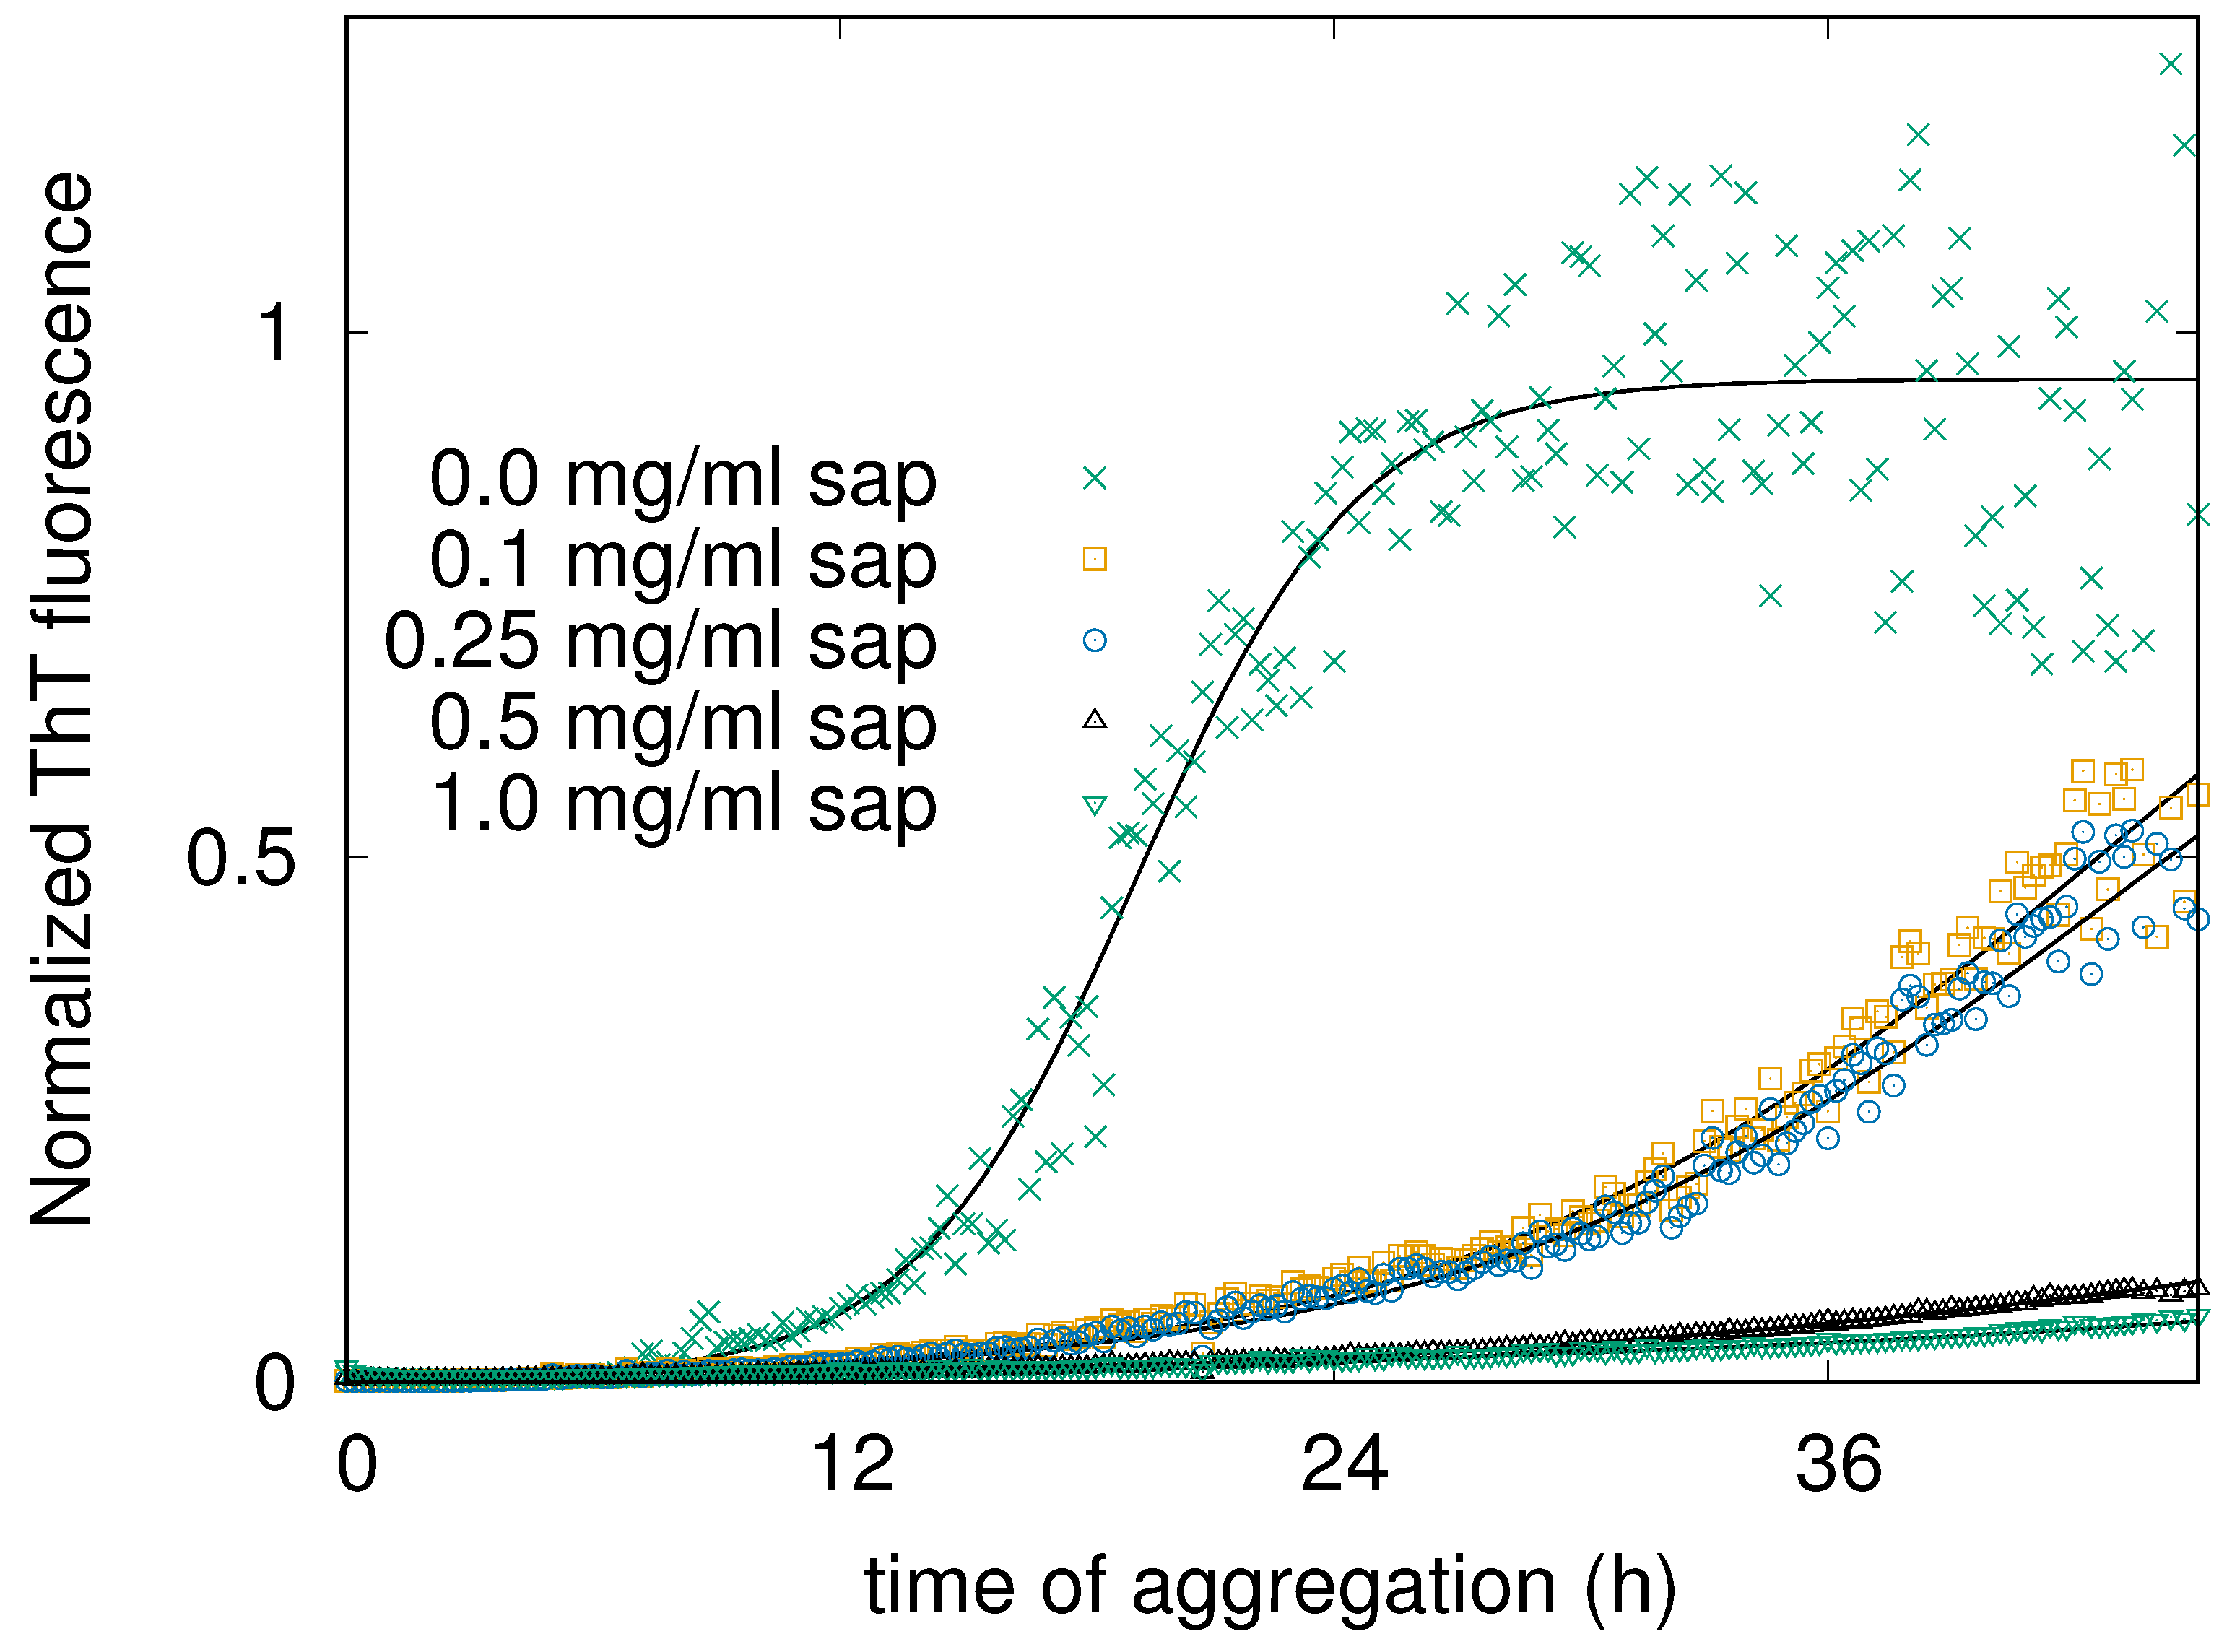
Figure 3.
Circular Dichroism (CD) curves of human insulin recorded after 48 h of aggregation kinetics at 37°C. The curves are related to the human insulin solution in the presence of increasing amounts of saponins, as indicated in the legend.
Figure 3.
Circular Dichroism (CD) curves of human insulin recorded after 48 h of aggregation kinetics at 37°C. The curves are related to the human insulin solution in the presence of increasing amounts of saponins, as indicated in the legend.
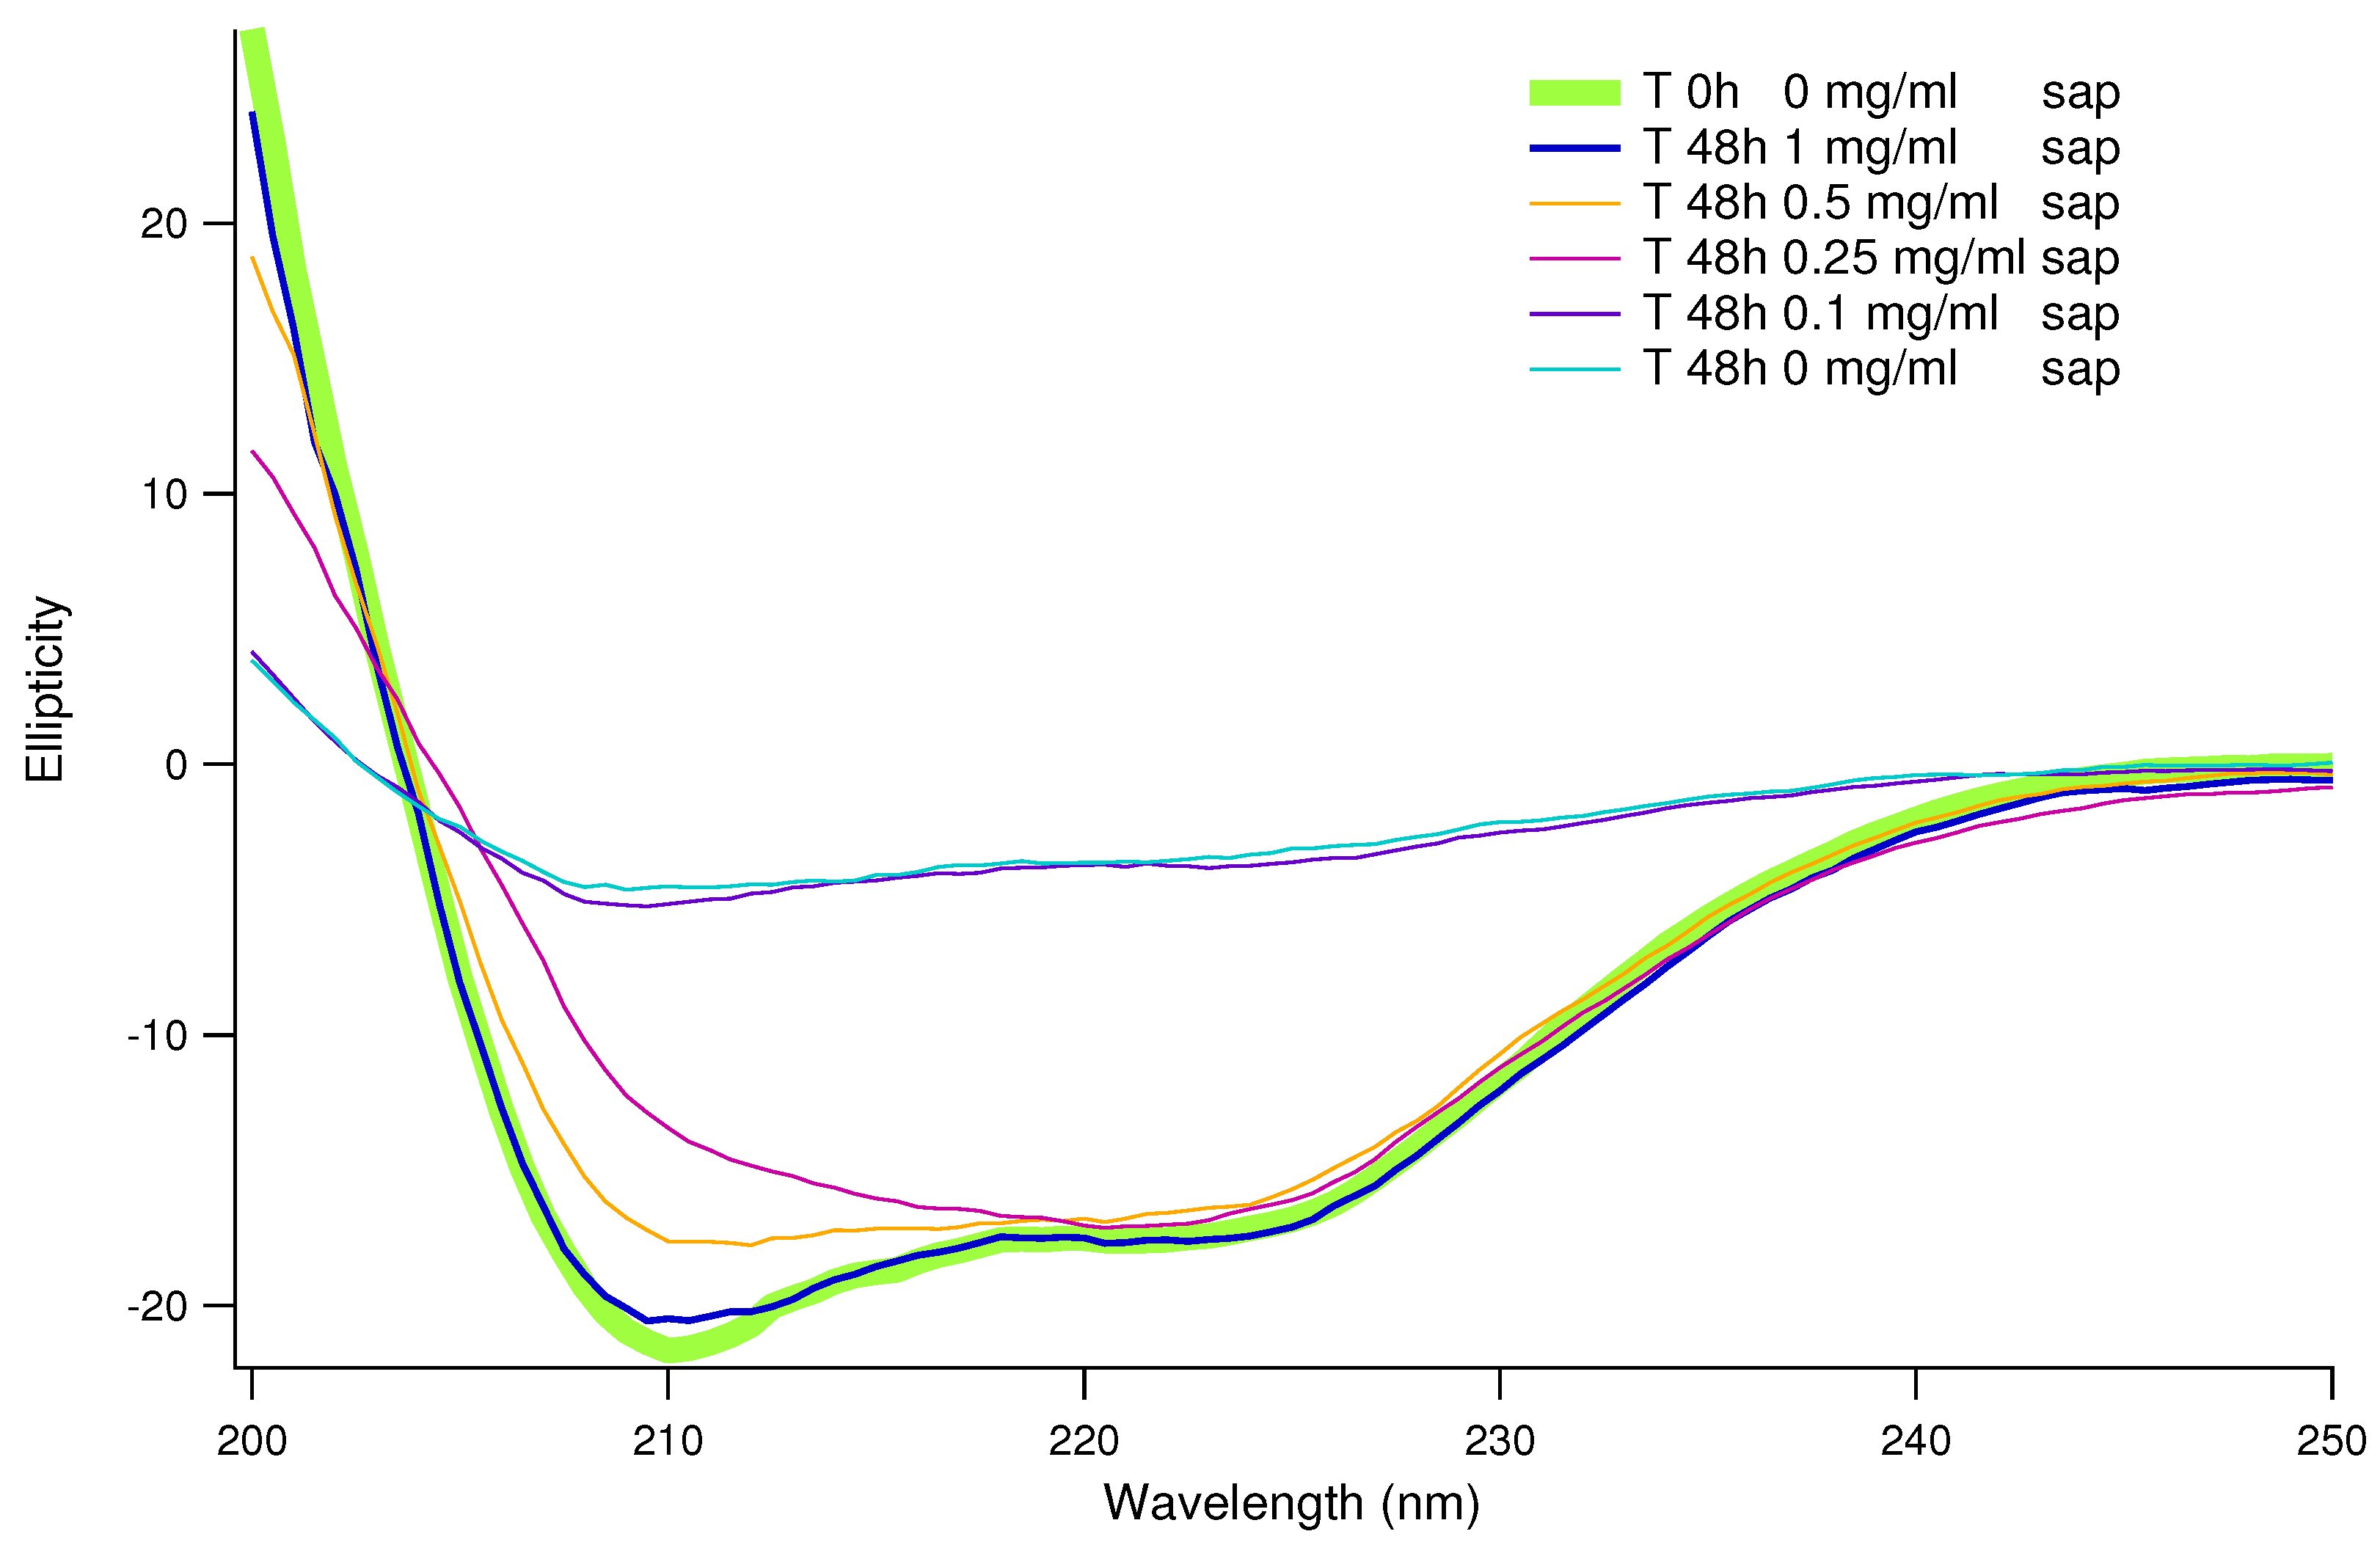
Figure 4.
Percentages of and structure, as in the legend, provided by CD data analysis. Blue and cyan shades refer to -helices, which dramatically decrease in absence of saponins. On the contrary, in the same conditions structures arise, in shades from red to yellow.
Figure 4.
Percentages of and structure, as in the legend, provided by CD data analysis. Blue and cyan shades refer to -helices, which dramatically decrease in absence of saponins. On the contrary, in the same conditions structures arise, in shades from red to yellow.
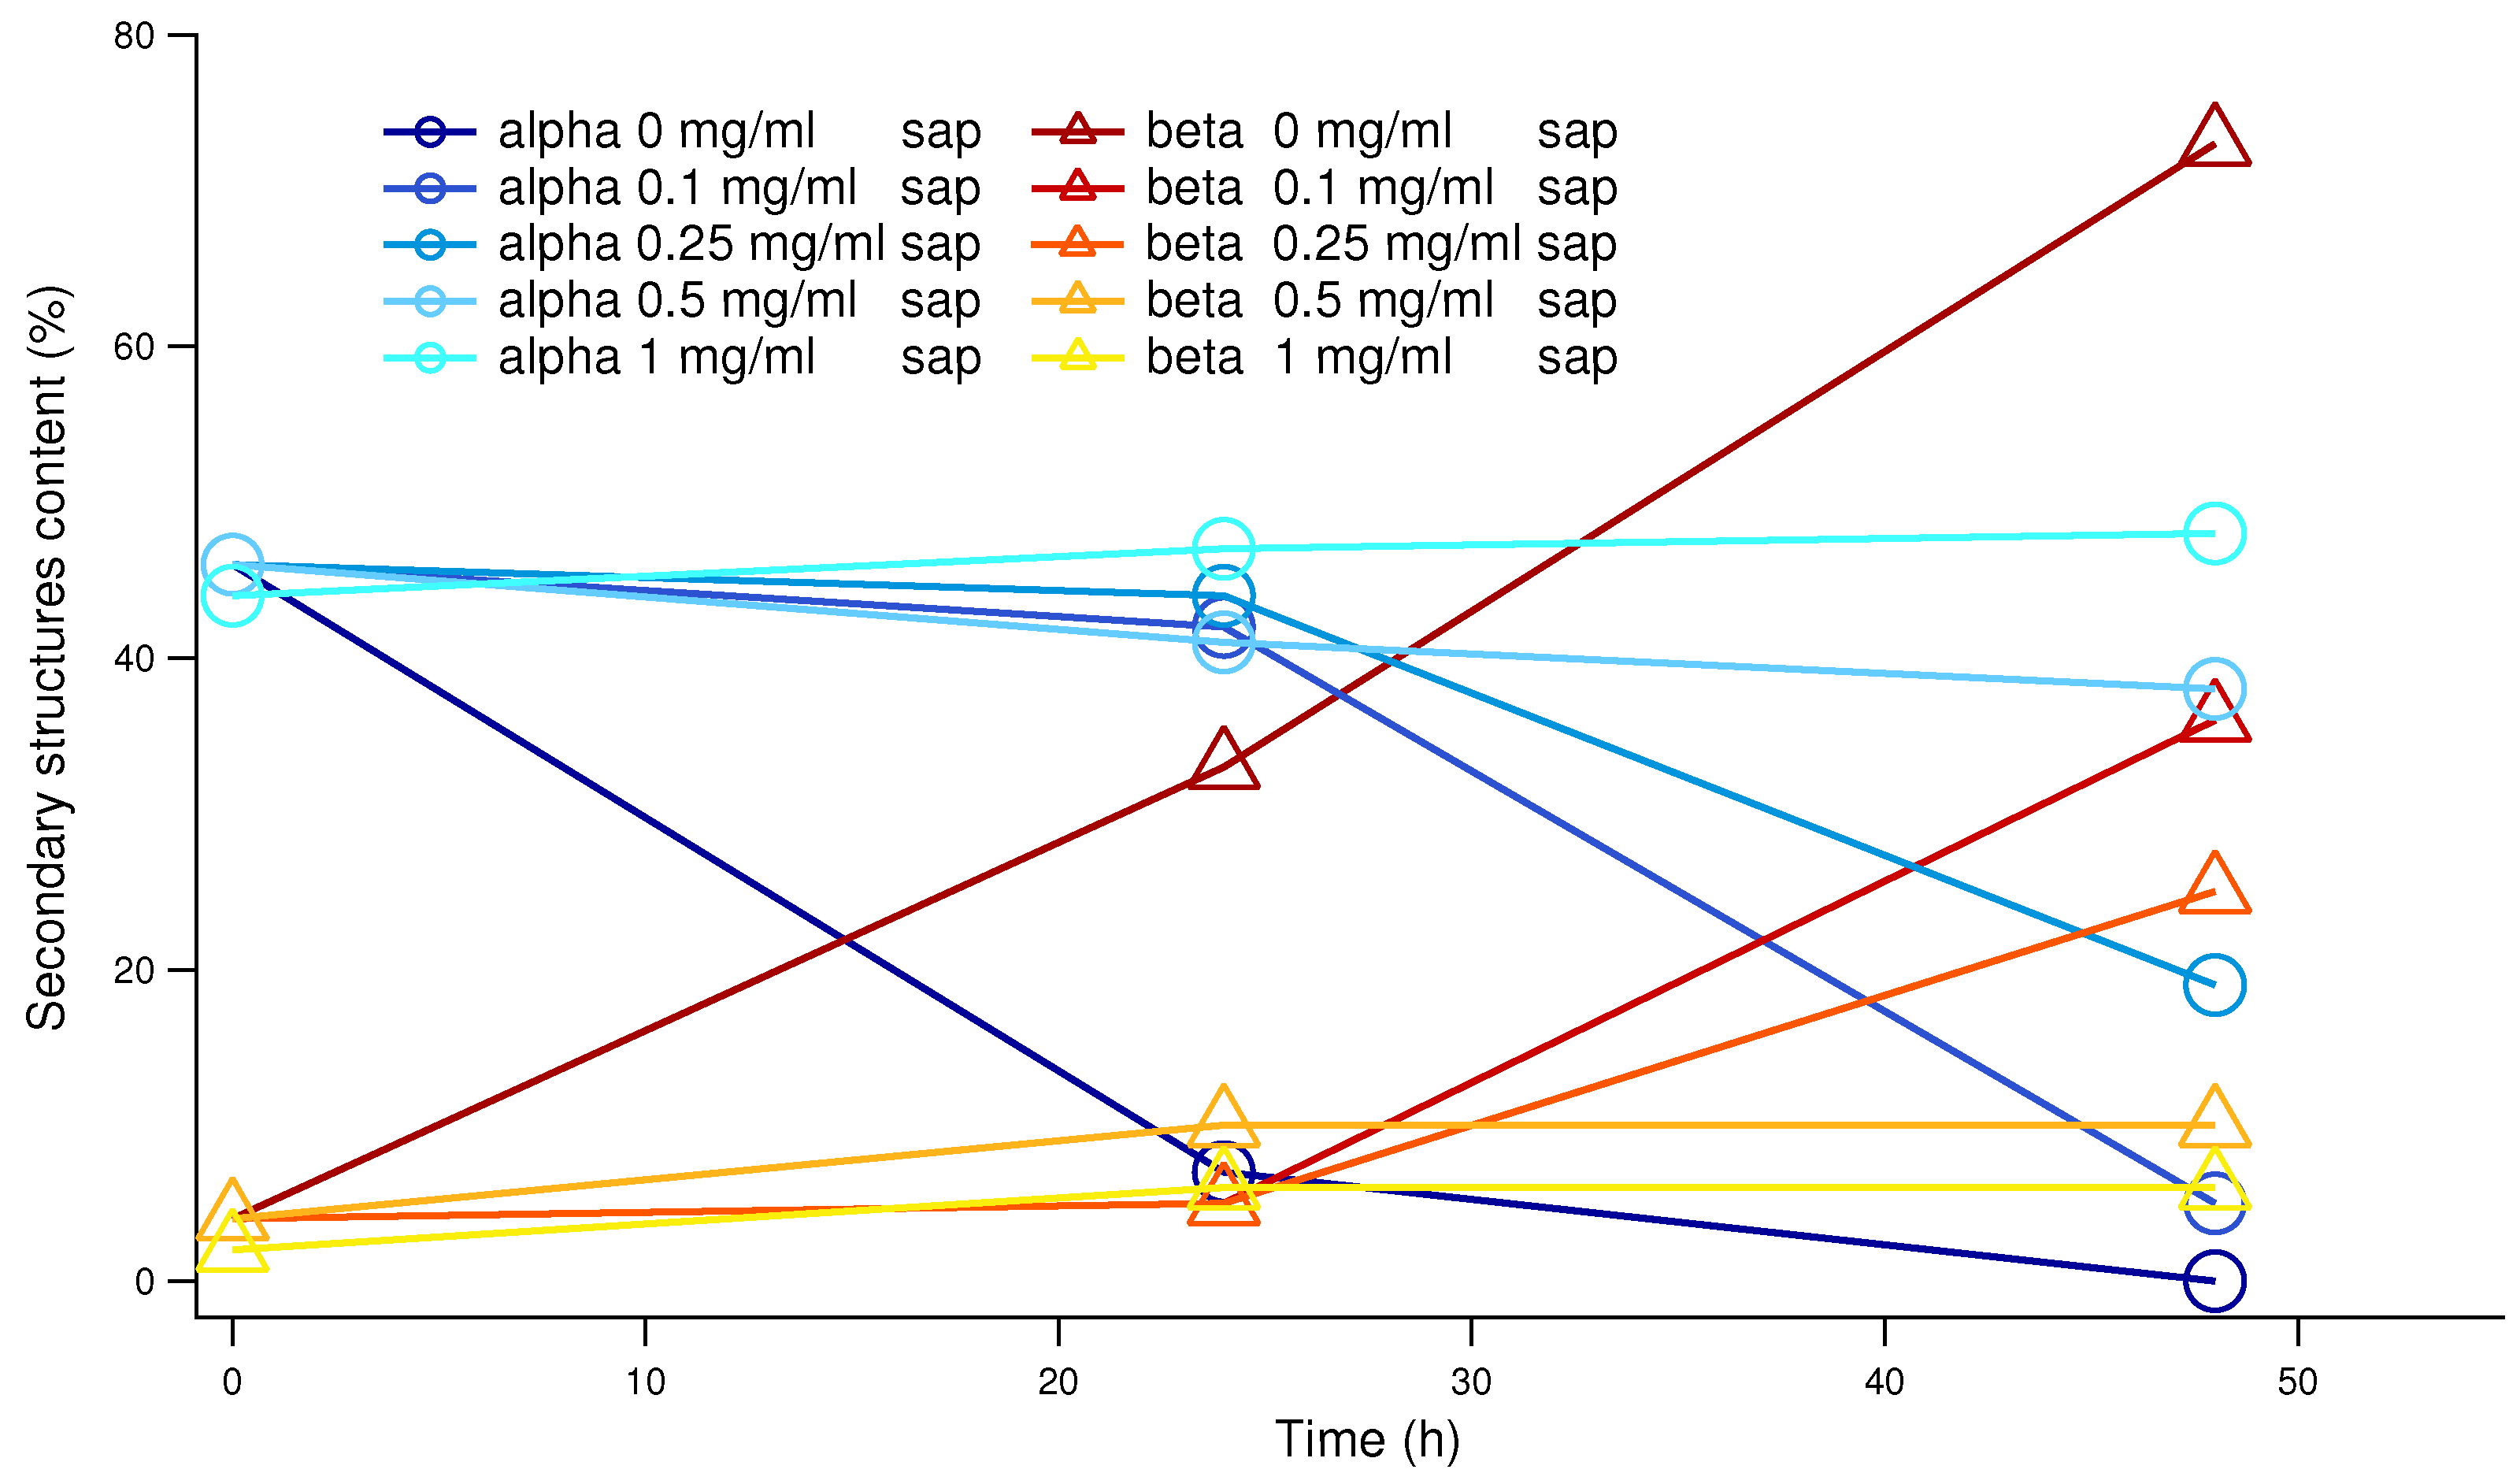
Figure 5.
DLS results: particle size distribution of human insulin at 0.5 mg/ml, after 5 hours of kinetics of aggregation in the presence (pink line) and in the absence (blue line) of saponins.
Figure 5.
DLS results: particle size distribution of human insulin at 0.5 mg/ml, after 5 hours of kinetics of aggregation in the presence (pink line) and in the absence (blue line) of saponins.
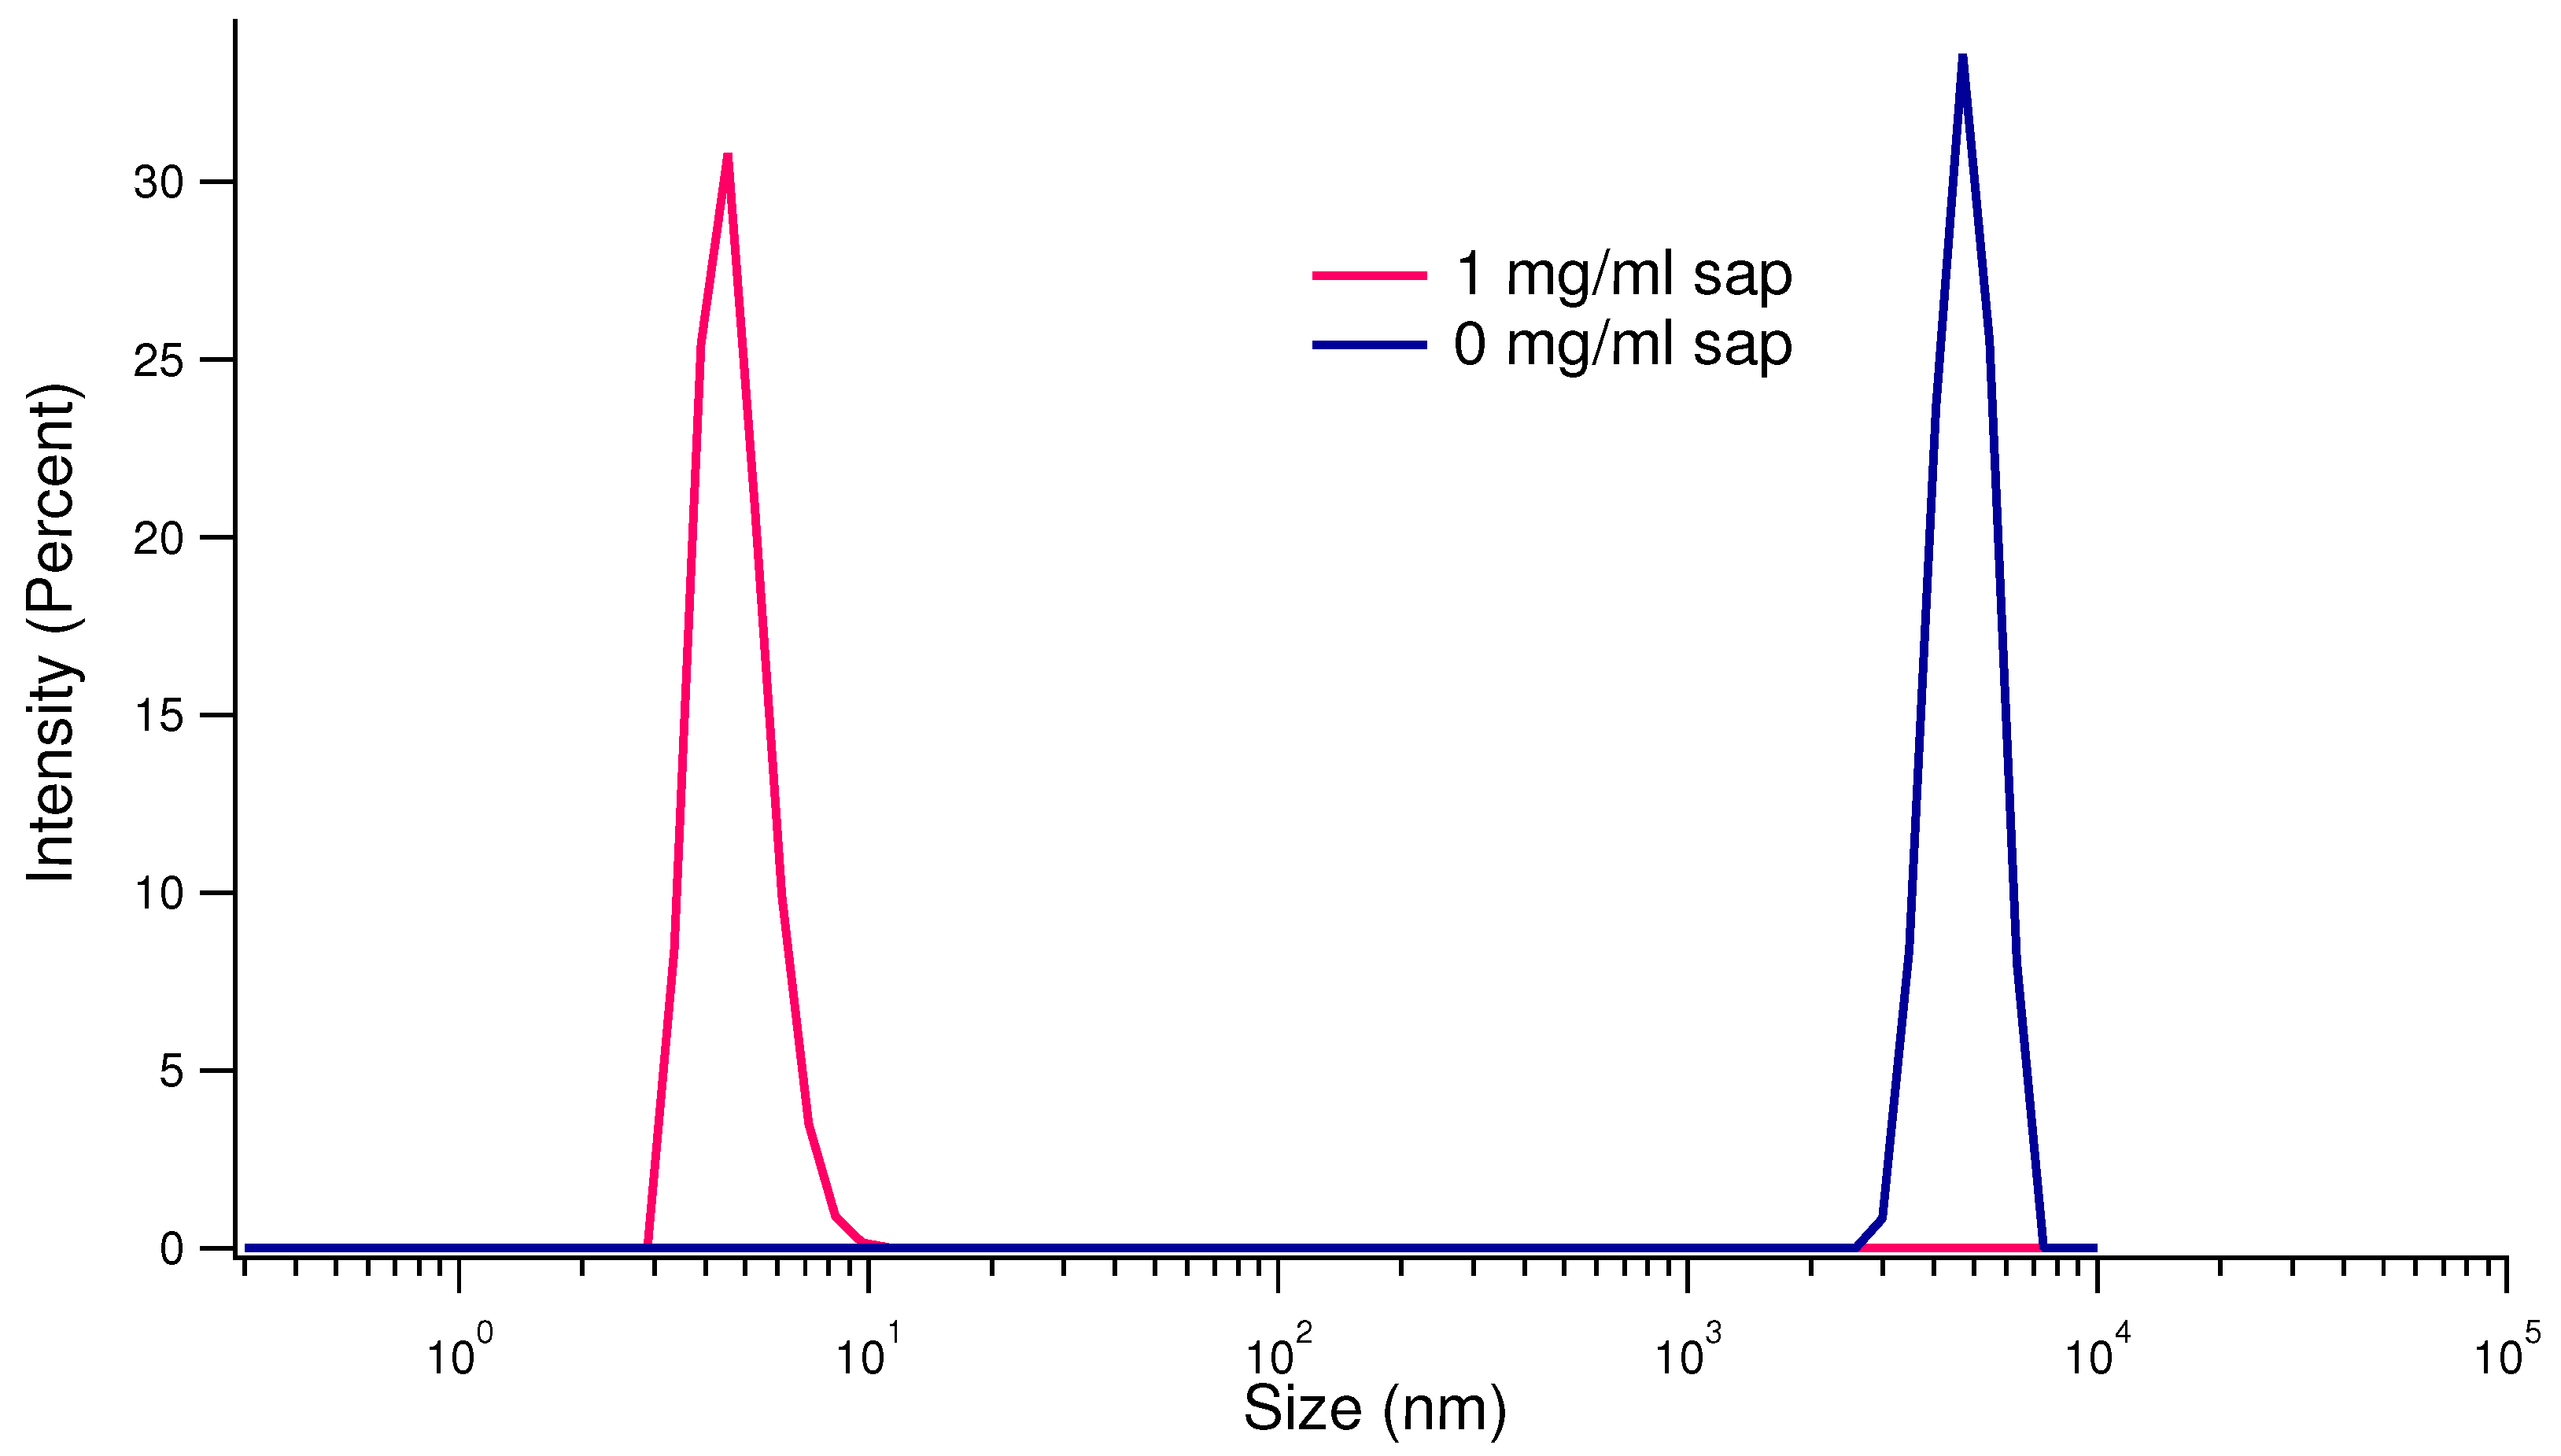
Figure 6.
SAXS results. Upper panels: SAXS spectra relative to human insulin (c= 0.5 mg/ml, pH 7.4) aggregation patterns at the beginning (0 h, in the legend, blue points), and after 6 (purple points) and 12 hours (cyan points). On the left side, data concern insulin dissolved without saponins, and on the right side data collected in presence of 1 mg/ml saponins, as in the legend. Bottom figure: structural parameters obtained by Guinier (Rg) and Guinier rod-like (Rc) analysis as a function of aggregation time. The empty cyan triangles represent the parameters achieved (Rg) for the curves obtained for the kinetics in the presence of saponins, while the orange (Rg) and the blue (Rc) triangles represent the parameters achieved for the kinetics in the absence of saponins.
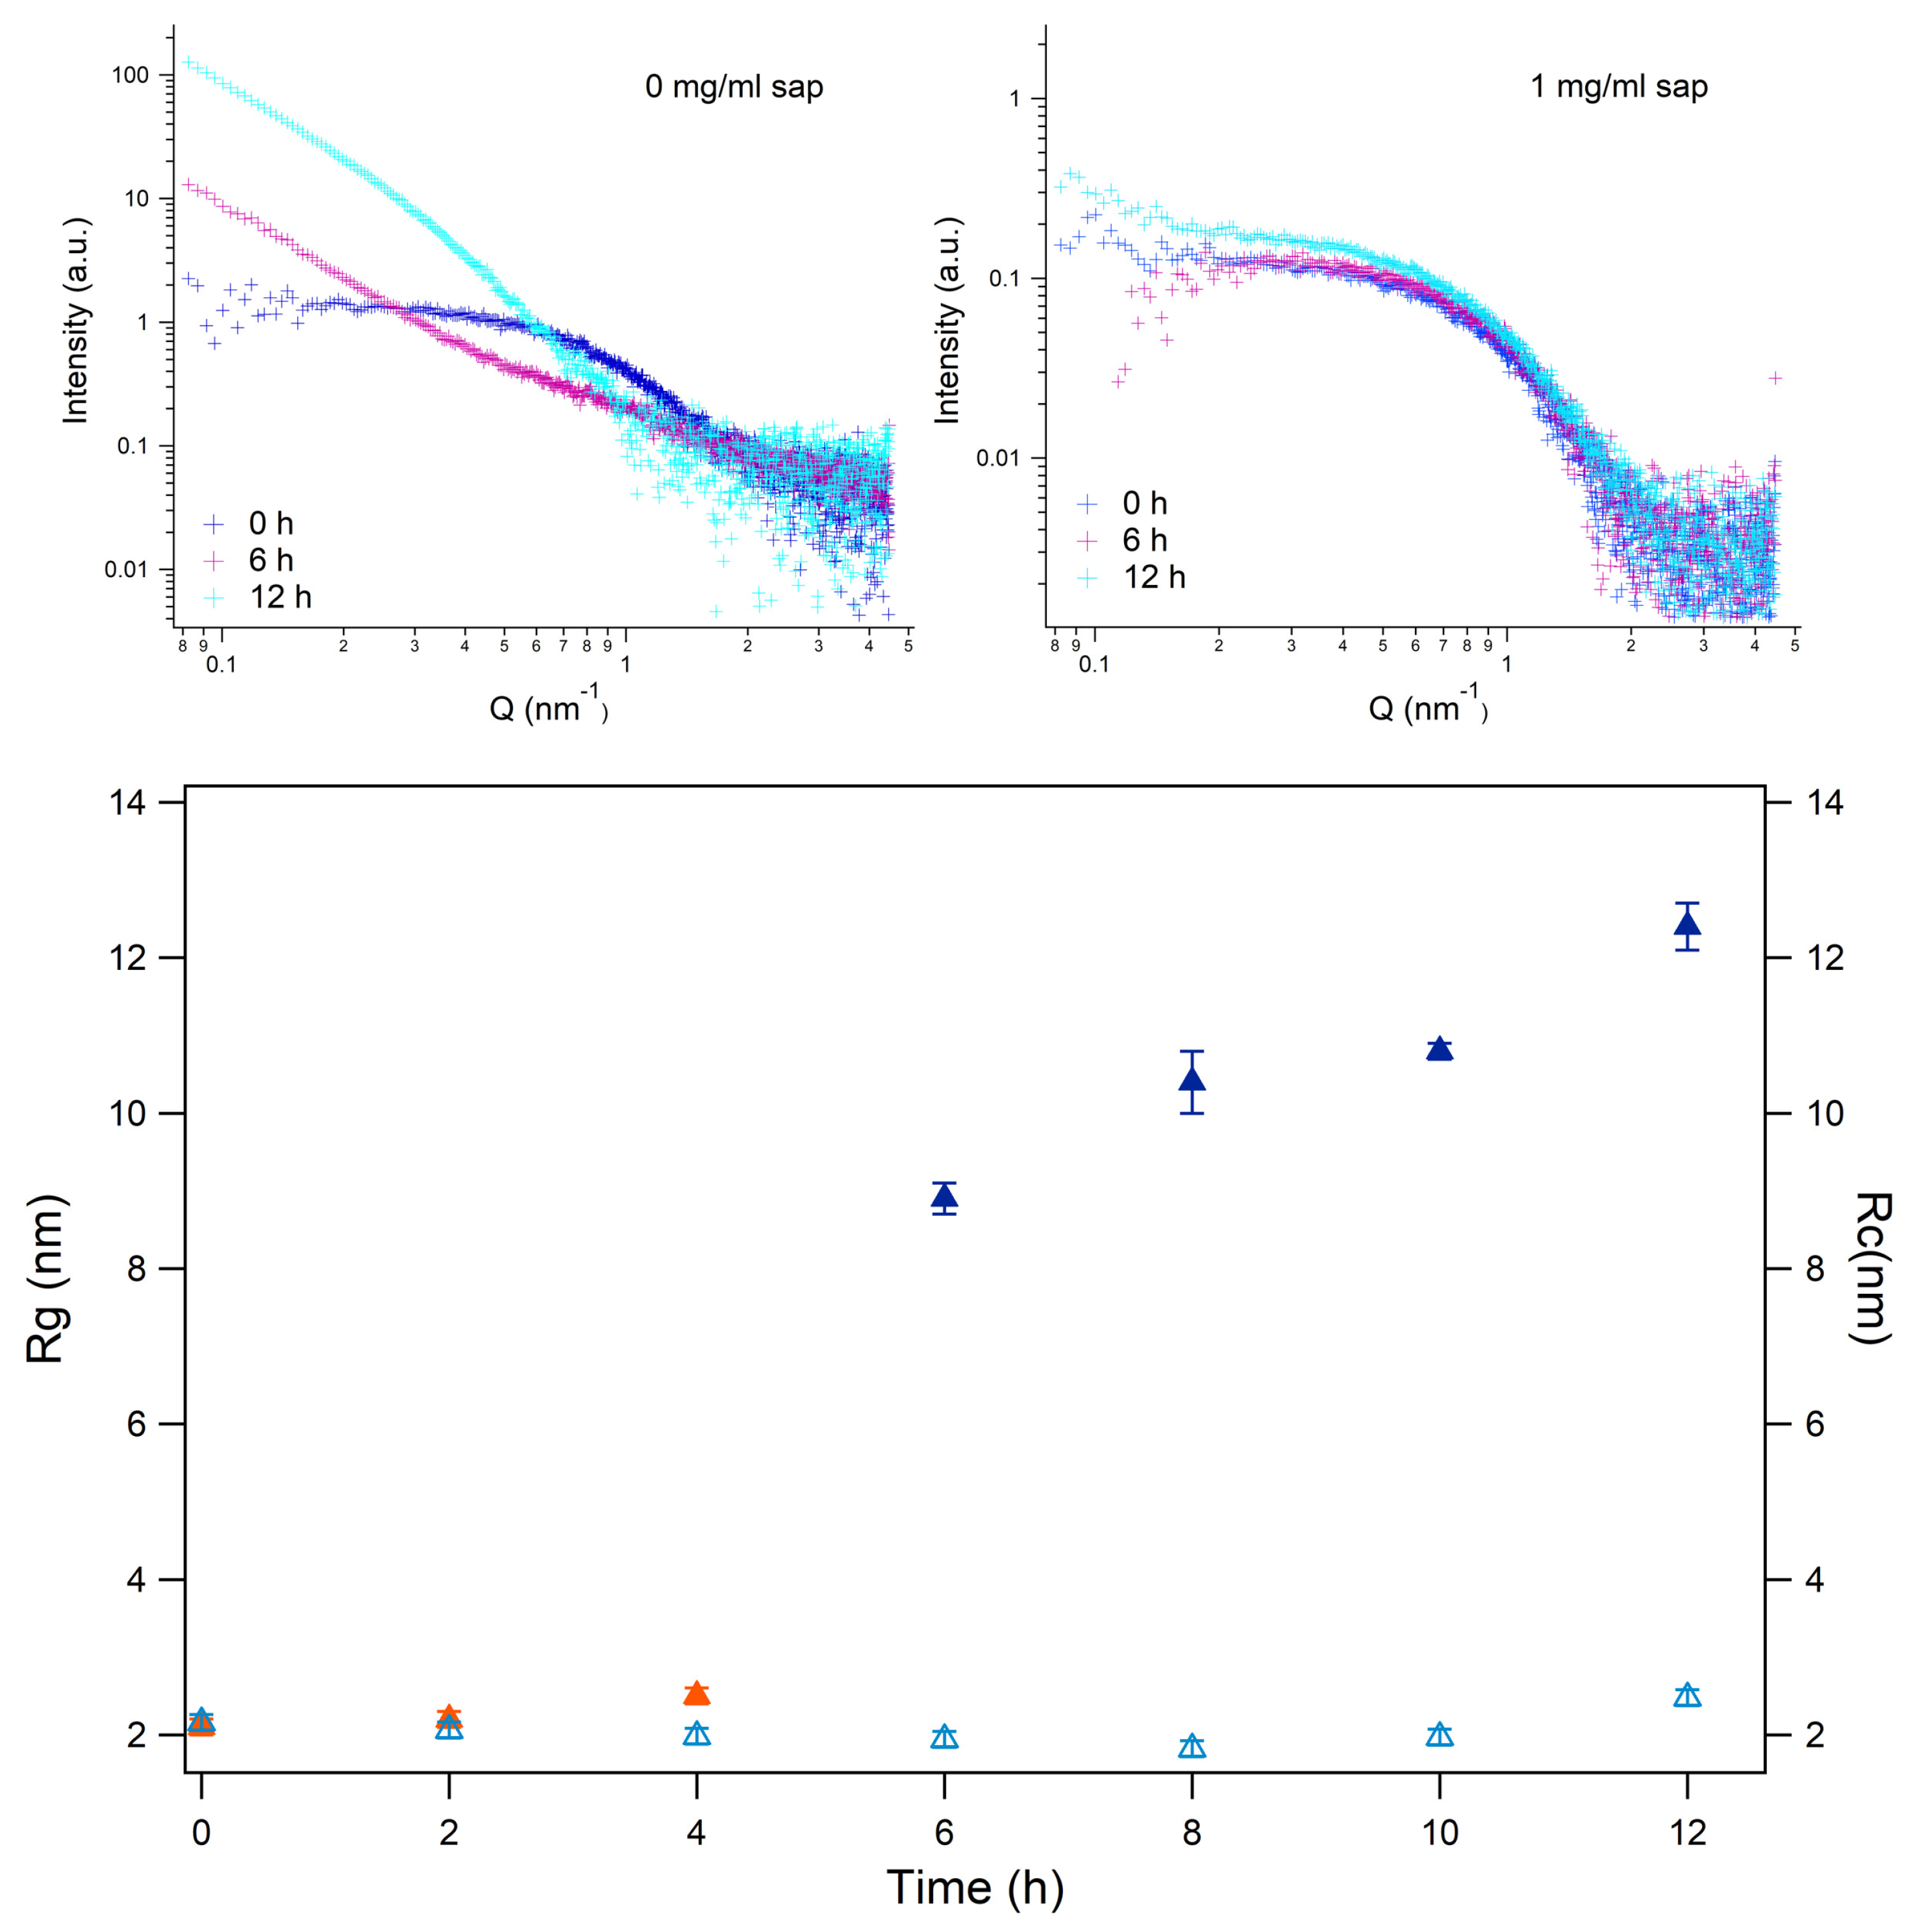
Figure 7.
Atomic Force Microscopy images. Grey Panel: Insulin without Saponin. Light Blue Panel: Insulin with Saponins. Pink powder Panel: Saponin without insulin.
Figure 7.
Atomic Force Microscopy images. Grey Panel: Insulin without Saponin. Light Blue Panel: Insulin with Saponins. Pink powder Panel: Saponin without insulin.
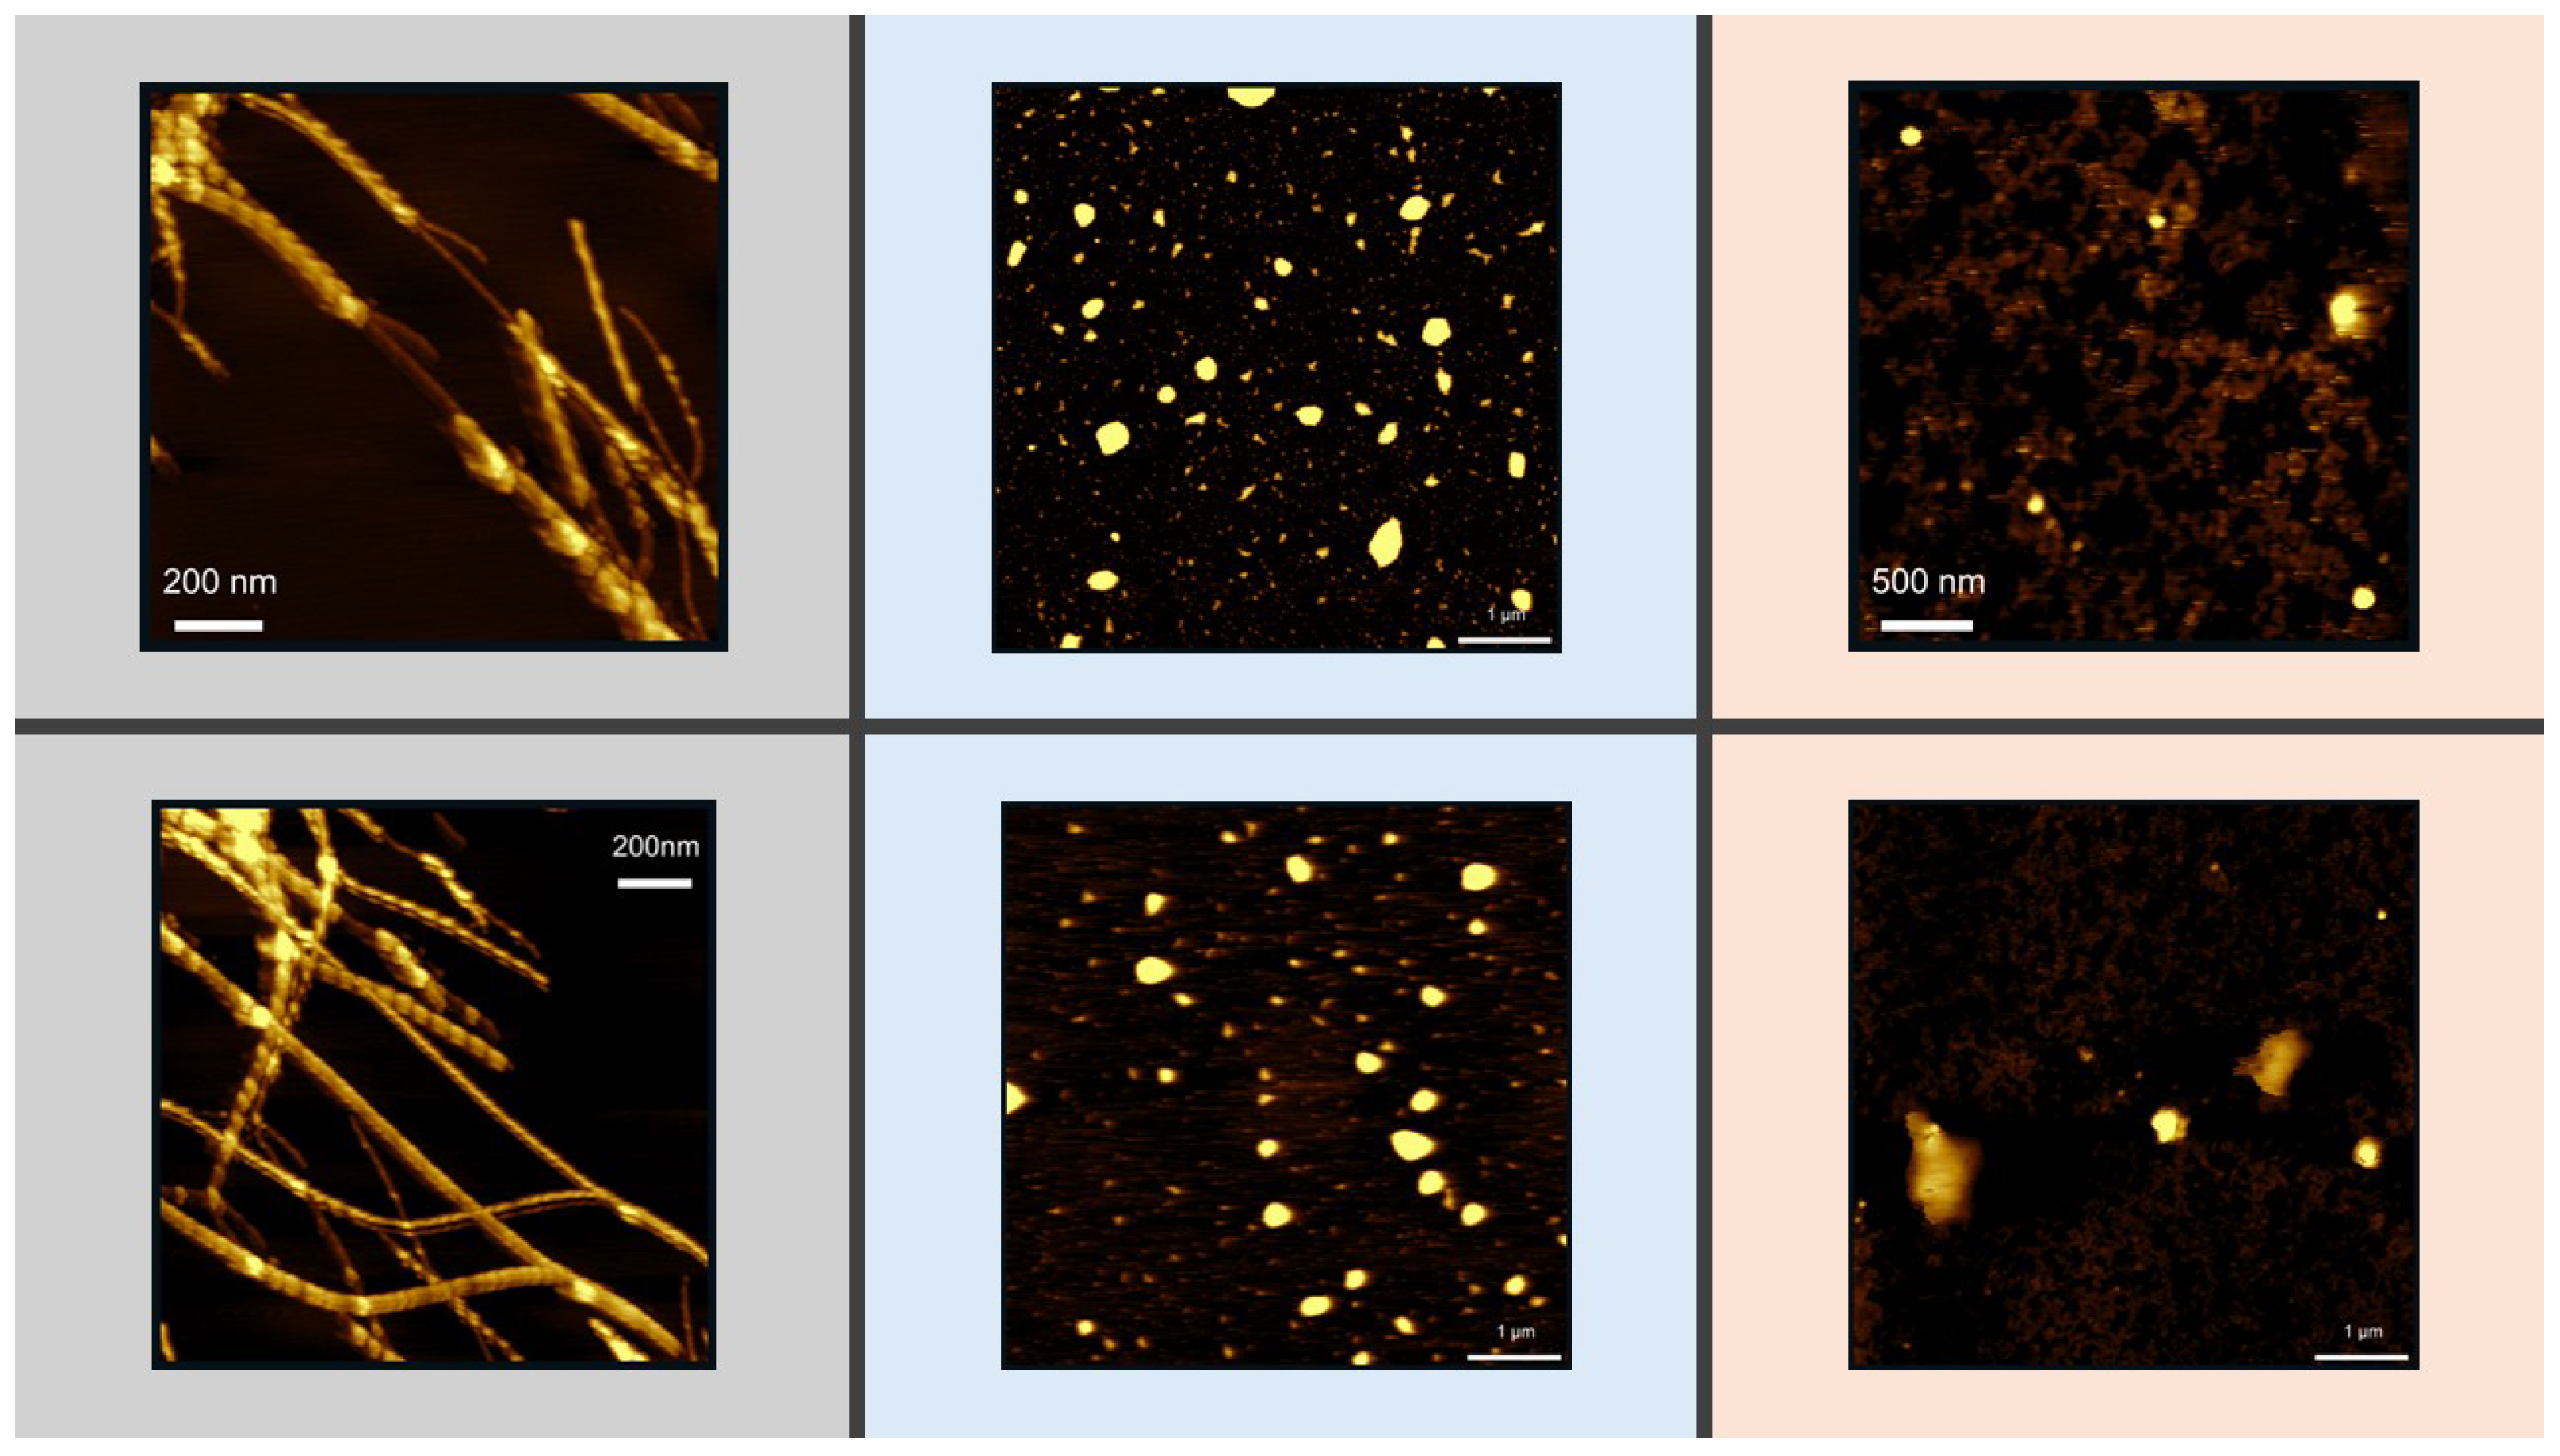
Figure 8.
Chichigenin B (in tube representation) and insulin (ribbons) molecular organization at the final steady state of the 200 ns MD simulation.
Figure 8.
Chichigenin B (in tube representation) and insulin (ribbons) molecular organization at the final steady state of the 200 ns MD simulation.
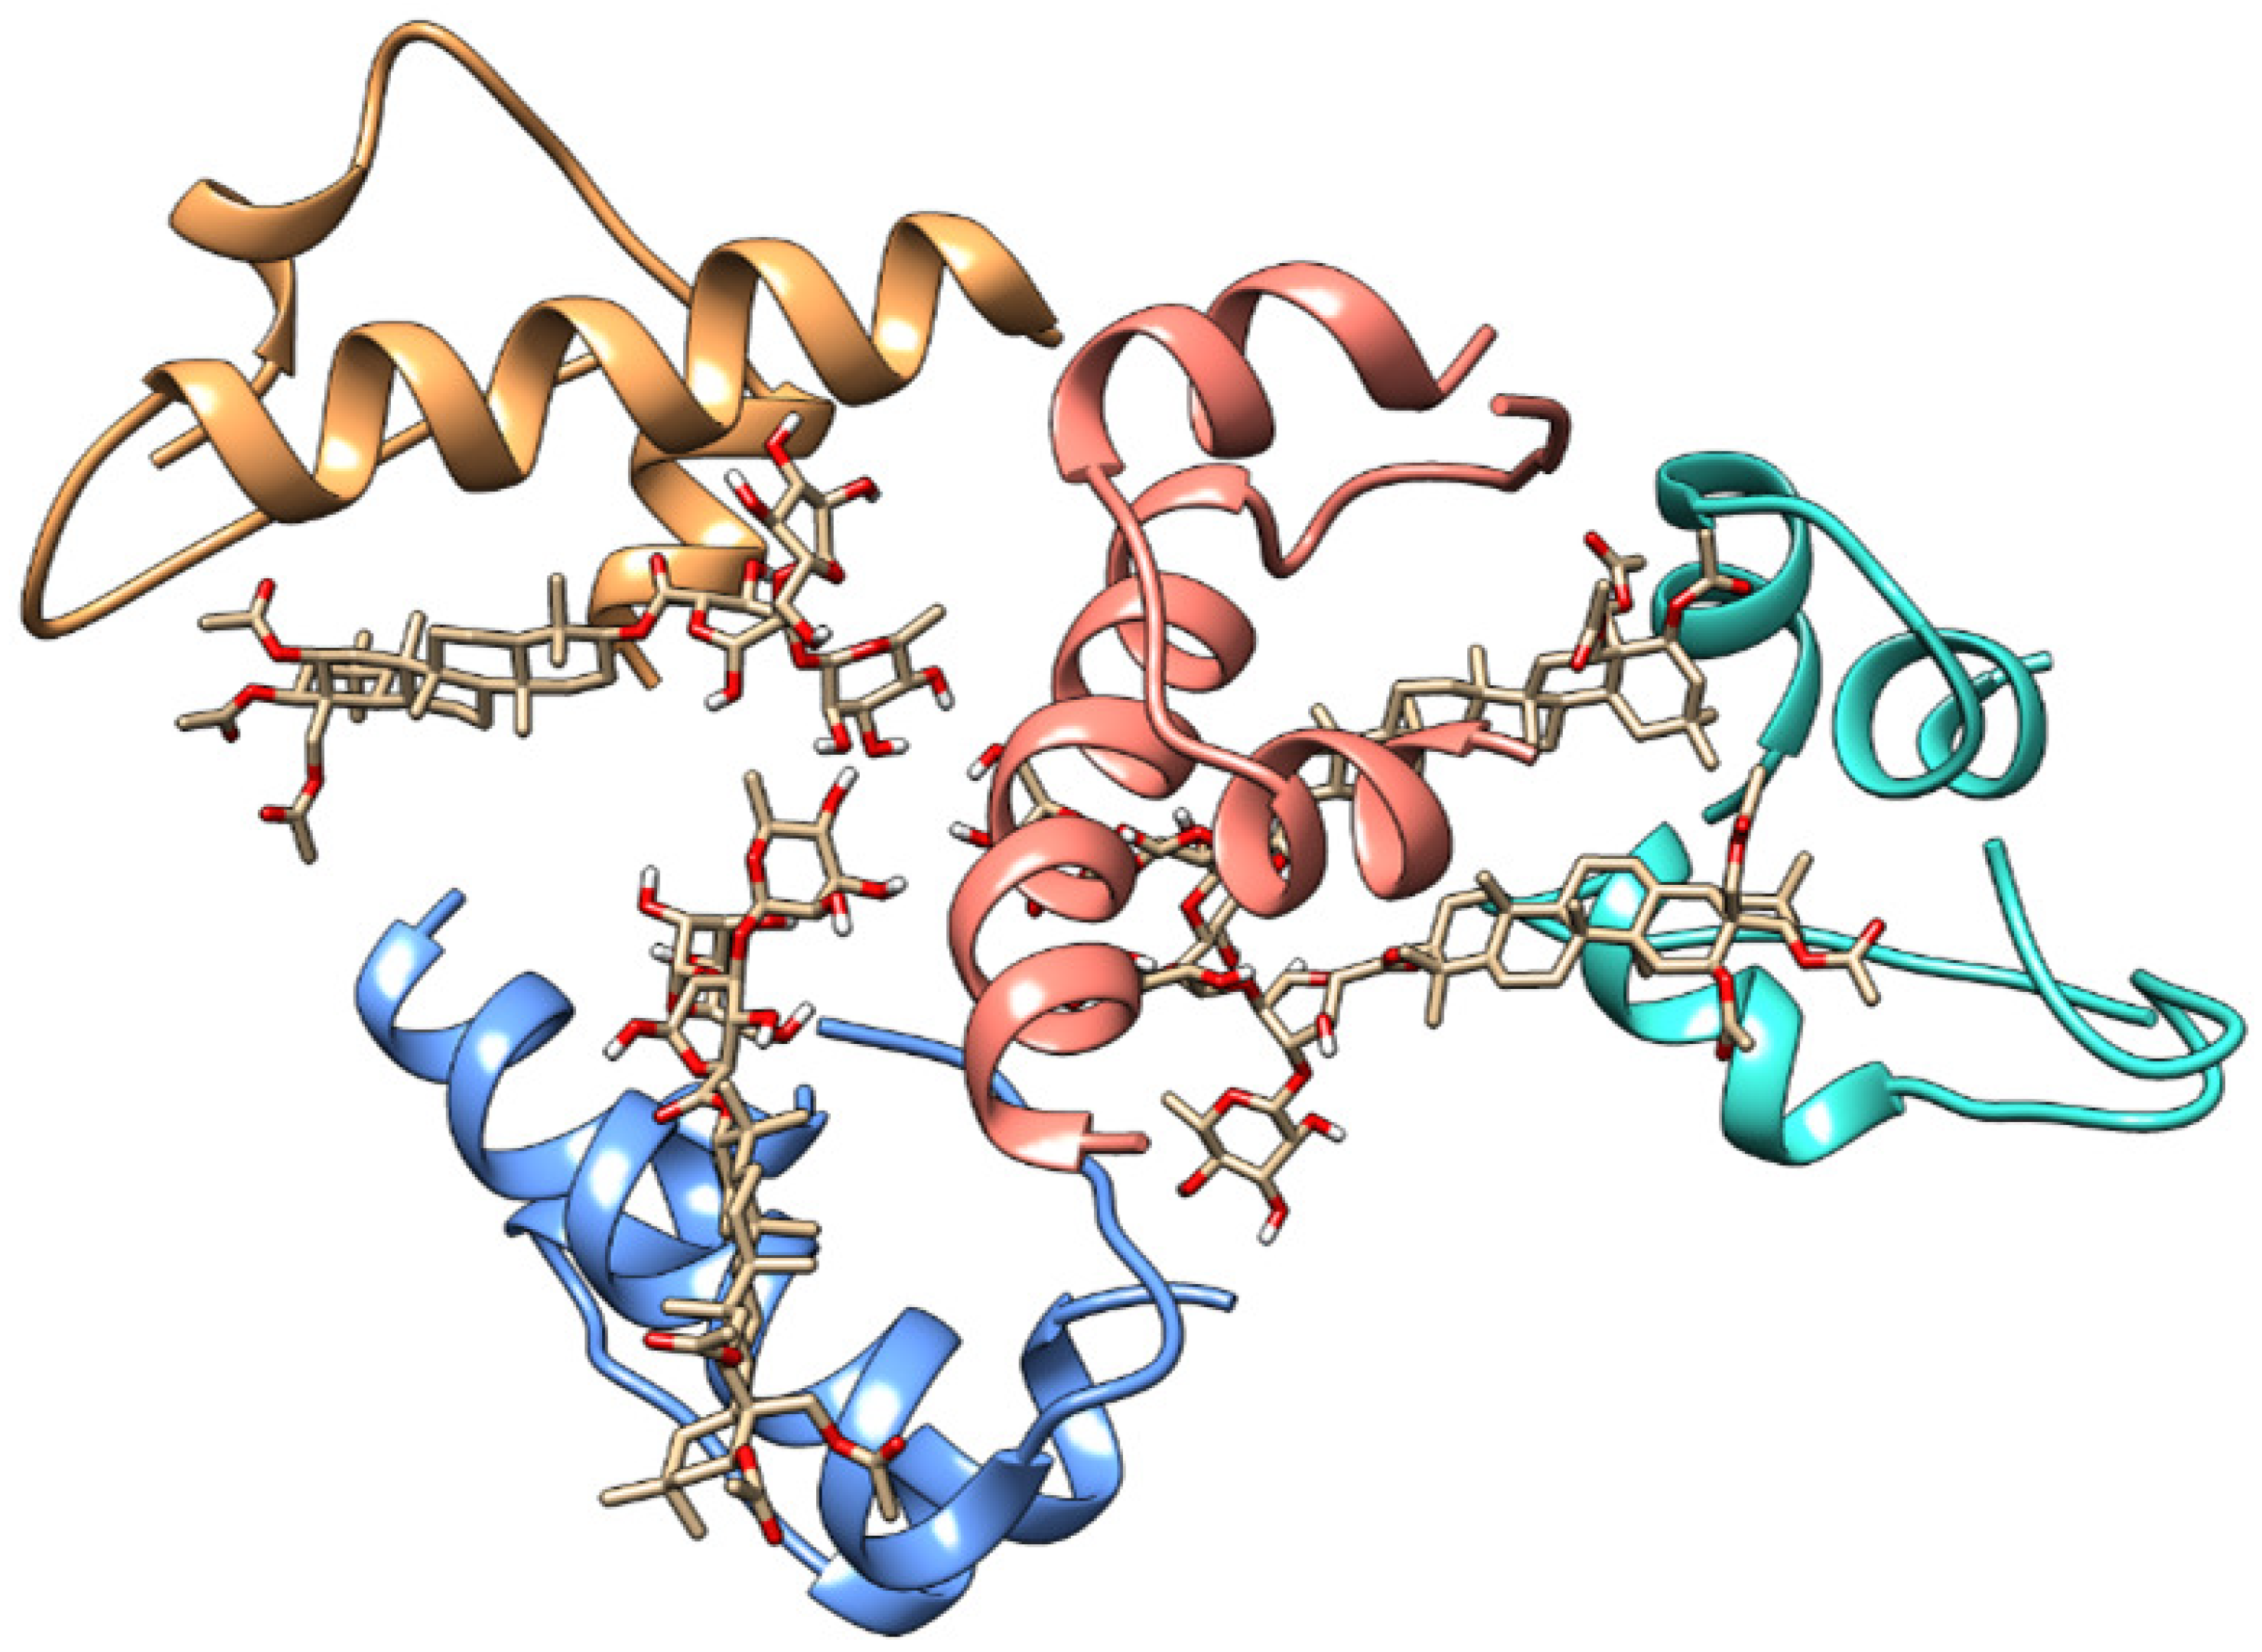
Figure 9.
Intermolecular distances between the four Chichigenin B molecules (a) and insulin (b) along the 200 ns MD simulation.
Figure 9.
Intermolecular distances between the four Chichigenin B molecules (a) and insulin (b) along the 200 ns MD simulation.
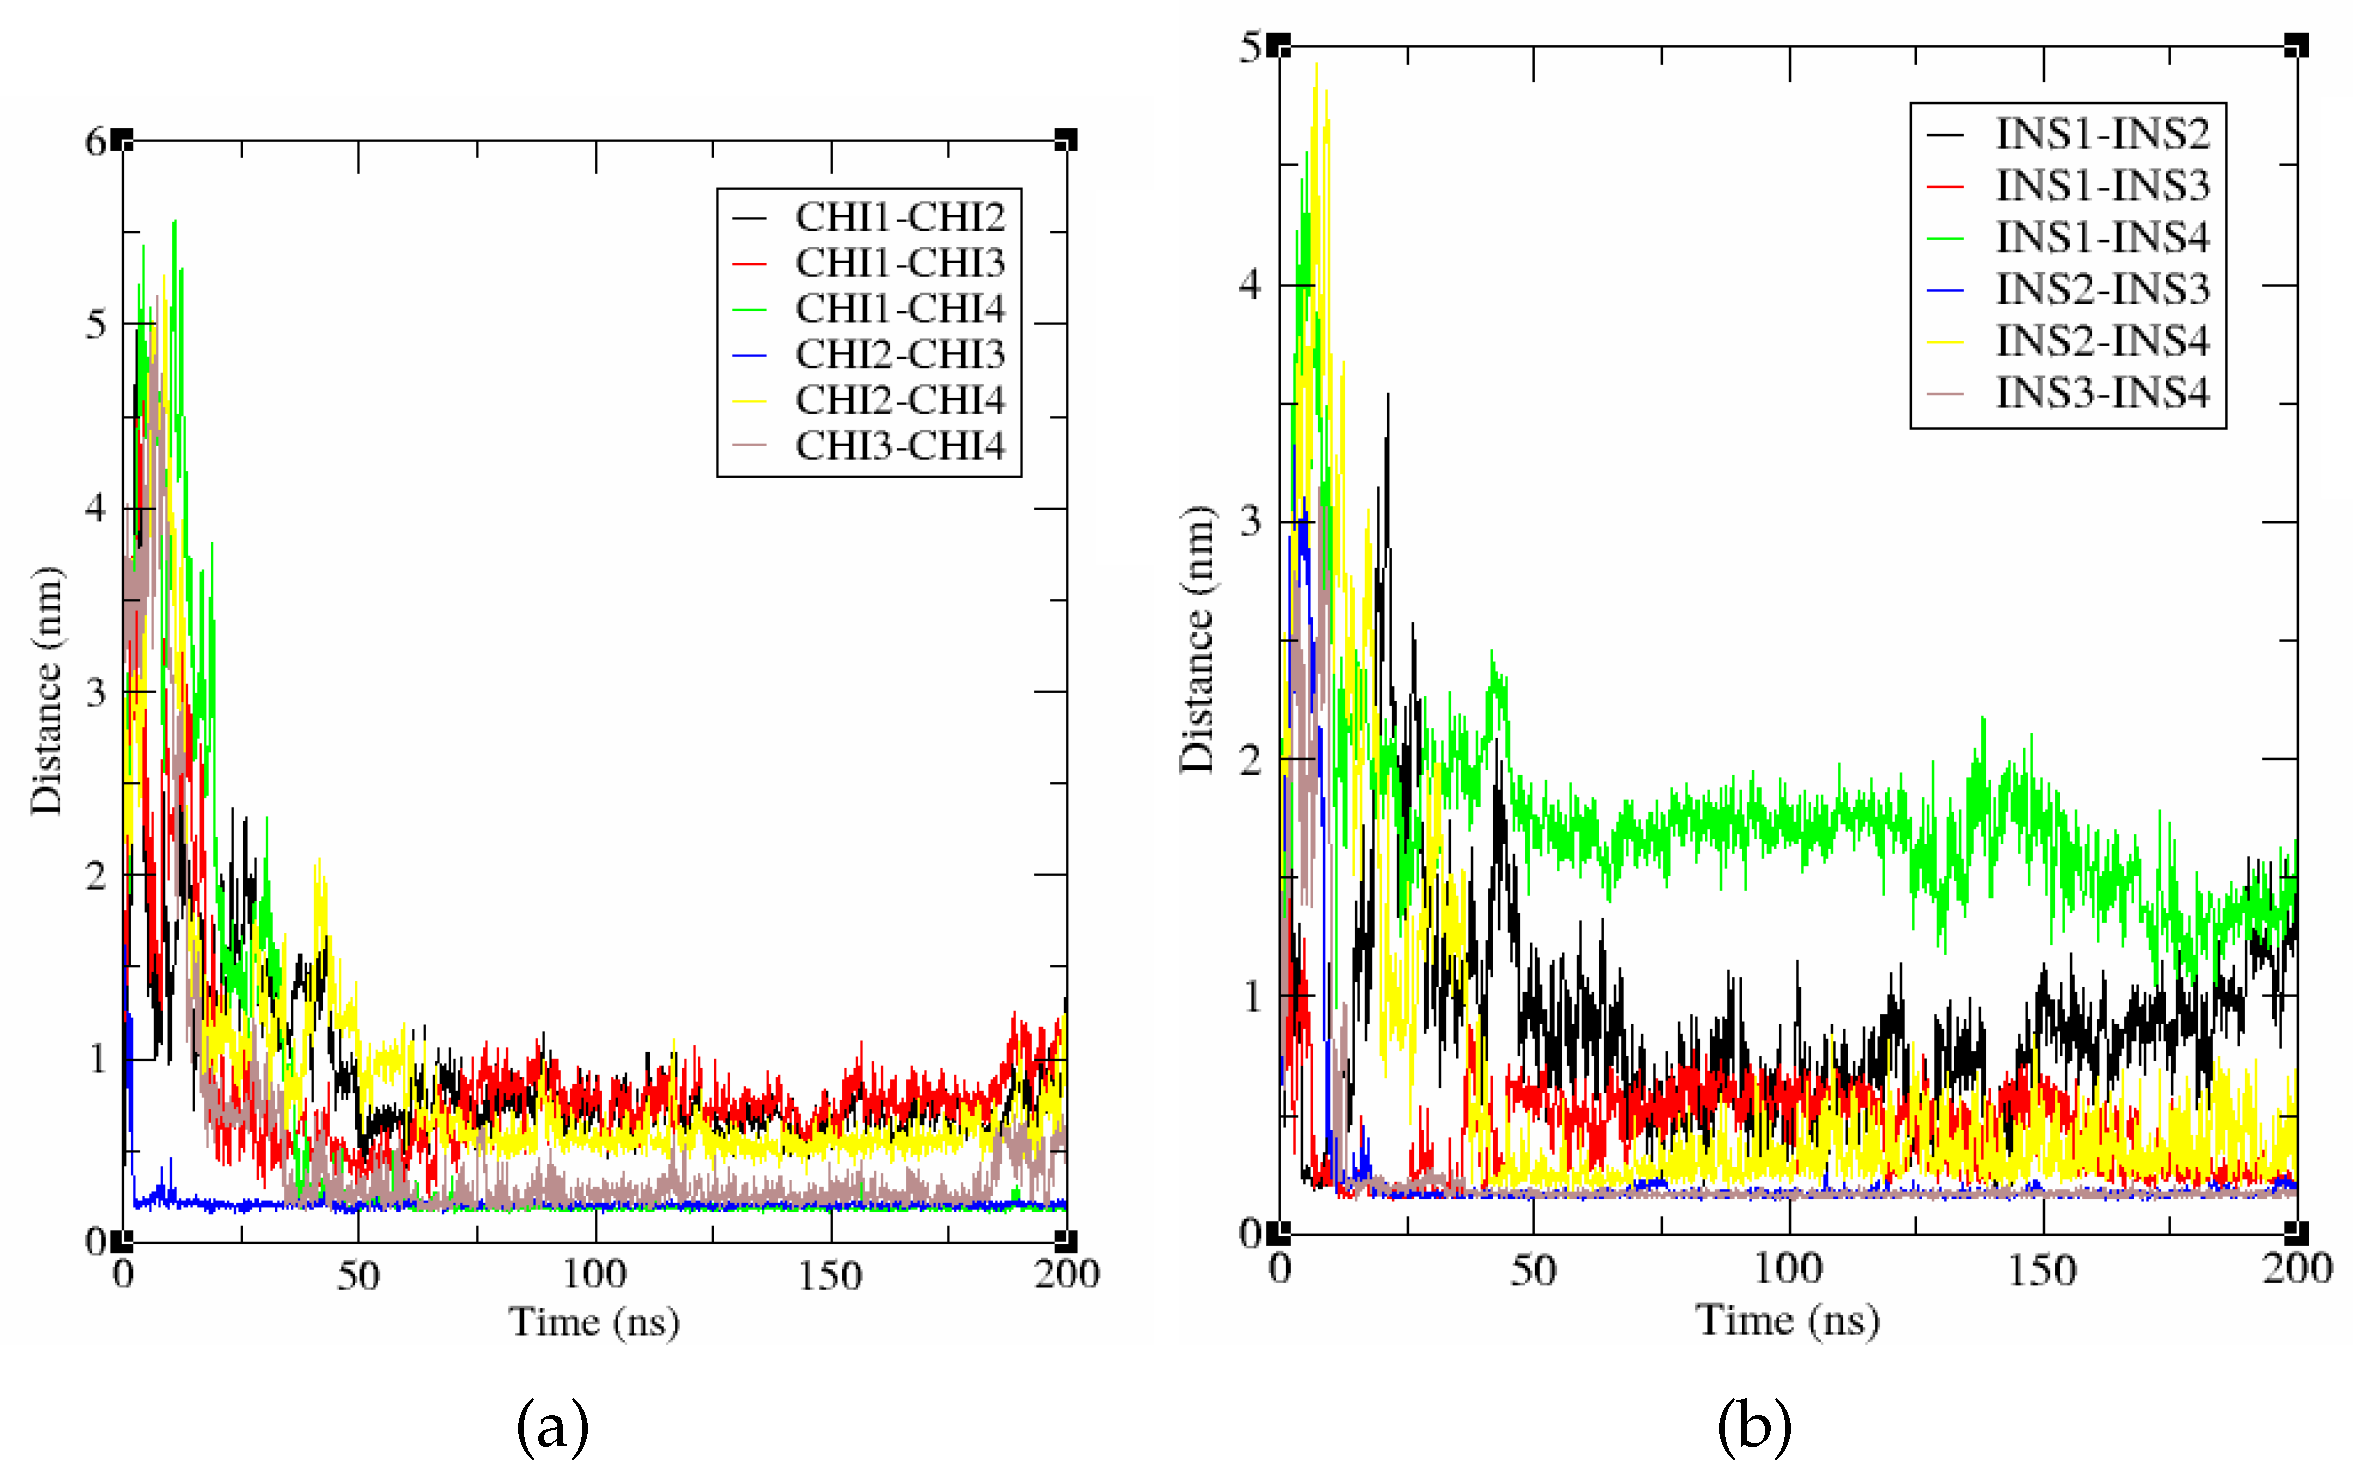
Figure 10.
Visualization obtained from the 200 ns MD simulation of Chichigenin B and human insulin, evidencing the residues playing a fundamental role in dimerization.
Figure 10.
Visualization obtained from the 200 ns MD simulation of Chichigenin B and human insulin, evidencing the residues playing a fundamental role in dimerization.
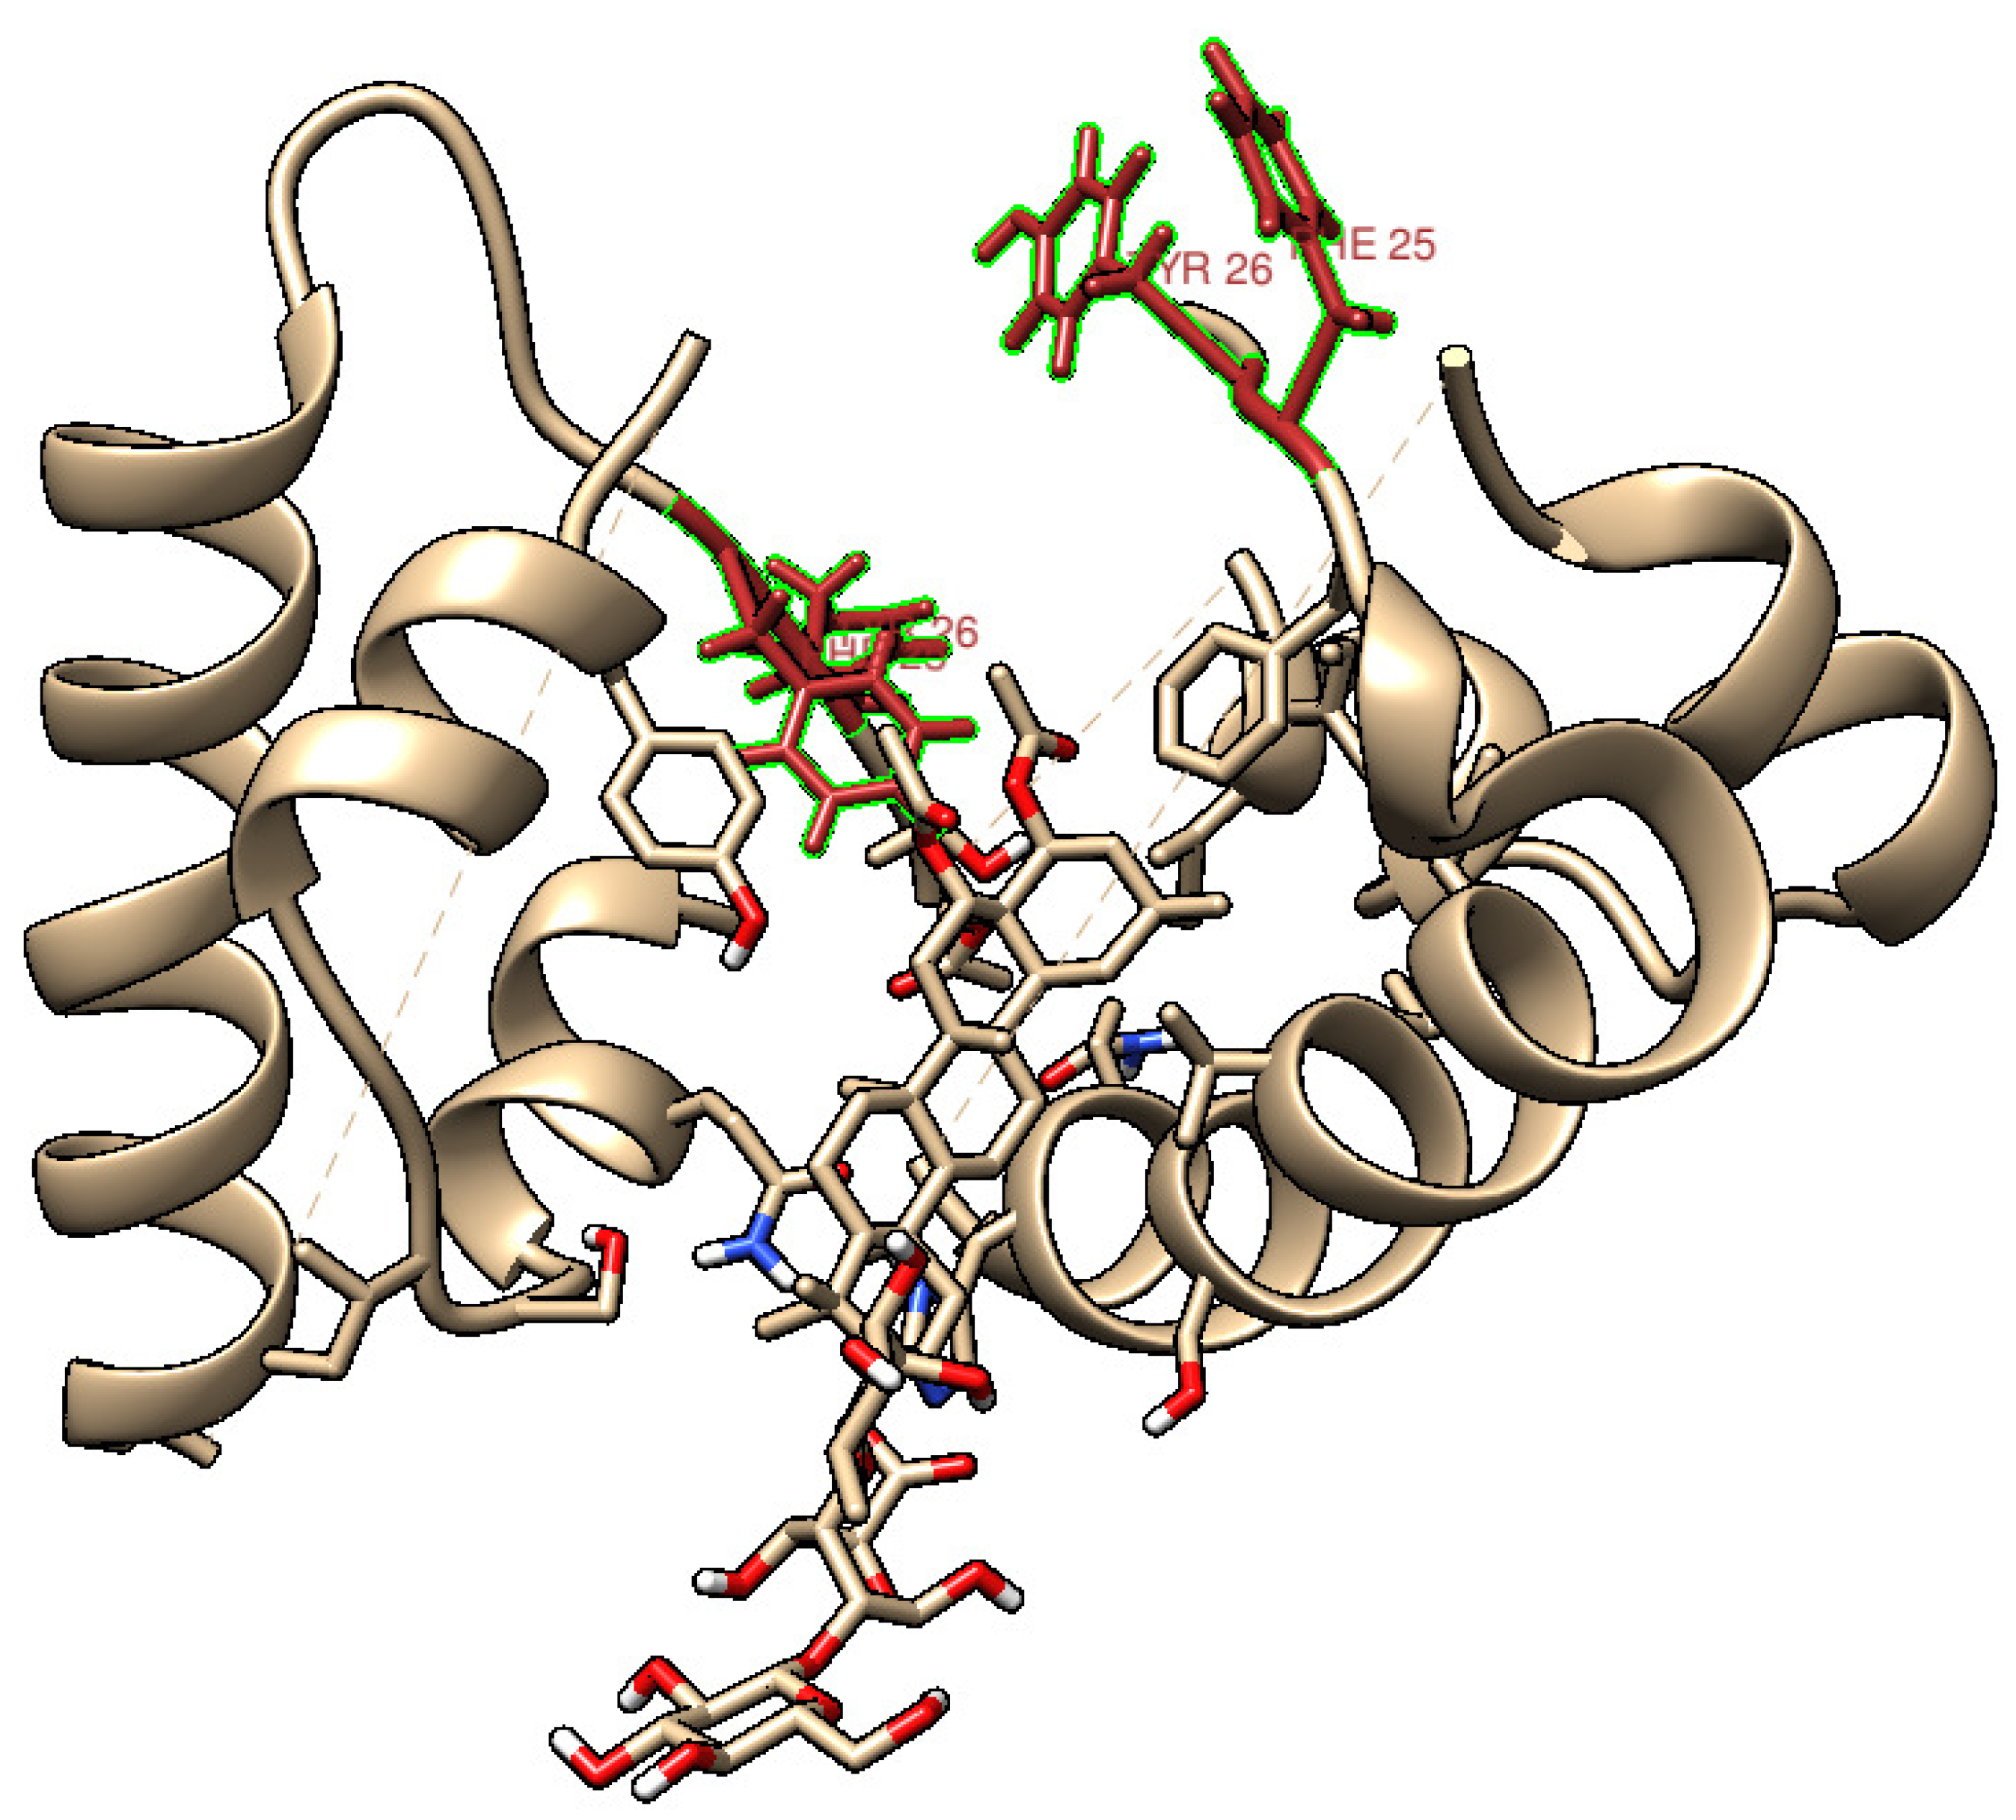

Table 1.
Halftimes of human insulin aggregation process at pH 7.4 and 37°C, in presence of different saponins concentrations.
Table 1.
Halftimes of human insulin aggregation process at pH 7.4 and 37°C, in presence of different saponins concentrations.
| Saponins concentration (mg/ml | 0 | 0.1 | 0.25 | 0.5 | 1.0 |
|---|---|---|---|---|---|
| Halftime (h) | 19.2 ± 0.1 | 42.6 ± 0.7 | 42.6 ± 0.7 | 52 ± 1 | 110 ± 80 |
Disclaimer/Publisher’s Note: The statements, opinions and data contained in all publications are solely those of the individual author(s) and contributor(s) and not of MDPI and/or the editor(s). MDPI and/or the editor(s) disclaim responsibility for any injury to people or property resulting from any ideas, methods, instructions or products referred to in the content. |
© 2024 by the authors. Licensee MDPI, Basel, Switzerland. This article is an open access article distributed under the terms and conditions of the Creative Commons Attribution (CC BY) license (http://creativecommons.org/licenses/by/4.0/).
Copyright: This open access article is published under a Creative Commons CC BY 4.0 license, which permit the free download, distribution, and reuse, provided that the author and preprint are cited in any reuse.


