
Submitted:
26 November 2024
Posted:
28 November 2024
You are already at the latest version
Abstract
Dissolved oxygen content is a paramount indicator of water quality. The quality of water and its remediation are directly linked to the dissolved oxygen concentration within it. A higher dissolved oxygen level signifies better water quality. Aeration processes are employed to enhance dissolved oxygen levels in water treatment. Aeration is achieved through natural methods or hydraulic structures that increase the interfacial area between water and air. This study investigates the aeration efficiencies of pressurized flow systems equipped with Venturi devices of two different orifice diameters connected to four distinct manifold pipe systems. The findings indicate that the orifice diameters of these hydraulic structures (Venturi devices) significantly influence aeration efficiency.
Keywords:
aeration
; Venturi
; manifold
1. Introduction
In aeration systems, air-water mixtures facilitate the transfer of oxygen from the atmosphere. Aeration is typically carried out for purposes such as oxygen transfer to water, mixing, and flotation. In addition to traditional aerators like mechanical aerators and pressurized diffusers, water jet aeration systems are also employed. Water jets play a crucial role in the transmission of air, the dispersion of transmitted air in the water mass as air bubbles, and ensuring effective contact between the air-water mixture. In practical applications, jet aerators are used in chemical engineering for mixing processes and enhancing gas-liquid transfer. In contrast, in environmental engineering, they are preferred for mixing and oxygen transfer processes in drinking water and wastewater treatment plants. Besides, Venturi-type aerators have recently become widely used. In these flow systems, the air drawn into the system enters as small bubbles, depending on various parameters.
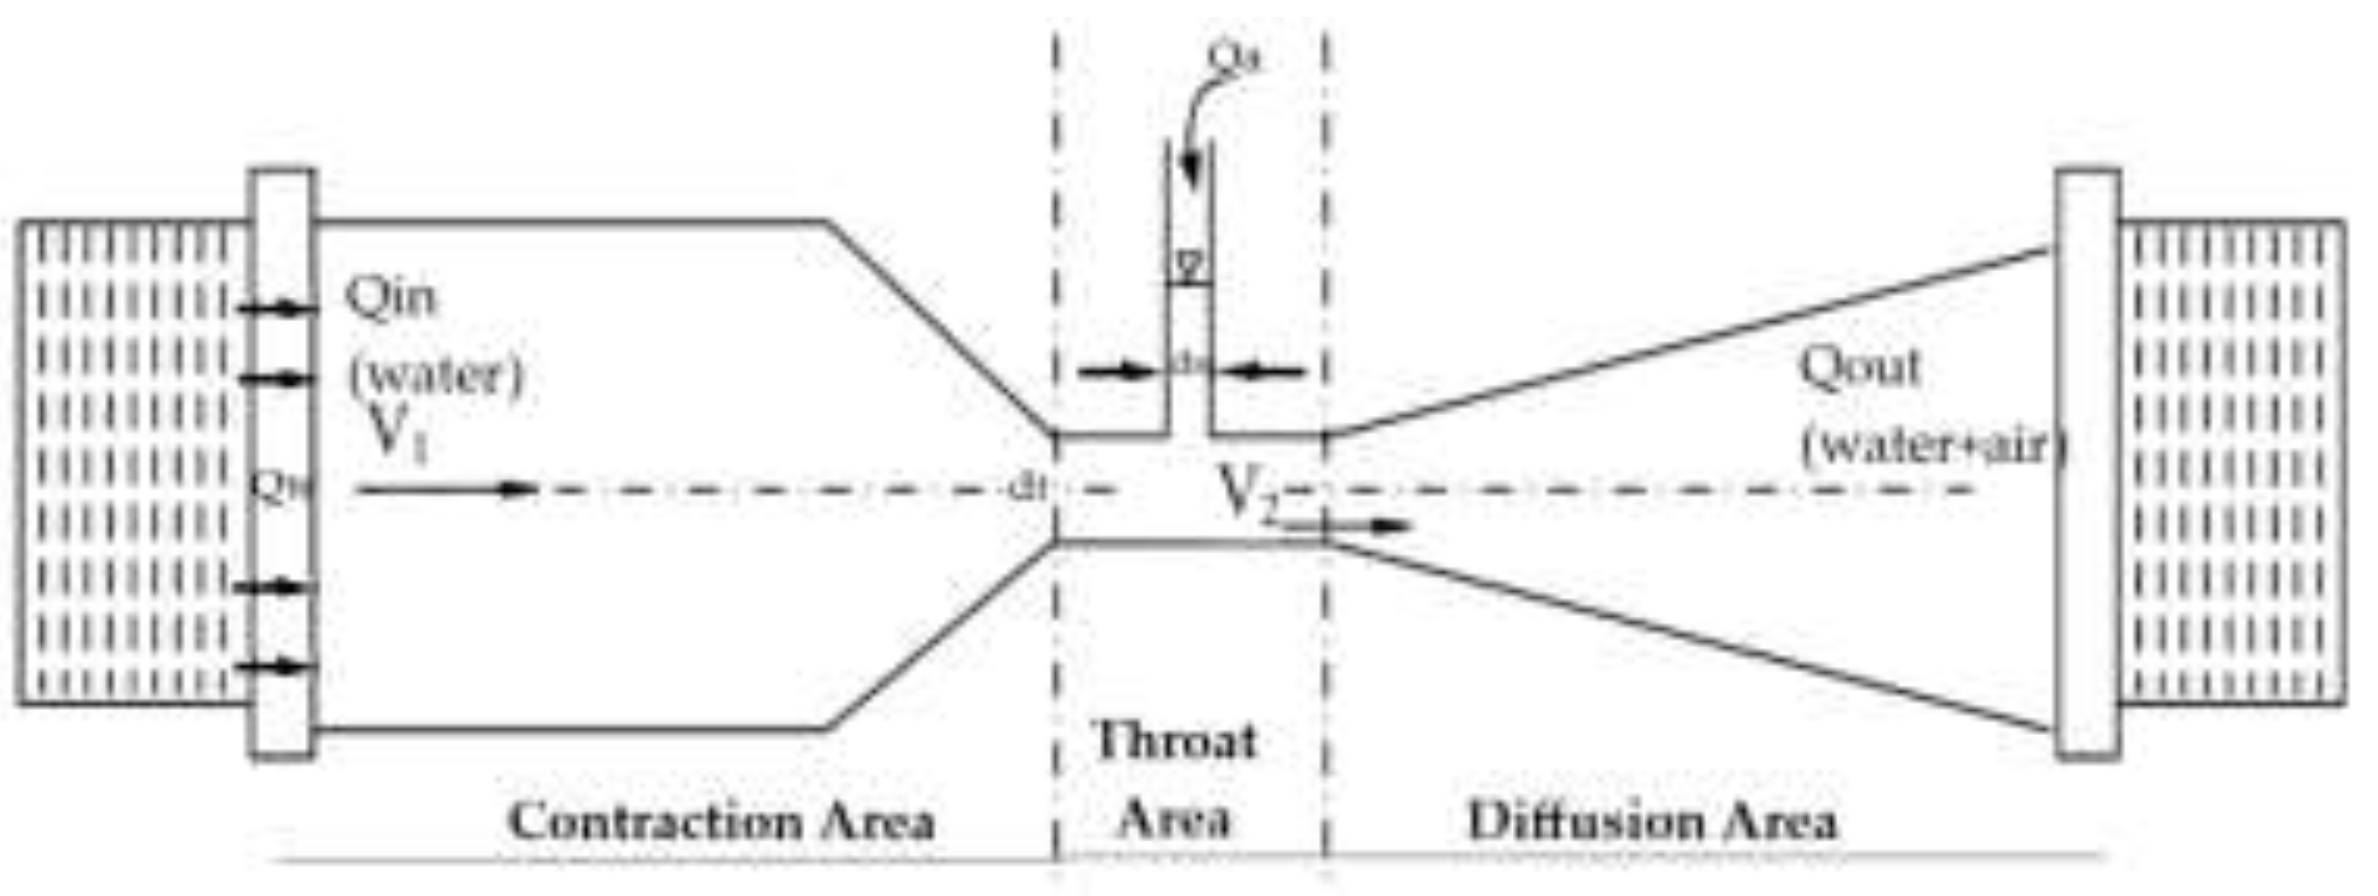
Due to its various advantages based on Bernoulli's principle, the Venturi is considered a productive, applicable, cost-effective, high-efficiency, energy-saving (20% of the energy required to create suction), and an attractive means of aeration [1]. As shown in Figure 1, the Venturi has a straightforward design.
In a study conducted by Baylar and Emiroğlu [2], it was determined that the dissolved oxygen content is an important indicator of water quality and that water jets can increase dissolved oxygen levels when the jet impact velocity exceeds a critical threshold. This study experimentally examined the air mixing ratio and oxygen transfer efficiency of a Venturi device equipped with air holes in the throat section, focusing particularly on the effects of the number, location, and open/closed status of the air holes. The results showed that the aeration of the resulting jet influenced the jet's expansion, shape, air mixing ratio, bubble penetration depth, and consequently, the oxygen transfer efficiency. It was demonstrated that the air mixing ratio and oxygen transfer efficiency values of the Venturi device were significantly higher than those for a circular nozzle.
Venturi pipe parts (VPPs) are devices that introduce air bubbles into flowing water through air inlet holes, thereby enhancing dissolved oxygen (DO) levels in irrigation water. Elevated DO levels facilitate accelerated nutrient absorption by plant roots, potentially boosting plant growth rates by up to 30%. This study aims to explore the design considerations and experimental outcomes associated with the characteristics of VPPs in air vacuum and aeration processes. Optimal inlet flow velocities for the aeration process were determined to range between 1 and 4 m/s. A minimum inlet flow velocity of 0.80 m/s was identified as necessary to initiate the air vacuum process. The VPPs were designed with a throat-to-inlet diameter ratio of 0.5 and an air vent-to-throat diameter ratio of 0.3. Volumetric air flow rates were observed to decrease with increasing pipe length [3].
The amount of dissolved oxygen in water is a crucial parameter that determines water quality and is essential for the survival of aquatic organisms. Aeration is used to increase the decreasing oxygen levels in water. Aeration is defined as the process of re-injecting oxygen from the atmosphere into the water. Hydraulic structures are widely used in the aeration process. In a study conducted by Gökgöz et al. [4], the impact of hole location on the air intake performance of circular conduits was investigated. The results of this study indicated that the position of the hole does not have a significant effect on the air intake rate.
Venturi systems are widely employed in fluid mechanics due to their simplicity and accuracy in measuring flow rates. A significant application of these systems is in ejector devices, which are crucial for precise air-water mixing in waterworks engineering. This study delves into enhancing the accuracy of venturi system measurements by experimentally investigating the impact of various configuration parameters on aeration efficiency. Through a series of experiments, the study examines the influence of factors such as water flow rate, air inlet orifice diameters, inlet and outlet velocities, throat length, and inlet and outlet angles on aeration performance. The results highlight the critical role of the venturi air vent diameter and the throat-to-diameter ratio in determining aeration efficiency. Furthermore, the study develops empirical correlations linking venturi system configuration, Reynolds numbers, and aeration performance to facilitate accurate predictions of aeration efficiency [5].
In the study conducted by Kantarcı [6], it was determined that hydraulic structures enable rapid and effective oxygen transfer. This transfer, achieved through hydraulic structures, is much faster and more efficient than the natural process of air-to-water transfer in the environment. The research focused on the high performance of pressurized water jets in aerating water. Various water jet nozzle models were designed to investigate the optimal air intake efficiency. The goal was to enhance air transfer efficiency through the high aeration performance of pressurized water jets. The study's results indicated that increasing the jet impact distance led to a higher air intake rate. It was determined that the most effective air intake rate was achieved with a nozzle size four times the jet diameter and an optimal air hole diameter of 4mm.
Hydraulic structures that have brief contact with flowing water significantly influence dissolved oxygen levels. Cascades and Venturi systems play a crucial role in water aeration. In Venturi systems, as water passes through a constricted section, its velocity increases, creating a negative pressure in the throat region. This pressure differential draws air into the system. The Venturi inlet-throat area ratio determines the amount of air drawn into the system. In a study conducted by Turgut [7], circular Venturis with diameters of 36, 42, and 54 mm were used. The throat diameters were half or three-quarters of the Venturi diameters, and the throat lengths were equal to or twice the throat diameter. Three pairs of 6 mm diameter holes were drilled on the Venturis, starting from the midpoint of the throat region with a distance of 0.75 times the throat length between them. The Venturis were integrated into the system to investigate their effects on dissolved oxygen concentration in water. Experimental results were compared and analyzed using graphs. The results of this study revealed that the highest dissolved oxygen levels were observed in Venturis with diameters of 36, 42, and 54 mm, respectively.
Adequate dissolved oxygen (DO) is essential for maintaining healthy water quality and supporting aquatic life. Aeration, the process of introducing air into water, can enhance DO levels. While various methods exist, venturi systems, leveraging the simplicity of ejectors, offer a reliable and maintenance-free solution. This research investigates the impact of geometric parameters on the aeration efficiency of venturi systems. Experiments were conducted on a transparent polycarbonate venturi model, varying water flow rates, throat lengths, air inlet orifice diameters, and outlet angles. The results demonstrate that geometric characteristics significantly influence aeration efficiency. Empirical correlations were developed to predict air and water flow rates based on venturi dimensions, angles, and Reynolds numbers [8].
Baylar, Emiroğlu, and Öztürk [9] found that when water jets pass through air and then impinge on water in a pool, they entrain a significant amount of air, creating a gas-liquid two-phase region. This condition facilitates oxygen transfer between the air bubbles in the pool and the water. A review of existing studies reveals that circular orifices are commonly used. These studies have identified orifice diameter, jet velocity, length, and impingement angle as factors affecting air entrainment. However, it is inaccurate to state that these four factors alone influence air entrainment in a water jet. Orifice geometry is also a crucial factor. This study experimentally investigated the oxygen transfer efficiency of vertical water jets issuing from perforated and non-perforated Venturi and circular orifices. Observations revealed a negative pressure in the air holes of the orifices used. This negative pressure influenced the expansion, shape, and penetration depth of the air bubbles drawn into the orifice from the air holes, consequently affecting oxygen transfer efficiency. The perforated Venturi orifice exhibited higher oxygen transfer efficiency compared to the non-perforated Venturi and perforated/non-perforated circular orifices. Therefore, using a simple perforated Venturi orifice in water jet systems can significantly enhance oxygen transfer.
Venturi aeration is a cost-effective technique for increasing dissolved oxygen (DO) in aquatic environments. This study investigated the performance of a venturi aerator in a 200-liter water tank. The aerator was operated at six different discharge rates to evaluate its impact on standard oxygen transfer rate (SOTR) and standard aeration efficiency (SAE). The results indicate that moderate to high discharge rates yield optimal SOTR and SAE, while excessive discharge rates can lead to a decline in performance. A strong correlation between oxygen transfer rate and discharge rate was observed [10].
Dalmau et al. [11] optimized the air flow in a two-chamber submerged membrane bioreactor (MBR) system, one chamber equipped with a fine bubble diffuser system for biomass aeration (aerobic chamber) and the other with a coarse bubble diffuser system for membrane surface scouring (membrane chamber). They determined that the optimal dissolved oxygen concentration for the aerobic chamber was 0.5 mg/L, and the specific aeration demand (SADm) for the membrane chamber was 1 m/s. This optimization resulted in a 42% reduction in total aeration (and a 75% reduction in energy consumption) without compromising nutrient removal efficiency.
This paper reviews the aeration efficiency of various systems, including Venturi flumes, weirs, conduits, and stepped channels. Venturi aeration efficiency improves with more air holes, while triangular notch weirs excel in air entrainment. Circular high-head gated conduits outperform other conduit types. Stepped channel cascades offer 30-70% aeration efficiency. Artificial neural network (ANN) models were employed to predict aeration efficiency. Discharge (Q) is the primary influencing factor for Venturi and conduit aeration, while both Q and tailwater depth (Tw) impact weir aeration. Bubble size is crucial for bubble diffusers, and velocity is the most sensitive input for jet diffusers, which can achieve oxygen transfer efficiencies (OTE) of 1.91-21.53 kgO2/kW-hr [12].
Johir et al. [13] found that aeration intensity affects the membrane fouling rate but that this effect can be negligible at high aeration intensities for various fluxes (5-25 L/m2.s). They also observed a sudden increase in TMP when the aeration rate was reduced from 1.5 m3/m2/h to 1.0 m3/m2/h. Similarly, Orantes et al. (2006) achieved a significant reduction in membrane fouling by doubling the air flow on the membrane surface, extending the filtration time in their systems from 10 to 50 days to over 200 days. However, excessive aeration can lead to increased fouling. Increasing the aeration rate from 400 L/s to 800 L/s reduced cake layer accumulation on the membrane surface but also caused the disintegration of sludge flocs, dispersion of colloids and dissolved substances adsorbed on the floc surfaces, and thus the formation of a denser cake layer and higher cake resistance (Meng et al., 2008).
Han et al. [14] showed that sludge accumulation on the membrane surface decreased with increasing aeration rates (0-25 L/min) but that this effect did not increase linearly with the aeration rate and became negligible when a critical aeration rate was exceeded.
Aerated drip irrigation is a promising water-saving technique that alleviates rhizosphere hypoxia and enhances water and fertilizer utilization, leading to improved crop yield and quality. However, emitter clogging remains a significant issue. This study investigated the impact of air injection methods, micro/nano bubble generation (MAI) and Venturi injection (VAI), on emitter clogging and microbial community structure. The results showed that air injection can delay emitter clogging and improve the uniformity of blockage distribution. MAI significantly prolonged emitter lifespan compared to unaerated drip irrigation (UVI), while VAI had a less pronounced effect. Air injection altered the microbial community composition, inhibiting the growth of clogging-promoting bacteria like Nitrospirae and Proteobacteria, and favoring the growth of Firmicutes and Actinobacteria. Additionally, air injection reduced the accumulation of extracellular polymeric substances (EPS), further mitigating clogging. These findings contribute to a better understanding of emitter clogging mechanisms and offer insights into developing sustainable and anti-clogging aerated drip irrigation technologies [15].
Plunging water jets are effective for oxygenating water due to their simplicity and efficiency. While their performance in stagnant water is well-studied, their behavior in turbulent cross-flow has been less explored. This study investigates the oxygen transfer capacity of plunging jets in turbulent cross-flow, considering factors like jet-to-cross-flow velocity ratio, fall height, cross-flow depth, and impact angle. Two equations are proposed to estimate oxygen transfer rates. Additionally, flow visualization techniques were employed to analyze the dynamic behavior of the resulting two-phase air-water flow [16].
This study investigates gas-liquid two-phase flow in labyrinth channels, a key component of aerated drip irrigation systems. Using particle tracking velocimetry, the researchers analyzed the motion trajectories and velocities of microbubbles under varying inlet pressures and channel geometries. The results revealed that bubbly flow was the predominant flow pattern, with occasional slug flow. Bubble trajectories were influenced by the flow zone, with smooth trajectories in the mainstream and twisted trajectories in the vortex zone. Increasing inlet pressure led to more bubbles and longer trajectories in the vortex zone. The velocity of bubbles varied with position, with higher velocities in the mainstream and lower velocities in the vortex zone. Channel A exhibited the longest bubble path length and highest instantaneous velocity in the vortex zone at 0.04 MPa, suggesting its potential for superior anti-clogging performance. This research enhances our understanding of gas-liquid two-phase flow in labyrinth channels, aiding in the optimization of aerated drip irrigation systems [17].
The experimental study analyzed the modifications in discharge flow rates and patterns at the outlets of a horizontally oriented pipe system for both single-phase water and two-phase air-water flows. The influence of different air flow rates, induced by two distinct venturi devices, on discharge flow rates and jet lengths was assessed. Additionally, the study investigated the variations in system performance and water jet characteristics due to the implementation of these venturi devices. Mathematical models derived from experimental data can be utilized to predict outcomes for untested scenarios [18].
2. Materials and Methods
The experimental setup for this study was constructed and tested in the Hydraulics and Environmental Laboratory of the Department of Civil Engineering, Dicle University. Figure 2 presents a photograph of the entire experimental setup, highlighting key components such as the pump, piping system, measurement instruments, and test section.
Schematic diagrams of the experimental setup, including the water tank, pump, valves, water flowmeter, Venturi meter, air flowmeter, manifold, and ports, are presented in Figure 3.
Experimental studies were conducted to investigate the air entrainment performance of two different Venturi devices integrated into a horizontally oriented manifold pipe system at varying flow rates. In four different experimental setups, water was circulated at different flow rates from a 300-liter water tank into a 250 cm long manifold pipe system with an internal diameter of 12.7 mm.
A water pump (0.75 kW, Pedrollo Model, Pedrollo S.p.A., Verona, Italy) was used to circulate water in the experimental setup, and a water flowmeter (0–6 m3/h, 10.1325 Pa) was employed to measure the flow rate. The temperature of the water in the tank was measured using a thermometer (WTW Tetra Con 325 Model, WTW, Troistedt, Germany). An air flowmeter (0.3–3.0 L/min, LZT 6-M, Changzhou City, JIangsu Prov., China) was used to measure the amount of air passing through the two different Venturi devices integrated into the system. The system was leveled horizontally and vertically using a water level. Two different Venturi devices were used in this study (Figure 4). The technical specifications of these Venturi types are given in Table 1 and Table 2. The dimensions of the Venturi devices used in this study comply with ASME standards [19]. Different water flow rates, air vacuum rates, and transfer efficiencies were experimentally investigated.
The experimental setups were equipped with Venturi devices whose specifications are detailed in Table 1 and Table 2. Laboratory experiments were carried out at flow rates of 0.60, 0.75, 0.85, and 1.0 m³/h to investigate the performance of these devices.
2.1. Measurement of Air Entrainment Rate
Experimental studies were conducted using Venturi Type 1 and Venturi Type 2, whose characteristics are specified in Table 1 and Table 2. A fluid flow, connected to a circulation pump and a water tank, was applied to different experimental setups. The flow rate was controlled by a flow control valve, and the flow rate in the main pipe was measured using a water flowmeter. To measure the amount of air entrained as the fluid passed through the Venturi device, an air flowmeter was placed at the air hole in the throat section. The fluid flow, circulated from the water tank, mixed with the air entrained in the throat sections of the Venturi device, forming a two-phase flow. The system was operated at various flow rates and with experimental setups having different port outlet openings on the manifold, and the amount of entrained air was measured (Figure 5).
2.2. Variation of Reynolds Number
The Reynolds number is a dimensionless parameter obtained from the dimensional analysis of the Navier-Stokes equations. It provides information about whether a fluid flow is laminar or turbulent [20]. The Reynolds number is calculated using the following equation:
where Re is the Reynolds number, V is the manifold flow velocity (m/s), D is the manifold main pipe diameter (m), and ν is the kinematic viscosity of water (m²/s). The variation of the Reynolds number for the experimental system is summarized in Table 3.
Re=VD/ν

Table 3.
Change of Reynolds number.
| Manifold Flow Velocity, m/s | Reynolds Number (Re) |
|---|---|
| V1=1.34 | 16,850 |
| V2=1.64 | 20,620 |
| V3=1.86 | 23,388 |
| V4=2.20 | 27,663 |
| D=1.27x10⁻² m, =1.01x10⁻⁶ m2/s (For water temperature of 20°C) | |
2.3. Dimensional Analysis
A theoretical investigation was undertaken to explore the functional relationships between the air injection flow rate (Qair) and various geometric and fluid dynamic parameters. Dimensional analysis was utilized to identify these relationships. Qair was treated as the dependent variable, while the following parameters were considered as independent variables:
where:
Qw: Water flow rate through the venturi
: Fluid density
μ: Dynamic viscosity
v: Velocity
ds: Hole diameter
dt: Throat diameter
Using Buckingham’s π-Theorem, nine variables and three repeated changes were obtained. These changes can be easily coordinated in the following non -dimensional π-terms.
In accordance with Buckingham Pi theorem, the general functional relationship between these variables can be represented as:
Considering the properties of the π-terms, the following equation was derived:
where, Re is Reynold’s number.
Figure 6.
Definition sketch of all parameters.
2.4. Experimental Investigation of the Correlation Between Air Suction Flow Rate and Main Pipe Flowrate in Four Different Venturi Configurations
The experiment utilizing Manifold 1 involved measuring the air volume evacuated by Venturi types 1 and 2 at varying flow rates using an air flow meter; the results are depicted in Figure 7. The data revealed a linear correlation between the evacuated air volume and the flow rate within the main manifold pipe. This trend was consistent for both Venturi types. Nevertheless, while both Venturi types exhibited comparable vacuuming performance at the onset of the experiment, Venturi type 2 demonstrated superior vacuuming capabilities compared to Venturi type 1 as the flow rate increased.
The experiment utilizing Manifold 2 involved measuring the air volume evacuated by Venturi types 1 and 2 at varying flow rates using an air flow meter; the results are depicted in Figure 8. The data revealed a linear correlation between the evacuated air volume and the flow rate within the main manifold pipe. This trend was consistent for both Venturi types. Nevertheless, at the outset of the experiment, Venturi type 1 demonstrated a superior vacuuming capacity compared to Venturi type 2. As the flow rate increased, the vacuuming performances of both Venturi types followed a similar trajectory for a period, but at higher flow rates, Venturi type 2 outperformed Venturi type 1, achieving higher vacuuming values.
An experiment was conducted using Manifold 3 to quantify the air volume evacuated by Venturi types 1 and 2 at different flow rates, as measured by an air flow meter. The results, illustrated in Figure 9, indicate a direct linear relationship between the evacuated air volume and the flow rate in the main manifold. This trend was observed for both Venturi types. However, although the initial vacuuming performance of Venturi type 1 was superior to that of Venturi type 2, at elevated flow rates, Venturi type 2 exhibited a higher vacuuming capacity.
An experiment was conducted using Manifold 4 to quantify the air volume evacuated by Venturi types 1 and 2 at different flow rates, as measured by an air flow meter. The results, illustrated in Figure 10, indicate a direct linear relationship between the evacuated air volume and the flow rate in the main manifold. This trend was observed for both Venturi types. However, Venturi type 1 consistently exhibited a higher vacuuming capacity throughout the experiment.
2.5. Experimental Investigation of the Correlation Between Air Suction Flow Rate and Main Pipe Flowrate in Four Different Venturi Configurations
The correlation between jet length and the ratio of air suction flow rate to main flow rate (Qa/Qw) is graphically represented in Figure 11. The analysis indicates a direct proportionality between jet length and the Qa/Qw ratio. Nevertheless, a notable inflection point in the jet length curve is observed at a main pipe velocity of 1.64 m/s. Post this inflection point, jet lengths exhibit a linear increase with increasing flow rate. These findings suggest that jet length is a complex function of both the Qa/Qw ratio and the main pipe velocity. The inflection point at the critical velocity signifies a substantial alteration in the fluid flow characteristics.
The correlation between jet length and the ratio of air suction flow rate to main flow rate (Qa/Qw) is graphically represented in Figure 12. The analysis indicates a direct proportionality between jet length and the Qa/Qw ratio. Nevertheless, a notable inflection point in the jet length curve is observed at a main pipe velocity of 1.64 m/s. Post this inflection point, jet lengths exhibit a linear increase with increasing flow rate. These findings suggest that jet length is a complex function of both the Qa/Qw ratio and the main pipe velocity. The inflection point at the critical velocity signifies a substantial alteration in the fluid flow characteristics.
The correlation between jet length and the ratio of air suction flow rate to main flow rate (Qa/Qw) is graphically represented in Figure 13. The analysis indicates a direct proportionality between jet length and the Qa/Qw ratio. Nevertheless, notable inflection points in the jet length curve are observed at main pipe velocities of 1.64 m/s and 1.86 m/s. Post these inflection points, jet lengths exhibit linear increases with increasing flow rate. These findings suggest that jet length is a complex function of both the Qa/Qw ratio and the main pipe velocity. The inflection points at critical velocity values signify substantial alterations in the fluid flow characteristics.
In the fourth experimental setup, when examining the graph (Figure 14) that shows the relationship between the air suction flow rate to main flow rate ratio and the jet lengths, it is observed that the jet lengths increase as the Qa/Qw ratio increases. At the point where the velocity in the main flow pipe is V2 = 1.64 m/s, the initial slope and the jet length (Ljet) exhibit a break, transitioning to a second slope. Later, at the point where the velocity in the main flow pipe is V3 = 1.86 m/s, another break occurs, leading to a third slope. These breaks indicate a transition to a linear increase trend as the flow rate develops with increasing velocity values in the main manifold pipe.
2.6. The Relationship Between Air Suction Flow Rate to Main Flow Rate Ratio and Jet Exit Lengths in a System with Venturi Type 2
In the first experimental setup, when examining the graph (Figure 15) that shows the relationship between the air suction flow rate to main flow rate ratio and the jet lengths, it is observed that the jet lengths increase as the Qa/Qw ratio increases. At the point where the velocity in the main flow pipe is V3 = 1.86 m/s, the initial slope and the jet length (Ljet) exhibit a break, transitioning to a second slope. This break indicates a shift into a linear increase trend as the flow rate develops with increasing velocity values in the main manifold pipe.
In the second experimental setup, when examining the graph (Figure 16) that shows the relationship between the air suction flow rate to main flow rate ratio and the jet lengths, it is observed that the jet lengths increase as the Qa/Qw ratio increases. At the point where the velocity in the main flow pipe is V2 = 1.64 m/s, the initial slope and the jet length (Ljet) exhibit a break, transitioning to a second slope. Later, at the point where the velocity in the main flow pipe is V3 = 1.86 m/s, another break occurs, leading to a third slope. These breaks indicate a transition to a linear increase trend as the flow rate develops with increasing velocity values in the main manifold pipe.
In the third experimental setup, when examining the graph (Figure 17) that shows the relationship between the air suction flow rate to main flow rate ratio and the jet lengths, it is observed that the jet lengths increase as the Qa/Qw ratio increases. At the point where the velocity in the main flow pipe is V2 = 1.64 m/s, the initial slope and the jet length (Ljet) exhibit a break, transitioning to a second slope. This break indicates a shift into a linear increase trend as the flow rate develops with increasing velocity values in the main manifold pipe.
In the forth experimental setup, when examining the graph (Figure 18) that shows the relationship between the air suction flow rate to main flow rate ratio and the jet lengths, it is observed that the jet lengths increase as the Qa/Qw ratio increases. At the point where the velocity in the main flow pipe is V2 = 1.64 m/s, the initial slope and the jet length (Ljet) exhibit a break, transitioning to a second slope. Subsequently, at a main flow velocity of V3=1.86 m/s, another inflection point is observed, indicating a transition to a third slope. These inflections suggest that as the flow rate increases in the main manifold, there is a linear increase trend.
3. Results and Discussion
Experimental measurements were conducted on the experimental setups, whose systematic flow diagram is given in Figure 3. The experimental measurements primarily consisted of determining the entrained and sucked air quantities and the water flow rate. The results obtained based on these measurements are expressed graphically.
The amount of air vacuumed as a function of the flow rate varies depending on the flow velocity in the main manifold pipe, and as the flow velocity increases, the amount of air vacuumed shows a parallel increase in both types of Venturi devices.
It is observed that the flow velocity of around 1-2 m/s, which is considered ideal for hydraulically low heights and local head losses, is also evident here.
When the obtained graphs are examined, it is seen that the jet lengths increase as the ratio of the main flow pipe flow rate to the air suction flow rate (Qa/Qw) increases.
It is thought that the breaks observed in the Qa/Qw and Ljet length graphs are related to the developing flow, especially at the transition to different port exit diameters.
This paper investigates the air vacuum phenomenon occurring within a Venturi device and its correlation with the Reynolds number. Experimental studies were con-ducted to examine the impact of varying water flow rates on volumetric air flow rates. An empirical correlation was developed to predict the volumetric air flowrate (Qa) as a function of water flowrate (Qw), diameter of throat (d2), diameter of air vent or suction port (dh) and Reynolds number (Re)The findings highlight the critical role of Reynolds number in ensuring air entrainment within both the transitional flow region at the Venturi inlet and the turbulent flow region at the throat.
4. Conclusions
The dual-phase system (system equipped with a Venturi device) was initially operated at different d/D ratios, which were recorded as d/D < 0.4. The first critical value of this ratio was determined to be d/D = 0.433. At the critical value of d/D = 0.433, water flow was observed in the system. The manifold demonstrated better air suction performance with an increasing flow rate when the main flow velocity V was between 1.5-2 m/s. Additionally, it provided suitable operating conditions for d/D = 0.433. The system did not meet dual-phase flow conditions for ratios below this critical value [21].
In this study, Reynolds numbers corresponding to the manifold main flow velocities of V1 = 1.34 m/s, V2 = 1.64 m/s, V3 = 1.86 m/s, and V4 = 2.20 m/s were obtained as 16,850, 20,620, 23388, and 27,663, respectively.
Empirical equations were gotten for venturi tubes linking the ratio of (Qair/Qwater) to throat lengths and diameters, air inlets orifices diameters and Reynolds numbers.
It was found that the ratio of (Qair/Qwater) increased with an increasing ratio of (ds/ dt).
During the experimental studies, when examining the graphs that show the relationship between the air suction flow rate and the main flow rate ratio (Qa/Qw) and the jet lengths (Ljet), R² values were measured as follows: R² = 0.9584 for Venturi type 1, manifold type 1; R² = 0.9965 for Venturi type 1, manifold type 2; R² = 0.9941 for Venturi type 1, manifold type 3; and R² = 0.8711 for Venturi type 1, manifold type 4. Additionally, R² values were measured as R² = 0.9933 for Venturi type 2, manifold type 1; R² = 0.9809 for Venturi type 2, manifold type 2; R² = 0.9992 for Venturi type 2, manifold type 3; and R² = 0.9603 for Venturi type 2, manifold type 4.
This paper investigates the air vacuum phenomenon occurring within a Venturi device and its correlation with the Reynolds number. Experimental studies were con-ducted to examine the impact of varying water flow rates on volumetric air flow rates. An empirical correlation was developed to predict the volumetric air flowrate (Qa) as a function of water flowrate (Qw), diameter of throat (d2), diameter of air vent or suction port (dh) and Reynolds number (Re)The findings highlight the critical role of Reynolds number in ensuring air entrainment within both the transitional flow region at the Venturi inlet and the turbulent flow region at the throat.
The experimental studies indicated that Venturi type 2 demonstrated a higher air suction performance compared to Venturi type 1. These results were found to be related to the geometric structure of the Venturi device and the air suction inlet.
In the experimental setup, discharge values corresponding to four inlet velocities were selected as Q1 = 17 × 10⁻⁵ m³/s, Q2 = 20.8 × 10⁻⁵ m³/s, Q3 = 23.6 × 10⁻⁵ m³/s, and Q4 = 27.8 × 10⁻⁵ m³/s. Additionally, two Venturi devices with different throat diameters were used in the experimental study.
The results of the experimental study indicated that the throat diameter of the Venturi device affects the ventilation efficiency.
The best results were obtained for the relationship with V = 1.5-2 m/s.
In these experimental studies, empirical equations were obtained between the air suction flow rate, the main flow pipe flow rate, and the water jet lengths across ports with different diameters on the main manifold.
For the experimental setups using Venturi Type 1, the following empirical equations for manifold types 1, 2, 3, and 4 were obtained: Ljet = 17.6(Qw/Qa) + 18, Ljet = 19.1(Qw/Qa) + 6.75, Ljet = 17.9(Qw/Qa) − 1.25, and Ljet = 8.4(Qw/Qa) + 16.5, respectively.
For the experimental setups using Venturi Type 2, the following empirical equations for manifold types 1, 2, 3, and 4 were obtained: Ljet = 16.1(Qw/Qa) + 19, Ljet = 19.1(Qw/Qa) + 6.75, Ljet = 13.8(Qw/Qa) − 2, and Ljet = 11(Qw/Qa) + 14.5, respectively.
Acknowledgments
The authors are thankful to Dicle University.
Author Contributions
Methodology: S.T. and T.B. Validation: T.B. and S.T., Formal Analysis: S.T., A.A., and T.B. Investigation: S.T. Data curation: S.T. and A.A. Writing— Original Draft Preparation: S.T. and A.A. Writing review and editing: S.T., A.A., and T.B. Visualization: S.T. and A.A., Supervision: T.B. and S.T. Project Administration: T.B. and S.T., Funding Acquisition: S.T. All authors have read and agreed to the published version of the manuscript.
Funding
No funding was received to assist with the preparation of this manuscript.
Data Availability Statement
There are no data to report other than that presented in this study.
Acknowledgments
The authors are thankful to Dicle University Faculty of Engineering Civil Engineering PhD student Mr. Arjin Ata and Dicle University.
Conflicts of Interest
The authors have no relevant financial or non-financial interests to disclose. The authors declare no conflict of interest. Ethics and consent to participate; ethical rules were followed in the experimental data in this study. The materials used are mainly water and air absorbed from the atmosphere. No permit or license was required as unused parts were used for this purpose.
References
- A. Baylar and F. Ozkan , "Applications of Venturi Principle to Water Aeration Systems," Environmental Fluid Mechanics, vol. 6, p. 341–357, August 2006.
- A. Baylar and M. E. Emiroğlu, "Air Entrainment and Oxygen Transfer in a Venturi," Proceedings of the Institution of Civil Engineers - Water and Maritime Engineering, vol. 156, no. 3, pp. 249-255, Eylül 2003. [CrossRef]
- T. Bagatur, "Evaluation of Plant Growth with Aerated Irrigation Water Using Venturi Pipe Part," Arabian Journal for Science and Engineering, vol. 39, p. 2525–2533, 2014. [CrossRef]
- A. Gökgöz, M. Güneş, Y. Akkoyunlu, Ö. Ergün and M. Ünsal, "Dairesel Konduitlerde Delik Yerinin Hava Giriş Performansına Etkisi," Kahramanmaraş Sütçü İmam Üniversitesi Mühendislik Bilimleri Dergisi, vol. 17, no. 1, pp. 22 - 30, 25 10 2014.
- M. A. R. Hamed, "Configuration influence in relation to fluid flow of venturi system," Environmental Quality Management, vol. 32, no. 3, pp. 203-208, 24 June 2022. [CrossRef]
- B. Kantarcı, Development of nozzles possessed high aeration efficiency, Elazığ: Firat University Institute of Science, 2017.
- S. Turgut, "Boğaz bölgesinde farklı delik sayılarına sahip venturi aygıtının havalandırma performansının incelenmesi," İnönü Üniversitesi, Ekim 2019.
- A. M. Mobasher and A. H. Mahmoud, "Effect Of Geometrıc Charachtarıstıcs On The Aerıatıon Efffıcıncy In The Venturı System," Journal of Al-Azhar University Engineering Sector, vol. 16, no. 60, pp. 650-665, July 2021.
- A. Baylar , M. E. Emiroğlu and M. Öztürk, "The development of aeration performance with different typed nozzles in a vertical plunging water jet system," International Journal of Science & Technology, vol. 1, no. 1, pp. 51-63, 2006.
- A. Yadav, A. Kumar and S. Sarkar, "Effect of Varying Discharge Rate on the Performance of Venturi Aeration System," Aquaculture Studies, vol. 22, no. 4, p. AQUAST824, 2022. [CrossRef]
- M. Dalmau, H. Monclús, S. Gabarrón, I. Rodriguez-Roda and J. Comas, "Towards integrated operation of membrane bioreactors: Effects of aeration on biological and filtration performance," Bioresource Technology, pp. 103-112, 13 Ağustos 2014. [CrossRef]
- D. Puri, P. Sihag and M. S. Thakur, "A review: Aeration efficiency of hydraulic structures in diffusing DO in water," MethodsX, 2023.
- M. A. Johir, R. Aryal, S. Vigneswaran, J. Kandasamy and A. Grasmick, "Influence of supporting media in suspension on membrane fouling reduction in submerged membrane bioreactor (SMBR)," Journal of Membrane Science, pp. 121-128, 15 May 2011. [CrossRef]
- S.-S. Han, T.-H. Bae, G.-G. Jang and T.-M. Tak, "Influence of sludge retention time on membrane fouling and bioactivities in membrane bioreactor system," Process Biochemistry, vol. 40, no. 7, pp. 2393-2400, June 2005. [CrossRef]
- P. Li, H. Li, J. Li, X. Huang , Y. Liu and Y. Jiang, "Effect of Aeration on Blockage Regularity and Microbial Diversity of Blockage Substance in Drip Irrigation Emitter," Agriculture, vol. 12, no. 11, pp. 19-41, 2022. [CrossRef]
- M. E. Jahromi and M. Khiadani, "Experimental Study on Oxygen Transfer Capacity of Water Jets Discharging into Turbulent Cross-Flow," Journal of Environmental Engineering, vol. 143, no. 6, June 2017. [CrossRef]
- Y. Liu, G. Wang, X. Zhang , H. Li, B. Si, W. Liu and Z. Zhang, "Motion Characteristics of Gas–Liquid Two-Phase Flow of Microbubbles in a Labyrinth Channel Used for Aerated Drip Irrigation," Water, vol. 15, no. 7, 2023. [CrossRef]
- S. Tumur, A. Ata and T. Bagatur, "Bir borudan çıkan çift fazlı jetin deneysel incelenmesi," Dicle Üniversitesi Mühendislik Fakültesi Mühendislik Dergisi, vol. 15, no. 3, pp. 713-718, 2024.
- A. S. MFC-3M-1989, Measurement of fluid flow in pipes using orifice, nozzle and venturi, 2021.
- M. S. Kirkgoz, Akışkanlar Mekaniği, İstanbul: Birsen Yayınevi, 2013.
- S. Tumur, A. Ata and T. Bagatur, "An Experimental Investigation of the Effect of Two-Phase Flow in a Manifold on Water Jet Lengths," Water , vol. 16, no. 22, 2024. [CrossRef]
Figure 1.
Schematic design of Venturi device.
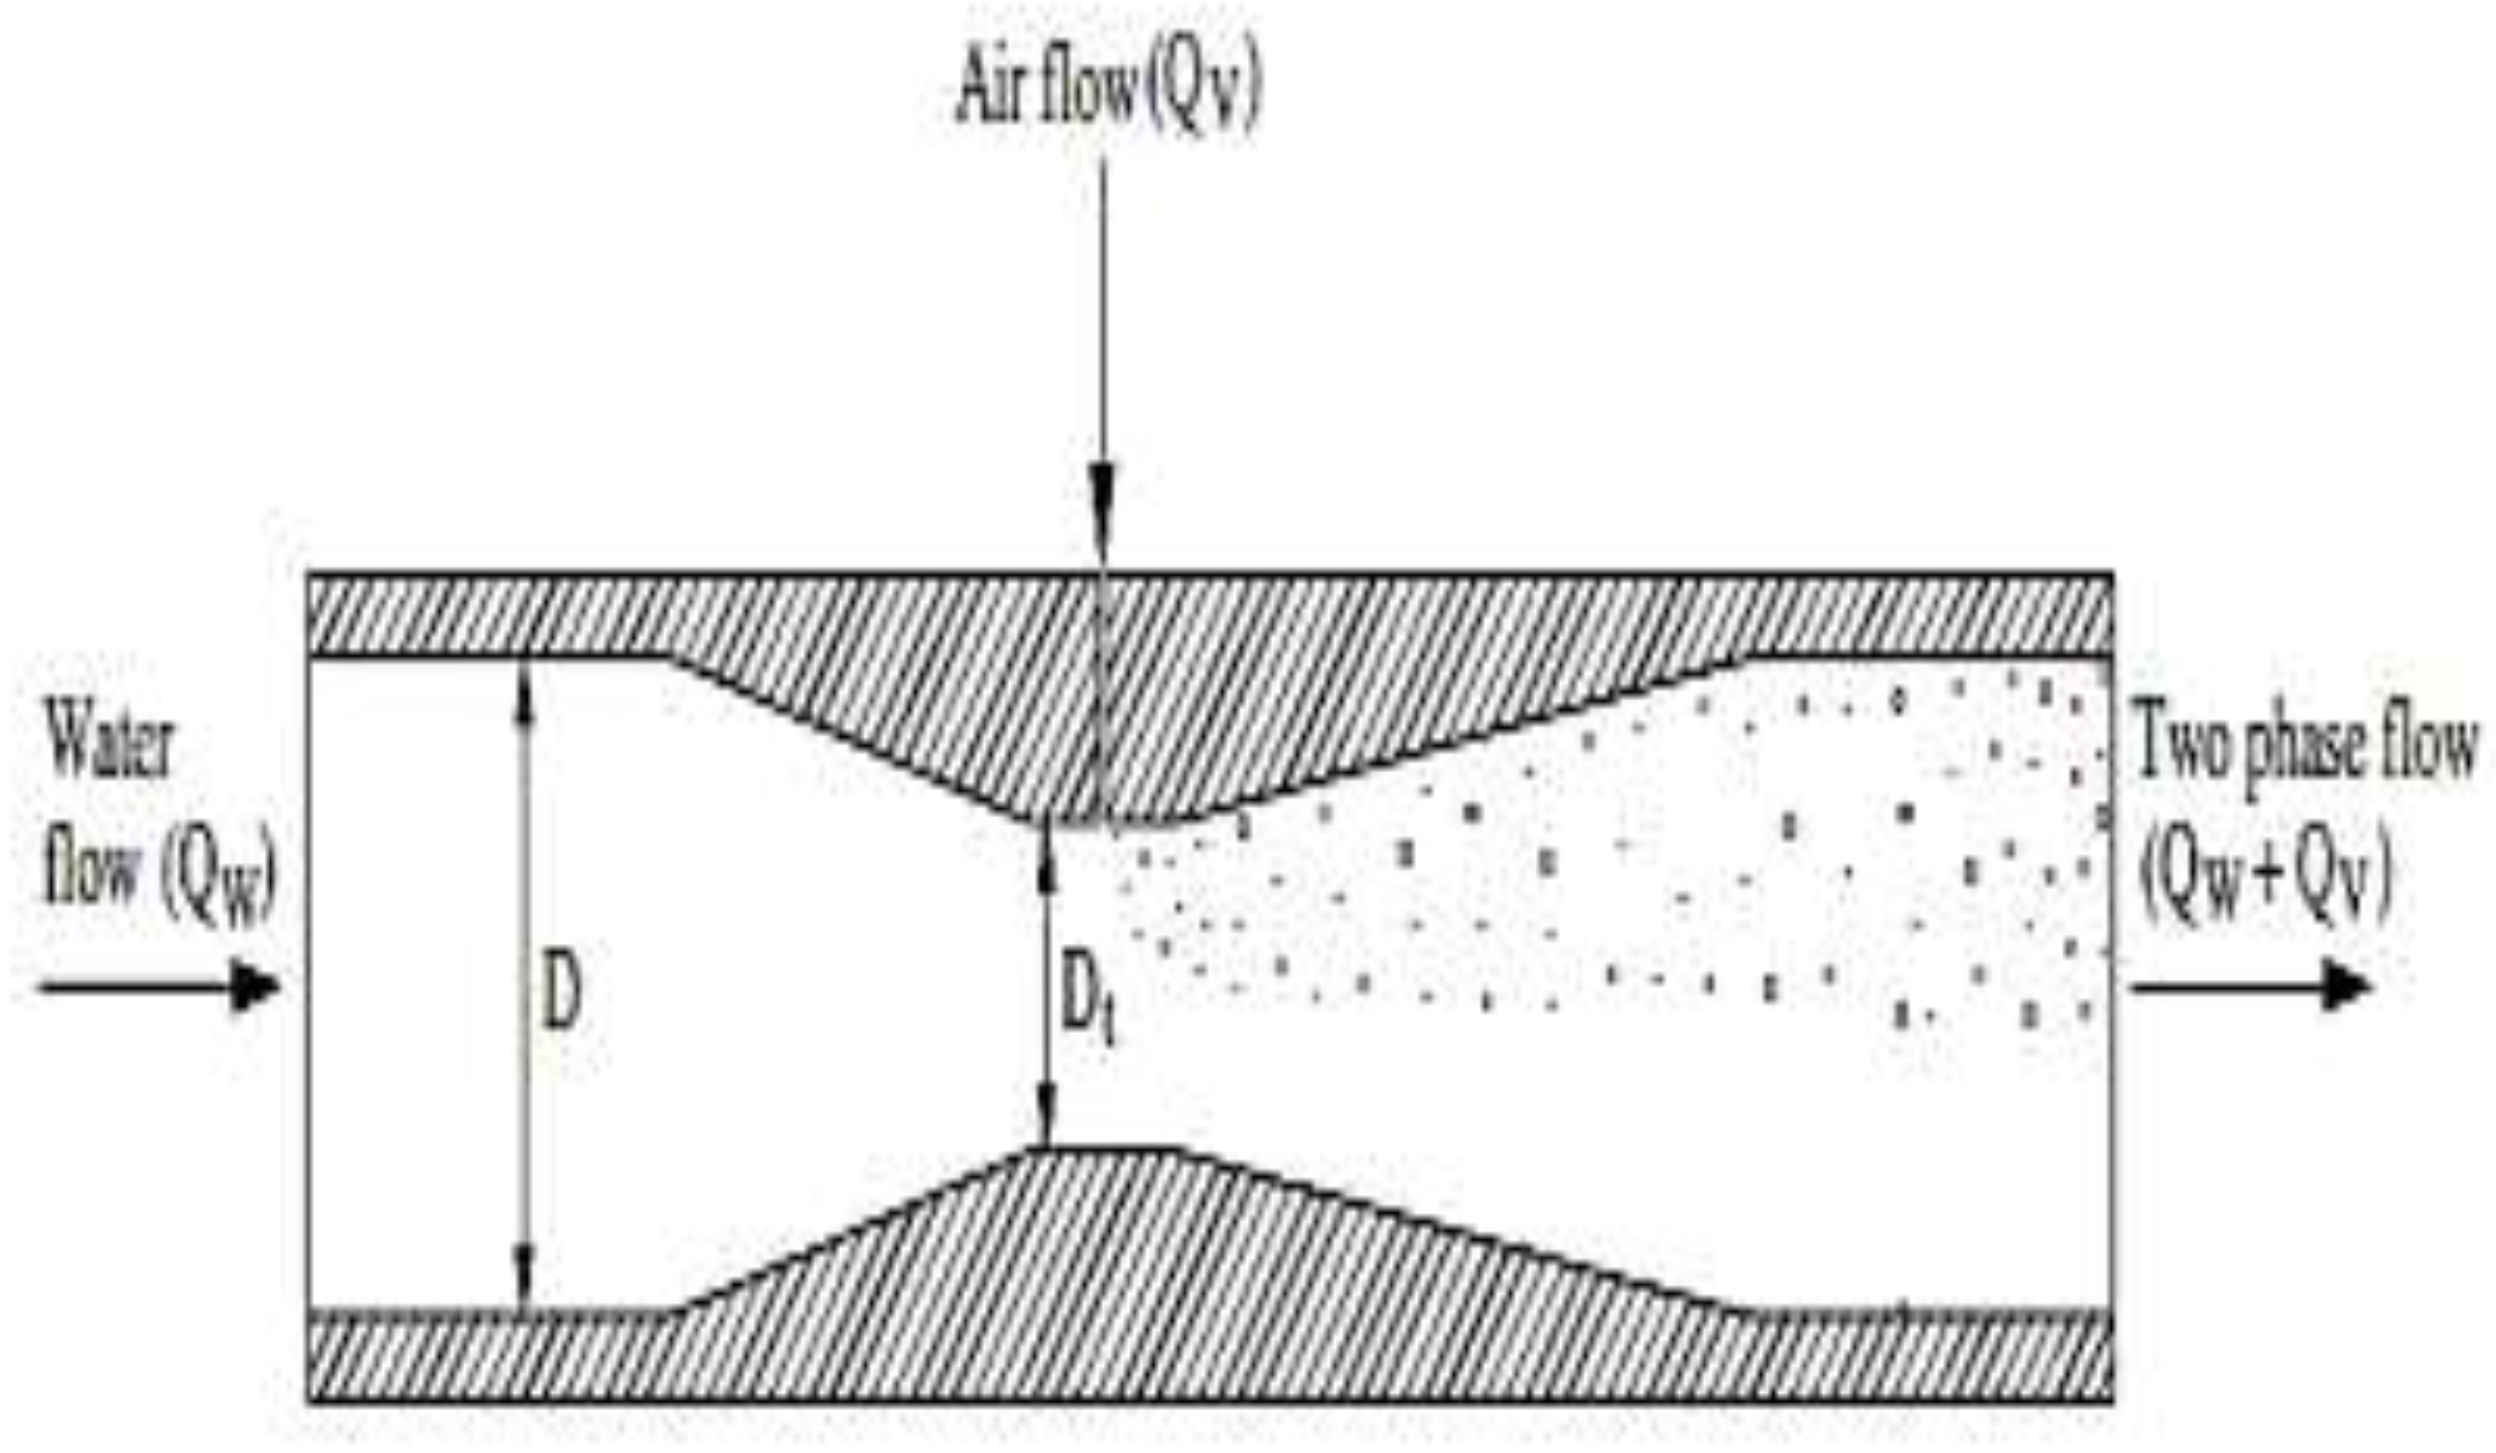
Figure 2.
Test setup (Pump, water flow meter, air flow meter, Venturi device and manifold).
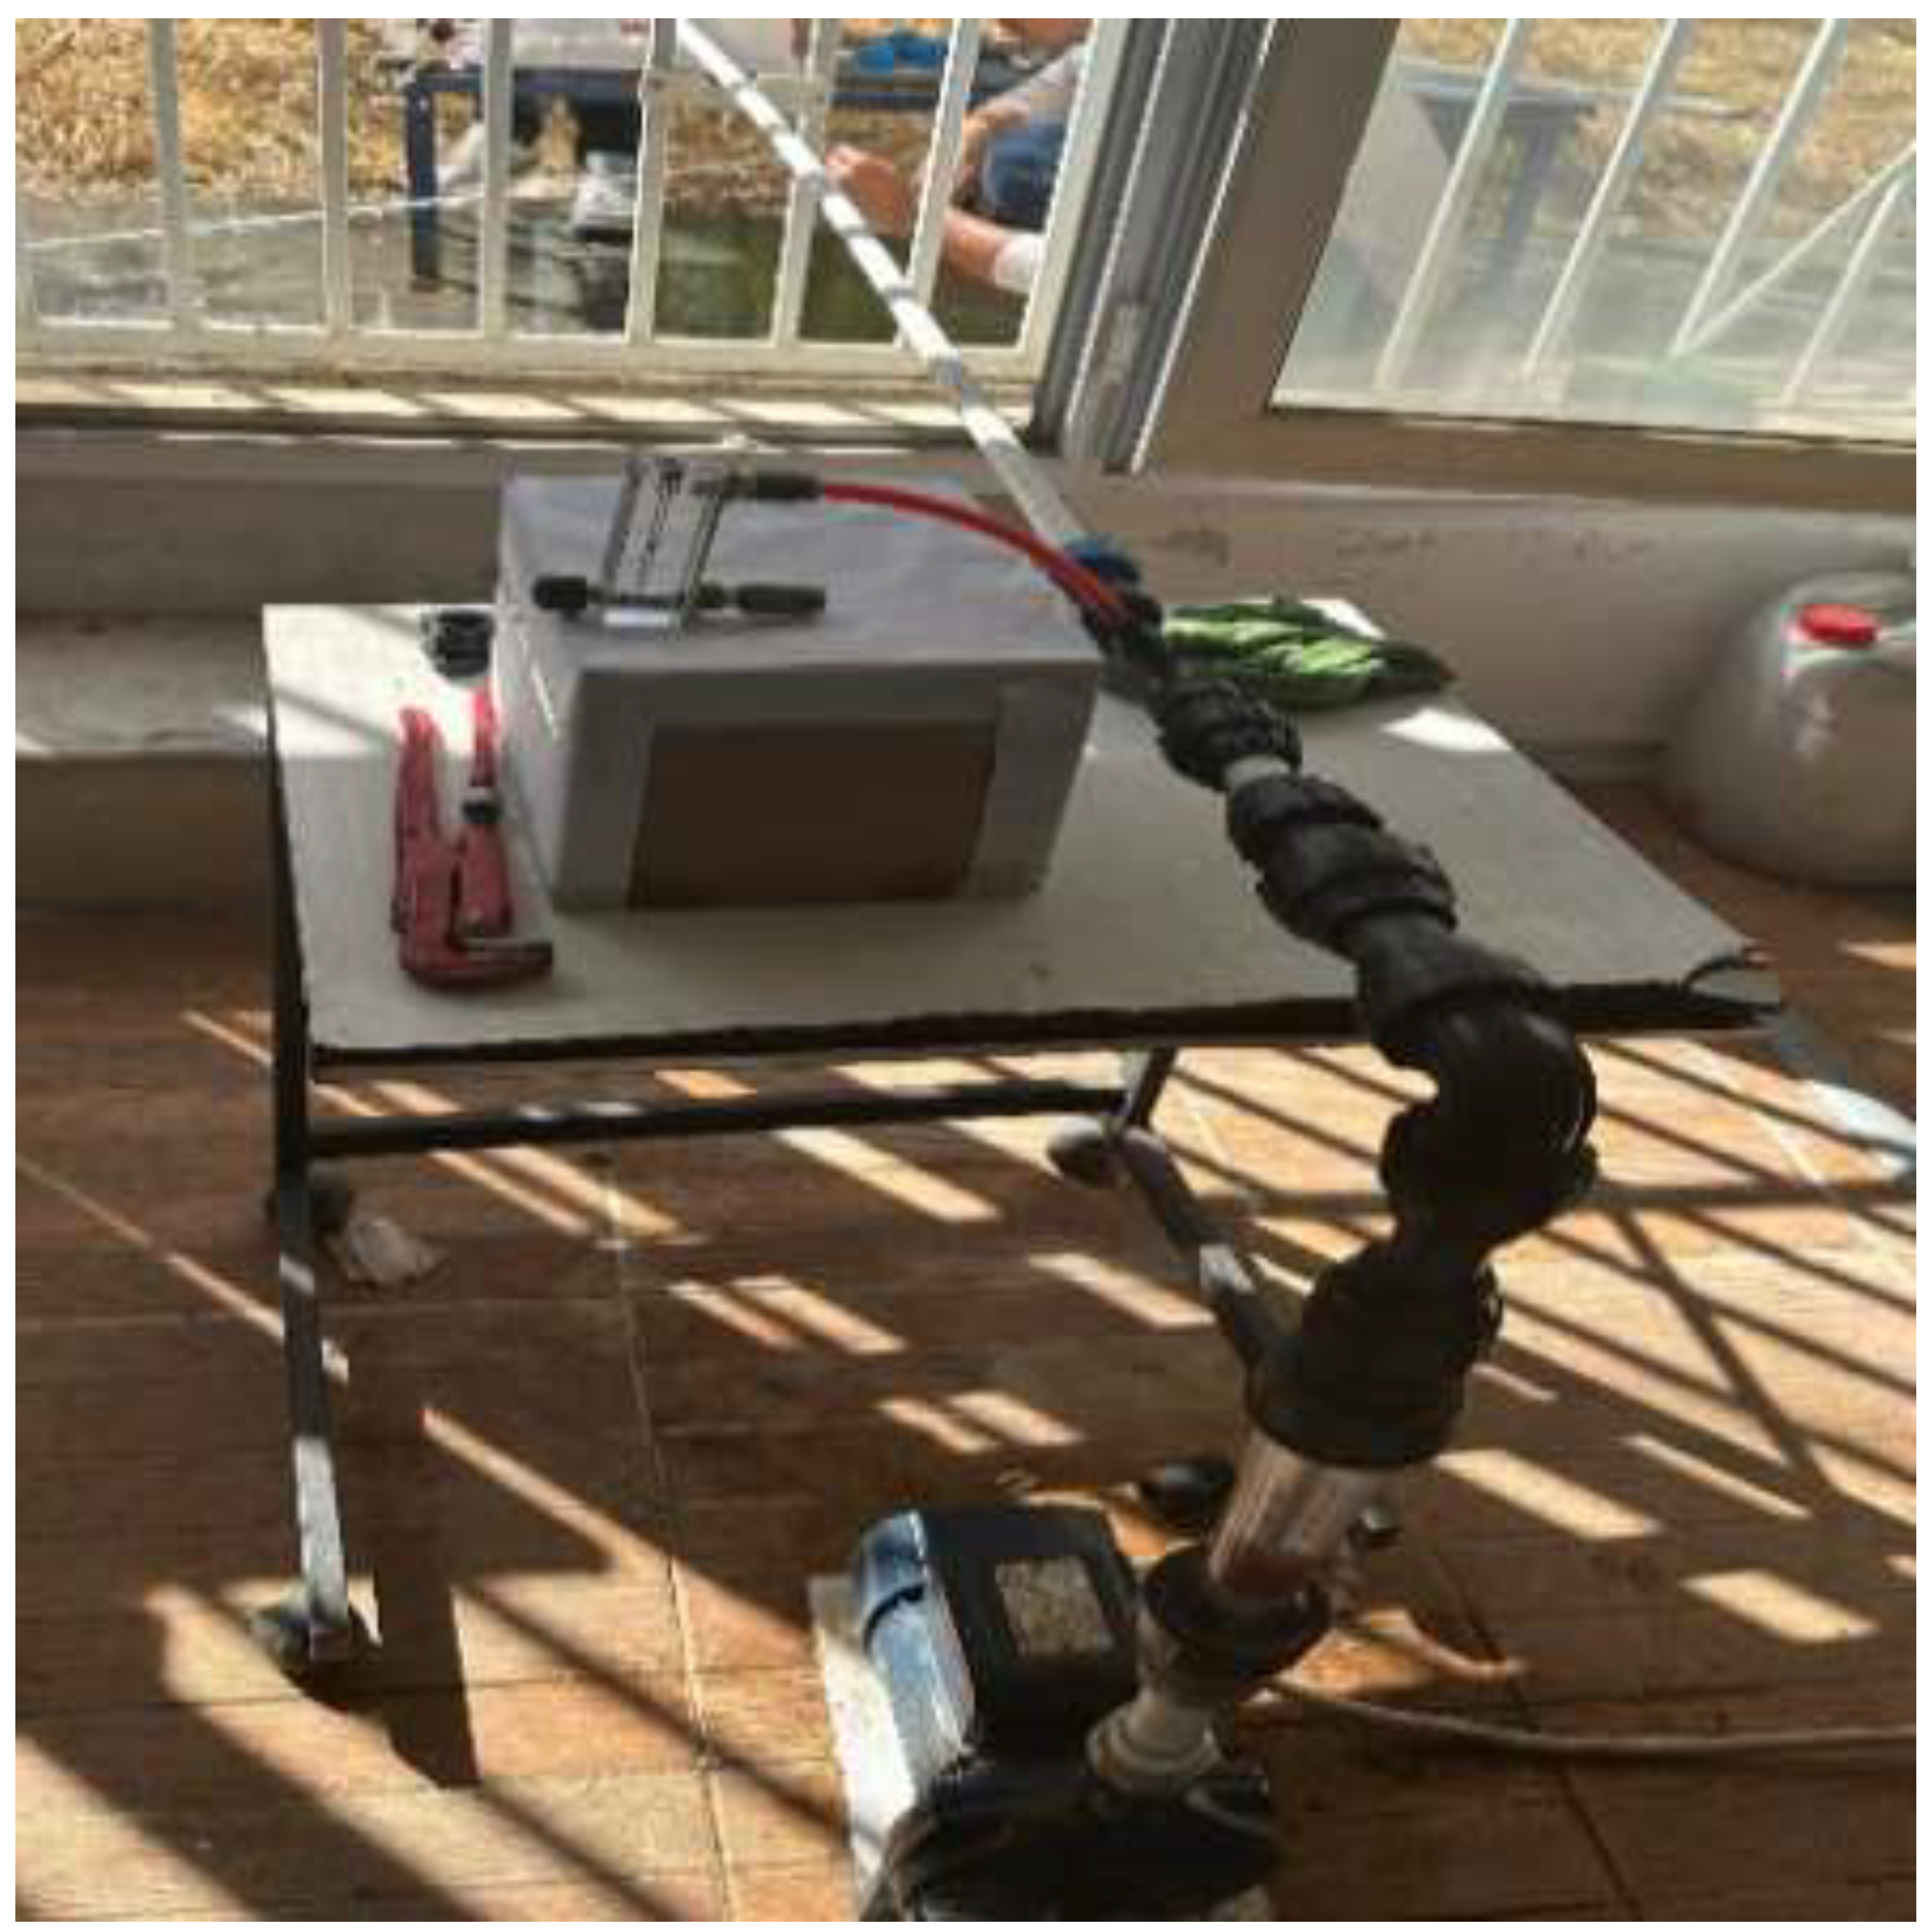
Figure 3.
Experimental setup with Venturi device.
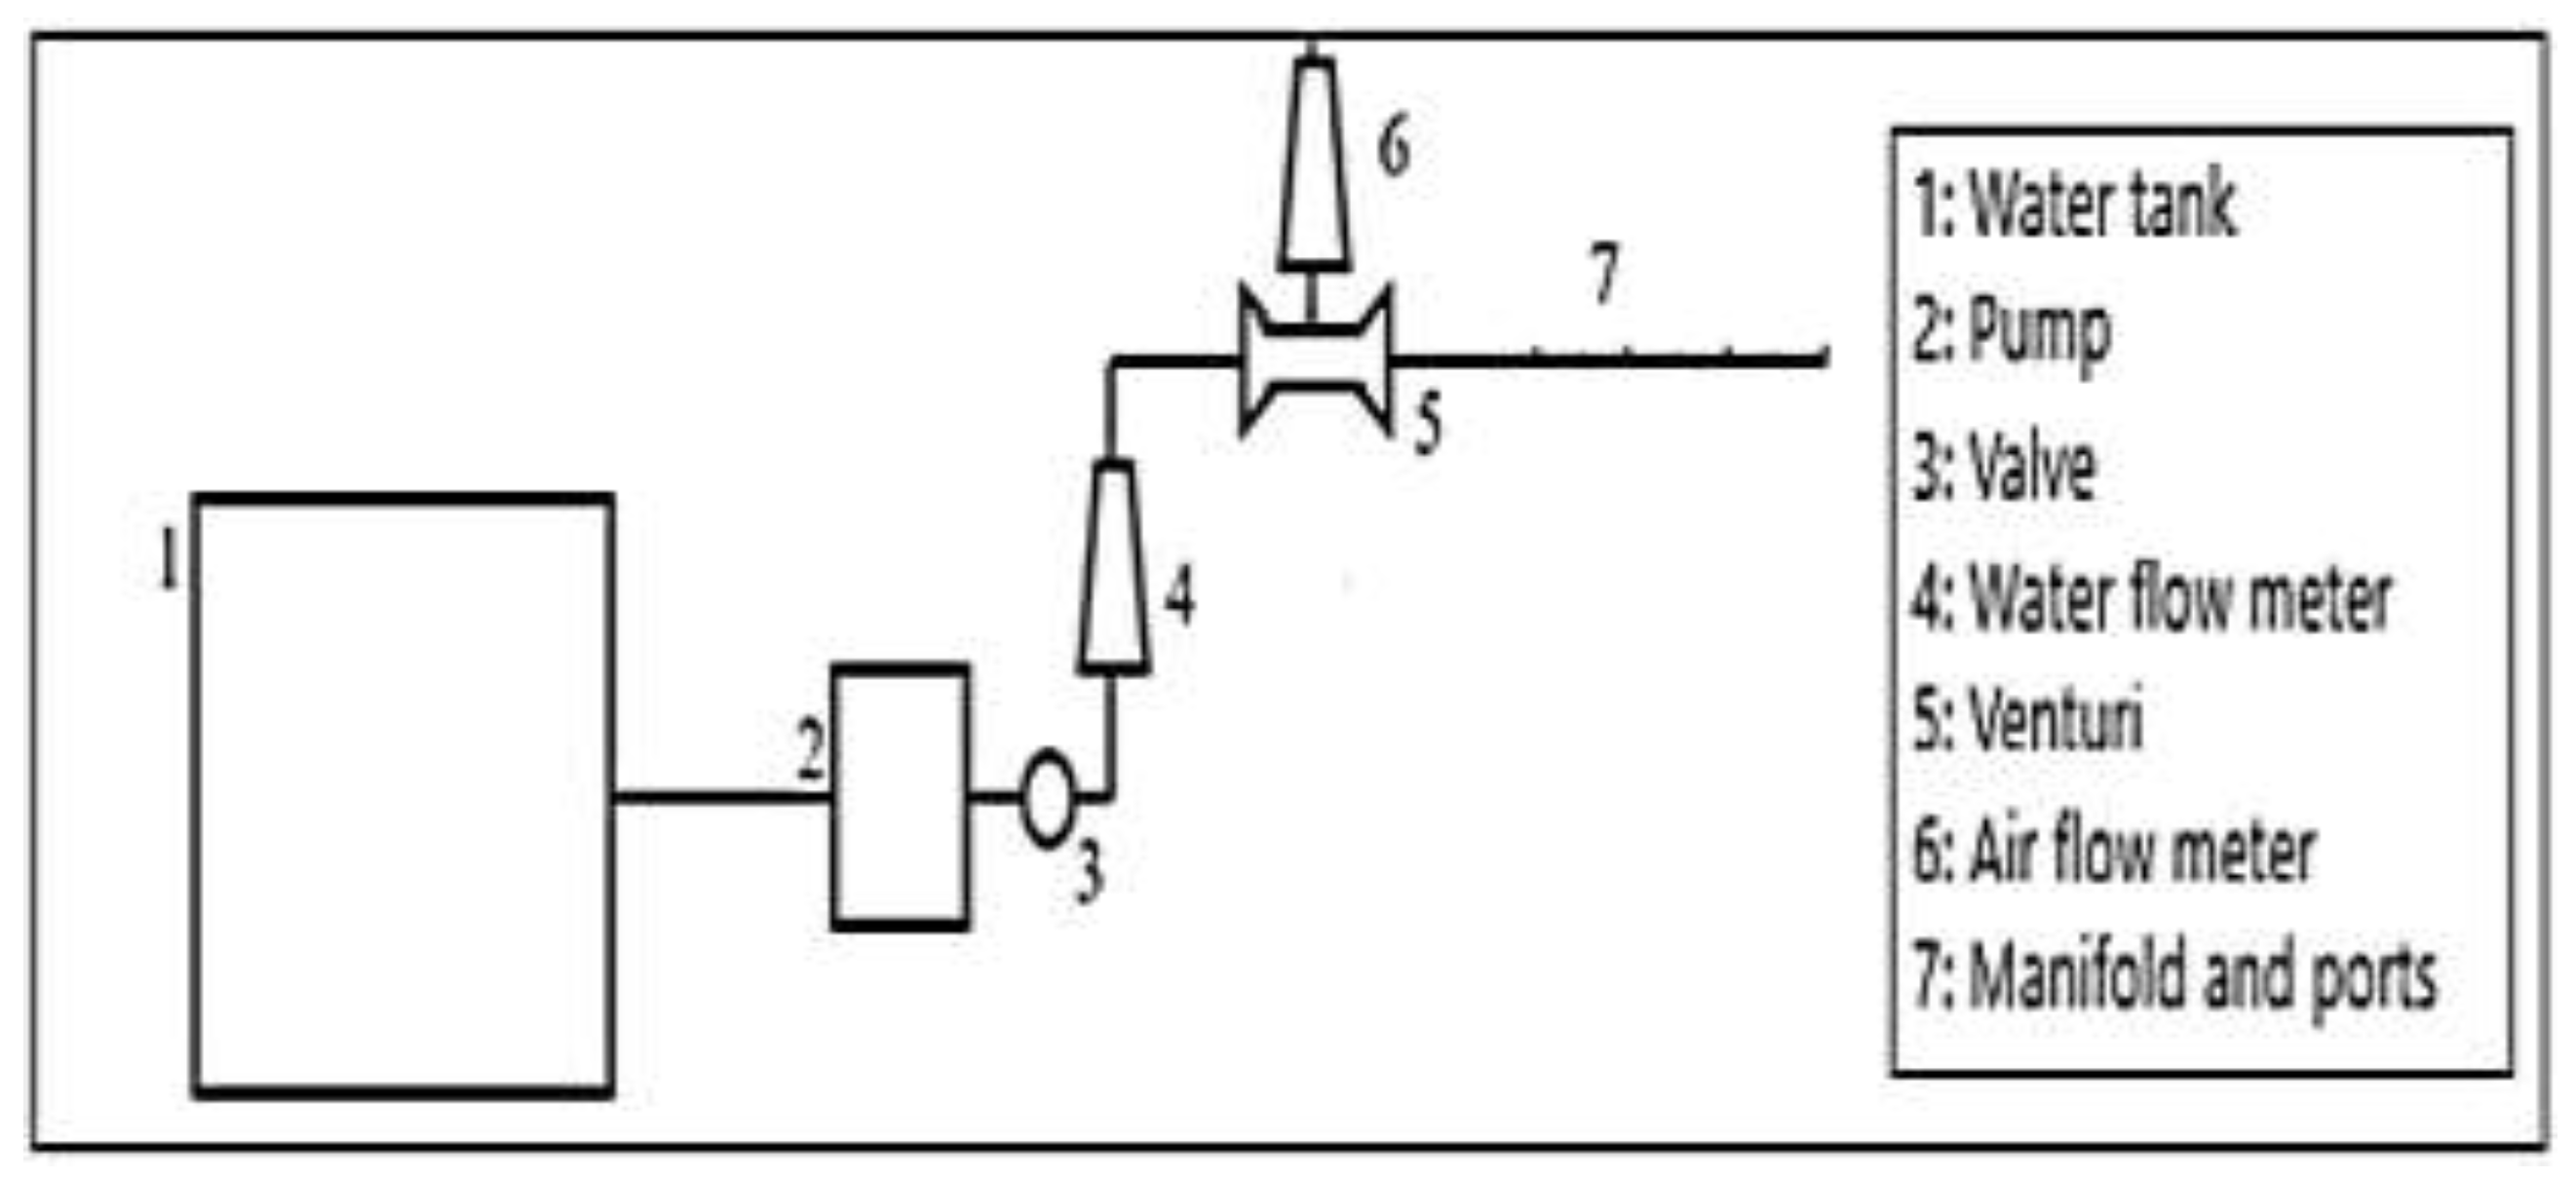
Figure 4.
Types of Venturi used in the experimental set.
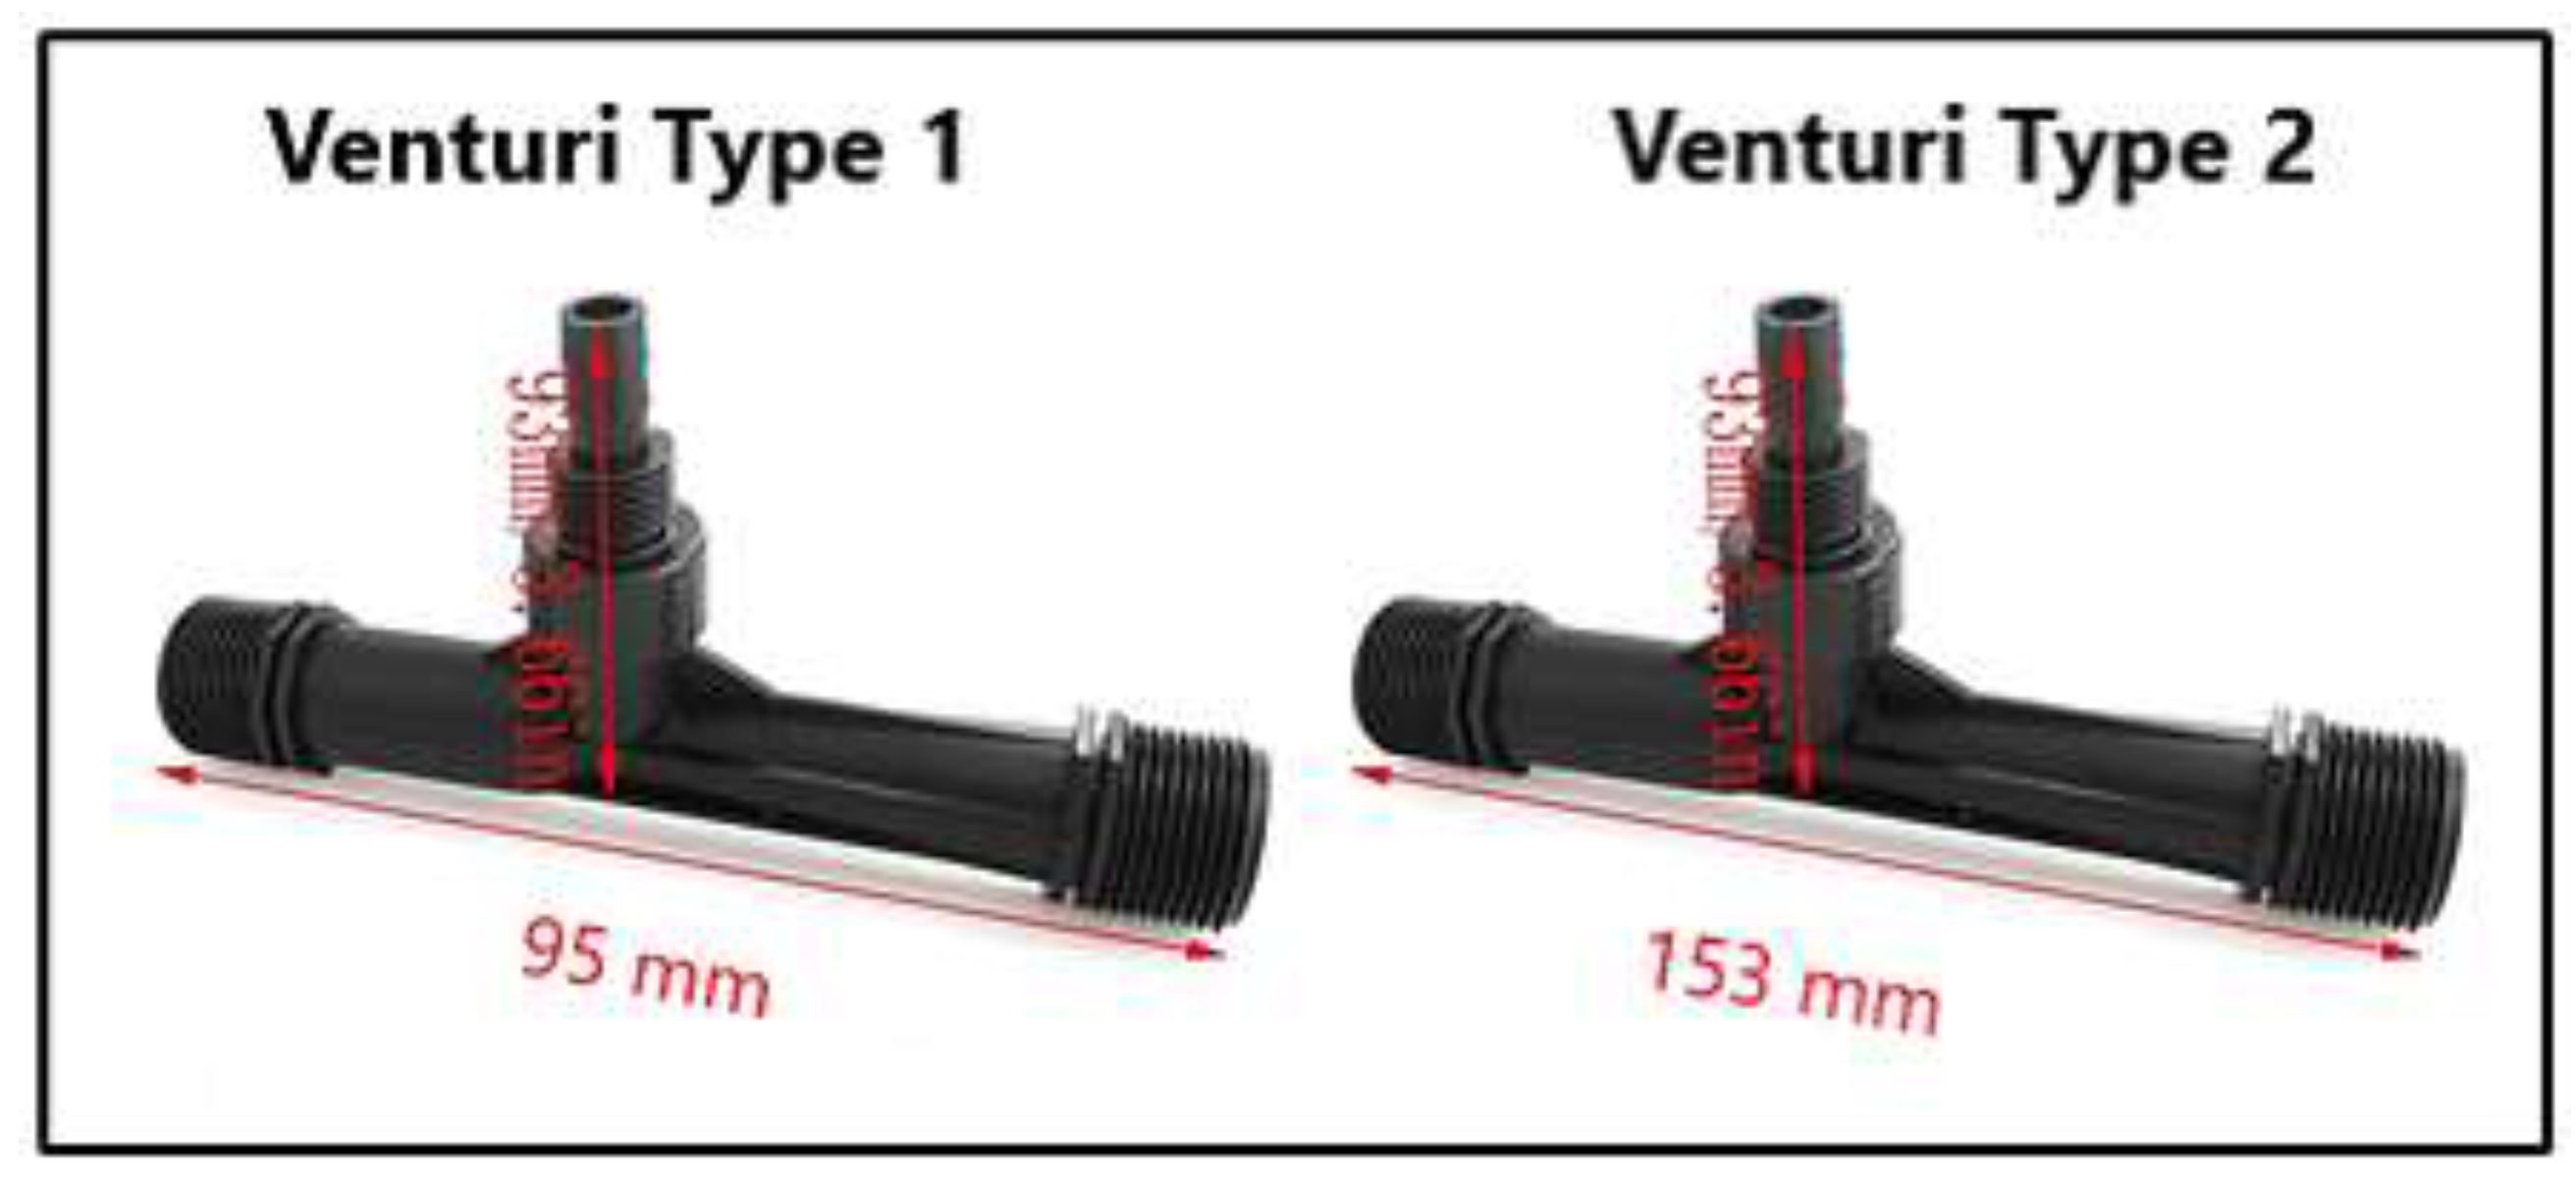
Figure 5.
Air-flow meter
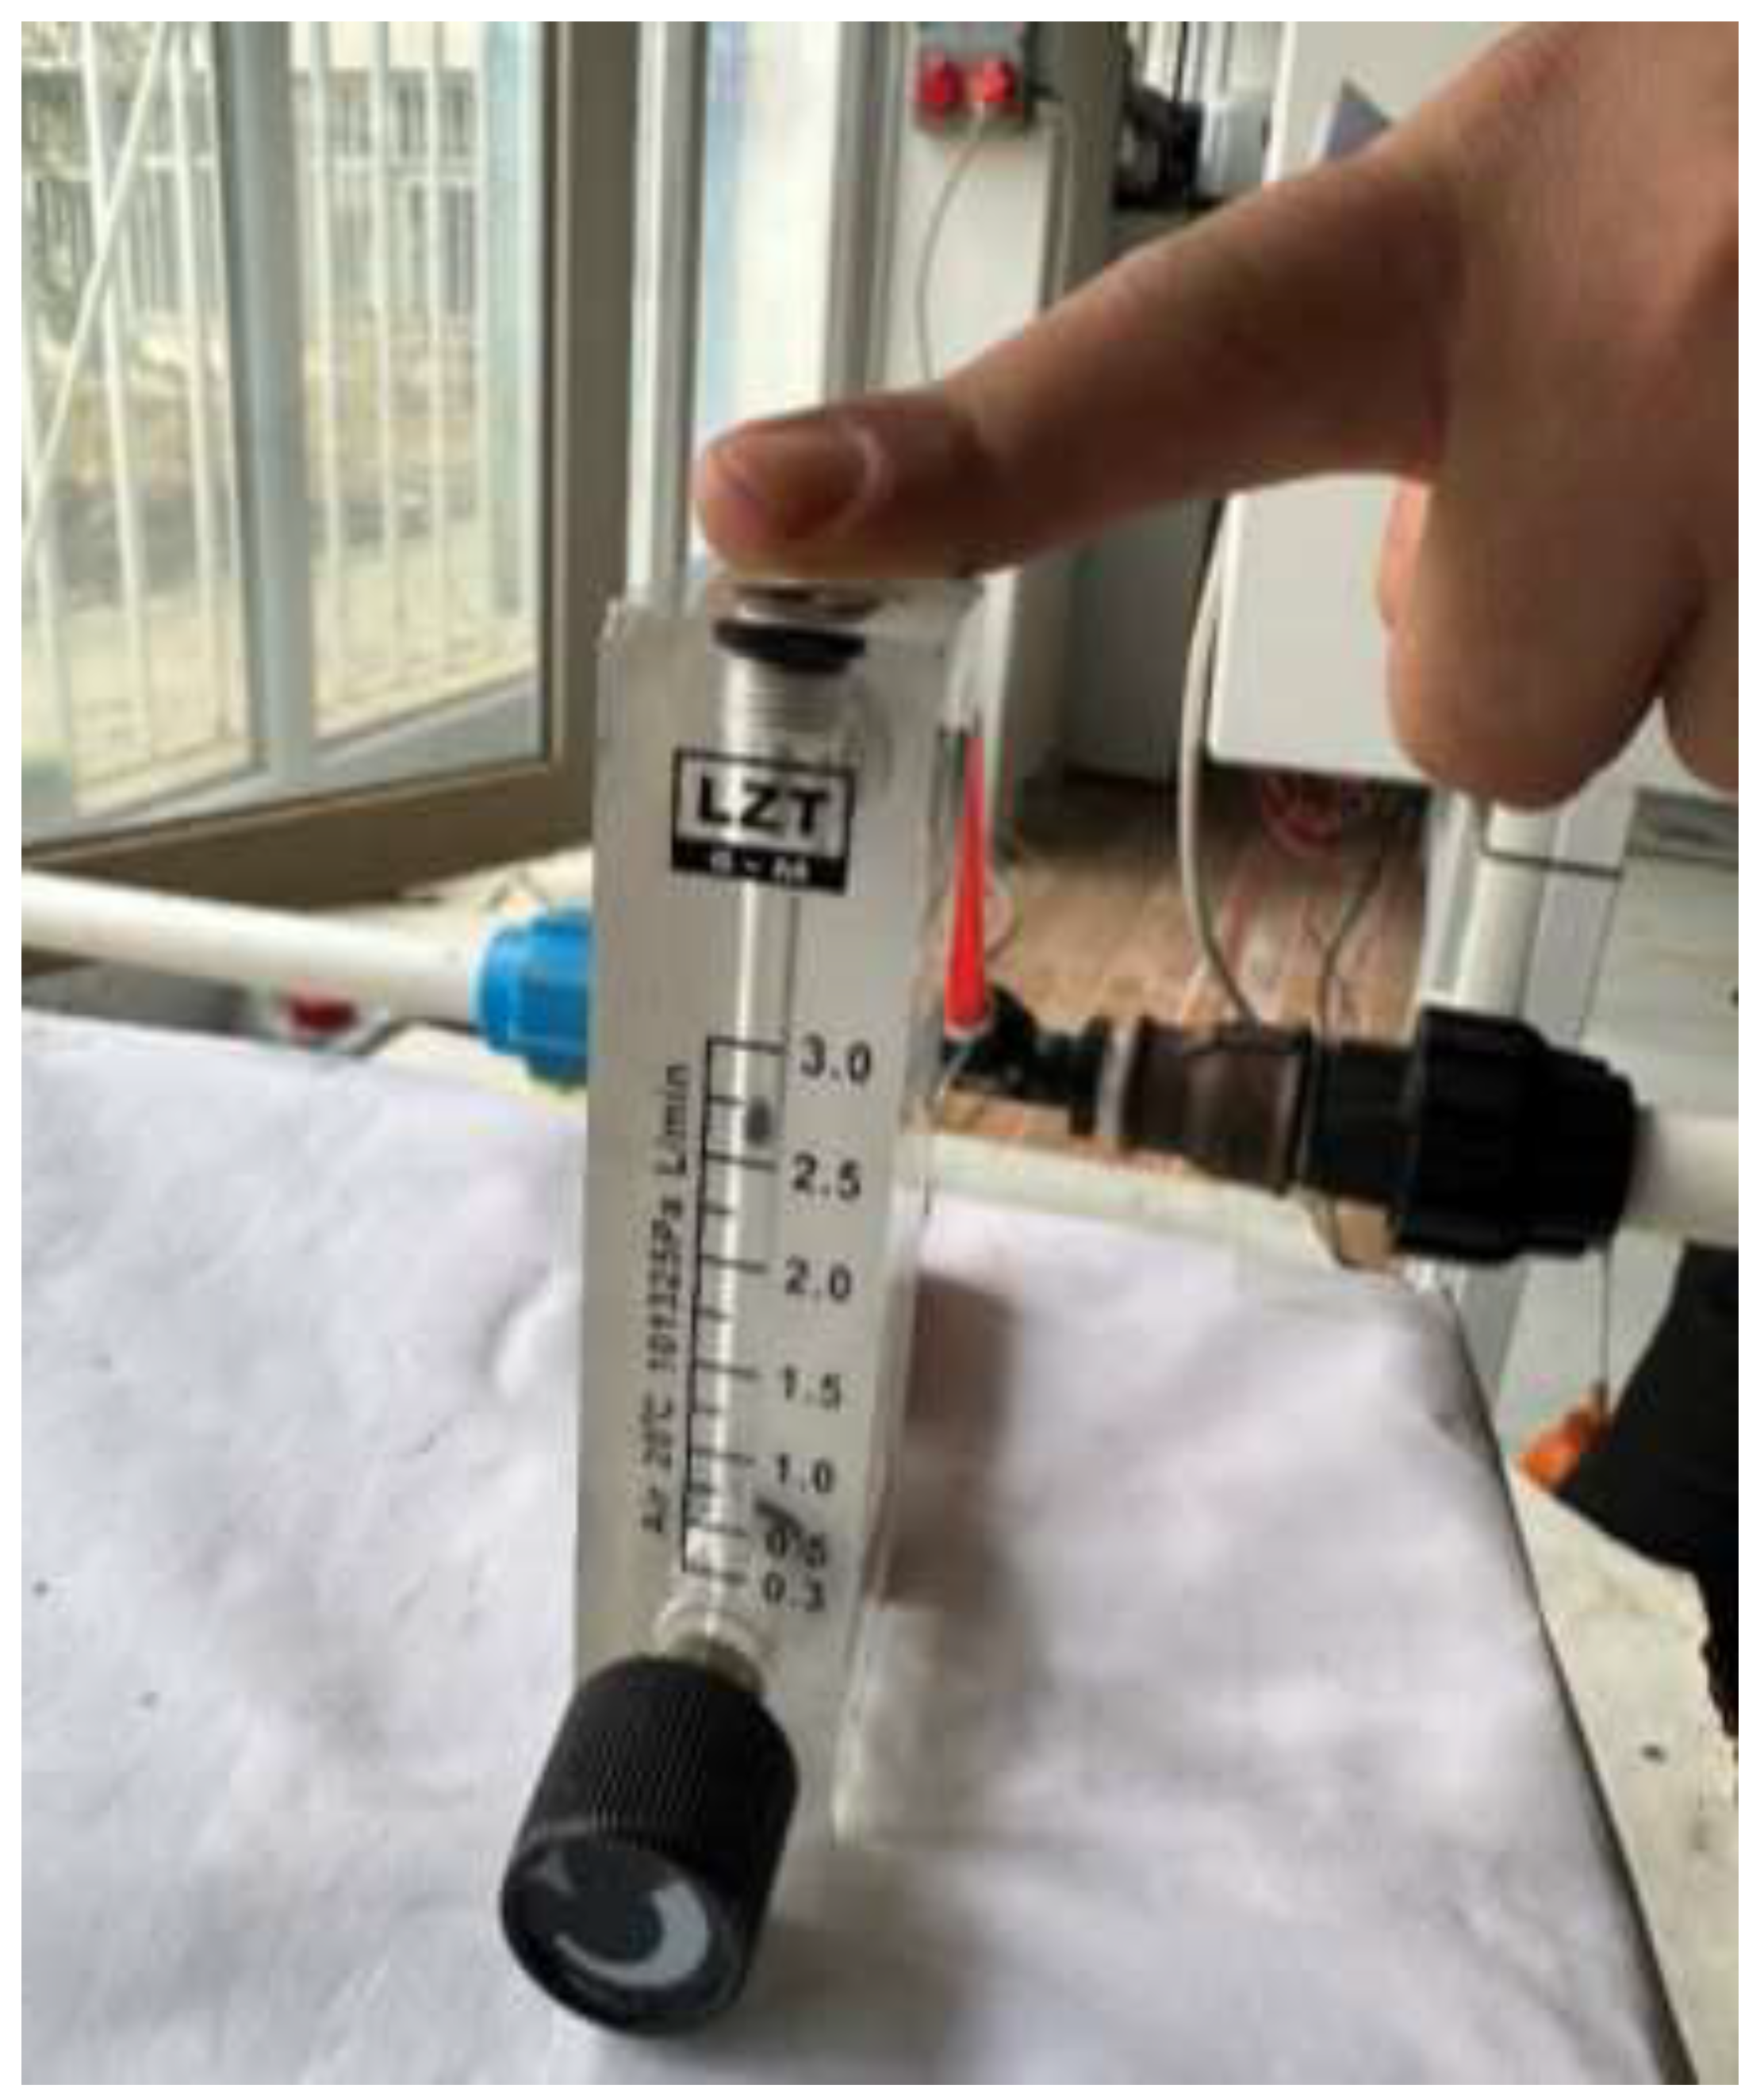
Figure 7.
The relationship between the air suction flow rate and the main pipe flow rate for the Manifold Type 1 with two Venturi device used in the experimental study (Q1 = 17 × 10−5 m3/s, Q2 = 20.8 × 10⁻⁵ m3/s, Q3 = 23.6 × 10⁻⁵ m3/s, Q4 = 27.8 × 10⁻⁵ m3/s).
Figure 7.
The relationship between the air suction flow rate and the main pipe flow rate for the Manifold Type 1 with two Venturi device used in the experimental study (Q1 = 17 × 10−5 m3/s, Q2 = 20.8 × 10⁻⁵ m3/s, Q3 = 23.6 × 10⁻⁵ m3/s, Q4 = 27.8 × 10⁻⁵ m3/s).
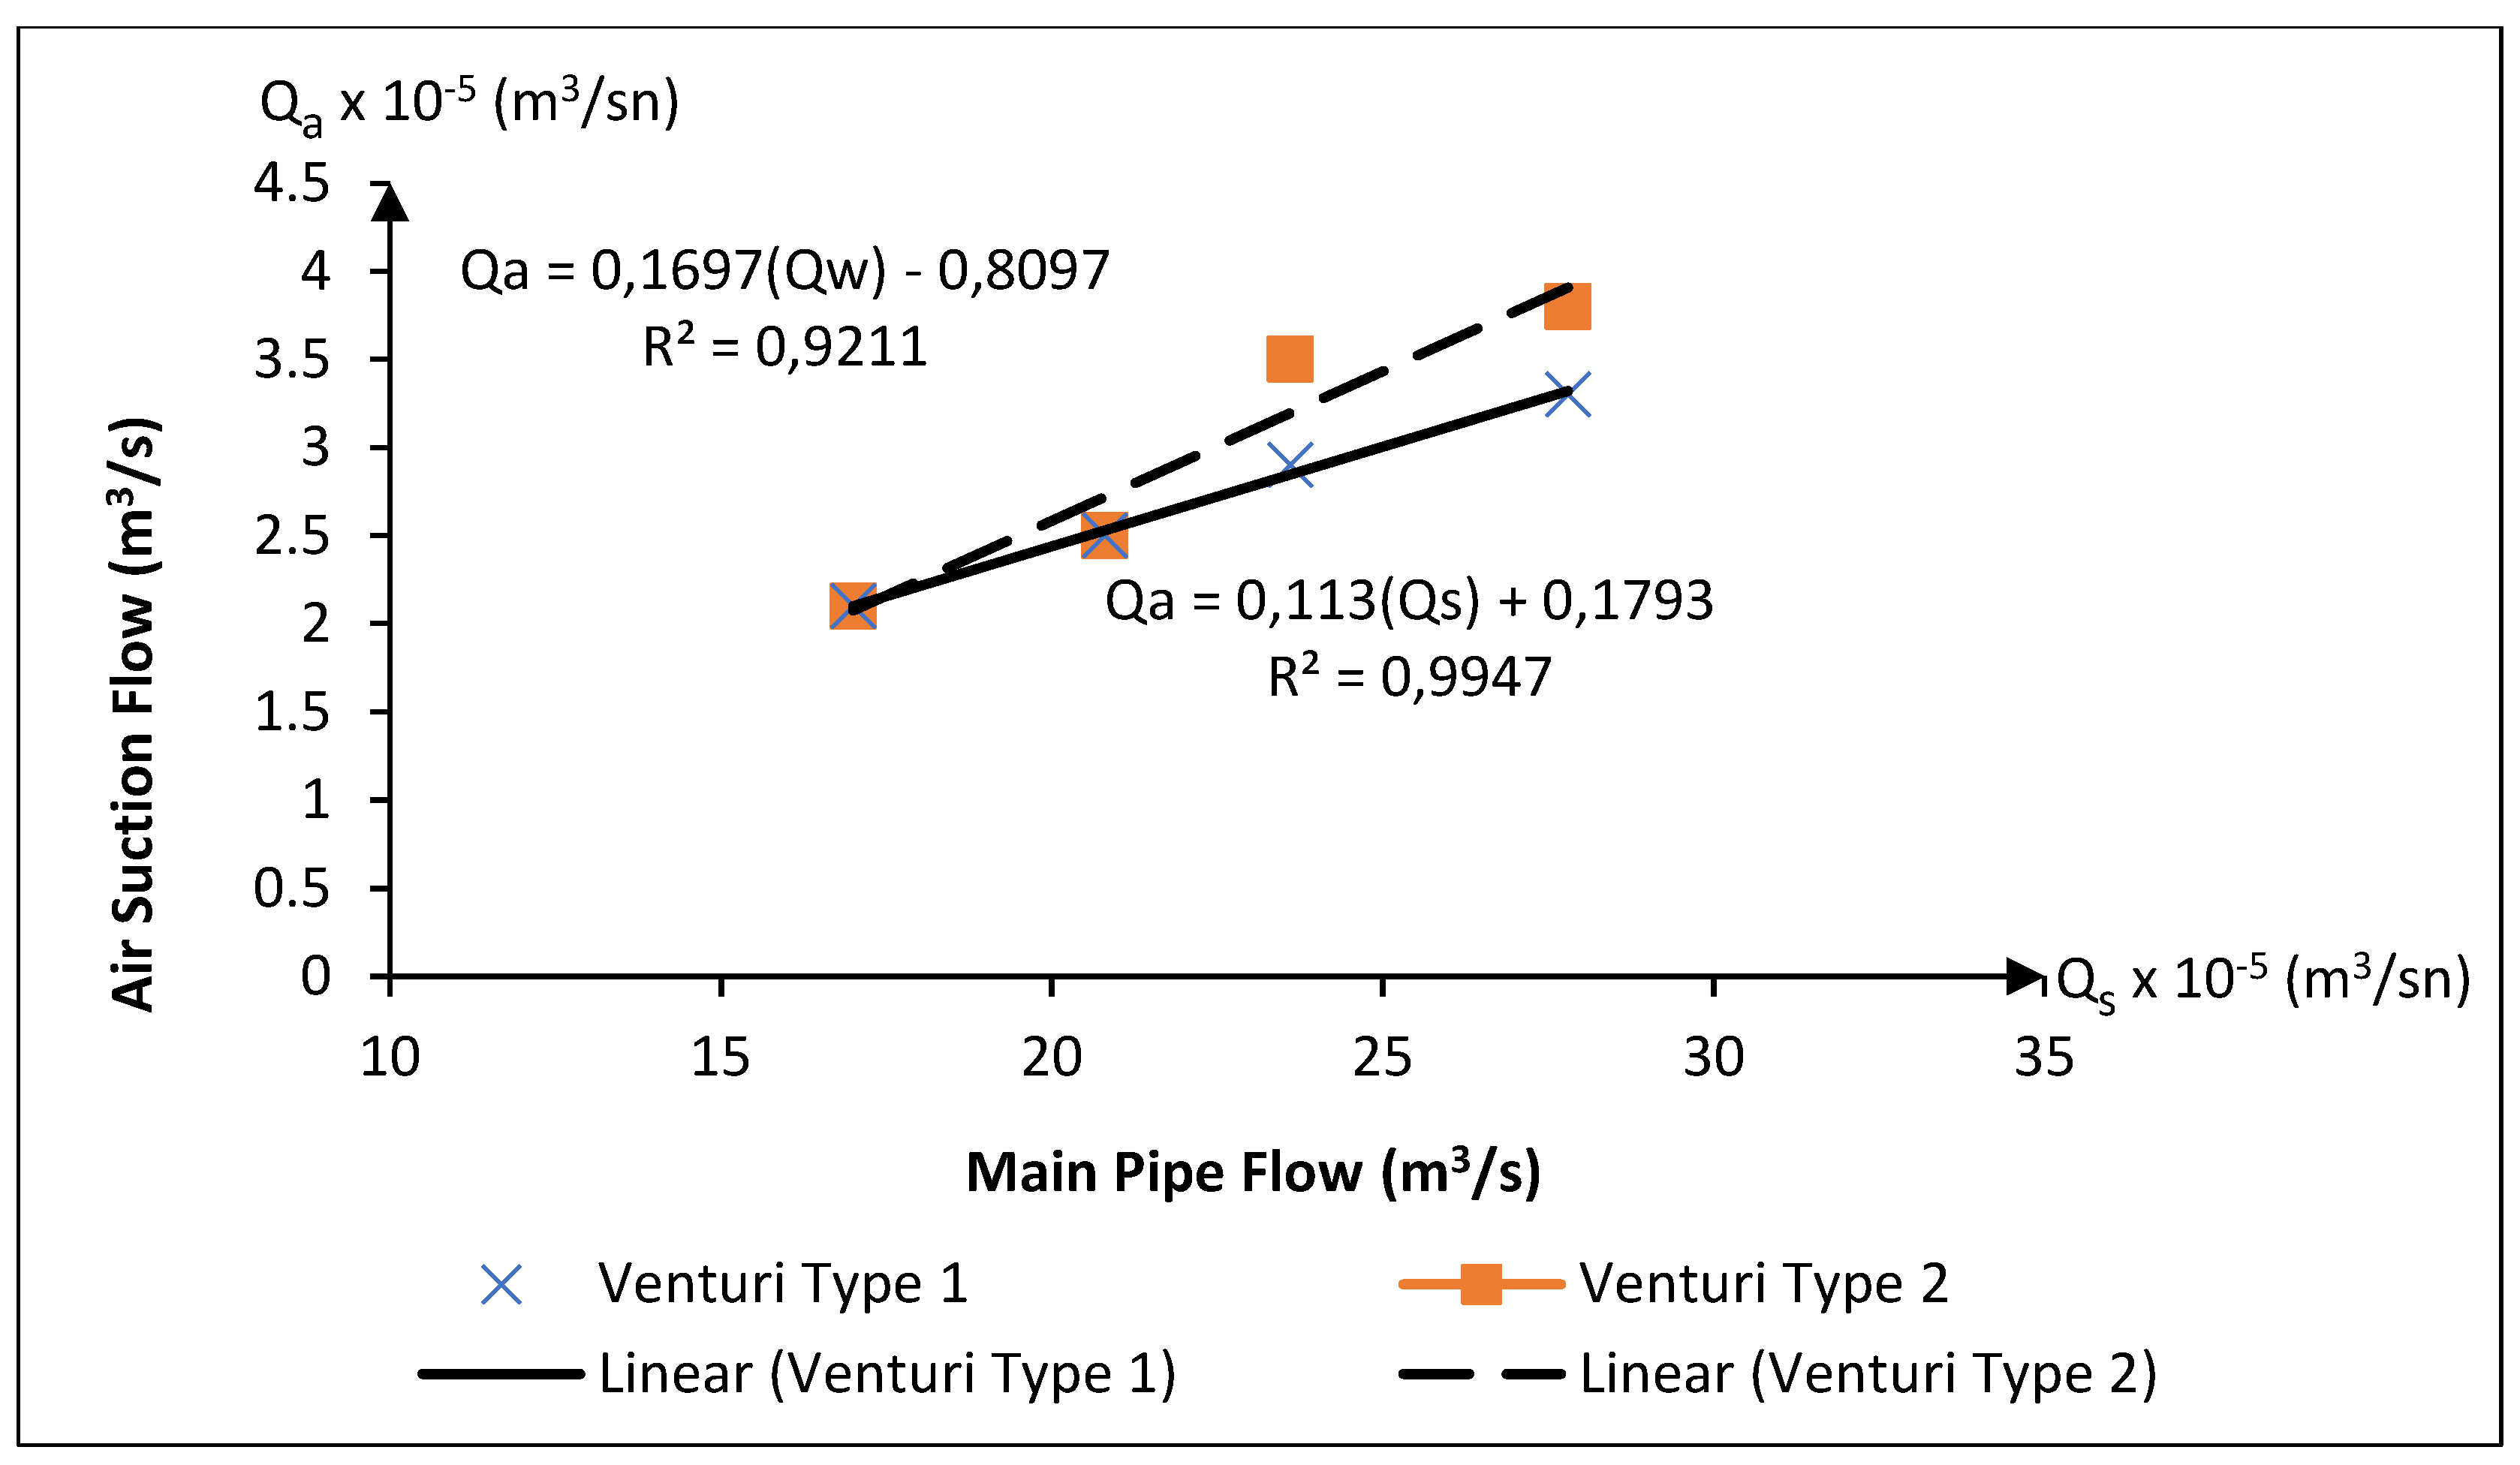
Figure 8.
The relationship between the air suction flow rate and the main pipe flow rate for the Manifold Type 2 with two Venturi device used in the experimental study (Q1 = 17 × 10−5 m3/s, Q2 = 20.8 × 10⁻⁵ m3/s, Q3 = 23.6 × 10⁻⁵ m3/s, Q4 = 27.8 × 10⁻⁵ m3/s).
Figure 8.
The relationship between the air suction flow rate and the main pipe flow rate for the Manifold Type 2 with two Venturi device used in the experimental study (Q1 = 17 × 10−5 m3/s, Q2 = 20.8 × 10⁻⁵ m3/s, Q3 = 23.6 × 10⁻⁵ m3/s, Q4 = 27.8 × 10⁻⁵ m3/s).
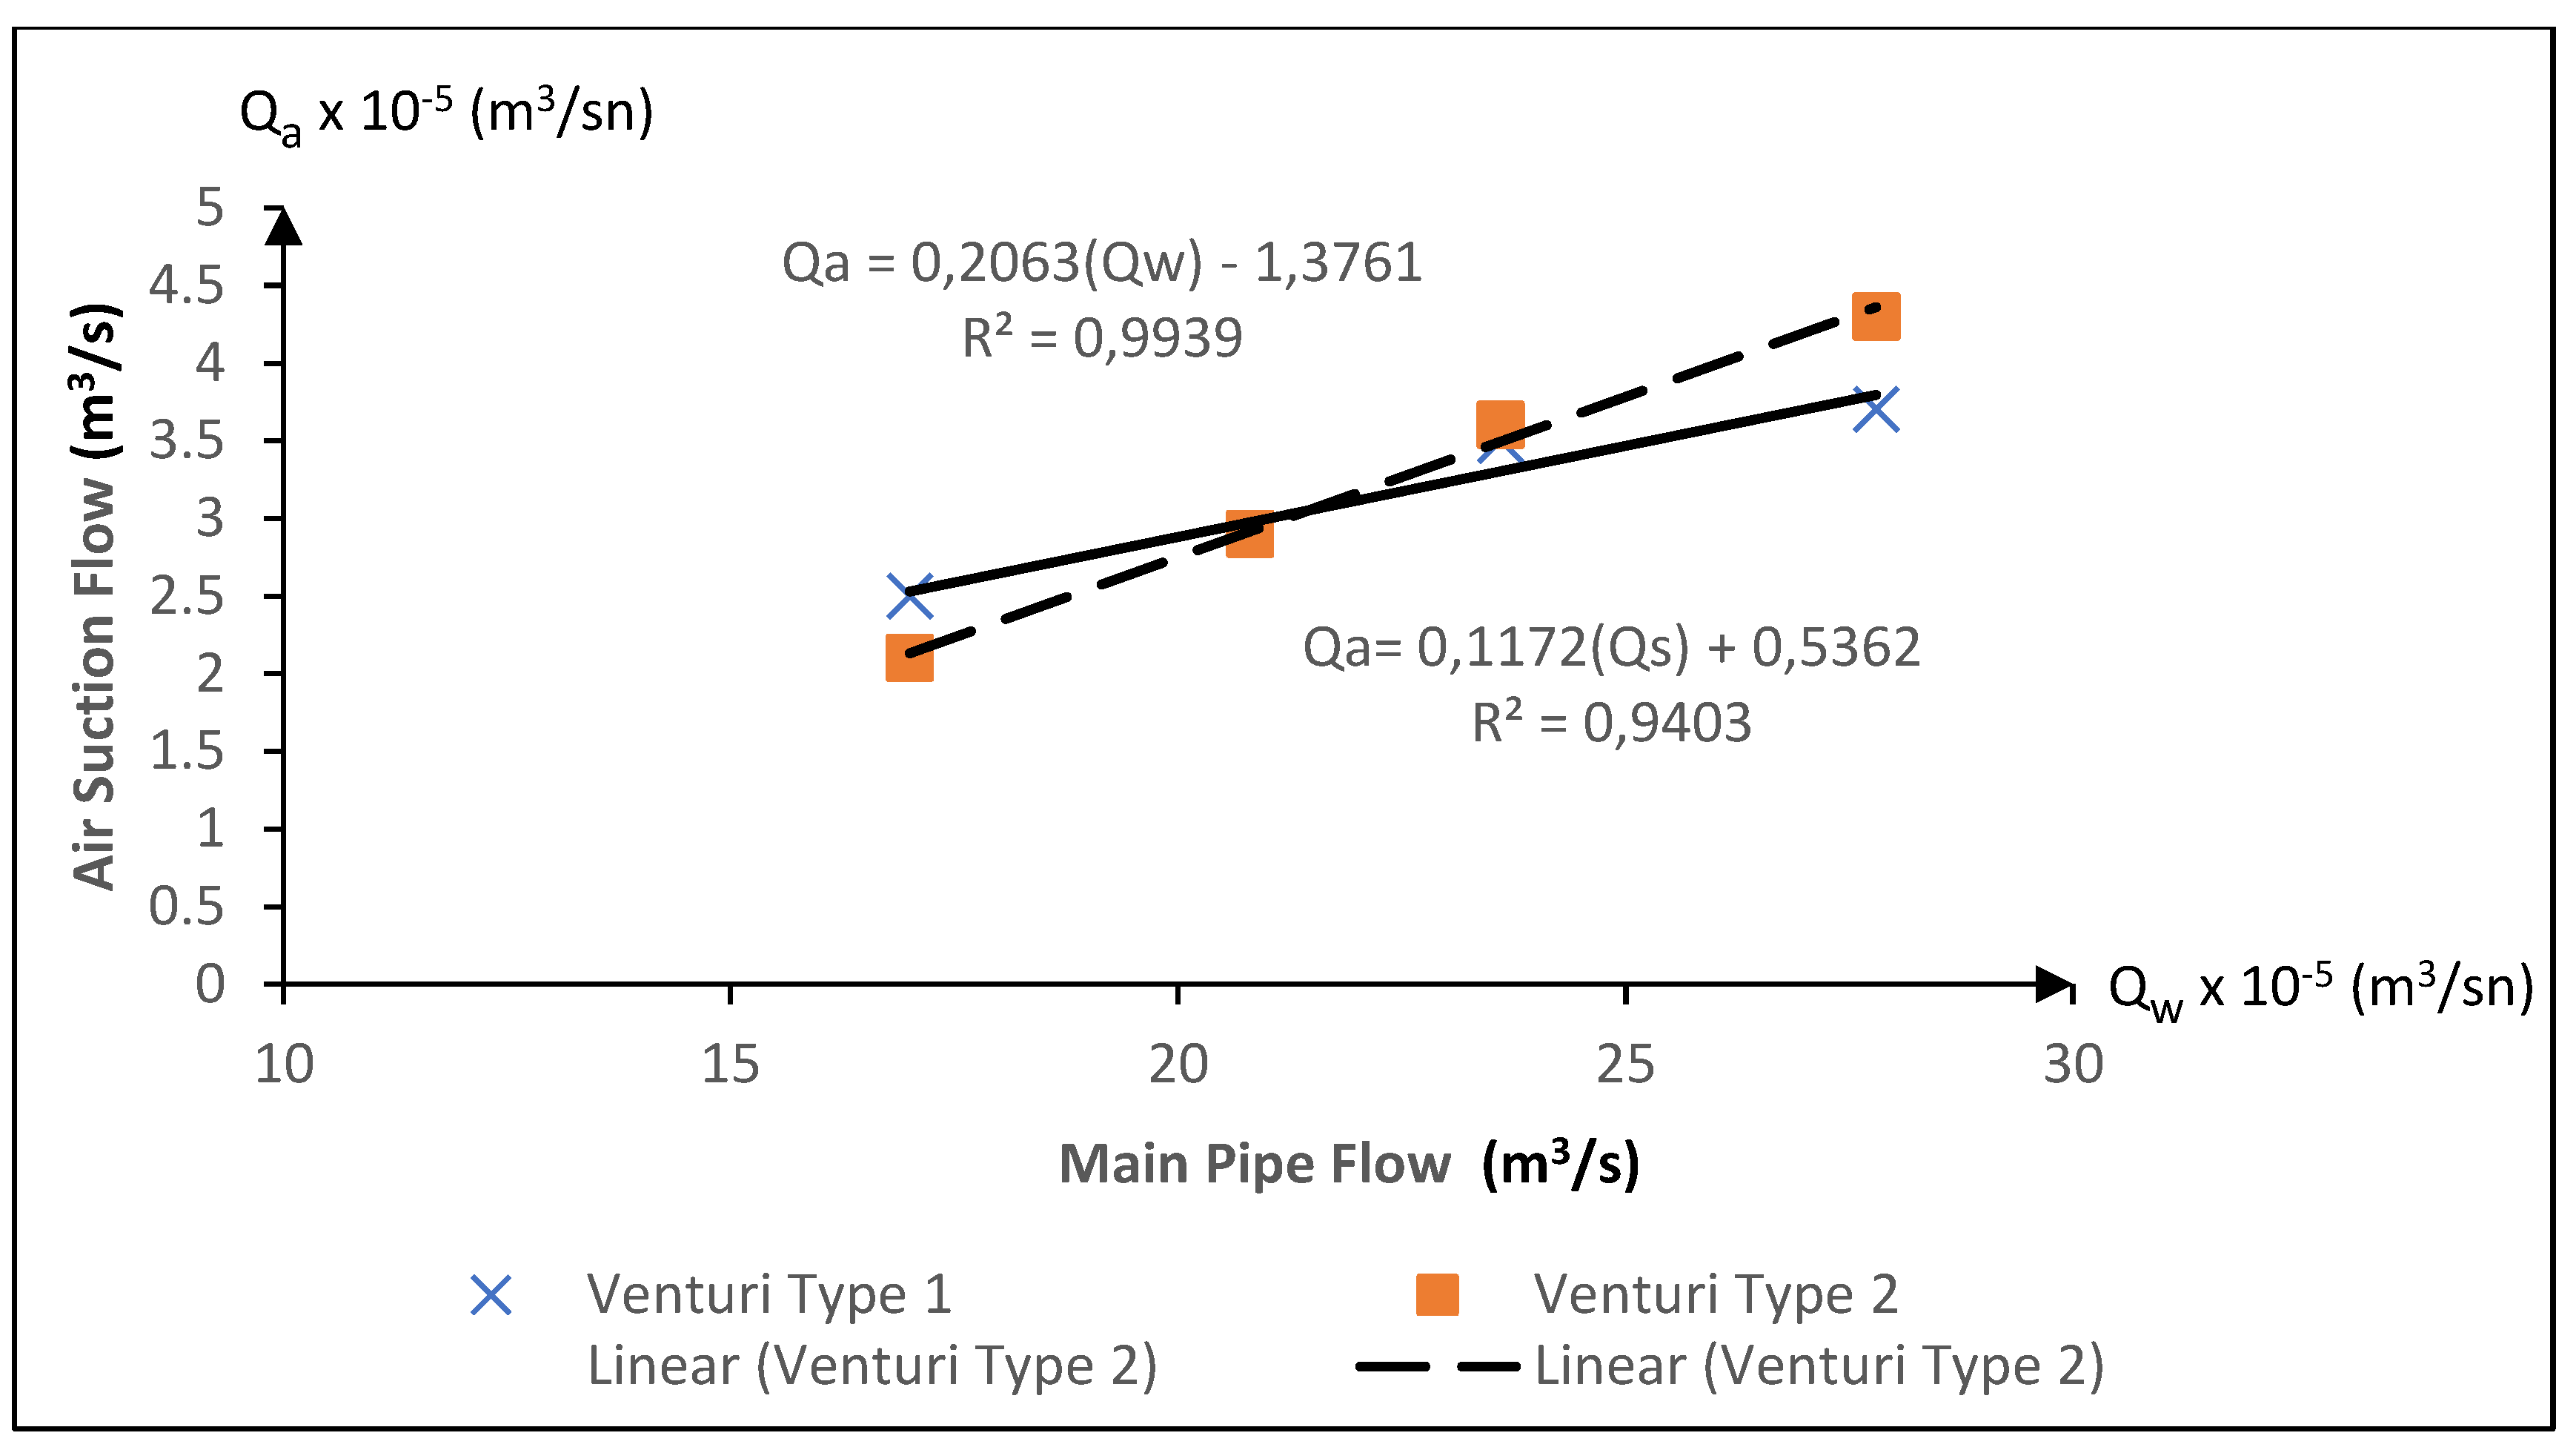
Figure 9.
The relationship between the air suction flow rate and the main pipe flow rate for the Manifold Type 3 with two Venturi device used in the experimental study (Q1 = 17 × 10−5 m3/s, Q2 = 20.8 × 10⁻⁵ m3/s, Q3 = 23.6 × 10⁻⁵ m3/s, Q4 = 27.8 × 10⁻⁵ m3/s).
Figure 9.
The relationship between the air suction flow rate and the main pipe flow rate for the Manifold Type 3 with two Venturi device used in the experimental study (Q1 = 17 × 10−5 m3/s, Q2 = 20.8 × 10⁻⁵ m3/s, Q3 = 23.6 × 10⁻⁵ m3/s, Q4 = 27.8 × 10⁻⁵ m3/s).
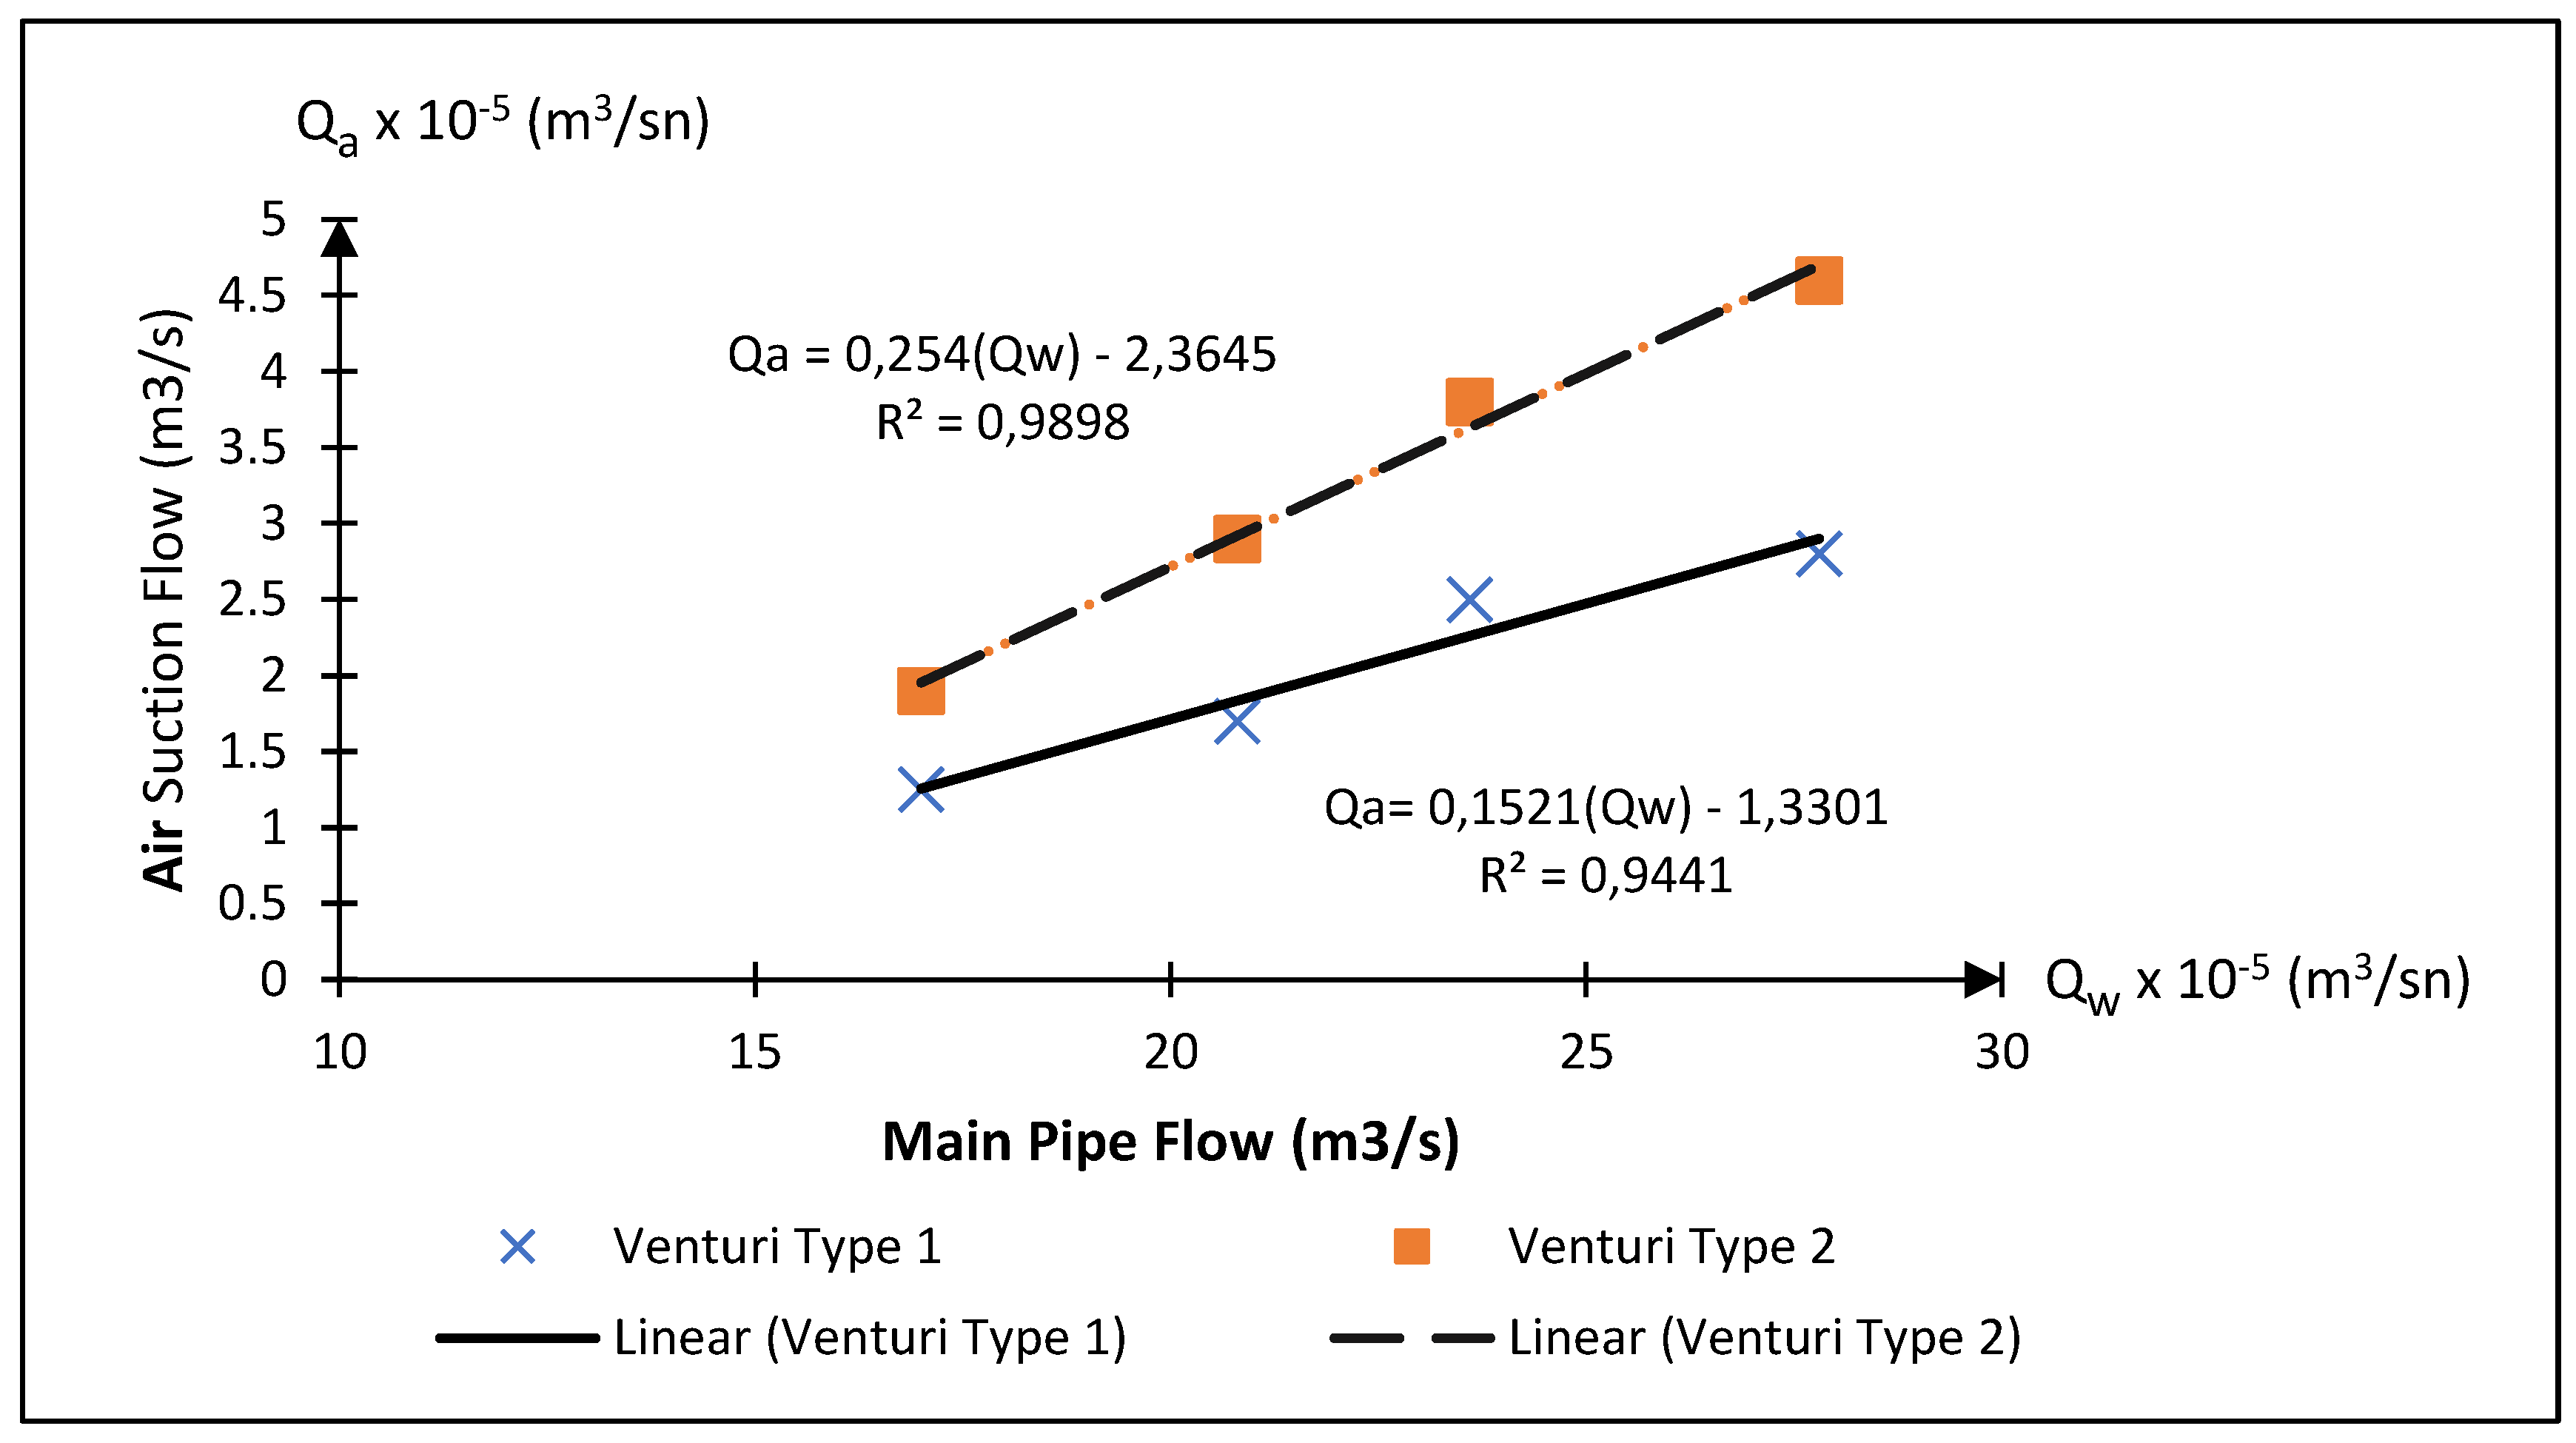
Figure 10.
The relationship between the air suction flow rate and the main pipe flow rate for the Manifold Type 4 with two Venturi device used in the experimental study (Q1 = 17 × 10−5 m3/s, Q2 = 20.8 × 10⁻⁵ m3/s, Q3 = 23.6 × 10⁻⁵ m3/s, Q4 = 27.8 × 10⁻⁵ m3/s).
Figure 10.
The relationship between the air suction flow rate and the main pipe flow rate for the Manifold Type 4 with two Venturi device used in the experimental study (Q1 = 17 × 10−5 m3/s, Q2 = 20.8 × 10⁻⁵ m3/s, Q3 = 23.6 × 10⁻⁵ m3/s, Q4 = 27.8 × 10⁻⁵ m3/s).
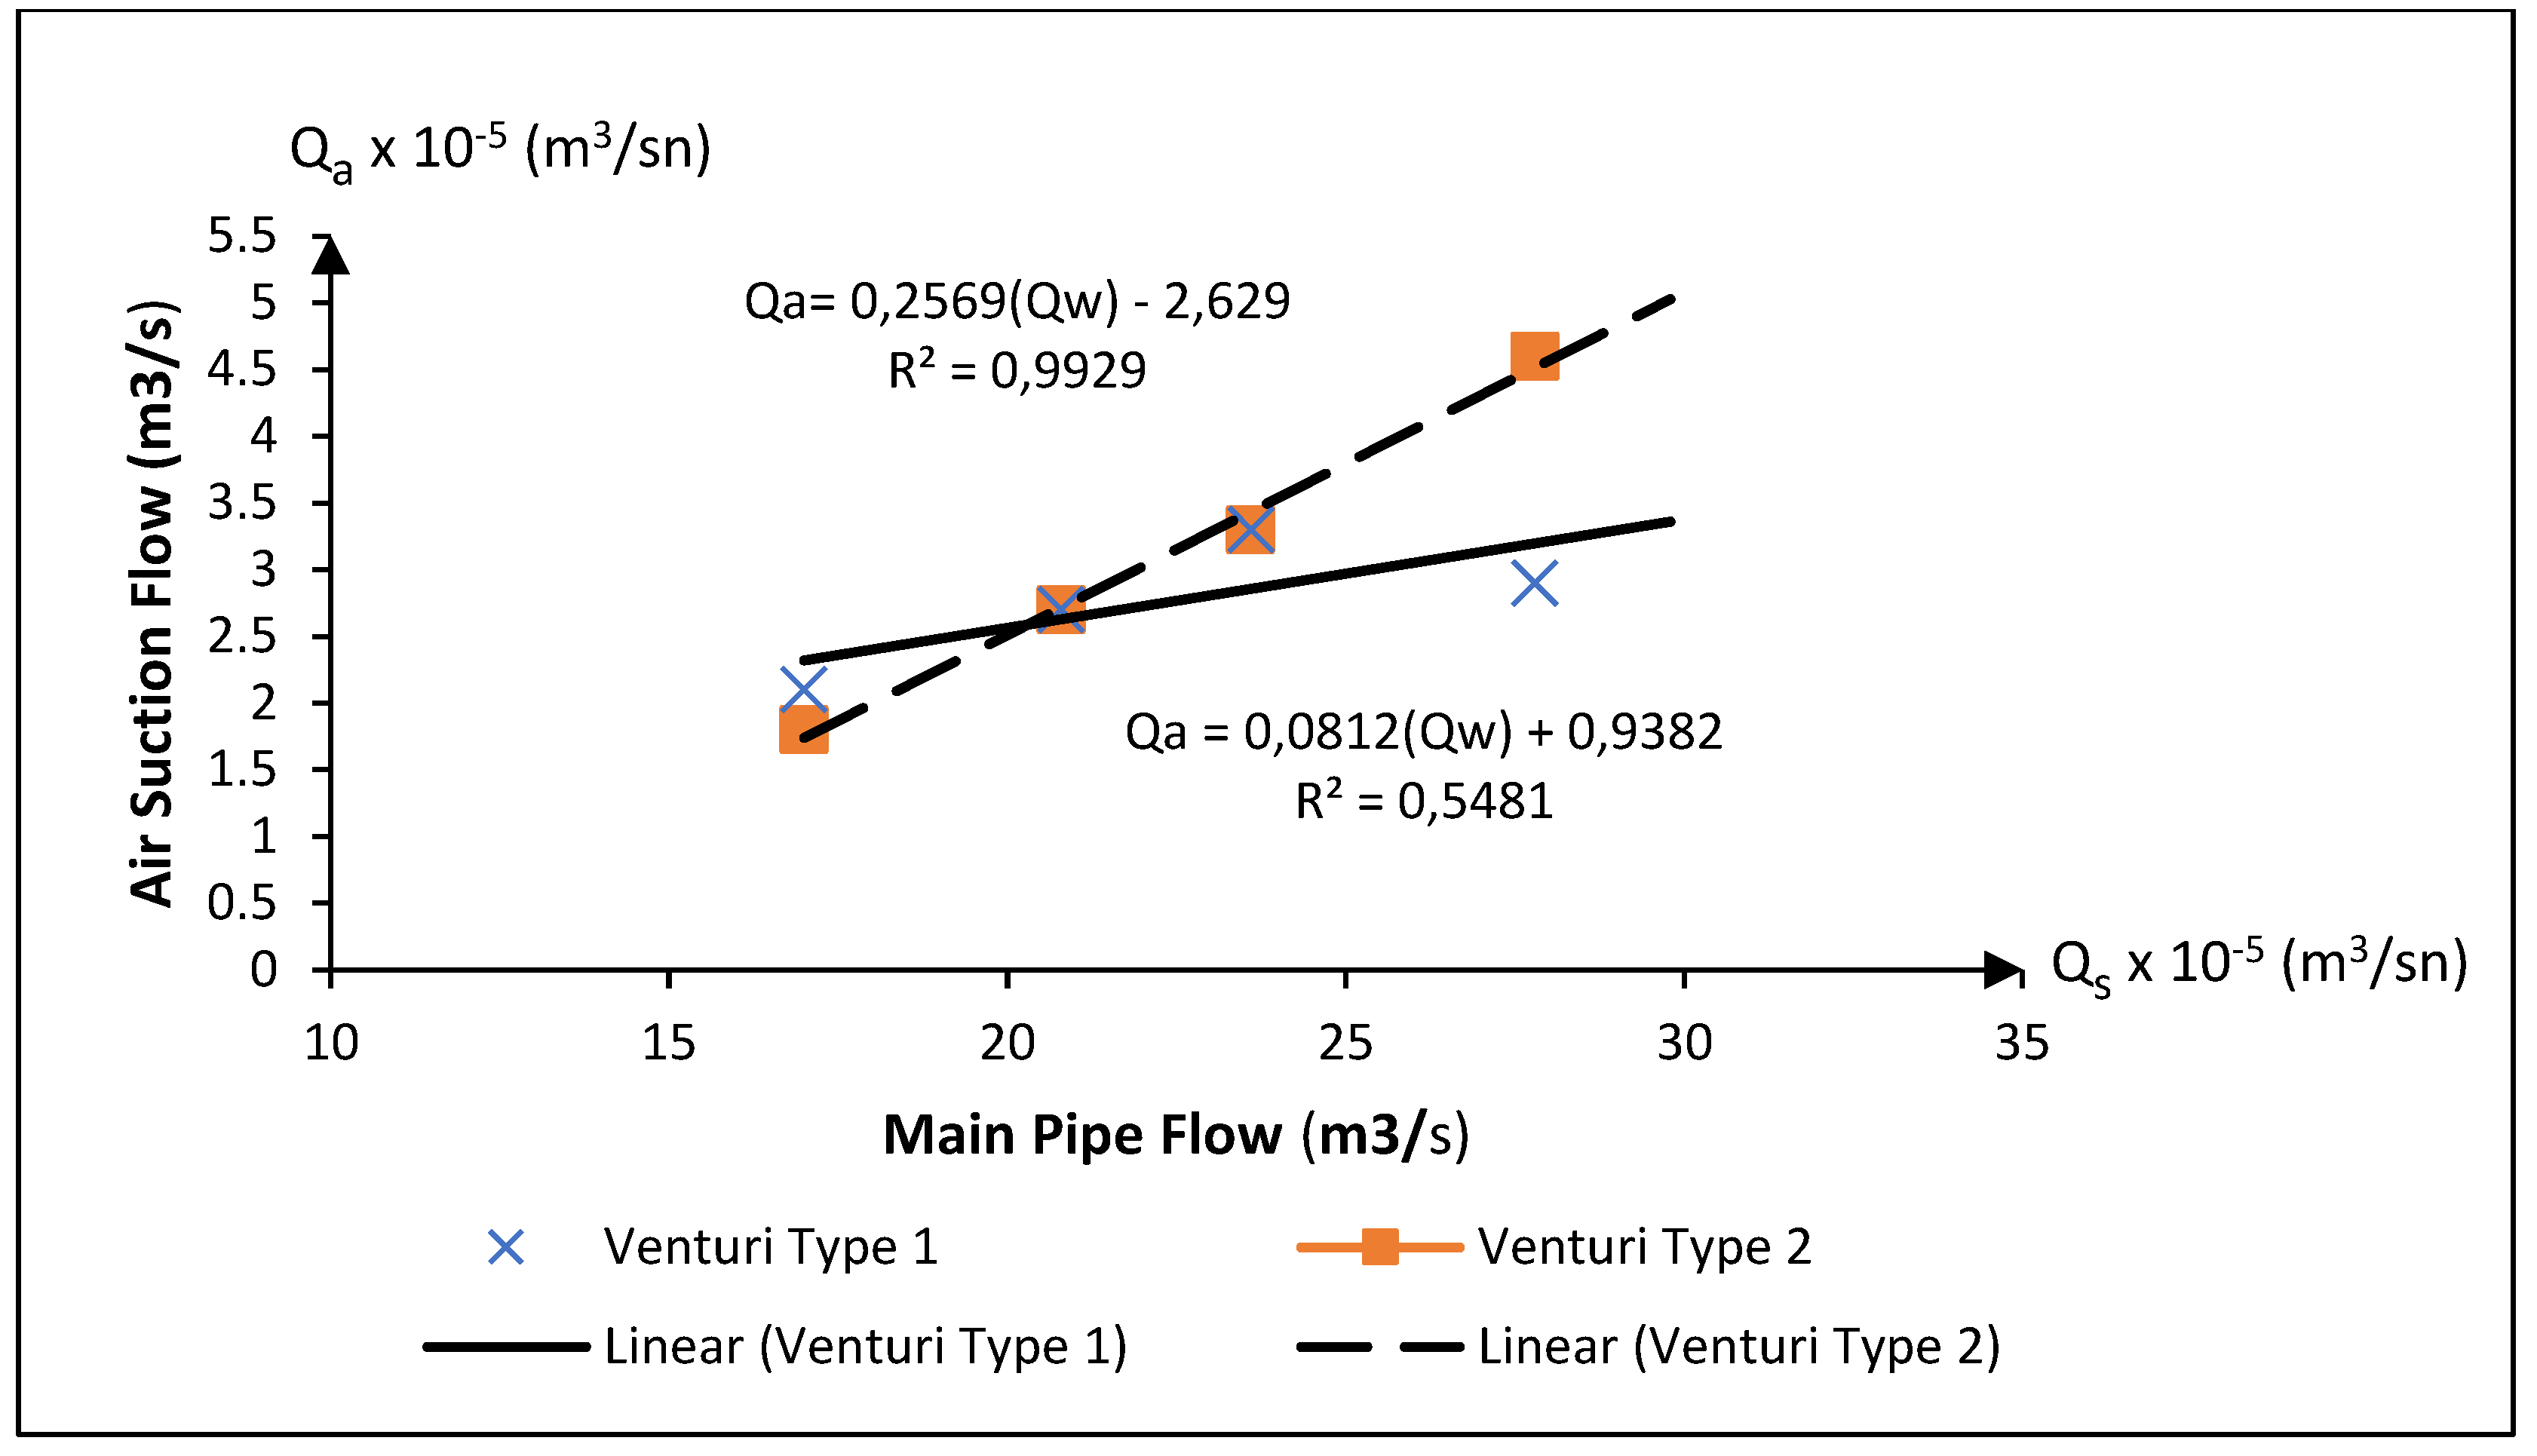
Figure 11.
The relationship between the Qa/Qw ratio and Ljet in a Venturi type 1, manifold type 1 experimental setup.
Figure 11.
The relationship between the Qa/Qw ratio and Ljet in a Venturi type 1, manifold type 1 experimental setup.
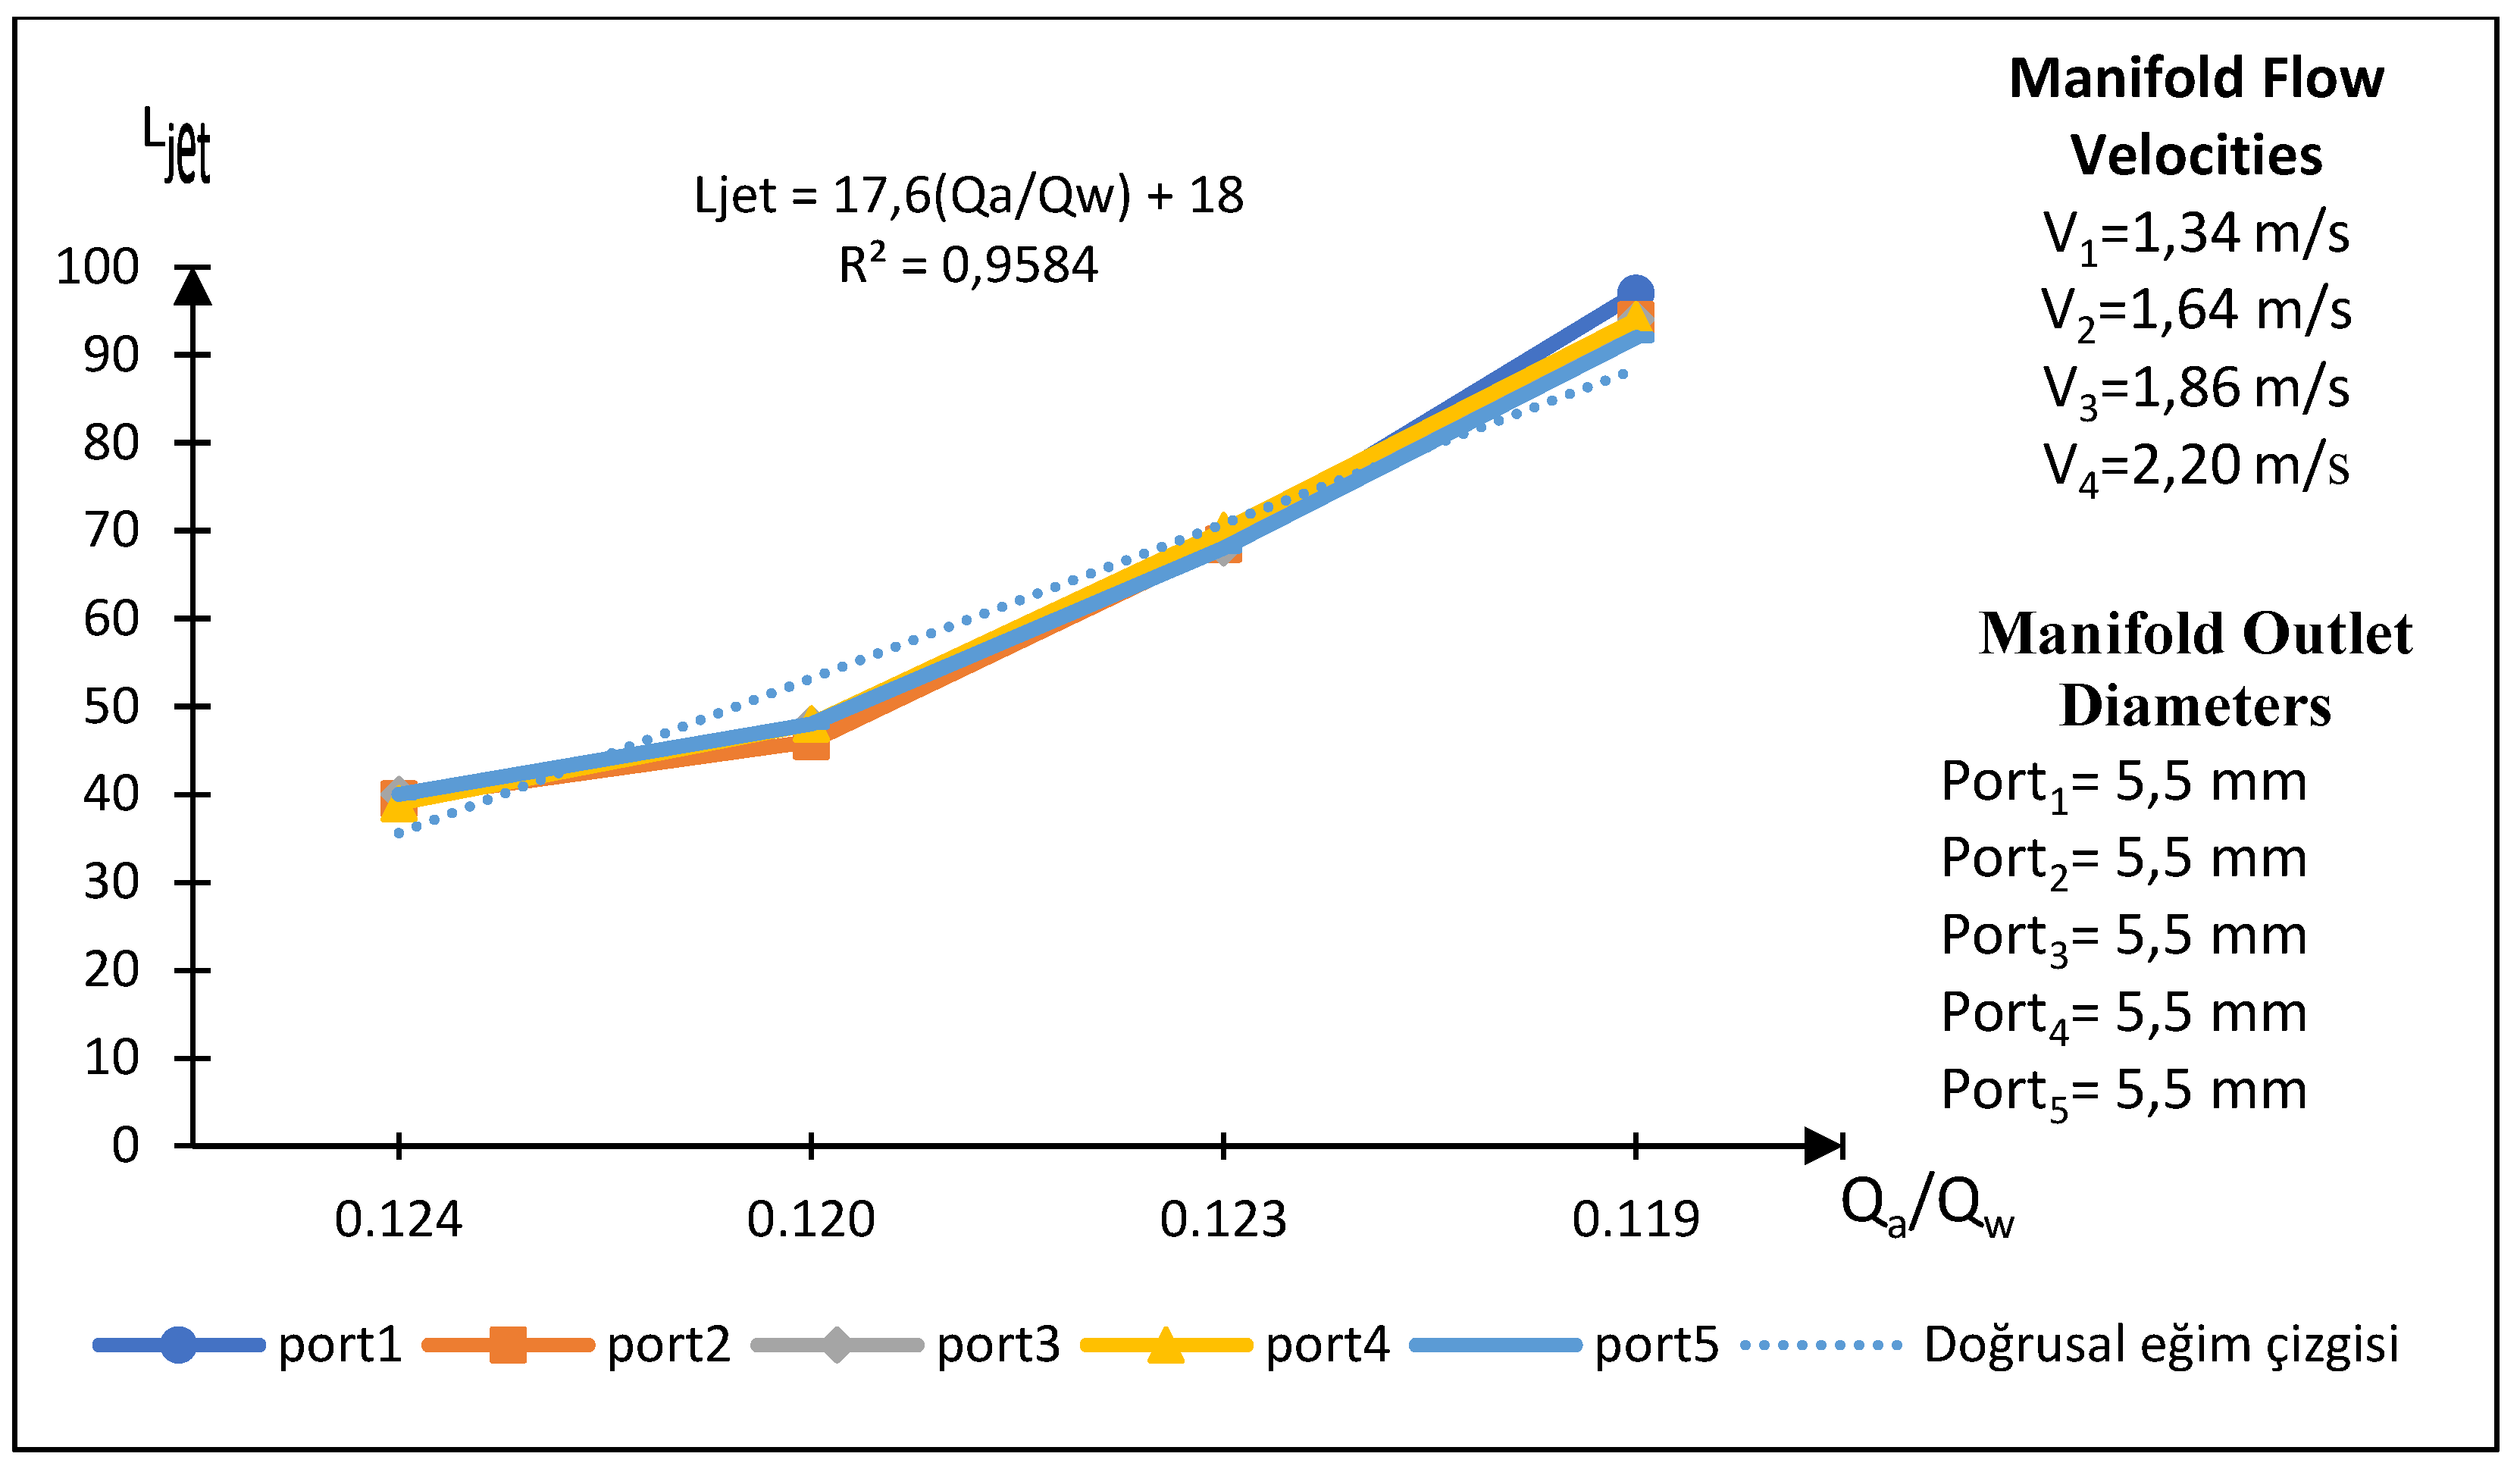
Figure 12.
The relationship between the Qa/Qw ratio and Ljet in a Venturi type 1, manifold type 2 experimental setup.
Figure 12.
The relationship between the Qa/Qw ratio and Ljet in a Venturi type 1, manifold type 2 experimental setup.
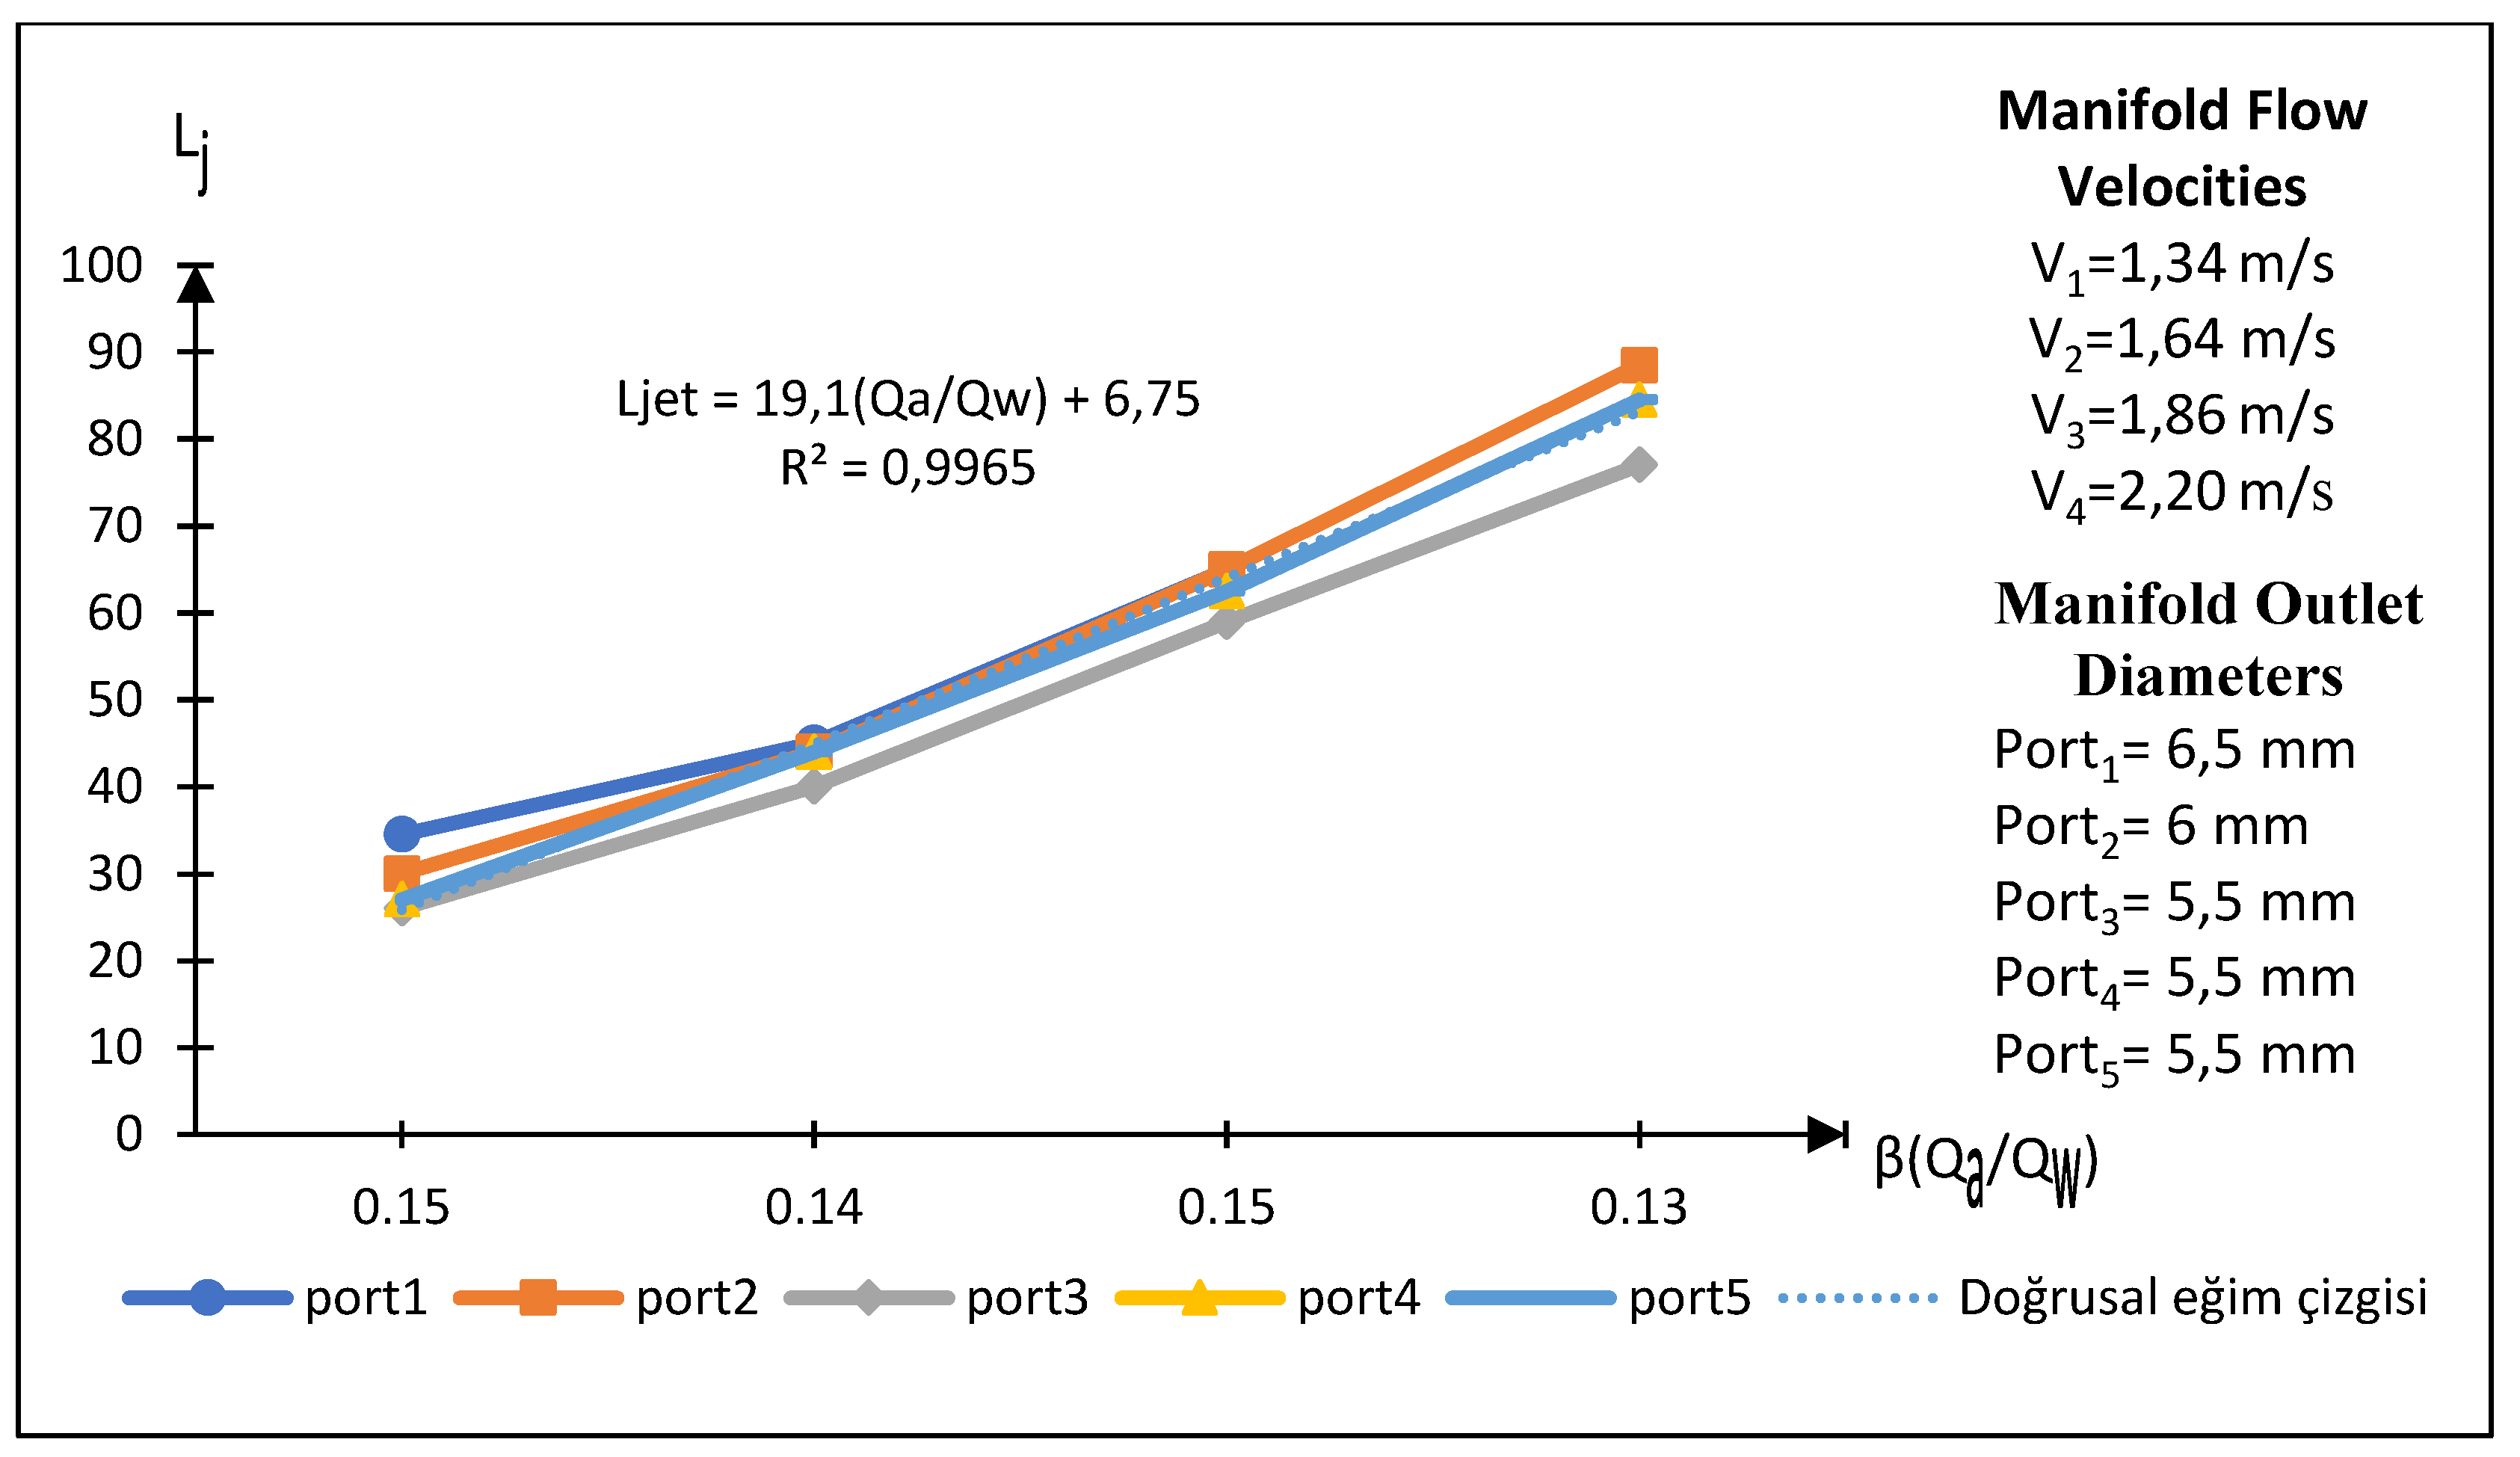
Figure 13.
The relationship between the Qa/Qw ratio and Ljet in a Venturi type 1, manifold type 3 experimental setup.
Figure 13.
The relationship between the Qa/Qw ratio and Ljet in a Venturi type 1, manifold type 3 experimental setup.
Figure 14.
The relationship between the Qa/Qw ratio and Ljet in a Venturi type 1, manifold type 4 experimental setup.
Figure 14.
The relationship between the Qa/Qw ratio and Ljet in a Venturi type 1, manifold type 4 experimental setup.
Figure 15.
The relationship between the Qa/Qw ratio and Ljet in a Venturi type 2, manifold type 1 experimental setup.
Figure 15.
The relationship between the Qa/Qw ratio and Ljet in a Venturi type 2, manifold type 1 experimental setup.
Figure 16.
The relationship between the Qa/Qw ratio and Ljet in a Venturi type 2, manifold type 2 experimental setup.
Figure 16.
The relationship between the Qa/Qw ratio and Ljet in a Venturi type 2, manifold type 2 experimental setup.
Figure 17.
The relationship between the Qa/Qw ratio and Ljet in a Venturi type 2, manifold type 3 experimental setup.
Figure 17.
The relationship between the Qa/Qw ratio and Ljet in a Venturi type 2, manifold type 3 experimental setup.
Figure 18.
The relationship between the Qa/Qw ratio and Ljet in a Venturi type 2, manifold type 4 experimental setup.
Figure 18.
The relationship between the Qa/Qw ratio and Ljet in a Venturi type 2, manifold type 4 experimental setup.
Table 1.
Features of the Type 1 (Model 25100) Venturi device used in the experiment.
| Water Inlet/Outlet | 1.27 cm |
| Air Suction Nozzle | 0.635 cm |
| Air Suction Capacity | 4-7 Nm3/h |
| Inlet Pressure | 4.92 kg/cm2 |
| Water Flow Amount | 400-1200 L/h |
| Full size | 95 mm |
Table 2.
Features of the Type 2 (Model 25152) Venturi device used in the experiment
| Water Inlet/Outlet | 1.905 cm |
| Air Suction Nozzle | 0.635 cm |
| Air Suction Capacity | 7.5-10 Nm3/h |
| Inlet Pressure | 2.04-5.098 kg/cm2 |
| Water Flow Amount | 1000-3000 L/h |
| Full size | 153 mm |
Disclaimer/Publisher’s Note: The statements, opinions and data contained in all publications are solely those of the individual author(s) and contributor(s) and not of MDPI and/or the editor(s). MDPI and/or the editor(s) disclaim responsibility for any injury to people or property resulting from any ideas, methods, instructions or products referred to in the content. |
© 2024 by the authors. Licensee MDPI, Basel, Switzerland. This article is an open access article distributed under the terms and conditions of the Creative Commons Attribution (CC BY) license (http://creativecommons.org/licenses/by/4.0/).
Copyright: This open access article is published under a Creative Commons CC BY 4.0 license, which permit the free download, distribution, and reuse, provided that the author and preprint are cited in any reuse.


