Preprint
Article

This version is not peer-reviewed.

Lessons Learned from Modeling COVID-19: Steps to Take at the Start of the Next Pandemic

Submitted:

26 November 2024

Posted:

28 November 2024

You are already at the latest version

Abstract

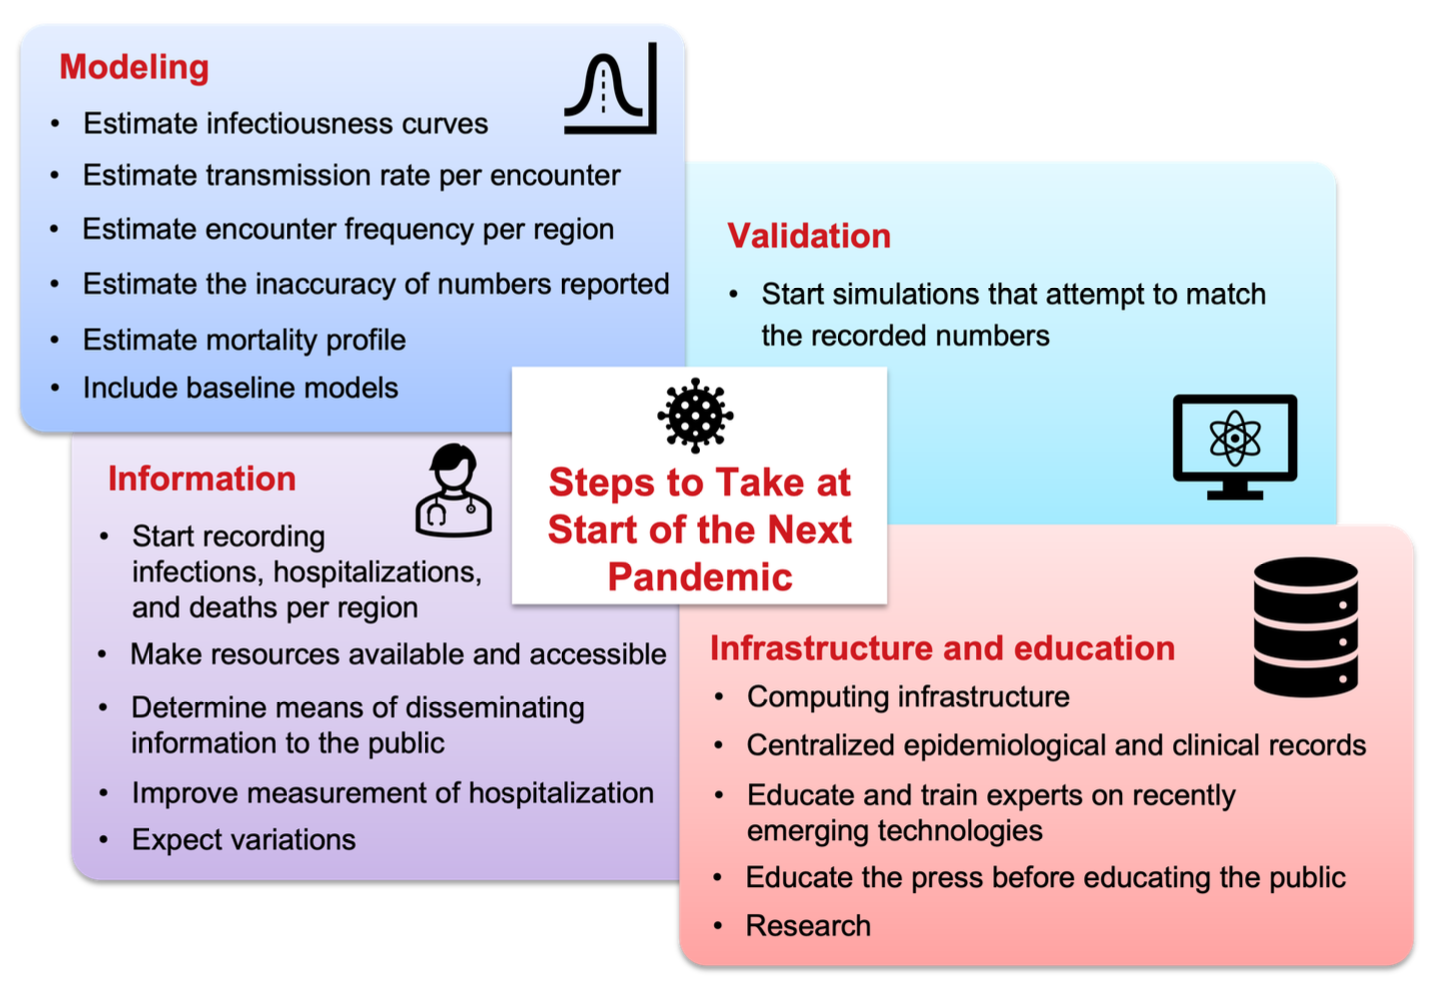
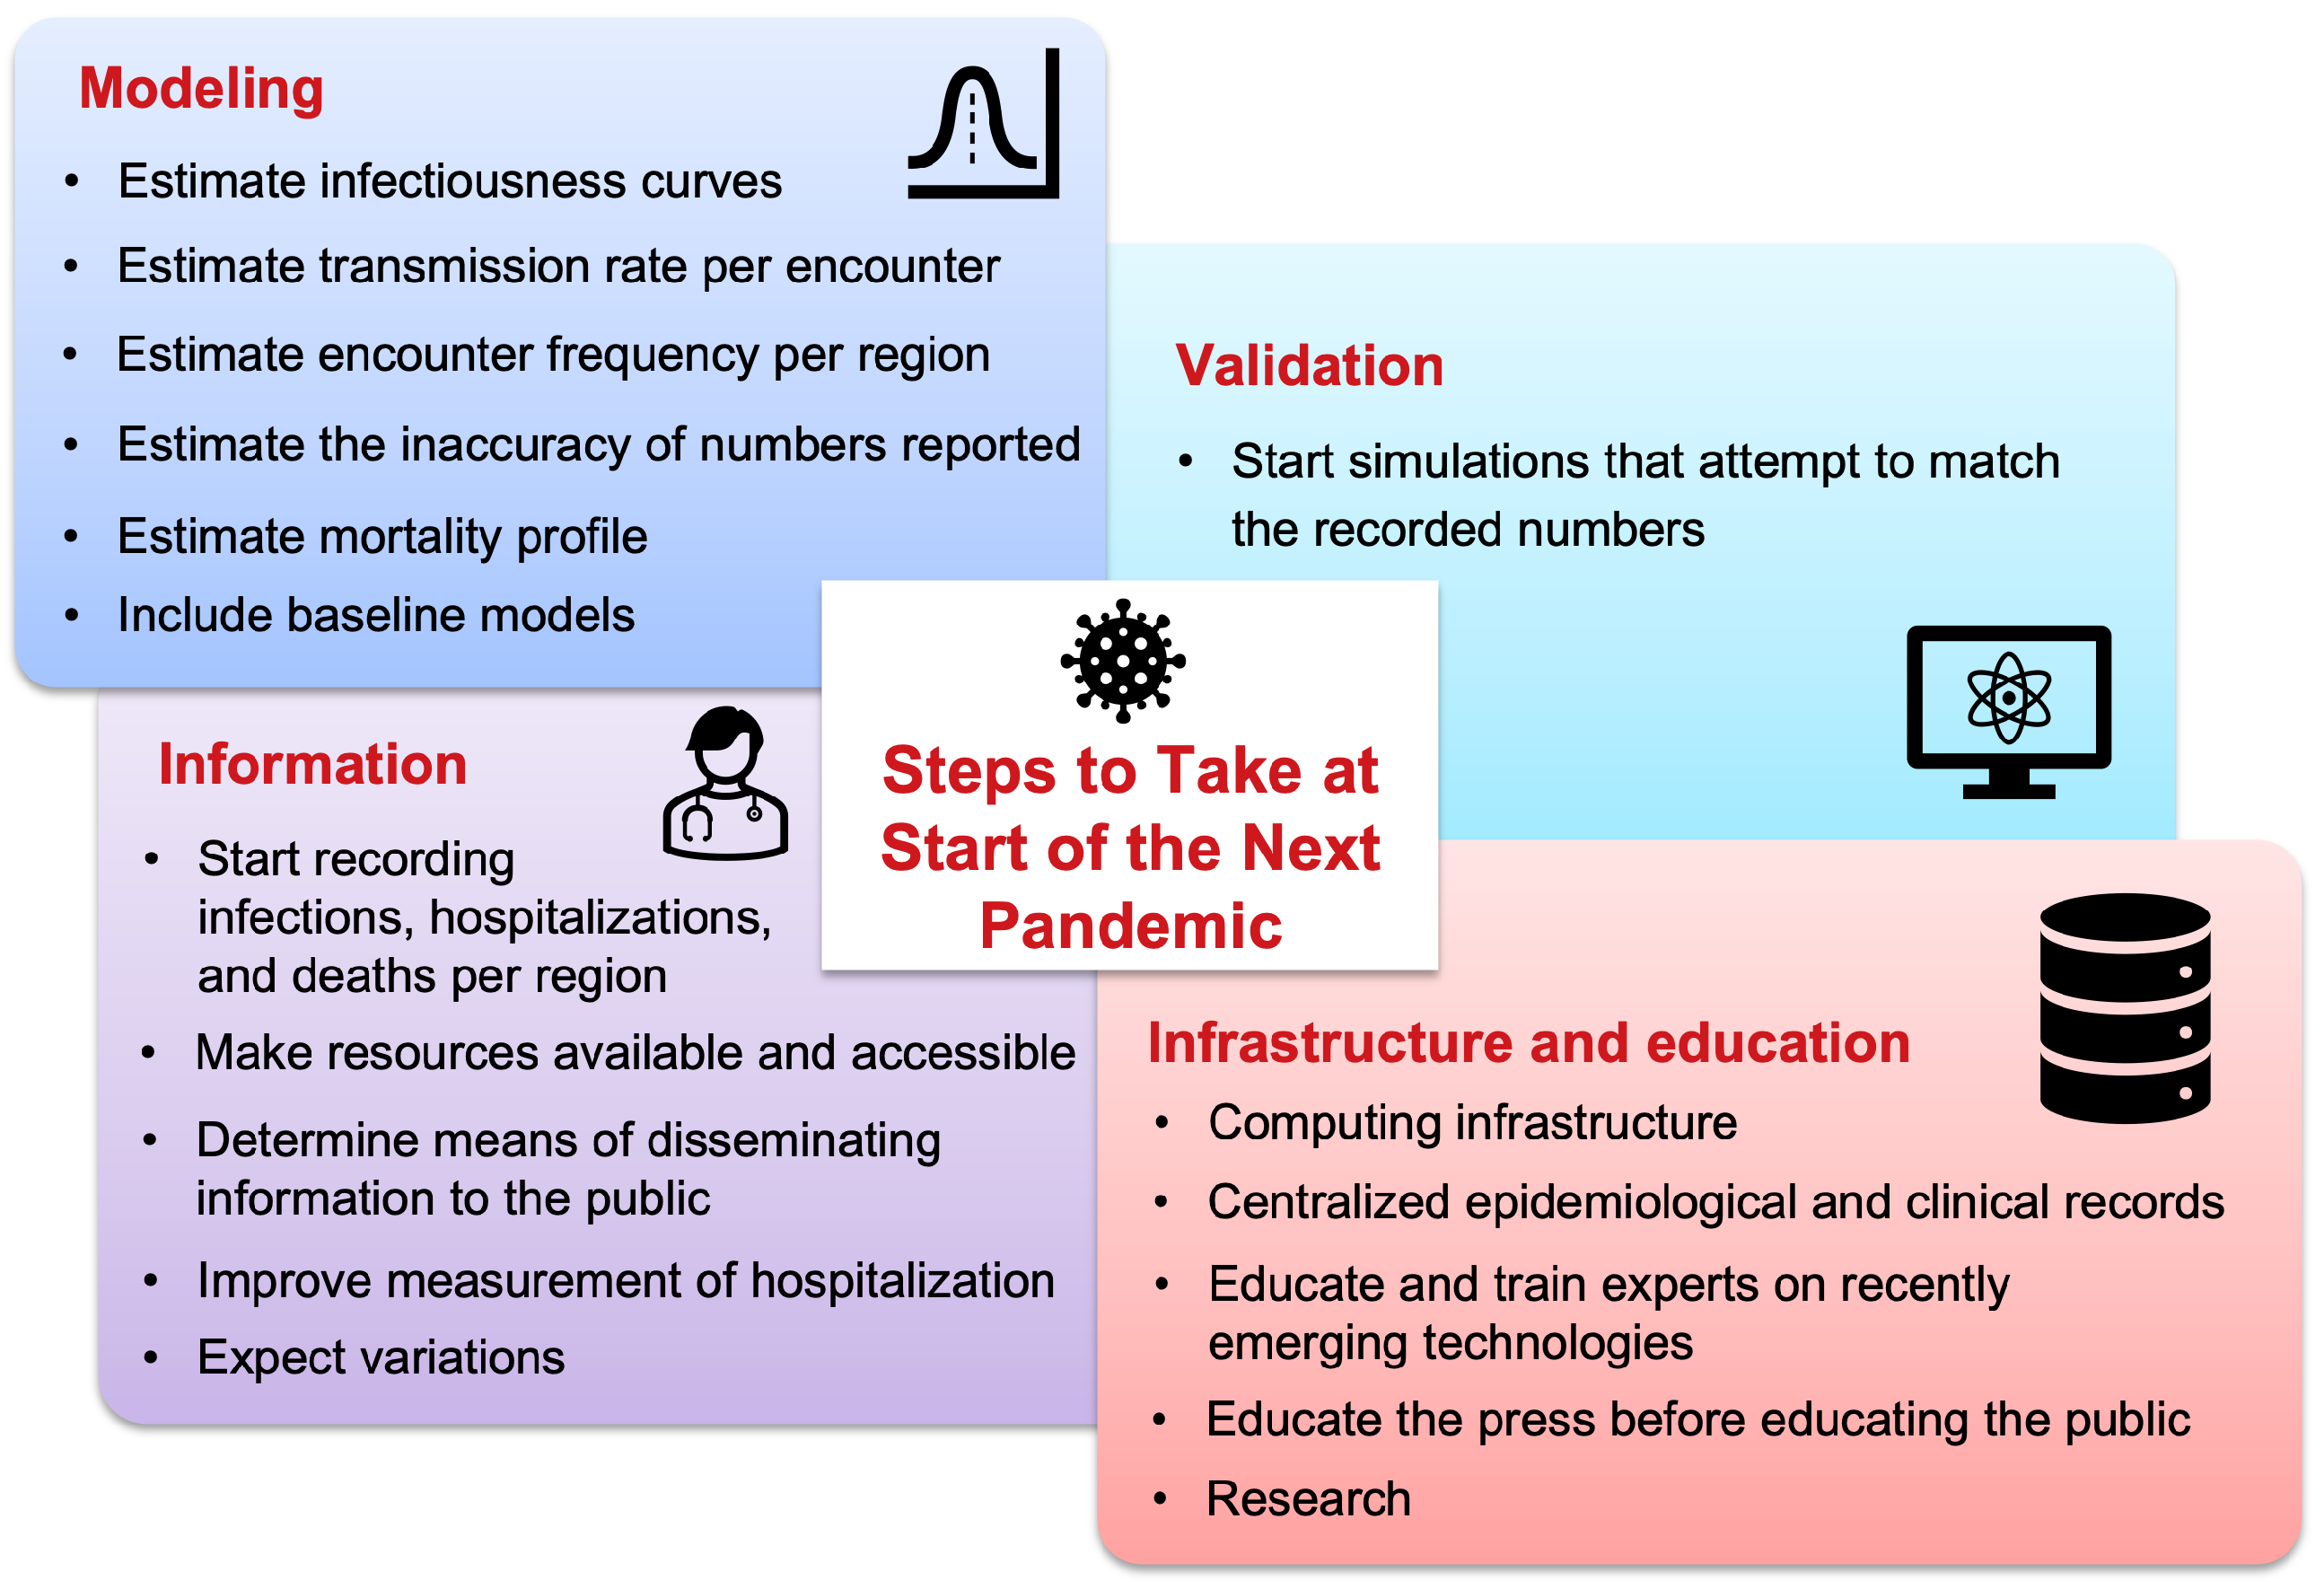
The COVID-19 pandemic spurred many computational modeling efforts. Many mistakes were made and many lessons were learned. This study attempts to list the key lessons learned from a modeling perspective, highlighting both the successes and shortcomings observed during the pandemic. Additionally, this work attempts to compile a set of critical steps and best practices that the authors believe would prove helpful and should be implemented before the start of the next pandemic to avoid inaccuracies in modeling pandemic scenarios. This will help to improve preparedness and ensure that computational models can more effectively guide decision-making in future pandemics.

Keywords: 
;  ;  ;  ;  

Introduction

During the COVID-19 pandemic, multiple mathematical and computational models were proposed. However, a few years later, the disease is no longer in the spotlight. A recent study [1] highlighted that most US CDC COVID-19 forecasting models were no better than a static case baseline or a simple linear trend forecast. This raises concerns about the utility of these models for formulating government policies. Many attempts to forecast the number of cases have turned out to be inaccurate, creating a need for highlighting the mistakes, drawing meaningful conclusions, and figuring out ways to improve future forecasting efforts. The present study attempts to compile critical steps that would prove helpful and should be taken before the next pandemic to avoid inaccuracies in modeling pandemic scenarios. The authors reason that if the enlisted steps are implemented, a much better understanding of the disease evolution could be captured and help avoid loss of lives. The following recommendations, summarized in Figure 1, are proposed by a team of computational modelers and represent their vantage of the difficulties and possible solutions to improve pandemic modeling attempts.

1. Record Infections, Hospitalizations, and Deaths per Region

Accurate models are essential for formulating policies that can safeguard both lives and livelihoods. However, developing precise forecasting models is an arduous task without reliable data. Collected data should be made public in a trusted location and multiple standardized formats such as CSV files, spreadsheets, and PDFs. During the COVID-19 pandemic, numerous organizations including the Covid Tracking Project [2], Johns Hopkins University, etc., released U.S. data in a systematic manner that was both machine and human-readable. However, how those numbers are recorded should be standardized across regions and countries for uniformity and handled with a professional level of quality control. A lack of standardization can result in data misinterpretation and incorrect conclusions. For example, the number of positive tests is often confused with the number of infections, which are not the same. Additionally, modern methods such as wastewater metric data can help in more accurately determining the proportion [3] of viruses in a population. Moreover, it is important to record numbers “consistently”, especially numbers for hospitalization and deaths that may be more accurate. During this last pandemic, there have been many inaccurate reports such as the number of cumulative hospitalizations which do not monotonically increase with time, or current hospitalizations higher than cumulative hospitalizations [2], and other inaccuracies such as mortality miscounting [4,5].

2. Estimate Infectiousness Curves

Infectiousness curves, often referred to as generation or shedding curves, represent the amount of virus generated by an individual over time, typically measured as a function of days since infection. These curves are critical for understanding how long and when an infected person is most likely to transmit a virus. They can be derived from direct measurement, estimations, or retrospective calculations. During the COVID-19 pandemic, there was significant uncertainty regarding the infectious period. For example, as late as May 26, 2020, i.e., many months after the start of the pandemic, the Department of Health Services (DHS) was still asking questions about the average infectious period during which individuals can transmit the disease [6]. This suggests that this information was either not widely available or available for very few and did not propagate to the general public or even to modelers engaging in the modeling exercise. One approach to estimating infectiousness is to follow a patient and record the amount of virus they shed as computed in [7]. Each patient may have their unique shredding curve and it may be highly useful to publish the overall distribution of these curves after anonymizing the patient information. In addition to direct measurements, infectiousness curves can also be obtained by retrospective calculations as done in some studies [4,8]. Overall, understanding and accurately estimating infectiousness curves is essential for improving epidemiological models.

3. Estimate Transmission Rate per Encounter

Each encounter between individuals may cause disease transmission, depending upon the disease’s transmission rate. If the probability of transmission per average encounter between two individuals is known, it becomes easier to calculate other related factors. In cases when no prior information is available, this number can be guessed, however it is possible to test the guessed number computationally. However, there are numerous modifiers for the transmission rates that include multiple parameters. For example, transmission rates may differ across regions due to variations in population density, regional climate, and environmental conditions such as ventilation or the presence of public transportation hubs. Such parameters should be enlisted and multiple estimated formulas should be constructed that can be later tested and merged. If information is unavailable, it is possible to make several educated guesses. It is important to note that the transmission rate may be related to the reproduction number (R0), a metric used by epidemiologists to measure infectiousness if the infectiousness, transmission rate, and number of encounters are known. While R0 is a useful higher-level product, particularly for those working with the SIR model, its components may be more comprehensible to less mathematically sophisticated audiences. Therefore, breaking the R0 number into its constituent factors is better for simulation purposes.

4. Estimate Encounter Frequency per Region

Since pandemics are primarily driven by interactions between individuals, it is important to keep track of these encounters. Even though the average number of encounters [9] and its standard deviation [10] are sufficient to start modeling, these numbers can quickly change as people start reacting to the pandemic. Therefore, it is important to develop methods that can estimate the level of encounters based on other factors. Examples from the COVID-19 pandemic include Apple Mobility data [11] that used the number of map searches in Apple devices to estimate how mobile people are, compared to a non-pandemic scenario. Another example is using household size [12] to estimate the number of interactions that an infectious person who is aware of their illness is having after deciding to avoid venturing outside their house. Such household size data is readily available from government census data.
Another important and recent piece of information that can be used to estimate encounter frequency is government decisions on local restrictions. During the COVID-19 pandemic, multiple local jurisdictions applied different rules on school closures, office shutdowns, restaurant restrictions, mask mandates, and mobility limitations. These restrictions were applied on different dates and enforced differently at times with varying degrees of rigor. To the best of our knowledge, there is no dataset regarding the same, neither is this piece of information available at one single location or listed in a centralized fashion. The closest example is the work by Forgoston et al. [13] which specifically targeted the state of New Jersey, US. An extension of the study [14] included all states in an easy format that can be converted to a behavior model. However, multiple versions of that work exist- after all, it is a large undertaking to handle during a stressful time. A similar endeavor was undertaken by Husch Blackwell [15]. However, significant processing is needed to be used in a computational model. A standardized and real-time publication of such data is highly important and therefore should be maintained, or at least supported, by the government. This may be helpful on its own to compare which strategies seem to reduce the effect of a pandemic. These enlisted elements are important to build accurate models that could estimate the number of encounters per day per region. Consequently, these models can be tested against observed data to determine which model best explains the observed numbers.

5. Estimate Mortality Profile

Estimating both the mortality table and mortality time is crucial for accurate disease modeling. The mortality table provides the death proportion of people infected with the disease, ideally stratified by age [16] and/ or other factors like sex, etc. The mortality time provides the time of death since infection. Mortality time and knowing the timing of deaths becomes especially important when one is computationally modeling the disease and wants to validate their models. Also, note that the “time of death since infection” is not the same as the “time of death since symptom onset”. Although it may be possible to provide information on symptom onset since infection, death should be reported as time since infection to support simpler models. Ideally, for modeling purposes, death should be reported as a probability density function that provides the probability of death as a function of “time since infection” and “age”, as demonstrated in a few studies [17]. This approach makes it possible to show it as a table or illustrate it graphically in an interactive manner [18] for less computationally inclined individuals.

6. Estimate the Inaccuracy of Reported Numbers

Reported numbers, even ones that are centralized, accessible, and highly scrutinized, have errors in them partially since data collection procedures are often not consistent, and secondly because there are multiple types of diagnostic tests, each of them having different accuracy and response times. Such errors can create distrust among the general public and even modelers. Therefore, reported numbers have to be audited continuously in various ways. At the onset of the COVID-19 pandemic, initiatives like the COVID-19 Tracking Project attempted to provide “grades of accuracy” to the numbers it gathered and reported per state. Such grades were useful for easily understanding that reported numbers may contain errors. However, few reported numbers are known to be inaccurate when representing an entire population. For example, the number of positive tests in a population does not scale up to represent the number of infections in a population due to factors such as test sampling strategy, test accuracy, and delays. Therefore, it is important to have correction factors to compensate for positive tests and infectiousness in a region. Even reported death numbers, which should be ideally accurate, appear to have errors [4] due to delays in reporting and the cause of death not being associated directly with the pandemic. Therefore, even mortality reports may need correction before entering into models. While modeling, there should be a clear distinction between modeled numbers – which represent virtual infections that should match the ground truth that will be reported in an ideal world, and observed numbers – which represent what we see and report. Modelers should investigate multiple correction strategies to fix the difference between modeled numbers and observed values.

7. Start Simulations that Will Attempt to Match the Recorded Numbers

All collected information should be verified using simulation to see how they match the observed reality. As much as it is tempting to forecast the progression of the pandemic, it is highly unlikely that models can accurately forecast it. Therefore, the focus should not only be on pandemic forecasting but also on explaining and attempting to verify, compare, and construct the assumptions made. Using ensemble modeling tools can help pinpoint errors in one’s comprehension of the disease and help improve it over time. The Reference Model for Disease Progression is an ensemble modeling tool [19] that attempts to gather all models and data, compare and match the numbers, and see what assumptions better fit the observed data that was collected. Note that this should be a continuous validation process so that the understanding improves over time. For example, the first model that was published during the first year of the pandemic [20] estimated the transmission rate per encounter to be 0.6%, while studies conducted during the second year concluded it to be about 2% per encounter. Note that the first publication was performed on data for 2 months starting April 1st, 2020. This study also concluded that a long infectiousness profile is dominant, while more recent publications, which took into account multiple simulation periods of 3 weeks repeating with different starts, have shown that a less contagious infectiousness profile provides better results and that the temperature may have an important role in transmission. Only additional simulations that took much more computing power have shown that both – a highly infectious profile, as well as a less infectious profile, have an influence. Reaching this conclusion required a lot of computing power. Thus, it is useful to repeat the modeling exercise several times on different periods/data to improve one’s understanding. Assumptions/models should be separated from data and the experiments should be repeated for different periods of time to determine which assumptions/models make more sense. Moreover, multiple simulations attempt to extract the invariant disease parameters, i.e., those parameters that do not change due to different behaviors. The more the data is accumulated, the potential for better calculating these parameters as well as understanding the disease increases. However, our ground hypothesis is that the phenomenon can be explained by analyzing the data. Although many modelers believe this is the case, it still needs to be proved in a way that can be perceived as credible by the public at large. Work that systematically checks the compatibility of the assumptions/models against data and reports to as many combinations as possible, can help in establishing this credibility.

8. Make Resources Available and Accessible

All collected information should be made available to the public electronically with as few restrictions as possible. The Creative Commons Zero (CC0) License is recommended while releasing data and codes since it removes all restrictions and makes it as close to the public domain as possible, thus providing incentives for reuse. Even seemingly permissive licenses, such as “Creative Commons Attribution-NonCommercial 4.0 International Public License” that prohibits commercial use or the “GNU General Public License” (GPL) that restricts reuse only under some conditions, should be avoided to allow the reuse of collected information in all sorts of ways. A competition between players should not diminish the incentives for another player, and not hinder its ability to provide useful information that will lead to a better understanding of the pandemic. Moreover, open-source tools and resources should be made readily available to support rapid data aggregation and subsequent modeling efforts. Fortunately, during the COVID-19 pandemic, many organizations made significant strides in providing open-access resources. For example, ad-hoc organizations [2], industry players such as Rescale High-Performance Computinga, Microsoft Cloudb, Amazon AWSc, as well as government-funded academic organizations like the MIDAS Networkd offered valuable tools and resources. However, greater centralization and improved accessibility of data and resources would be beneficial for future pandemics.

9. Improve Measurement of Hospitalization

For accurate hospitalization modeling from the beginning, it’s imperative to capture comprehensive epidemiological data. This includes detailed information on asymptomatic individuals, which requires contact tracing efforts and extensive testing with techniques such as wastewater metric [3]. Without this data, initial models may vastly underestimate the number of cases, leading to inadequate preparation and resource allocation. Ensuring that models account for asymptomatic spread is critical for predicting the true extent of the pandemic and accordingly planning hospital capacities. Another key action is to start real-time simulations that attempt to match the recorded numbers right from the pandemic onset. By continually updating models with incoming data, not only discrepancies can be identified but also corrected promptly. This iterative approach, where models are regularly compared against actual outcomes and adjusted accordingly, helps in refining predictions. Simulations should incorporate various parameters, such as hospital admission rates, length of stay, and ICU needs while adjusting dynamically as new data comes in. Thus, by embedding feedback loops within the modeling process, one can ensure that models remain accurate and relevant, thereby providing reliable guidance for decision-makers. By focusing on these key actions and data points, modelers can significantly improve the accuracy and reliability of hospitalization models from the outset of the next pandemic. This proactive approach will enable better preparedness and response, ultimately leading to more effective management of healthcare resources and better patient outcomes.

10. Include Baseline Models

A recent work [1] systematically analyzed the accuracy of US CDC COVID-19 case forecasting models, by first categorizing them and then calculating their Mean Absolute Percent Error (MAPE), both wave-wise and on the complete timeline of the COVID-19 pandemic in the US. Broadly, the study compared the estimates to government-reported case numbers, one another, as well as two baseline models wherein case counts remained static or followed a simple linear trend. The study highlighted that more than one-third of models fail to outperform a simple static case baseline and two-thirds fail to outperform a simple linear trend forecast.

10.1. For Government Officials

For government officials, the study recommended (i) a reassessment of the role of forecasting models in pandemic modeling and policy formulation, and (ii) raised concerns about “directly” hosting these models on official platforms, like the WHO, US CDC, etc, which are widely trusted by the general public and press. Without strict exclusion criteria, the public may not be aware that there are significant differences in the overall quality of these models. (iii) Current models can be used to predict the peak and decline of waves that have already been initiated and can provide value to decision-makers looking to allocate resources during an outbreak. Prediction of outbreaks beforehand, however, still requires “hands-on” identification of cases, sequencing, and data gathering.

10.2. For Researchers

For Researchers, the study recommended developing pandemic case forecasting models that are able to make accurate forecasts with a focus on increased Horizons i.e., at least 2-4 weeks ahead. To take an extreme example, a model that only forecasts one day in advance would have less utility than the model that forecasts 10 days in advance. Staffing decisions for hospitals can require a lead time of 2-4 weeks to prevent over-reliance on temporary workers, or shortages. They should also focus on data collection methodologies to address the lack of clean, structured, and accurate datasets that affect the performance of forecasting models, which the authors in the present manuscript also attribute as an important area.

11. Expect Variations

Even the best measurements are prone to errors and the best models are imperfect. However, the dynamics of an epidemic involve variations such as mutations that change parameters. Mutations can change infectiousness [21] and mortality and other factors. The spread of mutations may be seen as waves in the pandemic or may mix in the population. Variants such as Delta, the BA variants [22], and Omicron [23] cause additional challenges to compartmental modeling as they have partial “immune escape” so the proportion of the population that is Susceptible and Recovered in a SIR will need to be adjusted accordingly. They also change the R0, or the number of infections caused by the spread of a single infection, which also needs to be adjusted in compartmental modeling [24]. Lastly, because these properties are different by virus variant, machine learning models will become less accurate as they are trained on datasets from previous variants. Quickly adjusting model parameters to new variants is very important and requires accurate data on variant proportions in each population. In many cases, this data was under-reported, restricted, and difficult to obtain. It also was on average 1 month behind in reporting numbers by labs. Having accurate, timely, and accessible data about new variants is essential to modeling. Potential immune escape by variant also needs to be communicated to the public, as it may mean that previously infected or vaccinated individuals are no longer immune to infection and should take appropriate precautions.

12. Determine Means of Disseminating Information to the Public

Beyond creating physical portals for public access, it is also important to make the public aware of the limitations of models and the data collected. This can prevent people from overreacting based on the forecasts of a specific model in mind. It is important to educate the public about what can go wrong with the data and models and always be cautious with interpreting numbers. If a certain model suggests strict measures to be taken, it’s important to explain that the strictness is solely based on that model, and it is wise to show what other models suggest. Presenting a larger picture can help mitigate both public anxiety and indifference, which sometimes relies on guidance from the media or authorities. Moreover, when reporting model results it is important to trace back all information regarding the model and its data sources to ensure reproducibility before reporting.
Providing accurate information to the public at large is important to engender their trust and to help ensure they follow enacted policies. Early on in the pandemic, trusted authorities have made errors in order to affect behaviors. This was short-sighted and led to mistrust by the public later and created behavior changes. We are trying to focus on modeling in this manuscript and recognize that behavior is really difficult to model and has an effect on our modeling efforts. Therefore we call authorities worldwide to admit errors quickly and humbly. This may have a positive effect aside from modeling efforts. The actions described above require adequate infrastructure for efficient execution. Below are some key elements that will accelerate analysis:

12.1. Computing Infrastructure

Long-range forecasting as well as simulations require high-performance computing power. Fortunately, cloud computing is now readily available on demand today, with industry and government funding to access it. Nevertheless, software tools need to be modernized to effectively leverage these platforms. To give an example, this manuscript was written based on the experience earned while modeling an ensemble model [25] during the COVID-19 pandemic. The simulation “engine” that runs The MIcro Simulation Tool (MIST) [26] was imagined almost two decades ago when cloud computing had hardly started to appear. Newer simulation engines like covasim [27,28] and Vivarium [29,30] now exist. However, to date, none of them have been demonstrated to support an ensemble that can “explain” the pandemic. The Reference Model is currently the only ensemble shown to be capable of this protected by two US patents [31,32]. Thus, there is a need to boost the computing infrastructure, i.e., not only the hardware but also the software tools and its governing legal infrastructure.

12.2. Centralized Epidemiological and Clinical Records

A few centralized data infrastructures dedicated to shared databases or data lakes with public access would allow to storage of structured and unstructured data at any scale and enable organizations to perform different types of analytics, from dashboards and visualizations to big data processing, real-time analytics, and machine learning to guide better decisions. These infrastructures would allow scientists from all over the world to benefit from the collected information seamlessly, without struggling with data format differences, incomplete records, or inconsistent imputation methods.
We have seen examples of well-organized datasets with dashboards that visualize epidemiological data, such as cases, deaths, mortality risks, and vaccinations. Notable examples included epidemic indices on platforms like COVID-19 Observatorye, Our World in Data [33], and antigenic variances on Nextstrain [34]f and GISAIDg. However, what remains lacking is comprehensive clinical data, including detailed information about hospitalized patients, their health conditions, examinations, and other pertinent details. Essentially, the electronic health record of infected individuals contains invaluable scientific information on the disease course, particularly when related to the concept of digital twins. For instance, during COVID-19, the mathematical modeling community found viral load, antibody titers, and cytokine concentrations to be some of the most crucial data for developing models of the immune response to the pathogen. However, this critical information did not become available through scientific publications until 3-4 months after the pandemic began.
Setting up such uniform infrastructure faces several significant obstacles and needs careful consideration and balancing. Organizationally, different institutions and countries may have varying standards and protocols for data collection and storage, making integration challenging. Politically, there can be issues related to data sovereignty, where governments may be reluctant to share data freely due to concerns about privacy, security, or geopolitical advantages. Maintaining a centralized system requires robust governance frameworks and substantial coordination among diverse stakeholders as well as close legal scrutiny. A common agreement on the way to share and access information is crucial yet may be impractical. Without this, the full potential of centralized data infrastructures cannot be realized, and the global scientific community will continue to face barriers in their efforts to combat epidemics effectively. Nevertheless, the system has to make an effort to reach the best centralization possible within the limitations. Attempts have been made during the pandemic to centralize important data such as the MIDAS network attempt to centralize COVID papersh and the effort by DHS to summarize what is known about the pandemic [6]. However, those attempts focused on epidemiological data rather than clinical data that is more restricted. If clinical data is accessible in some way, that would considerably help model development.

12.3. Educate and Train Experts on Recently Emerging Technologies

The disease modeling community still relies on almost a century-old SIR model [35] as a base for many models. Newly emerging ideas like using an Ensemble of Models (popular in cross-domain fields like Machine Learning) are generally uncommon in the disease modeling community. Therefore, very few of them were created during the COVID-19 pandemic. Researchers should be educated on emerging technologies that will be heavily used in the next pandemic. Moreover, since many experts in disease modeling do not have an in-depth programming background, they should be trained in the use of existing computing tools such as version control, database systems, etc., that can help in the rapid and reliable exchange of information that is both traceable and reproducible. Moreover, organizing modeling drills, and Hackathons for modelers and researchers based on synthetic data, wherein both national and local governments also collaborate to learn their roles in data collection and reporting, can help create a system of trained researchers and government personnel who will be better prepared for the next pandemic.

12.4. Educate the Press Before Educating the Public

Beyond educating experts who are directly involved in the modeling process, an effort should be made to educate the general press, and subsequently the public about the capabilities as well as shortcomings of these models. This can be achieved through various channels, such as simple websites, articles on webpages that have high traffic, or educational TV programs. Though it is difficult to educate everyone, there should be more emphasis on educating the press that disseminates the information to large audiences. Broadcasting brief media interviews with modeling experts can help people understand how these models work, their limitations, and their accuracy. Presenting this information as simple conversations, without using jargon, will make it more accessible and helpful. Journalists tend to have fluent conversation and articulation skills compared to researchers and therefore may be able to convey the same to the public in an easy and appealing way. However, journalists should avoid glorifying models and particularly prevent the researchers from doing so (especially glorifying that their model is the best compared to others)– since the larger audiences might be misled and develop a bias for a particular model without realizing that a model’s forecasting accuracy tend to vary over time due to changes in external environments.

12.5. Research

Micro-simulation or agent-based simulations have been widely explored. However, implementing them for High-Performance Computing (HPC) infrastructures still needs more research. For example, new hardware combinations such as GPUs alongside recent compiler technology like Numba [36,37] or CUDA parallelization [38] need more exploration. Most modelers focus on improving simulation speed; however, an equally important area is to improve the assembling speed of ensemble models. For example, one ensemble model this paper is based on [19,39] is a prototype that started with the pandemic based on existing technology to model diabetes. To date, it took roughly 4 years – with over 70 model versions, and hundreds of CPU years of computing to reach conclusions. Early publications of the model were different, partially due to insufficient data. Yet, some necessary modeling techniques have appeared during the last years of development that improve understanding and change conclusions. One specific example is the need to repeat simulations with different start times of the cohort that changed the model conclusions. More research into this technology is needed as well as more tests. After the COVID-19 pandemic, modelers have more datasets to work with and can effectively study how to improve the data collection, modeling, and reporting cycle to be able to provide a more accurate view of the disease in a reasonable time in the next pandemic. It is still an open question of how fast one can come up with a good explanation of a disease since its outbreak. Another unanswered question is if we can and under what conditions/ constraints can apply this research to a future pandemic. More experimentation is needed to help answer such open questions.

Contributions

J.B. started and led the study. F.C. contributed a mortality model to the ensemble and contributed to the section on the centralization of clinical records. K.O. contributed hospitalization models to the ensemble and focused on lessons learned from hospitalization. A.C. and C.G. contributed to the section on lessons learned from modeling the pandemic. All authors have read, edited, and improved the manuscript. Other major contributors were invited and chose to opt out of the author list - they are acknowledged in the acknowledgment section.

Conflict of Interests Statement

Payment/ Service(s): J.B. reports non-financial support and others from Rescale, and MIDAS Network, others from Amazon AWS, Microsoft Azure, MIDAS network, from The COVID tracking project at the Atlantic, from John Rice and Jered Hodges.
Financial(s): J.B. declares employment from MacroFab, United Solutions, and B. Well Connected Health. The author had a contract with U.S. Bank/ Apexon, MacroFab, United Solutions, and B. Well. However, none of these companies had an influence on the modeling work reported in the paper. J.B. declares employment and technical support from Anaconda. The author contracted with Anaconda in the past and uses their free open-source software tools. Also, the author received free support from the Anaconda Holoviz team and Dask teams.
Intellectual property(s): J.B. has US Patent 9,858,390- Reference model for disease progression, and US patent 10,923,234- Analysis and Verification of Models Derived from Clinical Trials Data Extracted from a Database.
Other(s): During the conduct of the study; personal fees from United Solutions, personal fees from B. Well Connected health, personal fees, and non-financial support from Anaconda, outside the submitted work. However, despite all support, J.B. is responsible for the contents and the decisions made for this publication.
C.G., F.C., K.O., and A.C. declare no conflicts of interest.

Transparency

History of authoring this paper while in draft form can be accessed via this link: https://docs.google.com/document/d/1shsxwnzH5LFs3kyO_4dhR-kEh0Al_z9J4lslUpfzH_g/edit?usp=sharing

Acknowledgments

John Rice initiated the idea of this study and reviewed the first draft. Eric Forgoston helped substantially by providing valuable data on US states. Thanks to Robin Thompson, Alan Perelson, and Sen Pei for providing infectiousness models. Lucas Böttcher helped connect authors and contributed models and other supporting information. The MIDAS network helped to connect authors. The MIDAS Coordination Center is supported in part by NIGMS grant 5U24GM132013 and the NIH STRIDES program. Thanks to Guy Genin and Gregory Storch for providing useful information. Thanks to Rescale, Microsoft Azure, Amazon AWS, and MIDAS for providing the computing power in previous years to support the modeling effort.

References

  1. Chharia, A. et al. Accuracy of US CDC COVID-19 forecasting models. Frontiers in Public Health.
  2. The COVID Tracking Project at the Atlantic. https://covidtracking.com/. Accessed: 2024-9-6.
  3. Varkila, M. R. et al. Use of wastewater metrics to track COVID-19 in the US. JAMA Network Open. [CrossRef]
  4. Böttcher, L. , Xia, M. & Chou, T. Why case fatality ratios can be misleading: individual-and population-based mortality estimates and factors influencing them. Physical biology 17, 065003. [Google Scholar] [CrossRef]
  5. Schreiber, M. CDC coding error led to overcount of 72,000 Covid deaths. https://www.theguardian.com/world/2022/mar/24/cdc-coding-error-overcount-covid-deaths (2022).
  6. U.S. Department of Homeland Security. Master Question List for COVID-19 (caused by SARS-CoV-2) Weekly Report . https://www.dhs.gov/sites/default/files/publications/mql_sars-cov-2_-_cleared_for_public_release_20200526.pdf. 26 May.
  7. Ke, R. , Zitzmann, C., Ribeiro, R. M. & Perelson, A. S. Kinetics of SARS-CoV-2 infection in the human upper and lower respiratory tracts and their relationship with infectiousness. MedRxiv. [CrossRef]
  8. Hart, W. S. , Maini, P. K. & Thompson, R. N. High infectiousness immediately before COVID-19 symptom onset highlights the importance of continued contact tracing. Elife. [CrossRef]
  9. Del Valle, S. Y. , Hyman, J. M., Hethcote, H. W. & Eubank, S. G. Mixing patterns between age groups in social networks. Social Networks. [CrossRef]
  10. Edmunds, W. J. , O’callaghan, C. & Nokes, D. Who mixes with whom? A method to determine the contact patterns of adults that may lead to the spread of airborne infections. Proceedings of the Royal Society of London. Series B: Biological Sciences. [CrossRef]
  11. Mobility trends reports. https://covid19.apple.com/mobility. Accessed: 2020-11-7.
  12. United States Census Bureau: Explore Census Data. https://data.census.gov (2020).
  13. Forgoston, E. & Thorne, M. A. Strategies for controlling the spread of COVID-19. MedRxiv. [CrossRef]
  14. Forgoston, E. Stay at home orders by state for COVID-19: Spreadsheets containing start dates and relaxation dates for stay-at-home and closure orders by state in the USA. https://github.com/eric-forgoston/Stay-at-home-orders-by-state-for-COVID-19.
  15. Assisting businesses with COVID-19 orders and helping them effectively continue operations. https://www.huschblackwell.com/state-by-state-covid-19-guidance. Accessed: 2024-3-27.
  16. Bialek, S. 12 February 2019; 16. [CrossRef]
  17. Castiglione, F. , Deb, D., Srivastava, A. P., Liò, P. & Liso, A. From infection to immunity: understanding the response to SARS-CoV2 through in-silico modeling. Frontiers in Immunology. [CrossRef]
  18. Barhak, J. COVID-19 mortality model by Filippo Castiglione et. al. https://github.com/Jacob-Barhak/COVID19Models/tree/main/COVID19_Mortality_Castiglione (2021).
  19. Barhak, J. SimTK: The Reference Model for disease progression. https://simtk.org/projects/therefmodel.
  20. Barhak, J. The Reference Model: An Initial Use Case for COVID-19. Online: https://www.cureus.com/articles/36677-the-reference-model-an-initial-use-case-for-covid-19, Interactive Results: https://jacob-barhak.netlify. 2020. [Google Scholar] [CrossRef]
  21. Hart, W. S. et al. Generation time of the alpha and delta SARS-CoV-2 variants: an epidemiological analysis. The Lancet Infectious Diseases. [CrossRef]
  22. Nandakishore, P. et al. Deviations in predicted covid-19 cases in the us during early months of 2021 relate to rise in B.1.526 and its family of variants. 1.526 and its family of variants. medRxiv 2021–12. [CrossRef]
  23. Rufino, J. et al. Using survey data to estimate the impact of the omicron variant on vaccine efficacy against COVID-19 infection. Scientific Reports. [CrossRef]
  24. Natraj, S. et al. COVID-19 activity risk calculator as a gamified public health intervention tool. Scientific Reports. [CrossRef]
  25. Barhak, J. The Reference Model for COVID-19 attempts to explain USA data. MODSIM World 2023 -23 booth, Presentation: https://www.clinicalunitmapping.com/show/COVID19_Ensemble_Latest.html (2023). 22 May.
  26. Barhak, J. MIST: Micro-Simulation Tool to Support Disease Modeling. SciPy, Bioinformatics track, https://github.com/scipy/scipy2013_talks/tree/master/talks/jacob_barhak, Presentation also available at: https://jacob-barhak.github.io/old/SciPy2013_MIST_Presented_2013_06_26.pptx Video of Talk: https://www.youtube.com/watch?v=AD896WakR94 (2013).
  27. Kerr, C. Python vs. the pandemic: writing high-performance models in a jiffy. https://youtu.be/tG3K4Oq2W6M?si=VuZLFjnPYKYEOye0 (2021).
  28. Institute for Disease Modeling. COVID-19 Agent-based Simulator (Covasim): a model for exploring coronavirus dynamics and interventions. https://github.com/InstituteforDiseaseModeling/covasim (2024).
  29. Institute of Health Metrics and Evaluation (IHME). Vivarium: A python microsimulation framework. https://github.com/ihmeuw/vivarium.
  30. Deason, A. Small Potatoes: Microsimulation With Vivarium. PyTexas https://youtu.be/A7yWl4oeLhQ?si=Psceb1u_FlO-8sTm (2017).
  31. Barhak, J. Reference model for disease progression. https://ppubs.uspto.gov/dirsearch-public/print/downloadPdf/9858390 (2018). U.S. Patent US9858390B2.
  32. Barhak, J. Analysis and Verification of Models Derived from Clinical Trials Data Extracted from a Database. https://ppubs.uspto.gov/dirsearch-public/print/downloadPdf/10923234 (2021). U.S. Patent US20170286627A1.
  33. Mathieu, E. et al. Coronavirus Pandemic (COVID-19). Our World in Data.
  34. Hadfield, J. et al. Nextstrain: real-time tracking of pathogen evolution. Bioinformatics. [CrossRef]
  35. Kermack, W. O. & McKendrick, A. G. A contribution to the mathematical theory of epidemics. Proceedings of the royal society of london. Series A, Containing papers of a mathematical and physical character. [CrossRef]
  36. Lam, S. K. , Pitrou, A. & Seibert, 1–6 (2015)., S. Numba: A llvm-based python jit compiler. In Proceedings of the Second Workshop on the LLVM Compiler Infrastructure in HPC.
  37. Seibert, S. Evening of Python Coding 2021-09-21: Numba Demo. https://youtu.be/dl8JnpO7vBY?si=rf6jVXrzppAlKzJu, https://numba.pydata.org/ (2021).
  38. Nickolls, J. , Buck, I., Garland, M. & Skadron, K. Scalable parallel programming with cuda: Is cuda the parallel programming model that application developers have been waiting for? Queue, 2008. [Google Scholar]
  39. Barhak, J. The Reference Model: A Decade of Healthcare Predictive Analytics with Python. PyTexas 2017, Nov 18-19, 2017, Galvanize, Austin TX. Video: https://youtu.be/Pj_N4izLmsI Presentation: http://sites.google.com/site/jacobbarhak/home/PyTexas2017_Upload_2017_11_18.pptx (2017).
a
Rescale High-Performance Computing https://rescale.com/
b
c
d
e
COVID-19 Observatory https://covid19obs.fbk.eu/#/
f
Genomic epidemiology of SARS-CoV-2 with subsampling focused globally over the past 6 months: https://nextstrain.org/ncov/gisaid/global/6m
g
h
MIDAS network COVID papers https://midasnetwork.us/covid-19/
Figure 1. Key steps to be taken at the start of the next pandemic grouped into four categories: Modeling, Information, Validation, and Infrastructure and Education. These include estimating transmission dynamics, recording and disseminating data, running simulations to validate models, and enhancing infrastructure and training for effective response.
Preprints 140964 g001
Disclaimer/Publisher’s Note: The statements, opinions and data contained in all publications are solely those of the individual author(s) and contributor(s) and not of MDPI and/or the editor(s). MDPI and/or the editor(s) disclaim responsibility for any injury to people or property resulting from any ideas, methods, instructions or products referred to in the content.
Copyright: This open access article is published under a Creative Commons CC BY 4.0 license, which permit the free download, distribution, and reuse, provided that the author and preprint are cited in any reuse.
Prerpints.org logo

Preprints.org is a free preprint server supported by MDPI in Basel, Switzerland.

Subscribe

Disclaimer

Terms of Use

Privacy Policy

Privacy Settings

© 2025 MDPI (Basel, Switzerland) unless otherwise stated