
Submitted:
26 November 2024
Posted:
27 November 2024
You are already at the latest version
Abstract
The transition to renewable energy sources (RES) is crucial for achieving a low-carbon future and sustainable development. Reduction of greenhouse gas emissions is a priority goal in the European Union (EU) which actively promotes the development and use of renewable energy sources. This study evaluates the efficiency of EU countries in utilizing their geographical potential for wind and solar energy production. A two-stage radial network data envelopment analysis (NDEA) is proposed to estimate the efficiency of the utilisation of natural resources. The relationship between environmental potential and installed power capacity is evaluated in the first stage. In the second stage, the actual production from installed capacity is analysed. The efficiency trends over time are investigated. This approach offers a comprehensive assessment by considering both technical performance and environmental constraints. The results reveal that the development of alternative energy sources and the efficiency of the use of installed power capacity are not always in line with environmental conditions. The article's results highlight the necessity of a comprehensive approach to power capacity development basing on the renewable energy sources.
Keywords:
renewables
; RES
; efficiency
; network DEA
; wind power
; solar power
; energy
; EU
; resources
1. Introduction
Today, global greenhouse gas emissions from energy (electricity, heat, and transport) are more than 73% [1]. For this reason, the 7th Sustainable Development Goal – which includes the issue of sustainable energy – has been of great interest for years. Many countries are making significant efforts to transition towards 100% renewable energy sources for their electricity needs. The European Union (EU) announced the European Green Deal in 2019, intending to become a net zero emitter of greenhouse gases by 2050. Transformation of the energy sector is the most critical element in the EU’s net zero ambitions [2]. The development of renewable energy policies and strategies, as well as the current advancements in this field, are the subjects of extensive research and reporting. There has been a systematic increase in the number of articles and reports addressing this topic, which includes various comparative analyses between countries. Some opinions suggest that with current energy production and storage technologies, considering the energy and climate crisis alongside armed conflicts, we cannot meet energy demand without nuclear power or hydrogen. Nevertheless, wind and solar capacity have been growing the fastest in recent years. Analysing the data until 2023, the record was reached in 2022: 245 TWh of solar generation and 312 TWh of wind, which meant that these sources represented 12% of global electricity [3]. These sources are also believed to be the most environmentally neutral.
The development of energy production from renewable sources is determined by geographic, demographic, economic, and political factors. With limited resources, one of the challenges facing decision-makers is to choose the most beneficial technology in the long term from the available alternatives. The evaluation of renewable energy sources could be carried out in four categories: economics, technology, environment, and society with the following criteria: cost (investment, maintenance, operation, and others), efficiency, environmental impact (pollution, land use, etc.), job creation, safety [4]. The country's renewable resources could be assessed based on capital investment, electricity generation, environmental performance index (EPI), and access to clean fuels and technologies for cooking [5]. According to Wind-energy potential in Europe 2020-2030 [6], the potential of energy source development can be distinguished among theoretical, technical, economic, and market. It has been emphasised that energy generation from a given source depends on the geographical location, but it is also influenced by macroeconomic factors, industry, and the structure of energy consumption [7].
In the case of solar and wind energy, geography strongly impacts the assessment of technology and its efficiency. The environmental conditions that prevail in the planned location are of great importance for the functioning of the future wind or photovoltaic farm. Nevertheless, considering theoretical potential, studies have shown that many countries are well positioned to take advantage of wind and solar energy despite different wind power fluctuation distributions or heterogeneity of global horizontal irradiance [8].
The purpose of the article is to evaluate the efficiency of the use of the location potential of European countries for sustainability and climate neutrality by comparing the theoretical wind resources and solar irradiation and the mix of energy production of the countries. The data envelopment analysis (DEA) is employed as the primary research method. DEA is an operational research method that solves a linear programming task to evaluate the relative efficiencies of elements from a set of objects called decision-making units (DMU). DEA has gained recognition and has been frequently used in studies on sustainability, eco-efficiency, and energy efficiency, including renewable sources. Reviews of articles on DEA applications in sustainability [9,10,11] have revealed a prevalent practice of juxtaposing regions or countries based on factors such as capital, labour force, and energy consumption on the one hand and GDP and CO2 emissions + the other hand. These comparative analyses typically employ basic DEA models. Regarding energy generation efficiency, most studies on photovoltaic panels or wind turbine performance focus on micro-analysis and assess the power efficiency of individual farms.
This work adopts a two-stage radial network data envelopment analysis (NDEA) to estimate the efficiency of utilisation of natural resources at the country level. NDEA (also under the name multi-stage, multi-level, hierarchic) addresses the limitations of the conventional DEA that treats efficiency measurement as a ‘black box’ [12]. It is an extension of traditional DEA that considers the structure of the processes inside DMU and the intermediate products and sub-processes [13]. It provides information about the efficiency of subsystems within a given unit as well as its overall efficiency. The ability to capture the complexity and interconnections among processes and to ensure that each component of the system is operating efficiently is essential when intermediate products and byproducts impact the efficiency of the entire system [14]. NDEA contributes to a deeper understanding of the multifaceted nature of resource management efficiency and its implications for achieving sustainable development goals [15]. The two-stage system is the simplest network structure and divides DMU processes into two phases, assuming that the influence of some inputs on the outputs might be indirect. The exogenous inputs are utilised in the first phase to get the intermediate products (inputs) for the second phase to produce the final outputs [12]. The two-stage DEA model and its variants, as well as more advanced NDEA models, have been successfully applied in many energy and renewables studies. The review of the relevant research is summarised in the literature review section. However, the potential of NDEA appears to be still unexploited. In this work, two-stage DEA has been employed, firstly the relationship between environmental potential and installed power capacity has been evaluated, and then production from installed power has been analysed. The approach offers a more comprehensive and accurate evaluation of renewable energy investment efficiency, taking into account both the technical performance and the environmental constraints. The efficiency trends over time are also investigated.
The contribution of this article is three-fold. A methodological contribution is the proposal of a network DEA method framework for assessing the efficiency of using natural resources in the context of developing renewable energy technologies. The empirical contribution is the assessment of the compatibility of the development of renewable resources (RES) technology with the environmental potential of EU countries, indicating benchmarks and implications. The background to the analysis is an in-depth review of articles indicating recent advances in the DEA efficiency assessment of renewable energy sources.
The article is organised as follows. First, it presents the review of the papers on the assessment of countries in terms of energy transformation achievements by DEA and applications of the network DEA model in the literature on energy efficiency. Then, it introduces the DEA models used in this study. Next, the results of the computational analysis are presented. The article ends with conclusions, policy implications, and suggestions for future research directions.
2. Literature Review
The awareness of the necessity, but also the benefits of the development energy generation from renewables for long-term sustainability and circularity has been evoking huge interest from scientists and practitioners in recent decades [16]. Clean energy aspect has become a core element of every innovation aspiring to be seen as responsible and sustainable [17,18]. In energy efficiency analyses, DEA is commonly used as the primary performance assessment method. Scientists point to the applicability and adequacy of DEA in the energy sector, including renewable energy and environmental management or sustainability assessment in general. The review of DEA applications in the renewable energy source sector shows the variety of approaches and data considered. The purposes and scopes of the papers on energy efficiency by DEA make it possible to cluster them into several groups. Regarding the application areas, papers could be categorised into nine groups: environmental efficiency, economic and eco-efficiency, energy efficiency issues, renewable and sustainable energy, water efficiency, energy performance, energy saving, integrated energy efficiency, and others [19]. However, considering the object of the analysis, the following categories could be distinguished: (i) country/region-level performance analysis, (ii) sector/industry/enterprises-level analysis, (iii) efficiency of individual power farms, and (iv) others (e.g., renewable energy plans to be developed [20], supply chains [21]). The most popular division of approaches is to distinguish the objects of analysis: the eco-efficiency of countries and the technical efficiency of power plants [22].
Considering the purpose of this paper (assessing European countries' efficiency of renewable energy potential utilisation by NDEA) the relevant works on renewable energy efficiency by DEA have been divided into 3 groups based on objects (DMU), DEA models, and variables under consideration into: (i) conventional DEA for energy and renewable energy sources in countries’ comparisons, (ii) NDEA for energy and renewable energy research for geographical comparisons in a broader sense (countries, districts, provinces, regions etc.), and (iii) DEA (conventional and NDEA) for assessing the impact of geographical location. A review of recent works in distinguished groups is presented in the following sections: (2.1) DEA in cross-country analysis of energy efficiency, (2.2) NDEA in assessing energy efficiency, and (2.3) DEA in assessing the impact of geographical location on energy efficiency.
The period of analysis was selected according to the European Green Deal announcement in 2019 and ranges from a year before i.e. 2018 to 2024; the scope includes papers indexed in the Web of Science, Scopus and IEEE databases. The search query with obligation terms renewable(s) and DEA (data envelopment analysis) and energy or electricity or power and selected synonyms from the set: evaluation, assessment, analysis, effectiveness, efficiency, productivity, performance was employed.
2.1. DEA in Cross-Country Analysis of Energy Efficiency
Selected recent works on the renewable energy efficiency analysis of countries using the DEA method are summarised in Table 1. The objects of analysis, along with employed DEA models and variables under consideration, are indicated. The list excludes works that deal broadly with the problem of country comparisons, where energy efficiency is one of the elements of countries’ general sustainability assessment, e.g. [23], circular economy, e.g. [24], but also on the contrary, focused on a narrow aspect of assessment, e.g. electric vehicles [25].
Conventional DEA models extended with an explanatory regression stage are the most popular approach to investigating energy efficiency. In addition to cross-country comparisons cited in Table 1, it is worth mentioning studies on the assessment of provinces or regions, the most numerous of which are represented by China [44,45,46] but also India, e.g. [47], Turkey, e.g. [48], Vietnam, e.g. [49].
Literature analysis, including broader review papers on sustainable development and eco-efficiency, i.e. [9,10,11,19,50], as well as cited in Table 1 papers with their summaries of input and output variables of previous research, allows the conclusion that in cross-country energy efficiency evaluation the most common comparison criteria are capital, labour force, total energy consumption on one hand and GDP and CO2 emissions. Some studies analyse the productivity of installed capacity or the return on investment in RES. A significant group of papers include the financial perspective, considering the cost in relation to the achievements of the energy transformation. Variables taken into account highlight the relationship between innovations and R&D expenditures.
Concerning research methods following DEA models are mainly applied: (i) basic DEA, (ii) DEA with Malmquist index or window analysis to catch time changes, (iii) hybrid models combining DEA with other approaches (e.g., OLS regression/Tobit models, AHP, TOPSIS, artificial intelligence, fuzzy set), often referred to as two-stage.
2.2. NDEA in Assessing Energy Efficiency
Table 2 contains selected recent papers on energy efficiency and renewable energy sources by NDEA. The set includes papers on countries' energy efficiency but also regions, states, and provinces. The broader review results from the smaller number of works using network DEA models.
Network DEA is widely applicable to eco-energy efficiency and while the traditional DEA method evaluates the input-output process as a ‘black box’, NDEA allows it to look inside and assess the subprocess with additional inputs and outputs. It is believed to be a more appropriate approach to manage existing internal interactions. The works included in Table 2 extended the efficiency assessment of the transformation of resources such as labour, capital, and cost into energy production/consumption along with pollutants by considering additional variables describing the quality of life expressed by GDP or health indicators or transmission losses. Among the cited works there are analyses of transformations described by only a few main determinants (e.g., labour, capital, energy into GDP, and main pollutant CO2), considering an extended collection of variables (e.g., health expenditure and survival rate, tuberculosis rate, PM2.5 air pollution, mortality rates) or presenting a technical perspective (e.g., RES and non-RES capacity into power from RES and non-RES, length of transmission lines, losses). It could be argued that the potential of the NDEA method seems to be unrecognised and underestimated.
2.3. DEA in Assessing the Impact of Geographical Location on Energy Efficiency
Considering the assessment of energy efficiency with limitations or benefits resulting from environmental conditions, including geographical location, most studies focus on micro-analysis of photovoltaic or wind turbine sites and assess the power efficiency of individual farms. Selected works from recent years are presented in Table 3.
The works cited in Table 3 indicate the successful application of the DEA method to assess the location in a country or region. The list of common criteria used in reviewed relevant studies included the data resulting directly from the geographical location (e.g., wind speed, probability of natural disasters, irradiance, accessibility, water depth), social aspects (e.g., electricity demand, population), and technical criteria (e.g., cost of construction, generated energy, avoided CO2, distance to transmission lines, losses).
The presented review does not exhaust the possibilities of categorizing works in the field of application of the DEA method to assess the change towards zero-emission economies. It is also worth mentioning the emerging postulates to enhance the robustness of the overall assessment by hybrid models that integrate DEA and AI algorithms and leveraging advantage of the methods: the interpretability and transparency with the capabilities of detecting patterns, self-learning, and handling large data sets.
3. Research Methods and Data
Data envelopment analysis was developed by the A. Charnes, W.W. Cooper and E. Rhodes [73], who extended M.J. Farrell’s [74] concept of the best practice frontier. DEA is an operational research method widely used in management science to measure the relative efficiency of n units called decision-making units (DMUs) from a homogenous set of comparable entities. It is a technique that assesses the process of transforming multiple inputs ( ) into multiple outputs () (Figure 1a) solving linear programming tasks for each DMU (), where represents the weights and indicates the benchmarks and is the radial efficiency score of jth DMU:
Network DEA is an extension of the traditional DEA approach, permitting the consideration of the internal process structure and the examination of intermediate products and subprocesses [13]. The enhancement of network DEA is attributed to R. Färe and S. Grosskopf [75,76], who introduced the term and developed the concept in the context of analysing complex systems [77]. However, the idea of the division of a production system had been discussed in the literature earlier in the 1980s and 1990s e.g., in studying the performance of US Army recruitment [78] or in measurement of the efficiency of a two-stage agricultural production system with intermediate products [79].
Network systems can have various structures. It is important to gain information about the efficiency of selected areas within a given unit as well as its overall efficiency. The ability to capture the complexity and interconnections within production processes and ensure that each system component is operating efficiently is essential when intermediate products and by-products impact the efficiency of the entire system. Network DEA helps to identify where resources can be reallocated within the system to improve efficiency, as it might highlight underperforming or over-utilised stages of the production process.
Network DEA models are known by several different names in the literature, depending on the structure of the model and the research goals, reflecting their development history. Two-stage DEA is one of the simplest and is used to model processes that can be divided into two stages, where the outputs from the first stage are used as inputs to the second stage. Multi-stage (multi-level, serial) DEA is a generalisation of the two-stage approach, encompassing several sequential stages that are connected in a network. Parallel DEA enables the consideration of the combined impact of parallel subprocesses that operate simultaneously and independently on the DMU efficiency. Hierarchical DEA is used in situations where the DMU’s subprocesses have a hierarchy structure [77]. Supply Chain DEA is a specific case of Network DEA, focused on the analysis of performance within the supply chain. It takes into account the flows of materials, information and resources between different entities, which is crucial for assessing the efficiency of the entire chain [80]. Suppliers, manufacturers, distributors and retailers can also be analysed in terms of their performance and impact on other units in the chain. Dynamic NDEA is used to analyse the efficiency over time [81]. It models the DMU as a system consisting of many internal subprocesses but also considers time-varying data and the transfer of resources from one period to the next.
Selected examples of network structures are illustrated in Figure 1 (serial, parallel, parallel-serial, hierarchical, with feedback, dynamic NDEA, mixed DEA model). Just like the basic DEA models, network models are constantly evolving, and new techniques and applications are being developed to improve analysis accuracy. There are network DEA models with undesirable factors [82], and stochastic network DEA that could handle uncertainty in the data [83]. To deal with uncertain data fuzzy [84] or rough [85] network DEA models have been developed. The other extensions are multi-period network DEA models with feedback [86].
In the article, the environmental potential of renewable energy in the country was decomposed into two aspects: capacity in relation to natural resources and energy production in relation to capacity. It makes the simplest two-stage structure of network systems can be employed, where the outputs from the first stage are intermediate products and in the second stage are used to produce the final outputs of the system. The model engaged is an output-oriented adaptation of [89] with solution by (Emrouznejad & Amin, 2009) to ratio data as follows:
The is ith input, is kth intermediate, and is rth output of DMUj for . To account for variable returns to scale set to 1.
To take into consideration the diversity of countries and the unequal needs (e.g., the number of citizens), an assessment of both capacity and production per capita was studied. However, to meet the convexity assumption, absolute values were used, and additional inputs (area, population) were introduced into the model to include indicators in the form of ratios.
In the model, the average expansion rate of outputs is calculated . The efficiency for the first and second stage and the overall efficiency are defined as follows:
To measure changes over time, in periods 1 and 2, the Malmquist index was calculated. Malmquist index decomposes changes in efficiency into frontier-shift (covered efficiency in period 2 with respect to period 1 frontier , efficiency in period 2 with respect to period 2 frontier , efficiency in period 1 with respect to period 1 frontier , and efficiency in period 1 with respect to period 2 frontier) and catch-up effect (efficiency in period 2 with respect to period 2 frontier and efficiency in period 1 with respect to period 1 frontier ). A value greater than 1 indicates progress in total factor productivity, and less than 1 indicates a decrease. The Malmquist index is calculated using the following formula:
Figure 2 presents the structure of the adapted network system. To determine the potential wind power, the mean wind speed in 10% windiest areas () was considered since the power of the flowing air is directly proportional to the air density − , the area covered by the rotor blades − , and the cube of the wind speed − : . The photovoltaic power potential ( was expressed in Wh/m2 by Global Horizontal Irradiance (GHI). To include the information on the size of the country: population () and land area () are included. Intermediate effects represent wind capacity () and PV capacity (. The results are wind energy generation () and solar power generation (. The efficiency trends over time in periods t = 2018 and 2022 are investigated. Information on the basic and auxiliary data used in the NDEA model is presented in Table 4.
The study covers 32 countries from 2018 to 2022. In the last 5 years, there has been significant progress in the development of solar energy and a moderate increase in wind energy. Taking 2018 as the base value, the average power value of PV installations in the analysed set in 2022 is 468%, and 145% for wind power. Table 5 shows the correlations of variables in 2022, and Table 6 presents basic statistics.
The development of renewable energy sources is consistent with the size of the country measured by population, and to a lesser extent with area. It can be observed that solar and wind conditions are inversely related. The lack of wind conditions is often associated with favourable sunny conditions and vice versa. Moreover, it can be seen that both wind farms and solar farms have high-capacity utilization rates, although wind farms outperform solar farms. While the development of renewable energy sources is more compatible with wind conditions, it is not as dependent on solar conditions. The absolute values of photovoltaic and wind power as well as solar and wind energy generation are correlated, but when relative values (per inhabitant) are considered, there are no such relationships.
Based on the analysis of the minimum, maximum, and standard deviation values, it can be concluded that countries share similar environmental conditions. However, their utilisation varies. Wind energy potential and the amount of wind energy produced per capita are the most diverse. These variations are depicted in Figure 3, highlighting the differences between countries.
The leaders in wind energy are the northern countries: Denmark, and Sweden, but also Norway, and Finland. Considering solar power: Netherlands Germany, Spain, Greece, and Belgium.
4. Results
Table 7 displays the efficiency scores estimated by traditional one-stage DEA and two-stage DEA.
The DEA method has an advantage in that it considers all the results obtained and input data simultaneously. In other words, it selects the units that perform the best based on a given criterion. On average, the first stage of the DEA method, which evaluates the potential of the environment, has a lower effectiveness of 0.6 compared to the second stage’s 0.8 effectiveness. When considering the NDEA in 2018, the following leaders were indicated: Cyprus, Czechia, Finland, Germany, Ireland, Slovakia, and the United Kingdom. In 2022, the group of countries that scored 100% were: Germany, Hungary, Ireland, Latvia Netherlands, North Macedonia, Norway, Slovakia, United Kingdom. It can be noted that many countries, including Germany, Ireland, Latvia, North Macedonia, Norway, Slovakia, and the United Kingdom were rated as fully effective in both periods. Considering changes in time, in most cases, there was an increase in relative efficiency.
Table 8 shows the correlations between scores obtained by NDEA models and standard DEA models in 2018 and 2022.
A high correlation was observed in the results in 2022 and 2018 of total efficiency, but also of the first stage in relation to classic DEA. Additional conditions cause the efficiency calculated by network DEA to be lower. The correlation indicates that there is no consistency in the assessment of the efficiency of the second stage in 2018, and there are no proportional changes in energy production from panels and turbines (second stage) between 2018 and 2022. A histogram of the results of individual stages is shown in Figure 4.
5. Discussion and Conclusions
The article proposes an assessment of the location of countries for the development of solar and wind technologies and the level of their use by the NDEA. As a result, energy production was evaluated in relation to installed capacity and geographic location, which is expressed in wind density and irradiation. The need for clean energy has been taken for granted. Therefore, policies and laws or distance to transmission lines were excluded from the analysis as it was assumed that each country should adapt them to future needs.
The issue of sustainable energy is a growing concern, and achieving carbon neutrality requires a proper strategy. By taking location-related factors into account, we can broaden our perspective and develop sustainable progress. Multi-stage DEA has advantages over conventional DEA as it assesses both potential development and actual implementation. This study proposes a network DEA model that utilises geographic location potential and assesses wind and solar potential and energy production in European countries. The combined assessment of wind and solar potential is compatible with bidirectional development, including hybrid solar power plants that compensate for the lack of solar energy in winter months with wind energy. It is important to note that this study doesn't refer to hydropower due to its controversial nature and limitations.
Presented study has important policy implications. It shows that EU green energy policies may be tailored to the specific situation and the potential of each member state, based on the objective study of their relative efficiency and progress. By focusing on the most suitable strategies for each country, the overall EU transition to green energy can be faster, more efficient, and more equitable than in the case of one-size-fits-all approach. Regular monitoring and evaluation of countries’ performance with methods such as NDEA allow for evidence-based policy adjustments that respond to the often fast changing environmental, economic, and technological circumstances.
Systematic evaluation of countries is crucial as renewable energy sources have high dynamics of changes. Future studies should consider the complex internal structure of the network DEA model. While DEA is generally viewed as an objective method, as shown, the final ranking of efficiency is influenced by the adopted model. Additionally, extending the analysis to developing countries is worth considering as they need better policies and support for sustainable progress. Interesting direction of future development is to combine DEA with machine learning methods to exploit big data sets for advanced forecasting.
Author Contributions
Conceptualization, J.N., E.C. and L.N.; methodology, J.N, E.C. and L.N.; data curation, E.C and L.N.; validation, J.N. and E.C.; formal analysis, J.N. and E.C.; writing—original draft preparation, J.N., E.C. and L.N.; writing—review and editing, J.N., E.C. and L.N.; visualization, E.C.; supervision, J.N. All authors have read and agreed to the published version of the manuscript.
Funding
This research was conducted in the framework of the projects No. WZ/WIZ-INZ/3/2023 and WZ/WIZ-INZ/2/2022 of Bialystok University of Technology and financed from the subsidy granted by the Minister of Education and Science of the Republic of Poland.
Data Availability Statement
Publicly available datasets were analysed in this study.
Conflicts of Interest
The authors declare no conflicts of interest.
References
- Ritchie, H.; Roser, M.; Rosado, P. CO₂ and Greenhouse Gas Emissions. Our World Data 2020. [Google Scholar]
- Nazarko, Ł.; Žemaitis, E.; Wróblewski, Ł.K.; Šuhajda, K.; Zajączkowska, M. The Impact of Energy Development of the European Union Euro Area Countries on CO2 Emissions Level. Energies 2022, 15, 1425. [Google Scholar] [CrossRef]
- Wiatros-Motyka, M. Global Electricity Review 2023; Ember, 2023.
- Budak, G.; Chen, X.; Celik, S.; Ozturk, B. A Systematic Approach for Assessment of Renewable Energy Using Analytic Hierarchy Process. Energy Sustain. Soc. 2019, 9, 37. [Google Scholar] [CrossRef]
- Kara, S.E.; Ibrahim, M.D.; Daneshvar, S. Dual Efficiency and Productivity Analysis of Renewable Energy Alternatives of OECD Countries. Sustainability 2021, 13, 7401. [Google Scholar] [CrossRef]
- Eerens, H.; de Visser, E. Wind-Energy Potential in Europe 2020-2030. ETC/ACC Technical Paper; The European Topic Centre on Air and Climate Change, 2008.
- Li, W.; Ji, Z.; Dong, F. Global Renewable Energy Power Generation Efficiency Evaluation and Influencing Factors Analysis. Sustain. Prod. Consum. 2022, 33, 438–453. [Google Scholar] [CrossRef]
- Suri, M.; Betak, J.; Rosina, K.; Chrkav, D.; Suriova, N.; Cebecauer, T.; Caltik, M.; Erdelyi, B. Global Photovoltaic Power Potential by Country; Energy Sector Management Assistance Program (ESMAP); World Bank Group: Washington, D.C, 2020. [Google Scholar]
- Emrouznejad, A.; Marra, M.; Yang, G.; Michali, M. Eco-Efficiency Considering NetZero and Data Envelopment Analysis: A Critical Literature Review. IMA J. Manag. Math. 2023, dpad002. [Google Scholar] [CrossRef]
- Tsaples, G.; Papathanasiou, J. Data Envelopment Analysis and the Concept of Sustainability: A Review and Analysis of the Literature. Renew. Sustain. Energy Rev. 2021, 138, 110664. [Google Scholar] [CrossRef]
- Zhou, H.; Yang, Y.; Chen, Y.; Zhu, J. Data Envelopment Analysis Application in Sustainability: The Origins, Development and Future Directions. Eur. J. Oper. Res. 2018, 264, 1–16. [Google Scholar] [CrossRef]
- Kao, C. Network Data Envelopment Analysis; International Series in Operations Research & Management Science; Springer International Publishing: Cham, 2017; ISBN 978-3-319-31716-8. [Google Scholar]
- Chodakowska, E.; Nazarko, J. Network DEA Models for Evaluating Couriers and Messengers. Procedia Eng. 2017, 182, 106–111. [Google Scholar] [CrossRef]
- Tone, K.; Tsutsui, M. Network DEA: A Slacks-Based Measure Approach. Eur. J. Oper. Res. 2009, 197, 243–252. [Google Scholar] [CrossRef]
- Liu, Y.; Alnafrah, I.; Zhou, Y. A Systemic Efficiency Measurement of Resource Management and Sustainable Practices: A Network Bias-Corrected DEA Assessment of OECD Countries. Resour. Policy 2024, 90, 104771. [Google Scholar] [CrossRef]
- Nazarko, J.; Chodakowska, E.; Nazarko, Ł. Evaluating the Transition of the European Union Member States towards a Circular Economy. Energies 2022, 15, 3924. [Google Scholar] [CrossRef]
- Nazarko, L.; Melnikas, B. Operationalising Responsible Research and Innovation – Tools for Enterprises. Eng. Manag. Prod. Serv. 2019, 11, 21–28. [Google Scholar] [CrossRef]
- Nazarko, Ł. Responsible Research and Innovation in Industry: From Ethical Acceptability to Social Desirability. In Corporate Social Responsibility in the Manufacturing and Services Sectors; Golinska-Dawson, P., Spychała, M., Eds.; EcoProduction; Springer Berlin Heidelberg: Berlin, Heidelberg, 2019; ISBN 978-3-642-33850-2. [Google Scholar]
- Mardani, A.; Zavadskas, E.K.; Streimikiene, D.; Jusoh, A.; Khoshnoudi, M. A Comprehensive Review of Data Envelopment Analysis (DEA) Approach in Energy Efficiency. Renew. Sustain. Energy Rev. 2017, 70, 1298–1322. [Google Scholar] [CrossRef]
- Zeng, Y.; Guo, W.; Zhang, F. Comprehensive Evaluation of Renewable Energy Technical Plans Based on Data Envelopment Analysis. Energy Procedia 2019, 158, 3583–3588. [Google Scholar] [CrossRef]
- Wang, Q.; Jiang, F.; Li, R. Assessing Supply Chain Greenness from the Perspective of Embodied Renewable Energy – A Data Envelopment Analysis Using Multi-Regional Input-Output Analysis. Renew. Energy 2022, 189, 1292–1305. [Google Scholar] [CrossRef]
- Papież, M.; Śmiech, S.; Frodyma, K. Factors Affecting the Efficiency of Wind Power in the European Union Countries. Energy Policy 2019, 132, 965–977. [Google Scholar] [CrossRef]
- Liu, Y.; Alnafrah, I.; Zhou, Y. A Systemic Efficiency Measurement of Resource Management and Sustainable Practices: A Network Bias-Corrected DEA Assessment of OECD Countries. Resour. Policy 2024, 90, 104771. [Google Scholar] [CrossRef]
- Mavi, N.K.; Mavi, R.K. Energy and Environmental Efficiency of OECD Countries in the Context of the Circular Economy: Common Weight Analysis for Malmquist Productivity Index. J. Environ. Manage. 2019, 247, 651–661. [Google Scholar] [CrossRef]
- Almeida Neves, S.; Cardoso Marques, A.; Moutinho, V. Two-Stage DEA Model to Evaluate Technical Efficiency on Deployment of Battery Electric Vehicles in the EU Countries. Transp. Res. Part Transp. Environ. 2020, 86, 102489. [Google Scholar] [CrossRef]
- Jamshidi, N.; Meybodi, M.E. Dynamic Spillover Effects of Renewable Energy Efficiency in the European Countries. Environ. Sci. Pollut. Res. 2024, 31, 11698–11715. [Google Scholar] [CrossRef] [PubMed]
- Wang, C.-N.; Nguyen, T.T.-V.; Chiang, C.-C.; Le, H.-D. Evaluating Renewable Energy Consumption Efficiency and Impact Factors in Asia-Pacific Economic Cooperation Countries: A New Approach of DEA with Undesirable Output Model. Renew. Energy 2024, 227, 120586. [Google Scholar] [CrossRef]
- Zhang, T.; Nakagawa, K.; Matsumoto, K. Evaluating Solar Photovoltaic Power Efficiency Based on Economic Dimensions for 26 Countries Using a Three-Stage Data Envelopment Analysis. Appl. Energy 2023, 335, 120714. [Google Scholar] [CrossRef]
- Wang, C.-N.; Nguyen, N.-A.-T.; Dang, T.-T.; Wang, J.-W. Assessing Asian Economies Renewable Energy Consumption Efficiency Using DEA with Undesirable Output. Comput. Syst. Sci. Eng. 2022, 43, 347–362. [Google Scholar] [CrossRef]
- Wang, C.-N.; Dang, T.-T.; Tibo, H.; Duong, D.-H. Assessing Renewable Energy Production Capabilities Using DEA Window and Fuzzy TOPSIS Model. Symmetry 2021, 13, 334. [Google Scholar] [CrossRef]
- Rodríguez-Lozano, G.; Cifuentes-Yate, M. Efficiency Assessment of Electricity Generation from Renewable and Non-renewable Energy Sources Using Data Envelopment Analysis. Int. J. Energy Res. 2021, 45, 19597–19610. [Google Scholar] [CrossRef]
- Koçak, E.; Kınacı, H.; Shehzad, K. Environmental Efficiency of Disaggregated Energy R&D Expenditures in OECD: A Bootstrap DEA Approach. Environ. Sci. Pollut. Res. 2021, 28, 19381–19390. [Google Scholar] [CrossRef]
- Maradin, D.; Cerović, L.; Šegota, A. The Efficiency of Wind Power Companies in Electricity Generation. Energy Strategy Rev. 2021, 37, 100708. [Google Scholar] [CrossRef]
- Akbari, N.; Jones, D.; Treloar, R. A Cross-European Efficiency Assessment of Offshore Wind Farms: A DEA Approach. Renew. Energy 2020, 151, 1186–1195. [Google Scholar] [CrossRef]
- Wang, C.-N.; Hsu, H.-P.; Wang, Y.-H.; Nguyen, T.-T. Eco-Efficiency Assessment for Some European Countries Using Slacks-Based Measure Data Envelopment Analysis. Appl. Sci. 2020, 10, 1760. [Google Scholar] [CrossRef]
- Tenente, M.; Henriques, C.; Da Silva, P.P. Eco-Efficiency Assessment of the Electricity Sector: Evidence from 28 European Union Countries. Econ. Anal. Policy 2020, 66, 293–314. [Google Scholar] [CrossRef]
- Rakshit, I.; Mandal, S.K. A Global Level Analysis of Environmental Energy Efficiency: An Application of Data Envelopment Analysis. Energy Effic. 2020, 13, 889–909. [Google Scholar] [CrossRef]
- Wang, C.-N.; Tibo, H.; Duong, D.H. Renewable Energy Utilization Analysis of Highly and Newly Industrialized Countries Using an Undesirable Output Model. Energies 2020, 13, 2629. [Google Scholar] [CrossRef]
- Jalali Sepehr, M.; Haeri, A.; Ghousi, R. A Cross-Country Evaluation of Energy Efficiency from the Sustainable Development Perspective. Int. J. Energy Sect. Manag. 2019, 13, 991–1019. [Google Scholar] [CrossRef]
- Mezősi, A.; Szabó, L.; Szabó, S. Cost-Efficiency Benchmarking of European Renewable Electricity Support Schemes. Renew. Sustain. Energy Rev. 2018, 98, 217–226. [Google Scholar] [CrossRef]
- Camioto, F.D.C.; Mariano, E.B.; Santana, N.B.; Yamashita, B.D.; Rebelatto, D.A.D.N. Renewable and Sustainable Energy Efficiency: An Analysis of Latin American Countries. Environ. Prog. Sustain. Energy 2018, 37, 2116–2123. [Google Scholar] [CrossRef]
- Robaina, M.; Dias, M.F. Energy Efficiency and Its Determinants: An Empirical Analysis. In Proceedings of the 2018 15th International Conference on the European Energy Market (EEM); IEEE: Lodz, June, 2018; pp. 1–5. [Google Scholar]
- Gökgöz, F.; Güvercin, M.T. Energy Security and Renewable Energy Efficiency in EU. Renew. Sustain. Energy Rev. 2018, 96, 226–239. [Google Scholar] [CrossRef]
- Li, Y.; Chiu, Y.; Lin, T.-Y. Energy and Environmental Efficiency in Different Chinese Regions. Sustainability 2019, 11, 1216. [Google Scholar] [CrossRef]
- Tian, Z.; Xiao, Q.-W.; Ren, F.-R. Assessing the Efficiency and CO2 Reduction Performance of China’s Regional Wind Power Industry Using an Epsilon-Based Measure Model. Front. Energy Res. 2021, 9, 672183. [Google Scholar] [CrossRef]
- Yi, Q.G.; Chen, H.T.; Li, X.; Ma, C. Comprehensive Assessment of Regional Sustainability via Emergy, Green GDP And DEA: A Case Study in Guizhou Province, China. Appl. Ecol. Environ. Res. 2021, 19, 597–609. [Google Scholar] [CrossRef]
- Jha, A.P.; Singh, S.K. The Dynamics of Indian Energy Mix: A Two-Phase Analysis. Benchmarking Int. J. 2022, 29, 1162–1184. [Google Scholar] [CrossRef]
- Cayir Ervural, B.; Zaim, S.; Delen, D. A Two-Stage Analytical Approach to Assess Sustainable Energy Efficiency. Energy 2018, 164, 822–836. [Google Scholar] [CrossRef]
- Wang, C.-N.; Quynh Le, T.; Dang, T.-T. Measuring Operating Efficiency of Solar Photovoltaic Power Plants Using Epsilon-Based Measure Model: A Case Study in Vietnam. Meas. Control 2023, 56, 874–890. [Google Scholar] [CrossRef]
- Mohd Chachuli, F.S.; Ahmad Ludin, N.; Mat, S.; Sopian, K. Renewable Energy Performance Evaluation Studies Using the Data Envelopment Analysis (DEA): A Systematic Review. J. Renew. Sustain. Energy 2020, 12, 062701. [Google Scholar] [CrossRef]
- Chen, Z.; Kourtzidis, S.; Tzeremes, P.; Tzeremes, N. A Robust Network DEA Model for Sustainability Assessment: An Application to Chinese Provinces. Oper. Res. 2022, 22, 235–262. [Google Scholar] [CrossRef]
- Xie, B.-C.; Jiang, J.; Chen, X.-P. Policy, Technical Change, and Environmental Efficiency: Evidence of China’s Power System from Dynamic and Spatial Perspective. J. Environ. Manage. 2022, 323, 116232. [Google Scholar] [CrossRef]
- Mehmood, K.; Iftikhar, Y.; Chen, S.; Amin, S.; Manzoor, A.; Pan, J. Analysis of Inter-Temporal Change in the Energy and CO2 Emissions Efficiency of Economies: A Two Divisional Network DEA Approach. Energies 2020, 13, 3300. [Google Scholar] [CrossRef]
- Li, Z.; Wei, Y.; Li, Y.; Wang, Z.; Zhang, J. China’s Provincial Eco-Efficiency and Its Driving Factors—Based on Network DEA and PLS-SEM Method. Int. J. Environ. Res. Public. Health 2020, 17, 8702. [Google Scholar] [CrossRef]
- Tavassoli, M.; Ketabi, S.; Ghandehari, M. Developing a Network DEA Model for Sustainability Analysis of Iran’s Electricity Distribution Network. Int. J. Electr. Power Energy Syst. 2020, 122, 106187. [Google Scholar] [CrossRef]
- Feng, Y.; Yu, X.; Chiu, Y.; Chang, T.-H. Dynamic Linkages among Economic Development, Energy Consumption, Environment and Health Sustainable in EU and Non-EU Countries. Healthcare 2019, 7, 138. [Google Scholar] [CrossRef]
- Feng, Y.; Yu, X.; Chiu, Y.-H.; Lin, T.-Y. Energy Efficiency and Health Efficiency of Old and New EU Member States. Front. Public Health 2020, 8, 168. [Google Scholar] [CrossRef] [PubMed]
- Hsieh, J.; Lu, C.; Li, Y.; Chiu, Y.; Xu, Y. Environmental Assessment of European Union Countries. Energies 2019, 12, 295. [Google Scholar] [CrossRef]
- Li, Y.; Chiu, Y.; Lin, T.-Y. Research on New and Traditional Energy Sources in OECD Countries. Int. J. Environ. Res. Public. Health 2019, 16, 1122. [Google Scholar] [CrossRef] [PubMed]
- Iftikhar, Y.; Wang, Z.; Zhang, B.; Wang, B. Energy and CO2 Emissions Efficiency of Major Economies: A Network DEA Approach. Energy 2018, 147, 197–207. [Google Scholar] [CrossRef]
- Yan, Q.; Wan, Y.; Yuan, J.; Yin, J.; Baležentis, T.; Streimikiene, D. Economic and Technical Efficiency of the Biomass Industry in China: A Network Data Envelopment Analysis Model Involving Externalities. Energies 2017, 10, 1418. [Google Scholar] [CrossRef]
- Kamali Saraji, M.; Streimikiene, D.; Suresh, V. A Novel Two-Stage Multicriteria Decision-Making Approach for Selecting Solar Farm Sites: A Case Study. J. Clean. Prod. 2024, 444, 141198. [Google Scholar] [CrossRef]
- Ogunrinde, O.; Shittu, E. Benchmarking Performance of Photovoltaic Power Plants in Multiple Periods. Environ. Syst. Decis. 2023, 43, 489–503. [Google Scholar] [CrossRef]
- Dong, F.; Yang, Y.; Li, W. Analysis of Dynamic Renewable Energy Generation Efficiency and Its Influencing Factors Considering Cooperation and Competition between Decision-Making Units: A Case Study of China. Environ. Dev. Sustain. 2023. [Google Scholar] [CrossRef]
- Daoudi, M.; Ait Sidi Mou, A.; Idrissi, A.; Ihoume, I.; Arbaoui, N.; Benchrifa, M. New Approach to Prioritize Wind Farm Sites by Data Envelopment Analysis Method: A Case Study. Ocean Eng. 2023, 271, 113820. [Google Scholar] [CrossRef]
- Wang, C.-N.; Nguyen, H.-P.; Wang, J.-W. A Two-Stage Approach of DEA and AHP in Selecting Optimal Wind Power Plants. IEEE Trans. Eng. Manag. 2023, 1–11. [Google Scholar] [CrossRef]
- Mostafaeipour, A.; Qolipour, M.; Rezaei, M.; Jahangiri, M.; Goli, A.; Sedaghat, A. A Novel Integrated Approach for Ranking Solar Energy Location Planning: A Case Study. J. Eng. Des. Technol. 2021, 19, 698–720. [Google Scholar] [CrossRef]
- Siampour, L.; Vahdatpour, S.; Jahangiri, M.; Mostafaeipour, A.; Goli, A.; Shamsabadi, A.A.; Atabani, A. Techno-Enviro Assessment and Ranking of Turkey for Use of Home-Scale Solar Water Heaters. Sustain. Energy Technol. Assess. 2021, 43, 100948. [Google Scholar] [CrossRef]
- Wang, C.-N.; Nguyen, N.-A.-T.; Dang, T.-T.; Bayer, J. A Two-Stage Multiple Criteria Decision Making for Site Selection of Solar Photovoltaic (PV) Power Plant: A Case Study in Taiwan. IEEE Access 2021, 9, 75509–75525. [Google Scholar] [CrossRef]
- Mariano, J.; Liao, M.; Ay, H. Performance Evaluation of Solar PV Power Plants in Taiwan Using Data Envelopment Analysis. Energies 2021, 14, 4498. [Google Scholar] [CrossRef]
- Wang, C.-N.; Dang, T.-T.; Nguyen, N.-A.-T. Location Optimization of Wind Plants Using DEA and Fuzzy Multi-Criteria Decision Making: A Case Study in Vietnam. IEEE Access 2021, 9, 116265–116285. [Google Scholar] [CrossRef]
- Khanjarpanah, H.; Jabbarzadeh, A.; Seyedhosseini, S.M. A Novel Multi-Period Double Frontier Network DEA to Sustainable Location Optimization of Hybrid Wind-Photovoltaic Power Plant with Real Application. Energy Convers. Manag. 2018, 159, 175–188. [Google Scholar] [CrossRef]
- Charnes, A.; Cooper, W.W.; Rhodes, E. Measuring the Efficiency of Decision Making Units. Eur. J. Oper. Res. 1978, 2, 429–444. [Google Scholar] [CrossRef]
- Farrell, M.J. The Measurement of Productive Efficiency. J. R. Stat. Soc. Ser. Gen. 1957, 120, 253. [Google Scholar] [CrossRef]
- Färe, R.; Grosskopf, S. Intertemporal Production Frontiers: With Dynamic DEA; Springer Netherlands: Dordrecht, 1996; ISBN 978-94-010-7309-7. [Google Scholar]
- Färe, R.; Grosskopf, S. Network DEA. Socioecon. Plann. Sci. 2000, 34, 35–49. [Google Scholar] [CrossRef]
- Kao, C. Network Data Envelopment Analysis. Foundations and Extensions; International Series in Operations Research & Management Science; Springer International Publishing: Cham, 2017; ISBN 978-3-319-31716-8. [Google Scholar]
- Charnes, A.; Cooper, W.W.; Golany, B.; Halek, R.; Klopp, G.; Schmitz, E.; Thomas, D. Two-Phase Data Envelopment Analysis Approaches to Policy Evaluation and Management of Army Recruiting Activities: Tradeoffs between Joint Services and Army Advertising. Cent. Cybern. Stud. Univ. Tex.-Austin Austin Tex. USA 1986. [Google Scholar]
- Färe, R.; Whittaker, G. An Intermediate Input Model of Dairy Production Using Complex Survey Data. J. Agric. Econ. 1995, 46, 201–213. [Google Scholar] [CrossRef]
- Zhu, J.; Cook, W.D. Modeling Data Irregularities and Structural Complexities in Data Envelopment Analysis; Springer: New York, NY, 2010; ISBN 978-0-387-71607-7. [Google Scholar]
- Gavurova, B.; Kocisova, K.; Sopko, J. Health System Efficiency in OECD Countries: Dynamic Network DEA Approach. Health Econ. Rev. 2021, 11, 40. [Google Scholar] [CrossRef] [PubMed]
- Maleki, S.; Ebrahimnejad, A.; Kazemi Matin, R. Pareto–Koopmans Efficiency in Two-stage Network Data Envelopment Analysis in the Presence of Undesirable Intermediate Products and Nondiscretionary Factors. Expert Syst. 2019, 36, e12393. [Google Scholar] [CrossRef]
- Zhou, Z.; Lin, L.; Xiao, H.; Ma, C.; Wu, S. Stochastic Network DEA Models for Two-Stage Systems under the Centralized Control Organization Mechanism. Comput. Ind. Eng. 2017, 110, 404–412. [Google Scholar] [CrossRef]
- Tavassoli, M.; Fathi, A.; Saen, R.F. Assessing the Sustainable Supply Chains of Tomato Paste by Fuzzy Double Frontier Network DEA Model. Ann. Oper. Res. 2021. [Google Scholar] [CrossRef]
- Chodakowska, E.; Nazarko, J. Hybrid Rough Set and Data Envelopment Analysis Approach to Technology Prioritisation. Technol. Econ. Dev. Econ. 2020, 26, 885–908. [Google Scholar] [CrossRef]
- Xu, Y.; Zhang, H.; Cheng, K.; Zhang, Z.; Chen, Y. Efficiency Measurement in Multi-Period Network DEA Model with Feedback. Expert Syst. Appl. 2021, 175, 114815. [Google Scholar] [CrossRef]
- Data Envelopment Analysis: A Handbook on the Modeling of Internal Structures and Networks; Cook, W.D., Zhu, J., Eds.; International Series in Operations Research & Management Science; Springer US: Boston, MA, 2014; Vol. 208, ISBN 978-1-4899-8067-0. [Google Scholar]
- Tone, K.; Tsutsui, M. Dynamic DEA with Network Structure: A Slacks-Based Measure Approach. Omega 2014, 42, 124–131. [Google Scholar] [CrossRef]
- Khezrimotlagh, D.; Kaffash, S.; Zhu, J. U.S. Airline Mergers’ Performance and Productivity Change. J. Air Transp. Manag. 2022, 102, 102226. [Google Scholar] [CrossRef]
- Global Wind Atlas 3.0 2023.
- Global Photovoltaic Power Potential by Country 2023.
- Our World in Data, Population & Demography Data 2023.
- World Population Prospects 2022, Online Edition. 2022.
- The World Bank Data 2021.
- Renewable Capacity Statistics 2023; International Renewable Energy Agency, 2023.
- Our World in Data, Wind Energy Generation 2023.
- Our World in Data, Solar Power Generation 2023.
- Jaanti, M. Solar Energy in Finland & Market Entry. 2016.
Figure 1.
Network DEA models (a) basic DEA model; (b) serial DEA model; (c) parallel DEA model; (d) parallel-serial DEA model; (e) hierarchical DEA model; (f) DEA model with feedback; (g) dynamic DEA model; (h) mixed DEA model. Source: Own elaboration based on [12,13,87,88].
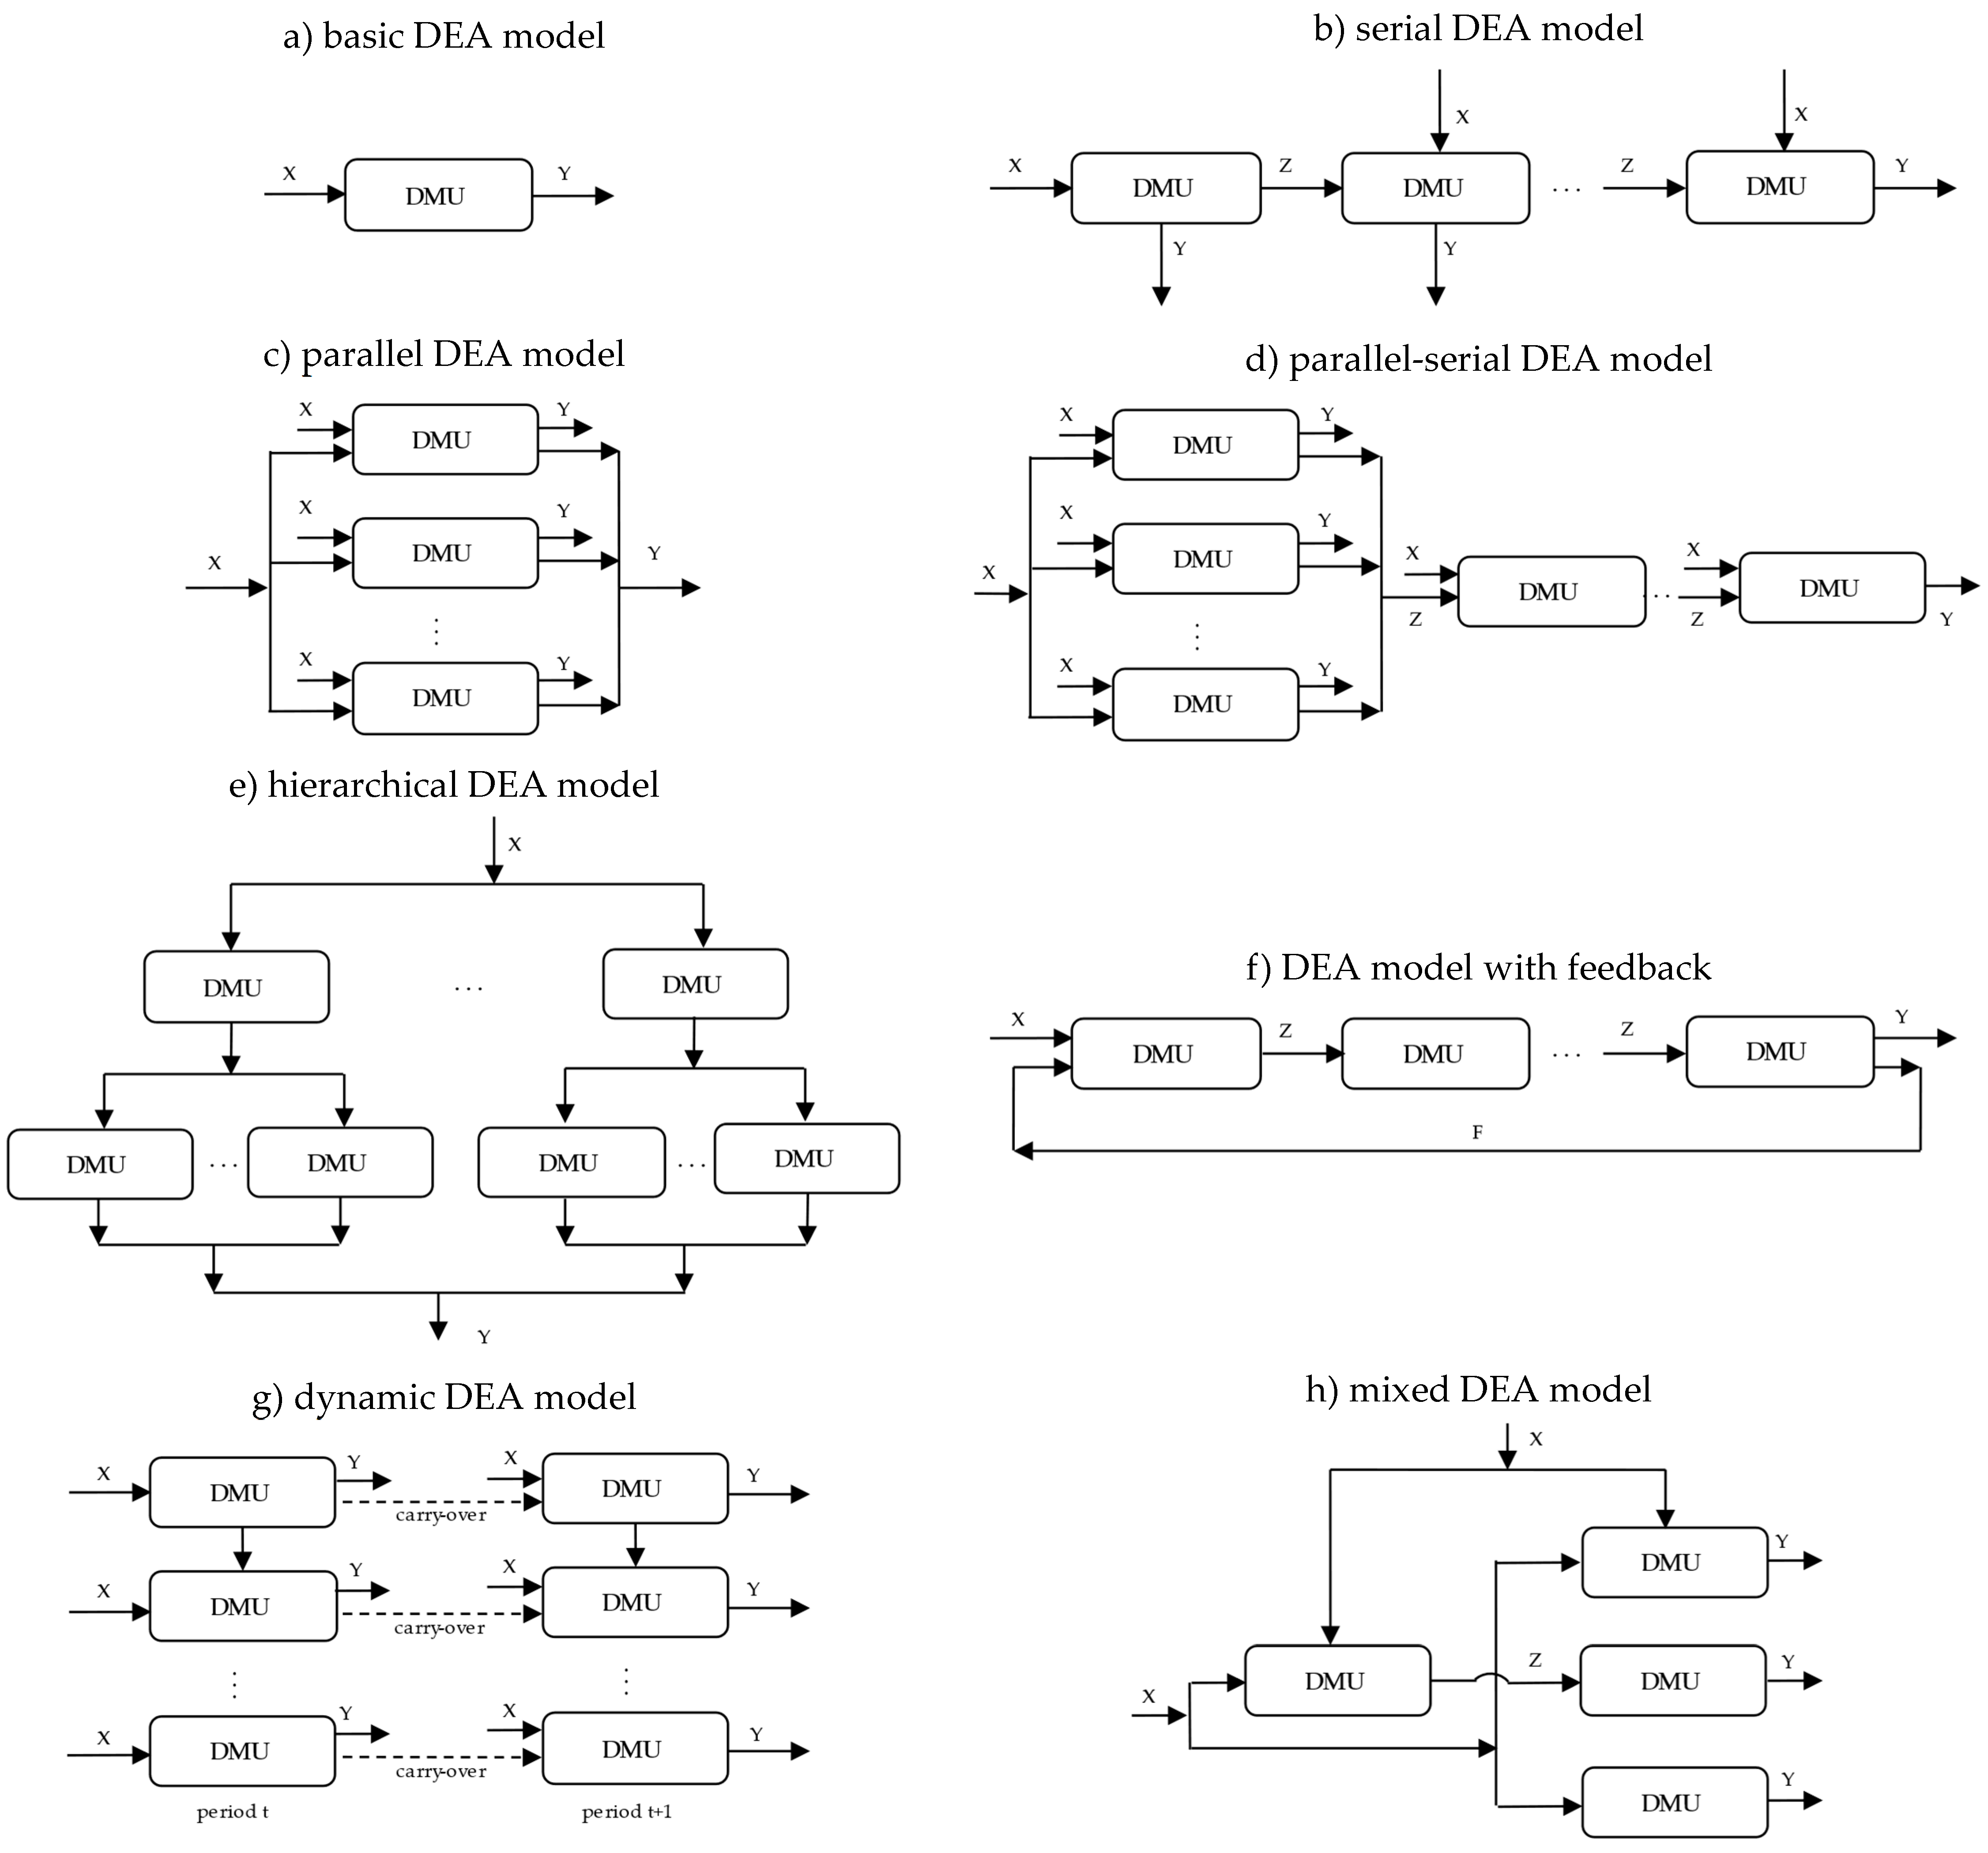
Figure 2.
Model structure Source: Own elaboration.
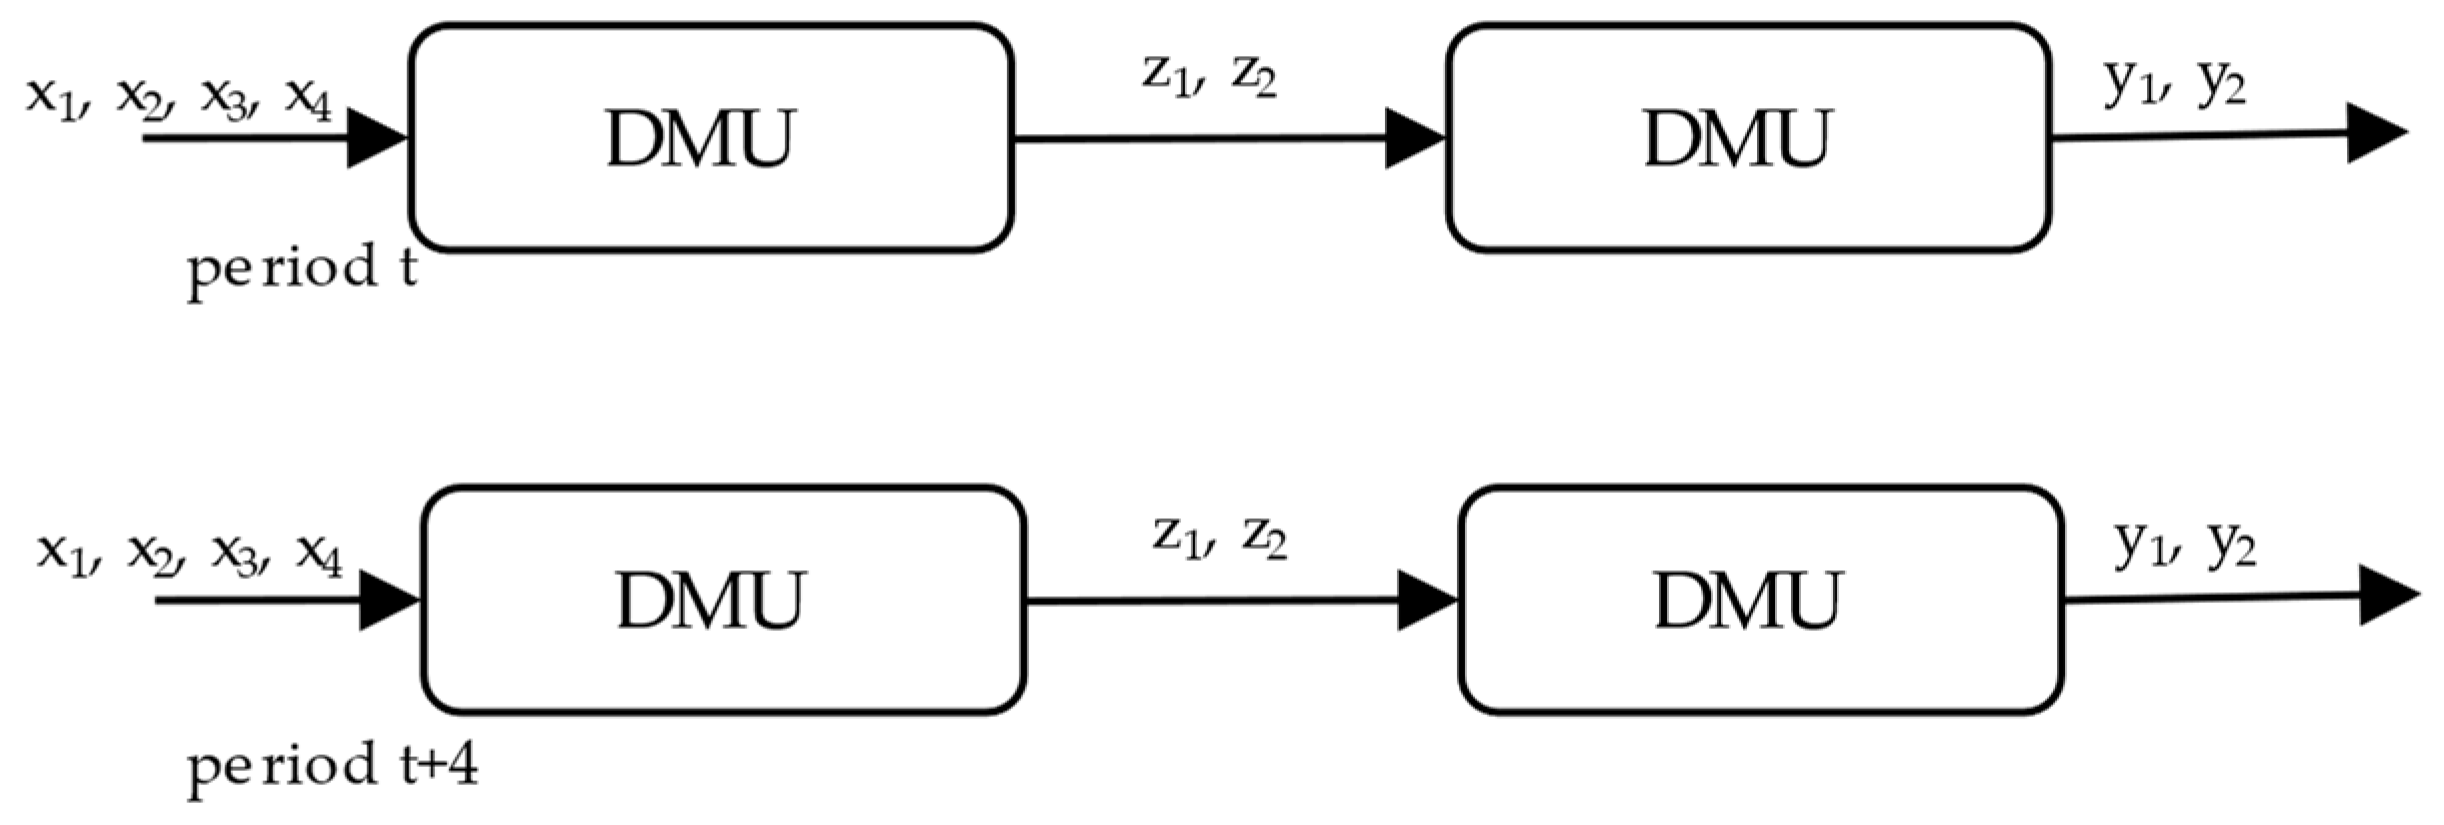
Figure 3.
Countries characteristics: (a) geographical characteristics; (b) wind power per capita; (c) solar power per capita.
Figure 3.
Countries characteristics: (a) geographical characteristics; (b) wind power per capita; (c) solar power per capita.
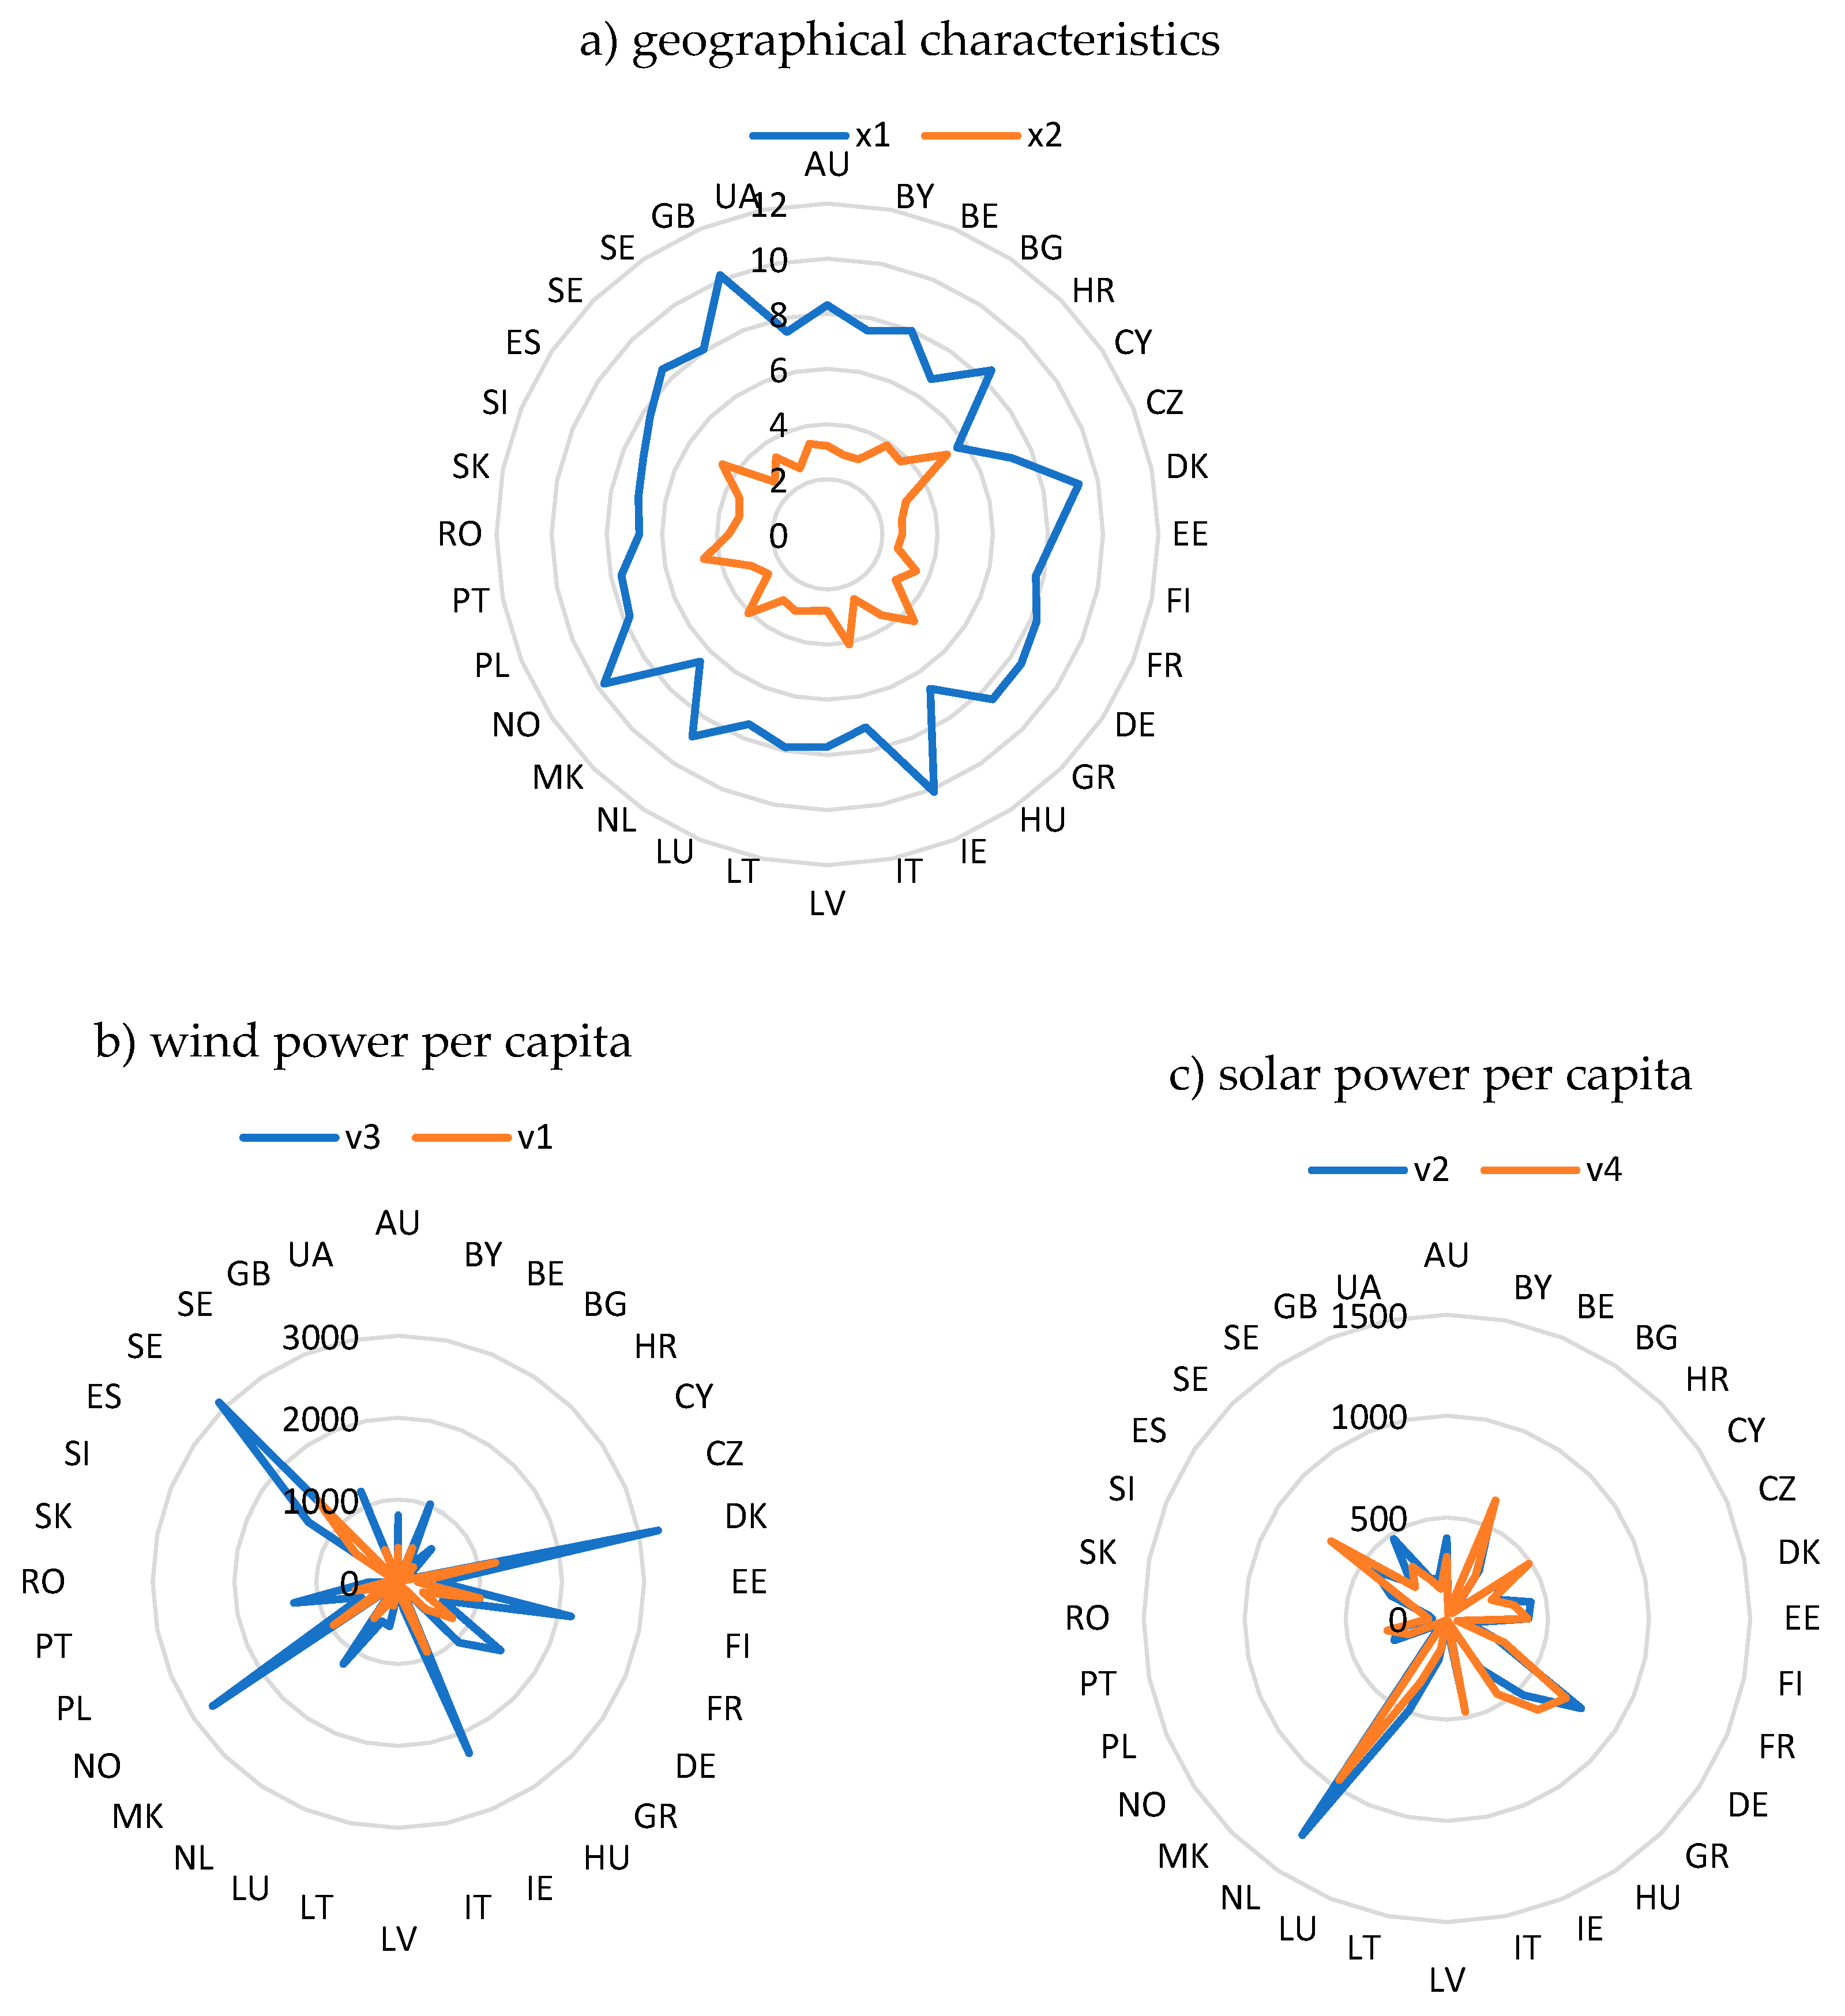
Figure 4.
Histograms of efficiency scores by NDEA: (a) overall 2018; (b) overall 2022; (c) first stage NDEA 018; (d) first stage NDEA 2022; (e) second stage NDEA 2018; (f) second stage NDEA 2022.
Figure 4.
Histograms of efficiency scores by NDEA: (a) overall 2018; (b) overall 2022; (c) first stage NDEA 018; (d) first stage NDEA 2022; (e) second stage NDEA 2018; (f) second stage NDEA 2022.
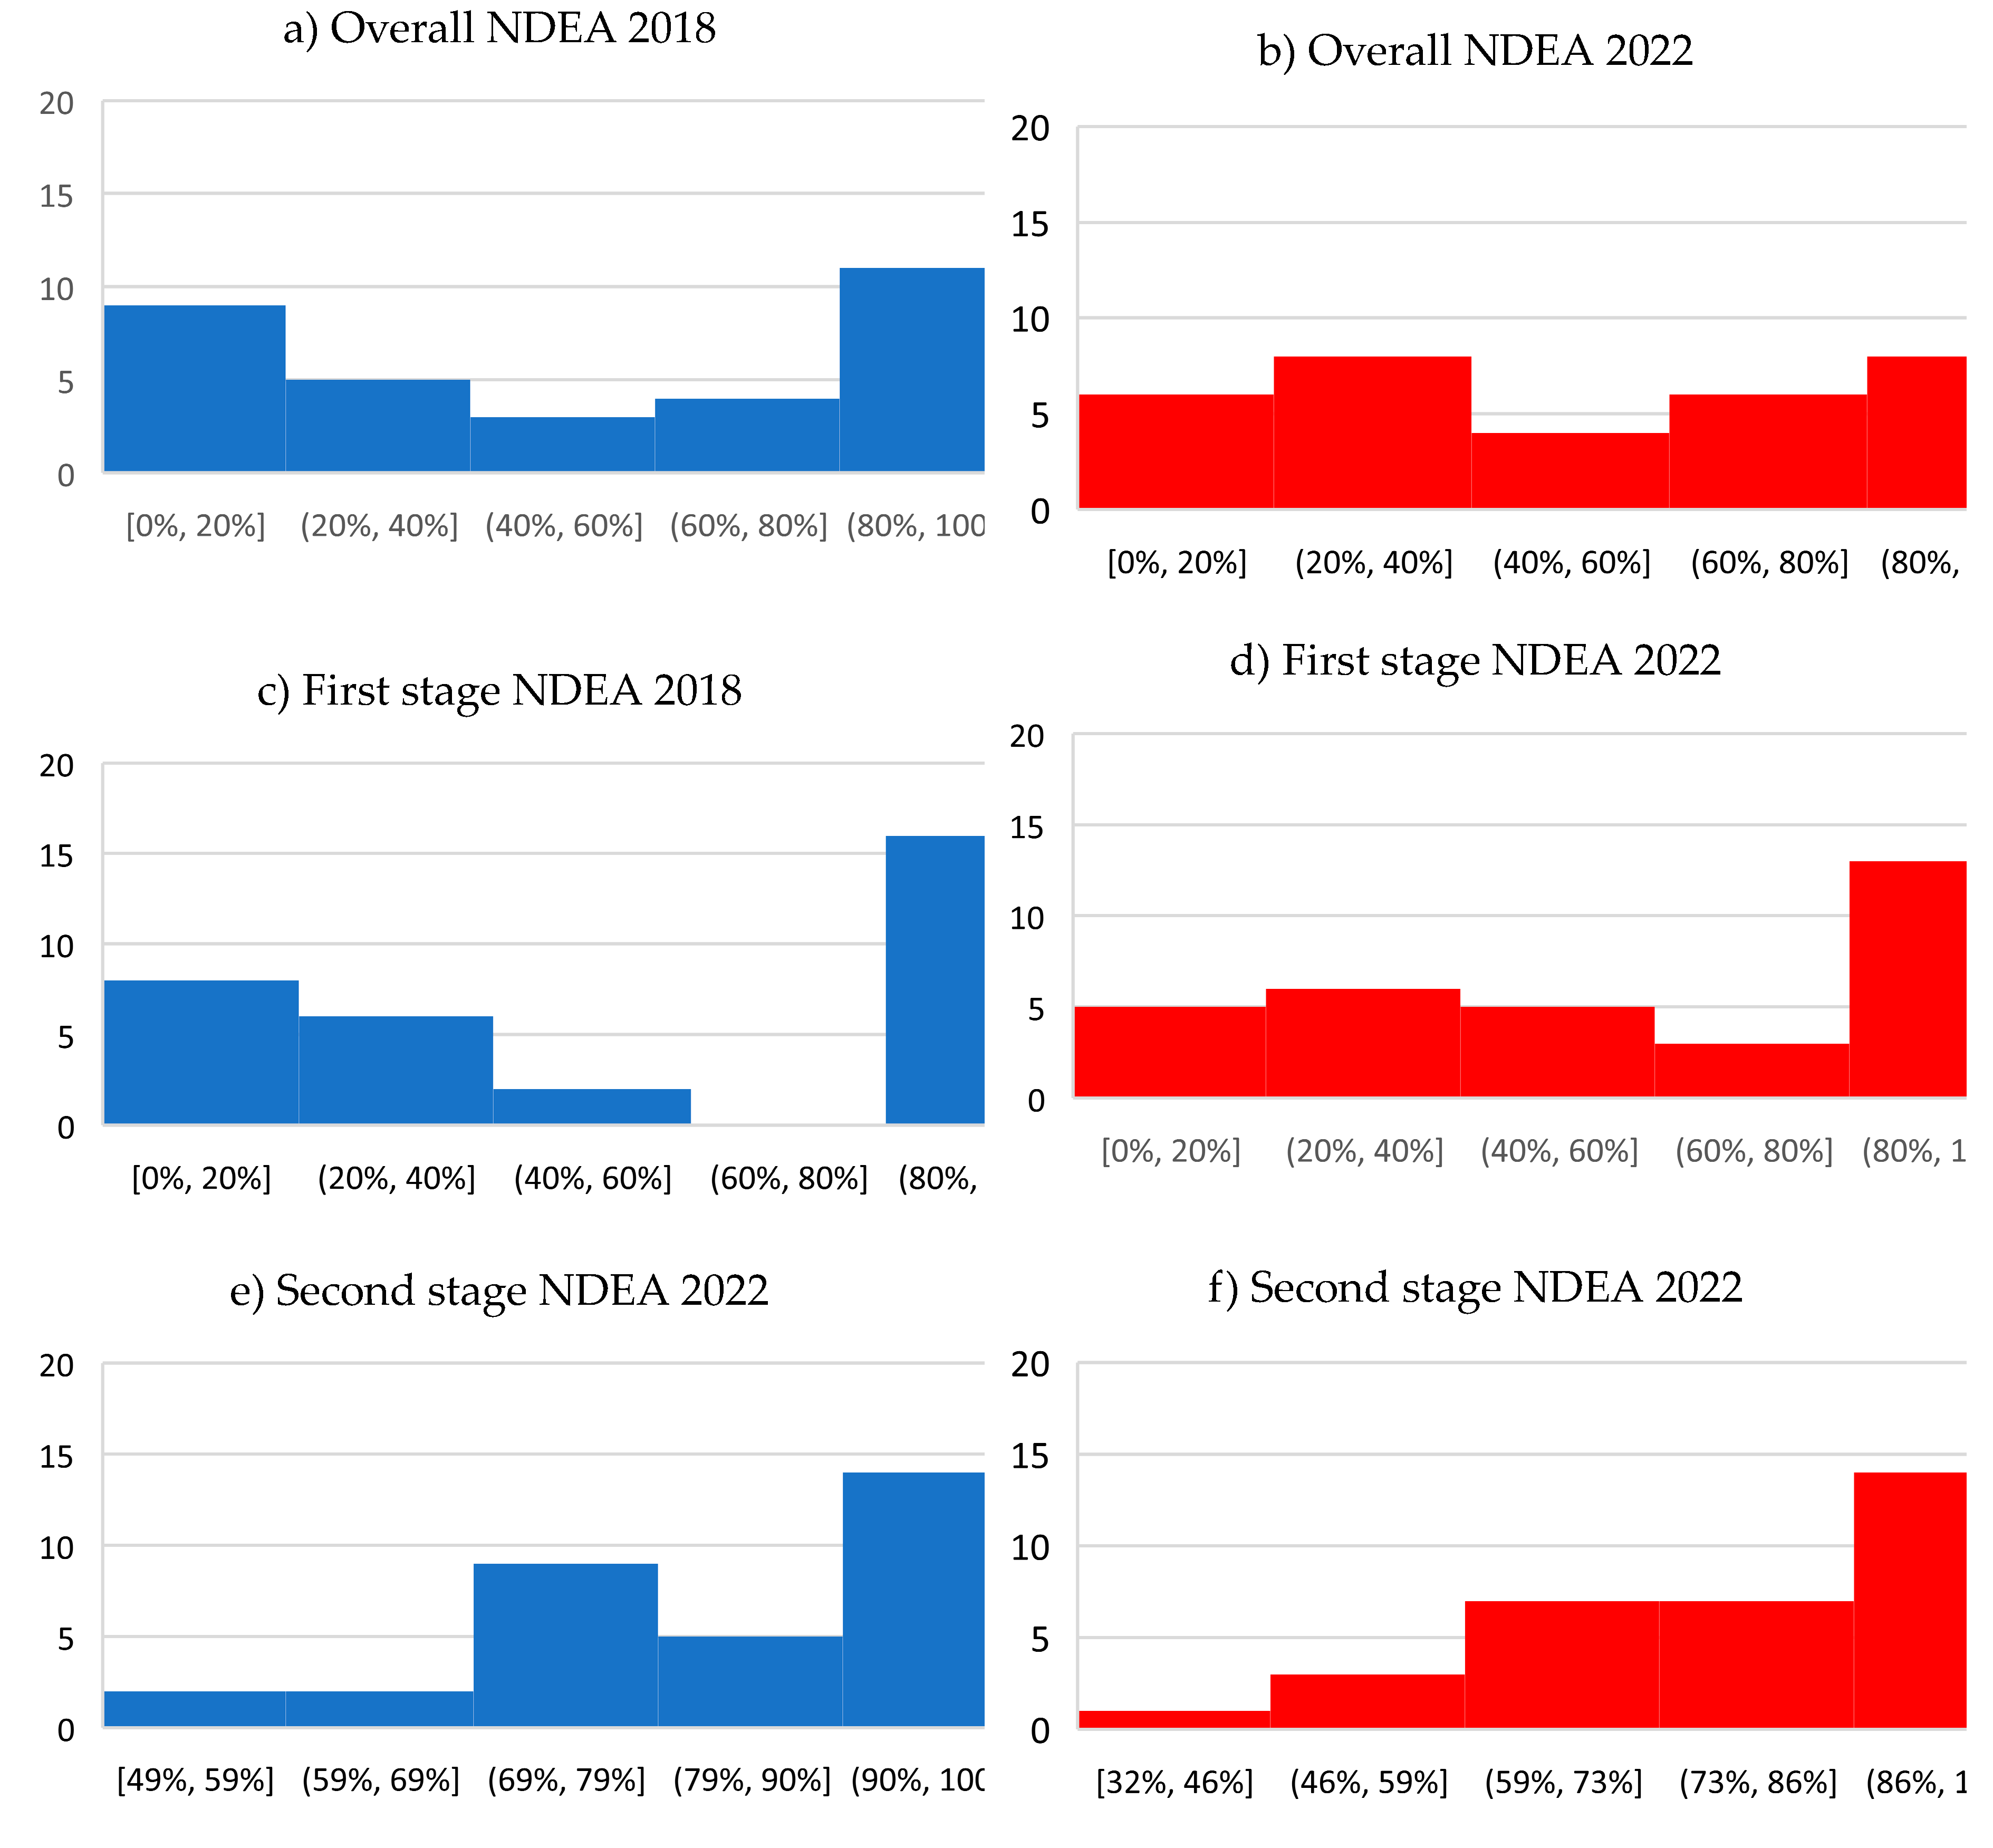

Table 1.
Works on cross-country renewable energy efficiency evaluation by DEA.
| Title (Year) | DMU | DEA model | Analysis Criteria |
|---|---|---|---|
| Dynamic spillover effects of renewable energy efficiency in the European countries (2024) [26] | 25 European countries from 2005 and 2020 | two-stage: DEA and regression | Inputs: renewable energy consumption, capital labour Outputs: GDP Influencing factors: GDP, energy price, renewable energy consumption, information and communications technology, industrial value added |
| Evaluating renewable energy consumption efficiency and impact factors in Asia-pacific economic cooperation countries: A new approach of DEA with undesirable output model (2024) [27] | 21 APEC member countries from 2011 to 2020 | DEA with undesirable output | Inputs: foreign direct investment total energy consumption, total renewable energy capacity Outputs: GDPUndesirables: GHG |
| Evaluating solar photovoltaic power efficiency based on economic dimensions for 26 countries using a three-stage data envelopment analysis (2023) [28] | 26 countries from 2000 to 2020 | three-stage: DEA-SFA-DEA | Inputs: capital, labour, PV installed capacity, PV patents Output: PV generation Environment variables: proportion of the urban population, GDP per capita, CO2 |
| Assessing Asian Economies Renewable Energy Consumption Efficiency Using DEA with Undesirable Output (2022) [29] | 14 Asian countries in 2019 | DEA with undesirable output | Inputs: labour, energy consumption, the share of renewable energy, and total renewable energy capacity Outputs: CO2 and GDP |
| Global renewable energy power generation efficiency evaluation and influencing factors analysis (2022) [7] | 36 countries from 2009 to 2018 | Super efficiency DEA, MI, and random forest regression model to analyse the influence of the selected factors | Inputs: five types of renewable energy installed capacity Outputs: renewable energy power generation Influencing factors: population size and density, economic level, urbanisation rate, production level, industrialisation level and structure, electricity and energy structure, carbon emissions, and technology level |
| Assessing Renewable Energy Production Capabilities Using DEA Window and Fuzzy TOPSIS Model [30] (2021) | 42 countries 2010–2019 | DEA window and FTOPSIS | Inputs: population, total energy consumption, and total renewable energy capacity Outputs: GDP, total energy production FTOPSIS: availability of resource, energy security, technological infrastructure, economic stability, social acceptance |
| Efficiency assessment of electricity generation from renewable and non-renewable energy sources using Data Envelopment Analysis (2021) [31] |
126 countries from 2000 to 2016 | BCC model | Inputs: renewable and non-renewable energy sources generation capacity Outputs: Power generation, CO2 emissions avoided |
| Environmental efficiency of disaggregated energy R&D expenditures in OECD: a bootstrap DEA approach (2021) [32] | 26 OECD countries | Bootstrap IO CCR DEA | Inputs: six different energy R&D expenditure indicators in 2015 Outputs: CO2 emission per capita |
| Dual Efficiency and Productivity Analysis of Renewable Energy Alternatives of OECD Countries (2021) [5] | Selected OECD countries in 2012, 2014, and 2016 | OO BCC model and MI | Inputs: investment in RE sources Outputs: electricity generation, EPI, the proportion of the population with access to clean fuels and technology for cooking |
| The efficiency of wind power companies in electricity generation (2021) [33] | 78 wind power companies in 12 selected European countries in 2014 | IO SBM VRS- DEA | Inputs: wind turbine power and number, fuel, tangible fixed assets, receivables and other assets, cash and cash equivalents Outputs: electricity production, EBITDA |
| A cross-European efficiency assessment of offshore wind farms: A DEA approach (2020) [34] | 71 offshore wind farms across 5 countries in 2018 | CCR DEA with sensitivity analysis | Inputs: number of turbines, cost, distance to shore, area Outputs: connectivity, generated electricity, water depth |
| Eco-efficiency assessment for some European countries using slacks-based measure data envelopment analysis (2020) [35] | 17 European countries from 2013 to 2017 | SBM DEA with undesirable outputs model and MI | Inputs: energy consumption, labour productivity, the share of renewable energy in energy consumption, gross capital formation productivity Outputs: GDP per capita, CO2 per capita |
| Eco-efficiency assessment of the electricity sector: evidence from 28 European Union countries (2020) [36] | 28 EU countries 2010 and 2014. | DEA Directional Distance Function model | Inputs: labour, capital, GHG, acidifying gases, ozone Precursors Outputs: GVA |
| A global level analysis of environmental energy efficiency: an application of data envelopment analysis (2020) [37] | 149 economies categorized into low-, middle- and high-income from 1993 to 2013 | IO and OO DEA with and without undesirable output and directional distance function | Inputs: labour, capital, energy Outputs: GDP, CO2 |
| Renewable Energy Utilization Analysis of Highly and Newly Industrialized Countries Using an Undesirable Output Model (2020) [38] | 17 countries highly and newly industrialised from 2013 to 2018 | DEA with undesirables preceded by Grey Prediction Model | Inputs: total renewable energy capacity, labour force, total energy consumption Outputs: CO2, GDP |
| Across-country evaluation of energy efficiency from the sustainable development perspective (2019) [39] | 132 countries from 2007 to 2014 | MinSum DEA | Inputs: GDP per unit of energy use, renewable energy consumption Outputs: GDP, CO2 emissions per GDP |
| Cost-efficiency benchmarking of European renewable electricity support schemes (2018) [40] | 25 EU member states and Norway from 2000 to 2015 | CCR model | Inputs: PV fee, wind fee, LCOE PV, LCOE wind Outputs: PV share, Wind share, REs share |
| Renewable and sustainable energy efficiency: An analysis of Latin American countries (2018) [41] | 156 Latin American countries from 1991 to 2013 | SBM VRS DEA with window analysis | Inputs: labour, capital, energy consumption Outputs: GDP, CO2 |
| Energy efficiency and its determinants: An empirical analysis (2018) [42] | 20 of the largest producers of renewable energy from 2009 to 2013 | BCC DEA and truncated regression | Input: primary energy consumption, capital, labour Output: GDP Regression: renewable energy consumption, GVA per capita, population density |
| Energy security and renewable energy efficiency in EU (2018) [43] | 14 EU countries from 2004 to 2014 | DEA and sequential Malmquist-Luenberger index | Input: deployed renewables Output: increase in the share of RE in total electricity generation Undesirable outputs: coal products, oil products and natural gas |
Abbreviations: APEC − Asia-Pacific Economic Co-operation; BCC (VRS) − variable returns to scale DEA models; CCR − constant returns to scale; CEF − cost efficiency indicator; CO2 − carbon dioxide emissions; DMU − decision-making unit; EPI − Environmental Performance Index; FTOPSIS − fuzzy technique for order of preference by similarity to ideal solution; GDP − gross domestic products; GHG − greenhouse gas emissions; IO − input-oriented; GVA − Gross Value Added; LCOE − levelized cost of electricity; MI − Malmquist Index; OO − output-oriented; PV − photovoltaics; RE, REs − renewable(s); SBM − slack based model; VRS (BCC) − variable returns to scale DEA models.
Table 2.
Works on evaluation of energy from renewables by network DEA.
| Title (Year) | DMU | DEA model | Analysis Criteria |
|---|---|---|---|
| A robust network DEA model for sustainability assessment: an application to Chinese provinces (2022) [51] | 30 Chinese regions during 2000-2012 | multiplicative two-stage relational NDEA | capital, labour, energy, GDP, CO2, SO2 |
| Policy, technical change, and environmental efficiency: Evidence of China's power system from dynamic and spatial perspective (2022) [52] | 30 Chinese provinces from 2011 to 2020 | DNSBM-DDF model and global MPI | feed-in tariff, renewable portfolio standard CO2, SO2, NOx, and line loss |
| The dynamics of Indian energy mix: a two-phase analysis (2022) [47] | 18 Indian states from 2008 to 2016 | two phases consist of two stages serial NDEA and regression | renewable and conventional capacities, generation from RES and conventional sources, length of transmission lines, technical and commercial losses, agricultural-, residential-, and industrial consumption, state GDP per capita |
| Analysis of inter-temporal change in the energy and CO2 emissions efficiency of economies: a two divisional network DEA approach (2020) [53] | Iran’s Electricity Distribution Network | two stage NDEA | labour, capital, energy consumption, GDP, CO2, the total population |
| China’s provincial eco-efficiency and its driving factors—based on network DEA and PLS-SEM Method (2020) [54] | 30 Chinese regions in 1996 -2015 | two-stage serial NDEA and PLS-SEM | labour, asset, energy consumption, land used, water, GDP, wastewater, exhaust, SO2, investment in pollution control, solid waste utilization, wastewater treatment, greening rate |
| Developing a network DEA model for sustainability analysis of Iran’s electricity distribution network (2020) [55] | Iran’s electricity distribution network | serial and parallel NDEA | fuel, staff, import, export, sale to big industry, electricity generated, electricity distributed, loss in transmission, purchase, network length, service area, sale to customers |
| Dynamic linkages among economic development, energy consumption, environment, and health sustainable in EU and Non-EU Countries (2019) [56] | 8 EU and 53 non-EU countries from 2010 to 2014 | two-stage meta-frontier dynamic serial NDEA | labour, renewable and non-renewable energy consumption, assets, GDP, health expenditure, survival rate, tuberculosis rate, CO2, PM2.5, mortality rates |
| Energy efficiency and health efficiency of old and new EU member states (2020) [57] | 15 old and 13 new EU states from 2010 to 2014 | two-stage meta-frontier dynamic serial NDEA | labour, renewable and non-renewable energy consumption, assets, GDP, health expenditure, survival rate, tuberculosis rate, CO2, PM2.5, mortality rates |
| Environmental assessment of European Union countries (2019) [58] | 28 EU countries 2006–2013 | dynamic DEA | labour, capital, energy consumption, GHE, SOx, GDP, GCF |
| Research on new and traditional energy sources in OECD countries (2019) [59] | 35 OECD countries | dynamic SBM DEA | labour, energy consumption, new energy consumption, GDP, CO2, PM2.5, fixed assets |
| Energy and CO2 emissions efficiency of major economies: a network DEA approach (2018) [60] | major economies | SBM two stages NDEA | energy resources, economic outputs, energy consumption, CO2 |
| Economic and technical efficiency of the biomass industry in China: a network data envelopment analysis model involving externalities (2017) [61] | 31 Chinese provinces in 2012 | NDEA model with undesirable outputs | operational cost, forest residues, organic waste, rural power, fertilizers, agricultural machinery, commercial and residential power, agricultural production, rural power, pollutants, agricultural and straw residues |
Abbreviations: DNSBM-DDF − dynamic slacks-based measure with network structure with directional distance function; MPI − Malmquist productivity index; PLS-SEM − partial least squares structural equation modelling; SBM − slacks-based measures; SOx − sulfur oxides.
Table 3.
Works on DEA in assessing the impact of geographical location conditions on energy efficiency.
Table 3.
Works on DEA in assessing the impact of geographical location conditions on energy efficiency.
| Title | DMU | DEA model | Analysis Criteria |
|---|---|---|---|
| A novel two-stage multicriteria decision-making approach for selecting solar farm sites: A case study (2024) [62] | 39 potential cities in the Baltic region | DEA and TOPSIS | temperature, wind speed, humidity, precipitation, and air pressure as inputs and sunshine hours, elevation, and irradiation and six evaluation criteria to prioritize the locations |
| Benchmarking performance of photovoltaic power plants in multiple periods (2023) [63] | 3 PV power plants in multiple periods | multi-period DEA | solar insolation, daily sun-hours, temperature, installation cost, installed capacity |
| Analysis of dynamic renewable energy generation efficiency and its influencing factors considering cooperation and competition between decision-making units: a case study of China [64] | China's provinces | DEA cross-efficiency | cumulative installed capacity, annual equipment utilisation hours, electricity consumption of power generation companies, electricity generation |
| New approach to prioritize wind farm sites by data envelopment analysis method: A case study (2023) [65] | 14 offshore sites of the Moroccan seas for 2016–2020 | DEAM (supper-efficiency DEA model) | water depth, distance to coast, accessibility, maximum wave height, maximum wind speed, wind power density |
| A two-stage approach of DEA and AHP in selecting optimal wind power plants (2023) [66] | 12 locations in Vietnam | DEA (CCR-I, CCR-O, BCC-I, BCC-O, SBM-I-O, SMB-O-C) and AHP | DEA: frequency of natural disasters, land cost, wind blow, population, quantity of proper geological and topographical area AHP: location characteristic, technical, economic, social, environmental |
| A novel integrated approach for ranking solar energy location planning: a case study (2021) [67] | 10 provinces in Canada | hybrid approach composed of data (DEA), balanced scorecard (BSC) and game theory (GT) | cost of construction, income, electricity generated by the plant and electricity generated by the panel, amount of pollution |
| Techno-enviro assessment and ranking of Turkey for use of home-scale solar water heaters (2021) [68] | 2 types of solar water heaters for 45 stations in Turkey | BCC and additive DEA model | total annual irradiation, diffuse radiation percentage, cold water temperature, total solar fraction, solar contribution to heating, CO2 emissions avoided, boiler energy to heating and to DHW |
| A two-stage multiple criteria decision making for site selection of solar photovoltaic (pv) power plant: a case study in Taiwan (2021) [69] | 20 potential cities and counties of Taiwan | DEA (CCR-I, CCR-O, BCC-I, BCC-O, SBM-I-O, SMB-O-C) and AHP | DEA: temperature, wind speed, humidity, precipitation, air pressure, sunshine hours, insolation AHP: site characteristics, technical, economic, social, environmental |
| Performance evaluation of solar PV power plants in Taiwan using data envelopment analysis (2021) [70] | solar PV power plants in Taiwan. | epsilon-based DEA | surface area, number of modules, ambient temperature, plant capacity, PV module temperature, irradiation, generated energy |
| Location optimization of wind plants using DEA and fuzzy multi-criteria decision making: a case study in Vietnam (2021) [71] | 20 potential provinces in Vietnam | DEA, FAHP, FWASPAS | DEA: land cost, intensity of natural disasters occurrence, wind power density, quantity of proper geological areas, population FAHP: technical, economic, social/political, environmental |
| Factors affecting the efficiency of wind power in the European Union countries (2019) [22] | 27 EU countries | two-stage bias-corrected DEA | installed wind power capacity, average wind power density, wind-generated electricity, and additional aspects: environmental, economic and energy security |
| A novel multi-period double frontier network DEA to sustainable location optimization of hybrid wind-photovoltaic power plant with real application (2018) [72] | 22 Iran provinces | double frontier (optimistic and pessimistic) parallel single- and multi-period NDEA | land cost, HDI, distance to high consumptions province, wind speed, population, electricity consumptions, sunny hours, above sea level |
Abbreviations: AHP − Analytic Hierarchy Process; DEAM − Data Envelopment Analysis Modified, DHW − Domestic hot water, FAHP − Fuzzy Analytic Hierarchy Process; FWASPAS − Fuzzy Weighted Aggregated Sum-Product Assessment; HDI − Human Development Index.
Table 4.
Data set.
| Variable | Description, source | Unit, year | Source |
|---|---|---|---|
| x1 | Mean wind speed | m/s (data for 10% windiest area) | [90] |
| x2 | GHI | kWh/m2/day | [91]* |
| x3 | Population | million people, 2018-2022 | [92,93] |
| x4 | Land area | square thousand km, 2021 | [94] |
| z1 | Wind energy capacity | MW, 2018, 2022 | [95] |
| z2 | Solar PV capacity | MW, 2018-2022 | [95] |
| y1 | Wind energy generation | GWh per year, 2018-2022 | [96] |
| y2 | Solar power generation | TWh per year, 2018-2022 | [97] |
| v1 | Wind capacity per capita | W | |
| v2 | PV capacity per capita | W | |
| v3 | Wind energy generation per capita | kW | |
| v4 | Solar power generation per capita | kW |
*Data from Finland based on publications [98].
Table 5.
Correlations of variables.
| Population | Land area | Mean Wind Speed | GHI | Wind capacity per capita | Solar PV capacity | Wind energy generation per capita | Wind energy generation per capita | Wind capacity | Solar PV capacity | Wind energy generation | |
|---|---|---|---|---|---|---|---|---|---|---|---|
| Population | 1.000 | ||||||||||
| Land area | 0.683 | 1.000 | |||||||||
| Mean Wind Speed | 0.203 | 0.154 | 1.000 | ||||||||
| GHI | 0.029 | -0.027 | -0.593 | 1.000 | |||||||
| Wind capacity per capita | 0.078 | 0.283 | 0.633 | -0.340 | 1.000 | ||||||
| Solar PV capacity per capita | 0.260 | -0.104 | 0.114 | 0.047 | 0.139 | 1.000 | |||||
| Wind energy generation per capita | 0.029 | 0.242 | 0.678 | -0.361 | 0.985 | 0.089 | 1.000 | ||||
| Solar power generation per capita | 0.334 | -0.005 | 0.006 | 0.283 | 0.121 | 0.920 | 0.064 | 1.000 | |||
| Wind capacity | 0.823 | 0.508 | 0.328 | -0.063 | 0.398 | 0.374 | 0.327 | 0.431 | 1.000 | ||
| Solar PV capacity | 0.826 | 0.416 | 0.168 | 0.008 | 0.187 | 0.573 | 0.108 | 0.584 | 0.910 | 1.000 | |
| Wind energy generation | 0.819 | 0.494 | 0.406 | -0.098 | 0.428 | 0.346 | 0.372 | 0.403 | 0.985 | 0.856 | 1.000 |
| Solar power generation | 0.853 | 0.484 | 0.134 | 0.112 | 0.185 | 0.521 | 0.105 | 0.603 | 0.914 | 0.973 | 0.865 |
Table 6.
Basic statistic for 2022.
| Min | Max | Mean | Std. dev. | |
|---|---|---|---|---|
| x1 | 5.66 | 10.18 | 7.90 | 1.01 |
| x2 | 2.53 | 5.21 | 3.33 | 0.68 |
| x3 | 0.65 | 83.37 | 18.12 | 22.32 |
| x4 | 2.57 | 579.40 | 170.30 | 166.59 |
| z1 | 3.00 | 66315.00 | 7490.81 | 13064.71 |
| z2 | 56.00 | 66554.00 | 7101.69 | 12782.09 |
| y1 | 5.00 | 125287.00 | 16167.99 | 26724.79 |
| y2 | 0.01 | 58.98 | 7.05 | 12.34 |
| v1 | 0.71 | 1379.90 | 377.42 | 372.40 |
| v2 | 26.88 | 1286.15 | 310.56 | 254.56 |
| v3 | 0.89 | 3230.37 | 860.08 | 916.97 |
| v4 | 5.40 | 958.21 | 292.85 | 233.90 |
Table 7.
Final efficiency score.
| Country | Two-stage NDEA 2018 | Two-stage NDEA 2022 | Malmquist index | |||||||||
| One stage DEA 2018 | One stage DEA 2022 | First stage | Second stage | Overall | First stage | Second stage | Overall | catch-up | frontier-shift | index | ||
| AU | Austria | 41.6% | 43.1% | 39.2% | 78.2% | 30.7% | 48.5% | 63.6% | 30.9% | 1.01 | 1.57 | 1.58 |
| BY | Belarus | 4.7% | 5.5% | 2.3% | 50.5% | 1.2% | 2.2% | 63.8% | 1.4% | 1.20 | 1.54 | 1.84 |
| BE | Belgium | 100.0% | 97.3% | 97.3% | 86.7% | 84.3% | 77.0% | 96.0% | 74.0% | 0.88 | 1.64 | 1.44 |
| BG | Bulgaria | 43.2% | 40.2% | 22.7% | 84.1% | 19.1% | 21.5% | 75.5% | 16.2% | 0.85 | 1.44 | 1.22 |
| HR | Croatia | 14.2% | 18.9% | 5.7% | 73.4% | 4.2% | 7.1% | 60.5% | 4.3% | 1.03 | 2.12 | 2.18 |
| CY | Cyprus | 100.0% | 100.0% | 100.0% | 100.0% | 100.0% | 100.0% | 79.6% | 79.6% | 0.80 | 1.12 | 0.89 |
| CZ | Czechia | 100.0% | 100.0% | 100.0% | 100.0% | 100.0% | 49.9% | 68.6% | 34.2% | 0.34 | 2.87 | 0.98 |
| DK | Denmark | 100.0% | 100.0% | 100.0% | 70.1% | 70.1% | 100.0% | 75.8% | 75.8% | 1.08 | 1.49 | 1.61 |
| EE | Estonia | 100.0% | 100.0% | 100.0% | 71.8% | 71.8% | 100.0% | 75.8% | 75.8% | 1.06 | 0.86 | 0.91 |
| FI | Finland | 100.0% | 100.0% | 100.0% | 100.0% | 100.0% | 100.0% | 50.7% | 52.8% | 0.53 | 0.91 | 0.48 |
| FR | France | 33.2% | 43.1% | 30.1% | 100.0% | 32.1% | 37.2% | 100.0% | 37.2% | 1.16 | 1.34 | 1.55 |
| DE | Germany | 100.0% | 100.0% | 100.0% | 100.0% | 100.0% | 100.0% | 100.0% | 100.0% | 1.00 | 1.00 | 1.00 |
| GR | Greece | 70.2% | 73.1% | 43.1% | 96.6% | 41.7% | 58.9% | 89.5% | 52.7% | 1.26 | 1.42 | 1.80 |
| HU | Hungary | 100.0% | 100.0% | 100.0% | 71.1% | 71.1% | 100.0% | 100.0% | 100.0% | 1.41 | 1.01 | 1.42 |
| IE | Ireland | 100.0% | 100.0% | 100.0% | 100.0% | 100.0% | 100.0% | 100.0% | 100.0% | 1.00 | 1.00 | 1.00 |
| IT | Italy | 97.8% | 87.8% | 47.6% | 86.5% | 41.2% | 50.0% | 80.4% | 40.2% | 0.98 | 1.74 | 1.70 |
| LV | Latvia | 100.0% | 100.0% | 100.0% | 100.0% | 100.0% | 100.0% | 100.0% | 100.0% | 1.00 | 0.45 | 0.45 |
| LT | Lithuania | 36.1% | 39.8% | 14.5% | 76.7% | 11.1% | 39.3% | 56.9% | 22.4% | 2.01 | 2.04 | 4.09 |
| LU | Luxembourg | 100.0% | 100.0% | 100.0% | 75.7% | 75.7% | 100.0% | 65.6% | 65.6% | 0.87 | 0.86 | 0.74 |
| NL | Netherlands | 100.0% | 100.0% | 100.0% | 83.1% | 83.1% | 100.0% | 100.0% | 100.0% | 1.20 | 1.16 | 1.39 |
| MK | North Macedonia | 100.0% | 100.0% | 100.0% | 100.0% | 100.0% | 100.0% | 100.0% | 100.0% | 1.00 | 1.00 | 1.00 |
| NO | Norway | 39.7% | 100.0% | 100.0% | 59.8% | 59.8% | 50.0% | 50.0% | 25.0% | 0.25 | 73.09 | 18.28 |
| PL | Poland | 27.9% | 36.0% | 5.4% | 48.7% | 2.6% | 33.4% | 83.7% | 27.9% | 10.62 | 1.47 | 15.63 |
| PT | Portugal | 78.9% | 64.6% | 21.1% | 100.0% | 21.1% | 36.3% | 99.3% | 36.0% | 1.71 | 1.73 | 2.96 |
| RO | Romania | 61.0% | 59.7% | 38.5% | 95.4% | 36.7% | 24.7% | 96.4% | 23.8% | 0.65 | 1.60 | 1.04 |
| SK | Slovakia | 100.0% | 100.0% | 100.0% | 100.0% | 100.0% | 100.0% | 100.0% | 100.0% | 1.00 | 1.00 | 1.00 |
| SI | Slovenia | 28.5% | 27.0% | 0.5% | 69.5% | 0.3% | 0.4% | 66.2% | 0.3% | 0.77 | 1.23 | 0.95 |
| ES | Spain | 81.4% | 95.2% | 40.0% | 100.0% | 40.0% | 64.3% | 100.0% | 64.3% | 1.60 | 1.37 | 2.20 |
| SE | Sweden | 100.0% | 100.0% | 18.9% | 85.2% | 16.1% | 74.1% | 79.9% | 59.2% | 3.68 | 2.02 | 7.46 |
| SE | Switzerland | 45.5% | 33.1% | 2.3% | 60.6% | 1.4% | 2.4% | 61.7% | 1.5% | 1.03 | 1.20 | 1.24 |
| GB | UK | 100.0% | 100.0% | 100.0% | 100.0% | 100.0% | 100.0% | 100.0% | 100.0% | 1.00 | 1.00 | 1.00 |
| UA | Ukraine | 5.3% | 22.0% | 3.7% | 75.5% | 2.8% | 10.7% | 32.2% | 3.4% | 1.24 | 1.23 | 1.53 |
| Average | 72.2% | 74.6% | 60.4% | 84.4% | 53.7% | 63.7% | 81.9% | 55.6% | ||||
Table 8.
Correlations of results.
| Overall NDEA 2018 (X→Z→Y) | Overall NDEA 2022 (X→Z→Y) | DEA 2022 (X→Y) | |
| DEA 2018 (X→Y) | 82.7% | 93.4% | |
| DEA 2022 (X→Y) | 83.9% | ||
| Overall NDEA 2018 (X→Z→Y) | 84.6% | ||
| First stage NDEA 2018 (X→Z→Y) | First stage NDEA 2022 (X→Z→Y) | DEA 2022 (X→Z) | |
| DEA 2018 (X→Z) | 84.3% | 94.8% | |
| DEA 2022 (X→Z) | 92.4% | ||
| First stage NDEA 2018 (X→Z→Y) | 89.0% | ||
| Second stage NDEA 2018 (X→Z→Y) | Second stage NDEA 2022 (X→Z→Y) | DEA 2022 (Z→Y) | |
| DEA 2018 (Z→Y) | 49.8% | 54.0% | |
| DEA 2022 (Z→Y) | 51.8% | ||
| Second stage NDEA 2018 (X→Z→Y) | 54.1% |
Disclaimer/Publisher’s Note: The statements, opinions and data contained in all publications are solely those of the individual author(s) and contributor(s) and not of MDPI and/or the editor(s). MDPI and/or the editor(s) disclaim responsibility for any injury to people or property resulting from any ideas, methods, instructions or products referred to in the content. |
© 2024 by the authors. Licensee MDPI, Basel, Switzerland. This article is an open access article distributed under the terms and conditions of the Creative Commons Attribution (CC BY) license (http://creativecommons.org/licenses/by/4.0/).
Copyright: This open access article is published under a Creative Commons CC BY 4.0 license, which permit the free download, distribution, and reuse, provided that the author and preprint are cited in any reuse.


