
Submitted:
25 November 2024
Posted:
27 November 2024
You are already at the latest version
Abstract
The objective of this research is to estimate the differences in sales levels between businesses operated by individuals who self-identify as indigenous (IE) and those who do not (NIE), as well as between men (ME) and women (WE), and how this intersection may affect their sales levels. To achieve this, an Analysis of Variance (ANOVA) will be employed to compare the means between the analyzed groups, and Tukey's Honestly Significant Differences (HSD) will be used to determine the magnitude and direction of these differences. The study results reveal that businesses led by indigenous individuals have sales that are 26% below the general average, while businesses led by women show a 70.6% reduction in the same comparison. Furthermore, businesses led by indigenous women have, on average, 93.5% lower sales. These findings suggest that the challenges faced by entrepreneurs reflect the structural inequalities observed in other areas of society, highlighting the need for public and private actions focused on reducing these gaps.
Keywords:
Entrepreneurship
; Self-Employment
; Intersectionality
1. Introduction
It is estimated that in Mexico, 23.2 million people aged 3 and older self-identify as indigenous, according to the 2020 Population and Housing Census, which represents 19.4% of the country’s total population. Quantifying this group is complex and varies depending on its conceptualization. At the community level, indigenous people can be identified based on historical, cultural, linguistic, territorial, religious, and other factors. At the individual level, an indigenous person is someone who self-identifies as part of these indigenous populations [1].
According to available evidence, poverty and belonging to an indigenous community are positively correlated. Internationally, individuals who belong to an indigenous group are more likely to live in poverty compared to non-indigenous people in the same country [2,3]. In Mexico, 71.9% of the indigenous population lives in moderate poverty, and 28.5% in extreme poverty, compared to the non-indigenous population, where 39.5% live in poverty and 6.3% in extreme poverty [4]. This situation is linked to various factors, including historical marginalization, lack of access to education and healthcare, and limited economic opportunities.
There is growing interest in the relationship between entrepreneurship and poverty due to its potential impact on economic development, innovation, and access to resources [5]. Entrepreneurship has been proposed as a possible solution to mitigate poverty [6,7]. In this context, it is essential to consider factors such as access to financial resources, government support, training, and the overall business environment
Within this framework, the concept of indigenous entrepreneurship has gained relevance. It is argued that entrepreneurship among indigenous populations promotes self-determination, economic independence, and the preservation of traditions within their communities [8]. However, the goals and outcomes of businesses, organizations, or regions led or operated by indigenous individuals, compared to other types of leadership, remain underexplored
This type of entrepreneurship is characterized by the use of traditional ecological knowledge in biodiversity conservation, participation in land management markets, and the creation of conservation areas managed or co-managed by indigenous people [9]. Unlike conventional entrepreneurship, which often focuses on individual profit, indigenous entrepreneurship places a strong emphasis on community well-being [10].
There is a need to deepen understanding of the relationship between performance variables, such as sales levels, productivity, or market participation, and the fact that these businesses or enterprises are led by indigenous individuals. Exploring this relationship could help identify whether significant differences exist, understand their causes, and, if necessary, propose actions to reduce inequality gaps
The objective of this research is to estimate the differences in sales levels between businesses operated by individuals who self-identify as indigenous and those operated by individuals who do not. Additionally, it seeks to estimate the differences between businesses operated by women compared to those operated by men. Furthermore, from an intersectionality perspective, the research aims to evaluate how the combination of these characteristics affects sales. To achieve this, an Analysis of Variance (ANOVA) will be employed to compare the means between the analyzed groups, and Tukey’s Honestly Significant Differences (HSD) will be used to determine the magnitude and direction of these differences, using data from the National Income and Expenditure Surveys for the years 2016 to 2022.
1.1. About Indigenous Peoples
International law, through instruments such as the ILO Convention 169 and the United Nations Declaration on the Rights of Indigenous Peoples, provides a legal basis for defining indigenous peoples. These instruments highlight elements such as:
a) Direct descent from populations that inhabited a territory prior to colonization, and
b) The preservation of their own social, economic, cultural, and political institutions, even if these have undergone modifications over time.
This conceptualization presents several challenges. Identifying the “original” inhabitants of a region can be a complex task that depends on the temporal framework used, as even before colonization there were dynamics of conquest, displacement, and subjugation. Moreover, determining the extent to which an institution can be “modified” before it is no longer considered indigenous is a significant challenge.
Identifying an individual as indigenous requires a multi-perspective and cautious approach. According to Stavenhagen [11], “indigeneity is the result of government policies imposed from above and from outside,” characterized by a process of historical injustices, dispossession, and servitude.
Bonfil [12] proposes a distinction between “indigenous” and “ethnic group.” The former term is associated with colonization and is considered conceptually broader than ethnicity, in the sense that it can encompass one or more ethnic groups, which are, in turn, subsets within a broader society. On the other hand, “ethnic group,” according to Bonfil, refers to a “specific historical unit that shares a common past and a set of distinctive communication codes and relationships.”
In general, any attempt to define the indigenous population based on a single criterion is considered insufficient; thus, categorizations relying solely on aspects such as language or region are discarded. However, when attempting to estimate the size of this population through income surveys or population censuses, it is necessary to formulate specific questions that capture the complexity of indigenous identification. In this sense, the respondent’s self-identification can encompass the multiple dimensions of indigenous identity through a self-identification question [13].
Self-identification is based on social identity theory, which suggests that individuals categorize themselves as belonging to various groups, such as a professional group, a fanbase of a specific music band, or as people with or without children. Along with this self-categorization, individuals also evaluate the groups they feel they belong to (in-groups) and the groups they do not consider themselves part of (out-groups) [14]. This type of categorization will be employed in this study
1.2. About Entrepreneurship and Self-Employment
From the earliest studies on entrepreneurship, it has been established that it is inherently associated with change, creativity, and innovation. Schumpeter [15] referred to this concept as “creative destruction,” describing the process of introducing goods or services that displace existing ones, thereby creating or segmenting new markets.
Baumol classifies entrepreneurship based on its objectives. Productive entrepreneurship contributes to social welfare, including the introduction of new products or production processes. In contrast, unproductive entrepreneurship aims to obtain transfers, often through rent-seeking or violence. Entrepreneurship becomes destructive when resources are used for rent-seeking or the expropriation of wealth [16]. While unproductive entrepreneurship may lead to economic inefficiencies and suboptimal resource allocation, destructive entrepreneurship has far more severe consequences, such as environmental damage, significant economic losses, and social deterioration. Unproductive entrepreneurship often operates within legal boundaries, sometimes exploiting loopholes or inefficiencies, whereas destructive entrepreneurship frequently involves illegal activities.
An analysis of the relationship between institutional development, entrepreneurship, and social value suggests that a robust institutional framework enables entrepreneurship to generate social value at an aggregate level. However, at an individual level, entrepreneurs can both create and destroy social value [17]. This analysis underscores the importance of proper regulation and the allocation of financial resources to projects that generate social value not only at an aggregate level but also at the business level.
Complementing this, the concept of evasive entrepreneurship has been developed. This is defined as “a market-driven entrepreneurial activity that seeks to bypass the existing institutional framework by using innovations to exploit contradictions within that framework” [18]. In rigid labor markets, evasive entrepreneurship often manifests as self-employment. Individuals unable to find formal employment or who consider formal wages insufficient often offer goods and services irregularly or informally through self-employment or microenterprises.
Another classification for entrepreneurship is based on motivation [19]. On one hand, there is necessity-driven entrepreneurship, which arises from a lack of other options or alternatives. Although these ventures can sometimes be a catalyst for innovation, they are often associated with lower growth and innovation rates. On the other hand, opportunity-driven entrepreneurship involves businesses initiated to capitalize on an innovative idea or market opportunity.
The variation in the level of aggregate entrepreneurship significantly influences factors such as employment and economic development [20]. The nature and direction of these impacts depend on various factors, including the type of entrepreneurship, the predominant business structures in each region, the adaptability of enterprises to economic fluctuations, and the average size of businesses in different regions. For the purposes of this study, the terms self-employment and entrepreneurship will be used interchangeably, without focusing on whether the entrepreneurial activity arises from necessity or opportunity.
1.3. About Indigenous Entrepreneurship
The concept of indigenous entrepreneurship has gained relevance as entrepreneurship is explored as an alternative to combat poverty and inequality [5]. There is ongoing debate about whether this type of entrepreneurship merits recognition as a distinct field of research [21].
This theory suggests that entrepreneurship within indigenous populations promotes self-determination, economic independence, and the preservation of traditions in indigenous communities [8]. The proposed definition is as follows: “Indigenous entrepreneurship is an activity focused on creating new businesses or pursuing economic opportunities—or both—with the purpose of reducing indigenous disadvantage through the creation of culturally viable and community-acceptable wealth” [21].
Research has advanced in analyzing entrepreneurship in relation to gender [22,23], the migratory status of individuals [24], or rural contexts [25]. Each of these cases identifies specific challenges and opportunities for leveraging entrepreneurship. However, research on the performance of indigenous enterprises in Mexico remains limited, and the challenges faced by members of this social group entail additional complexities.
In the context of this document, these difficulties are reflected in sales levels. This variable is assumed to indirectly reflect aspects such as the type of market in which the business operates, the competition it faces, and the types of goods or services it offers, among other factors.
Based on the above, the following hypothesis can be proposed: Businesses led by individuals who self-identify as indigenous will, on average, have lower performance than those led by individuals who do not self-identify as indigenous.
1.4. About the Sex of Entrepreneurs
There is extensive literature on the relationship between the gender of entrepreneurs and the challenges faced by women entrepreneurs. Numerous studies highlight that women face specific obstacles compared to their male counterparts, including limited access to financing, smaller business support networks, and the persistence of gender stereotypes that influence their ability to develop and scale businesses.
Various theories addressing the relationship between entrepreneurship and feminism have been grouped together [26,27].Greer and Greene propose understanding this relationship through three feminist perspectives: liberal, Marxist, and radical [26]. The liberal perspective assumes that women and men are autonomous and equal individuals. Thus, differences observed in entrepreneurial activity and performance are attributed to legal or institutional barriers. Although some of these barriers to women’s entrepreneurship have been reduced over time, their cumulative effects remain significant, particularly in terms of participation and performance. These institutional barriers include disparities in the type and level of education [27],., prior labor market participation and entrepreneurial experience [28,29], social and support networks [30], and the quality and accessibility of formal and informal financial systems [31,32]
The Marxist perspective argues that unpaid domestic labor, which women perform in significantly greater proportions than men, places them at a disadvantage in terms of market participation and remuneration. Women often turn to entrepreneurship to address this disadvantage [33]. Some studies suggest that women’s entrepreneurship may reproduce the inequalities of an oppressive system rather than serve as a mechanism for economic liberation [34]. In this context, women’s entrepreneurship can provide an alternative for balancing domestic labor and market participation. Various studies have examined this phenomenon by estimating how factors like marriage, having young children, or caregiving responsibilities affect business performance. In most cases, these characteristics negatively impact business outcomes [35].
From the radical feminist perspective, while biological differences exist between men and women, they are not the fundamental cause of societal inequalities [35]. Instead, radical feminism argues that differences in behavior and attitudes are largely due to socialization and cultural conditioning, which perpetuate gender roles tied to sex [36]. Biological experiences may influence certain aspects of women’s lives, but radical feminism does not consider these experiences as necessarily leading to specific attitudes, such as caregiving or conflict resolution. Instead, it emphasizes that expectations of care and submission imposed on women are cultural constructions designed to maintain their subordination and perpetuate male dominance [37].
This perspective views differences in entrepreneurship and business performance as a result of a system that marginalizes women for the benefit of men. Market institutions often favor men, as seen in restricted access to financial systems and limited opportunities to build support networks for their businesses [38]. Additionally, gender roles in certain communities can marginalize women or impose social costs as a consequence of this system [39]. Advocates of this perspective propose the creation of spaces specifically designed and implemented for women, such as training groups, financial products, and even dedicated markets.
Based on this, the following hypothesis is proposed: Businesses led by women, on average, perform worse than those led by men.
1.5. Intersectionality and Entrepreneurship
Intersectionality is a theoretical approach that originally proposed that the intersection of race and gender shapes the way individuals experience social phenomena, such as discrimination or violence [40]. This concept has since been expanded to include other intersections, such as socioeconomic status [41], sexual orientation [42], gender [43], migration status [44] and religion [45]. Fundamentally, this approach suggests that these characteristics do not independently influence a person’s life but rather interact to shape their social experiences, including entrepreneurship.
Research on intersectionality in entrepreneurship is an emerging field [46]. This perspective has been used to study work-life balance and how power relations and social interactions within and across cultural, structural, and agency dimensions influence the operation of businesses owned by migrant women [47]. Additionally, the complexities of racialized women’s experiences, struggles, and resistance in specific contexts have been highlighted, demonstrating how these factors affect entrepreneurial performance [46].
The relationship between intersectionality and entrepreneurship has been proposed as a threshold concept for studying inequalities across different types of entrepreneurship and their contexts [48]. From this perspective, understanding entrepreneurship through the lens of intersectionality provides a new starting point for conceptualizing and empirically studying entrepreneurial activities [48].
Based on this, the following hypothesis is proposed: Businesses led by individuals who identify as both women and indigenous will, on average, have lower sales than their counterparts. The difference between these groups will be greater than if these characteristics are considered separately.
2. Materials and Methods
Publicly available data from the National Income and Expenditure Survey (ENIGH) was used for the period 2016 to 2022. This survey, conducted biennially, provides an overview of household income and expenditures in Mexico. The questionnaire identifies individuals’ sources of income; for this study, only individuals who reported earning their income as independent workers were selected. The survey defines an independent worker as “a person who manages their own company or business, without having a boss or superior to whom they report their performance or results.” For the purposes of this study, independent workers are considered entrepreneurs.
The same survey collects information on the entrepreneur’s gender and includes the following question: “According to the culture of (), does he/she consider themselves indigenous?” If the respondent answers affirmatively, they are classified as an indigenous entrepreneur (IE). Conversely, those who respond negatively are classified as non-indigenous entrepreneurs (NIE). The survey also includes information on quarterly business sales. For descriptive statistics, sales data were converted into U.S. dollars for each period; however, for subsequent analysis, the values remain in pesos, with their equivalent dollar amounts provided in parentheses.
Initially, the study explores how disparities between analyzed groups are distributed as sales increase. To do this, percentiles are constructed for each group, and the gap is calculated for the four periods analyzed [49].
To estimate whether there are statistically significant differences in sales levels between the compared groups, an Analysis of Variance (ANOVA) was conducted. Income data do not follow a normal distribution and show a clear skew due to outliers reporting unusually high quarterly sales. However, the assumption of normality for residuals in ANOVA models is only necessary for small samples. Thanks to the Central Limit Theorem, even extreme violations of normality assumptions are not problematic for samples consisting of several hundred participants [50].
Additionally, Tukey’s Honestly Significant Differences (HSD) test was applied. This post hoc method is used in ANOVA to make multiple pairwise comparisons of group means. It is particularly useful after finding a significant ANOVA result when determining which specific groups differ from each other.
3.1. Descriptive Results
The descriptive data are presented in Table 1. Notably, the percentage of Indigenous Entrepreneurs (IE) during the analyzed period ranged from 35% to 38%, a significantly higher figure compared to the 19.4% of the general population in Mexico who self-identify as indigenous. The income data shown are quarterly and expressed in nominal terms, revealing a wide dispersion.
Sales growth followed a similar trend across groups: an increase between 2016 and 2018, a decline from 2018 to 2020, and a resurgence of growth in the final period from 2020 to 2022. The percentage of Women Entrepreneurs (WE) ranged from 56.4% to 57.2%, while the proportion of IE ranged from 35% to 38.2%.
Some survey respondents reported zero income, a phenomenon commonly observed in self-reported income surveys. To address this methodological challenge, the first step is to determine whether these zero-income responses are randomly distributed among the analyzed groups. In this survey, zero-income responses disproportionately affected women, accounting for 65% to 70% of such cases depending on the period, and IE, representing 31% to 37% of these cases (Table B1).
Given that the distribution of zero sales data is not random, there are three options for handling this issue: imputing, removing, or retaining the data. Imputing involves estimating these incomes based on other available survey data. However, this option was deemed unviable because the objective of this study is to identify relationships, and previous studies have shown significant biases associated with this method [51].
The second option, removing zero-sales observations, was also deemed unsuitable, as it would result in the loss of valuable information by excluding low-performing businesses. Since the survey reports sales rather than salaries, zero sales responses may simply reflect poor performance rather than a lack of participation. Thus, the chosen approach was to conservatively retain the zero-income observations, given that their proportion is relatively small: 2.8% in 2016, 2.6% in 2018, 3% in 2020, and 2.4% in 2022 of the total observations
Graph 1.
Quarterly sales gap between indigenous and non-indigenous, by percentile and period.
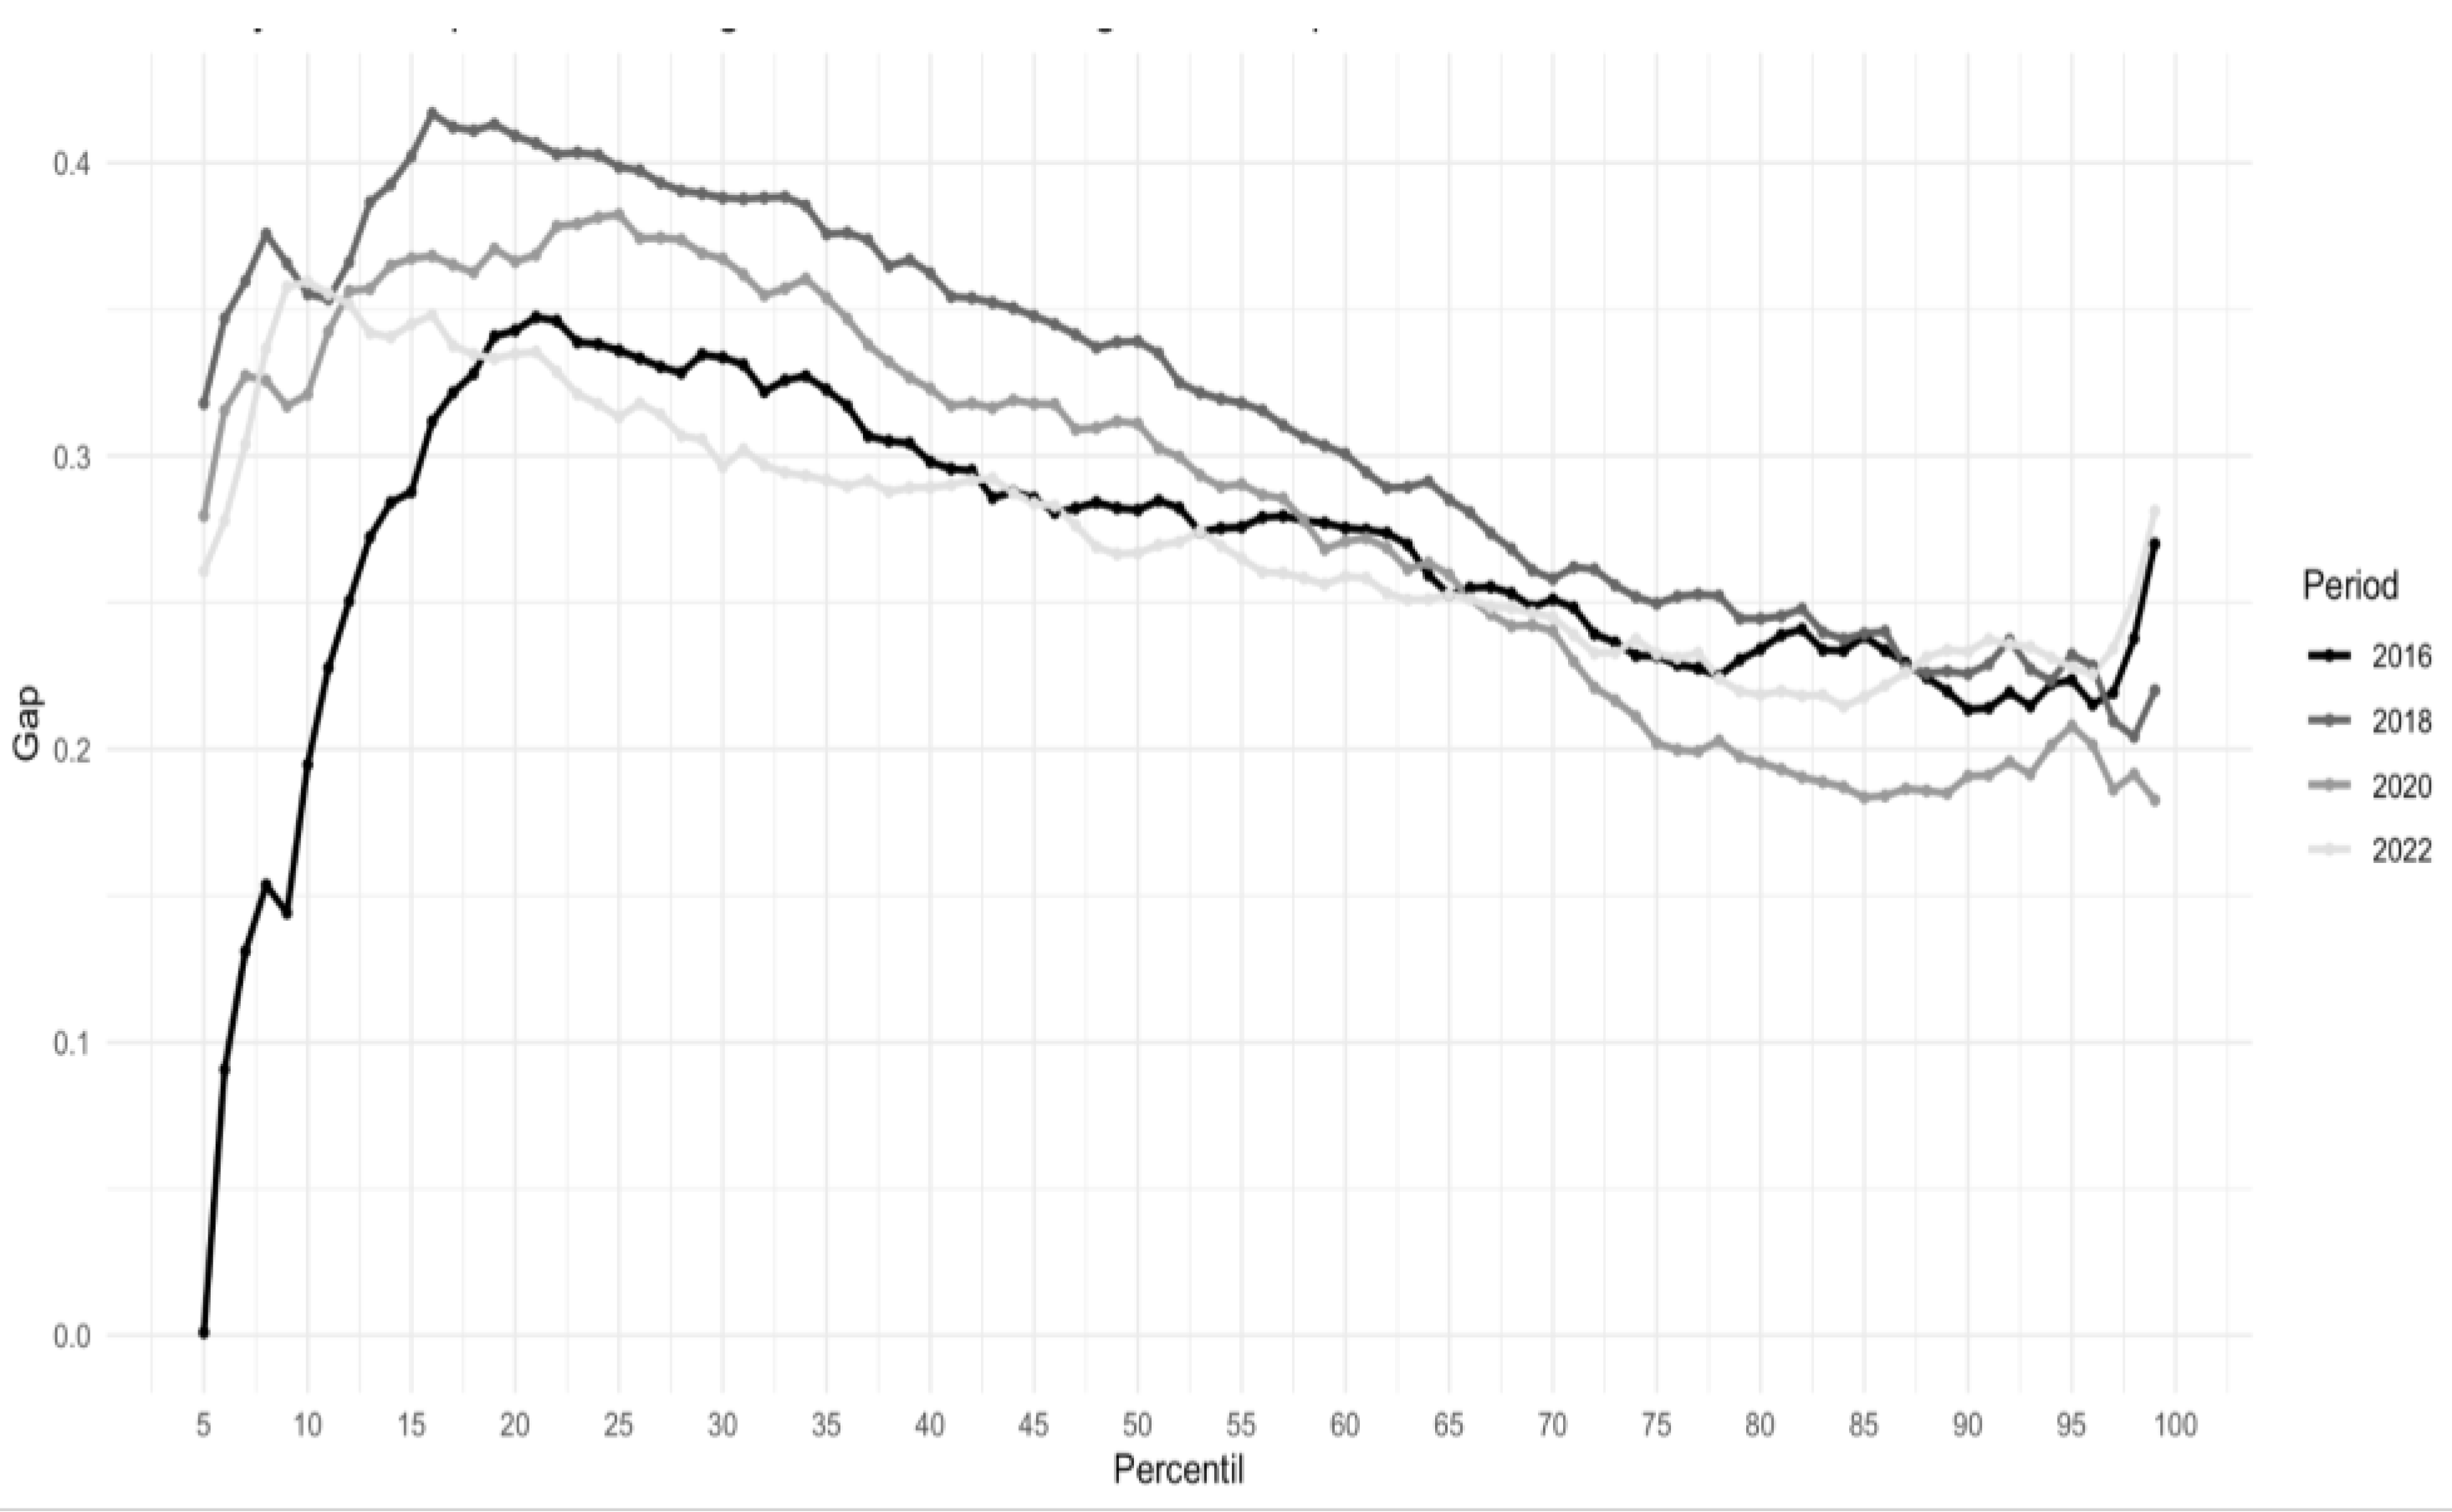
First, a graphical analysis of the gap between the groups of interest was conducted. For this purpose, the sales data were sorted from highest to lowest, and the ratio was calculated. Values above zero indicate a bias in favor of ME or NEI, while values below zero indicate higher income for WE or IE in the specified percentile. The closer the ratio is to zero, the smaller the gap, regardless of direction.
The representation begins at the 5th percentile because sales values equal to or very close to zero prevented the accurate calculation of the ratio. The four graphs presented show a similar trend: as income increases, the gap decreases. However, in some periods—particularly in comparisons between IE and NIE —the gap widens in the higher percentiles.
Graph 2.
Quarterly sales gap between women and men, by percentile and period.
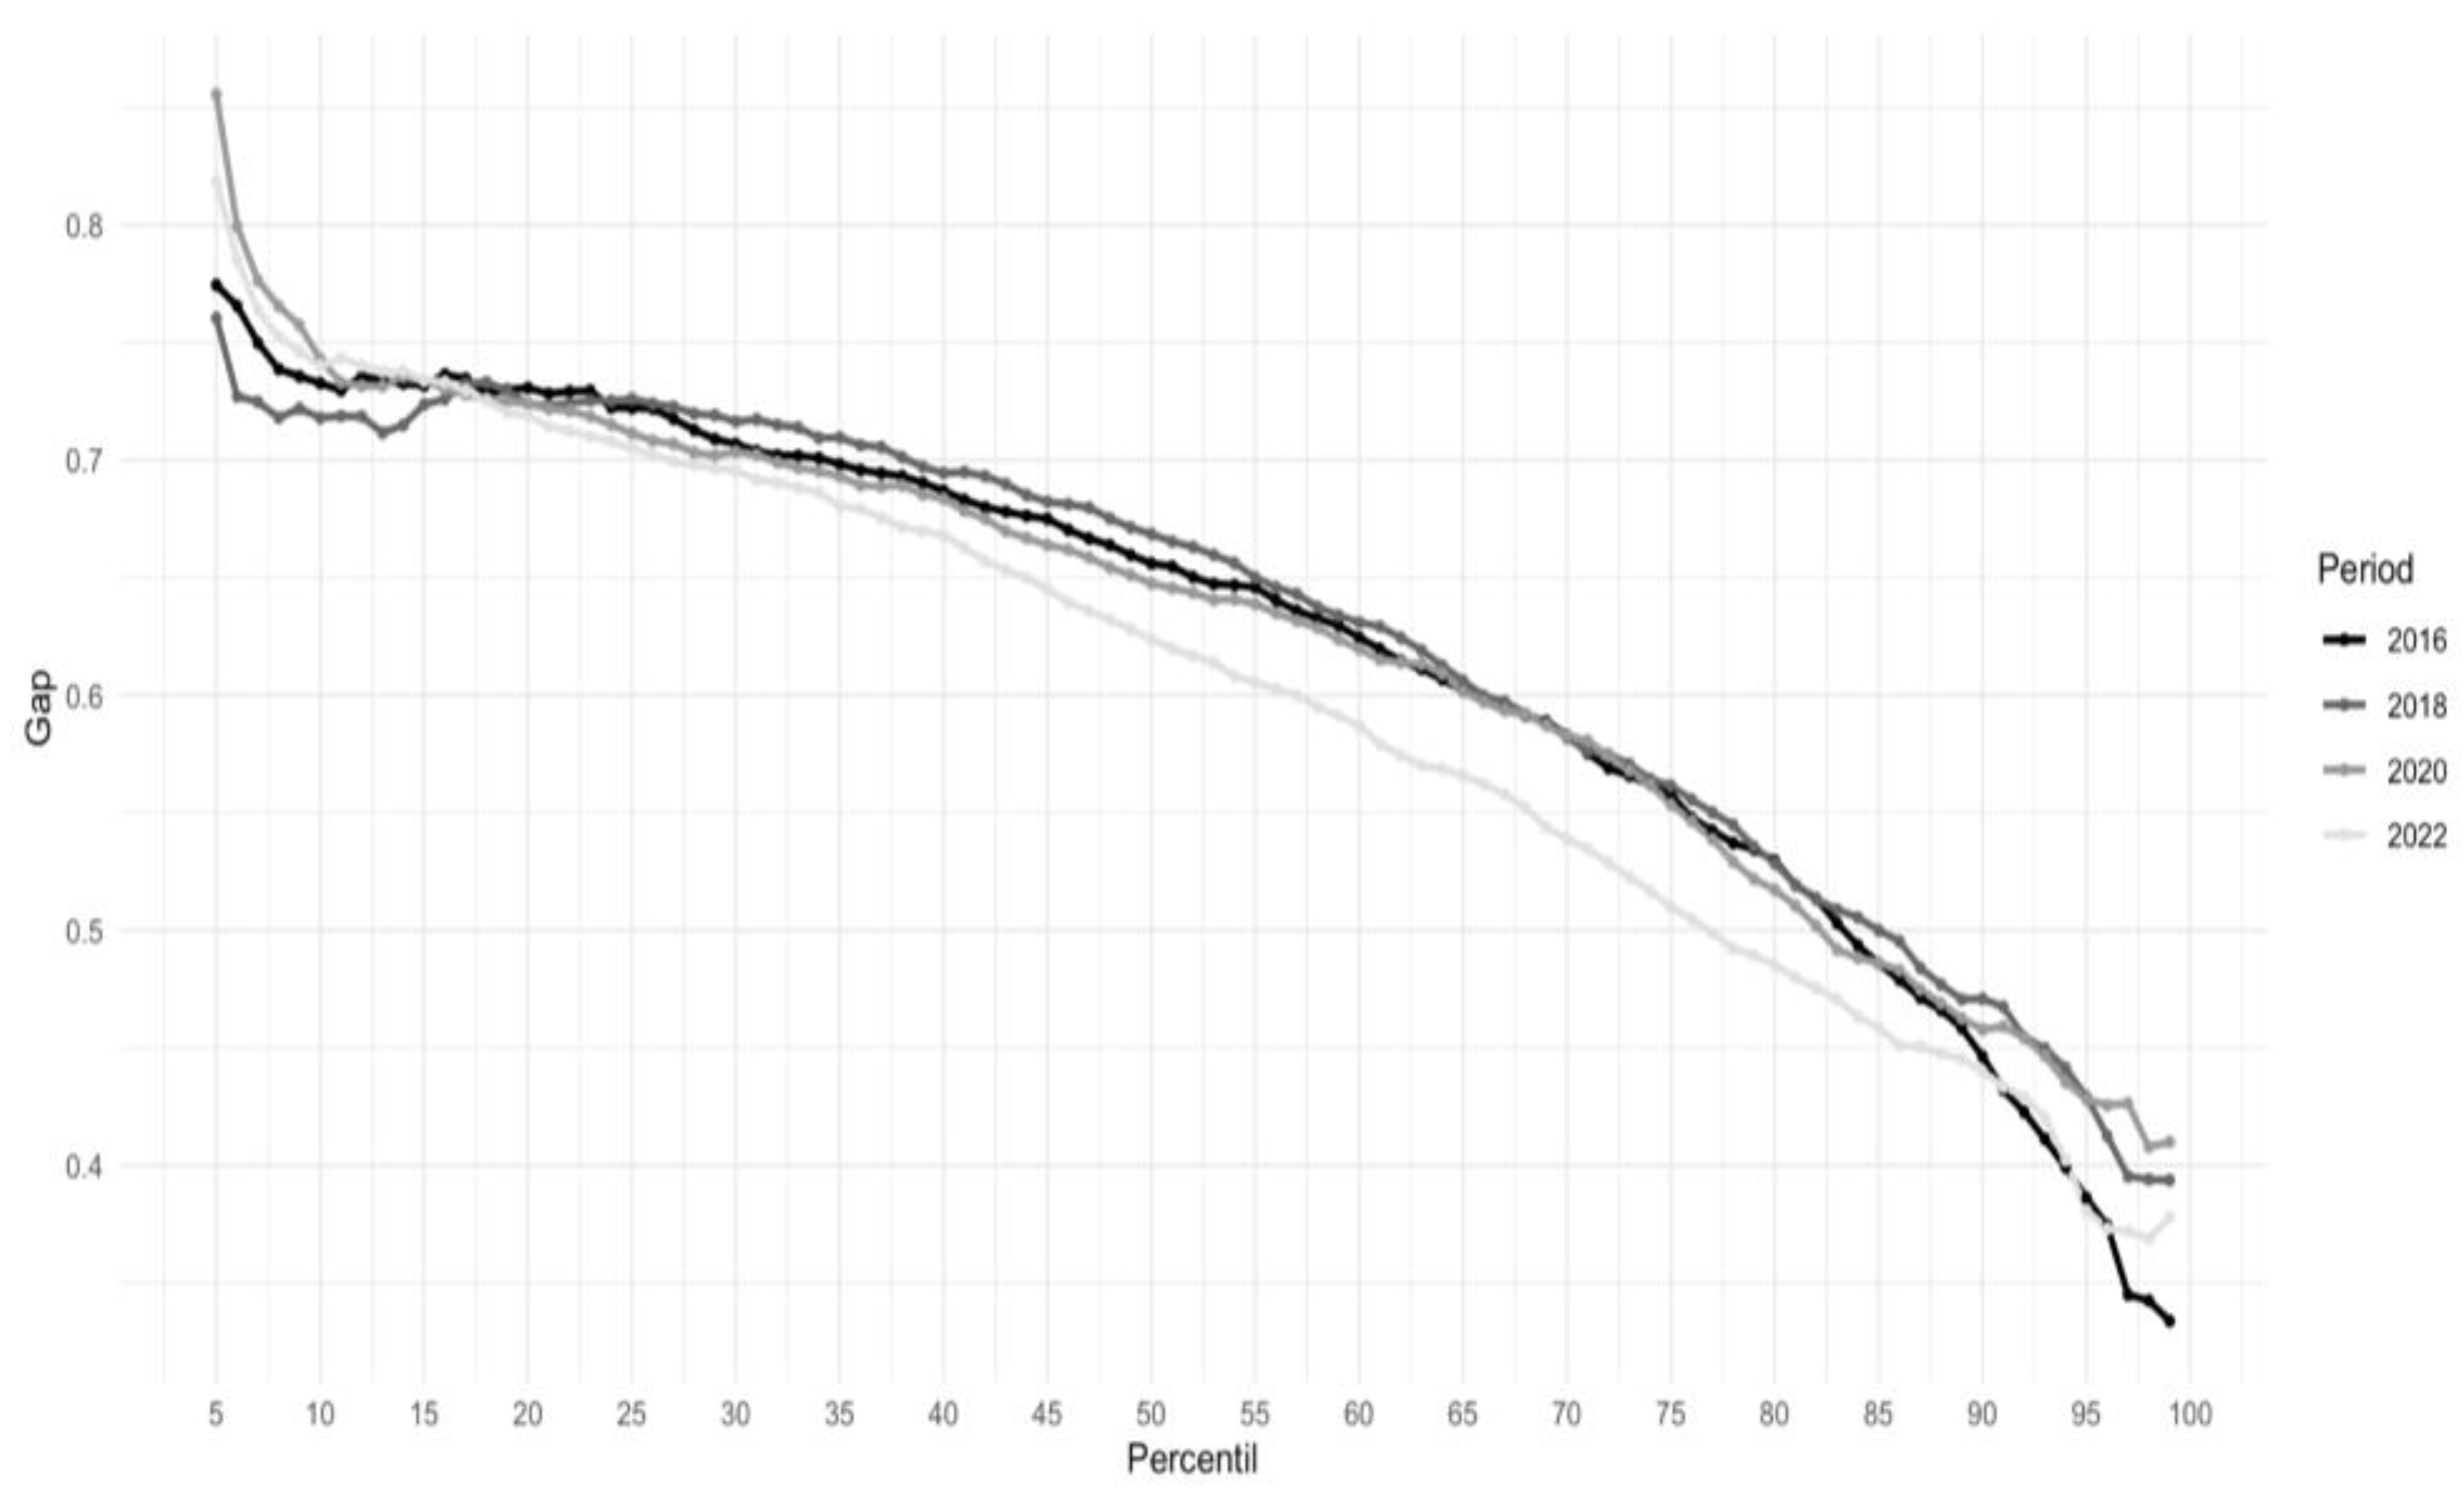
The reduction in gaps as income increases can be attributed to several factors. The first is a statistical effect: in the lower percentiles, small absolute differences represent relatively large gaps. Another explanation is that high sales income is often achieved in non-traditional economic sectors where consumers value goods or services based on their quality or price, leaving less room for considerations of other factors.
Finally, the reduction in the gap can be explained by initial barriers to financing. For entrepreneurs with low sales, self-financing or high-interest loans are often the only available options. However, as sales increase, entrepreneurs gain access to standardized financial products across groups.
Graph 3.
Quarterly sales gap between Indigenous women and men by percentile and period.
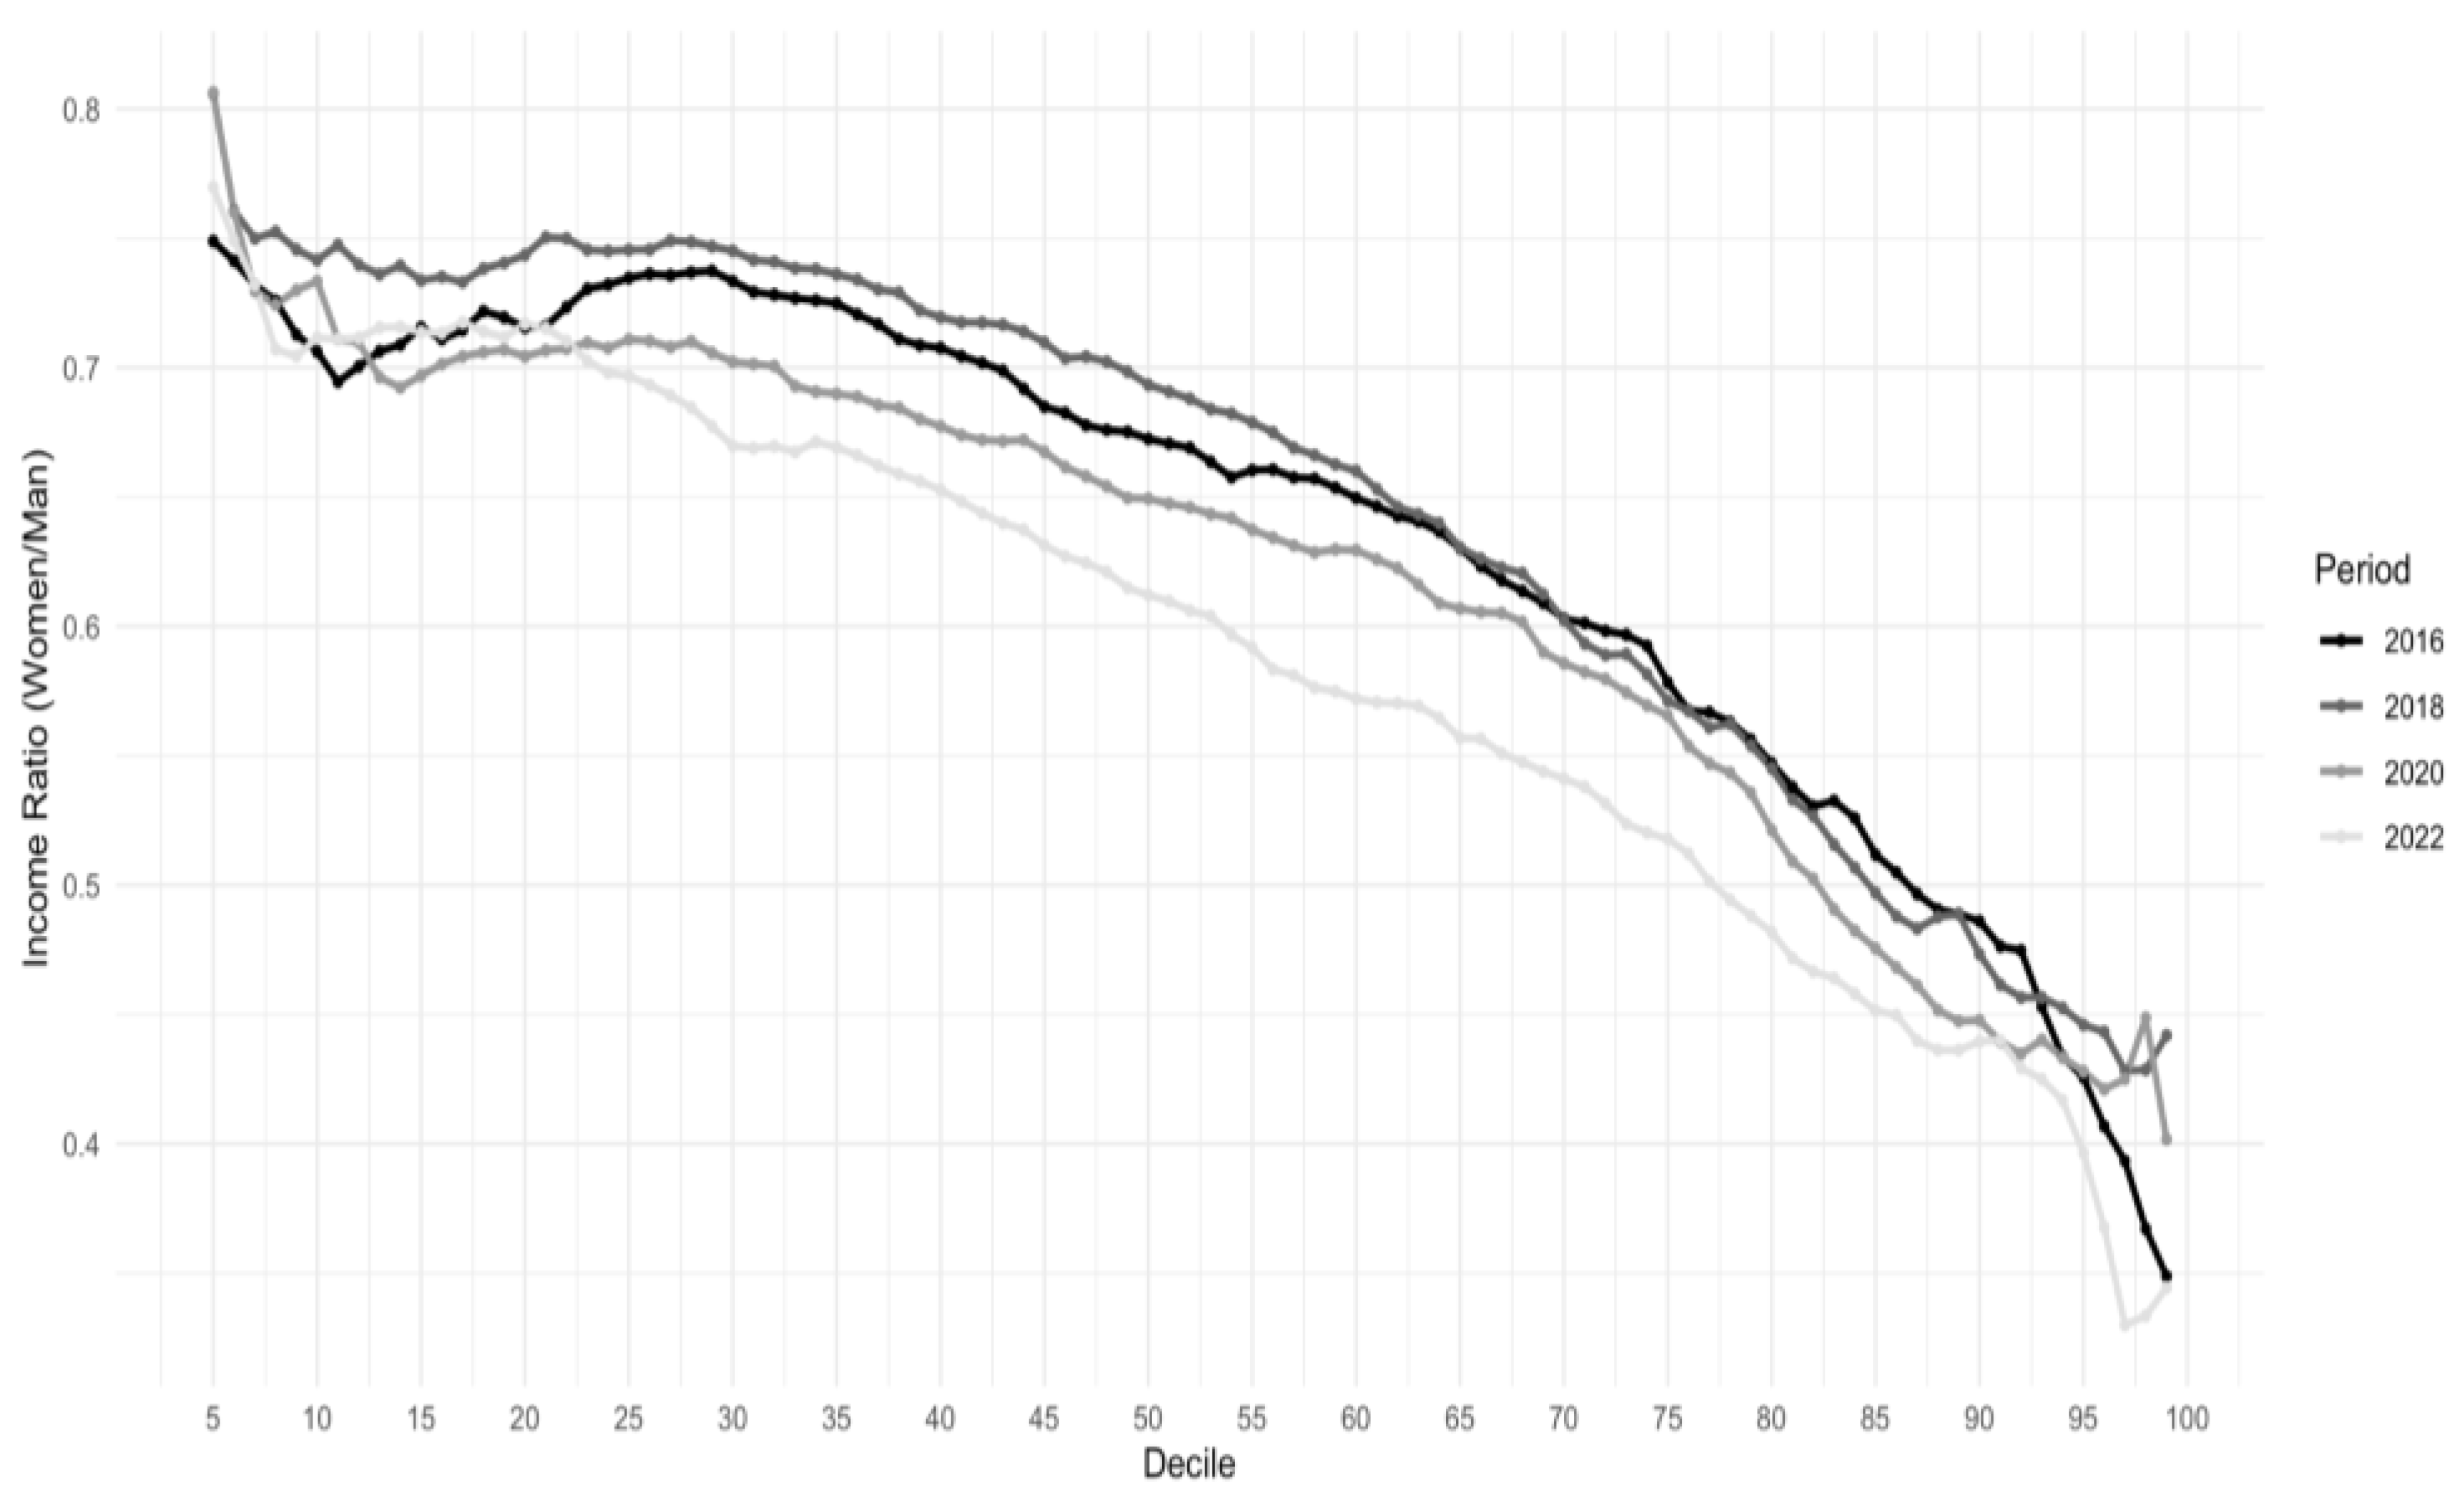
The gap is never less than zero. However, the smallest difference for the lower deciles among the analyzed groups is observed between IE and NIE, showing a slower reduction as income increases and a resurgence in the higher percentiles.
In the other comparisons, contrasting income between WE and ME, the gap is significantly larger. It is unclear whether this gap consistently decreases over time across all income levels. The most compelling graphical evidence is for the ratio between indigenous women and men. In this case, the 2022 period shows a notable reduction compared to the other periods.
Graph 4.
Quarterly sales gap between No-Indigenous women and men by percentile and period.
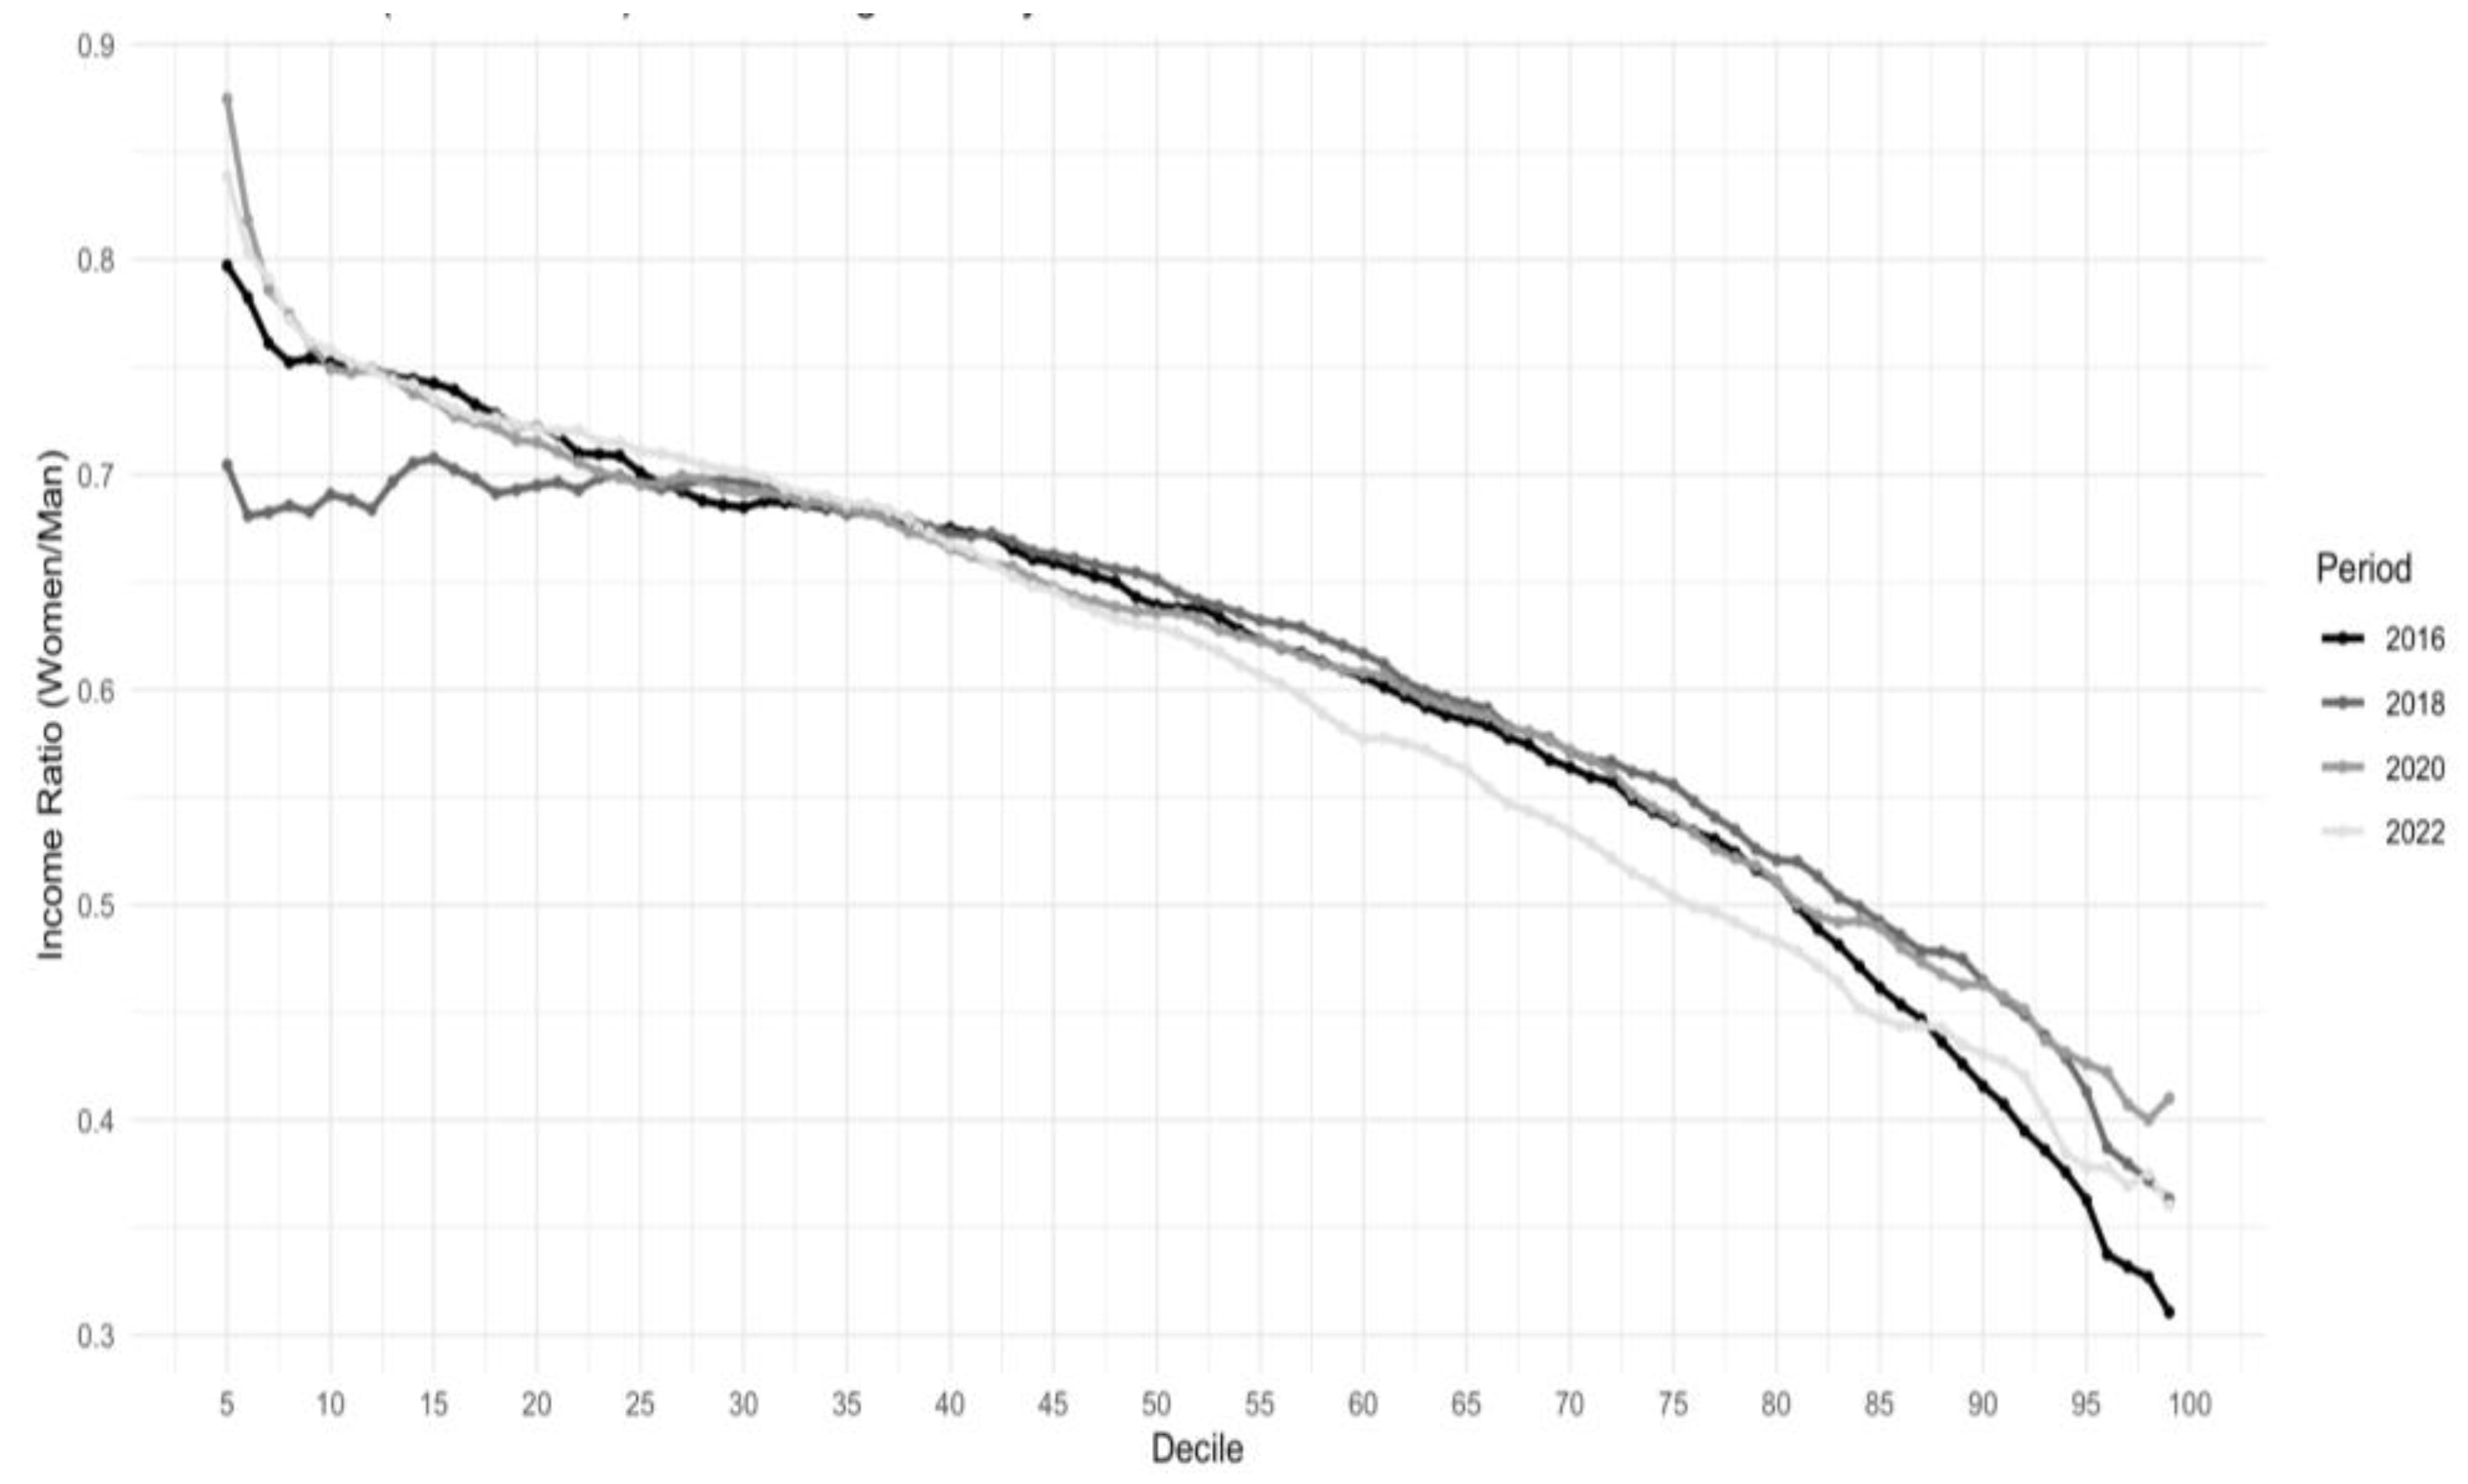
For the analyzed period, it appears that the reduction in the gap is more closely associated with income growth rather than the passage of time. The middle percentiles show the smallest gap in 2022 when comparing ME and WE, suggesting partial success in inclusion efforts and policies.
However, progress remains to be made at both lower and higher income levels, referred to as the “sticky floor” and “glass ceiling,” respectively. These phenomena highlight the conditions that prevent certain groups from advancing: the “sticky floor” describes barriers that hinder the initial growth of their ventures at the same pace as others, while the “glass ceiling” refers to invisible obstacles that prevent ventures from surpassing a certain threshold of success.
3.2. ANOVA and Tukey Results
The results in Table 2 confirm that there is indeed a statistically significant difference in the average sales of IE compared to NIE, as well as between WE and ME. The latter comparison shows a larger disparity across all periods analyzed.
The variation in these differences over time is not consistent, with the largest gap observed in 2022 for both comparisons. Referring to the differences reported in Table 2, the average sales difference for IE compared to NIE was -23.9% in 2016, -28.45% in 2018, -24% in 2020, and -27.39% in 2022, based on the average sales reported in Table 1. This represents an average sales difference of -26% for IE during the analyzed period.
For the WE vs. ME comparison, the disparities are more pronounced, with differences of -69% in 2016, -73.6% in 2018, -72.1% in 2020, and -67% in 2022, resulting in an average sales gap of -70% during the analyzed period. These findings provide evidence to support the first two hypotheses: the data demonstrate that both gender and indigenous identity are associated with average sales that are significantly below the overall average for entrepreneurs.
Finally, the results in Table 3 show the differences when combining the characteristics previously discussed. In all comparisons, the anticipated disadvantages are reflected in the sales performance of the ventures.
When analyzing the Indigenous: Women vs. Non-Indigenous: Men comparison, a statistically significant difference is observed across all periods analyzed. Regarding the average sales reported for each period, the differences are -89.7% in 2016, -99.8% in 2018, -92.9% in 2020, and -91.4% in 2022, resulting in an average sales gap of -93.5% during the analyzed period.
This result partially supports the third hypothesis proposed: the intersectionality of being an indigenous woman indeed has a more negative impact on sales levels, but the effect is less severe than the combined impact of these characteristics considered separately.
4. Discussion
Entrepreneurship is proposed as a mechanism for social mobility and reducing inequalities. However, for this assumption to hold true, it is crucial to consider the structural disadvantages faced by certain groups, which further complicate an already challenging endeavor.
Women face additional challenges, such as the inequitable distribution of household responsibilities, which limits the time available to operate their businesses. This can be reflected in lower sales. Similarly, businesses run by Indigenous individuals also tend to have lower average sales, which hinders their social mobility. This can be associated with limited access to financing, operation in traditional sectors, or small markets. From an intersectionality perspective, it is evident that Indigenous women entrepreneurs have lower sales compared to non-Indigenous women entrepreneurs and Indigenous male entrepreneurs. This highlights the importance of specific public and private actions that consider structural and intersectional inequalities when designing interventions or public policies.
The findings highlight the importance of exploring other dimensions of inequality, such as access to education, social networks, and training programs. Future research should also examine how cultural, regional, and industry-specific factors influence the performance of marginalized entrepreneurs.
Author Contributions
All authors contributed equally.
Funding
This research received no external funding.
Data Availability Statement
All the information used for this document is publicly available and can be accessed at the following link https://www.inegi.org.mx/programas/enigh/nc/2022/. On the same page, the questionnaires and their coding are also accessible.
Conflicts of Interest
The authors declare no conflicts of interest.
Appendix A
To test the hypothesis, an ANOVA model is used. The analysis starts with the null hypothesis , which states that there are no differences in the means between the analyzed groups:
The alternative hypothesis is defined as: there are differences in the means between the analyzed groups.
The ANOVA test itself provides an overall p-value to determine if there are statistically significant differences among group means. If the ANOVA p-value is less than 0.05, it indicates that at least one group differs significantly from the others.
Prueba Tukey HSD
The Tukey’s HSD test is a post-hoc analysis used to compare all possible pairs of group means following an ANOVA test. It identifies which specific means are significantly different while controlling the family-wise error rate. The formalization involves the following steps:
The difference between two group means ( is compared against a critical value
= is the critical value of the studentized range distribution for a significance level ,grupos, y degrees of freedom for the error.
= is the mean square error obtained from the ANOVA
= is the number of observations per group, assuming equal sample sizes; if the sample sizes are unequal, the average group size is used.
Finally, it is tested whether the absolute value of the difference between the means of two groups is greater than or equal to the HSD. If this condition is met, the difference between the compared groups is considered significant.
Tukey’s test provides P-Adjusted (P-Adj) values for pairwise comparisons, indicating whether the observed differences are statistically significant after correcting for multiple comparisons.
Appendix B

Table B1.
Responses with zero sales totals by year and group.
| Year | Number of “0” values | % of total observations | Indigenous | No Indigenous | Men | Women |
| 2016 | 509 | 2.83% | 160 | 349 | 170 | 339 |
| 2018 | 503 | 2.65% | 179 | 324 | 173 | 330 |
| 2020 | 747 | 3.03% | 279 | 468 | 224 | 523 |
| 2022 | 571 | 2.39% | 189 | 382 | 177 | 394 |
References
- Cobo, J.R.M. Estudio del problema de la discriminación contra las personas indígenas. Naciones Unidas; 1986.
- Psacharopoulos, G.; Patrinos, H. Indigenous people and poverty in Latin America. Finance Dev. 1994, 31, 41–41. [Google Scholar]
- Hall, G.; Patrinos, H.A. Indigenous people, poverty and human development in Latin America. 1st ed. New York (NY): Palgrave Macmillan; 2006.
- CONEVAL. Medición de la pobreza 2022 [Internet]. 2022 [cited 2024 Nov 22]. Available from: https://www.coneval.org.mx/Medicion/MP/Documents/MMP_2022/Pobreza_multidimensional_2022.pdf.
- Moradi, M.; Imanipour, N.; Arasti, Z.; Mohammadkazemi, R. Poverty and entrepreneurship: A systematic review of poverty-related issues discussed in entrepreneurship literature. World Rev Entrep Manag Sustain Dev. 2020, 16, 125–152. [Google Scholar] [CrossRef]
- Yunus, M. Poverty alleviation: Is economics any help? Lessons from the Grameen Bank experience. J Int Aff. 1998, 52, 47–65. [Google Scholar]
- Álvarez, S.A.; Barney, J.B. Entrepreneurship opportunities and poverty alleviation. Entrep Theory Pract. 2014, 38, 159–184. [Google Scholar] [CrossRef]
- Henry, E.Y.; Dana, L.P.; Murphy, P.J. Telling their own stories: Māori entrepreneurship in the mainstream screen industry. Entrep Reg Dev. 2018, 30, 118–145. [Google Scholar] [CrossRef]
- Hill, R.; Pert, P.L.; Davies, J.; Walsh, F.J.; Falco-Mammone, F. Indigenous land management in Australia: Extent, scope, diversity, barriers and success factors. Cairns: CSIRO Ecosystem Sciences; 2013.
- Dana, L.P. Indigenous entrepreneurship: An emerging field of research. Int J Bus Globalisation. 2015, 14, 158–169. [Google Scholar] [CrossRef]
- Stavenhagen, R. Los derechos de los indígenas: Algunos problemas conceptuales. Nueva Antropol. 1992, 13, 83–99. [Google Scholar]
- Bonfil, B. El concepto de indio en América: Una categoría de la situación colonial. Plural ADALDC. 2020, 3, 1–15. [Google Scholar]
- Wilson, C. Decolonizing methodologies: Research and indigenous peoples. Zed Books; 2001.
- Trepte, S.; Loy, L.S. Social identity theory and self-categorization theory. In: Rössler P, Hoffner CA, van Zoonen L, editors. The International Encyclopedia of Media Effects. Wiley-Blackwell; 2017. p. 1-13. [CrossRef]
- Schumpeter, J.A. The theory of economic development. Leipzig: Duncker & Humblot; 1911.
- Baumol, W.J. Entrepreneurship: Productive, unproductive, and destructive. J Bus Venturing. 1996, 11, 3–22. [Google Scholar] [CrossRef]
- Lucas, D.S.; Fuller, C.S. Entrepreneurship: Productive, unproductive, and destructive—Relative to what? J Bus Venturing Insights. 2017, 7, 45–49. [Google Scholar] [CrossRef]
- Elert, N.; Henrekson, M. Evasive entrepreneurship. Small Bus Econ. 2016, 47, 95–113. [Google Scholar] [CrossRef]
- Hechavarria, D.M.; Reynolds, P.D. Cultural norms & business start-ups: The impact of national values on opportunity and necessity entrepreneurs. Int Entrep Manag J. 2009, 5, 417–437. [Google Scholar] [CrossRef]
- Ramírez-Urquidy, M. Economic downturns and regional entrepreneurship dynamics in Mexico: Trends and policy implications. Probl Desarro. 2022, 53, 115–157. [Google Scholar] [CrossRef]
- Hindle, K.; Moroz, P. Indigenous entrepreneurship as a research field: Developing a definitional framework from the emerging canon. Int Entrep Manag J. 2010, 6, 357–385. [Google Scholar] [CrossRef]
- Tovar, Y.S.; Ángel, M.; García, M.; Flores, J.E.M. Diferencias en los determinantes del éxito en el emprendimiento en México, una perspectiva de género. Rev Venez Gerenc. 2021, 26, 880–902. [Google Scholar] [CrossRef]
- Sorzano, M.; Flores, Y.; Lugo, C. Capacitación en emprendimiento para el fomento del empoderamiento económico de mujeres privadas de la libertad en la frontera norte de México. In: Santiago CK, Sánchez CI, editors. Desigualdad regional y empobrecimiento: Gestión de los territorios con inclusión social. Vol. 6. UNAM-AMECIDER; 2023. p. 243-256.
- García, C. Emprendimiento caficultor en migrantes de la región huasteca del centro de México. Equidad Desarro. 2018, 1, 119–147. [Google Scholar]
- Paz, I.M.J. Emprendimiento rural como estrategia de desarrollo territorial: Una revisión documental. Econ CUC. 2022, 43, 257–280. [Google Scholar] [CrossRef]
- Greer, M.J.; Greene, P.G. Feminist theory and the study of entrepreneurship. In: Butler JE, editor. New perspectives on women entrepreneurs. Information Age Publishing; 2003. p. 1-24.
- Minniti, M.; Arenius, P. Women in entrepreneurship. In: The entrepreneurial advantage of nations: First annual global entrepreneurship symposium. Vol. 29. United Nations; 2003. p. 1-28.
- Lerner, M.; Brush, C.; Hisrich, R. Israeli women entrepreneurs: An examination of factors affecting performance. J Bus Venturing. 1997, 12, 315–339. [Google Scholar] [CrossRef]
- Alene, E.T. Determinants that influence the performance of women entrepreneurs in micro and small enterprises in Ethiopia. J Innov Entrep. 2020, 9, 1–20. [Google Scholar] [CrossRef]
- Jha, P.; Alam, M.M. Antecedents of women entrepreneurs’ performance: An empirical perspective. Manag Decis. 2022, 60, 86–122. [Google Scholar] [CrossRef]
- Morsy, H. Access to finance–Mind the gender gap. Q Rev Econ Finance. 2020, 78, 12–21. [Google Scholar] [CrossRef]
- Chaudhuri, K.; Sasidharan, S.; Raj, R.S.N. Gender, small firm ownership, and credit access: Some insights from India. Small Bus Econ. 2020, 54, 1165–1181. [Google Scholar] [CrossRef]
- Patrick, C.; Stephens, H.; Weinstein, A. Where are all the self-employed women? Push and pull factors influencing female labor market decisions. Small Bus Econ. 2016, 46, 365–390. [Google Scholar] [CrossRef]
- Goffee, R.; Scase, R. Women in charge: The experiences of female entrepreneurs. Routledge; 2015. [CrossRef]
- Duncan, S. Theorising differences in patriarchy. Environ Plan A. 1994, 26, 1177–1194. [Google Scholar] [CrossRef]
- Liñán, F.; Jaén, I.; Martín, D. Does entrepreneurship fit her? Women entrepreneurs, gender-role orientation, and entrepreneurial culture. Small Bus Econ. 2022, 58, 1051–1071. [Google Scholar] [CrossRef]
- Shahriar, A.Z.M. Gender differences in entrepreneurial propensity: Evidence from matrilineal and patriarchal societies. J Bus Venturing. 2018, 33, 762–779. [Google Scholar] [CrossRef]
- Bui, H.T.; Kuan, A.; Chu, T.T. Female entrepreneurship in patriarchal society: Motivation and challenges. J Small Bus Entrep. 2018, 30, 325–343. [Google Scholar] [CrossRef]
- Baughn, C.C.; Chua, B.L.; Neupert, K.E. The normative context for women’s participation in entrepreneurship: A multicountry study. Entrep Theory Pract. 2006, 30, 687–708. [Google Scholar] [CrossRef]
- Crenshaw, K. Demarginalizing the intersection of race and sex: A black feminist critique of antidiscrimination doctrine, feminist theory, and antiracist politics. Univ Chic Leg Forum. 1989, 1989, 139–167. [Google Scholar]
- Saatcioglu, B.; Corus, C. Poverty and intersectionality: A multidimensional look into the lives of the impoverished. J Macromarketing. 2014, 34, 122–132. [Google Scholar] [CrossRef]
- aylor, Y.; Hines, S.; Casey, M.E., editors. Theorizing intersectionality and sexuality. Palgrave Macmillan; 2010. [CrossRef]
- Shields, S.A. Gender: An intersectionality perspective. Sex Roles. 2008, 59, 301–311. [Google Scholar] [CrossRef]
- Bastia, T. Intersectionality, migration and development. Prog Dev Stud. 2014, 14, 237–248. [Google Scholar] [CrossRef]
- Essers, C.; Benschop, Y.; Doorewaard, H. Female ethnicity: Understanding Muslim immigrant businesswomen in the Netherlands. Gend Work Organ. 2010, 17, 320–339. [Google Scholar] [CrossRef]
- Knight, M. Race-ing, classing and gendering racialized women’s participation in entrepreneurship. Gend Work Organ. 2016, 23, 310–327. [Google Scholar] [CrossRef]
- Forson, C. Contextualising migrant black business women’s work-life balance experiences. Int J Entrep Behav Res. 2013, 19, 460–477. [Google Scholar] [CrossRef]
- Dy, A.M.; MacNeil, H. “Doing inequality, doing intersectionality”: Intersectionality as threshold concept for studying inequalities in entrepreneurial activity. Int J Entrep Behav Res. Forthcoming.
- Arceo-Gómez, E.O.; Campos-Vázquez, R.M. Evolución de la brecha salarial de género en México. Trimest Econ. 2014, 81, 619–653. [Google Scholar] [CrossRef]
- Lumley, T.; Diehr, P.; Emerson, S.; Chen, L. The importance of the normality assumption in large public health data sets. Annu Rev Public Health. 2002, 23, 151–169. [Google Scholar] [CrossRef]
- Bollinger, C.R.; Hirsch, B.T. Match bias from earnings imputation in the Current Population Survey: The case of imperfect matching. J Labor Econ. 2006, 24, 483–519. [Google Scholar] [CrossRef]
Table 1.
Descriptive Statistics.
| Subject | Year | Mean | Growth (%) | Standard Deviation | n | % |
| All observations | 2016 | 10206 | 41391 | 17969 | ||
| 2018 | 11387 | 11.6% | 20602 | 18984 | ||
| 2020 | 10751 | -5.6% | 18956 | 24666 | ||
| 2022 | 16530 | 53.8% | 29359 | 23847 | ||
| Men | 2016 | 14407 | 54634 | 7688 | 43.8% | |
| 2018 | 16189 | 12.4% | 24868 | 8217 | 43.4% | |
| 2020 | 15240 | -5.9% | 23633 | 10572 | 42.9% | |
| 2022 | 22850 | 49.9% | 35693 | 10386 | 43.6% | |
| Women | 2016 | 7065 | 27192 | 10281 | 57.2% | |
| 2018 | 7723 | 9.3% | 15665 | 10767 | 56.7% | |
| 2020 | 7384 | -4.4% | 13545 | 14094 | 57.1% | |
| 2022 | 11654 | 57.8% | 22126 | 13461 | 56.4% | |
| No indigenous | 2016 | 10281 | 11119 | 10281 | 63.3% | |
| 2018 | 10767 | 13.6% | 12626 | 10767 | 61.8% | |
| 2020 | 14094 | -7.1% | 11720 | 14094 | 62.2% | |
| 2022 | 13461 | 54.4% | 18115 | 13461 | 65% | |
| Indigenous | 2016 | 8628 | 37864 | 6587 | 36.7% | |
| 2018 | 9386 | 8.8% | 18503 | 7260 | 38.2% | |
| 2020 | 9141 | -2.6% | 16201 | 9324 | 37.8% | |
| 2022 | 13588 | 48.6% | 25305 | 8349 | 35% |
* The exchange rate for each year is: 20.52 (2016), 20.11 (2018), 19.96 (2020), 19.59 (2022).
Table 2.
Tukey’s Honestly Significant Differences.
| Indigenous-No Indigenous (Americans dollars) | ||||
| Year | Diff. | Lower Limit | Upper Limit | P-Adj |
| 2016 | -121.39 | -182.34 | -60.43 | 0.0000952 |
| 2018 | -161.11 | -190.39 | -131.83 | 0 |
| 2020 | -129.6 | -153.51 | -105.77 | 0 |
| 2022 | -231.05 | -270.1 | -192 | 0 |
| Women-Man (Americans dollars) | ||||
| Year | Diff. | Lower Limit | Upper Limit | P-Adj |
| 2016 | -352.83 | -412.20 | -293.47 | 0 |
| 2018 | -417.06 | -445.78 | -388.34 | 0 |
| 2020 | -388.75 | -412.13 | -365.36 | 0 |
| 2022 | -565.36 | -602.93 | -527.79 | 0 |
If the P-Adj value is below 0.05, the group means are statistically different with a 95% confidence level.
Table 3.
Tukey’s Honestly Significant Differences (HSD): Combination of Sex and Indigenous Self-Identification.
Table 3.
Tukey’s Honestly Significant Differences (HSD): Combination of Sex and Indigenous Self-Identification.
| 2016 | 2018 | 2020 | 2022 | |||||
| Diff. | P-Adj | Diff. | P-Adj | Diff. | P-Adj | Diff. | P-Adj | |
| Indigenous:Man-No indigenous: Man | -148.6 | 0.01 | -185.86 | 0 | -165.77 | 0 | -281.90 | 0 |
| Indigenous:Women-Indigenous:Man | -306.9 | 0 | -379.16 | 0 | -334.34 | 0 | -489.4 | 0 |
| No indigenous:Women-Indigenous:Man | -230.98 | 0. | -254.74 | 0 | -256.12 | 0 | -324.34 | 0 |
| Indigenous:Women-No indigenous:Man | -455.59 | 0 | -565.03 | 0 | -500.11 | 0 | -771.36 | 0 |
| No indigenous:Women-No indigenous:Man | -379.64 | 0 | -440.6 | 0 | -421.89 | 0 | -606.24 | 0 |
| No indigenous:Women-Indigenous:Women | 75.95 | 0.243 | 124.42 | 0 | 78.21 | 0 | 165.12 | 0 |
If the P-Adj value is below 0.05, the group means are statistically different with a 95% confidence level.
Disclaimer/Publisher’s Note: The statements, opinions and data contained in all publications are solely those of the individual author(s) and contributor(s) and not of MDPI and/or the editor(s). MDPI and/or the editor(s) disclaim responsibility for any injury to people or property resulting from any ideas, methods, instructions or products referred to in the content. |
© 2024 by the authors. Licensee MDPI, Basel, Switzerland. This article is an open access article distributed under the terms and conditions of the Creative Commons Attribution (CC BY) license (http://creativecommons.org/licenses/by/4.0/).
Copyright: This open access article is published under a Creative Commons CC BY 4.0 license, which permit the free download, distribution, and reuse, provided that the author and preprint are cited in any reuse.


