Preprint
Article

This version is not peer-reviewed.

Usefulness of Serum Biomarkers to Predict Anastomotic Leakage After Gastrectomy

A peer-reviewed article of this preprint also exists.

Submitted:

26 November 2024

Posted:

28 November 2024

You are already at the latest version

Abstract

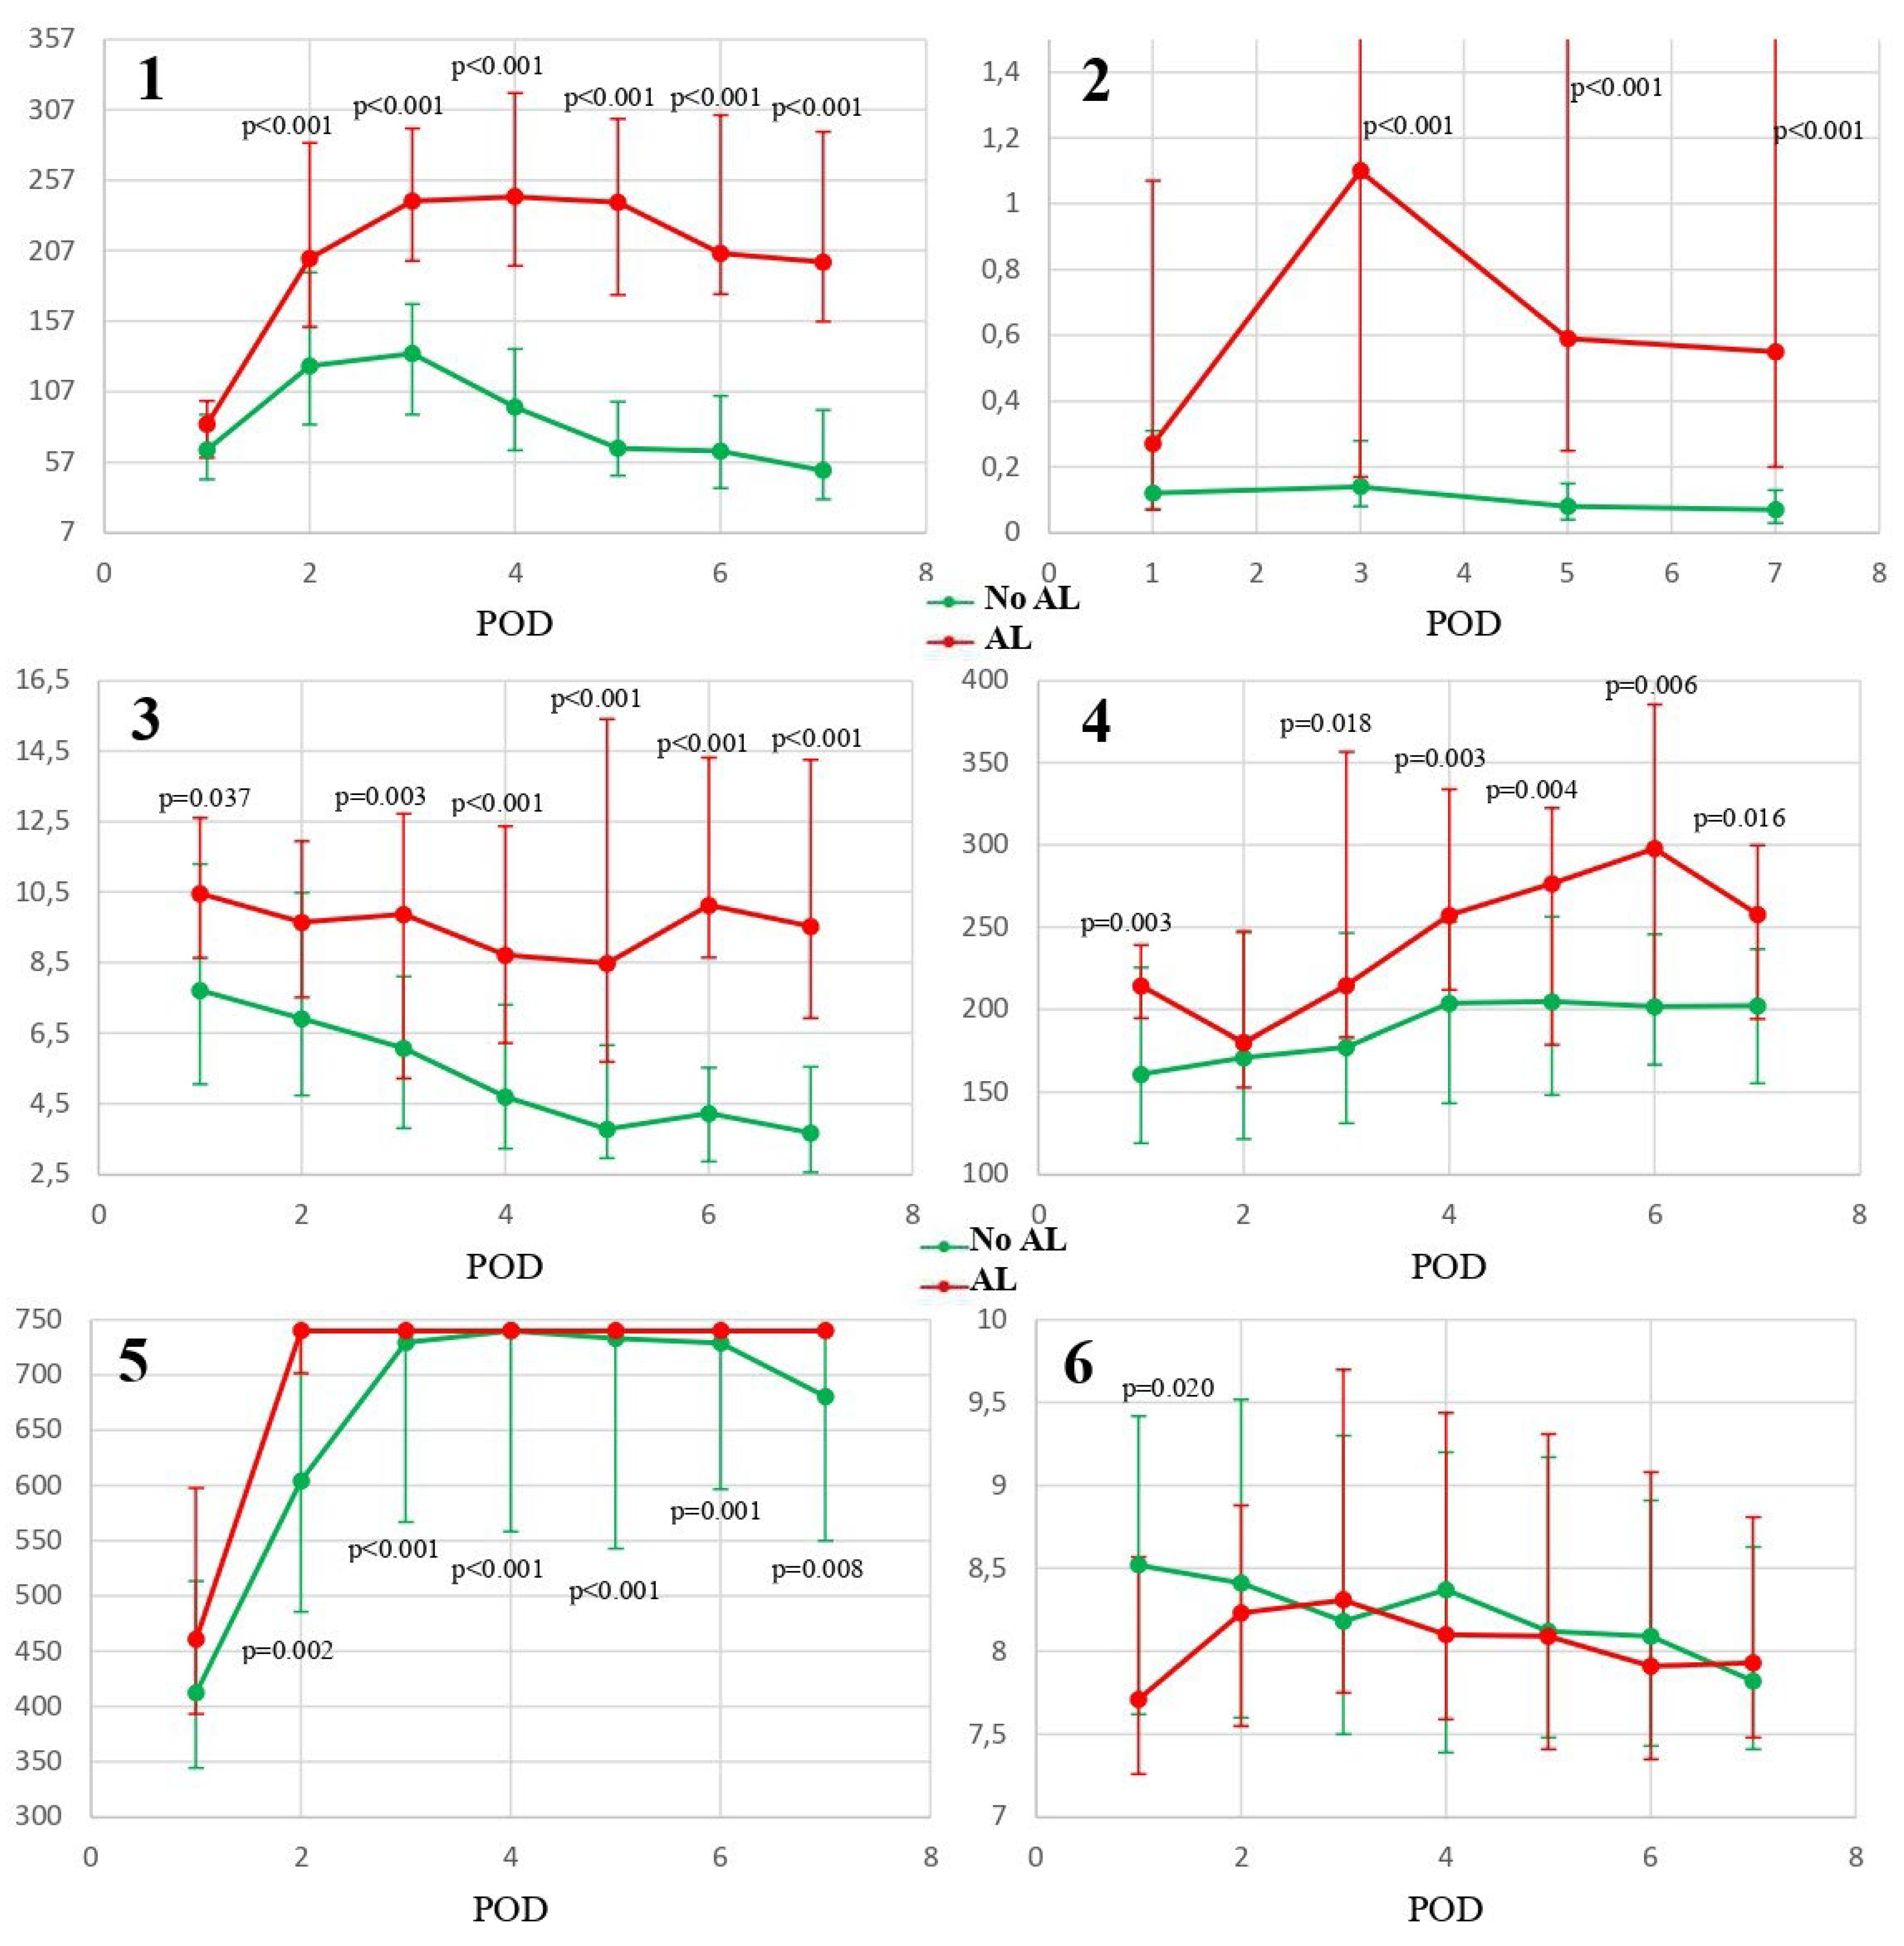
Background/Objectives: Anastomotic leakage (AL) is one of the most feared complications following gastrectomy, with a relatively high incidence rate. The aim of this study was to assess and compare the predictive ability of C-reactive protein (CRP), procalcitonin (PCT), neutrophil-to-lymphocyte ratio (NLR), platelet-to-lymphocyte ratio (PLR), fibrinogen and mean platelet volume (MPV) in the early diagnosis of post-gastrectomy AL. Methods: A prospective bicentric observational study was conducted including all patients undergoing elective gastrectomy between August 2018 and December 2022, assessing the performance of the noted biomarkers to predict the existence of AL within the first 7 postoperative days (POD). Results: A total of 107 patients were included for analysis. The incidence of AL was 20.56%, and the median day of diagnosis was on POD5 (interquartile range 4-6). CRP, PCT, NLR, PLR and fibrinogen showed significant association with the presence of AL (from POD2 for CRP and fibrinogen and from POD3 for PCT, NLR and PLR). CRP showed the better discrimination on POD4 (cut-off 181.4mg/L; NPV 99%; AUC 0.87, p<0.001); PCT demonstrated the better discrimination on POD7 (cut-off 0.13ng/mL; NPV 98%; AUC 0.84, p<0.001); NLR showed the better discrimination on POD6 (cut-off 6.77; NPV 95%; AUC 0.86, p<0.001); PLR achieved the higher discrimination on POD7 (AUC 0.71; 95%CI 0.58-0.82; cut-off 234; Se 93%; Sp 73%; PPV 47%; NPV 98%; p=0.002); fibrinogen showed the better discrimination on POD5 (AUC 0.74; 95%CI 0.66-0.8; cut-off 734.4; Se 95%; Sp 52%; PPV 35%; NPV 98%; p=0.003). In the comparison of predictive accuracy CPR, PCT and NLR were found superior among all other biomarkers. Conclusions: CRP, PCT and NLR are biomarkers with adequate predictive ability to clinically discard the presence of AL within the first postoperative week.

Keywords: 
;  ;  ;  ;  ;  ;  ;  ;  

1. Introduction

Anastomotic leakage (AL) is one of the most fearsome and yet common complication after gastric surgery, with reported incidence rates ranging from 5 to 20%, or even higher in some series [1,2]. The morbidity and mortality rates of AL are reported to reach up to 50%2, and survivors have prolonged hospitalization, increased recurrence rates and worse long-term functional and oncologic outcomes [3,4,5]. The median time of leakage occurrence ranges from 5 to 7 days after gastrectomy [6,7], and an early diagnosis of this complication is crucial for a prompt (and, in many cases, aggressive) treatment, with clear impact on survival and subsequent associated complications [8,9,10]. Many biomarkers have been proposed as potentially valuable tools in the postoperative management of patients undergoing abdominal surgery, including C-reactive protein (CRP), procalcitonin (PCT), a wide variety of cytokines or many peripheral-blood-cell parameters and indices (such as neutrophil-to-lymphocyte ratio or platelet indices), but regarding gastric surgery, and more specifically as viable predictors of post-gastrectomy AL, the evidence remains overwhelmingly scarce [11].
Furthermore, newly implemented early-discharge protocols require adequate detection of patients with postoperative complications prior to discharge, particularly severe or potentially lethal like AL, which makes essential the development of a post-surgical screening strategy.
Based on these premises, the aim of this study is to determine the role, reliability and accuracy of CRP, PCT, neutrophil-to-lymphocyte ratio (NLR), platelet-to-lymphocyte ratio (PLR), mean platelet volume (MPV) and fibrinogen as early predictors of AL after gastrectomy.

2. Materials and Methods

2.1. Study Design

A prospective observational bicentric cohort study was designed. The participating centers were Ramón y Cajal University Hospital and Príncipe de Asturias University Hospital. The study was reviewed and approved by the Institutional Review Board in both participating centers (Approval code: 164-18). All consecutive patients who underwent elective gastrectomy within the August 2018 – December 2022 period were included in the study. Admitted procedures were total or near-total (95%) gastrectomy with Roux-en-Y reconstruction, subtotal gastrectomy with Roux-en-Y or Billroth II reconstruction, and proximal gastrectomy followed by esophagogastrostomy. Two abdominal drains were routinely placed for total, near-total and proximal gastrectomy, and one abdominal drain was routinely placed for subtotal gastrectomy. For patients undergoing total, near-total or proximal gastrectomy, routine diatrizoate meglumine (Gastrografin®) upper-gastrointestinal study was performed between the 5th and 7th postoperative day (POD).
Exclusion criteria were: age less than 18 years, emergency surgery, patients undergoing gastric surgery without anastomosis (e.g. wedge resections), bariatric surgery, patients undergoing concomitant resection of other organs, patients with ongoing infection, systemic inflammation or active neoplasms (other than localized and resectable gastric tumors) at the time of surgery, acquired or congenital immunodeficiencies, liver or kidney failure, and inability or refusal to give informed consent.
In all cases, complete blood count on a daily basis on the POD 1 to 7 was obtained. Serum CRP levels were measured using immunoturbidimetry (autoanalyzer Alinity®-c, Abbott Laboratories, IL, USA), PCT levels using chemiluminescence microparticle immunoassay (autoanalyzer Alinity®-i, Abbott Laboratories, IL, USA) and fibrinogen concentration using a colorimetric method (autoanalyzer BCS® XP System, Siemens Healthineers, Erlangen, Germany); MPV, NLR and PLR were determined with an autoanalyzer CELL-DYN® Sapphire (Abbott Laboratories, IL, USA). NLR was calculated as the absolute neutrophil count divided by the absolute lymphocyte count. PLR was calculated as the absolute platelet count divided by the absolute lymphocyte count.

2.2. Data Collection

For all the patients included in this study, the following data were prospectively collected: age, gender, comorbidities, ASA score, underlying gastric disease, type of operation, surgical approach, operating time, post-gastrectomy AL, other postoperative complications during hospitalization classified according to the Clavien-Dindo score [12] and length of postoperative in-hospital stay.
Diagnostic criteria for AL in this study were defined by changes in drainage fluid (color, turbidity or enteric/fecal fluid), changes in imaging techniques, or direct visualization of the leak with endoscopy or during reintervention due to peritoneal irritation of patient instability.
CPR, NLR, PLR, fibrinogen and MPV values were recorded for every POD within the first postoperative week; meanwhile, PCT levels were registered every 48 hours (POD 1, 3, 5 and 7).

2.3. Endpoints

The primary endpoint of this study was the assessment of a discriminative and biomarker accuracy achieved by CRP, PCT, NLR, PLR, fibrinogen and MPV within the first postoperative week to determine the occurrence of AL following gastrectomy. Secondary endpoint was to compare the predictive value of all these previously listed variables, trying to establish a gold-standard biomarker to detect the development of AL.

2.4. Data anal#ysis

Statistical analysis was performed using Stata v.16 for Windows (StataCorp, 2019. Stata Statistical Software: Release 16. StataCorp LLC: College Station: TX). All data were recorded as absolute values and percentages, means and standard deviations (SD) and median and interquartile range (IQR) as appropriate conforming to their category.
Univariate analyses were performed using the Student’s t-test or Mann-Whitney U-test for quantitative variables, and c2 test or Fisher’s exact test for categorical variables as proper. The statistical study was completed with a multivariate analysis using binary logistic regression.
Linear mixed models were used for each of the biomarkers to assess the evolution of the parameters throughout the first postoperative week, using as independent variables AL and POD.
Discrimination was appraised with the area under the curve (AUC) of receiver operating characteristic (ROC) curves. Optimal cut-off points (OCP) of CRP, PCT, NLR, PLR, fibrinogen and MPV were calculated by Youden’s J statistics, and utilized to determine sensitivity (Se), specificity (Sp), positive predictive value (PPV) and negative predictive value (NPV). Confidence interval and p value were calculated with DeLong’s method, which was also used to compare AUC between curves.
In all cases, two-sided p values of <0.05 were considered to be statistically significant.

3. Results

3.1. Cohort characteris#tics

A total of 107 patients undergoing gastrectomy within the study period were recruited. Clinicopathologic features of the enrolled patients are presented in Table 1. There were 50 males (46.73%) and 57 females (53.27%), with a mean age of 73 years (range 64-79). A significant number of patients showed comorbidities, reflected in a high percentage of cases graded as ASA II and ASA III according to the American Society of Anesthesiologists physical status classification system (38.32 and 52.34% respectively) [13]. A vast majority of the patients (89,72%) presented with a diagnosis of gastric adenocarcinoma, of whom 38.32% received neoadjuvant treatment prior to surgery. Overall, 57 patients underwent total or near-total gastrectomy (53.27%), and in most cases laparoscopic approach was indicated (67,29%).
The rate of AL was 20.56%, and the median day of AL diagnosis was POD5 (range 4-6). 59.09% of the cases presented as clinical leaks, while the remaining 40.91% were detected through radiological techniques. Reintervention rate was 36.36%, notably higher in the subgroup of patients that presented as clinical leaks (62.50%).

3.2. Dynamics of the Inflammatory Markers

Overall fluctuation of the investigated inflammatory biomarkers is shown in Table 2. CRP levels noteworthy increased in the first postoperative week, reaching a maximum on POD3, and were significantly higher in the AL group from POD2 to POD7 (p<0.001). Global PCT levels did not show any remarkable fluctuation but were found to be significantly higher in the AL group from POD3 to POD7 (p<0.001). NLR presented a downward trend, significant from POD3, and values in the AL group remained elevated displaying statistically significant differences from POD3 to POD7 (p=0.003 and p<0.001). PLR values increased in the AL group from POD3 to POD7 (p=0.018, 0.003, 0.004, 0.006 and 0.016 respectively). Fibrinogen levels showed a significant increase, with maximum levels achieved by POD4, significantly higher in the AL group from POD2 to POD7 (p=0.002, <0.001 and 0.008 respectively). Finally, MPV levels decreased over time, with statistically significant differences observed only on POD1 (p=0.02) (Figure 1, Table 2 and Table 3).

3.3. Diagnostic Accuracy and Cutoffs

For the detection of AL, a significant discrimination was identified in the ROC curve analysis as early as POD1 for CRP (AUC 0.63; 95%CI 0.5-0.75; cut-off 82.1mg/L; p=0.037), with the better discrimination achieved on POD4 (AUC 0.87; 95%CI 0.77-0.95; cut-off 181.4mg/L; Se 95%; Sp 90%; PPV 69%; NPV 99%; p<0.001) (Supplemental Table S1). For PCT, significant discrimination was also detected from POD1 (AUC 0.63; 95%CI 0.5-0.75; cut-off 0.22ng/mL; p=0.041), with the better discrimination achieved on POD7 (AUC 0.84; 95%CI 0.74-0.91; cut-off 0.13ng/mL; Se 90%; Sp 78%; PPV 56%; NPV 96%; p<0.001) (Supplemental Table S2). Regarding NLR, significant discrimination was found from POD1 (AUC 0.67; 95%CI 0.57-0.77; cut-off 8.51; p=0.007), with the better discrimination identified on POD6 (AUC 0.86; 95%CI 0.76-0.94; cut-off 6.77; Se 86%; Sp 84%; PPV 66%; NPV 95%; p<0.001) (Supplemental Table S3). Concerning PLR, significant discrimination was also identified from POD1 (AUC 0.73; 95%CI 0.62-0.82; cut-off 190.7; p=0.001), showing the better discrimination on POD7 (AUC 0.71; 95%CI 0.58-0.82; cut-off 234; Se 93%; Sp 73%; PPV 47%; NPV 98%; p=0.002) (Supplemental Table S4). For fibrinogen, significant discrimination was observed from POD2 (AUC 0.72; 95%CI 0.61-0.82; cut-off 696.6mg/dL; p=0.001), with the better discrimination achieved on POD5 (AUC 0.74; 95%CI 0.66-0.8; cut-off 734.4; Se 95%; Sp 52%; PPV 35%; NPV 98%; p=0.003) (Supplemental Table S5). Finally, no significant discrimination was observed for MPV on any POD within the first postoperative week.

3.4. Comparison of Predictive Accuracy

In the comparison of predictive accuracy among the biomarkers in the prediction of AL, CRP was found superior to PLR on POD2 (p=0.026), to PCT, NLR, PLR and fibrinogen on POD3 (p=0.031, 0.007, 0.005 and <0.001 respectively), and to NLR, PLR and fibrinogen on POD4 (p<0.001); on POD5, CRP showed better accuracy than NLR, PLR and fibrinogen (p=0.008, 0.002 and <0.001 respectively), and PCT was found superior to PLR and fibrinogen (p=0.039 and 0.026 respectively); on POD6 both CRP and NLR showed higher accuracy than PLR and fibrinogen (p<0.001); on POD7, CRP, PCT and NLR were found more accurate than PLR and fibrinogen (p<0.001, 0.011, 0.025, 0.003 and 0.007 respectively).

4. Discussion

In this study, we analyzed and compared the accuracy and predictive capability of multiple biomarkers including CRP, PCT, NLR, PLR fibrinogen and MPV in determining the occurrence of AL following gastrectomy in a prospectively maintained database. According to our results, all these biomarkers, with the exception of MPV, showed significant discrimination power for the detection of AL on the first postoperative week, being the most reliable markers CRP, PCT and NLR. With regards to PLR and fibrinogen, even though they achieved statistically significant discrimination, it is questionable to transpose that to a clinically relevant scenario, due to both a lower performance than the other biomarkers and relatively low AUCs until late dates in the postoperative period.
In our study, CRP achieved the higher discrimination on POD4, but bearing in mind that the median day of AL diagnosis was POD5 and in line with previously published evidence that have demonstrated that, from as early as POD3, the inflammatory response of the resection has been attenuated in patients with a normal postoperative course (and an elevated CPR could thus indicate the presence of a postoperative infectious complication) [8,11,14], we consider that a higher clinical discriminatory threshold is achieved on POD3. As an acute phase reactant molecule, CPR has been proposed as a biomarker candidate for numerous conditions. There is substantial evidence of the utility of CRP to detect complications following different abdominal procedures, essentially in relation to infectious complications and AL in colorectal surgery [15,16], but with respect to gastric surgery data are still scarce. There is, however, growing evidence on the utility of CRP to detect patients with low risk of infectious intraabdominal complications [7,8,9,17], yet only a few authors have evaluated its diagnostic accuracy to identify the occurrence of AL. The majority of these series are consistent with the fact that CRP is of high relevance of detecting AL following gastrectomy; nevertheless, a great disparity is reported both in the proposed POD and cut-off, ranging from POD2 to as late as POD7, and from serum levels of 94 to 209mg/L [7,18,19,20,21]. Our study, however, provides evidence of a potential use of CRP as a biomarker following gastric surgery and, consequently, we consider CRP as a clinically relevant biomarker for AL, with a proposed threshold of 162.4mg/L.
PCT showed the better discrimination on POD7, although under the same circumstances, the higher clinical discrimination could be found on POD3, when a cut-off value of 0.4ng/mL is advised. PCT recently showed promising results in detecting intraabdominal complications following esophagogastric surgery [22,23,24] but, up to date, only Cananzi et al. [7] have specifically studied PCT in relation to AL in gastric surgery, with similar results to our study, identifying significant discrimination from POD6, a noticeably later date than ours, and with the better discrimination achieved on POD7 (AUC 0.763, 95%CI 0.684–0.831, cut-off 0.4, NPV 97%, p=0.002).
NLR, on its side, demonstrated in our study the better discrimination on POD6, yet the higher clinical discrimination could also be proposed on POD3. Most of the published evidence on NLR is focused on its quantification in the preoperative period [25,26], and only two series have studied the implications of the postoperative fluctuations. In a retrospective study of 57 patients that underwent total gastrectomy with esophagojejunostomy, Clemente-Gutierrez et al. [27] identified that NLR could identify the occurrence of AL on POD3 (AUC 0.78, cut-off 10, NPV 96%), but only by defining as AL those that required invasive management; likewise, the retrospective series of Çetin et al. [28] described that NLR was significantly higher in the patients with AL and other postoperative complications (p=0.022), although its diagnostic accuracy was not assessed. Thus, considered NLR levels could represent an interesting biomarker for AL following gastric surgery from POD3 with the suggested threshold of 8.86.
This is the first prospective study to evaluate the usefulness of CRP, PCT, NLR, PLR, fibrinogen and MPV in the early postoperative period after gastrectomy, and to compare their accuracy, and our results have marked implications on clinical practice. When comparing the predictive accuracy, as previously detailed, on POD3 CRP was found in our study superior to PCT and NLR so it could be proposed as the biomarker of choice to determine the occurrence of AL on that POD. This contrasts with previous evidence in colorectal surgery, in which PCT proved to be more accurate than CRP in predicting AL [29]. The most feasible explanation for this is the substantial difference in the microbiota between the proximal and distal segments of the gastrointestinal tract, which is reproduced in abdominal cultures, abscesses and bloodstream after abdominal surgery complications. Hence, after gastric surgery Candida spp., Klebsiella pneumoniae, Streptococcus and Staphylococcus spp. are often isolated, in contrast to a strikingly low rate of fungal infections and a prominent role of Gram-negative bacteria following colorectal surgery [7], being PCT specifically triggered by the latter and dramatically less by Gram-positive bacteria or fungi [30].
Direct consequence of the foregoing, is that PCT should not be routinely determined during the normal postoperative course following gastric resection to rule out AL, both considering the lower accuracy compared with CRP and due to an economic burden, that varies between different laboratories, yet can be more than 4 (or even up to 7) times higher than that of CRP [31,32], which combined reveal an objectionable cost-effectiveness balance for PCT.
Additionally, NLR proved to be less accurate than CRP, as well as PCT (but not inferior to the latter); however, and contrary to PCT determination, complete blood count is a unexpensive test and is customarily performed throughout the postoperative period. In such manner, NLR could be a useful biomarker adjuvant to the interpretation of CRP values.
Finally, irrespective of the proposed cut-off on POD3 for a better clinical discrimination, CRP was identified as a valuable negative predictive parameter for AL from POD2 to POD7, showing a remarkably useful potential to identify low-risk patients in the recovery progress [21]. Thus, CRP monitoring could lead to a marked improvement in the risk-stratification of patients, facilitating the identification of those low-risk patients, eligible for fast-track and early discharge. Moreover, the merger of CRP and NLR could enable the creation of a combined risk-score that may boost the accuracy of the stratification compared to CRP alone. This is particularly of huge interest in the field of gastric surgery, where hospitalization is ordinarily long, and enhanced recovery protocols after surgery (ERAS) have not been widely implemented, mainly because of concerns for patient safety and unclear benefits in terms of readmission rates [7,33].
This study has nevertheless some limitations, including the choice of the analyzed biomarkers, which may have overlooked others with clinical relevance, and the lack of external validation for the results. The population of the study also showed a relatively high rate of AL, but bearing in mind that negative predictive values actually increase as prevalence of the tested event decreases [34], this should not influence the results, but rather sustain them. Also, baseline pre-operative levels of the biomarkers were not measured, thus whether their dynamic changes could be more accurate to diagnose AL could not be clarified. Notwithstanding its limitation, this is to our knowledge the first prospective study to simultaneously evaluate various inflammatory biomarkers, such as CRP, PCT, NLR, PLR, fibrinogen and MPV, and compare their accuracy to determine the occurrence of AL following gastric resection. The results were valuable, as some biomarkers were decisively discarded and CRP aroused as the biomarker of choice with clinical application, along with providing the basis for further combined risk-scores development.

5. Conclusions

CPR, PCT and NLR demonstrated significant discrimination and accuracy to determine the occurrence of AL following gastrectomy within the first postoperative week.
CRP showed better performance than PCT and NLR, and represents the reference screening postoperative biomarker in the studied population. CRP-based protocols could be further developed to optimize postoperative management.

Supplementary Materials

The following supporting information can be downloaded at: www.mdpi.com/xxx/s1, Table S1: ROC curve analysis for CRP levels; www.mdpi.com/xxx/s2, Table S2: ROC curve analysis for PCT levels; www.mdpi.com/xxx/s3, Table S3: ROC curve analysis for NLR values; www.mdpi.com/xxx/s4, Table S4: ROC curve analysis for PLR values; www.mdpi.com/xxx/s5, Table S5: ROC curve analysis for fibrinogen levels.

Author Contributions

Conceptualization, D.R, P.P. and F.G-M.; methodology, D.R., J.M. and F.G-M..; formal analysis, D.R.; investigation, D.R. and J.M.; data curation, D.R. and E.G-C.; writing—original draft preparation, D.R.; writing—review and editing, E.G-C., J.M., I.B. and F.G-M.; supervision, I.B., P.P. and F.G-M.. All authors have read and agreed to the published version of the manuscript.

Funding

This research received no external funding.

Institutional Review Board Statement

The study was conducted in accordance with the Declaration of Helsinki, and approved by the Institutional Review Board - Ethics Committee of Ramón y Cajal University Hospital (protocol code 164-18; date of approval 26 July 2018).

Informed Consent Statement

Informed consent was obtained from all subjects involved in the study.

Conflicts of Interest

The authors declare no conflicts of interest.

References

  1. Lang, H.; Piso, P.; Stukenborg, C.; Raab, R.; Jähne, J. Management and results of proximal anastomotic leaks in a series of 1114 total gastrectomies for gastric carcinoma. Eur. J. Surg. Oncol. (EJSO) 2000, 26, 168–171. [CrossRef]
  2. Makuuchi, R.; Irino, T.; Tanizawa, Y.; Bando, E.; Kawamura, T.; Terashima, M. Esophagojejunal anastomotic leakage following gastrectomy for gastric cancer. Surg. Today 2018, 49, 187–196. [CrossRef]
  3. Tokunaga, M.; Tanizawa, Y.; Bando, E.; Kawamura, T.; Terashima, M. Poor Survival Rate in Patients with Postoperative Intra-Abdominal Infectious Complications Following Curative Gastrectomy for Gastric Cancer. Ann. Surg. Oncol. 2012, 20, 1575–1583. [CrossRef]
  4. Tsujimoto, H.; Ichikura, T.; Ono, S.; Sugasawa, H.; Hiraki, S.; Sakamoto, N.; Yaguchi, Y.; Yoshida, K.; Matsumoto, Y.; Hase, K. Impact of Postoperative Infection on Long-Term Survival After Potentially Curative Resection for Gastric Cancer. Ann. Surg. Oncol. 2008, 16, 311–318. [CrossRef]
  5. Polish Gastric Cancer Study Group; Sierzega, M.; Kolodziejczyk, P.; Kulig, J. Impact of anastomotic leakage on long-term survival after total gastrectomy for carcinoma of the stomach. Br. J. Surg. 2010, 97, 1035–1042. [CrossRef]
  6. Roh, C.K.; Choi, S.; Seo, W.J.; Cho, M.; Kim, H.-I.; Lee, S.-K.; Lim, J.S.; Hyung, W.J. Incidence and treatment outcomes of leakage after gastrectomy for gastric cancer: Experience of 14,075 patients from a large volume centre. Eur. J. Surg. Oncol. (EJSO) 2021, 47, 2304–2312. [CrossRef]
  7. Cananzi, F.C.M.; Biondi, A.; Agnes, A.; Ruspi, L.; Sicoli, F.; De Pascale, S.; Fumagalli, U.R.; D’ugo, D.; Quagliuolo, V.; Persiani, R. Optimal Predictors of Postoperative Complications After Gastrectomy: Results from the Procalcitonin and C-reactive Protein for the Early Diagnosis of Anastomotic Leakage in Esophagogastric Surgery (PEDALES) Study. J. Gastrointest. Surg. 2023, 27, 478–488. [CrossRef]
  8. Shishido, Y.; Fujitani, K.; Yamamoto, K.; Hirao, M.; Tsujinaka, T.; Sekimoto, M. C-reactive protein on postoperative day 3 as a predictor of infectious complications following gastric cancer resection. Gastric Cancer 2015, 19, 293–301. [CrossRef]
  9. van Winsen, M.; McSorley, S.T.; McLeod, R.; MacDonald, A.; Forshaw, M.J.; Shaw, M.; Puxty, K. Postoperative C-reactive protein concentrations to predict infective complications following gastrectomy for cancer. J. Surg. Oncol. 2021, 124, 1060–1069. [CrossRef]
  10. Chadi, S.A.; Fingerhut, A.; Berho, M.; DeMeester, S.R.; Fleshman, J.W.; Hyman, N.H.; Margolin, D.A.; Martz, J.E.; McLemore, E.C.; Molena, D.; et al. Emerging Trends in the Etiology, Prevention, and Treatment of Gastrointestinal Anastomotic Leakage. J. Gastrointest. Surg. 2016, 20, 2035–2051. [CrossRef]
  11. De Mooij, C.M.; Maassen van den Brink, M.; Merry, A.; Tweed, T.; Stoot, J. Systematic review of the role of biomarkers in predicting anastomotic leakage following gastroesophageal cancer surgery. J. Clin. Med. 2019, 8, 2005. [CrossRef]
  12. Dindo D, Demartines N, Clavien PA. Classification of surgical complications: A new proposal with evaluation in a cohort of 6336 patients and results of a survey. Ann Surg. 2004;240(2):205–13.
  13. Dripps RD. New classification of physical status. Anesthesiology. 1963;24:111.
  14. Kim EY, Yim HW, Park CH, Song KY. C-reactive protein can be an early predictor of postoperative complications after gastrectomy for gastric cancer. Surg Endosc. 2017;31(1):445–54.
  15. Nam, J.H.; Noh, G.T.; Chung, S.S.; Kim, K.H.; Lee, R.-A. Validity of C-Reactive Protein as a Surrogate Marker for Infectious Complications After Surgery for Colorectal Cancer. Surg. Infect. 2023, 24, 488–494. [CrossRef]
  16. Bona, D.; Danelli, P.; Sozzi, A.; Sanzi, M.; Cayre, L.; Lombardo, F.; Bonitta, G.; Cavalli, M.; Campanelli, G.; Aiolfi, A. C-reactive Protein and Procalcitonin Levels to Predict Anastomotic Leak After Colorectal Surgery: Systematic Review and Meta-analysis. J. Gastrointest. Surg. 2023, 27, 166–179. [CrossRef]
  17. Imai Y, Tanaka R, Honda K, Matsuo K, Taniguchi K, Asakuma M, et al. The usefulness of prepepsin in the diagnosis of postoperative complications after gastrectomy for gastric cancer: a prospective cohort study. Sci Rep. 2022;12(1):21289.
  18. Gordon, A.C.; Cross, A.J.; Foo, E.W.; Roberts, R.H. C-reactive protein is a useful negative predictor of anastomotic leak in oesophago-gastric resection. ANZ J. Surg. 2016, 88, 223–227. [CrossRef]
  19. Kano, K.; Tamagawa, H.; Sawazaki, S.; Ohshima, T.; Yukawa, N.; Rino, Y.; Masuda, M. [The Postoperative C-Reactive Protein Level Is an Early Predictor of Infectious Complications after Gastric Cancer Resection].. 2015, 42, 1256–8.
  20. Ji, L.; Wang, T.; Tian, L.; Gao, M. The early diagnostic value of C-reactive protein for anastomotic leakage post radical gastrectomy for esophagogastric junction carcinoma: A retrospective study of 97 patients. Int. J. Surg. 2016, 27, 182–186. [CrossRef]
  21. Shi, J.; Wu, Z.; Wang, Q.; Zhang, Y.; Shan, F.; Hou, S.; Ying, X.; Huangfu, L.; Li, Z.; Ji, J. Clinical predictive efficacy of C-reactive protein for diagnosing infectious complications after gastric surgery. Ther. Adv. Gastroenterol. 2020, 13. [CrossRef]
  22. Hoeboer, S.H.; Groeneveld, A.B.J.; Engels, N.; van Genderen, M.; Wijnhoven, B.P.L.; van Bommel, J. Rising C-Reactive Protein and Procalcitonin Levels Precede Early Complications After Esophagectomy. J. Gastrointest. Surg. 2015, 19, 613–624. [CrossRef]
  23. Xiao, H.; Zhang, P.; Xiao, Y.; Xiao, H.; Ma, M.; Lin, C.; Luo, J.; Quan, H.; Tao, K.; Huang, G. Diagnostic accuracy of procalcitonin as an early predictor of infection after radical gastrectomy for gastric cancer: A prospective bicenter cohort study. Int. J. Surg. 2020, 75, 3–10. [CrossRef]
  24. Yang, W.; Chen, X.; Zhang, P.; Li, C.; Liu, W.; Wang, Z.; Yin, Y.; Tao, K. Procalcitonin as an Early Predictor of Intra-abdominal Infections Following Gastric Cancer Resection. J. Surg. Res. 2021, 258, 352–361. [CrossRef]
  25. Mohri Y, Tanaka K, Toiyama Y, Ohi M, Yasuda H, Inoue Y, et al. Impact of preoperative neutrophil to lymphocyte ratio and postoperative infectious complications on survival after curative gastrectomy for gastric cancer: A single institutional cohort study. Med. 2016;95(11):1–7.
  26. Mungan İ, Bay Ç, Bekta Ş, Sar S, Yamanyar S, Çavu M. Does the preoperative platelet-to- lymphocyte ratio and neutrophil-to- lymphocyte ratio predict morbidity after gastrectomy for gastric cancer? Mil Med Res. 2020;7(1):9.
  27. Clemente-Gutiérrez, U.; Sarre-Lazcano, C.; Casanueva-Pérez, E.; Sánchez-Morales, G.; Terán-Ellis, S.M.Y.; Contreras-Jiménez, E.; Santes, O.; Alfaro-Goldaracena, A.; Cortés, R.; Medina-Franco, H. Usefulness of inflammatory markers in detecting esophagojejunostomy leakage. Rev. De Gastroenterol. De Mex. 2021, 86, 229–235. [CrossRef]
  28. Çetin, D.A.; Gündeş, E.; Çiyiltepe, H.; Aday, U.; Uzun, O.; Değer, K.C.; Duman, M. Risk factors and laboratory markers used to predict leakage in esophagojejunal anastomotic leakage after total gastrectomy. Turk. J. Surg. 2019, 35, 6–12. [CrossRef]
  29. Giaccaglia, V.; Salvi, P.F.; Antonelli, M.S.; Nigri, G.R.; Corcione, F.; Pirozzi, F.; de Manzini, N.; Casagranda, B.; Balducci, G.; Ziparo, V. Procalcitonin reveals early dehiscence in colorectal surgery: the PREDICS study. J. Am. Coll. Surg. 2014, 219, e8. [CrossRef]
  30. Yang, J.; Li, S.; Rong, H.; Guo, Q.; Chen, Y.; Zhang, G. Serum procalcitonin levels distinguish Gram-negative bacterial sepsis from Gram-positive bacterial and fungal sepsis. J. Res. Med Sci. 2016, 21, 39. [CrossRef]
  31. Nora, D.; Salluh, J.; Martin-Loeches, I.; Póvoa, P. Biomarker-guided antibiotic therapy—strengths and limitations. Ann. Transl. Med. 2017, 5, 208–208. [CrossRef]
  32. Póvoa, P.; Salluh, J.I.F. Biomarker-guided antibiotic therapy in adult critically ill patients: a critical review. Ann. Intensiv. Care 2012, 2, 32–32. [CrossRef]
  33. D’Ugo D, Agnes A, Grieco M, Biondi A, Persiani R. Global updates in the treatment of gastric cancer: a systematic review. Part 2: perioperative management, multimodal therapies, new technologies, standardization of the surgical treatment and educational aspects. Updat Surg. 2020;72(2):355–78.
  34. Parikh, R.; Mathai, A.; Parikh, S.; Sekhar, G.C.; Thomas, R. Understanding and using sensitivity, specificity and predictive values. Indian J. Ophthalmol. 2008, 56, 45–50. [CrossRef]
Figure 1. Postoperative changes of inflammatory markers. 1: CRP (mg/L); 2: PCT (ng/mL); 3: NLR; 4: PLR; 5: Fibrinogen (mg/dL); 6: MPV (fL). p values were calculated using Mann-Whitney U-test.
Preprints 140898 g001
Table 1. Clinicopathologic characteristics of the enrolled patients.
Overall
(n=107)
Patients without AL
(n=85)
Patients with AL
(n=22)
p value
Age (years) 73 (64-79) 73 (64-78) 74 (68-80) 0.20
Gender
Male 50 (46.73%) 37 (43.53%) 13 (59.09%) 0.19
Female 57 (53.27%) 48 (56.47%) 9 (40.91%)
ASA score
I 6 (5.61%) 6 (7.06%) 0 (0.00%) 0.64
II 46 (38.32%) 32 (37.65%) 9 (40.91%)
III 36 (52.34%) 44 (51.76%) 12 (54.55%)
IV 4 (6.54%) 3 (3.53%) 1 (4.55%)
Histology
ADC 96 (89.72%) 76 (89.41%) 30 (90.91%) 0.83
GIST 3 (2.80%) 2 (2.35%) 1 (4.55%)
PUD 2 (1.87%) 2 (2.35%) 0 (0.00%)
Other 6 (5.61%) 5 (5.88%) 1 (4.55%)
NAT 41 (38.32%) 37 (43.53%) 4 (18.18%) 0.029
Type of gastrectomy
Total 44 (41.12%) 31 (36.47%) 13 (59.09%) 0.28
Near-total (95%) 13 (12.15%) 11 (12.94%) 2 (9.09%)
Subtotal 49 (45.79%) 42 (49.41%) 7 (31.82%)
Proximal 1 (0.93%) 1 (1.18%) 0 (0.00%)
Surgical approach
Open 28 (26.17%) 22 (25.88%) 6 (27.27%) 0.002
Laparoscopic 72 (67.29%) 61 (71.76%) 11 (50.00%)
LCO 7 (6.54%) 2 (2.35%) 5 (22.73%)
Procedure duration (min) 290 (246-334) 280 (240-324) 320 (263-370) 0.010
Other complications 66 (61.68%) 49 (57.65%) 17 (77.27%) 0.091
Clavien-Dindo score
I 19 (26.03%) 19 (22.35%) 0 (0.00%) <0.001*
II 33 (45.21%) 26 (30.59%) 7 (31.82%)
III 8 (10.96%) 2 (2.35%) 6 (27.27%)
IV 4 (5.48%) 2 (2.35%) 2 (9.09%)
V 9 (12.33%) 2 (2.35%) 7 (31.82%)
Postoperative stay (days) 10 (7-17) 9 (7-12) 25 (17-39) <0.001*
Mortality 9 (8.41%) 2 (2.35%) 7 (31.82%) <0.001*
AL: anastomotic leakage; ASA: American Society of Anesthesiologists; ADC: gastric adenocarcinoma; GIST: gastrointestinal stromal tumors; PUD: peptic ulcer disease; NAT: neoadjuvant treatment; LCO: laparoscopic with conversion to open surgery.
Table 2. Dynamics of the inflammatory biomarkers.
CPR PCT NLR
Coefficient 95% CI p Coefficient 95% CI p Coefficient 95% CI p
POD1 BL BL NA BL BL NA BL BL NA
POD2 77.60 63.34–91.87 <0.001* NA NA NA 0.49 (-)1.46–1.56 0.949
POD3 86.94 72.72–101.17 <0.001* 0.22 (-)1.70–2.15 0.821 -1.61 (-)3.11–(-)0.10 0.036*
POD4 61.65 47.31–74.99 <0.001* NA NA NA -2.82 (-)4.34–(-)1.30 <0.001*
POD5 37.38 22.92–51.85 <0.001* 1.45 (-)0.49–3.39 0.145 -3.52 (-)5.04–(-)1.99 <0.001*
POD6 31.44 16.13–46.75 <0.001* NA NA NA -3.41 (-)5.02–(-)1.79 <0.001*
POD7 21.21 6.68–36.73 0.007* 0.46 (-)1.61–2.53 0.663 -3.31 (-)4.96–(-)1.67 <0.001*
AL 115.37 92.87–137.88 <0.001* 3.43 1.72 – 5.15 <0.001* 4.27 2.43–6.12 <0.001*
PLR Fibrinogen MPV
Coefficient 95% CI p Coefficient 95% CI p Coefficient 95% CI p
POD1 BL BL NA BL BL NA BL BL NA
POD2 19.16 (-)17.43–55.75 0.305 167.04 145.956– 188.12 <0.001* -0.66 (-)1.44–0.13 0.101
POD3 8.65 (-)27.84–45.14 0.642 219.77 198.62–240.91 <0.001* -0.62 (-)1.40–0.16 0.120
POD4 16.74 (-)20.05–53.53 0.372 222.94 201.73–244.15 <0.001* -0.86 (-)1.65–(-)0.07 0.033*
POD5 14.15 (-)22.85–51.14 0.454 215.92 194.57–237.27 <0.001* -0.85 (-)1.66–(-)0.06 0.035*
POD6 24.12 (-)15.11–63.34 0.228 214.39 191.82-236.97 <0.001* -0.88 (-)1.72–(-)0.04 0.040*
POD7 1.91 (-)37.92–41.73 0.925 181.87 158.96–204.77 <0.001* -0.97 (-)1.82-(-)0.12 0.026*
AL 60.49 12.07–108.91 0.014* 80.94 35.12–126.76 0.001* -0.35 (-)1.17–(+)0.46 0.398
Linear mixed models study for each individual biomarker. using as independent variables AL and POD. BL: Baseline; NA: Not available.
Table 3. Binary logistic regression of inflammatory biomarkers levels.
CRP PCT NLR
OR (95% CI) p OR (95% CI) p OR (95% CI) p
POD1 NA NA NA NA 1,039 (0,974-1,109) 0,244
POD2 1,011 (1,005-1,017) <0,001* NA NA NA NA
POD3 1,018 (1,010-1,026) <0,001* 1,451 (1,030-2,043) 0,033* 1,076 (1,000-1,157) 0,05*
POD4 1,025 (1,015-1,035) <0,001* NA NA 1,161 (1,049-1,285) 0,004*
POD5 1,025 (1,015-1,035) <0,001* 6,831 (1,865-25,023) 0,004* 1,333 (1,160-1,533) <0,001*
POD6 1,032 (1,018-1,047) <0,001* NA NA 1,681 (1,326-2,130) <0,001*
POD7 1,030 (1,016-1,045) <0,001* 18,83 (2,45-144,51) 0,005* 1,585 (1,259-1,994) <0,001*
PLR Fibrinogen MPV
OR (95% CI) p OR (95% CI) p OR (95% CI) p
POD1 1,002 (0,999-1,005) 0,229 NA NA 0,589 (0,384-0,904) 0,015*
POD2 NA NA 1,007 (1,002-1,012) 0,006* NA NA
POD3 1,005 (1,001-1,009) 0,008* 1,015 (1,003-1,028) 0,018* NA NA
POD4 1,007 (1,002-1,012) 0,007* 1,020 (1,001-1,039) 0,036* NA NA
POD5 1,007 (1,002-1,012) 0,006* 1,019 (1,002-1,035) 0,027* NA NA
POD6 1,006 (1,001-1,010) 0,014* 1,013 (1,001-1,025) 0,029* NA NA
POD7 1,005 (0,999-1,010) 0,06 1,002 (0,998-1,006) 0,286 NA NA
Only values that previously showed statistically significance in the Mann-Whitney U-test were analysed.
Disclaimer/Publisher’s Note: The statements, opinions and data contained in all publications are solely those of the individual author(s) and contributor(s) and not of MDPI and/or the editor(s). MDPI and/or the editor(s) disclaim responsibility for any injury to people or property resulting from any ideas, methods, instructions or products referred to in the content.
Copyright: This open access article is published under a Creative Commons CC BY 4.0 license, which permit the free download, distribution, and reuse, provided that the author and preprint are cited in any reuse.
Prerpints.org logo

Preprints.org is a free preprint server supported by MDPI in Basel, Switzerland.

Subscribe

Disclaimer

Terms of Use

Privacy Policy

Privacy Settings

© 2025 MDPI (Basel, Switzerland) unless otherwise stated