Submitted:
25 November 2024
Posted:
27 November 2024
You are already at the latest version
Abstract
T and B cell-deficient rag1-/- mutant zebrafish develop protective immunity mediated by trained immunity. In mammals, trained immune responses can be induced by Toll-like receptor (TLR) ligands. This study evaluated protective trained immunity in rag1-/- zebrafish through exposure to TLR ligands (beta glucan, R848, Poly I:C), RE33® (a live attenuated Edwardsiella ictaluri vaccine), or combinations thereof, followed by wild-type E. ictaluri challenge one month later. Survival analyses revealed that all TLR ligands and vaccine treatments provided significantly higher protection than the control, with beta glucan inducing significantly greater protection than RE33®, while R848 and Poly I:C were equivalent to the vaccine. Gene expression analysis of kidney and liver tissues post-challenge revealed beta glucan training elicited early and strong expression of Nklb, Nkld, and ifng in the kidney, while combined beta glucan + RE33® training showed the highest induction of Nkld, ifng, and other NK cell genes in both organs. Principal Component Analysis (PCA) revealed that early kidney gene expression at 6–12 hours post secondary infection were associated with the highest survival. This study highlights that TLR ligand-induced trained immunity enhances innate immune gene expression and improves survival, with tissue-specific NK cell subpopulations adapting to local microenvironments to mediate protective responses.
Keywords:
trained immunity
; beta glucan
; TLR ligands
; tissue-resident NK cell subsets
; Danio rerio
; vaccine adjuvants
1. Introduction
Trained immunity is a rapid innate defense mechanism that enhances the overall readiness of the immune system to deal with a variety of infections. It is the ability of the innate immune system to retain a memory of previous encounters with pathogens or certain stimuli. These responses are less specific than acquired immunity, and this is the key advantage. This generalized immune memory is beneficial when facing infections caused by different strains of the same pathogen or different pathogens. Exposure to one molecule can result in trained immune protection against multiple pathogens. This corresponds to one exposure resulting in protection against multiple diseases. Innate immune responses rely on germline encoded receptors to mediate immune responses against non-self molecules and pathogenic microorganisms. Innate immune responses are initial host responses and occur more quickly than acquired immune responses. These responses determine the course of infection and host survival. Innate immune responses are the first line of defense and most initial infections don’t progress past this point. Trained immune responses are more sophisticated in function and response time, and result in more effective antimicrobial immune mechanisms. Trained immunity results in the ability of specific innate immune cells to respond more effectively to certain pathogens and pathogen associated molecular patterns (PAMPS). Three fish research models have demonstrated trained immunity. Using adoptive cell transfers, it was demonstrated that innate immune cells of rag1-/- (MT) zebrafish mediated enhanced protective immunity for up to one month, in the absence of lymphocyte-based immunity [1]. Further studies suggested gene expressions underlying trained immunity in the MT zebrafish model [2,3]. The rag1-/- model also demonstrated long-term protection one month after gavage bacterial exposure [4]. Additionally, a different study observed trained immune mechanisms in carp through in vitro studies with head-kidney-derived macrophages [5]. These studies were the first documentations of trained immunity in fish. There are practical benefits of trained immunity in fish. Because it is less specific, trained immunity can provide increased resistance to many pathogens. After one training event, fish can be protected against several diseases. Innate defenses are fully functional during early stages of development and at temperatures that are restrictive to acquired immunity. Trained immunity has the advantage of providing protection against diseases during stages or conditions when acquired immunity can be less functional. Trained immunity is possible through epigenetics, or changes in organisms caused by modifications of gene expression rather than alterations in the DNA sequence or genetic code itself. Trained immunity results from shifts in transcriptional regulation caused by epigenetic changes to the chromatin of innate immune cells [6] after PAMP exposure. Chromatin determines how the DNA is accessed and transcribed. Specific modifications of the histones influence the transcription of the genes in the region of the modified chromatin [7]. The genomic locations of the histone modifications are coordinated and cause broad changes in functional pathways of the innate immune cells and influence the type and magnitude of their responses when a pathogen is encountered. These changes result in stronger cellular defenses and increased survival. Trained immunity specifically relies on epigenetic changes to histones H3 and H4 [6]. Epigenetic modifications to H3K4 and H3K27 in channel catfish anterior kidney leukocytes were associated with increased survival during Edwardsiella ictaluri and E. piscicida infections, improved phagocytic efficiency, and upregulated phagocytosis-related genes [8], demonstrating trained immunity in a third fish model. In humans, multiple immune cells mediate trained immune responses, including monocytes/macrophages, Natural Killer (NK) cells, dendritic cells (DCs), and neutrophils [7,9]. Hematopoietic stem cells can also be trained and establish and maintain trained immunity [10,11].
Trained immunity can be induced by multiple microbial components, including PAMPS and toll-like receptor (TLR) ligands [12]. TLRs are pattern recognition receptors (PRRs) (reviewed in [13], and when bound, activate immune cells to release pro- and anti-inflammatory molecules (cytokines, interleukins, and chemokines). Although non-specific in nature, the use of TLR ligands as immune stimulants in aquaculture is a well-known practice and the most widely investigated are beta glucan (TLR2/4 ligand) and Poly I:C (TLR3 ligand). The use of Poly I:C to induce protection against fish viruses has been demonstrated [14,15]. Additionally, the upregulation of teleost TLR 7 and 8, following viral infections suggests their anti-microbial role [16]. Beta glucan is an immune stimulant with long lived effects in aquaculture [5]. Beta glucan induced trained immunity provided increased protection against bacterial diseases in MT zebrafish and channel catfish ([4]and [8] respectively). Resiquimod, or R848, is an immune modulator that binds to TLR 7 and 8 and recognizes intracellular viral and bacterial RNAs localized in the endosome of infected cells [17]. R848 has been used as an immune modulator in zebrafish [4], flounder [18] and pompano [19]. RE33® is a live attenuated vaccine strain of Edwardsiella ictaluri [20], and has been used in multiple studies with our zebrafish model [21].
Significant upregulation of the genes analyzed in this study have been correlated with NK cell based immune responses in MT zebrafish (Muire and Petrie-Hanson, under review). NK cell lysins have been identified in various fish species, and NK lysin a, b, c and d have been described in zebrafish [22,23]. Tbox-21, or t-bet, is a T and NK cell transcription factor essential for the maturation of NK cells [24]. Nitr9 is an activating receptor characterized on NK cells in zebrafish [25,26]. Interferon gamma (ifng) is produced by activated T and NK cells and the level of ifng expression is correlated to cell cytotoxic activity [27].
Upregulation of these genes and their associated pathways underlies cellular changes that mediate trained immunity. The purpose of this study was to determine which of the TLR ligands induce the strongest trained immune response and mediate protection against live bacterial infection in MT zebrafish. To accomplish this, MT zebrafish were exposed to either beta glucan, R848, Poly I:C, RE33, beta glucan + RE33, R848 + RE33® or Poly I:C + RE33. After 1 month, fish were exposed to a LD50 of E. ictaluri. At 6, 12, 24 and 48 hours post exposure, kidney and liver tissues were removed and gene expression analyses performed. Survival was determined for each treatment. Principal Component Analysis (PCA) with survival as the outcome used survival and gene expressions associated with each treatment to determine which inter-correlated gene expression patterns increased survival of MT zebrafish after bacterial exposure. To gain another perspective on trained immunity and visualize cell phenotypes in beta glucan, R848 and RE33 exposed zebrafish, we examined cell expression of nitr9 and macrophage protein expressing gene-1 on kidney and liver leukocytes isolated at 24 and 48 hours post the training event, and 24 and 48 hours post the bacterial exposure after induction of trained immunity. Nitr9 and mpeg1 are genetic markers of NK cells and macrophages, respectively.
2. Results
2.1. Survival Trials
RE33® exposed MT zebrafish demonstrated significantly higher survival than non-exposed control fish when injected with a field isolate of WT E. ictaluri 4 weeks after innate training (Figure 1B and Table 2). Both beta glucan induced training and beta glucan + RE33® co-administration provided significantly greater survival than RE33® (Figure 1C and Table 2). R848 induced training provided protection equivalent to RE33®. Trained immune protection induced by co-administration of R848 + RE33® was equivalent to protection induced by R848 alone, and significantly greater than protection induced by RE33® alone (Figure 1D and Table 2). Poly I:C induced protection was not significantly greater than RE33®. However, protection induced by co-administration of Poly I:C + RE33® was significantly greater than RE33® alone (Figure 1E and Table 2). Survival between the co-administered treatments beta glucan+RE33® and R848 + RE33® were not significantly different. However, both treatments demonstrated significantly higher survival than survival induced by exposure to Poly I:C + RE33®. Moribund fish demonstrated clinical signs consistent with E. ictaluri and the progression of Enteric Septicemia of Catfish (ESC) in zebrafish [21]. E. ictaluri was re-isolated from randomly sampled moribund fish. All control fish that were injected with WT E. ictaluri died by day 7 of the trial.
2.2. Quantitative Gene Expression
2.2.1. Kidney
Kidney tissues were strongly differentially responsive to the bacterial challenge (Table 3 and Supp Figure 1 and Figure 2). Gene expression changes were negligible in the PBS injected fish. Naïve fish that were challenged showed moderate induction (<10 fold) of Nitr9 at 6,12 and 48 hpi, moderate induction of Nkla at 48 hpi and very high induction (>100 fold) of ifng at 24 hpi. A strong response to infection was demonstrated by beta glucan trained fish. Kidney tissues demonstrated a rapid response with very high induction of Nklb at 6 hpi and Nkld and ifng at 12 hpi which decreased to high expression at 24 hpi. Nkla was moderately induced at 48 hpi. Kidney tissues from beta glucan + RE33® trained fish demonstrated very high induction of Nkld at 12 and 24 hpi, Nklb at 24 hpi and ifng at 48 hpi and moderate induction of Nkla at 48 hpi. Kidney tissues from RE33® trained fish demonstrated very high induction of T-bet at 6 hpi and Nkld at 12 hpi. R848 trained fish demonstrated a high induction of Nkla at 48 hpi, while the R848 + RE33® trained fish demonstrated very high induction of Nkld at 24 hpi and ifng at 48 hpi, and moderate induction of Nkla at 48 hpi.
2.2.2. Liver
Liver tissues demonstrated a similar responsive profile (Table 3 and Supp Figure 3 and Figure 4). The PBS injected fish showed mild responses. The naïve fish that were challenged showed high to very high expression of ifng at 6, 12 and 48 hpi and high induction of Nklc at 48 hpi. Liver tissues from the beta glucan + RE33® trained fish demonstrated the most induced genes, with very high induction of Nkld at 12 and 24 hpi and of ifng, T-bet, Nitr9, Nkla, Nklb and Nklc at 24 hpi. The beta glucan trained fish had a more rapid response as was seen in the kidney with very high induction of ifng, Nkla, Nklb, Nklc and Nkld at 6 hpi. Liver tissues from the RE33® trained fish demonstrated very high induction of Nitr9 at 6 hpi, Nkla at 12 hpi and ifng at 48 hpi. Liver tissues from the R848 trained fish demonstrated very high induction of Nitr9 at 12 hpi while the R484 + RE33® trained fish demonstrated very high induction of Nitr9 at 24 hpi and INF at 48 hpi. To gain the best understanding of the trained immunity induced secondary gene responses associated with survival, we performed Principal Component Analysis on the survival and gene expressions from the kidney and liver tissues of the beta glucan, R848, RE33®, beta glucan + RE33® and R848 + RE33® treated MT zebrafish.
2.3. Principal Component Analysis
Dealing with numerous gene expression values and time points can be challenging to interpret. Using the expression of multiple immune genes over time in principal component analysis (PCA) is a statistical approach to assess and compare the effectiveness of different treatments in the context of immune responses. The PCA used gene expression data (time and relative expression) and transformed it into principal components and were ordered by the degree to which they explain the survival data. PCA plotting demonstrated patterns and groupings. Treatments that lead to similar immune responses were clustered together. This visualization helped identify which treatments and gene expressions have the most similar or different effects on survival. When survival is plotted within these groupings, the significance of gene expressions to survival was demonstrated.
The PCA biplot analysis illustrated how survival (active observations) occurred relative to gene expressions and time (active variables) and suggests that different innate immune training treatments resulted in different patterns of NK cell gene expression. F1 (the first principal component), represents the most dominant trend in gene expression changes. F2 is the second principal component and represents the second most dominant trend in gene expression that is independent of F1. Together, F1 and F2 demonstrate differences in gene expression and survival. The upper right quadrant in which F1 and F2 are both positive is where most of the gene expression variances are located, and these are the variables that had the greatest effect on survival. The treatment in this quadrant was correlated to strong immune gene activation. Gene expressions occurring in the upper left quadrant represent a different profile, and survival in this quadrant resulted from different gene expressions and pathways. Survival from treatments that occur in the lower quadrants were correlated with gene expressions or pathways that were different from the upper quadrants, or from gene expressions that did not have as great an effect on survival.
The PCA F1 of vaccination treatments according to differential gene expressions in kidney tissue plotted six of the 6 hpi gene Eigenvectors (nkla, nklb, nklc, nkld, t-bet and ifng), and six of the 12 hpi gene Eigenvectors (nkla, nklb, nklc, nkld, t-bet and ifng) and nitr9 and t-bet at 48 hpi Eigenvectors in the upper right quadrant. The active observation beta glucan survival was in this quadrant, suggesting it is strongly influenced by and associated with these gene expressions (Figure 2A and Supp Figure 5).
The PCA F2 of kidney included three of the 24 hpi gene expression Eigenvectors (nklc, nkld and t-bet) and five of the 48 hpi gene Eigenvectors (nklb, nklc, nkld, ifng and nitr9) were in the upper left quadrant. The active observations beta glucan + RE33® survival and R848 + RE33® survival were in this quadrant, suggesting they are strongly influenced by and associated with these gene expressions. The active observations R848 survival and RE33® survival were in the lower quadrants, suggesting that these differ from the other treatments, and the immune responses induced by these treatments have weaker gene expression patterns or were more influenced by other genes. (Figure 2A and Supp Figure 5).
Figure 2.
Principal Component Analysis (PCA) of vaccination treatments (active observations) associated with differential gene expressions (active variables) in A. kidney marrow and B. liver tissues. For each vaccination treatment, ifng, t-bet, nitr9, nkla, nklb, nklc and nkld were determined at 6, 12, 24 and 48 hours post bacterial challenge. S refers to data collected after the secondary exposure (bacterial challenge) one month after induction of trained immunity. The vaccinations with the highest survival were beta glucan, beta glucan + Re33® and R848 + Re33®. Tissue gene expressions for the Poly I:C and Poly I:C + RE33® treatments were not determined.
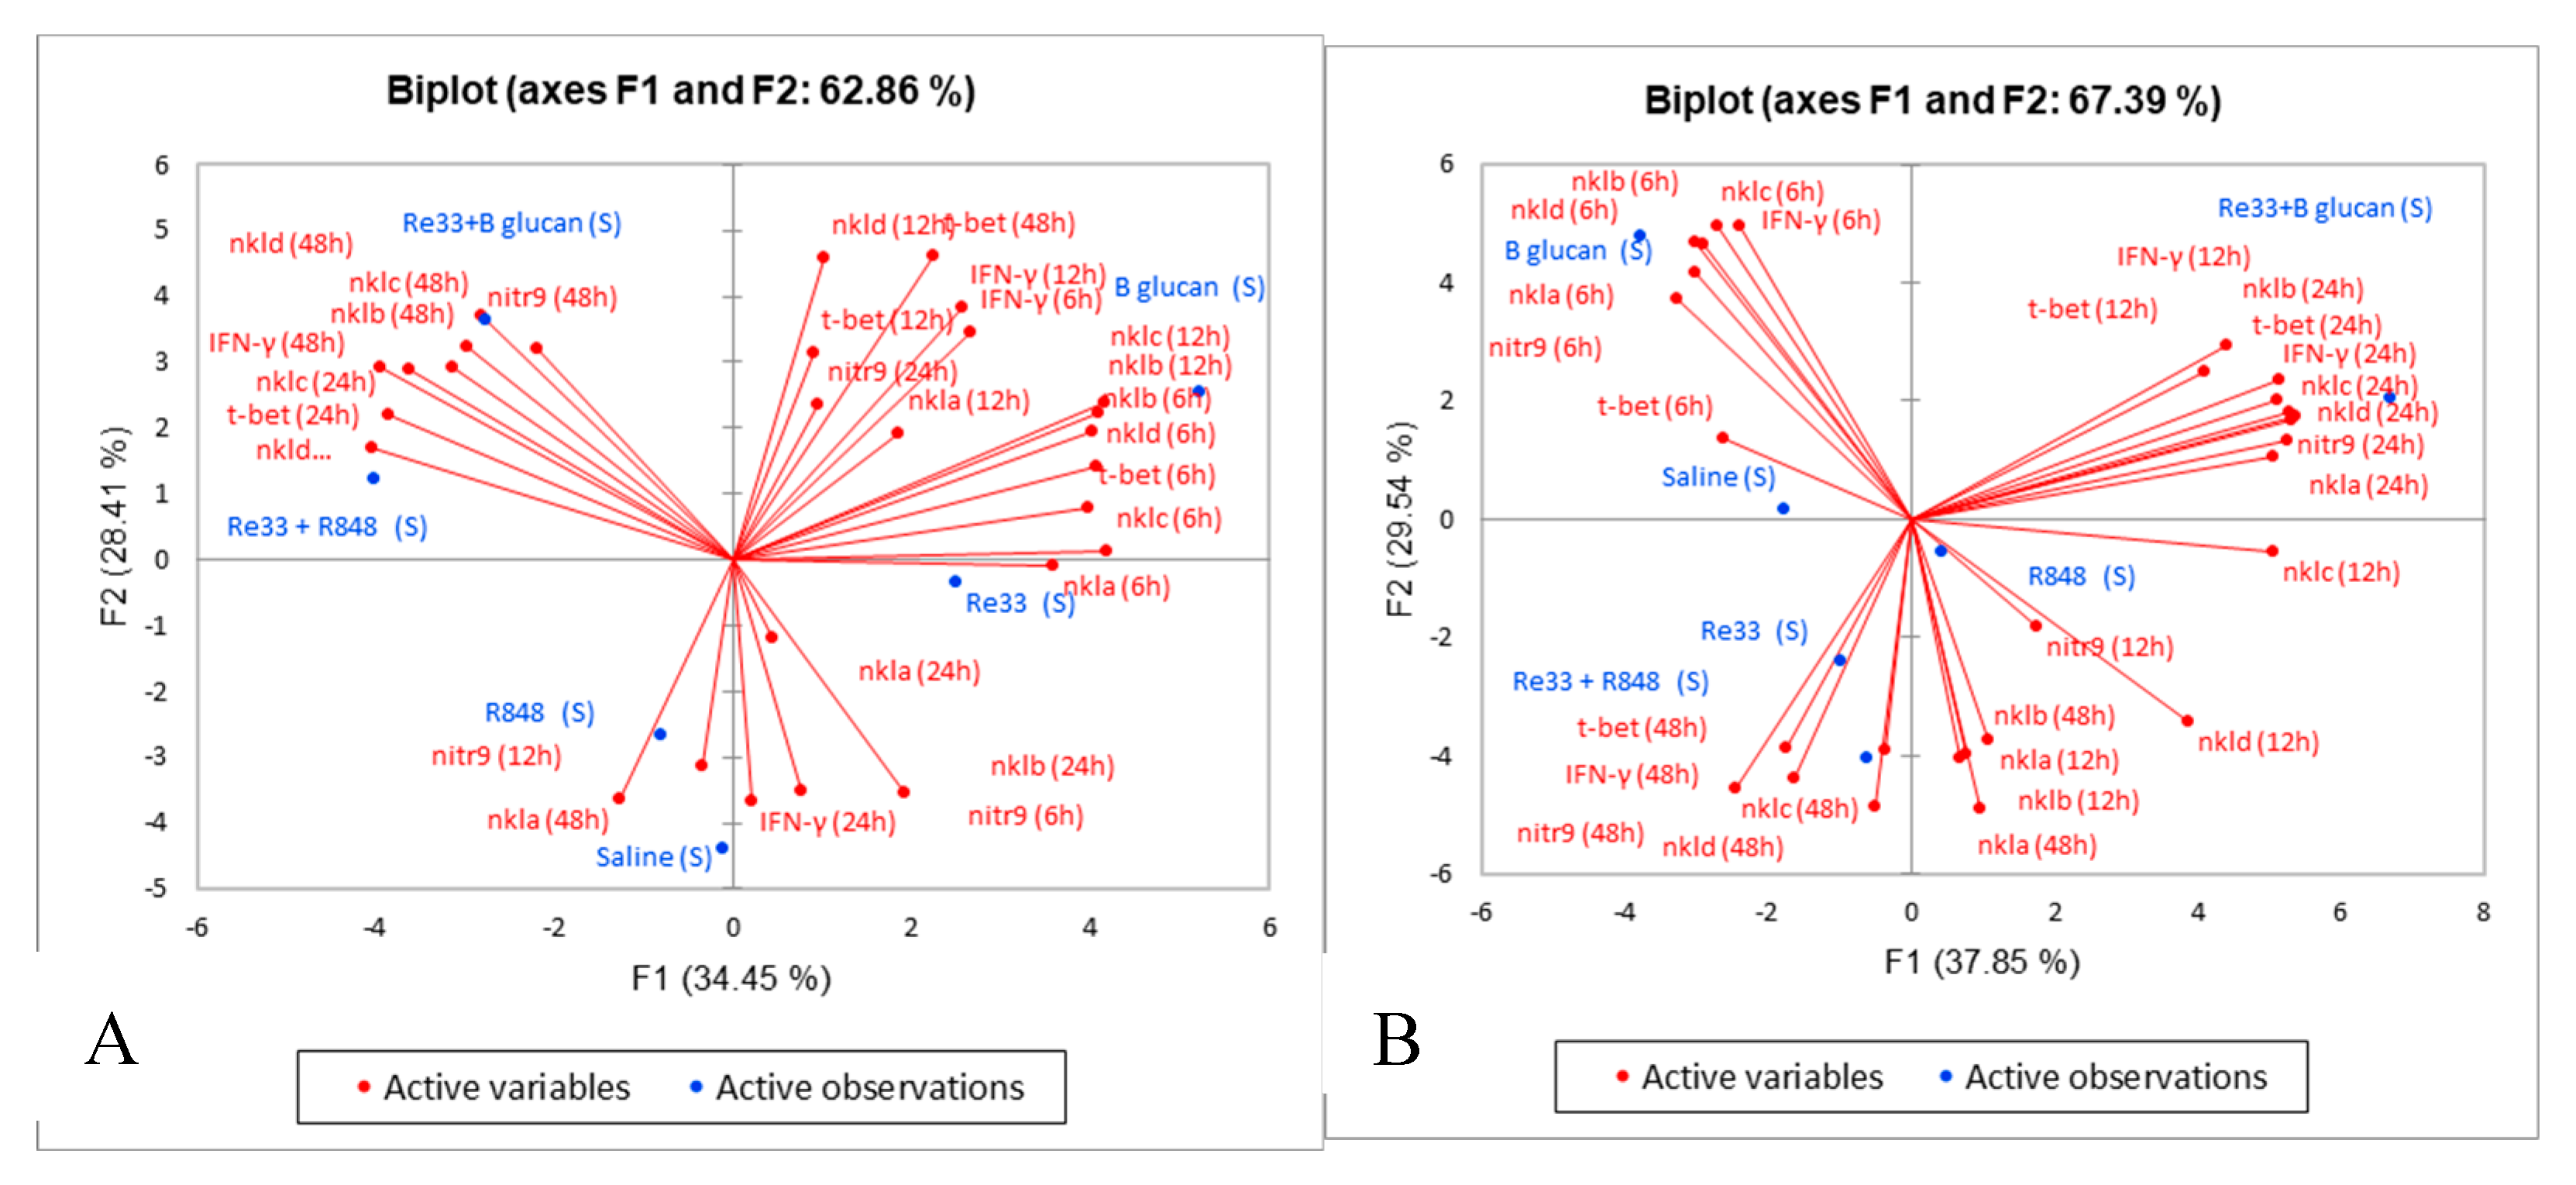
The PCA F1 of vaccination treatments according to differential gene expressions in liver tissue included two of the 12 hpi gene Eigenvectors (t-bet and ifng) and all the 24 hpi gene Eigenvectors (nkla, nklb, nklc, nkld, t-bet, nitr9 and ifng) in the upper right quadrant. The active observation beta glucan+ RE33® survival was in this quadrant, suggesting it was strongly influenced by and associated with these gene expressions (Figure 2B and Supp Figure 6). All the 6 hpi gene Eigenvectors (nkla, nklb, nklc, nkld, ifng, t-bet and nitr9) were in the upper left quadrant (Figure 2B and Supp Figure 6). The active observation beta glucan survival was in this quadrant, suggesting it was strongly associated with these gene expressions.
2.4. Expression of MPEG-1+ and NITR9+ Leukocytes in Kidney and Liver Tissues
2.4.1. Kidney
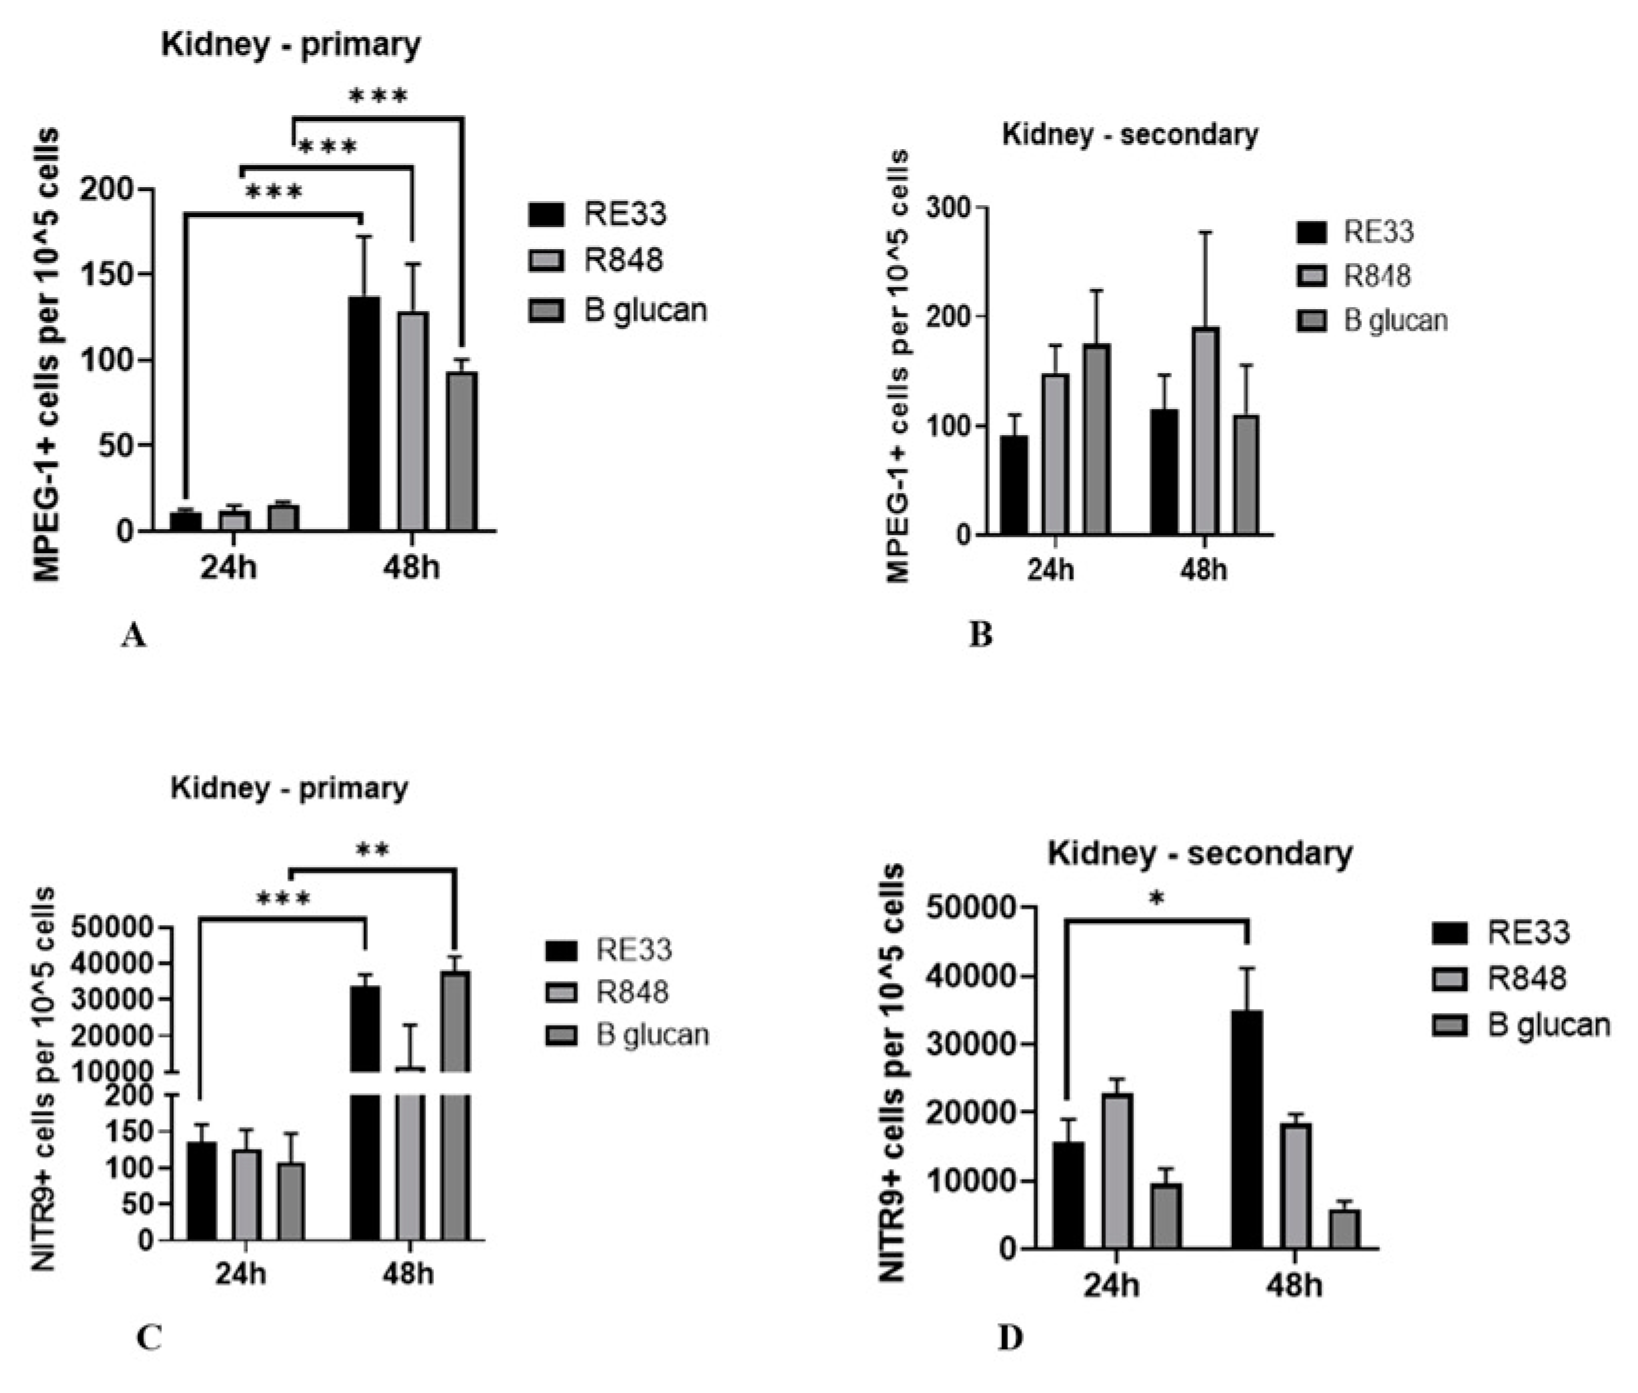
Flow cytometry demonstrated MPEG-1+ kidney leukocytes significantly increased between 24 and 48 hours following initial exposures to RE33®, R848 and beta glucan IC injections (Figure 3A and Supp Table 1). After one month, there were no significant changes in the kidney MPEG-1+ cells between 24 and 48 hpi after WT E. ictaluri challenge for any treatments (Figure 3B and Supp Table 1). NITR9+ kidney leukocytes significantly increased between 24 and 48 hours following initial exposures to RE33® and beta glucan IC injection (Figure 3C and Supp Table 1). After one month, RE33® trained NITR9+ kidney leukocytes significantly increased between 24 and 48 hpi in WT E. ictaluri exposed fish from these treatments (Figure 3D and Supp Table 1).
Figure 3.
Flow cytometric analysis of rag1-/- mutant zebrafish MPEG-1+ kidney macrophages A) 24 and 48 hours post injection (hpi) with R848, beta glucan or RE33® and B) at 24 and 48 hpi of WT E. ictaluri one month after induction of trained immunity. C) Flow cytometric analysis of rag1-/- mutant zebrafish NITR9+ kidney Natural Killer cells at 24 and 48 hours post injection (hpi) with R848, beta glucan or RE33® and D) at 24 and 48 hpi of WT E. ictaluri one month after induction of trained immunity.
2.2.2. Liver
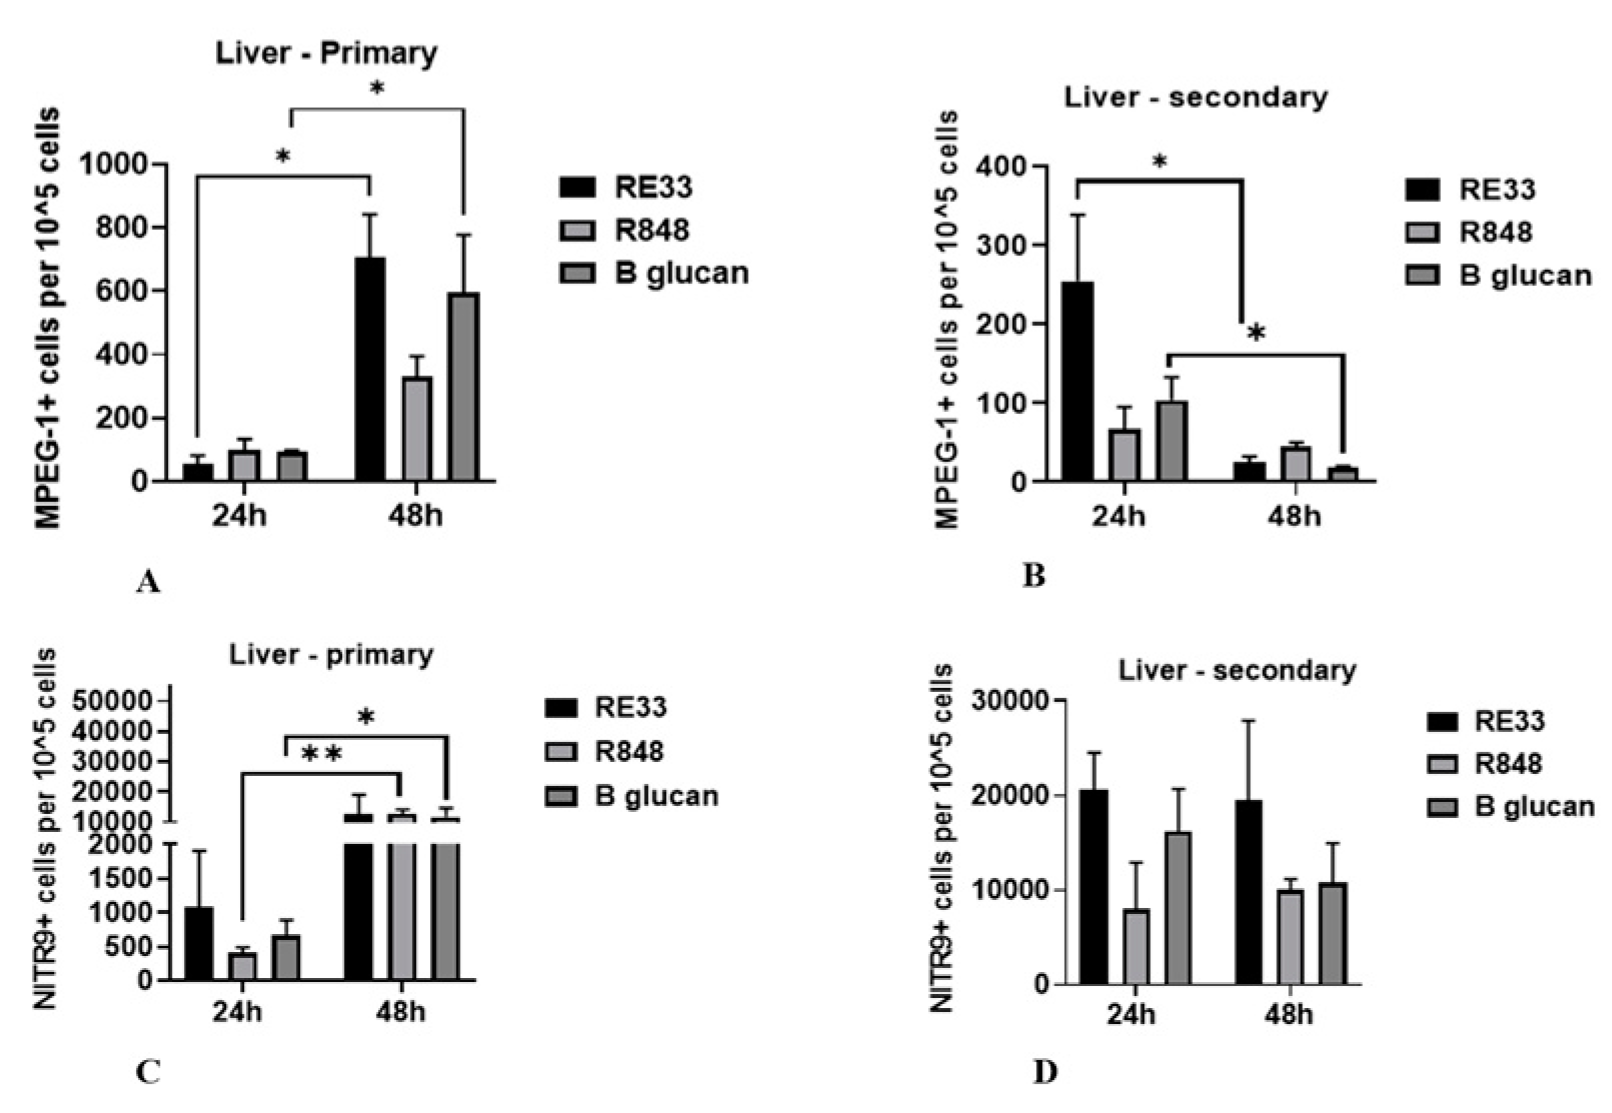
MPEG-1+ liver leukocytes significantly increased between 24 and 48 hours following initial exposures to RE33® and beta glucan IC injections (Figure 4A and Supp Table 1). After one month, MPEG-1+ liver leukocytes significantly decreased between 24 and 48 hpi after WT E. ictaluri challenge for the RE33® and beta glucan training treatments (Figure 4B and Supp Table 1). NITR9+ liver leukocytes significantly increased between 24 and 48 hours following initial exposures to R848 and beta glucan (Figure 4C and Supp Table 1). After one month, NITR9+ liver leukocytes did not significantly change between 24 and 48 hpi for any of the treatments (Figure 4D and Supp Table 1).
Figure 4.
Flow cytometric analysis of rag1-/- mutant zebrafish MPEG-1+ liver macrophages A) 24 and 48 hours post injection (hpi) with R848, beta glucan or RE33® and B) at 24 and 48 hpi of WT E. ictaluri one month after induction of trained immunity. C) Flow cytometric analysis of rag1-/- mutant zebrafish NITR9+ liver Natural Killer cells at 24 and 48 hours post injection (hpi) with R848, beta glucan or RE33® and D) at 24 and 48 hpi of WT E. ictaluri one month after induction of trained immunity.
3. Discussion
One of the hallmarks of trained immunity is protection against subsequent pathogen exposure. Our study demonstrates the induction of trained immunity with beta glucan, R848, Poly I:C and RE33® providing protection against the bacterial pathogen E. ictaluri 30 days after the training event in MT zebrafish. Beta glucan induced trained immunity provided heterologous protection to IC administered E. ictaluri and E. piscicida in channel catfish [8] and gavage administered E. ictaluri in MT zebrafish [4]. An earlier study from our lab demonstrated adoptive cell transfers of innate immune cells from E. ictaluri exposed MT zebrafish provided protection against E. ictaluri in naïve MT zebrafish [1].
Another hallmark of trained immunity is cellular metabolic changes characterized by pro-inflammatory genes being upregulated in a short time span after rechallenging with a secondary stimulus [28]. Enhanced cellular phagocytic functions were demonstrated after beta glucan induced trained immunity in turbot [29], carp macrophages [5] and channel catfish [8]. Cellular metabolic changes result from histone methylation and acetylation changes. These changes were documented in channel catfish [8].
Our transcriptomic studies using the MT zebrafish/E. ictaluri model demonstrated genes for cell receptor activation, signal transduction, cell proliferation and cytotoxic functions were up-regulated [3] following secondary exposure to the bacterium (trained immunity). This finding was similar to our study showing the correlation of upregulated inflammatory genes and gene pathways to beta glucan induced trained immunity in catfish [8]. Many studies have documented the effects of TLR ligand exposures enhancing immune responses of fish (reviewed in [30,31]), but most documented immune stimulation or immune priming not the long term effects of trained immunity. Immune stimulation can last up to two weeks, and results in increased gene expression and cellular metabolic activity. Immune priming is a short-term heightened responsiveness that can be part of the adaptive immune response [7]. These early primary responses may be much different from the responses after epigenetic and metabolic reprogramming that is long term, and characteristic of trained immunity. Trained immunity involves a long-term functional reprogramming of innate immune cells that results in heightened responses upon secondary exposure, even after extended periods [7]. In our current study, the robust gene responses as early as 6 hours after bacterial challenge in fish that received TLR ligand exposure one month earlier demonstrate a trained immunity effect, distinct from the transient immune activation seen during short-term immune stimulation or priming.
Principal Component Analysis of the kidney tissue and the separation of upregulated gene expressions into early (6 and 12 hours) and late (24 and 48 hours) responses suggest a timing difference in NK cell activation between beta glucan alone (upper right quadrant) and the combined beta glucan+ RE33® innate trainings (upper left quadrant). After beta glucan innate immune training, subsequent bacterial exposure resulted in a rapid initial response that resulted in early survival benefits and the highest survival of the innate trainings administered. Innate training with combined beta glucan+RE33® resulted in a sustained immune response enhancing NK cell gene expressions at 24 and 48 hours post bacterial exposure. These gene expressions resulted in survival that was equivalent to beta glucan alone but significantly greater than RE33® alone. Beta glucan 6 and 12 hpi gene expressions in the upper right quadrant and the beta glucan + RE33® 24 and 48 hpi gene expressions in the upper left quadrant suggest that different pathways may be involved in the trained immune responses of these two treatments. Active observations RE33® and R848 survival were in the lower quadrants of the PCA and were not near the dominate Eigenvectors. Although survival from each of these treatments was significantly higher than the control treatment, this suggests these treatments are less associated with the prominent genes or immune pathways associated with higher survival. Our findings suggest the upregulation of transcription factor, t-bet, is very important for survival; upregulation of this gene at 6, 12, and 48 hours post bacterial exposure occurred in the upper right quadrant of the PCA biplot. Nitr9 gene expression was the most diverse, with one of the 4 time points occurring in a different quadrant. This finding suggests that nitr9 expression in the kidney is influenced by the expression of other genes or pathways and is not directly indicative of survival. In summary, beta glucan induced trained immunity in the MT zebrafish kidney provides a quick NK cell response that results in the highest survival after secondary pathogen exposure. However, combining beta glucan with RE33® innate training treatment results in equivalent protection and may create a more sustained trained immune response and prolonged activation, useful for extended pathogen resistance.
Principal Component Analysis in the liver revealed strong representation of beta glucan+RE33® survival in the upper right quadrant and association with significant gene upregulation at 12 and 24 hours post bacterial exposure. This suggests that in the liver, the beta glucan+ RE33® combination triggered a sustained immune response earlier compared to the kidney with the dominant factors affecting survival occurring mid-way through the sampling period. Early-to-mid-activation of liver NK cell-related genes induced by beta glucan+RE33® innate training treatment were most associated with survival. In the upper left quadrant of the PCA biplot, beta glucan survival showed an association with early 6-hour gene expressions, indicating a more immediate but possibly shorter-lived response in the liver. In our current study, PCA modeling links survival to temporal gene expression data. This statistical visualization approach is used in human disease research [32,33,34] but has not been used with fish disease research. PCA has been used to study zebrafish development [35] and the effects of environmental factors on fish [36] and oysters [37]. In our current study, PCA indicates the biological relevance of treatments that are more likely to have higher survival. The positioning of eigenvectors representing gene expressions in the upper quadrants suggests a stronger or more robust gene response associated with beta glucan and beta glucan + RE33® survivals, suggesting these treatments stimulate more immune pathways over time, resulting in a more comprehensive and prolonged immune response.
Interpreting the findings by tissue and time revealed that in the kidney, beta glucan had the greatest effect on gene expressions and initiated early protection, while beta glucan+RE33® provided a more sustained activation, enhancing survival over a longer period. In the liver, beta glucan training induced early activation, but when combined with RE33® shifted NK gene expressions to 12 and 24 hours post exposure that resulted in a stronger response on the bi-plot. The complementary, or synergistic effect of beta glucan+RE33® was very interesting. It appeared to induce a prolonged activation profile in both tissues, but on different timelines. In the kidney there was longer NK cell activation, and in the liver, there was an earlier sustained activation, possibly resulting in different immune benefits depending on the tissue. Varying immune cell populations in different tissues [2] can influence how each tissue responds to different TLR ligands and trained immunity inducers.
Our findings suggest there are NK cell subpopulations in the kidney and the liver that may alter their function based on tissue microenvironment. Mammalian NK cells are composed of multiple subsets based on surface phenotype, immunological activity and anatomic distribution. Liver tissue harbors circulating NK cells and resident NK cells (restricted mobility in liver) [38]. Liver resident NK cells exhibit anti-bacterial activity [39] and have different transcriptional profiles compared to circulating NK cells. MT zebrafish kidney and liver tissues have different NK-like cell profiles [40]. Mammalian tissue-resident memory NK cells have demonstrated specialized roles, determined by the tissue microenvironment and specific functional demands (reviewed in [41]. In our experiments, the liver and kidney show distinct timing and intensity in NK cell gene responses to immune stimuli. The differences in timing and survival associations between beta glucan, beta glucan + RE33®, and TLR training suggest that certain NK subpopulations in each tissue have specific roles and timing in immune responses to different ligands and support survival differently. Beta glucan training induces a response that is rapid in the kidney NK cell subpopulation, and longer to upregulate gene expression in the liver and supports higher survival. However, the combination of beta glucan + RE33® induces a more rapid response in the liver and is associated with significantly lower survival than beta glucan alone. An earlier response may correlate to a NK cell subpopulation that is more responsive to a ligand, or more abundant in a tissue. A longer response may suggest a NK cell subpopulation that may have a regulatory or memory function.
Our flow cytometry data determined the levels of NK cell and macrophage biomarkers NITR9 and MPEG-1, respectively, at 24 and 48 hpi after WT E. ictaluri challenge and found minimal changes in the cell populations of the trained fish after challenge. These findings suggest the up-regulation of NK associate genes at 24 and 48 hr were not related to changes in Nitr9+ NK cell numbers and suggests NK cell gene expressions (6 and 12 hpi in the kidney and 12 to 24 hpi in the liver) were indicative of enhanced immune readiness not increased cell numbers.
In kidney tissue, increased numbers of NITR9 and MPEG-1 positive cells in the primary response suggested that NK cells and macrophages responded to the initial training induced by beta glucan, RE33® and R848. The lack of increased MPEG-1 positive cells following bacterial exposure after one month suggest that kidney trained immunity functional changes do not require increased MPEG-1 positive cell numbers. It is interesting to note RE33® induced training resulted in increased NITR9+ cell numbers at 48 hpi following bacterial exposure after one month. In the PCA, kidney nitr9 at 48 hpi was in the upper left quadrant and was associated with RE33® + beta glucan and RE33® + R848 survival and could result from memory NK cells, but this change in the population was not seen with the other treatments.
In liver tissue, the increased MPEG-1 positive cells suggest macrophages responded to RE33® and beta glucan exposure. However, decreased MPEG-1 positive cells following bacterial exposure after one month suggest that RE33® and beta glucan trained liver macrophages may exhibit a regulated or restrained response after a secondary bacterial challenge, possibly to control inflammation. RE33®, R848 and beta glucan induced training resulted in significantly increased NITR9+ cell numbers in the liver. However, none of the trained fish demonstrated a change in NITR9+ numbers after a secondary bacterial challenge. In the PCA, nitr9 at 48 hpi was in the lower left quadrant. This is very different from the kidney tissue. A possible explanation is the liver is involved in maintaining metabolic and immune balance, so prolonged or sustained immune activation is regulated to prevent inflammation. Temporally, the kidney and liver flow cytometry findings occurred after the initial gene responses correlated to increased survival. At 48 hours post the secondary challenge, regulatory or suppressive immune responses would be required to control the heightened early responses associated with trained immunity.
This study demonstrated that TLR ligands induced trained immunity and protection to subsequent bacterial challenge in lymphocyte deficient zebrafish, with the best protection provided by beta glucan. Co-administration of TLR ligands with a live attenuated vaccine increased survival above that of the vaccine alone, demonstrating these agents can act as powerful adjuvants. The basis of protection was rapid NK cell immune gene responses that varied between kidney and liver tissues, suggesting tissue resident NK cell subpopulations were responding differently to immune training induced by different ligands.
4. Material and Methods
4.1. Zebrafish Care
Zebrafish were raised and maintained at 28°C in the specific pathogen free (SPF) hatchery in the College of Veterinary Medicine (CVM), Mississippi State University (MSU) following standard lab protocols. Experimental protocols were approved by the MSU Institutional Animal Care and Use Committee. A homozygous breeding colony of rag1-/- mutant (MT) zebrafish was previously established [42] and bred at the CVM-SPF hatchery and the experimental fish were progeny from that colony.
4.2. Innate Immune Training
MT zebrafish were administered either a TLR ligand, attenuated bacteria, or co-administered a TLR ligand and attenuated bacteria. To accomplish this, MT zebrafish (n=10 for each treatment) were intra-coelomically (IC) injected with either beta glucan 50μg/0.5g of fish, Poly I:C 50μg/0.5g of fish, R848 0.08 μl/0.5g of fish, 1x10⁴ CFU live attenuated vaccine strain of Edwardsiella ictaluri (RE33®) [20], beta glucan + RE33®, Poly I:C + or R848 + RE33®. Each of these compounds were dissolved in 10 μl of PBS. Control fish were IC injected with 10µl/fish of endotoxin free PBS. Two tanks were used per treatment and the experiment was repeated three times.
4.3. Survival Trials
4.3.1. Preparation of Bacterial Cultures
E. ictaluri (field strain 93146) identification was confirmed by biochemical analysis using the bioMerieux api20 strip (Bio Merieux, 69280 Marcy l’Etoile, France). Aliquots (0.5 mL) were stored in 20% glycerol at -80°C until needed for trials, at which time one aliquot was thawed and added into Brain Heart Infusion broth and incubated in a shaker incubator at 30°C overnight. Logarithmic phase cultures were obtained by dilution of the overnight culture 1:10 and grown until the optical density was 0.4 at 540 nm which corresponds to 108 colony forming units (CFU) per mL. Culture purities were assessed and bacterial concentrations determined by plating serial dilutions on 5% sheep blood agar plates.
4.3.2. Lethal Dose (LD50) Determination
In separate trials, MT mutant zebrafish were injected with E. ictaluri, (106, 105, 104, 103, 102, or 101 CFU/fish) to select the LD50 dosage for the protection exposures (to determine if the treatment exposures provided protection). Injections of MT zebrafish were performed using four replicate tanks per treatment with 15 fish per replicate. Additionally, 15 control fish were sham injected. Mortalities were recorded for 18 days post injection (dpi), and the dose at which 80% of the fish died was used for the protection exposure.
4.3.3. Bacterial Infections
Four weeks after innate immune training, the zebrafish were challenged by 1×10⁴ CFU/fish intra-coelomic (IC) injections of virulent WT E. ictaluri (field strain 93146). Fish were observed and deaths recorded for 20 days. Fish were observed three times per day and moribund fish were euthanized by immersion in 340 ppm Tricaine methane sulfonate and then placed in a freezer. Randomly sampled fish were necropsied to determine the presence or absence of E. ictaluri.
4.4. Quantifying Gene Expression
Innate immune training treatments were administered as described above except for the omission of Poly I:C due to the limitation in number of samples that could be processed within the sampling time frame. Four weeks later, a bacteria challenge was performed as described above. In fish, kidney marrow is a hematopoietic tissue, equivalent to the mammalian bone marrow and is a primary lymphoid organ. Following the bacteria challenge, fish were euthanized in buffered 0.02% MS222 and liver and kidney tissues from fish (n=5) were surgically removed at 6, 12, 24 and 48 hours post bacterial injection (hpi) for each treatment. For basal expression, 0 hr non-injected fish were sampled. Whole tissues were immediately transferred to 400μl Trizol reagent (Zymo Research, USA) and homogenized following standard procedures in our lab [43]. Total RNA was extracted from each liver and kidney sample using RNA extraction kits (Zymo Research, USA) according to the manufacturer’s protocol. The quantity of extracted total RNA was determined by NanoDrop ND-1000 and ND-8000 8-Sample Spectrophotometer and stored at -80°C until used. 100ng cDNA was prepared from RNA by using Super script III VILOTM cDNA Synthesis Kit (Invitrogen).
Arp, Ifnγ, T-bet, Nitr9, Nkla, Nklb, Nklc and Nkld gene expression was measured using real time quantitative PCR. The T-bet primer and probe (Table 1) were designed by Beacon Design software (BioRad) and Primer3 plus (GraphPad) software, respectively. The source of the other primers and probes are included in Table 2. All primers and probes were purchased from Eurofins MWG, Operon, Huntsville, Alabama, USA. Amplification of the ubiquitously expressed acidic ribosomal phosphoprotein (arp) gene was used for the internal control to normalize the gene expression data [44]. The amplification was performed in a 25 μL volume containing 10 μL target cDNA and 15 μL master mix containing: 8.8 μL Nuclease free water (GIBCO, Ultra PureTM), 1.5 μL MgCl2 (5mM), 2.5μl 10x buffer, 0.5μl dNTPs, 0.2μl Taq Polymerase HS enzyme (Hot Start PCR Kit, TAKARA, Japan), 0.5 μL forward primer (20 μM), 0.5 μL reverse primer (20 μM) and 0.5 μL probe (10μM). Thermal cycler parameters for the PCR program were set as follows: 50°C for 2 minutes, 95°C for 10 minutes, 45 cycles of 95°C for 15 seconds and 61°C for 1 minute. All samples (biological reps) were run in triplicates i.e., 3 technical reps/sample.

Table 1.
Summary of significantly differentially expressed genes in kidney or liver tissues of rag1-/- mutant fish at different hours post injection (hpi) with wild type E. ictaluri four weeks following induction of trained immunity by TLR ligands or RE33® alone, or combinations of TLR ligands and RE33®.
| Treatment | Tissue | Upregulated fold change post E. ictaluri challenge |
||
|---|---|---|---|---|
| 1-100 | 101-1000 | >1000 | ||
| Sham control | Liver |
Ifnγ (12h) Nklc (48h) |
Ifnγ (6h) |
Ifnγ (48h) |
| Kidney |
Nitr9 (6h) Nitr9 (12h) Nitr9 (48h) Nkla (48h) |
Ifnγ (24h) | ||
| RE33® | Liver |
Nkld (12h) Nkla (48h) |
Nitr9 (6h) Nkla (12h) |
Ifnγ (48h) |
| Kidney | Nkld (12h) |
T-bet (6h) |
||
| beta glucan | Liver |
Nkla (6h) Nklb (6h) Nkld (6h) |
Ifnγ (6h) Nklc (6h) |
|
| Kidney |
Ifnγ (24h) Nkla (48h) |
Ifnγ (12h) Nkld (12h) |
Nklb (6h) |
|
| beta glucan + RE33® | Liver |
Nkld (12h) Nitr9 (24h) Nkla (24h) Nklb (24h) Nklc (24h) Nkld (24h) |
Ifnγ (24h) T-bet (24h) |
|
| Kidney | Nkla (48h) |
Nkld (12h) Nklb (24h) Nkld (24h) Ifnγ (48h) |
||
| R848 | Liver | Nitr9 (12h) | ||
| Kidney | Nkla (48h) | |||
| R848 + RE33® | Liver | Nitr9 (24h) | Ifnγ (48h) | |
| Kidney |
Nkla (48h) |
Nkld (24h) | Ifnγ (48h) | |
Table 2.
Oligonucleotide primers and probes used for qRT-PCR to quantify gene expression levels of arp, ifnγ, t-bet, nitr9, nkla, nklb, nklc and nkld. House-keeping gene arp was used as a reference gene. *The t-bet primers and probe were designed by Beacon Design software (BioRad) and Primer3 plus (GraphPad) software, respectively.
| Gene | Oligonucleotide sequences (5’–3’) | GenBank Accession No. |
|---|---|---|
| arp |
Fwd: CTGCAAAGATGCCCAGGGA Rev: TTGGAGCCGACATTGTCTGC Probe:[6~FAM]TTCTGAAAATCATCCAACTGCTGGATGACTACC [BHQ1a~ Q] [8] |
NM_131580 |
| ifnγ |
Fwd: CTTTCCAGGCAAGAGTGCAGA Rev: TCAGCTCAAACAAAGCCTTTCG Probe:[6~FAM]AACGCTATGGGCGATCAAGGAAAACGAC[BHQ1a~ Q] [8] |
NM_212864 |
| t-bet |
Fwd:GATCAAGCTCTCTCTGTGATAG Rev:GCTAAAGTCACACAGGTCT Probe:[6~FAM]TTCTGAAGGTCACGGTCACA[BHQ1a~Q] * |
NM_001170599.1 |
| nitr9 |
Fwd: GTCAAAGGGACAAGGCTGATAGTT Rev:GTTCAAAACAGTGCATGTAAGACTCA Probe: [6~FAM]CAAGGTTTGGAAAAGCAC[BHQ1a~Q] [9] |
AY570237.1 |
| nkla |
Fwd: TTTCTGGTCGGCTTGCTCAT Rev: TTCTCATTCACAGCCCGGTC Probe:[6~FAM]TCTGCAGCTCACTGGGAGGTTCGTGA[BHQ1a~Q] |
NM_001311794 |
| nklb |
Fwd: TCCGCAACATCTTTCTGGTCA Rev: AGCCTGCTCATGAATGAAAATGA Probe:[6~FAM]CACGCCTGCAAATCTGAACCACCCA[BHQ1a~Q] |
NM_001311792 |
| nklc |
Fwd: CTGCTTGTGCTGCTCACTTG Rev: AGCACACATGGAGATGAGAACA Probe: [6~FAM]GGGCTTGCAAGTGGGCCATGGGAA[BHQ1a~Q] |
NM_001311793.1 |
| nkld |
Fwd: ACCCTGCTCATCTCCTCTGT Rev: CCCCAGCTAAAGCAAAACCC Probe:[6~FAM]TGCCTGGGATGTGCTGGGCTTGCAA[BHQ1a~Q] |
NM_212741.1 |
4.5. Principal Component Analysis
To identify the genes that were the most influential on survival, we performed XLSTAT 2020.3.1.1000 Principal Component Analysis (PCA). Pearson’s Correlation were used to transform the active variables, or gene expressions at each time point, into a set of new, uncorrelated variables that are the principal components. Using Pearson’s correlation coefficients, a correlation matrix was calculated. The correlation matrix examined all the gene expressions and identified how related they were. Variables that were highly correlated contributed similarly to a principal component, while less correlated variables contributed differently. Cumulative survival for each treatment were the active observations that were plotted with the active variables of gene expressions of 6, 12, 24 and 48 hpi in liver and kidney tissues.
4.6. Nitr9 and Mpeg-1 Expression by Fluorescence Activated Cell Sorting (FACS)
MT adult zebrafish (n=15/group) were IC injected with either beta glucan 50 μg/0.5g of fish, R848 0.08 μL/0.5g of fish, 1x10⁴ CFU live attenuated vaccine strain of E. ictaluri (RE33®) [20] or endotoxin free PBS 10μl/fish. After 24 or 48 hours, fish were euthanized in buffered 0.02% MS222 and liver and kidney tissues surgically removed. Tissues from five fish were pooled for each biological replicate and three replicates were used per treatment. Tissues were mechanically dislodged with a teflon pestle and passed through a 40μm sterile filter. Cells were washed in Hank's Balanced Salt Solution (HBSS) buffer without Ca2+ and Mg2+ at 500 x g for 20 minutes. Leukocytes were enriched by separation on a histopaque®-1077 sterile filtered gradient (Sigma-Aldrich). Briefly, the cell suspension was layered on a histopaque gradient at a ratio of 1:1 and centrifuged at 400xg for 30 min and the leukocyte layer was collected. Cells were labelled with a zombie green viability dye (BioLegend), incubated for 30 minutes at room temperature, and washed. This was followed by addition of purified rat anti- mouse CD16/CD32/mouse BD Fc block (BDPharmingenTM) (1:100) and staining with anti-zebrafish primary antibodies: anti-NITR990.10.5 (1:20) (University of North Carolina at Chapel Hill Core Facility; http://mabs.unc.edu) and anti-MPEG-1 (1:40) (AnaspecTM) to the respective tubes. Before staining cells with anti-NITR9 antibody, the cells were permeablized with perm buffer (BDbiosciencesTM) and Fc blocked to facilitate intracellular staining. Samples were incubated on ice for 45 min, washed and stained with secondary antibody goat anti-mouse IgG-PE for anti-NITR990.10.5 antibody and goat anti-rabbit IgG-APC for anti-MPEG-1 antibody followed by 15 min of incubation on ice. Cells were then washed in FACS (HBSS + 2% BSA) buffer and analyzed on a FACS Novocyte. Samples collected at this point are referred to as ‘trained’. Isotype controls were used as a negative control to help differentiate non-specific background signal from specific antibody signal. Rat IgG2b isotype control (Invitrogen, 02-9288), mouse IgG2b isotype control (Invitrogen, 02-6300) and rabbit IgG polyclonal isotype control (Abcam, ab37415) were used as negative controls as appropriate. The isotype controls for each fluor were stained using the isotype control as the primary antibody for 1 h followed by incubation with specific fluor for 30 min. Samples were incubated on ice until analyzed.
Flow cytometry analyses of kidney leukocytes involved forward scatter (FSC) and side scatter (SSC) determinations on a Calibur FACS. FSC represents cell size in diameter and SSC represents cell granularity, or complexity. Twenty thousand cells were collected from each sample. Cells were gated in three areas based on cell sizes and granularity. Unstained, fluorescence minus 1 (FMO), and isotype controls were used to set gates and determine positivity. The positive cells were calculated using the percentage positive cells minus the number positive for the isotype control. Results are presented as mean number of cells positive for a specific antibody. Novoexpress software was used for analysis.
Four weeks after the training event, the fish were challenged with 1×10⁴ CFU/fish IC injections of a virulent WT E. ictaluri (strain #93146). A control group of naïve fish (n=15) were injected with virulent WT E. ictaluri. Fish were euthanized in buffered 0.02% MS222. Liver and kidney tissues from fish were surgically removed at 24 and 48h as described above. Leukocytes were collected and labeled with anti-NITR990.10.5 and anti-MPEG-1 following the same procedures described above.
4.7. Data Analysis and Statistical Evaluation
Survival curves analysis was performed by the Kaplan-Meier survival plot. The non-parametric statistic tests Gehan-Breslow-Wilcoxon test and Log ranked (Mantel-Cox) test were used to estimate the statistical significance between the survival curves of RE33® only, TLR ligand groups only and RE33® plus TLR ligand groups. The Gehan-Breslow-Wilcoxon method gives more weight to mortalities at early time points. The Log-rank (Mantel-Cox) test gives equal weight to all time points and is preferred. Relative gene expression was determined using the Pfaffl method [45]. Data obtained from qRT-PCR were expressed as fold change and were converted to log2 values. Data were analyzed by two-way ANOVA followed by Dunnet's multiple comparison test. Data obtained from FACS was analyzed by two-way ANOVA followed by Tukey's multiple comparisons test. Survival curves analysis, qPCR and FACS data statistical analysis was performed using "GraphPad Prism version 6.00 for Windows, GraphPad Software, La Jolla California USA, www.graphpad.com”. An alpha level of 0.05 was used to determine the significance of all analyses. A matrix of Pearson Correlations demonstrated the gene expressions that were significantly correlated for each treatment. Principle Component Analysis XLSTAT 2020.3.1.1000 was performed using Pearson correlations, and examined survival described by time-correlated gene expression patterns.
Acknowledgments
We thank Dr. Beth Peterman for technical help and Dr. Wei Tan (Manager, MSU Flow Cytometry Core Facility). FACS was performed at the Flow Cytometry Core Facility, Basic Science Department, Mississippi State University.
References
- Hohn C, Petrie-Hanson L. Rag1−/− Mutant Zebrafish Demonstrate Specific Protection following Bacterial Re-Exposure. PLoS ONE. 2012;7(9):e44451.
- Muire PJ, Hanson LA, Wills R, Petrie-Hanson L. Differential gene expression following TLR stimulation in rag1-/- mutant zebrafish tissues and morphological descriptions of lymphocyte-like cell populations. PLOS ONE. 2017;12(9):e0184077.
- Krishnavajhala A, Muire PJ, Hanson L, Wan H, McCarthy F, Zhou A, et al. Transcriptome Changes Associated with Protective Immunity in T and B Cell-Deficient Rag1-/- Mutant Zebrafish. International Journal of Immunology. 2017;5(2):20.
- Peterman B, Petrie-Hanson L. Beta-glucan induced trained immunity is associated with changes in gut Nccrp-1+ and Mpeg-1+cell populations in rag1-/- zebrafish. Journal of Aquaculture, Marine Biology & Ecology. 2021;2021(01).
- Petit J, Wiegertjes GF. Long-lived effects of administering β-glucans: Indications for trained immunity in fish. Developmental & Comparative Immunology. 2016;64:93-102. [CrossRef]
- Netea MG, Domínguez-Andrés J, Barreiro LB, Chavakis T, Divangahi M, Fuchs E, et al. Defining trained immunity and its role in health and disease. Nature Reviews Immunology. 2020;20(6):375-88. [CrossRef]
- Netea MG, Joosten LAB, Latz E, Mills KHG, Natoli G, Stunnenberg HG, et al. Trained immunity: A program of innate immune memory in health and disease. Science. 2016;352(6284):aaf1098. [CrossRef]
- Petrie-Hanson L, Peterman AEB. Trained Immunity Provides Long-Term Protection against Bacterial Infections in Channel Catfish. Pathogens. 2022;11(10):1140. [CrossRef]
- Dagenais A, Villalba-Guerrero C, Olivier M. Trained immunity: A “new” weapon in the fight against infectious diseases. Frontiers in Immunology. 2023;14:1147476.
- De Zuani M, Frič J. Train the Trainer: Hematopoietic Stem Cell Control of Trained Immunity. Frontiers in Immunology. 2022;13:827250.
- Kain BN, Luna P, Hormaechea Agulla D, Maneix L, Morales-Mantilla DE, Le D, et al. Specificity and Heterogeneity of Trained Immunity in Hematopoietic Stem and Progenitor Cells. Blood. 2021;138(Supplement 1):2149-. [CrossRef]
- Ifrim DC, Quintin J, Joosten LAB, Jacobs C, Jansen T, Jacobs L, et al. Trained Immunity or Tolerance: Opposing Functional Programs Induced in Human Monocytes after Engagement of Various Pattern Recognition Receptors. Clinical and Vaccine Immunology. 2014;21(4):534-45. [CrossRef]
- Kawai T, Akira S. TLR signaling. Cell Death & Differentiation. 2006;13(5):816-25.
- Nishizawa T, Takami I, Kokawa Y, Yoshimizu M. Fish immunization using a synthetic double-stranded RNA Poly (I: C), an interferon inducer, offers protection against RGNNV, a fish nodavirus. Diseases of aquatic organisms. 2009;83(2):115-22.
- Jensen I, Albuquerque A, Sommer A-I, Robertsen B. Effect of poly I: C on the expression of Mx proteins and resistance against infection by infectious salmon anaemia virus in Atlantic salmon. Fish & shellfish immunology. 2002;13(4):311-26.
- Dong X, Su B, Zhou S, Shang M, Yan H, Liu F, et al. Identification and expression analysis of toll-like receptor genes (TLR8 and TLR9) in mucosal tissues of turbot (Scophthalmus maximus L.) following bacterial challenge. Fish & shellfish immunology. 2016;58:309-17.
- Souza-Fonseca-Guimaraes F, Parlato M, Fitting C, Cavaillon J-M, Adib-Conquy M. NK Cell Tolerance to TLR Agonists Mediated by Regulatory T Cells after Polymicrobial Sepsis. The Journal of Immunology. 2012;188(12):5850-8. [CrossRef]
- Zhou Z-x, Sun L. Immune effects of R848: Evidences that suggest an essential role of TLR7/8-induced, Myd88- and NF-κB-dependent signaling in the antiviral immunity of Japanese flounder (Paralichthys olivaceus). Developmental & Comparative Immunology. 2015;49(1):113-20.
- Zhou Y, Chen X, Cao Z, Li J, Long H, Wu Y, et al. R848 Is Involved in the Antibacterial Immune Response of Golden Pompano (Trachinotus ovatus) Through TLR7/8-MyD88-NF-κB-Signaling Pathway. Frontiers in Immunology. 2021;11:617522.
- Klesius PH, Shoemaker CA. Modified live Edwardsiella ictaluri against enteric septicemia in channel catfish. Google Patents; 2000.
- Petrie-Hanson L, Romano CL, Mackey RB, Khosravi P, Hohn CM, Boyle CR. Evaluation of Zebrafish Danio rerio as a Model for Enteric Septicemia of Catfish (ESC). Journal of Aquatic Animal Health. 2007;19(3):151-8. [CrossRef]
- Pereiro P, Varela M, Diaz-Rosales P, Romero A, Dios S, Figueras A, et al. Zebrafish Nk-lysins: First insights about their cellular and functional diversification. Developmental & Comparative Immunology. 2015;51(1):148-59. [CrossRef]
- Zhang M, Long H, Sun L. A NK-lysin from Cynoglossus semilaevis enhances antimicrobial defense against bacterial and viral pathogens. Developmental & Comparative Immunology. 2013;40(3-4):258-65. [CrossRef]
- Klose Christoph SN, Blatz K, d’Hargues Y, Hernandez Pedro P, Kofoed-Nielsen M, Ripka Juliane F, et al. The Transcription Factor T-bet Is Induced by IL-15 and Thymic Agonist Selection and Controls CD8αα+ Intraepithelial Lymphocyte Development. Immunity. 2014;41(2):230-43.
- Shah RN, Rodriguez-Nunez I, Eason DD, Haire RN, Bertrand JY, Wittamer V, et al. Development and Characterization of Anti-Nitr9 Antibodies. Advances in Hematology. 2012;2012:1-9. [CrossRef]
- Wei S, Zhou J-m, Chen X, Shah RN, Liu J, Orcutt TM, et al. The zebrafish activating immune receptor Nitr9 signals via Dap12. Immunogenetics. 2007;59(10):813-21. [CrossRef]
- Vivier E, Tomasello E, Baratin M, Walzer T, Ugolini S. Functions of natural killer cells. Nature Immunology. 2008;9(5):503-10.
- Riksen NP, Netea MG. Immunometabolic control of trained immunity. Molecular Aspects of Medicine. 2021;77:100897. [CrossRef]
- Librán-Pérez M, Costa MM, Figueras A, Novoa B. β-glucan administration induces metabolic changes and differential survival rates after bacterial or viral infection in turbot (Scophthalmus maximus). Fish & Shellfish Immunology. 2018;82:173-82. [CrossRef]
- Dawood MAO, Koshio S, Esteban MÁ. Beneficial roles of feed additives as immunostimulants in aquaculture: a review. Reviews in Aquaculture. 2018;10(4):950-74. [CrossRef]
- Wang J, Grishin AV, Ford HR. Experimental Anti-Inflammatory Drug Semapimod Inhibits TLR Signaling by Targeting the TLR Chaperone gp96. The Journal of Immunology. 2016;196(12):5130-7. [CrossRef]
- Kumar L, Greiner R. Gene expression based survival prediction for cancer patients—A topic modeling approach. PLOS ONE. 2019;14(11):e0224446. [CrossRef]
- Gravendeel LAM, Kouwenhoven MCM, Gevaert O, de Rooi JJ, Stubbs AP, Duijm JE, et al. Intrinsic Gene Expression Profiles of Gliomas Are a Better Predictor of Survival than Histology. Cancer Res. 2009. [CrossRef]
- Shen Y-J, Huang S-G. Improve Survival Prediction Using Principal Components of Gene Expression Data. Genomics, Proteomics & Bioinformatics. 2006;4(2):110-9. [CrossRef]
- White RJ, Collins JE, Sealy IM, Wali N, Dooley CM, Digby Z, et al. A high-resolution mRNA expression time course of embryonic development in zebrafish. eLife. 2017;6:e30860.
- Al-Sulaiti MM, Soubra L, Ramadan GA, Ahmed AQS, Al-Ghouti MA. Total Hg levels distribution in fish and fish products and their relationships with fish types, weights, and protein and lipid contents: A multivariate analysis. Food Chemistry. 2023;421:136163. [CrossRef]
- Gavery MR, Roberts SB. Predominant intragenic methylation is associated with gene expression characteristics in a bivalve mollusc. PeerJ. 2013;1:e215. [CrossRef]
- Peng H, Jiang X, Chen Y, Sojka DK, Wei H, Gao X, et al. Liver-resident NK cells confer adaptive immunity in skin-contact inflammation. The Journal of clinical investigation. 2013;123(4):1444. [CrossRef]
- Bermudez LE, Wu M, Young LS. Interleukin-12-stimulated natural killer cells can activate human macrophages to inhibit growth of Mycobacterium avium. Infection and immunity. 1995;63(10):4099-104. [CrossRef]
- Muire PJ, Hanson LA, Wills R, Petrie-Hanson L. Differential gene expression following TLR stimulation in rag1-/-mutant zebrafish tissues and morphological descriptions of lymphocyte-like cell populations. PLOS ONE. 2017;12(9):e0184077.
- Schuster IS, Andoniou CE, Degli-Esposti MA. Tissue-resident memory NK cells: Homing in on local effectors and regulators. Immunological Reviews. 2024;323(1):54-60. [CrossRef]
- Petrie-Hanson L, Hohn C, Hanson L. Characterization of rag1 mutant zebrafish leukocytes. BMC Immunology. 2009;10(1):8. [CrossRef]
- Elibol-Fleming, B. Effects of Edwardsiella ictaluri infection on transcriptional expression of selected immune-relevant genes in channel catfish, Ictalurus punctatus: Doctoral dissertation. Mississippi State University, Mississippi State; 2006.
- Ju B, Xu Y, He J, Liao J, Yan T, Hew CL, et al. Faithful expression of green fluorescent protein(GFP) in transgenic zebrafish embryos under control of zebrafish gene promoters. Developmental genetics. 1999;25(2):158-67.
- Pfaffl, M.W. Quantification strategies in real-time PCR. AZ of quantitative PCR. 2004;1:89-113.
Figure 1.
(A). Comparison of survival of non-vaccinated rag1-/- mutant zebrafish and RE33® (live attenuated vaccine) vaccinated fish (dashed line) after WT E. ictaluri challenge group (dotted line). There was significantly higher survival in the rag1-/- mutant zebrafish that was vaccinated compared to the group that was not. All non-vaccinated but challenged fish died by day 7. (B). Comparison of survival of rag1-/- mutant zebrafish groups that were pre-exposed to RE33® (dashed line), beta (β) glucan+RE33® (solid line) or beta (β) glucan (dotted line) and then challenged 1 month later with WT E. ictaluri. (C). Comparison of survival of rag1-/- mutant zebrafish groups that were pre-exposed to RE33® (dashed line), Poly I:C+RE33® (solid line) or Poly I:C (dotted line) and then challenged 1 month later with WT E. ictaluri. (D). Comparison of survival of rag1-/- mutant zebrafish groups that were pre-exposed to RE-33® (dashed line), R848+RE33® (solid line) and R848 (dotted line) and then challenged 1 month later with WT E. ictaluri. Statistical significance was analyzed between the fish that received vaccine or TLR ligands and challenged groups (p<0.05).

Disclaimer/Publisher’s Note: The statements, opinions and data contained in all publications are solely those of the individual author(s) and contributor(s) and not of MDPI and/or the editor(s). MDPI and/or the editor(s) disclaim responsibility for any injury to people or property resulting from any ideas, methods, instructions or products referred to in the content. |
© 2024 by the authors. Licensee MDPI, Basel, Switzerland. This article is an open access article distributed under the terms and conditions of the Creative Commons Attribution (CC BY) license (http://creativecommons.org/licenses/by/4.0/).
Copyright: This open access article is published under a Creative Commons CC BY 4.0 license, which permit the free download, distribution, and reuse, provided that the author and preprint are cited in any reuse.


