Submitted:
25 November 2024
Posted:
26 November 2024
You are already at the latest version
Abstract
Healthcare-associated infections (HCAI) are a critical public health problem, with 30 to 40% of infections related to the urinary tract system. These urinary tract infections (UTIs) are considered one of the most common microbial infections in hospital settings and everyday community contexts, where about 80% are highly correlated with urinary catheter insertion - Catheter-associated urinary tract infection (CAUTI). Considering that 15 to 25% of hospitalised patients need to be catheterised during their treatments and most CAUTIs are asymptomatic, it results in a tremendous challenge to early diagnosis of CAUTI, therefore, to initiate its treatment. The lack of standardized methods as a first step for urine monitoring and early detection of UTIs, is the driving force of this work that aims to explore the potential of absorption and fluorescence spectroscopic methodologies to detect UTIs. Urine samples were used without any previous treatment to target the most straightforward testing protocol possible. In this work, we successfully developed a powerful methodology that combines ratiometric fluorescence spectroscopy measurements and transmittance at 600 nm to distinguish healthy urines from infected urines. The complementary use of fluorescence spectroscopy and transmittance is what makes the new methodology we propose such a powerful approach to monitor urine samples and make the early detection of UTIs since it provides a quantitative analysis of both healthy and infected urines.
Keywords:
urinary tract infections
; urine monitoring
; fluorescence spectroscopy
; ratiometric measurements
; transmittance
1. Introduction
Despite the remarkable advances in healthcare over the years, there is still a long way forward regarding Healthcare-associated infection (HCAI), recognized by the World Health Organization (WHO) as a public health problem [1].
This health problem remains one of the leading causes of death worldwide and represents, also, a significant economic burden. WHO has reported the annual financial damage due to HCAI in Europe to be ~ 7 billion euros, whereas in the United States is ~ 6.5 billion dollars, just considering the direct costs [1].
Urinary Tract Infections (UTI) are among the most frequent HCAI (about 30 to 40%), and constitute one of the most common microbial infections in hospitals or even in the normal community context [2]. Despite the high prevalence of UTIs, the main challenge is to achieve a timely and accurate diagnosis, since UTI may have many different causative agents.
The main symptoms of UTI are dysuria, i.e., the presence of discomfort and burning sensation in the urethra during micturition and an abnormal increase in its frequency. Other symptoms can also be back pain, fever, cloudy, dark blood or bad-smelling urine. However, once these symptoms are identified, it is no longer possible to avoid infection and the course of action is to proceed with treatment, which can be more or less aggressive, according to the severity of the infection. Thus, the early identification of microorganisms in urine is of pivotal importance in the timely detection of UTI.
Regarding UTI resultant from HCAI, 80% are related to the urinary catheterisation, described as Catheter-associated urinary tract infections (CAUTI). According to some reports, approximately 15 to 25% of all hospitalised patients have to be catheterised during their hospital treatments [2]. Furthermore, for a single day of catheterisation the risk of developing UTI is between 1 to 2%, however, for each additional day, this risk increases 10% in women and 3 to 4% in men [3,4]. As a result, after 30 days it is possible to infer that all patients are likely to report bacteria in their urinary tract, known as bacteriuria [5]. Around 70 to 80% [6,7] of the most complicated UTIs are highly correlated with the insertion of foreign bodies, such as the indwelling catheters, which allow the adherence of microorganisms and the biofilm formation. These are mostly asymptomatic infections, especially for a catheter utilisation for less than 30 days, making diagnosis extraordinarily difficult and also delayed. In fact, asymptomatic bacteriuria is very common to develop and around 95% of patients have detectable bacteriuria only after two weeks or more when catheterised [8]. There is a correlation between the acquisition of a CAUTI and the mortality rate in intensive care units [9] and the mortality rate due to UTI can be as much as 9 % [10]. Thus, there is a considerable risk of a silent worsening of the patient’s state of health during their hospitalisation due to CAUTI, which may culminate even in death.
CAUTI is an important public health problem; its mitigation would improve patient health and result in a significant decrease in HCAI, which, in turn, would lead to an economical relieve through a reduction in hospital expenses, patient hospitalisation days and additional labour hours of health professionals [6,11].
Urine is a highly complex biological fluid mainly composed of water (≃95%) and containing a low percentage of inorganic salts and soluble metabolic residues [12]. To this date, over 3000 compounds have been identified in urine [13]. Its composition is highly volatile; it will depend on multiple factors such as gender, age, diet, metabolism, physical activity, and the presence of medications. In addition to these variables, the urine composition from the same patient can also change over time on the same day. However, a sample of urine provides a very detailed report of the patient’s internal physiological status. Many components have already become potential biomarkers for diagnosing and monitoring several diseases such as prostate cancer [14], bladder cancer [15], acute kidney injury [16] among others. Nonetheless, urine analysis and the finding of new methodologies for diagnosing abnormalities is still a target of great interest in the scientific community [17,18,19].
The currently available diagnostic methods for detecting UTI in a hospital context are mainly laboratory methods requiring pre-processing of samples which are the urine culture and urinalysis. The urine culture is the high goal standard for UTI diagnosis; it is the only method providing detailed information about the bacteria or fungal specimen causing the current infection. The main issue regarding this analysis is related to high time-consuming costs, requiring at least 24 to 72 hours for the results to be available.
The limitations mentioned above have made urinalysis the most currently used diagnostic technique with a significant role in diagnosing and monitoring nephrological and urological illnesses [20]. This method is faster and cheaper than the urine culture and can also detect the presence of bacteria in the patient’s urine through a combination of physical, chemical, and microscopic analysis [12]. However, it requires no less than 24 hours to get the results delaying diagnosis and treatment for patients with CAUTI. Since there is no standardized protocol to conduct the urine analysis, the European Urinalysis Guidelines recommend a two-step strategy [21]:
-The first step involves a visual examination followed by the dipstick test. This test is used to exclude urine samples from further analysis if the parameters of haemoglobin, leukocyte esterase activity, nitrite and protein are negative.
-In step two, if erythrocyturia, leukocyturia, bacteriuria or proteinuria are present, the urine samples are submitted for further analysis by microscopy. This step is crucial because the dipstick test screening by itself has low sensitivity carrying the risk of missing infections and other urinary tract illnesses.
Urine dipsticks have many advantages for being quick, cheap and a functional test to predict UTI in hospitalised patients. However, this method has some limitations. It is not a reusable test, the analysis result can be biased by the observer and the degradation of the urine-reacted pads can occur. Moreover, its low sensitivity compared to urine microscopy and culture can put at risk the screening accuracy of asymptomatic bacteriuria [22]. False negative tests due to technical errors and excessively diluted, acidic urine or low pH may arise and the nitrite test will be negative for bacteria that do not convert nitrate into nitrite. Any urine sample analysed no more than 4 hours after the last urination produces very inconsistent results [23] since it requires more than 4 hours for bacteria to complete the nitrate to nitrite conversion. All sum up, the first step in the urine analysis as recommended in the European Urinalysis Guidelines presents poor sensitivity, thus bears the risk of missing infections or other urinary diseases [24,25,26].
Hence, a more reliable and economic first step approach to rule out urine infections is necessary. For such an approach to become successful different requirements should be met:
- its outcome must not rely on observer judgement;
- the ability to detect different types of microbial infections (bacteria or fungus) with equal sensitivity, even in the absence of nitrite;
- a reusable methodology that is more economically advantageous in the long-term.
We, thus, propose a spectroscopic-based methodology combining fluorescence ratiometric and transmittance measurements as a first step approach for urine analysis. To further reinforce the need of a new methodology for this end, we include, at the beginning of our results section, a survey made to Portuguese healthcare professionals to investigate how problematic CAUTI are and if a new methodology for urine monitoring would be welcome.
2. Materials and Methods
2.1. Surveys
A survey was conducted through the Google Forms software, to investigate the dimension of CAUTI in Portugal at health facilities in order to understand the routines with catheterised patients, and determine which procedures are normally undertaken to monitor and detect UTI. This survey was only directed towards Portuguese healthcare professionals including doctors, nurses and nursing assistants and all were invited to leave their concerns and suggestions about the matter. The anonymity of all participants was preserved.
The following questions were asked:
1. Hospital and department, health professional (doctor, nurse, or nursing assistant)?
2. Did you ever work daily with patients in continuous catheterisation for at least five days (yes or no)?
3. Have you witnessed any cases where patients have developed a urinary tract infection due to the catheter insertion (yes, no or do not recall)?
4. If yes, how often (rarely, often, very often)?
5. As a healthcare professional, which is the priority level of these infections (CAUTIs) in asymptomatic hospitalised patients regarding an early diagnosis and treatment (low priority, medium priority or high priority)?
6. Which methods are used to detect signs of urinary tract infection in catheterised patients (dipstick urine test, urine colour observation)?
7. During a regular work shift, how often each of these methods is used on catheterised patients who do not present any symptoms of urinary tract infection (none, once, twice, three or more times)?
8. Select the worst features of each method regarding effectiveness, hygienics, speed, user-friendliness, reusability.
9. Would it be helpful to implement a new methodology for CAUTI early detection or just urine monitoring in the hospital routines (from the range of useless to extremely useful)?
2.2. Urine Samples
Urine samples for this research were provided by a large medical clinic. As a matter of protocol and logistical considerations, the urine samples were retrieved for this experimental activity approximately 24 hours after being normally analysed by the clinic. According to the medical clinic analysis (complete urinalysis), each sample provided was labelled as "Positive Sample" (urine sample with infection) or "Negative sample" (urine sample with no infection). All the urine samples were studied by us on the same day they were retrieved from the medical clinic. Throughout this manuscript, urine samples identified with UTI will be referred to as ‘’Positive Samples” and those that do not have infection as ‘’Negative samples”.
Considering the motivation of this work, it was essential to use the urine samples in their original form (as they were collected), without submitting them to any dilution, centrifugation or other separation methods, to ensure that the methodology developed can be applied on situations where it is intended that sample manipulation is kept to a minimum.
A total of 81 samples were used in this study, 40 positive and 41 negative.
2.3. Spectroscopic Measurements
As mentioned, to propose a reliable spectroscopic-based methodology as a first step approach for urine analysis, we performed absorbance, transmittance and steady-state fluorescence intensity measurements. All spectroscopic measurements were performed in 1 cm x 0.4 cm Hellma® semi-Micro, Suprasil® quartz fluorescence cuvettes. Samples were excited along the 1 cm pathway, and the emission was collected along the 0.4 cm pathway. MilliQ water was used as a blank, but it presented only a marginal intensity at the wavelengths used so the methodology proposed in the results and discussion section does not requires the use of water or any other blank, which simplifies its implementation.
Absorbance and transmittance measurements were performed in a Jasco V-560 spectrophotometer (Easton, MD, USA). Before starting the measurements, the baseline was acquired with MilliQ water. Spectra were acquired in the following conditions: 1 nm interval between two consecutive points, mean response, 1 nm bandwidth and 400 nm/min of scan speed. Regarding transmittance, the value at 600 nm was retrieved from the obtained spectrum. 600 nm is the wavelength normally used in microbiology to follow cell growth due to the optical properties of the bacterial/fungal culture growth media and to prevent cell degradation during the process. On the other hand, Rayleigh scattering is kept to minimum and light scattering measured is (mainly) due to the cells (microbial or human cells like leukocytes or hematocytes) present in the urine sample. Thus, high transmittance values suggest a low number of particles (cells) in suspensions, whereas low transmittance values are indicative of a high number of particles in suspension. On top of this, it is not expected for the other components of the urine to absorb at 600 nm.
Steady-state Fluorescence measurements were performed in a spectrofluorometer Fluorolog-3 v2.2 (HORIBA Jobin Yvon) with dual monochromators in excitation and emission, in right-angle geometry, where the radiation source is a 450 W xenon arc lamp and the reference is a photodiode. The excitation and emission spectra were corrected using the correction files provided by the manufacturer. A water bath is coupled to the spectrofluorometer enabling to control of the temperature of the cuvette holder. In fluorescence spectroscopy, several conditions were tested in order to guarantee that the most sensitive parameters to urine composition were being used. For emission spectra, three excitation wavelengths were tested: 280, 290 and 360 nm. For excitation spectra, two emission wavelengths were tested: 410 and 520 nm. Finally, for obtaining the synchronous spectra, four wavelength offsets were explored = [30, 50, 70, 90] nm. In order to optimize sensitivity, the slits of the fluorimeter were also adjusted for each method above. Once the slits were defined, they were kept the same throughout all the samples. The number of counts per second was kept within the linear dynamic range. The light scattering was also measured at the fluorimeter with λex = λem = 600 nm.
2.4. Data Processing
After data acquisition, our purpose was to explore the significant parameters that enabled to, effectively, distinguish positive urine samples (with infection) from negative ones (with no infection). The excitation, emission and synchronous spectra obtained for positive and negative samples were compared. As noted by Anwer et al. [27], we also observed that exciting a sample at λex = 290 nm could be a potential diagnostic tool to differentiate between normal urines and urines with bacteriuria. We further explored if this excitation wavelength was the one promoting the largest differences between negative and positive urine samples by comparing the emission spectra obtained in the 305 nm to 550 nm interval range for λex = 290 nm vs λex = 280 nm. To develop an approach that would yield an instrument-independent output, a ratiometric methodology was considered and for that purpose, the ratio (R) between the fluorescence intensity at the maximum emission peak (M) and 305 nm (V) was determined:
R=M/V
The value of fluorescence intensity at 305 nm was chosen because the vast majority of the samples (whether negative or positive) showed, at this wavelength, identical fluorescence intensity. This data processing ensures that, independently of the equipment used to perform the fluorescence measurements, by doing this ratio the output data can be compared. The scattering signal measured at the fluorimeter for each sample is the average of seven acquisitions.
Five main parameters were extracted and explored in order to ascertain how they could be used to distinguish between negative and positive urine samples:
• The fluorescence intensity value at the spectrum maximum peak (M);
• The fluorescence intensity value at 305 nm (V);
• The ratio value between the M and V (R);
• The transmittance value at 600 nm (T);
• The light scattering averaged value.
Our unpaired dataset was analysed by a Mann-Whitney U test (non-parametric test) since the ratio between the variances was more than 3. The significance level of each parameter was analysed through the p-value and for each statistically significant parameter, the range of values considering the confidence interval (CI) of 99% was determined to achieve the highest significant features to differentiate the urine samples into positive and negative.
3. Results and Discussion
In this work, besides presenting an alternative first-step methodology to distinguish urines with infection from healthy ones or just for the systematic urine monitoring, we also present the results of a survey answered by Portuguese healthcare professionals.
3.1. Surveys
Regarding the survey, most of the inquiries were from nurses (73%), then doctors (20%) and, finally nursing assistants (7%). Long-term catheterisation is considered when the catheter is inserted for one month or longer and is highly linked to a high probability of bacteriuria. Conversely, short-term catheterisation is assumed to be less than a month. Taking into account the wide range of days (from 1 to 30) [28], it was important to establish a minimum, so the five day-minimum was determined. Thus, only health professionals who had worked with patients who had been catheterised for more than five days were considered for the next set of questions. According to Figure 1a), most of the interviewees (90%) had previously worked with catheterized patients for at least five days.
Figure 1 b) shows that 79% of the healthcare professionals who had work with catheterised patients attributed the development of UTI due to catheter remaining. Moreover, only 17% of these professionals stated that it rarely happened (Figure 1 c)). The feedback to questions 2, 3, and 4 (Figure 1), shows that, in the understanding of the healthcare professionals, there is a strong correlation between the use of catheters and the development of UTI.
Regarding the priority level of an early diagnosis and treatment in asymptomatic catheterised patients, 67% of the health professionals considered it as a high priority, whereas 30% considered it a medium-level priority and only 3% judged it to be a low-level priority health concern (Figure 2). The results presented in Figure 1 and Figure 2, reinforce the significance of the high need for UTI early detection in catheterized patients, an idea conveyed by the healthcare professionals themselves and not only derived by the numbers that show that UTI are highly probable to developed in this kind of patients.
These first few questions of the survey (questions 2 to 5) validated what was already known from the literature – CAUTI is an health issue that needs to be tackled. Then, it was meant to explore which methods and diagnostic tools are used on a daily basis in Portuguese hospitals for an early and fast CAUTI diagnostic. The answer to this (Figure 3a) revealed that in most cases a combination of at least two approaches (either urine dipstick test + thermometer, urine dipstick test + urine observation or urine observation + thermometer) is employed. Many health professionals, ~43 %, report using all three methods in a combined strategy for the evaluation of UTI. It is worth noting that the thermometer and the urine dipstick test are not used individually, which is in line with the accuracy issues addressed in the introduction concerning the dipstick test.
We were also interested in assessing how often each method was used individually in a normal work shift in patients without any symptoms of UTI. From the results presented in Figure 3b, most health professionals (~54 %) do not use the urine dipstick test during their routine and ~40 % of them use it one time. The most used methodology is urine observation, most likely due to its simplicity.
Next, we asked the healthcare professionals what they considered to be the worst feature(s) of each method. They were able to choose among effectiveness, hygienics, diagnostic speed, user-friendly and re-use of each method. The results are displayed in Figure 4 and show that the healthcare professionals considered the lack of effectiveness to be the major drawback of all the methods. Despite not being pointed out by the health professionals in their answer, the reusability of the urine dipstick test is another major limitation of this test, since each stripe can be only used one time.
The last question of this survey regards how a device for CAUTI early detection or just urine monitoring would be helpful to implement in the hospital routines. Figure 5 shows that all health professionals have considered to be at least useful, where 36% believed to be very useful and 27% extremely useful. This last question in particular was one of the main motivations to develop this new methodology to tackle the delayed diagnosis and treatment of CAUTI, especially in asymptomatic patients.
With this survey, it became clear the lack of reusable, economical and reliable standardised methods for monitoring urine, especially in catheterised patients, for the early detection of UTIs. These findings are also consistent with the literature, which is briefly explored in the introduction. For this reason, the present work aims to propose a new spectroscopic-based methodology combining fluorescence ratiometric measurements and UV-vis absorption to measure sample transmittance as a first step approach for urine analysis to screen for UTI.
3.2. Fluorescence Spectroscopy
It is a well-known fact that there are differences between the urine composition of a patient diagnosed with a UTI and that of a healthy patient. We, thus, aim to explore these differences and develop a spectroscopic-based analysis to distinguish positive urines with infection from negative urines.
As one of the approaches, we employed steady-state fluorescence spectroscopy. Time-resolved measurements were also explored as an alternative, however, they cannot be applied to the purpose of this work mainly due to their lengthy acquisition time.
As already mentioned in the Materials and Methods section, fluorescence emission, excitation and synchronous spectra were acquired. The fluorescence synchronous spectra with Δλ = 30, 50, 70 and 90 nm (Figure S1) did not allow to differentiate between positive and negative urine samples. The average synchronous spectra (Figure S1) obtained for positive and negative samples overlap almost completely and did not allow for a way to distinguish positive and negative samples.
We have also analysed emission and excitation spectra. Since most fluorophores present in the urine have their excitation maxima in the UV-range, we acquire excitation spectra with λem = 410 nm (Figure 6 and Figure S2). The excitation spectra of all the samples are shown in Figure S2 and in Figure 6 the average spectra are plotted. When analysing the overall positive and negative spectra (Figure S2), no noticeable differences were found between the two sets of samples. The average fluorescence excitation (Figure 6a) spectra practically overlapped and thus were not considered to be a valid approach to distinguish positive and negative urine samples. Still, if the excitation spectra are analysed in the range between 250 nm and 300 nm, spectral curves of lower intensity that are unnoticed in the plot in Figure 6, are present (Figure 6b). An excitation peak close to 280 nm is observed (Figure 6b) and a greater distinction between the fluorescence intensity of positive and negative urine samples is obtained as compared to the maximum excitation peak centred around 350 nm.
As already mentioned, Anwer et al. [57] observed that at 290 nm excitation wavelength, the negative urine samples exhibited a very low intensity of fluorescence emission when compared with the positive samples. We observed the same (Figure 7a and Figure S3) and extended our research to check if by exciting the samples at λex = 280 nm we would improve the difference between positive and negative urine samples, either by selectively exciting fluorophores mostly present in positive samples or just by increasing their signal. Thus, the emission spectrum with excitation fixed at 280 nm was also obtained ((Figure 7b and Figure S3) together with the emission spectrum with excitation fixed at 290 nm (Figure 7a) in order to investigate whether this approach would be a good way forward to be used as a diagnostic tool.
The emission spectra of all the samples with λex = 290 nm or λex = 280 nm are shown in Figure S3, while the average of the fluorescence emission spectra of positive and negative samples are shown in Figure 7. The maximum is also indicated for each set of samples.
The emission spectra of urine samples with λex = 290 nm (Figure S3a)) and λex = 280 nm (Figure S3b)) show the predominance of low fluorescence intensity values for the negative samples, whereas the positive samples display fluorescence intensities that are clearly higher. Negative urine samples can apparently be distinguished from the positive ones by excitation both at 290 nm and 280 nm. The ability to differentiate between positive and negative urine is further demonstrated inFigure 7a) and Figure 7b), where the average spectra are shown. Although it is possible to successfully discriminate between positive and negative urine samples through excitation at both 290 nm and 280 nm, the fluorescence signal is stronger when the urine samples are excited at 280 nm (Figure 7b)). The significant fluorescence intensity difference between positive and negative samples can be explored in order to differentiate positive from negative urine samples. Both the fluorescence intensity ratio between positive and negative samples and their absolute difference is higher in the case of λex = 280 nm. However, absolute maxima values cannot be used directly since they are instrument-dependent.
In order to develop a reliable methodological approach, the ratio (R) between the peak maximum (M) and the fluorescence intensity at 305 nm (V) were determined for each sample (Figure 8). As mentioned, the R (Figure 8a) value is the outcome of a ratiometric measurement. At 305 nm all the samples have the same (or nearly the same) fluorescence intensity. This is shown in (Figure 8b), where it becomes clear not only that the fluorescence intensity at 305 nm is identical for positive and urine samples, but also that its value is 2 orders of magnitude lower than at the peak maximum (Figure 8c). Thus, by using a ratiometric approach instead of a single wavelength measurement our purpose is for the final intensity value to be more robust and more easily compared between different equipment and/or laboratories. Ratiometric methods are usually employed to study processes where spectral shifts are observed, which is not the case in the present work. However, the purpose here is to develop an approach capable to eliminate most instrument artifacts and intensity fluctuations.
We also tried to take advantage of the light scattering ability of the samples and use it to differentiate positive from negative urines. To evaluate light scattering, we followed two different approaches: 1) light scattering in the spectrofluorometer was measured with λex = λem = 600 nm and 2) the transmittance of the samples was measured in a spectrophotometer at 600 nm.
Regarding the light scattering of urine samples measured in the spectrofluorometer, it is hard to draw a correlation between the sample type (positive or negative) and the intensity value of the scattered light (Figure 9). Thus, measuring light scattering in a spectrofluorometer does not allow a clear distinction between positive and negative samples. In contrast, the distribution of the transmittance values is clearly dependent on the sample type (positive or negative) (Figure 10), where high transmittance values correspond to negative urine samples, whereas low transmittance is indicative of positive urine samples. In fact, transmittance has revealed to be a strong tool to differentiate between positive and negative samples. This is because the predominance of cells or cell fragments in positive urine samples will scatter the light beam, thus a smaller percentage of the incident radiation reaches the detector as compared to the negative samples. The fact that it is not possible to distinguish positive from negative urines using the light scattering measurements performed in the fluorimeter is most likely related to the geometry of the equipment. While in the fluorimeter light is collected at a 90° degree angle in relation to the light source, thus only a fraction of light is analysed, in the spectrophotometer, light reaches the detector at a 180° degree angle in relation to the light source.
3.3. A New Spectroscopic Method to Detect UTI
For each sample, the fluorescence intensity value at 305 nm (V) and the peak maximum of the fluorescence spectrum (M) was retrieved as well as the transmittance (T). The ratio (R) between M and V was calculated for each sample. The distribution of the parameters that allow to distinguish positive and negative urine samples (M, R, T) are shown in Figure 8 and Figure 10. These three parameters presented statistically significant differences between positive and negative samples with a p-value = < 0,001, shown in Table 1, where the descriptive statistics of each parameter are presented including also the CIs of 99%. The data in Table 1 clearly shows that R, M and T are effective parameters to distinguish the positive and negative samples. Moreover, between R and M parameters, only R should be used to differentiate positive from negative urines, since it is more robust and, as long as the instrument is internally calibrated, the data obtained in different instruments, days or laboratories/healthcare facilities can be directly compared if R is determined.
Envisaging the development of a methodology that can be used to distinguish positive urines from negative and taking into consideration the upper and low confidence intervals in Table 1 and data in Figure 8 and Figure 10 it was decided that:
For the parameter R – concerning the positive samples, although the range of values is not narrow, only the lower limit of the CI is used for the method under consideration. In turn, in what concerns the negative samples only the upper limit of the CI will be considered, because the lower limit is not critical to be defined as long as it is greater than zero (Table 1).
For the parameter T – the distribution of positive and negative samples is such that the upper limit of the CI of positive samples and the lower limit of CI of negative samples are still very distant. Thus, it was determined that only the upper limit of the CI was significant for the positive samples and the lower limit of the CI for the negative ones (Table 1). The lower limit of the positive samples can be defined as 0 and the upper limit of the negative samples can be defined as 100.
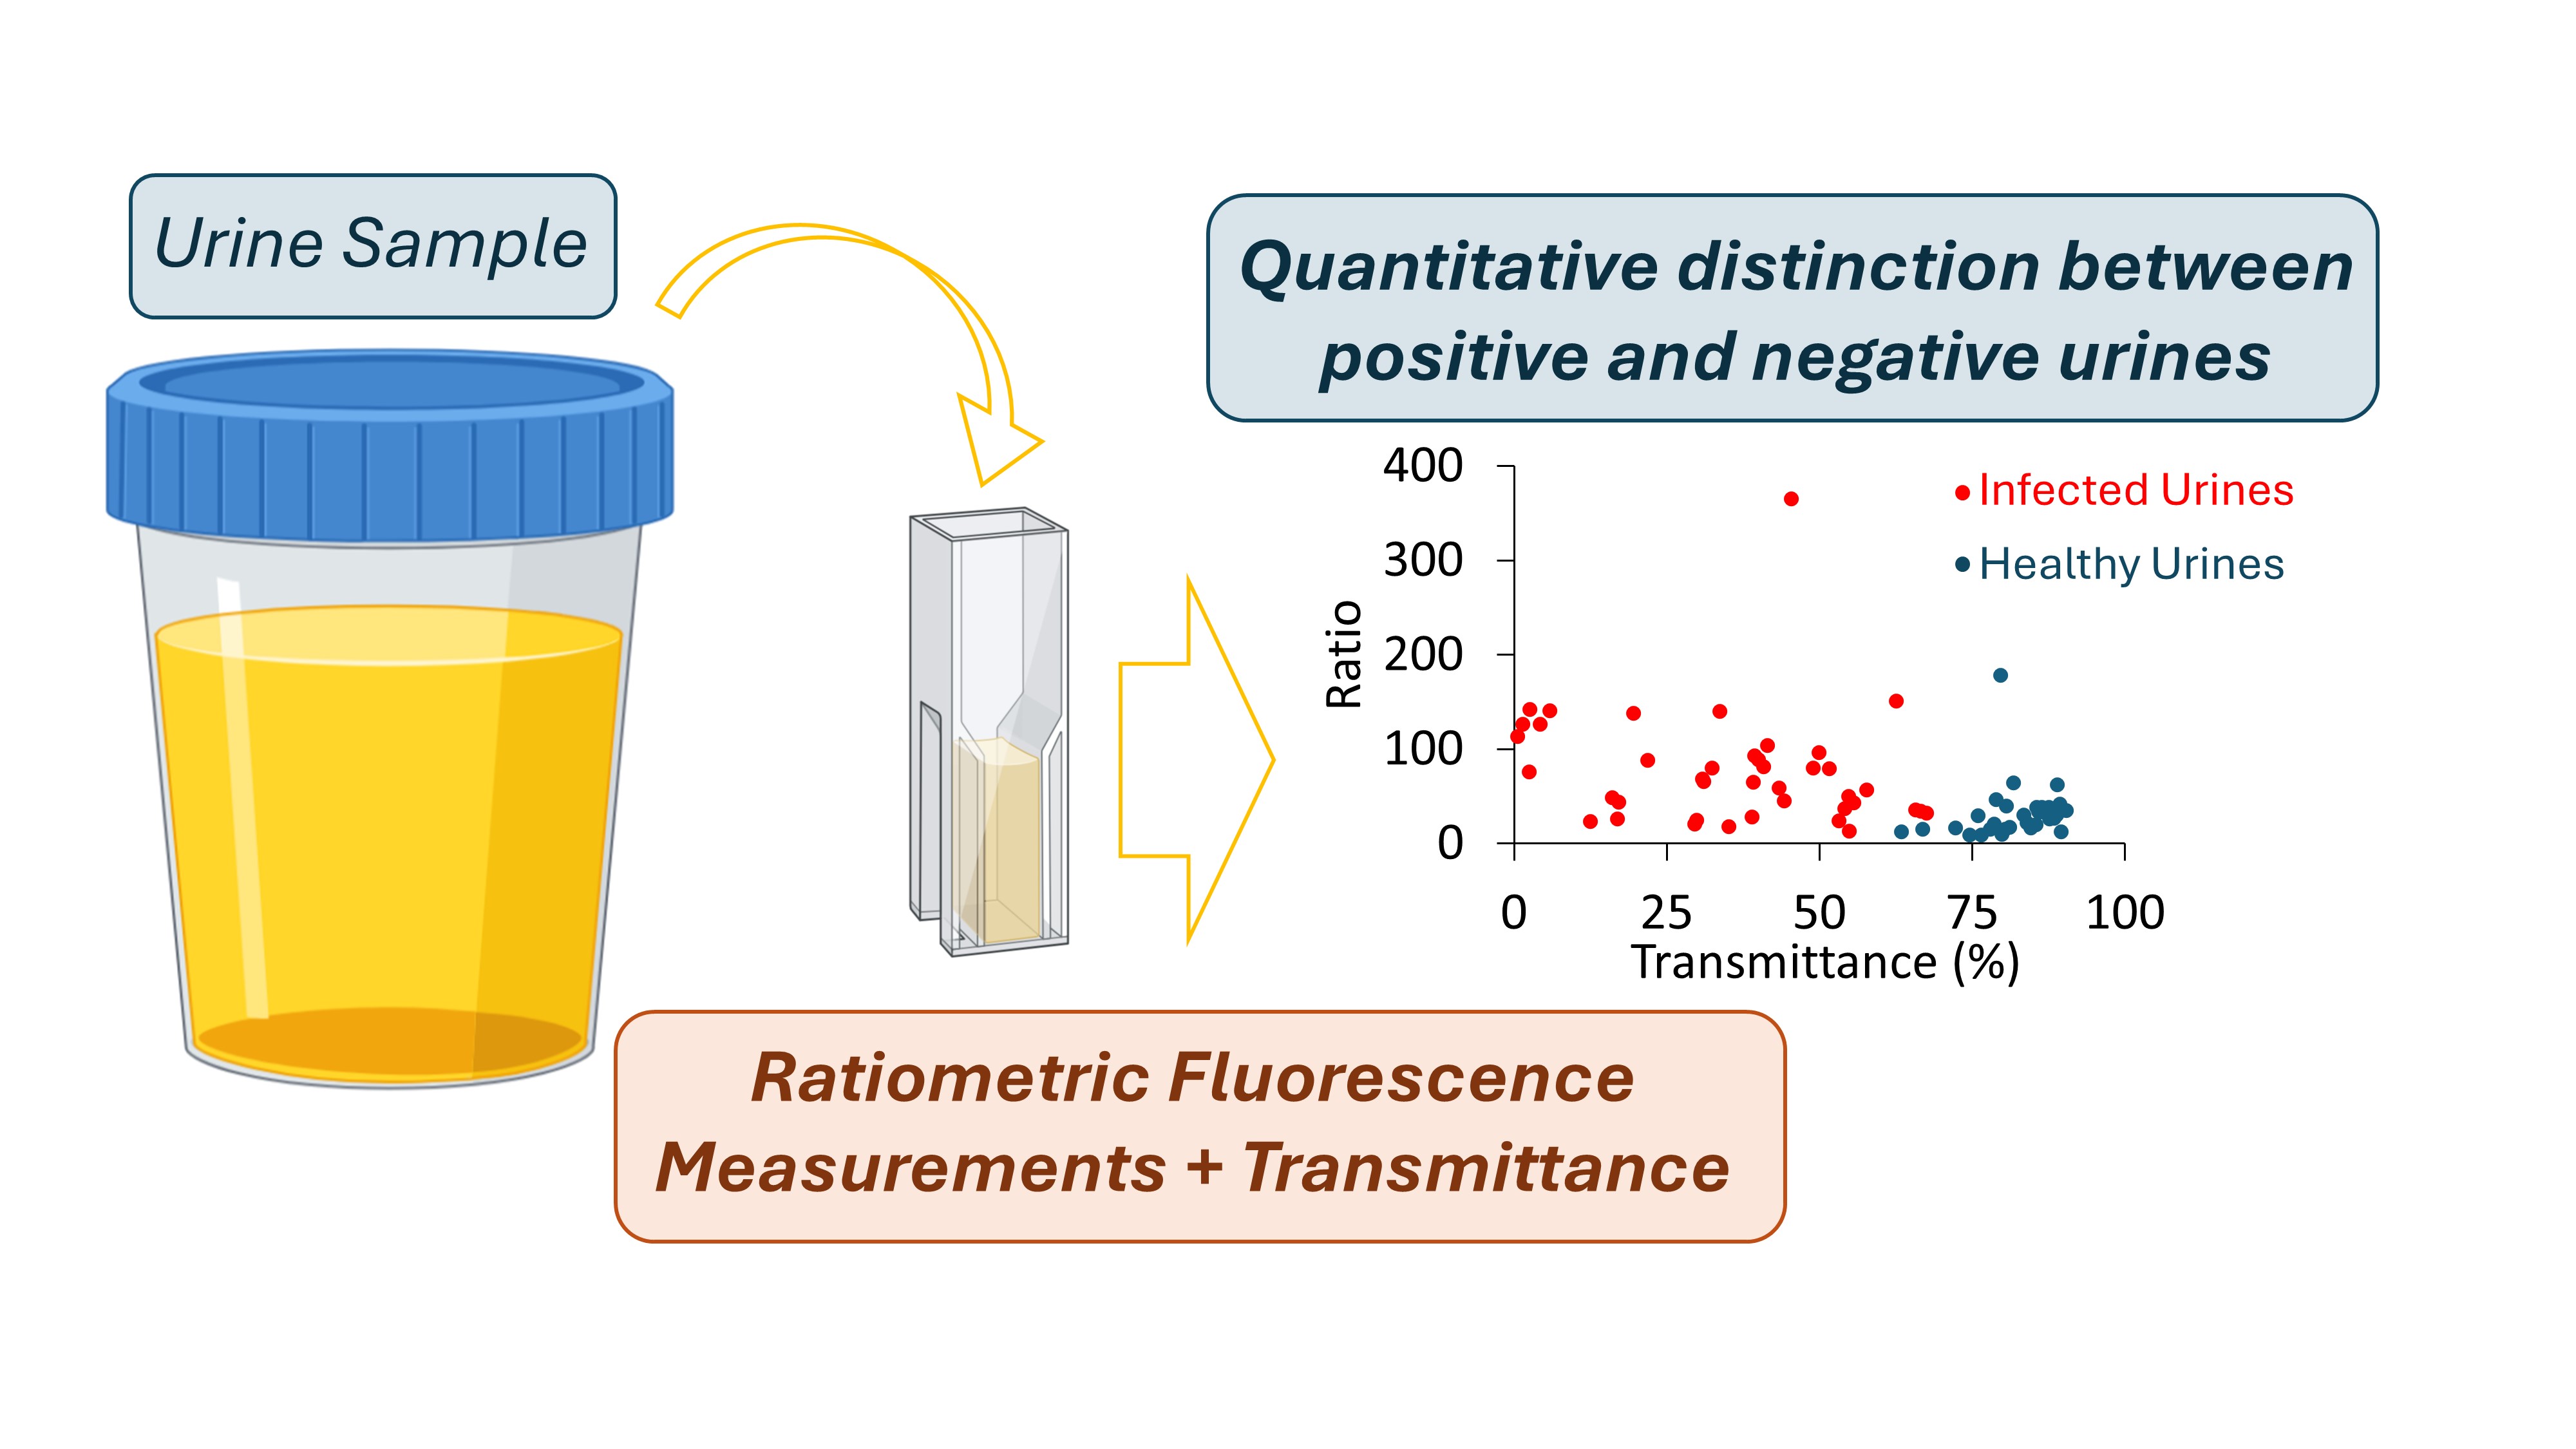
The suitability of employing a combined approach, using both R and T in the classification of urine samples is well demonstrated in the scattering plot between R and T in Figure 11, where the two populations (positive and negative) are confined to different areas. Still, with the methodology we propose it does not make sense to have simply a binary classification with just two class labels as Negative and Positive. This way, we suggest two different degrees of probability, depending on the CIs established for R and T parameters. If R and T obtained for a sample are within the CIs corresponding to the positive samples, the sample is classified as “high probability of a positive sample”; If R and T obtained for a sample are within the confidence intervals corresponding to the negative samples, the sample is classified as “high probability of a negative sample”. When only R or T fall within the established confidence interval for positive samples then the probability of a sample to be positive (or negative) is lower. It is then classified as “Probability of a positive sample”.
We have already tested our methodology and its capability to distinguish positive from negative urines. We have developed an interactive application for automatic UTI detection in MATLAB through its Design App. We tested different machine learning algorithms. We used R and T to train the models and the best performance was obtained for the k-nearest neighbors machine learning algorithm with k = 5. As for the accuracy performance, although it is not a 100% accuracy methodology, this model presented the highest value in the confusion matrix accuracy with 0.902 and an area under the curve with 0.750, which indicates a good-to-excellent capability to discriminate the two defined groups using only two parameters, R and T. The interactive application is capable to do an automated analysis of the fluorescence and transmittance spectra, calculate the value of R, select the value of T at 600 nm and return the classification of the samples (high probability of a positive sample, high probability of a negative sample or probability of a positive sample) based on the k-nearest neighbors machine learning algorithm. Given these considerations, there is a high potential in identifying healthy and unhealthy urines from the methodology developed using biological samples without any further pre-treatment. This also indicates that this methodology has the potential to be developed as a simple and rapid diagnostic tool for UTIs. Moreover, we have also designed a portable compact instrument capable of performing spectroscopic measurements both at a 90° and 180° angle between the light source and the detector that allows to make fluorescence ratiometric measurements and transmittance in the same instrument. The long-term purpose is to have our instrument used in hospitals, medical clinics or other healthcare facilities with catheterized or bedridden patients to perform the first step in urine monitoring. Both the interactive application and the instrument are going to be submitted for a patent.
4. Conclusions
The present work was motivated by the lack of commercial and medical urine monitoring solutions to help in early UTIs diagnosis, particularly in catheterised patients. Thus, our main goal was to develop a methodology capable of making the distinction between healthy urines and urines with infection requiring only minimal sample handling.
The surveys conducted with different healthcare professionals were found to be highly important for the collection of real-life perspectives and evidence supporting the need for an on-early-stage detection of CAUTIs. The survey was restricted to Portuguese healthcare professionals, which happens to be the European country with the highest prevalence rate of HCAIs (11.7%), most of them related to UTIs. Portuguese healthcare professionals report that urinary catheterisation is a common procedure performed in hospitalised patients and that this procedure is highly correlated to UTIs. This strong correlation is on the basis of the professionals’ need for an early diagnostic tool for the timely treatment of CAUTIs, independently of whether the patient was admitted due to urinary tract associated pathologies or not. In terms of pre-diagnostic methods and urine monitoring, there is no standardized methodology to answer this evident need. According to the surveys, the patient’s urine is subjectively and irregularly evaluated; it is up to the professional to decide on how and when this evaluation should be conducted. Additionally, all three urine monitoring methods under consideration in the survey (urine dipstick test, thermometer and urine observation) were deemed inefficient in detecting CAUTI, especially in asymptomatic patients.
In summary, the reply to the survey supports and reinforces the existing literature, that conveys the importance for a standardized method for urine monitoring. In this work we propose such a method that is able to efficiently distinguish positive urines for infection from negative ones. To achieve this, several spectroscopic approaches were exploited throughout this work. Some of them were discarded due to their inability to differentiate positive from negative urines. Only three parameters revealed statistical significance between the two groups of samples: M, the peak maximum of the emission spectrum with λex = 280 nm; R, the ratiometric measurement between M and the intensity value at 305 nm; and T, the transmittance of the urine sample. Since it is intended to develop a methodology whose output can be directly compared between different laboratories or healthcare facilities, only R and T parameters were considered for the method development. This is because only R and T ensure an instrument-independent measurement. To the best of our knowledge, this is the first time that a fluorescent ratiometric measurement and transmittance are employed in the context of UTI detection, especially in a combined and complementary manner. The work and instrument developed have no intention of replacing the urinalysis or urine culture, which are high-quality exams to detect UTIs, but rather to create a monitoring method that could evaluate and alert the possible existence of UTI development, particularly in catheterised patients, since they are the most affected by the lack of an early diagnosis.
Supplementary Materials
The following supporting information can be downloaded at the website of this paper posted on Preprints.org, Figure S1: Synchronous spectra with Δλ = 30 nm, 50 nm, 70 nm and 90 nm of positive (red) and negative (blue) samples; Figure S2: Intrinsic fluorescence of urine samples.; Figure S3: Intrinsic fluorescence emission spectra of positive (red) and negative (blue) urine samples when excited at a) 290 nm and b) 280 nm.
Author Contributions
Conceptualization, A.M., N.M., J.C. and J.M.; Methodology, J.M.; Validation, J.C., N.M. and J.M.; Formal Analysis, A.M. and J.M.; Investigation, A.M.; Resources, J.M.; Writing – Original Draft Preparation, J.M.; Writing – Review & Editing, N.M., J.C. and J.M.; Visualization, A.M., N.M., J.C., J.M.; Supervision, N.M., J.C. and J.M.; Project Administration, J.M.; Funding Acquisition, J.M.
Funding
This work was supported by Fundação para a Ciência e a Tecnologia (FCT), Portugal through CEECIND/03247/2018 to JTM, EXPL/BIA-BFS/1034/2021 (https://doi.org/10.54499/EXPL/BIA-BFS/1034/2021), Centro de Química Estrutural is a Research Unit funded by FCT through projects UIDB/00100/2020 (https://doi.org/10.54499/UIDB/00100/2020) and UIDP/00100/2020 (https://doi.org/10.54499/UIDP/00100/2020). Institute of Molecular Sciences is an Associate Laboratory funded by FCT through project LA/P/0056/2020 (https://doi.org/10.54499/LA/P/0056/2020). Instituto de Biofísica e Engenharia Biomédica is a Research Unit funded by FCT through project UIDB/00645/2020 (https://doi.org/10.54499/UIDB/00645/2020).
Data Availability Statement
The data presented in this study are available on request from the corresponding author.
Acknowledgments
The Authors are thankful to Cintramédica medical clinic, in particular to Dra. Ines Stilwell, Dra. Marta Rúbio and Dra. Sandra Nóbrega, for providing the urine samples used in this work.
Conflicts of Interest
The authors declare no conflict of interest.
References
- Organization, W. H. Report on the Burden of Endemic Health Care-Associated Infection Worldwide; 2011.
- Nicolle, L. E. , Urinary Catheter-Associated Infections. Infectious Disease Clinics of North America 2012, 26, (1), 13–27. [Google Scholar] [CrossRef]
- Santos, M.; Mariz, M.; Tiago, I.; Martins, J.; Alarico, S.; Ferreira, P. , A review on urinary tract infections diagnostic methods: Laboratory-based and point-of-care approaches. J. Pharm. Biomed. Anal. 2022, 219, 114889. [Google Scholar] [CrossRef] [PubMed]
- Letica-Kriegel, A. S.; Salmasian, H.; Vawdrey, D. K.; Youngerman, B. E.; Green, R. A.; Furuya, E. Y.; Calfee, D. P.; Perotte, R. , Identifying the risk factors for catheter-associated urinary tract infections: a large cross-sectional study of six hospitals. BMJ open 2019, 9, (2), e022137. [Google Scholar] [CrossRef]
- Maki, D. G.; Tambyah, P. A. , Engineering out the risk for infection with urinary catheters. Emerging infectious diseases 2001, 7, (2), 342–7. [Google Scholar] [CrossRef]
- Lo, E.; Nicolle, L. E.; Coffin, S. E.; Gould, C.; Maragakis, L. L.; Meddings, J.; Pegues, D. A.; Pettis, A. M.; Saint, S.; Yokoe, D. S. , Strategies to prevent catheter-associated urinary tract infections in acute care hospitals: 2014 update. Infection control and hospital epidemiology 2014, 35, (5), 464–79. [Google Scholar] [CrossRef]
- Holá, V.; Ruzicka, F.; Horka, M. , Microbial diversity in biofilm infections of the urinary tract with the use of sonication techniques. FEMS immunology and medical microbiology 2010, 59, (3), 525–8. [Google Scholar] [CrossRef]
- Graham, J. C.; Galloway, A. , ACP Best Practice No 167: the laboratory diagnosis of urinary tract infection. Journal of clinical pathology 2001, 54, (12), 911–9. [Google Scholar] [CrossRef]
- Rosenthal, V. D.; Yin, R.; Lu, Y.; Rodrigues, C.; Myatra, S. N.; Kharbanda, M.; Valderrama-Beltran, S. L.; Mehta, Y.; Daboor, M. A.; Todi, S. K.; Aguirre-Avalos, G.; Guclu, E.; Gan, C. S.; Jiménez-Alvarez, L. F.; Chawla, R.; Hlinkova, S.; Arjun, R.; Agha, H. M.; Zuniga-Chavarria, M. A.; Davaadagva, N.; Basri, M. N. M.; Gomez-Nieto, K.; Aguilar-de-Moros, D.; Tai, C.-W.; Sassoe-Gonzalez, A.; Aguilar-Moreno, L. A.; Sandhu, K.; Janc, J.; Aleman-Bocanegra, M. C.; Yildizdas, D.; Cano-Medina, Y. A.; Villegas-Mota, M. I.; Omar, A. A.; Duszynska, W.; BelKebir, S.; El-Kholy, A. A.; Alkhawaja, S. A.; Florin, G. H.; Medeiros, E. A.; Tao, L.; Memish, Z. A.; Jin, Z. , The impact of healthcare-associated infections on mortality in ICU: A prospective study in Asia, Africa, Eastern Europe, Latin America, and the Middle East. American Journal of Infection Control 2023, 51, (6), 675–682. [Google Scholar] [CrossRef]
- Eliakim-Raz, N.; Babitch, T.; Shaw, E.; Addy, I.; Wiegand, I.; Vank, C.; Torre-Vallejo, L.; Joan-Miquel, V.; Steve, M.; Grier, S.; Stoddart, M.; Nienke, C.; Leo, v. d. H.; Vuong, C.; MacGowan, A.; Carratalà, J.; Leibovici, L.; Pujol, M.; Group, R. S. , Risk Factors for Treatment Failure and Mortality Among Hospitalized Patients With Complicated Urinary Tract Infection: A Multicenter Retrospective Cohort Study (RESCUING Study Group). Clinical Infectious Diseases 2018, 68, (1), 29–36. [Google Scholar] [CrossRef]
- Tiwari, M. M.; Charlton, M. E.; Anderson, J. R.; Hermsen, E. D.; Rupp, M. E. , Inappropriate use of urinary catheters: A prospective observational study. American Journal of Infection Control 2012, 40, (1), 51–54. [Google Scholar] [CrossRef]
- Baig, A. , Biochemical Composition of Normal Urine. Nature Precedings 2011.
- Sarigul, N.; Korkmaz, F.; Kurultak, İ. , A New Artificial Urine Protocol to Better Imitate Human Urine. Sci Rep 2019, 9, (1), 20159. [Google Scholar] [CrossRef]
- Dijkstra, S.; Mulders, P. F.; Schalken, J. A. , Clinical use of novel urine and blood based prostate cancer biomarkers: a review. Clinical biochemistry 2014, 47, (10–11), 889-96. [Google Scholar] [CrossRef] [PubMed]
- Ng, K.; Stenzl, A.; Sharma, A.; Vasdev, N. , Urinary biomarkers in bladder cancer: A review of the current landscape and future directions. Urologic oncology 2021, 39, (1), 41–51. [Google Scholar] [CrossRef]
- Coca, S. G.; Yalavarthy, R.; Concato, J.; Parikh, C. R. , Biomarkers for the diagnosis and risk stratification of acute kidney injury: a systematic review. Kidney international 2008, 73, (9), 1008–16. [Google Scholar] [CrossRef]
- Davenport, M.; Mach, K. E.; Shortliffe, L. M. D.; Banaei, N.; Wang, T. H.; Liao, J. C. , New and developing diagnostic technologies for urinary tract infections. Nature reviews. Urology 2017, 14, (5), 296–310. [Google Scholar] [CrossRef]
- Oyaert, M.; Delanghe, J. , Progress in Automated Urinalysis. Annals of laboratory medicine 2019, 39, (1), 15–22. [Google Scholar] [CrossRef]
- Aitekenov, S.; Gaipov, A.; Bukasov, R. , Review: Detection and quantification of proteins in human urine. Talanta 2021, 223, (Pt 1), 121718. [Google Scholar] [CrossRef]
- Chambliss, A. B.; Van, T. T. , Revisiting approaches to and considerations for urinalysis and urine culture reflexive testing. Critical reviews in clinical laboratory sciences 2022, 59, (2), 112–124. [Google Scholar] [CrossRef]
- European urinalysis guidelines. Scandinavian journal of clinical and laboratory investigation. Supplementum 2000, 231, 1–86.
- Eigbefoh, J. O.; Isabu, P.; Okpere, E.; Abebe, J. , The diagnostic accuracy of the rapid dipstick test to predict asymptomatic urinary tract infection of pregnancy. Journal of obstetrics and gynaecology : the journal of the Institute of Obstetrics and Gynaecology 2008, 28, (5), 490–5. [Google Scholar] [CrossRef]
- Wilson, M. L.; Gaido, L. , Laboratory diagnosis of urinary tract infections in adult patients. Clinical infectious diseases : an official publication of the Infectious Diseases Society of America 2004, 38, (8), 1150–8. [Google Scholar] [CrossRef]
- Shaw, S. T., Jr.; Poon, S. Y.; Wong, E. T. , 'Routine urinalysis'. Is the dipstick enough? Jama 1985, 253, (11), 1596–600. [Google Scholar] [CrossRef]
- Laine, P.; Toivonen, E.; Eklund, K.; Hohenthal, U.; Siren, S.; Mäki, T. , Rapid dipstick urinalysis in the internal medicine clinic: what is missed? Journal of internal medicine 1997, 242, (3), 271–3. [Google Scholar] [CrossRef]
- Devillé, W. L.; Yzermans, J. C.; van Duijn, N. P.; Bezemer, P. D.; van der Windt, D. A.; Bouter, L. M. , The urine dipstick test useful to rule out infections. A meta-analysis of the accuracy. BMC urology 2004, 4, 4. [Google Scholar]
- Anwer, A. G.; Sandeep, P. M.; Goldys, E. M.; Vemulpad, S. , Distinctive autofluorescence of urine samples from individuals with bacteriuria compared with normals. Clinica Chimica Acta 2009, 401,, (1), 73–75. [Google Scholar] [CrossRef]
- Jahn, P.; Beutner, K.; Langer, G. , Types of indwelling urinary catheters for long-term bladder drainage in adults. The Cochrane database of systematic reviews 2012, 10, Cd004997. [Google Scholar] [CrossRef] [PubMed]
Figure 1.
Results of questions 2 (a), 3 (b) and 4 (c) of the survey. The plot in (a) shows how many health professionals had already worked with catheterised patients. Questions 3 (b) and 4 (b) were targeted to the healthcare professionals that answered ”yes” to question 2 (a). The plot in (b) reports the results correlating UTIs due to the catheter remaining in the hospitalised patient and (c) presents how often it occurs.
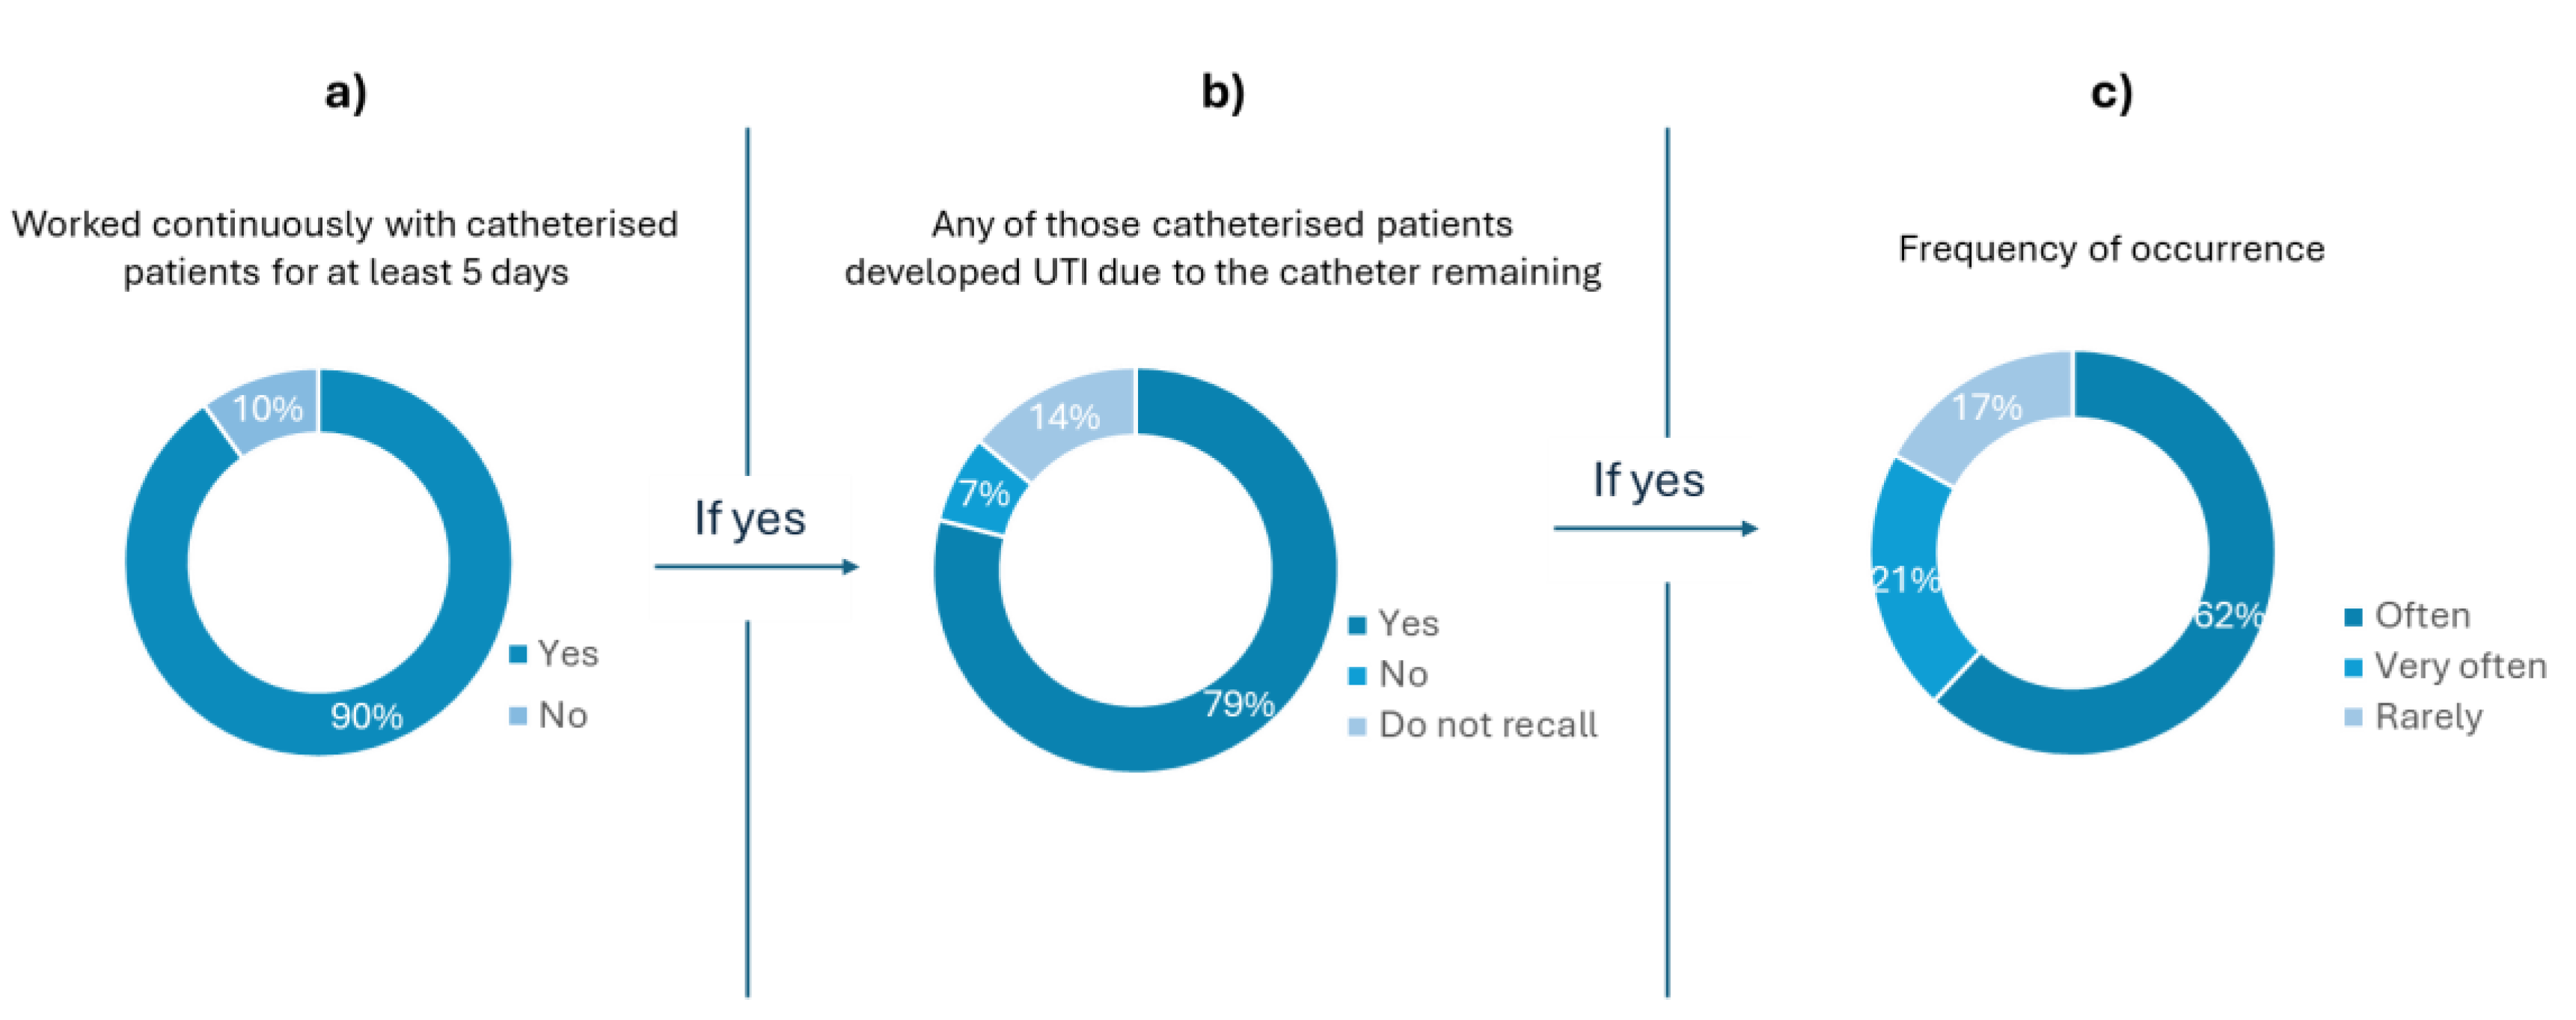
Figure 2.
Priority level of how UTIs in catheterised patients are handled in Portuguese hospitals regarding the early diagnosis and proper treatment (question 5); 67% of the health professionals considered of high level of priority, 30% and 3 % considered a medium and low level of priority, respectively.
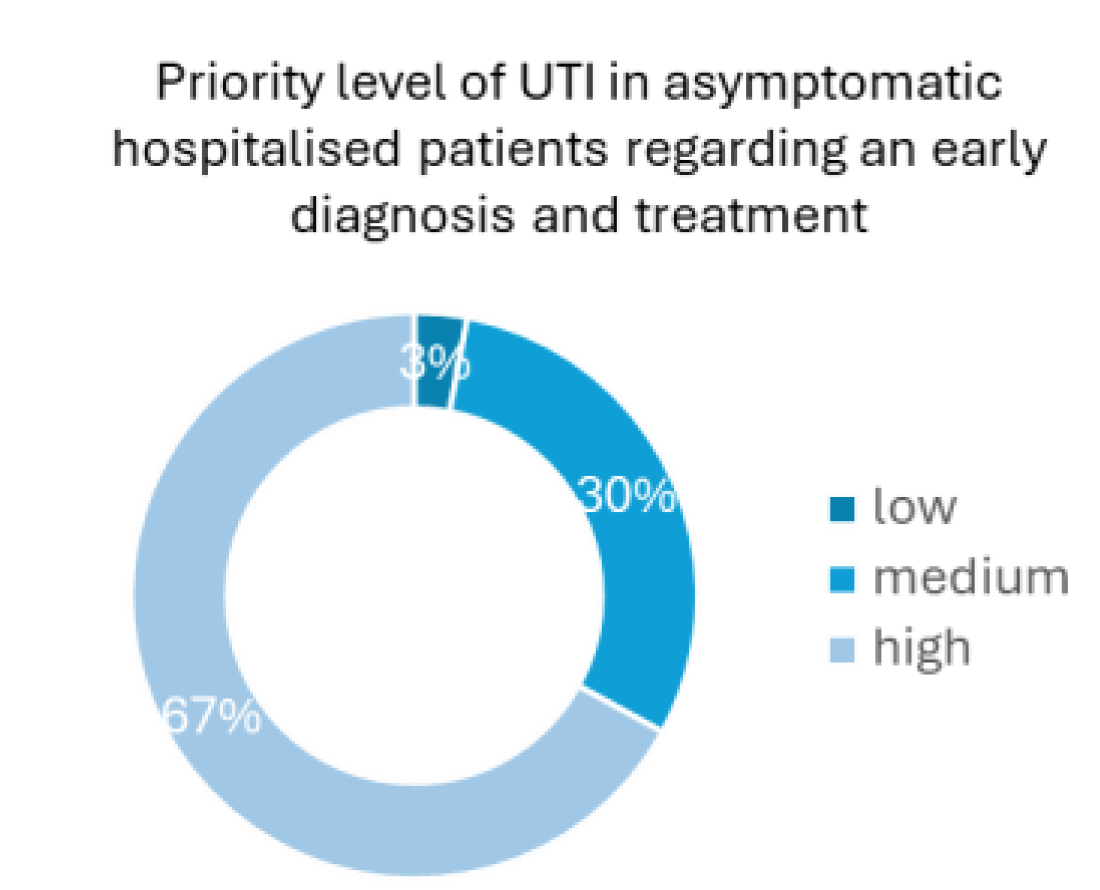
Figure 3.
In a) the answer to question 6 – which methods are used to detect signs of urinary tract infection in catheterised patients (dipstick urine test, urine colour observation, thermometer) – is shown; in b) the answer to question 7 of the survey – during a regular work shift, how often each of these methods is used on catheterised patients who do not present any symptoms of urinary tract infection – is depicted.
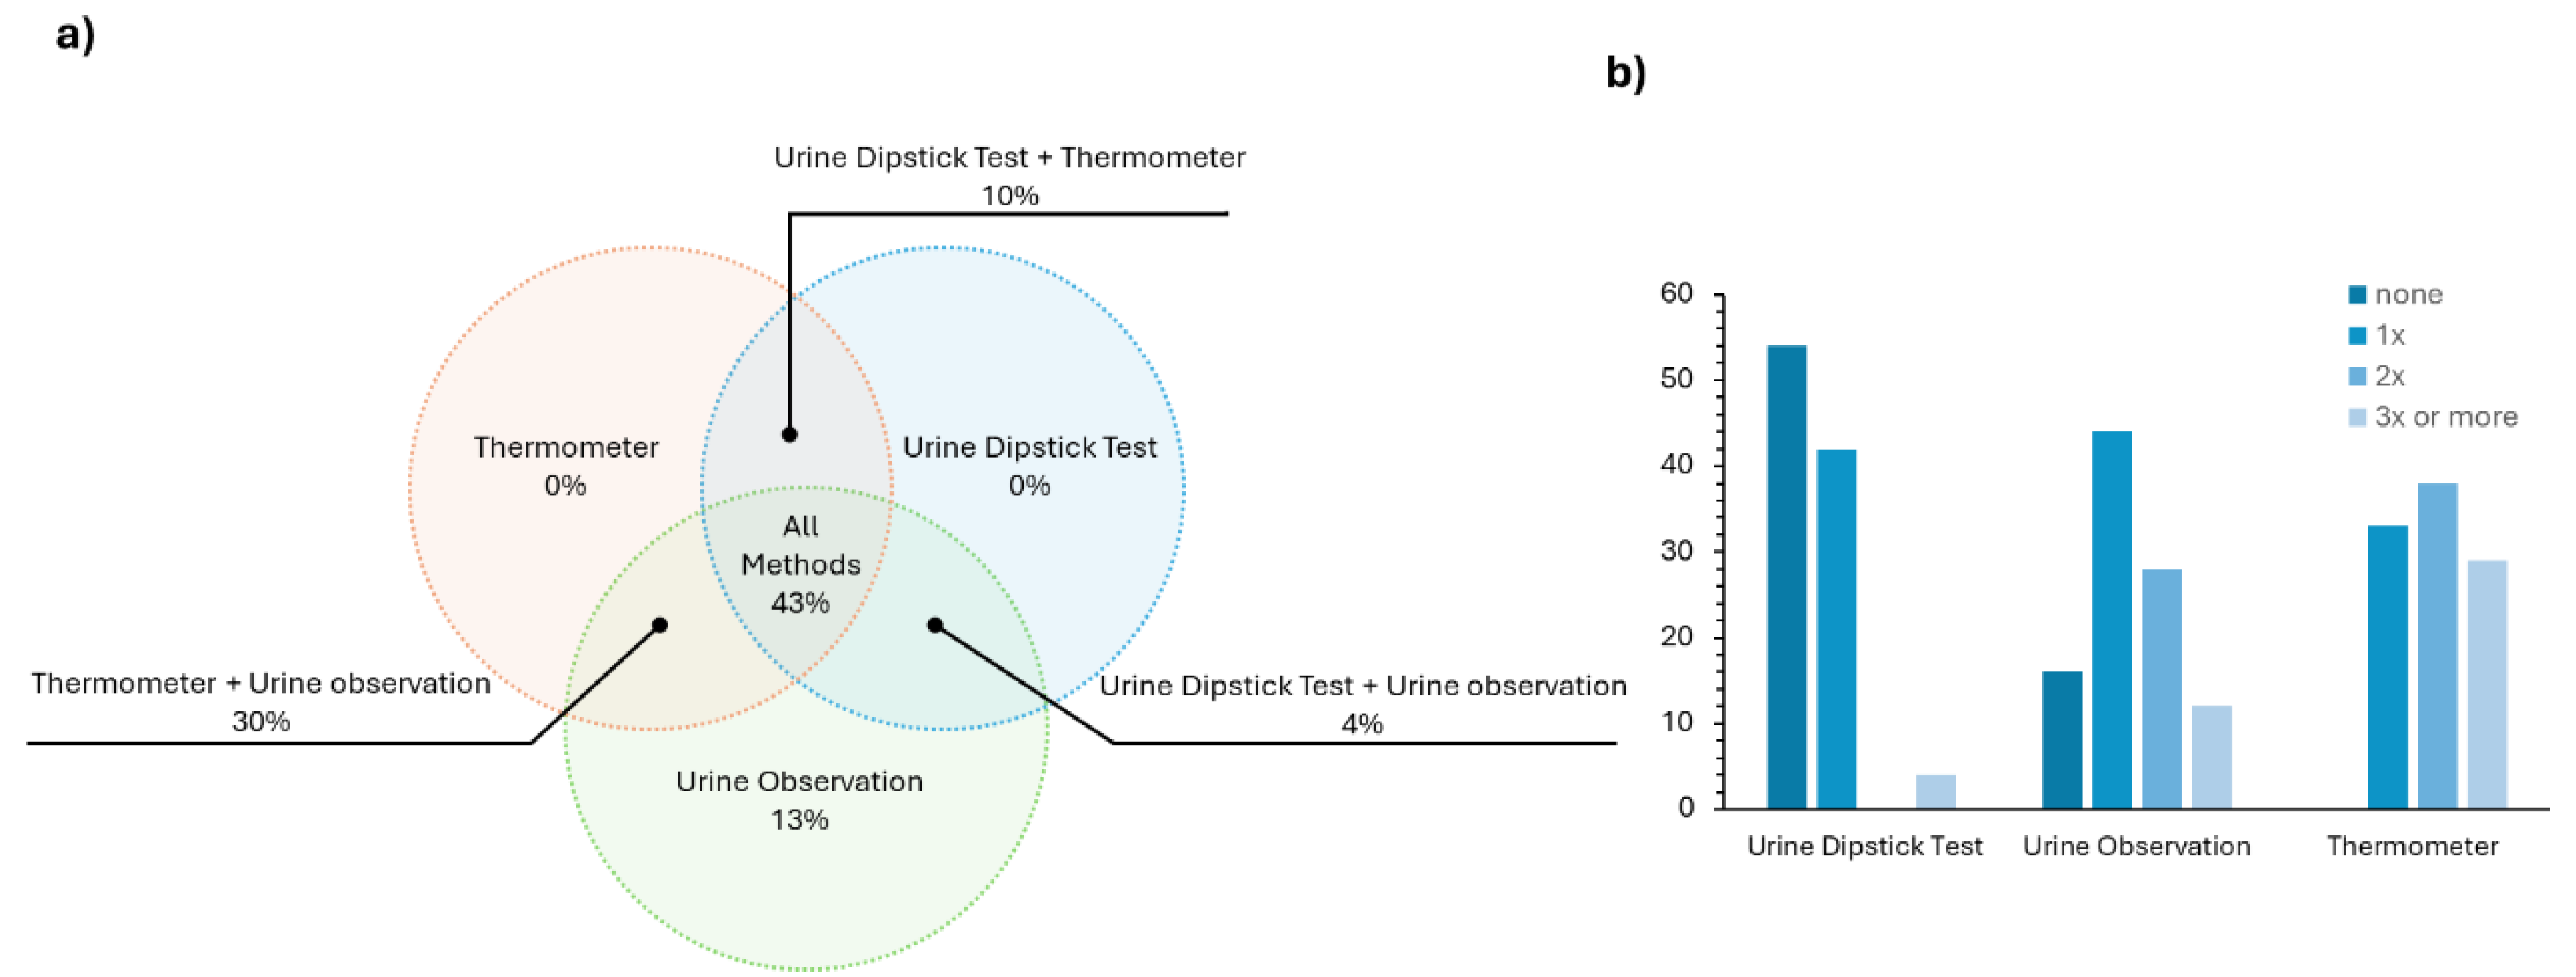
Figure 4.
Answer to question 8, which regards the selection of the worst feature. For each method, urine dipstick test, thermometer and urine observation the worst utilization characteristic was chosen among “Effectiveness”, “Hygienic”, diagnostic “Speed”, “User-Friendly” and ‘’Re-use”. Each interviewee could attribute more than one to each method.
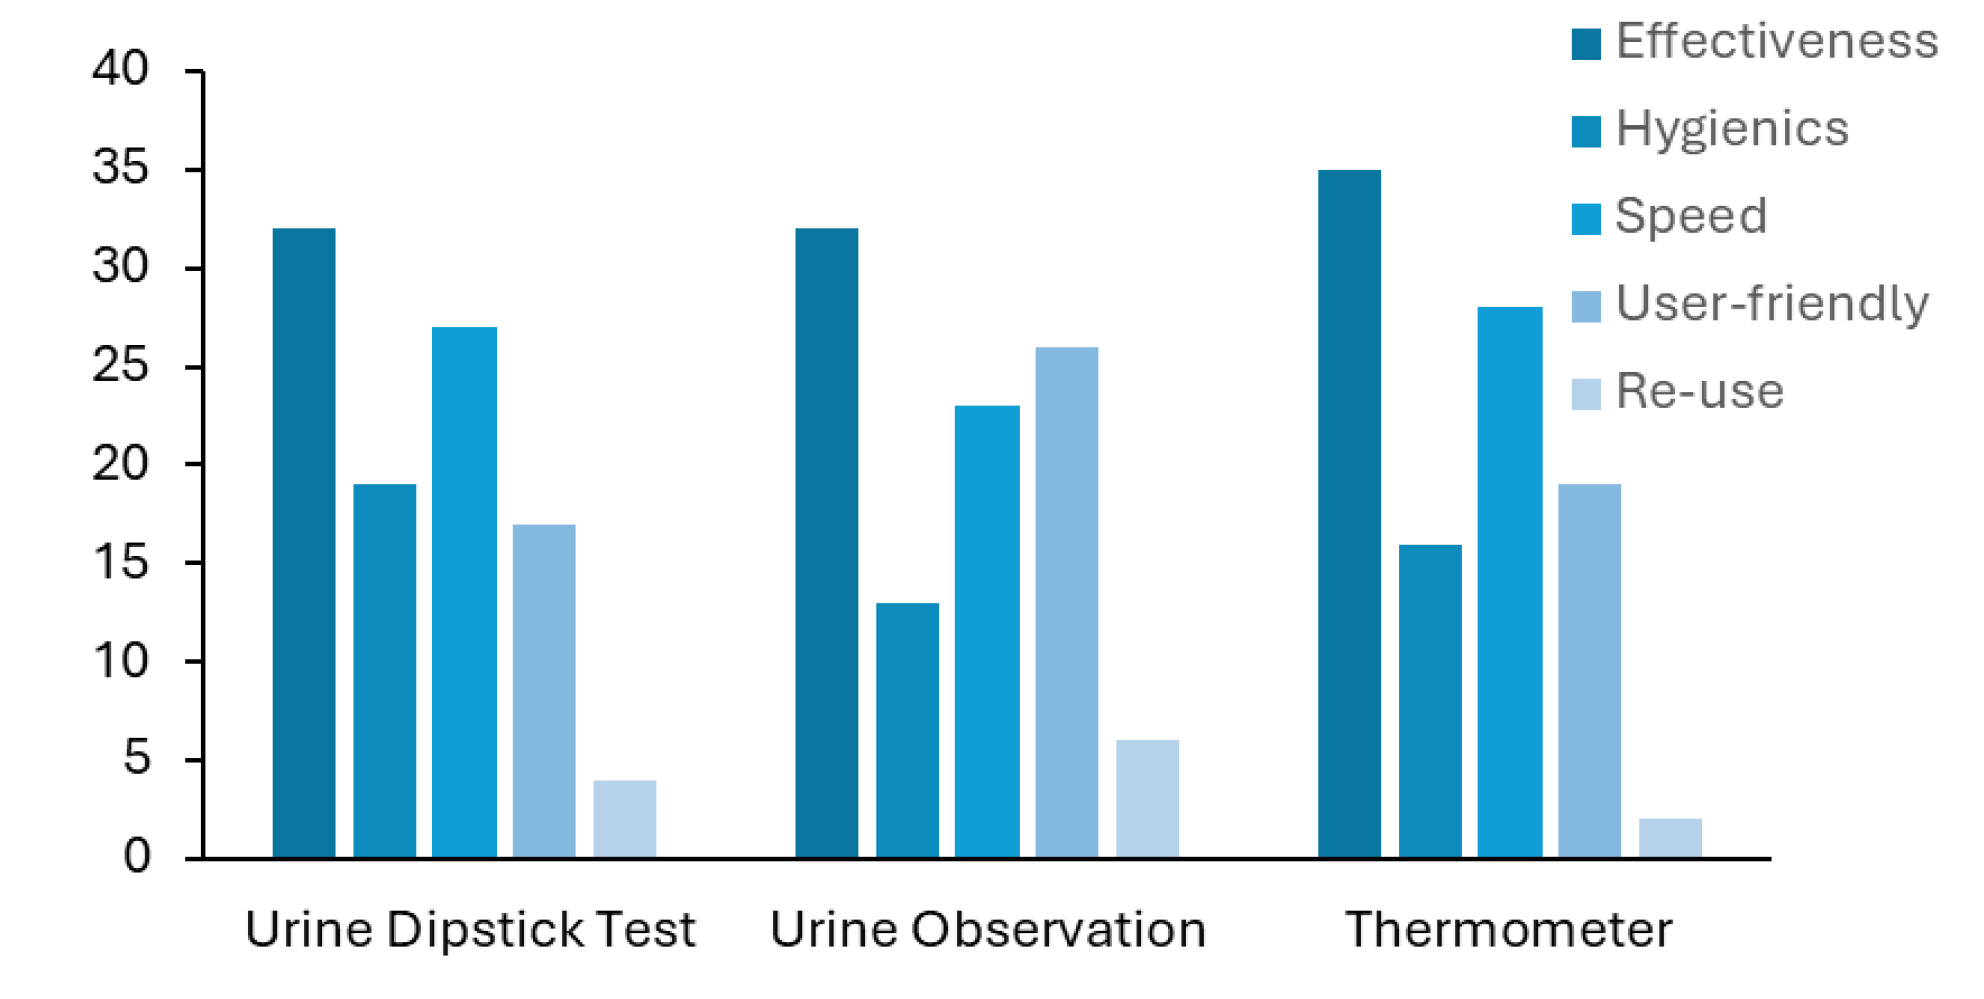
Figure 5.
Utility level of a new methodology for early UTI detection or just urine monitoring.
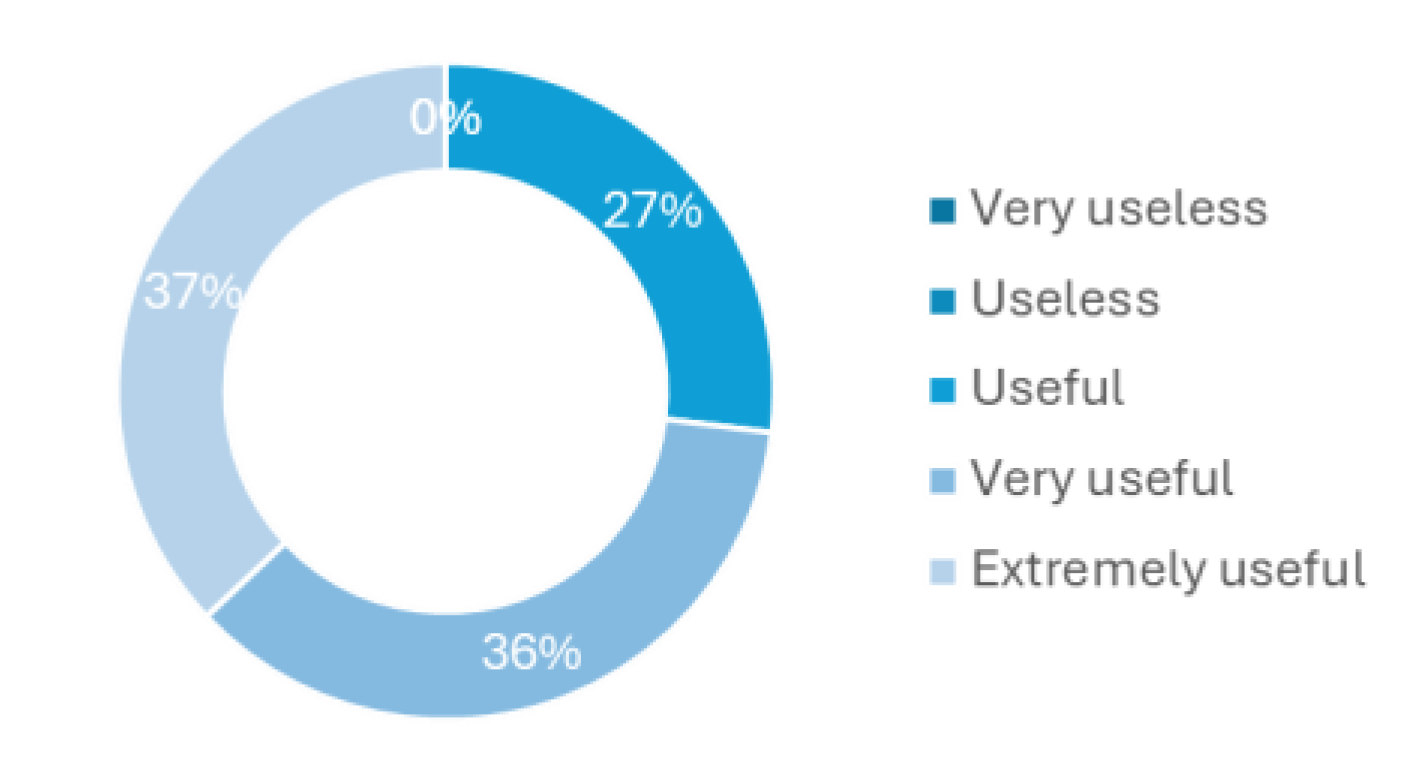
Figure 6.
Intrinsic fluorescence of urine samples. a) Average excitation spectra of autofluorescence of positive (red) and negative (blue) urine samples with emission wavelength set to 410 nm and in b) the range between 250 nm to 300 nm is highlighted. The slits were set to 7 nm and spectra were acquired at 24 ± 1 °C.
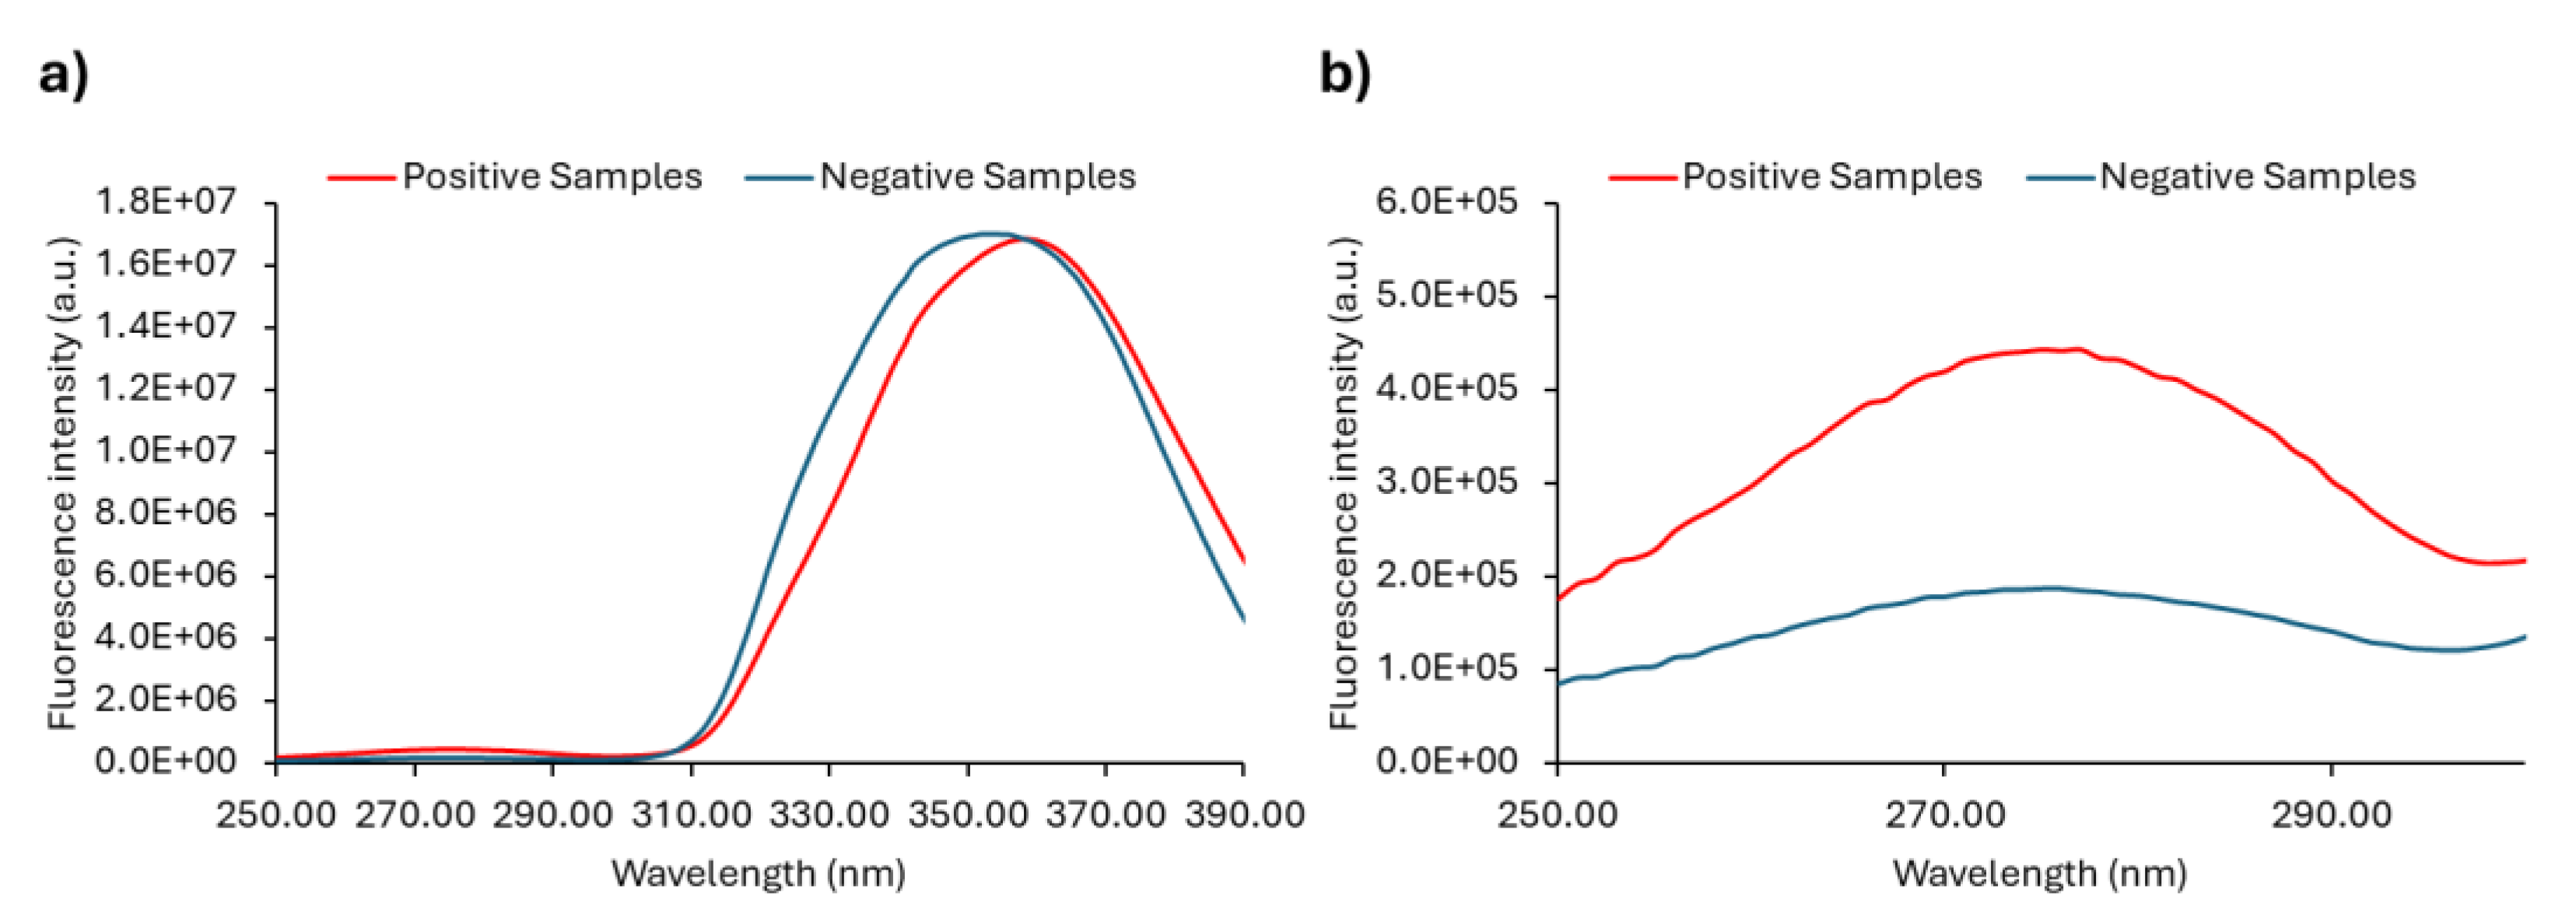
Figure 7.
Average fluorescence emission spectra of positive (red) and negative (blue) urine samples when excited at a) 290 nm and b) 280 nm. The slits set for both emission spectra were 7 nm and the data were acquired at 24 ± 1 °C.
Figure 7.
Average fluorescence emission spectra of positive (red) and negative (blue) urine samples when excited at a) 290 nm and b) 280 nm. The slits set for both emission spectra were 7 nm and the data were acquired at 24 ± 1 °C.
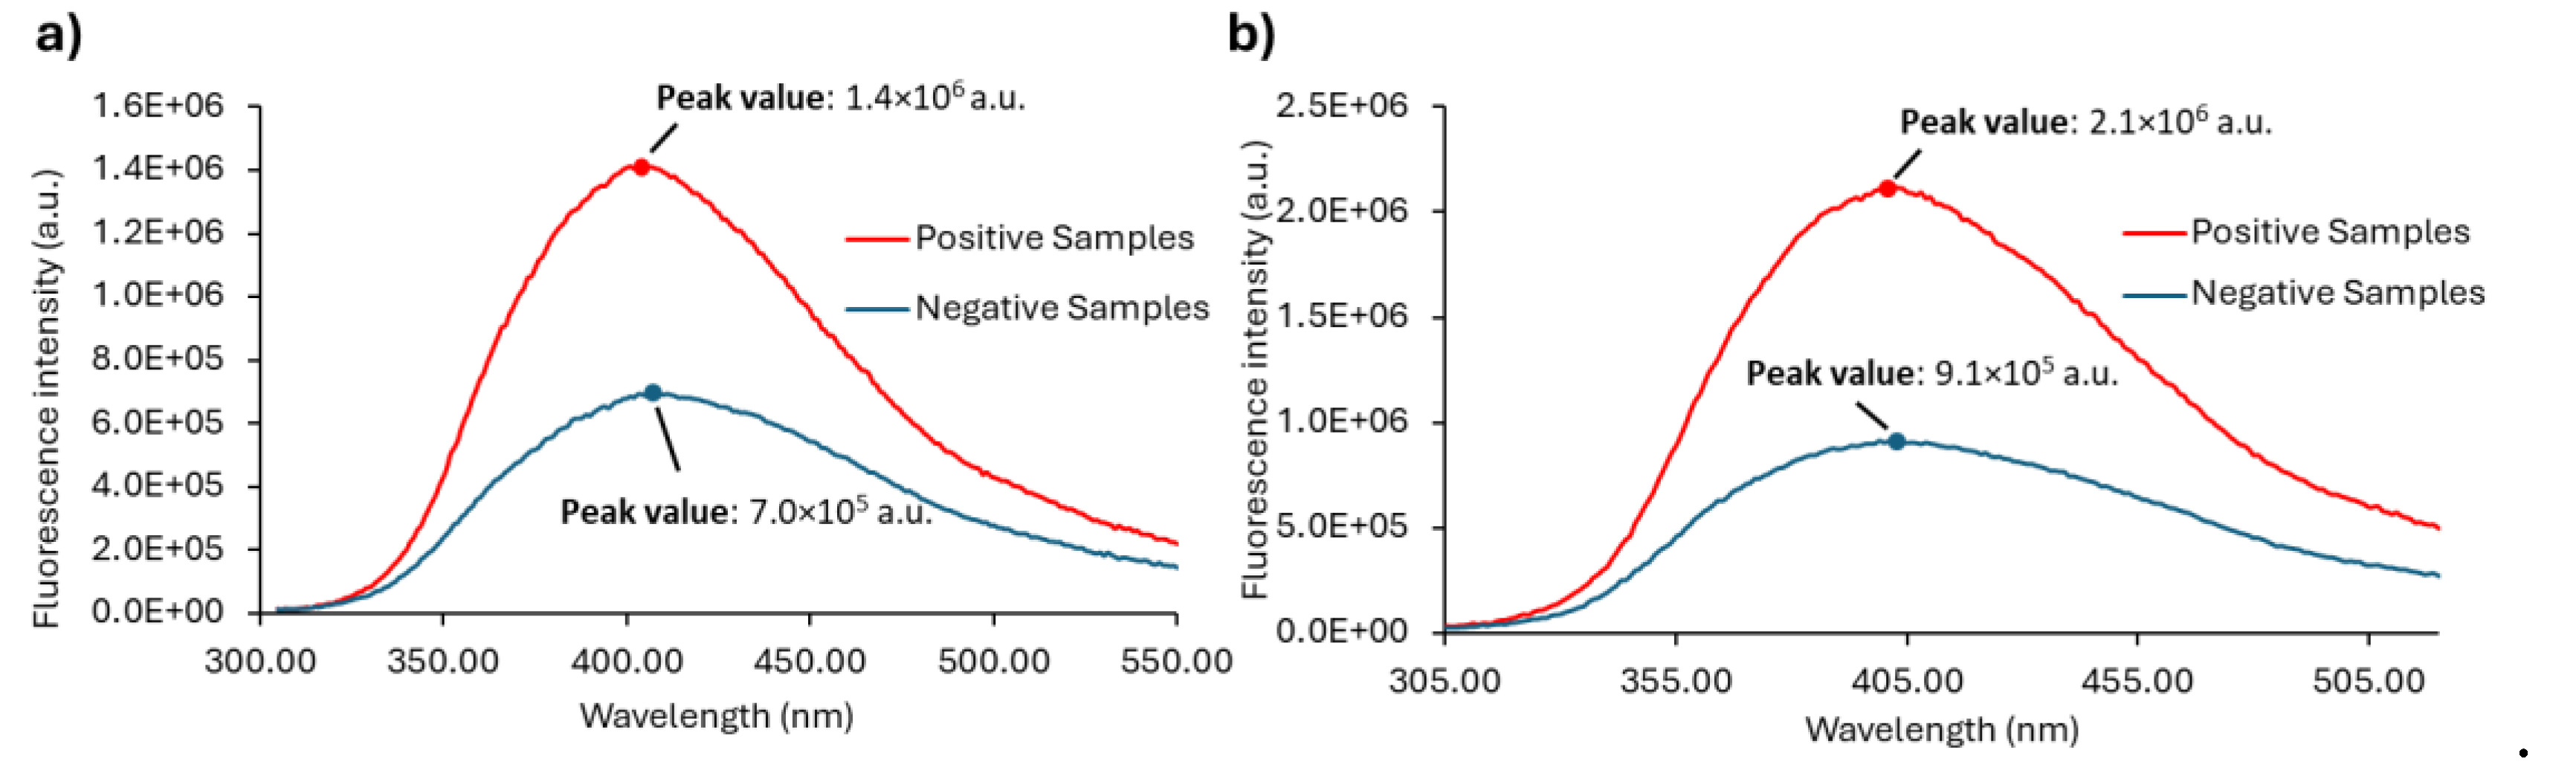
Figure 8.
Box plots of a) the fluorescence intensity at 305 nm (V), b) the peak maximum (M) and c) the Ratio (R) for both positive (red) and negative (blue) samples; the respective mean and standard deviation (SD) is shown. The parameters were extracted from the emission spectra with excitation wavelength set to 280 nm.
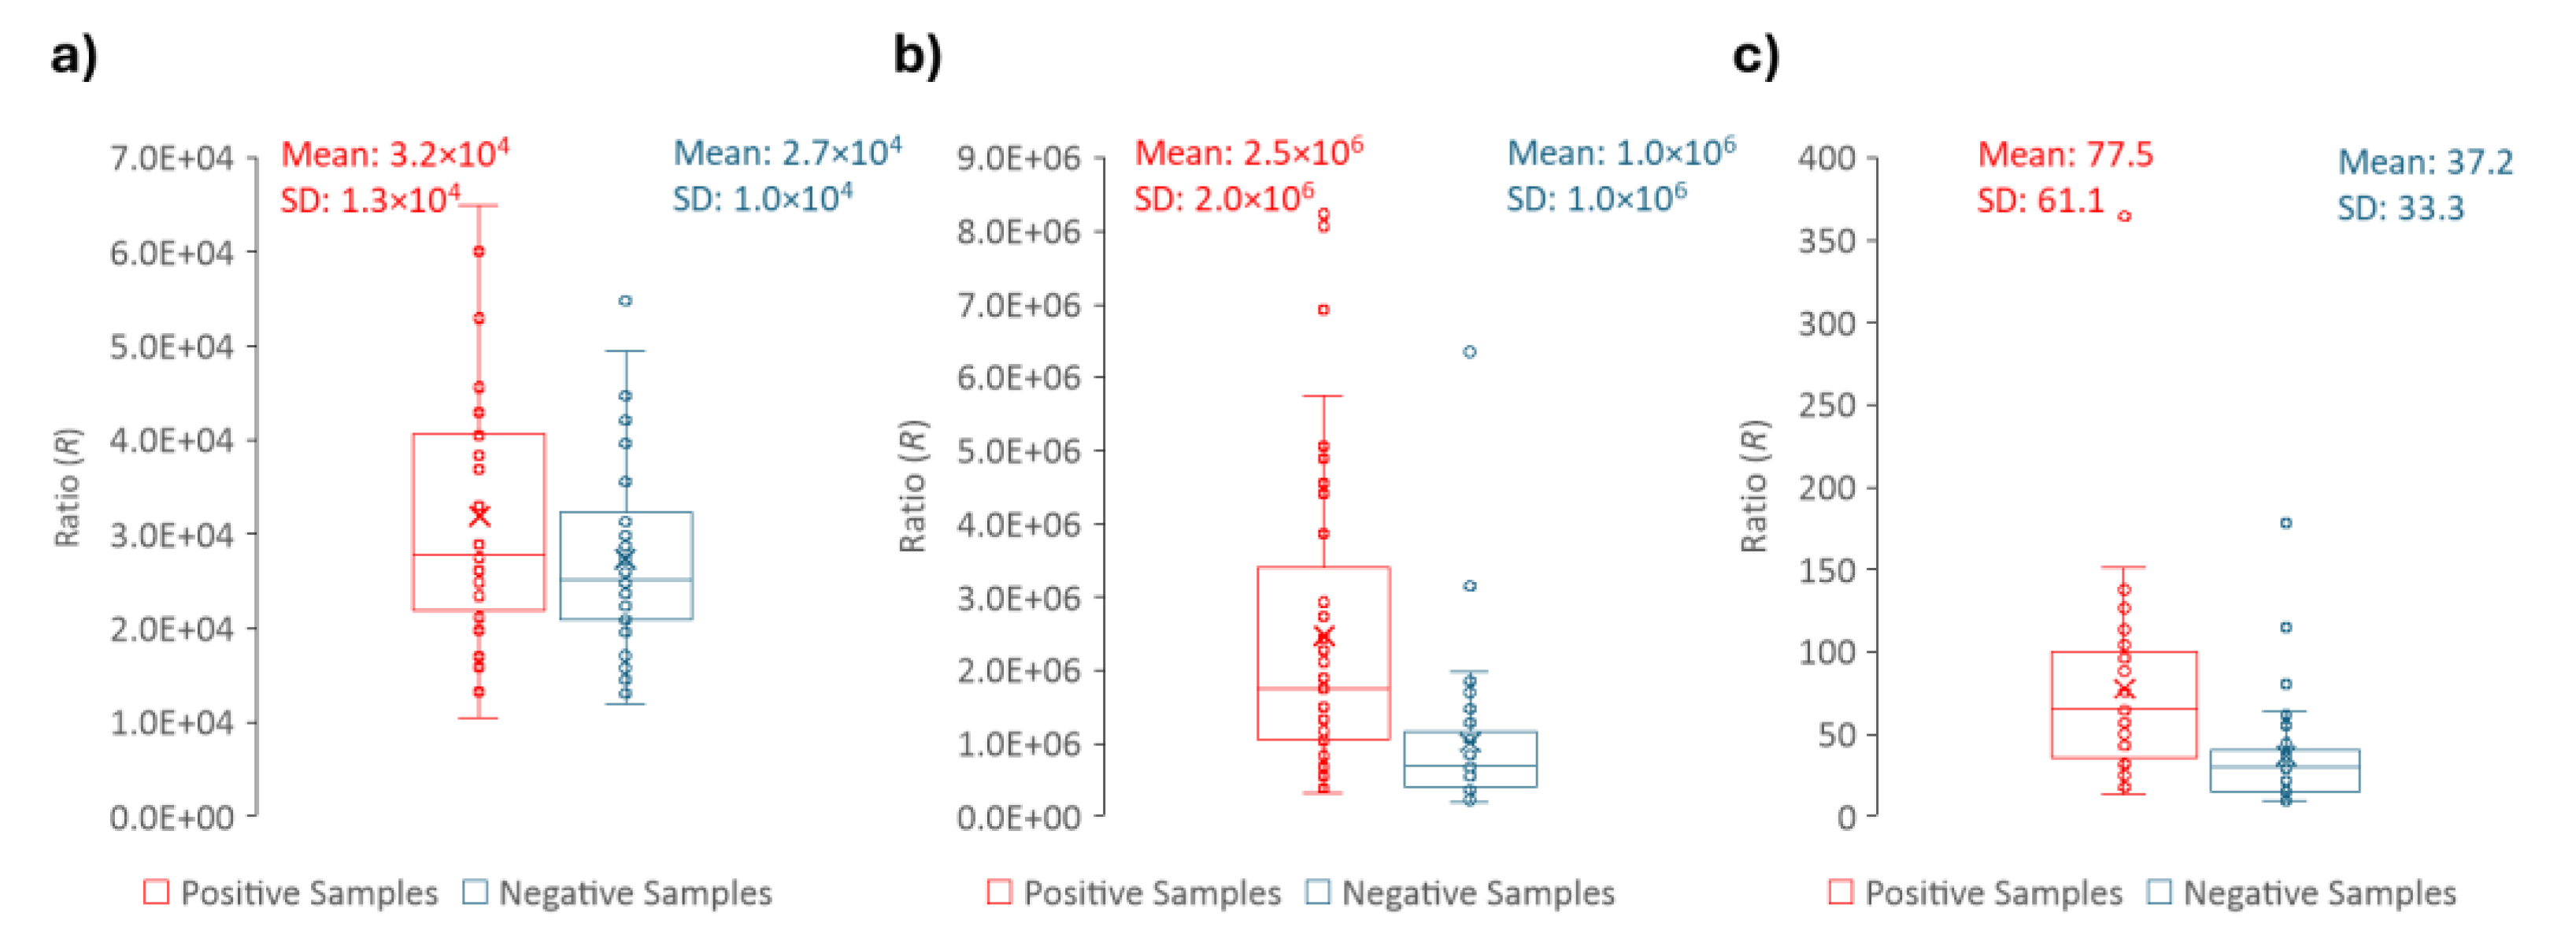
Figure 9.
Box plots of the light scattering data for positive (red) and negative (blue) urine samples with the respective mean and standard deviation (SD). Data were acquired at 24 ± 1 °C, with λex = λem = 600 nm and slits set to 1.4 nm.
Figure 9.
Box plots of the light scattering data for positive (red) and negative (blue) urine samples with the respective mean and standard deviation (SD). Data were acquired at 24 ± 1 °C, with λex = λem = 600 nm and slits set to 1.4 nm.
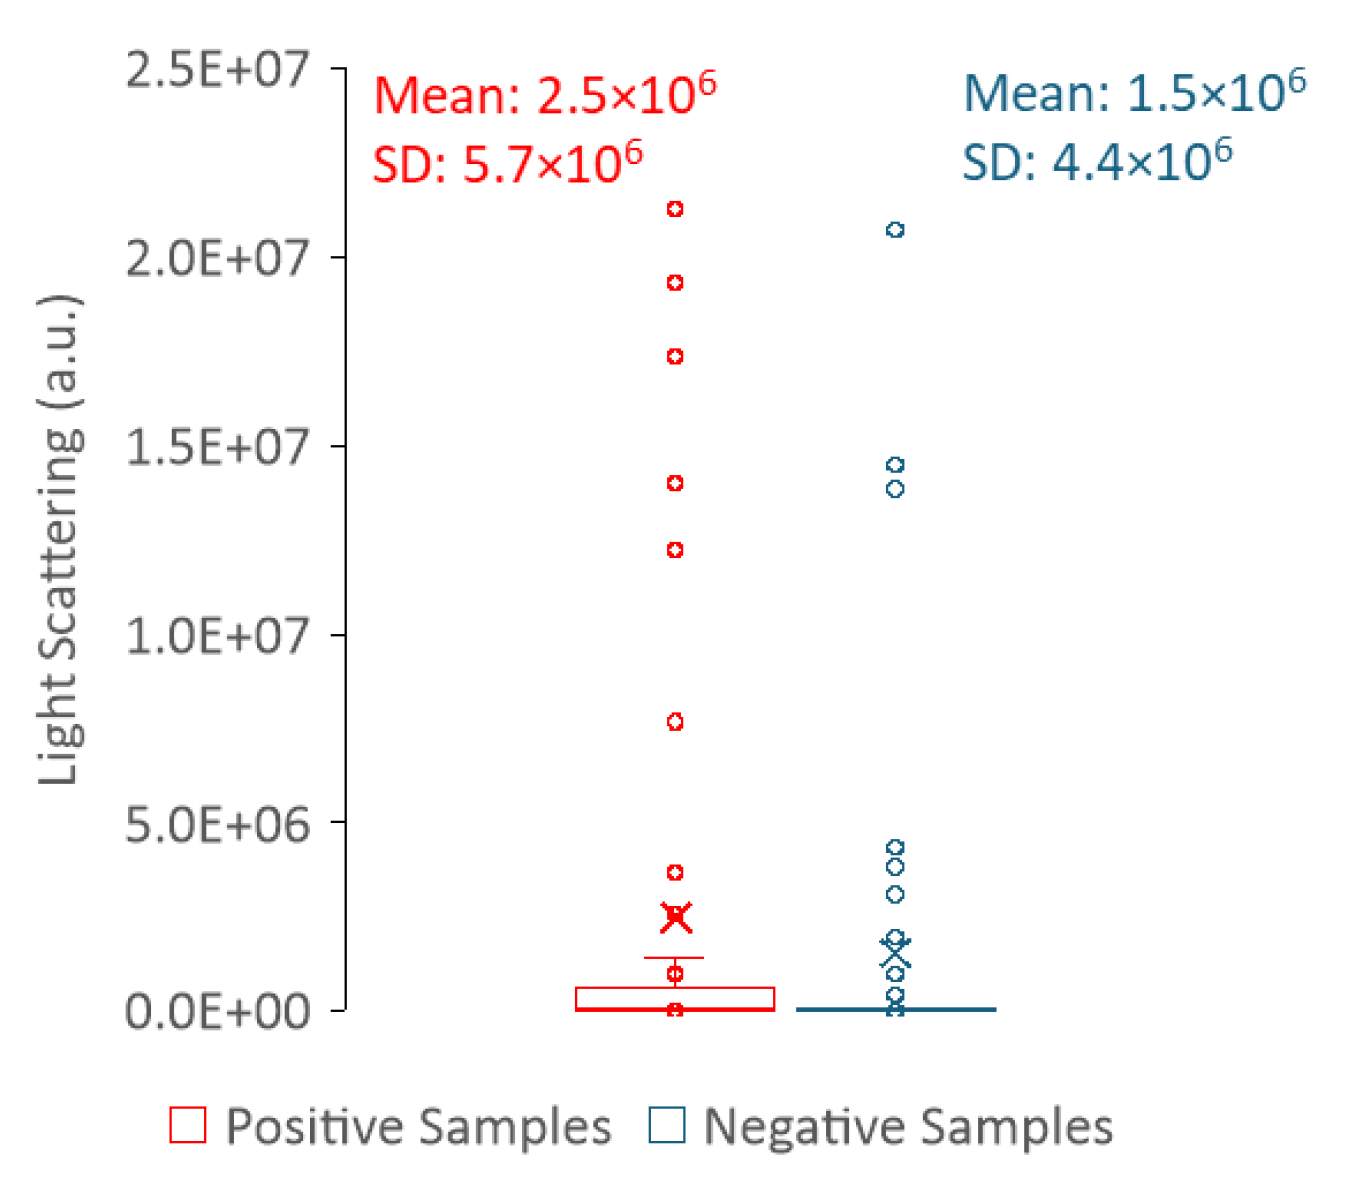
Figure 10.
Box plots of the transmittance (T) at 600 nm for both positive (red) and negative (blue) samples with the respective mean and standard deviation (SD).
Figure 10.
Box plots of the transmittance (T) at 600 nm for both positive (red) and negative (blue) samples with the respective mean and standard deviation (SD).
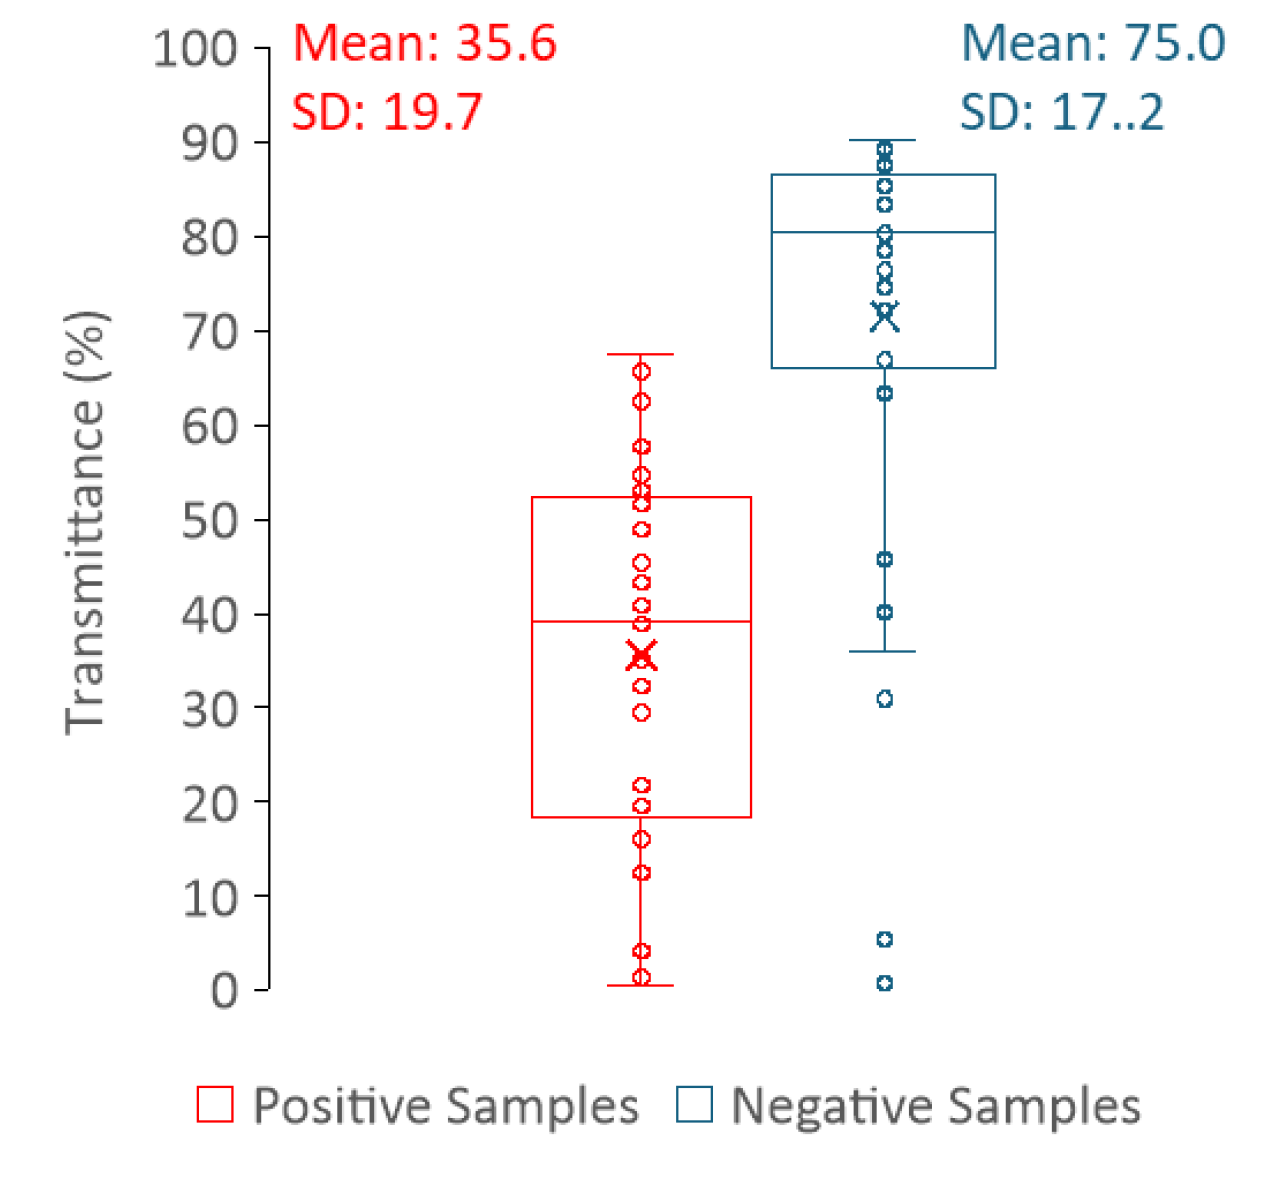
Figure 11.
Scattering plot between the ratio value (R) and the transmittance (T) highlighting a clear separation between positive (red) and negative (blue) urine samples.
Figure 11.
Scattering plot between the ratio value (R) and the transmittance (T) highlighting a clear separation between positive (red) and negative (blue) urine samples.
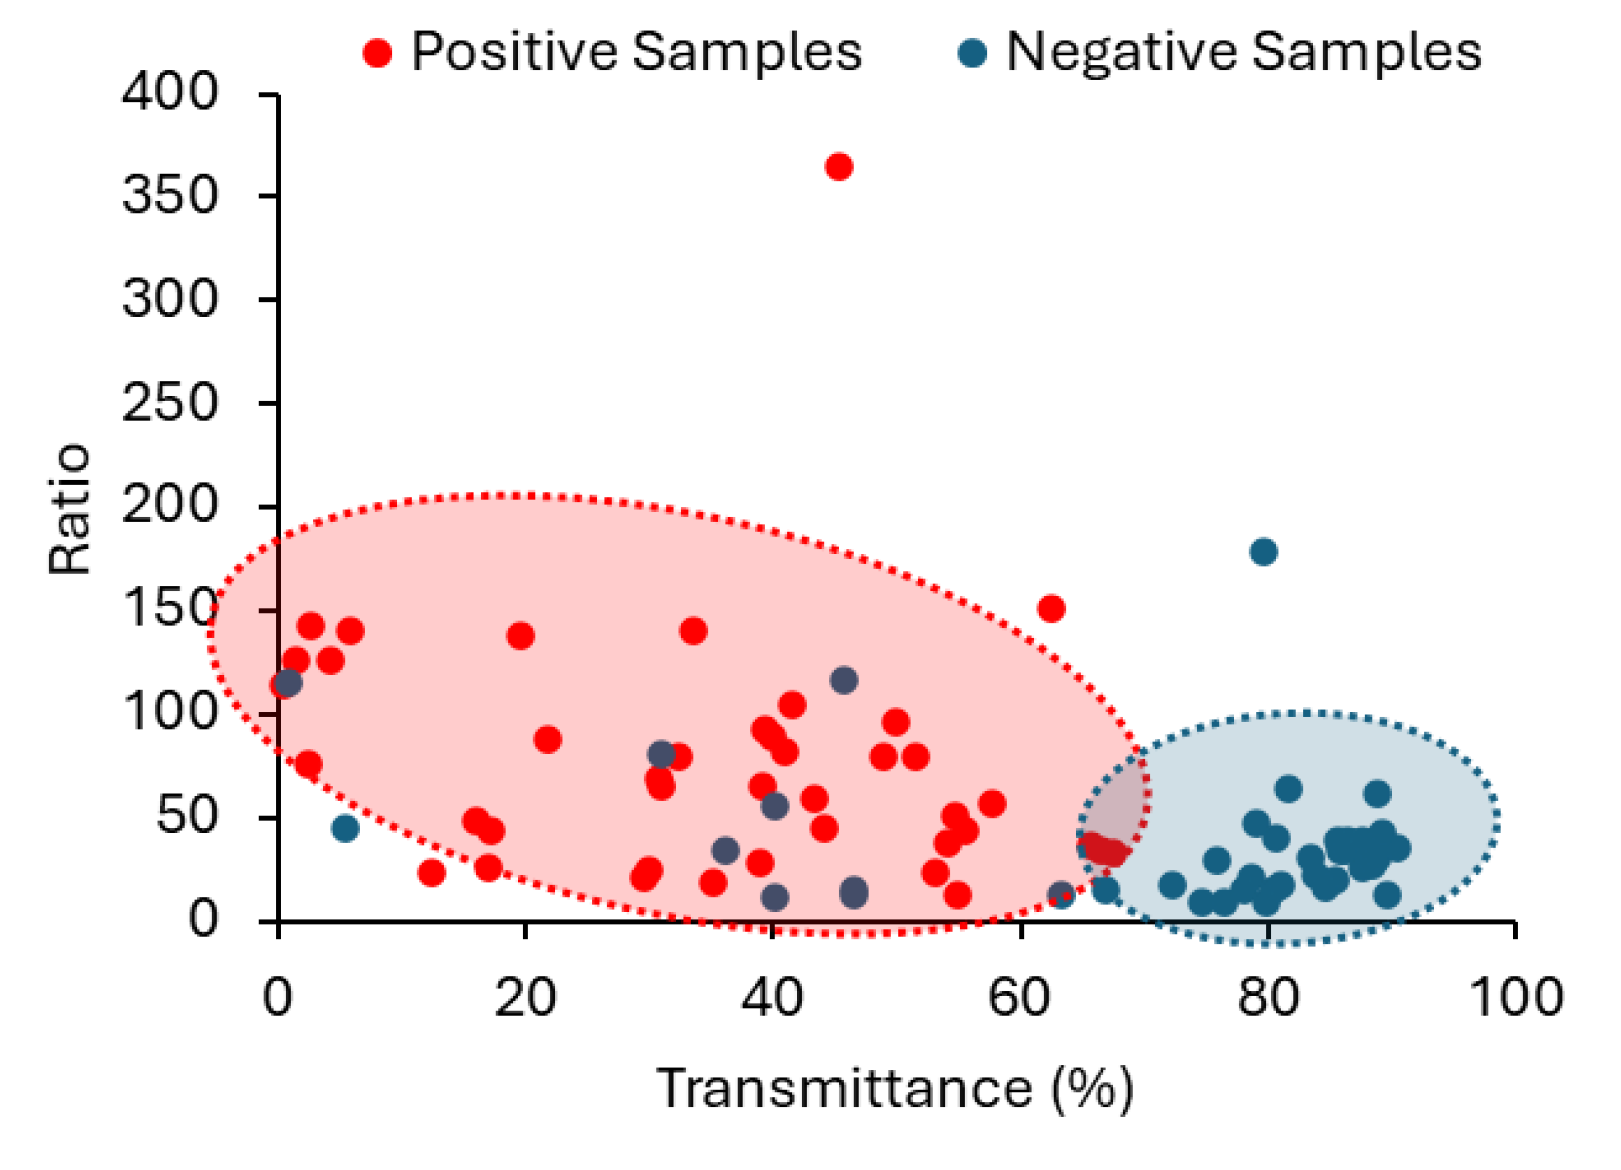

Table 1.
Descriptive statistics for M, R and T and respective confidence intervals (CIs) of 99%.
| Sample | Mean | SD | Lower 99% CI | Upper 99% CI | |
|---|---|---|---|---|---|
| M | Positive | 2.47×10⁶ | 2.08×10⁶ | 1.59×10⁶ | 3.35×10⁶ |
| Negative | 1.02×10⁶ | 1.09×10⁶ | 5.63×10⁵ | 1.47×10⁶ | |
| R | Positive | 77.5 | 61.1 | 51.7 | 103 |
| Negative | 37.2 | 33.3 | 23.4 | 51.1 | |
| T | Positive | 35.6 | 19.7 | 27.3 | 43.9 |
| Negative | 75 | 17.2 | 67.7 | 82.4 | |
Disclaimer/Publisher’s Note: The statements, opinions and data contained in all publications are solely those of the individual author(s) and contributor(s) and not of MDPI and/or the editor(s). MDPI and/or the editor(s) disclaim responsibility for any injury to people or property resulting from any ideas, methods, instructions or products referred to in the content. |
© 2024 by the authors. Licensee MDPI, Basel, Switzerland. This article is an open access article distributed under the terms and conditions of the Creative Commons Attribution (CC BY) license (http://creativecommons.org/licenses/by/4.0/).
Copyright: This open access article is published under a Creative Commons CC BY 4.0 license, which permit the free download, distribution, and reuse, provided that the author and preprint are cited in any reuse.


