
Submitted:
25 November 2024
Posted:
27 November 2024
You are already at the latest version
Abstract
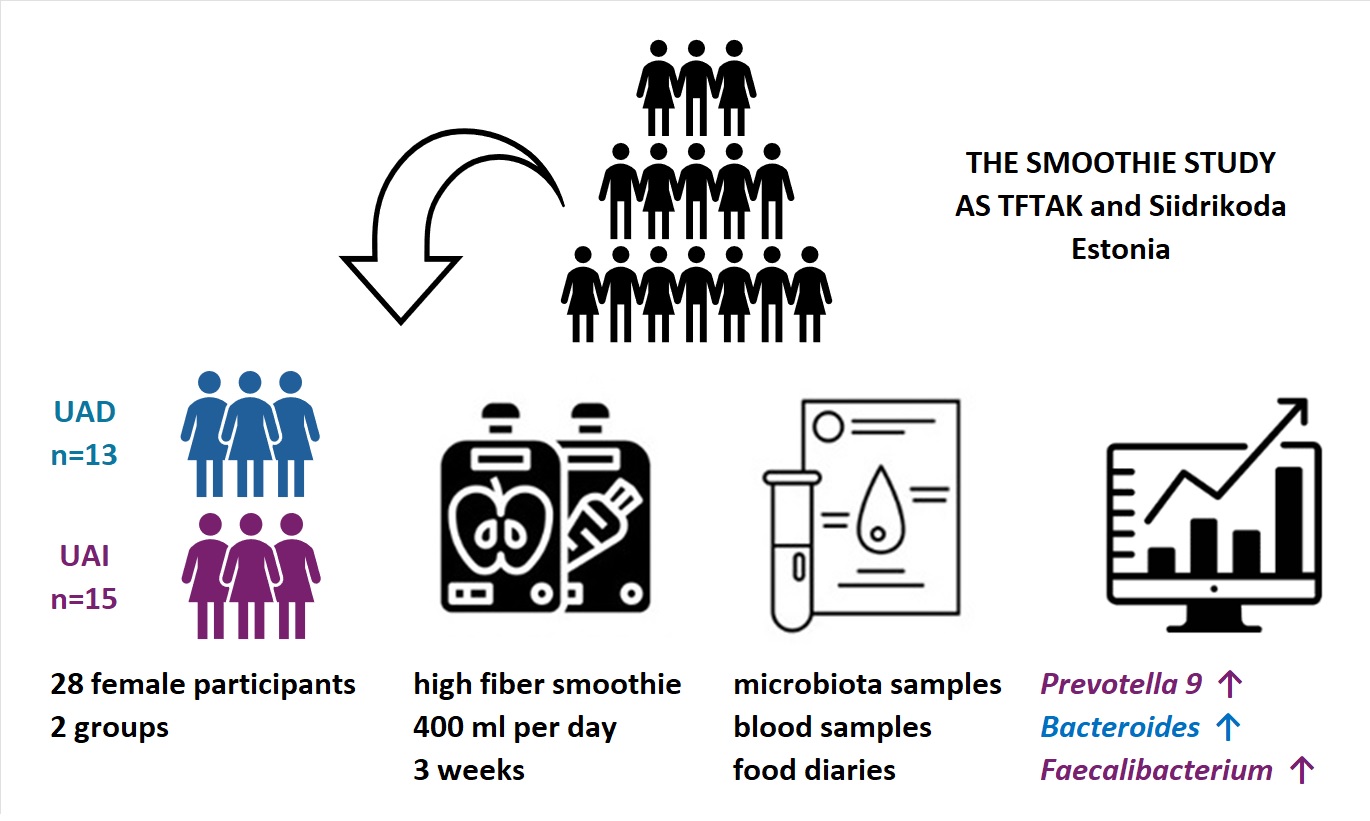
Background/Objectives: The normal uric acid (UA) levels vary based on gender, but in both sexes elevated UA levels are linked to various health conditions. Methods: This study examined the impact of a high-pectin smoothie (11.6g fibre/day) consumption for 3 weeks on UA levels and gut microbiota in 28 women. Food diaries, stool and blood samples were collected at baseline and after the smoothie consumption. Results: Participants with similar baseline UA levels showed divergent responses: UA levels increased in the UAI group (n = 15) and decreased in the UAD group (n = 13) post-intervention. The smoothie consumption increased Bacteroides in the UAD and Prevotella 9 in the UAI, contrasting with the baseline abundances, where Prevotella 9 was higher in the UAD and Bacteroides in the UAI group. Furthermore, the proportion of Faecalibacterium increased in the UAI group after smoothie consumption, equalizing the baseline difference with the UAD group. Conclusion: This research underscores the importance of personalized dietary strategies for managing healthy UA levels in women.
Keywords:
dietary fibre
; pectin
; uric acid
; gut microbiota
; women’s health
; 16S rRNA sequencing

1. Introduction
Uric acid (UA) is a compound that forms when the body breaks down purines found in certain foods and drinks or is synthesized within the body. The liver, kidneys, and intestines balance UA levels. Most UA is excreted through the kidneys, with about a third excreted through the intestines and bile. Disrupted coordination between these organs can increase levels of blood UA, which is linked to various diseases, such as gout [1]. Additionally, estrogen has been shown to facilitate uric acid excretion through the kidneys, highlighting the increased risk of UA accumulation after menopause [2]. A meta-analysis of 14 studies involving 341,389 participants found that hyperuricemia is associated with an increased risk of all-cause and coronary heart disease mortality, with a stronger effect observed in women than in men [3]. At the same time, even slightly elevated serum UA levels may be associated with a higher risk of arterial stiffness in women [4]. Furthermore, studies have shown correlations between body composition and UA levels [5,6]. Elevated UA may lead to increased oxidative stress by increasing the production of reactive oxygen species, particularly in females [7].
Based on current knowledge, the gut microbiota, especially an increased presence of bacteria that produce short-chain fatty acids, can impact UA metabolism, ultimately lowering UA levels [8,9]. Abnormalities in the breakdown of UA due to gut microbiota can cause increased UA production, the release of pro-inflammatory mediators, and damage to the intestinal barrier [10]. As the enterotype appears to be related to health indicators, lower UA levels are known to be associated with the Prevotella enterotype [11]. At the same time, the relative abundance of Prevotella, along with Bacteroides and Fusobacterium, was found to be increased in gout [12].
Various factors may influence the microbiota enterotype, with sex being an important determinant. Hormones affect gut microbiota differently depending on gender, influenced by diet, lifestyle, and medication use [13]. It's known that high-fructose, high-fat, and purine-rich diets can lead to hyperuricemia and alterations in gut microbiota, as observed in both animal models and hyperuricemic individuals [14,15]. On the contrary, the DASH (Dietary Approaches to Stop Hypertension) diet, characterised by greater consumption of high-fiber fruit and vegetables with low-fat dairy and reduced total and saturated fat, lowers serum urate levels [16]. Consistent with the above, our previous study showed that otherwise healthy female participants in the low-fiber group had significantly higher levels of UA than the high-fiber group [17]. It is well known that food choices and individual components of the menu can have a preventive effect on the development of diseases and that dietary fibers, such as pectins, contribute to general health in addition to strengthening the health of the digestive tract [18].
This study aimed to investigate the effect of consuming a high-pectin (HPect) smoothie on UA levels and the composition of gut microbiota in healthy women without clinical hyperuricemia.
2. Materials and Methods
2.1. Recruitment of Study Participants and Design of the Study
The current study was carried out and the smoothies were developed by the Center of Food and Fermentation Technologies (AS TFTAK, Estonia) in collaboration with Siidrikoda (Estonia). The smoothie study, divided into five periods, lasted from October 2022 to December 2022. Participants were selected according to a questionnaire and definite criteria. The questions concerned the respondents’ eating habits, description of their health status (incl. digestive health), and data on their general lifestyle. The exact study design, the composition of the smoothies, and the inclusion-exclusion criteria are described in detail elsewhere [17]. An additional criterion for inclusion in this study was that UA levels aligned with the reference values established by the United Laboratories of Tartu University Hospital (https://www.kliinikum.ee/yhendlabor/wp-content/uploads/2023/05/TL-14_5__V20_Reference_values_for_clinical_chemistry_tests.pdf). Of the 368 volunteers who filled out the questionnaire, 39 were included in the study, with 31 completing it, including 3 men (9.7%). Since this research focused on female health, data from the men were withdrawn, leaving data from 28 women for analysis. Data was obtained at baseline and at the end of the HPect smoothie consumption period. During the 3-week HPect smoothie period, participants consumed an additional 11.6 grams of fiber per day alongside their regular meals. Elsewhere, participants were asked to continue with their usual eating habits. Based on baseline UA levels and changes following HPect smoothie consumption, participants were classified into two groups: the decreased UA group (UAD, n = 13) and the increased UA group (UAI, n = 15). All participants signed written informed consent forms before the beginning of the study. The research has been approved by the local ethics committee (Research Ethics Committee of the National Institute for Health Development, Reference number 1065, issued on 04/25/2022).
2.2. Data Collection
Nutrition data diaries were filled out one week before blood and fecal sample collection using the NutriData dietary analysis program (National Institute for Health Development, Estonia). The participants were asked to report the exact amount of smoothies they consumed. The analysis of macronutrients considered all regular diet periods to rule out occasional variations in the daily diet. At the end of every period, blood and fecal samples were taken and body composition was determined with a Tanita body composition analyser (DC-360S, Tanita Corporation, Tokyo, Japan).
2.3. Analyses of Blood Samples
Blood test analysis was performed by the Tartu University Hospital laboratory or SYNLAB Eesti OÜ (Tallinn, Estonia). Blood samples were taken between 7 a.m. and 10.30 a.m. after overnight fasting (on the same day the fecal sample was produced). Blood was centrifuged and serum was used for analysis. The uric acid levels were measured using the enzymatic colorimetric method (Cobas c 501, Roche Diagnostics).
2.4. DNA Extraction and Sequencing
Fecal samples were collected with DNA/RNA Shield Collection Tubes with Swabs (Zymo Research, Irvine, CA, USA) using FecesCatcher by TagHemi (Zeijen, The Netherlands) and stored at + 4 ◦C. Before DNA extraction, samples were frozen at −20 ◦C at least overnight. DNA was extracted using the ZymoBIOMICS DNA Miniprep Kit (Zymo Research, Irvine, CA, USA) according to the manufacturer´s instructions. Qubit™ 3 Fluorometer (Thermo Fisher Scientific, Waltham, MA, USA) and the dsDNA BR Assay Kit (Thermo Fisher Scientific) were used for gDNA quantification. The V4 hypervariable region of the 16S rRNA gene was PCR amplified using universal forward F515 5`- GTGCCAGCMGCCGCGGTAA-3` and reverse R806 5´-GGACTACHVGGGTWTCTAAT-3´ primers [19]. Samples were sequenced using the Illumina MiSeq platform and a 2 × 150-cycle paired-end sequencing protocol. On average, 38 800 reads (minimum 17 677 reads) per sample were obtained. The whole sequencing workflow was published before [20]. DNA sequence data was analyzed by BION-meta software (https://github.com/nielsl/mcdonald-et-al) according to the authors’ instructions [21]. The sequences were first cleaned at both ends using a 99.5% minimum quality threshold for at least 18 out of 20 bases for 5`-end and 28 out of 30 bases for 3`-end, followed by joining and removal of shorter contigs than 150 bp. Afterwards, the sequences were cleaned from chimaeras and clustered by 95% oligonucleotide similarity (k-mer length of 8 bp, step size 2 bp). Finally, consensus reads were aligned to the SILVA reference 16S rRNA database (v138) using a word length of 8 and a similarity cut-off of 90%.
2.5. Statistical Analyses
Statistical analyses were performed at the bacteria genus level with an abundance of at least > 0.0006 per sample. Data analyses were done by R version 4.2.1 (The R Foundation for Statistical Computing, Vienna, Austria) using open public packages-indicspecies, dplyr, ggpubr, reshape2, tidyverse, and ggplot2, grDevices package were used for visualisation. Pairwise comparisons were calculated between the baseline and the end of the HPect smoothie consumption period using the Wilcoxon signed-rank test. The Wilcoxon rank-sum test was used to evaluate differences in the abundances of bacterial genera between UAD and UAI groups. Statistical significance was defined at P < 0.01. Macronutrient intake differences were assessed, and general health parameters were analyzed using SPSS for Windows version 20.0 (SPSS Inc. Chica go, IL, USA). A nonparametric Wilcoxon test was used to evaluate the difference between the medians and distributions of the outcome parameters for the subgroups. Statistical significance was defined at P < 0.05.
3. Results
3.1. Baseline Characteristics of Two Groups Based on Changes in Uric Acid Levels After Consuming HPect Smoothie
Age is an important factor influencing female hormonal levels and overall health status. Participants in the UAD group were younger, with an average age of 34 (±6.8), compared to participants in the UAI group, who had an average age of 39 (±4.8) (t-test P-value = 0.02). Regarding their eating habits, no statistically significant differences were found between the two groups. Table 1 displays the daily intake of energy, macronutrients and fiber. The macronutrient intake of the two groups during their standard diet was analyzed via food records. The mean intake of fructose, a sugar that may affect UA levels, was rather low in both groups (18.7 g in the UAD and 16 g in the UAI group, respectively). It is worth noting that both groups consumed more fat than recommended by Estonian nutrition guidelines [22]. In the UAD and UAI groups, 38% and 37.3% of daily energy consumption came from fat, respectively. Notably, there was an increase in the intake of saturated fatty acids, which contributed to 13% of daily energy intake in the UAD group and 11% in the UAI group. At the same time, fruit and vegetable consumption was low based on the food frequency questionnaire. The two groups did not differ regarding UA levels and the UA values in the baseline period of all participants remained below the recommended maximum of the reference, i.e. below 339 μmol/L [23]. Both groups had a similar median BMI corresponding to normal weight (21.9 in the UAD and 22 in the UAI, respectively).
Next, we compared the gut microbiota of both groups at the beginning of the study and found quite similar compositions at the genus level. The results are comparable to our previous study [17]. At the same time, a significantly decreased abundance of Faecalibacterium and Anaerosporobacter and an increased abundance of Prevotella and Lactococcus were found in the UAI group compared to the UAD group (P < 0.01, respectively) (Figure 1A). Since the abundance of Bacteroides and Prevotella may be related to purine metabolism and UA levels [24], we investigated the proportion of these bacteria and their response to smoothie consumption in our study subjects. The proportion of Prevotella 9 in the UAD group seems to be higher than that in the UAI group, while the opposite is true for Bacteroides during the base period (Figure 2). In the UAD group, 54% of participants' gut microbiota contains a higher level of Prevotlla 9 than Bacteroides; in the UAI group, the value is 20%.
3.2. The High-Pectin Smoothie Affects Uric Acid Levels and Gut Microbiota Differently in the UAI and UAD Groups
Compared to the baseline period, HPect smoothie consumption significantly decreased the UA level in the UAD group (264.4 µmol/l vs 227.9 µmol/l, the Wilcoxon rank-sum test P-value = 0.001) and increased it in the UAI group (234.1 µmol/l vs 249.5 µmol/l, the Wilcoxon rank-sum test P-value = 0.003). At the same time, consumption of the HPect smoothie led to a small but significant increase in the abundance of Bacteroides in UAD and Prevotella 9 in the UAI group (Figure 3). Furthermore, in the UAI group, after consuming the HPect smoothie, the levels of the Ruminococcus torques group, Fusicatenibacterium and Butyricimonas decreased, while Sutterella and Paraprevotella increased (P-values < 0.01, Figure 4). Besides, in the UAD group, the levels of Anaerostipes and the Eubacterium ventriosum group decreased (Figure 5). Interestingly, in the UAI group, the level of Faecalibacterium increased after consuming HPect smoothie to such an extent that no significant difference was observed compared with the base period of the UAD group (Figure 1B).
4. Discussion
An important finding of the study was that otherwise healthy women with initially similar uric acid (UA) levels experienced both increases (UAI group) and decreases (UAD group) in UA levels after consuming the smoothie fortified by pectin.
Growing evidence suggests that gender should be considered in hyperuricemia research [25]. Therefore, we focused exclusively on women to examine the relationship between dietary changes, gut microbiota, and UA levels. UA levels naturally increase with age, particularly in women after 50, likely due to menopause and related hormonal changes [26]. Although our study groups differed in mean age, all participants were under 50 years old, and the baseline levels of UA showed no statistically significant differences. Nevertheless, UAI group participants were older than those in the UAD group, indicating a possible trend between age and UA levels. Although the threshold at which UA levels become abnormal is still debated, research shows that health issues can arise even at lower levels of UA. Thus, it is shown that in women, the risk of developing hypertension starts at uricemia levels of 214 μmol/L, which is lower than the conventional hyperuricemia threshold of 404 μmol/L [27]. A significant association between cardiovascular disease and diabetes has also been shown in women with mean UA levels below the definition of hyperuricemia [25]. Furthermore, a high-normal or elevated serum UA level may be linked to a higher risk of arterial stiffness in healthy women [4]. Among different factors affecting UA levels, both genes and diet play important roles [10,28,29]. Evidence from the meta-analysis indicated that intake of red meat, seafood, fructose and alcohol may increase and consumption of dairy products or soy foods may decrease the risk of hyperuricemia and gout [28]. Due to the increased proportion of added sugars in our menus, it is recommended to pay special attention to the consumption of fructose, considering the evidence of fructose metabolism to avoid an increase in UA [29,30].
Despite participants' dietary habits not fully aligning with national recommendations, no significant differences were found between the groups attributable to opposing changes in UA levels associated with HPect smoothie consumption. Also, the fructose consumption of the participants in both groups remained below 5% of the daily energy. Since both groups had similar diets throughout the study regarding macronutrient compositions, the changes in UA levels related to the HPect smoothie may be more associated with individual fiber consumption and baseline differences in the gut microbiome. Variations in individual gut microbiomes have been shown to correlate with different serum UA levels. [31]. Several studies have demonstrated that different types of fibers have a unique impact on gut microbiota as well as UA levels [32,33,34]. It has been demonstrated that even if fiber can alter the gut microbiota, the effects are specific to individual bacterial strains and species [34]. Although the two groups had quite similar gut microbiota composition at the genus level in the baseline period, it was observed that the UAD group had a higher proportion of Prevotella 9 compared to the UAI group, whereas the opposite was observed for Bacteroides. Consuming the HPect smoothie led to a cross-reactive increase in Prevotella 9 in the UAI group and Bacteroides in the UAD group, with no opposite effect. In addition, the prevalence of uric acid-affecting bacteria may vary by specific population. For instance, a study of Asians found that the genus Collinsella, abundant in their gut microbiota, and Dorea are strongly linked to hyperuricaemia, while low UA levels are associated with Faecalibacterium and Ruminococcus [5]. It has also been revealed that structurally different types of pectins can control different bacterial populations, including Faecalibacterium prausnitzii, Ruminococcus, Sutterella, Prevotella copri and Bacteroides spp. [34,35,36]. These previous findings may, at least partially, explain the results of our study. Likewise, HPect smoothie consumption-associated variation in UA levels within both groups may be related to changes in the Prevotella-to-Bacteroides ratio. Thus, a lower Prevotella-to-Bacteroides ratio has been shown in asymptomatic hyperuricemia [24]. Moreover, it has been previously mentioned that non-dietary factors could influence the distribution of gut Prevotella species [37].
Even if our study subjects deviated from the recommended eating pattern based on food diaries, they did not have hyperuricemia and were healthy. As a result, we cannot definitively determine if the intervention changed their well-being. At the same time, it is known that the imbalances in diet and microbiota can support body's inflammatory mechanisms. A correlation between inflammatory conditions and low levels of Faecalibacterium has previously been shown [38]. It is also known that specific Prevotella species can exhibit different properties and some Prevotella strains may be associated with chronic inflammation [39]. Despite Anaerosporobacter not being extensively studied, its abundance difference between the groups could be associated with a high-fat diet and ageing, as shown by a negative correlation in a murine model [40].
In conclusion, our findings assume that the conscious addition of specific fibers to the diet may help promote a balanced microbiota, especially for women experiencing hormonal shifts that affect overall well-being. For instance, as shown in our study, Faecalibacterium levels in the UAI group increased after consumption of the HPect smoothie, ultimately eliminating the baseline difference observed between UAI and UAD groups.
However, the study is limited by the relatively short-term duration and small number of participants, making the results more vulnerable to individual variations. Additionally, the results may be influenced by seasonal variations in diet and cannot be significantly generalised.
In summary, due to the unclear threshold for UA levels that can pose health risks, it's essential to investigate the factors that influence UA levels, including the impact of different fibre types on gut microbiota or the hormonal status of women, to better understand and manage future health outcomes.
Author Contributions
conception and design of the study (KEA, SP), investigation (KEA, SP), data preparation (SP), data analysis and interpretation (KEA, SP JK), writing and critical revision of the manuscript (KEA, SP, JK). All authors have read and agreed to the published version of the manuscript.
Funding
This study was supported by the European Agricultural Fund for Rural Development (EAFRD) and the Estonian Rural Development Plan (ERDP) for 2014–2020 measure 16.2 and by The Republic of Estonia Agricultural Registers and Information Board (ARIB), project number 616219790087. The study was partly funded by the inter-sectorial mobility grant no 2021-2027.1.01.23-0352 provided by the Estonian State Shared Service Centre and co-funded by the European Union.
Institutional Review Board Statement
The local ethics committee approved the study (Research Ethics Committee of the National Institute for Health Development, Reference number 1065, issued on 25 April 2022). The participants were informed about all the procedures and purposes of the study. Signed written consent was obtained from all subjects involved in the study.
Informed Consent Statement
Any research article describing a study involving humans should contain this statement. Please add “Informed consent was obtained from all subjects involved in the study.” OR “Patient consent was waived due to REASON (please provide a detailed justification).” OR “Not applicable.” for studies not involving humans. You might also choose to exclude this statement if the study did not involve humans. Written informed consent for publication must be obtained from participating patients who can be identified (including by the patients themselves). Please state “Written informed consent has been obtained from the patient(s) to publish this paper” if applicable.
Data Availability Statement
The data presented in this study is available on SRA database: https://www.ncbi.nlm.nih.gov/sra/PRJNA981491.
Acknowledgments
The authors express their gratitude to Aili Kallastu, Anne Meikas, and Esther Malv for their assistance with fecal sample preparation and sequencing, to Margit Paukson for conducting the bioinformatic analyses, and to Rain Kuldjärv for serving as the project coordinator.
Conflicts of Interest
The authors declare that they have no known competing financial interests or personal relationships that could have appeared to have influenced the work reported in this paper.
References
- T. Bardin and P. Richette, “Definition of hyperuricemia and gouty conditions,” Curr. Opin. Rheumatol., vol. 26, no. 2, pp. 186–191, 2014. [CrossRef]
- V. L. H. Kuhns and O. M. Woodward, “Molecular Sciences Sex Differences in Urate Handling,” Int. J. Mol. Sci., vol. 21, no. Figure 1, pp. 1–20, 2020, [Online]. Available: www.mdpi.com/journal/ijms.
- T. Zuo, X. Liu, L. Jiang, S. Mao, X. Yin, and L. Guo, “Hyperuricemia and coronary heart disease mortality: A meta-analysis of prospective cohort studies,” BMC Cardiovasc. Disord., vol. 16, no. 1, 2016. [CrossRef]
- J. I. Fang, J. S. Wu, Y. C. Yang, R. H. Wang, F. H. Lu, and C. J. Chang, “High uric acid level associated with increased arterial stiffness in apparently healthy women,” Atherosclerosis, vol. 236, no. 2, pp. 389–393, 2014. [CrossRef]
- Y. Miyajima et al., “Prediction and causal inference of hyperuricemia using gut microbiota,” Sci. Rep., vol. 14, no. 1, pp. 1–9, 2024. [CrossRef]
- T. Mao, Q. He, J. Yang, L. Jia, and G. Xu, “Relationship between gout, hyperuricemia, and obesity—does central obesity play a significant role?—a study based on the NHANES database,” Diabetol. Metab. Syndr., vol. 16, no. 1, pp. 1–12, 2024. [CrossRef]
- M. Kurajoh et al., “Uric acid shown to contribute to increased oxidative stress level independent of xanthine oxidoreductase activity in MedCity21 health examination registry,” Sci. Rep., vol. 11, no. 1, pp. 1–9, 2021. [CrossRef]
- N. Yamada et al., “Evaluation of purine utilization by Lactobacillus gasseri strains with potential to decrease the absorption of food-derived purines in the human intestine,” Nucleosides, Nucleotides and Nucleic Acids, vol. 35, no. 10–12, pp. 670–676, 2016. [CrossRef]
- G. A. Martínez-Nava et al., “The impact of short-chain fatty acid–producing bacteria of the gut microbiota in hyperuricemia and gout diagnosis,” Clin. Rheumatol., vol. 42, no. 1, pp. 203–214, 2023. [CrossRef]
- H. Yin, N. Liu, and J. Chen, “The Role of the Intestine in the Development of Hyperuricemia,” vol. 13, no. February, pp. 1–8, 2022. [CrossRef]
- M. Y. Lim, M. Rho, Y. Song, K. Lee, J. Sung, and G. Ko, “Stability of Gut Enterotypes in Korean Monozygotic Twins and Their Association with Biomarkers and Diet,” pp. 1–7, 2014. [CrossRef]
- Y. Chu et al., “Metagenomic analysis revealed the potential role of gut microbiome in gout,” npj Biofilms Microbiomes, vol. 7, no. 1, 2021. [CrossRef]
- F. Valeri and K. Endres, “How biological sex of the host shapes its gut microbiota,” Front. Neuroendocrinol., vol. 61, p. 100912, 2021. [CrossRef]
- J. Beisner, A. Gonzalez-granda, M. Basrai, and A. Damms-machado, “Fructose-Induced Intestinal Microbiota Shift,” Nutrients, vol. 12, pp. 1–21, 2020.
- Z. Wang, Y. Li, W. Liao, and J. Huang, “Gut microbiota remodeling : A promising therapeutic strategy to confront hyperuricemia and gout,” no. August, pp. 1–18, 2022. [CrossRef]
- S. P. Juraschek, C. Yokose, N. McCormick, E. R. Miller, L. J. Appel, and H. K. Choi, “Effects of Dietary Patterns on Serum Urate: Results From a Randomized Trial of the Effects of Diet on Hypertension,” Arthritis Rheumatol., vol. 73, no. 6, pp. 1014–1020, 2021. [CrossRef]
- S. Pihelgas, K. Ehala-Aleksejev, R. Kuldjärv, A. Jõeleht, J. Kazantseva, and K. Adamberg, “Short-term pectin-enriched smoothie consumption has beneficial effects on the gut microbiota of low-fiber consumers,” FEMS Microbes, no. February, pp. 1–10, 2024. [CrossRef]
- M. Beukema, M. M. Faas, and P. de Vos, “The effects of different dietary fiber pectin structures on the gastrointestinal immune barrier: impact via gut microbiota and direct effects on immune cells,” Exp. Mol. Med., vol. 52, no. 9, pp. 1364–1376, 2020. [CrossRef]
- J. G. Caporaso et al., “Global patterns of 16S rRNA diversity at a depth of millions of sequences per sample,” Proc. Natl. Acad. Sci. U. S. A., vol. 108, no. SUPPL. 1, pp. 4516–4522, 2011. [CrossRef]
- J. Kazantseva, E. Malv, A. Kaleda, A. Kallastu, and A. Meikas, “Optimisation of sample storage and DNA extraction for human gut microbiota studies,” BMC Microbiol., vol. 21, no. 1, pp. 1–13, 2021. [CrossRef]
- J. E. McDonald et al., “Characterising the canine oral microbiome by direct sequencing of reverse-transcribed rRNA molecules,” PLoS One, vol. 11, no. 6, pp. 1–17, 2016. [CrossRef]
- T. Pitsi et al., Eesti toitumis- ja liikumissoovitused 2015. Tervise Arengu Instituut, 2017.
- Kallion Kaja, Ühendlabori analüüside käsiraamat. .
- H. W. Kim, E. J. Yoon, S. H. Jeong, and M. C. Park, “Distinct Gut Microbiota in Patients with Asymptomatic Hyperuricemia: A Potential Protector against Gout Development,” Yonsei Med. J., vol. 63, no. 3, pp. 241–251, 2022. [CrossRef]
- B. Engel, F. Hoffmann, M. H. Freitag, and H. Jacobs, “Should we be more aware of gender aspects in hyperuricemia? Analysis of the population-based German health interview and examination survey for adults (DEGS1),” Maturitas, vol. 153, no. June, pp. 33–40, 2021. [CrossRef]
- E. Zi, A. Fisc, L. Karl, C. Hans, and G. Nage, “Sex- and age-specific variations , temporal trends and metabolic determinants of serum uric acid concentrations in a large population-based Austrian cohort,” pp. 1–8, 2020. [CrossRef]
- L. Gaffo, D. R. Jacobs, F. Sijtsma, C. E. Lewis, T. R. Mikuls, and K. G. Saag, “Serum urate association with hypertension in young adults: Analysis from the Coronary Artery Risk Development in Young Adults cohort,” Ann. Rheum. Dis., vol. 72, no. 8, pp. 1321–1327, 2013. [CrossRef]
- R. Li, K. Yu, and C. Li, “Dietary factors and risk of gout and hyperuricemia: A meta-analysis and systematic review,” Asia Pac. J. Clin. Nutr., vol. 27, no. 6, pp. 1344–1356, 2018. [CrossRef]
- R. J. Johnson et al., “The fructose survival hypothesis for obesity,” Philos. Trans. R. Soc. B Biol. Sci., vol. 378, no. 1885, 2023. [CrossRef]
- Tero-Vescan, R. Ștefănescu, T. I. Istrate, and A. Pușcaș, “Fructose-induced hyperuricaemia–protection factor or oxidative stress promoter?,” Nat. Prod. Res., vol. 0, no. 0, pp. 1–13, 2024. [CrossRef]
- M. Liang et al., “Diagnostic model for predicting hyperuricemia based on alterations of the gut microbiome in individuals with different serum uric acid levels,” Front. Endocrinol. (Lausanne)., vol. 13, no. September, pp. 1–13, 2022. [CrossRef]
- T. Koguchi et al., “Suppressive Effect of Viscous Dietary Fiber on Elevations of Uric Acid in Serum and Urine Induced by Dietary RNA in Rats is Associated with Strength of Viscosity,” Int. J. Vitam. Nutr. Res., vol. 73, no. 5, pp. 369–376, 2003. [CrossRef]
- T. Koguchi and T. Tadokoro, “Beneficial Effect of Dietary Fiber on Hyperuricemia in Rats and Humans: A Review,” Int. J. Vitam. Nutr. Res., vol. 89, no. 1–2, pp. 89–108, 2019. [CrossRef]
- W. S. F. Chung et al., “Modulation of the human gut microbiota by dietary fibres occurs at the species level,” BMC Biol., vol. 14, no. 1, pp. 1–13, 2016. [CrossRef]
- N. Larsen et al., “Potential of pectins to beneficially modulate the gut microbiota depends on their structural properties,” Front. Microbiol., vol. 10, no. FEB, pp. 1–13, 2019. [CrossRef]
- N. Pascale, F. Gu, N. Larsen, L. Jespersen, and F. Respondek, “The Potential of Pectins to Modulate the Human Gut Microbiota Evaluated by In Vitro Fermentation: A Systematic Review,” Nutrients, vol. 14, no. 17, pp. 1–31, 2022. [CrossRef]
- Y. K. Yeoh et al., “Prevotella species in the human gut is primarily comprised of Prevotella copri, Prevotella stercorea and related lineages,” Sci. Rep., vol. 12, no. 1, pp. 1–9, 2022. [CrossRef]
- R. Martín et al., “Faecalibacterium: a bacterial genus with promising human health applications,” FEMS Microbiol. Rev., vol. 47, no. 4, pp. 1–18, 2023. [CrossRef]
- J. M. Larsen, “The immune response to Prevotella bacteria in chronic inflammatory disease,” Immunology, vol. 151, no. 4, pp. 363–374, 2017. [CrossRef]
- S. Takahashi, K. Nakagawa, W. Nagata, A. Koizumi, and T. Ishizuka, “A preliminary therapeutic study of the effects of molecular hydrogen on intestinal dysbiosis and small intestinal injury in high-fat diet-loaded senescence-accelerated mice,” Nutrition, vol. 122, 2024. [CrossRef]
Figure 1.
(A) Baseline relative abundance of four bacterial genera with statistically significant differences between UAD (n=13, green) and UAI (n=15, blue) groups. The Wilcoxon rank-sum test was used, and outliers were shown. ** p-value < 0.01. p-values respectively (0.0083, 0.0066, 0.0023, 0.0096). (B) Abundance of Faecalibacterium in the UAD group during the baseline period and in the UAI group after HPect consumption. The Wilcoxon rank-sum test was performed, and outliers were shown (P-value 0.16).
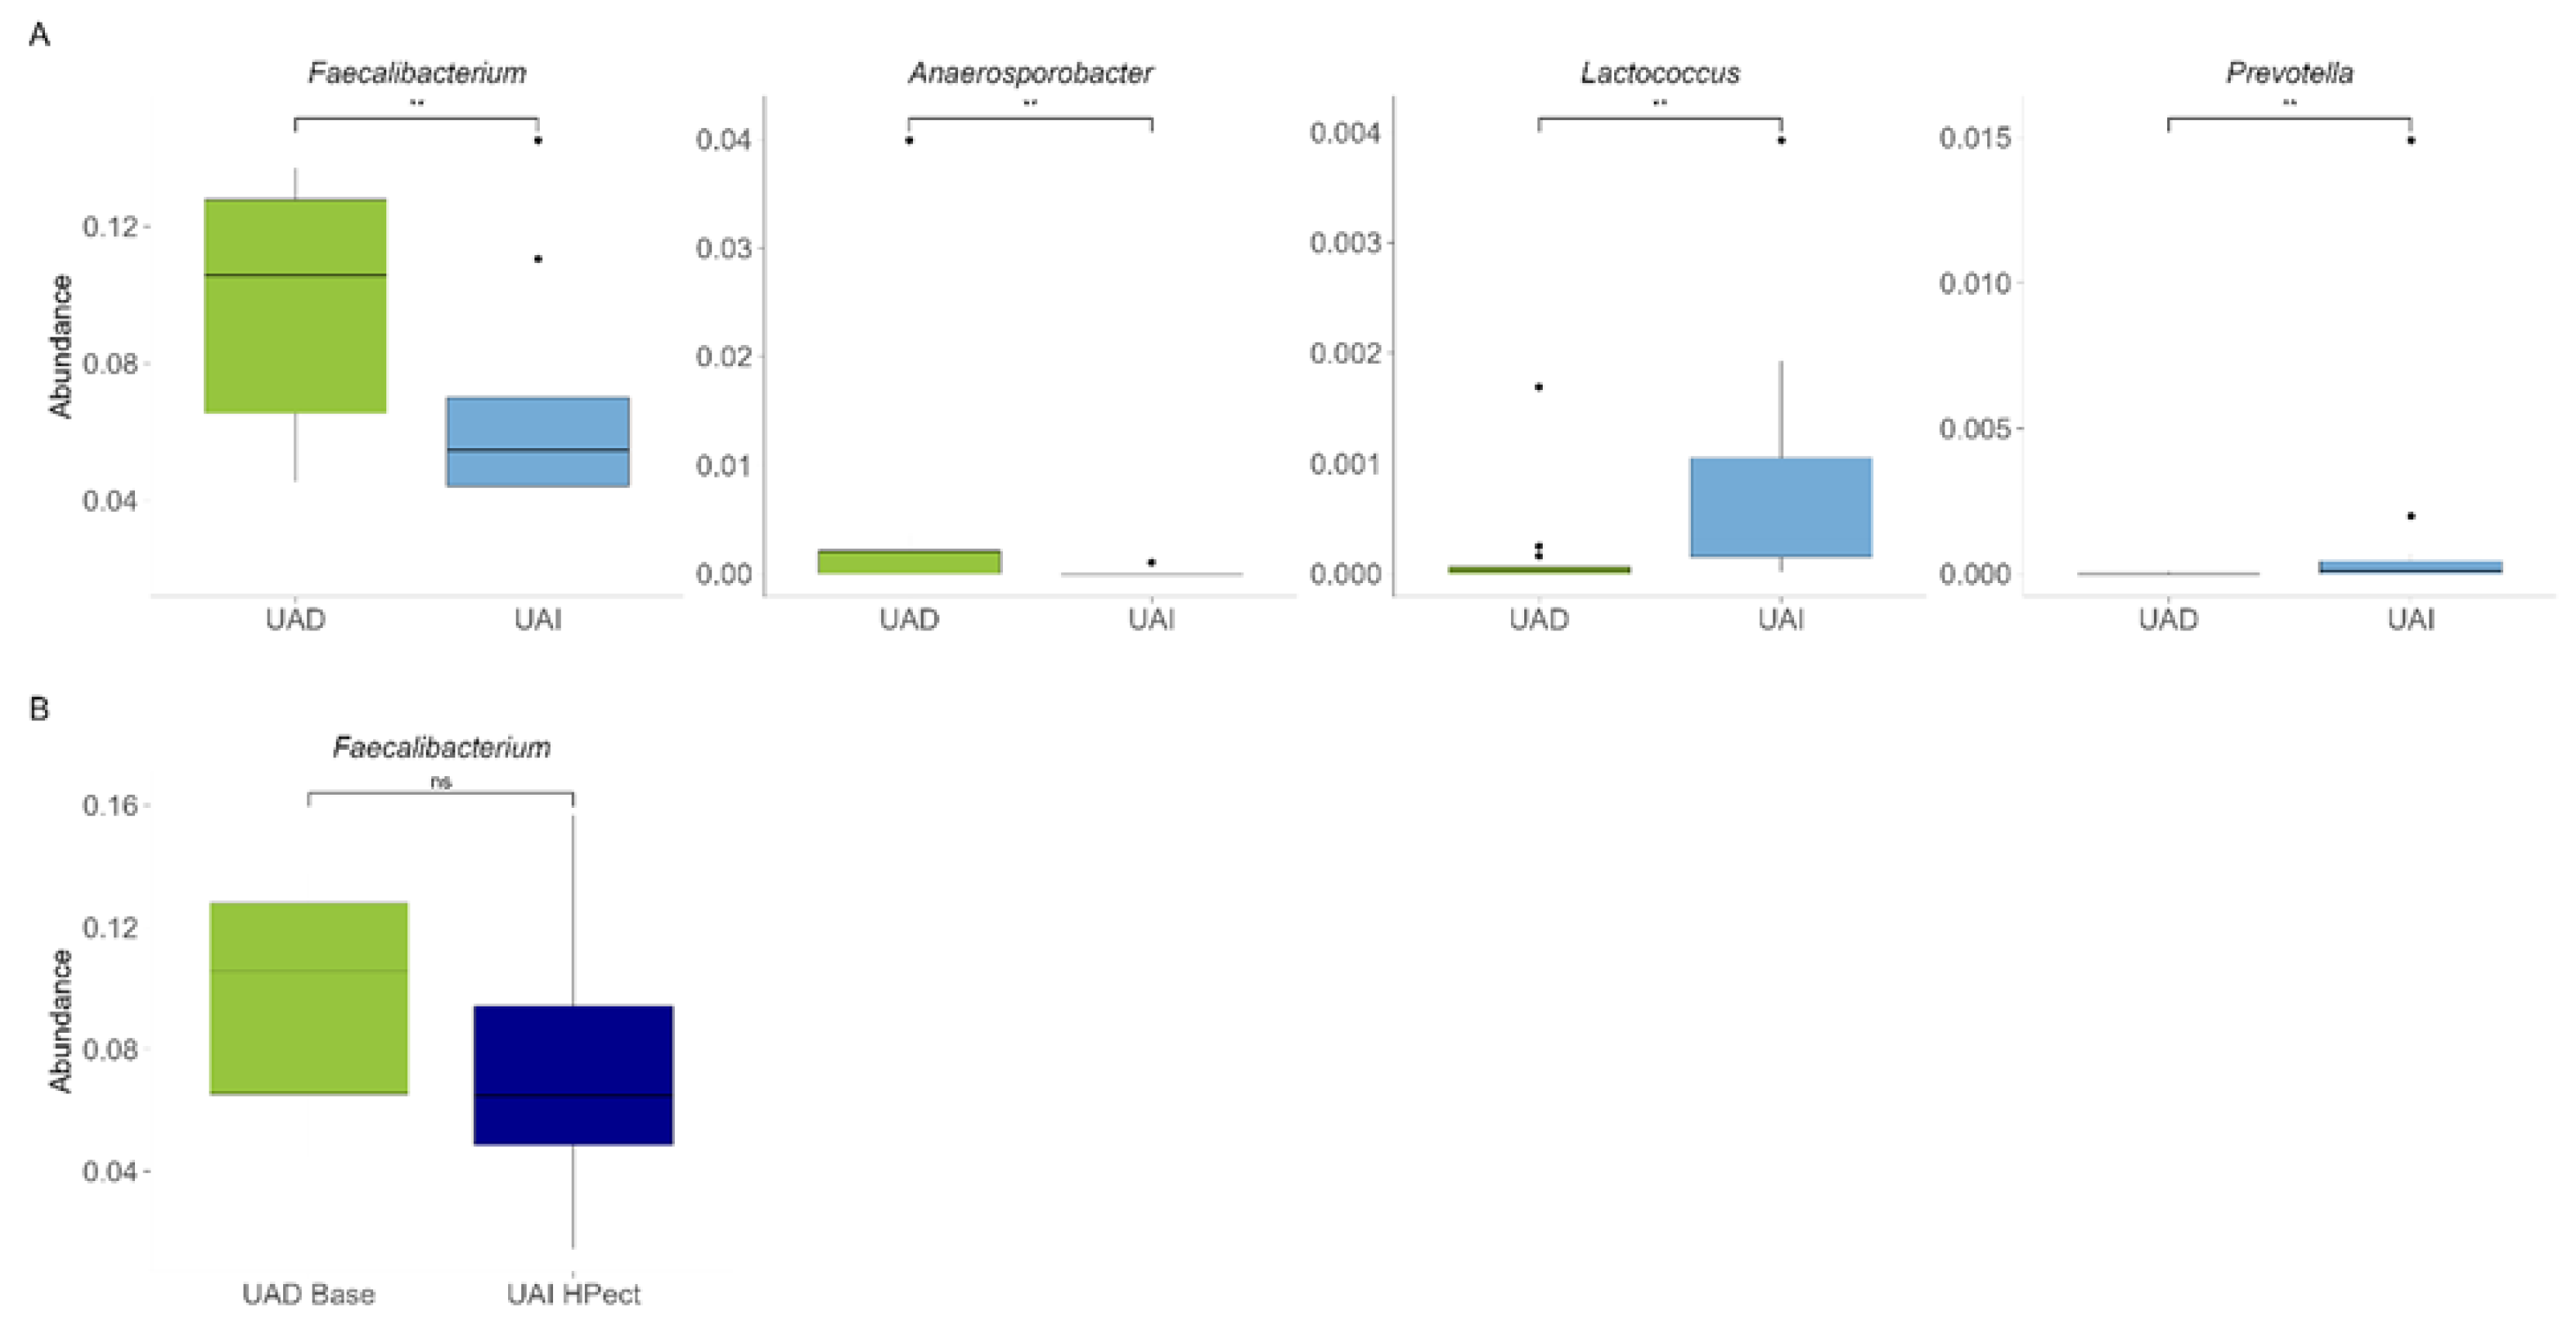
Figure 2.
Heatmap of the ten most abundant bacterial genera in UAD and UAI groups at the baseline period of the study.
Figure 2.
Heatmap of the ten most abundant bacterial genera in UAD and UAI groups at the baseline period of the study.
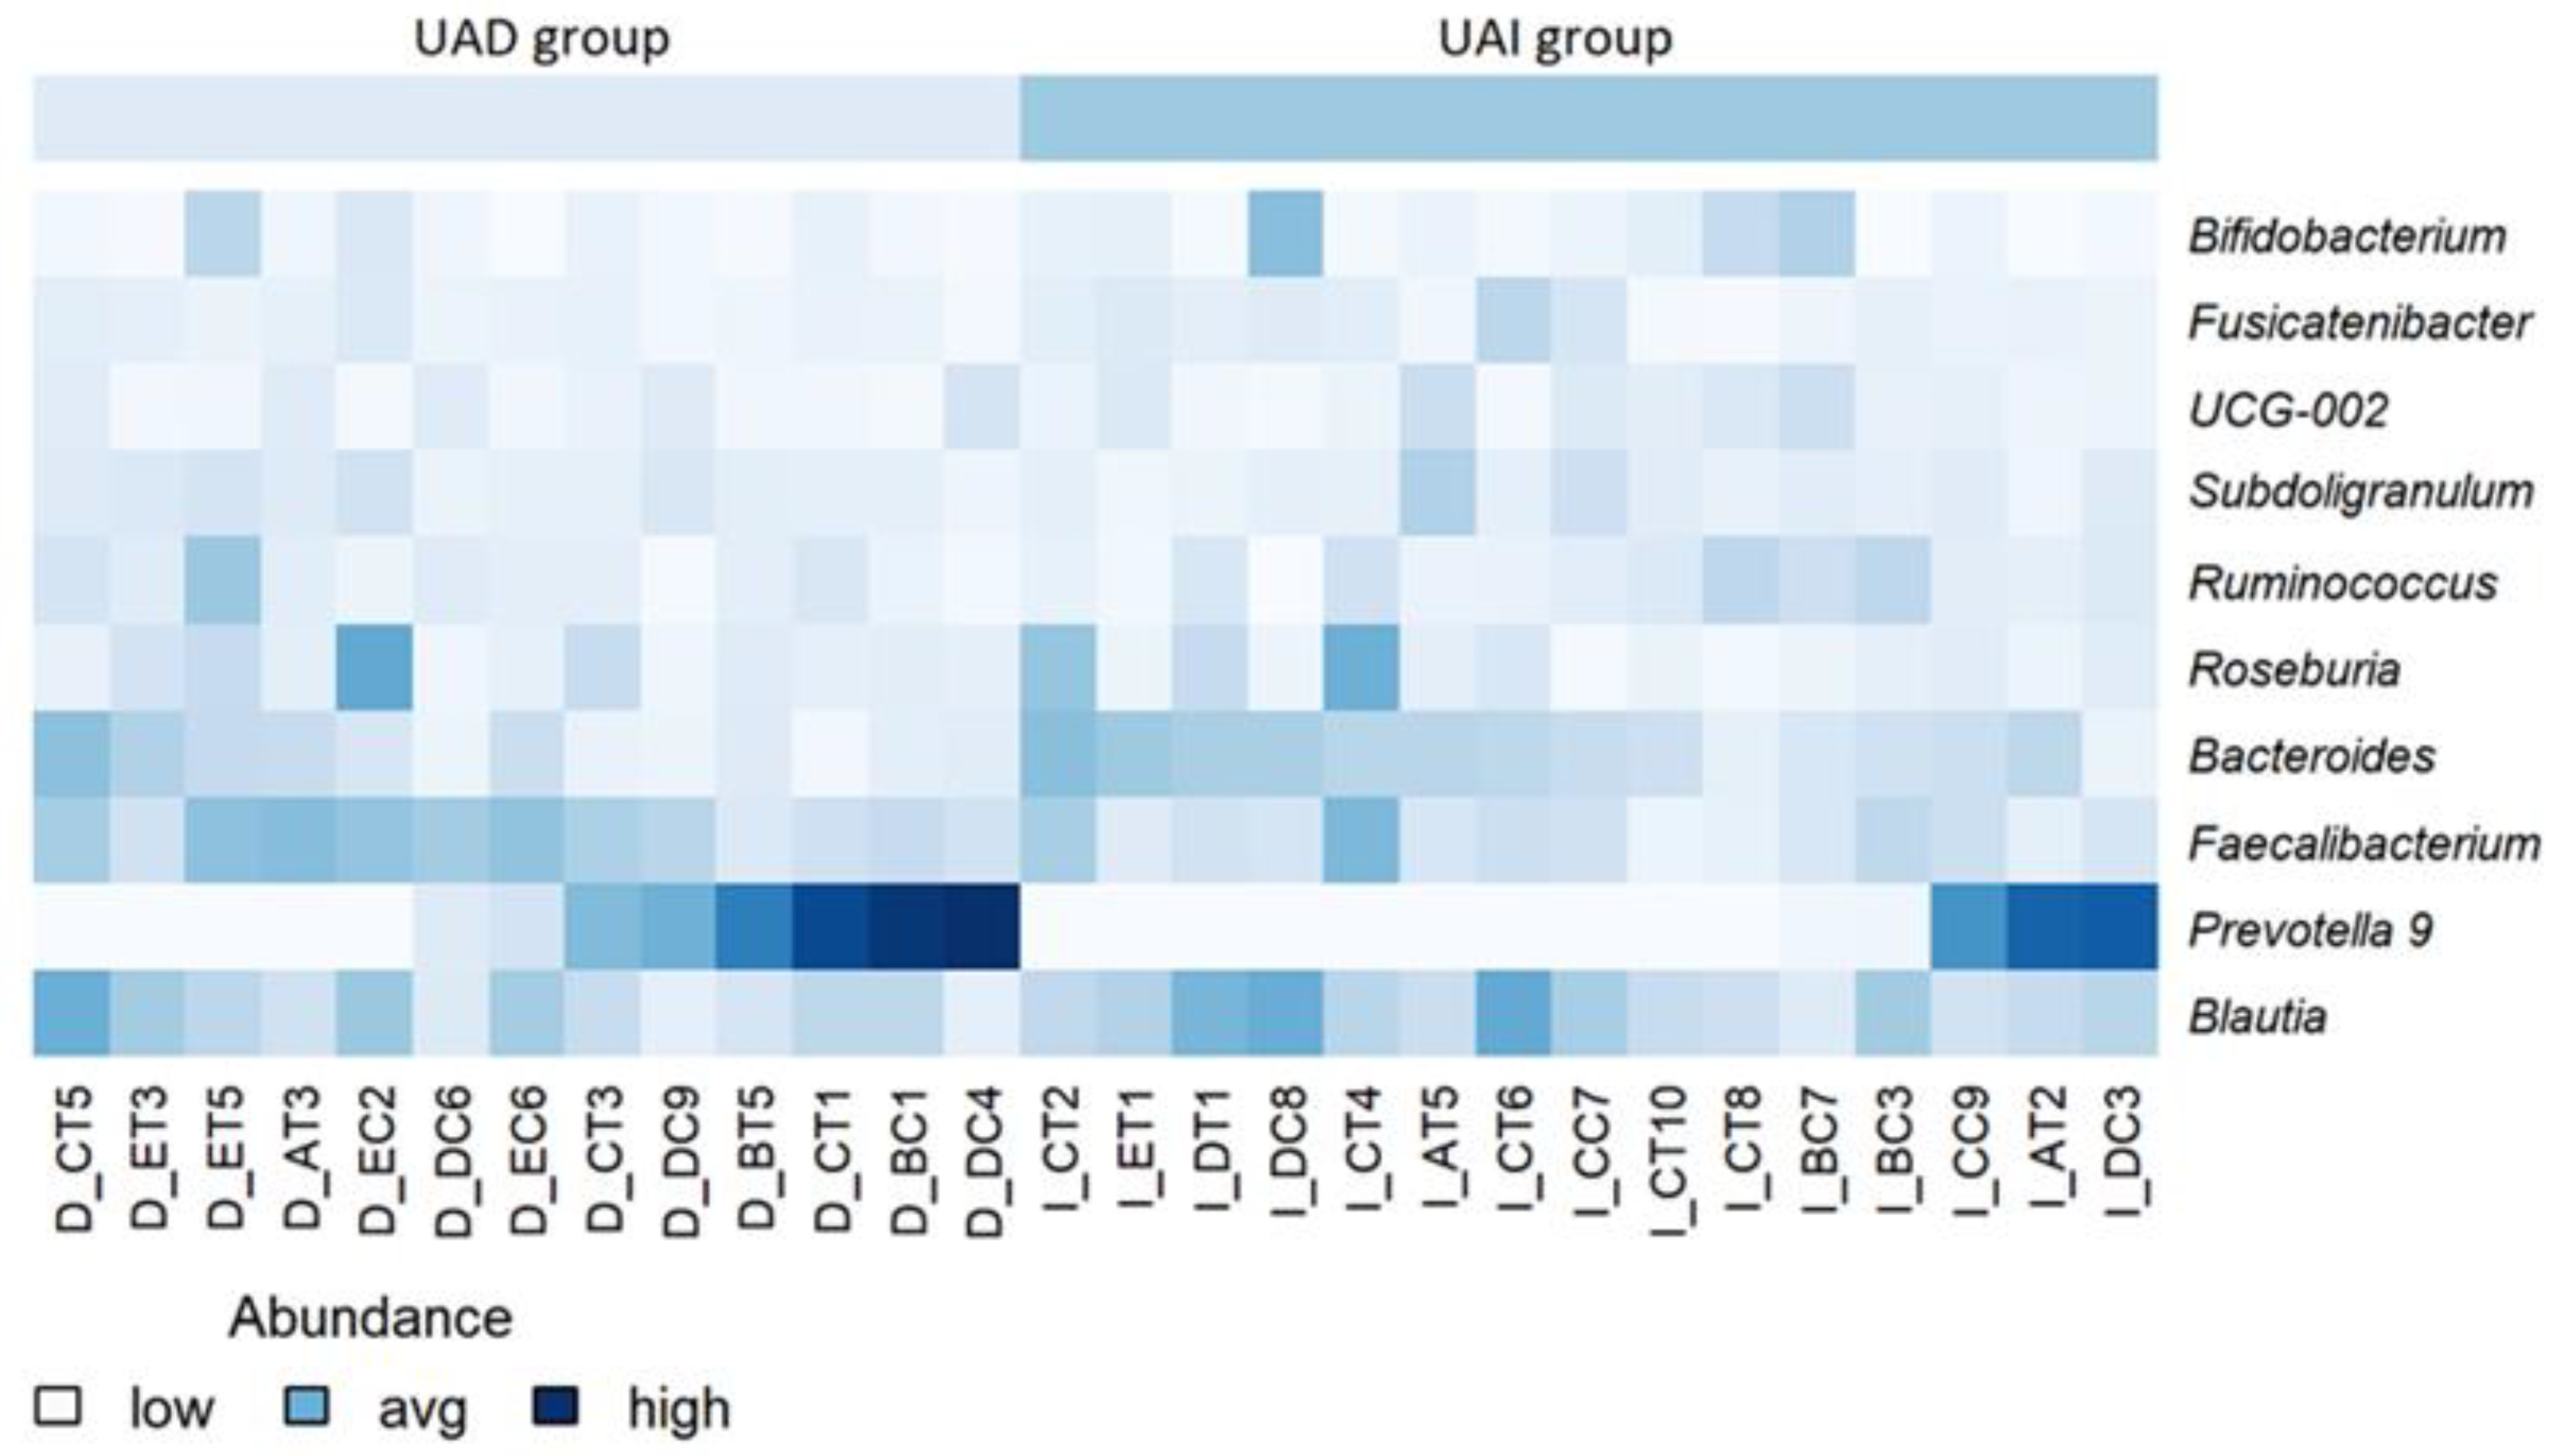
Figure 3.
Relative abundances of Bacteroides and Prevotella 9 in UAD and UAI groups before and after HPect consumption. The Wilcoxon signed-rank test was performed, and outliers were shown. * p-value < 0.05. p-values 0.027, 0.12, 0.34, and 0.036 respectively.
Figure 3.
Relative abundances of Bacteroides and Prevotella 9 in UAD and UAI groups before and after HPect consumption. The Wilcoxon signed-rank test was performed, and outliers were shown. * p-value < 0.05. p-values 0.027, 0.12, 0.34, and 0.036 respectively.
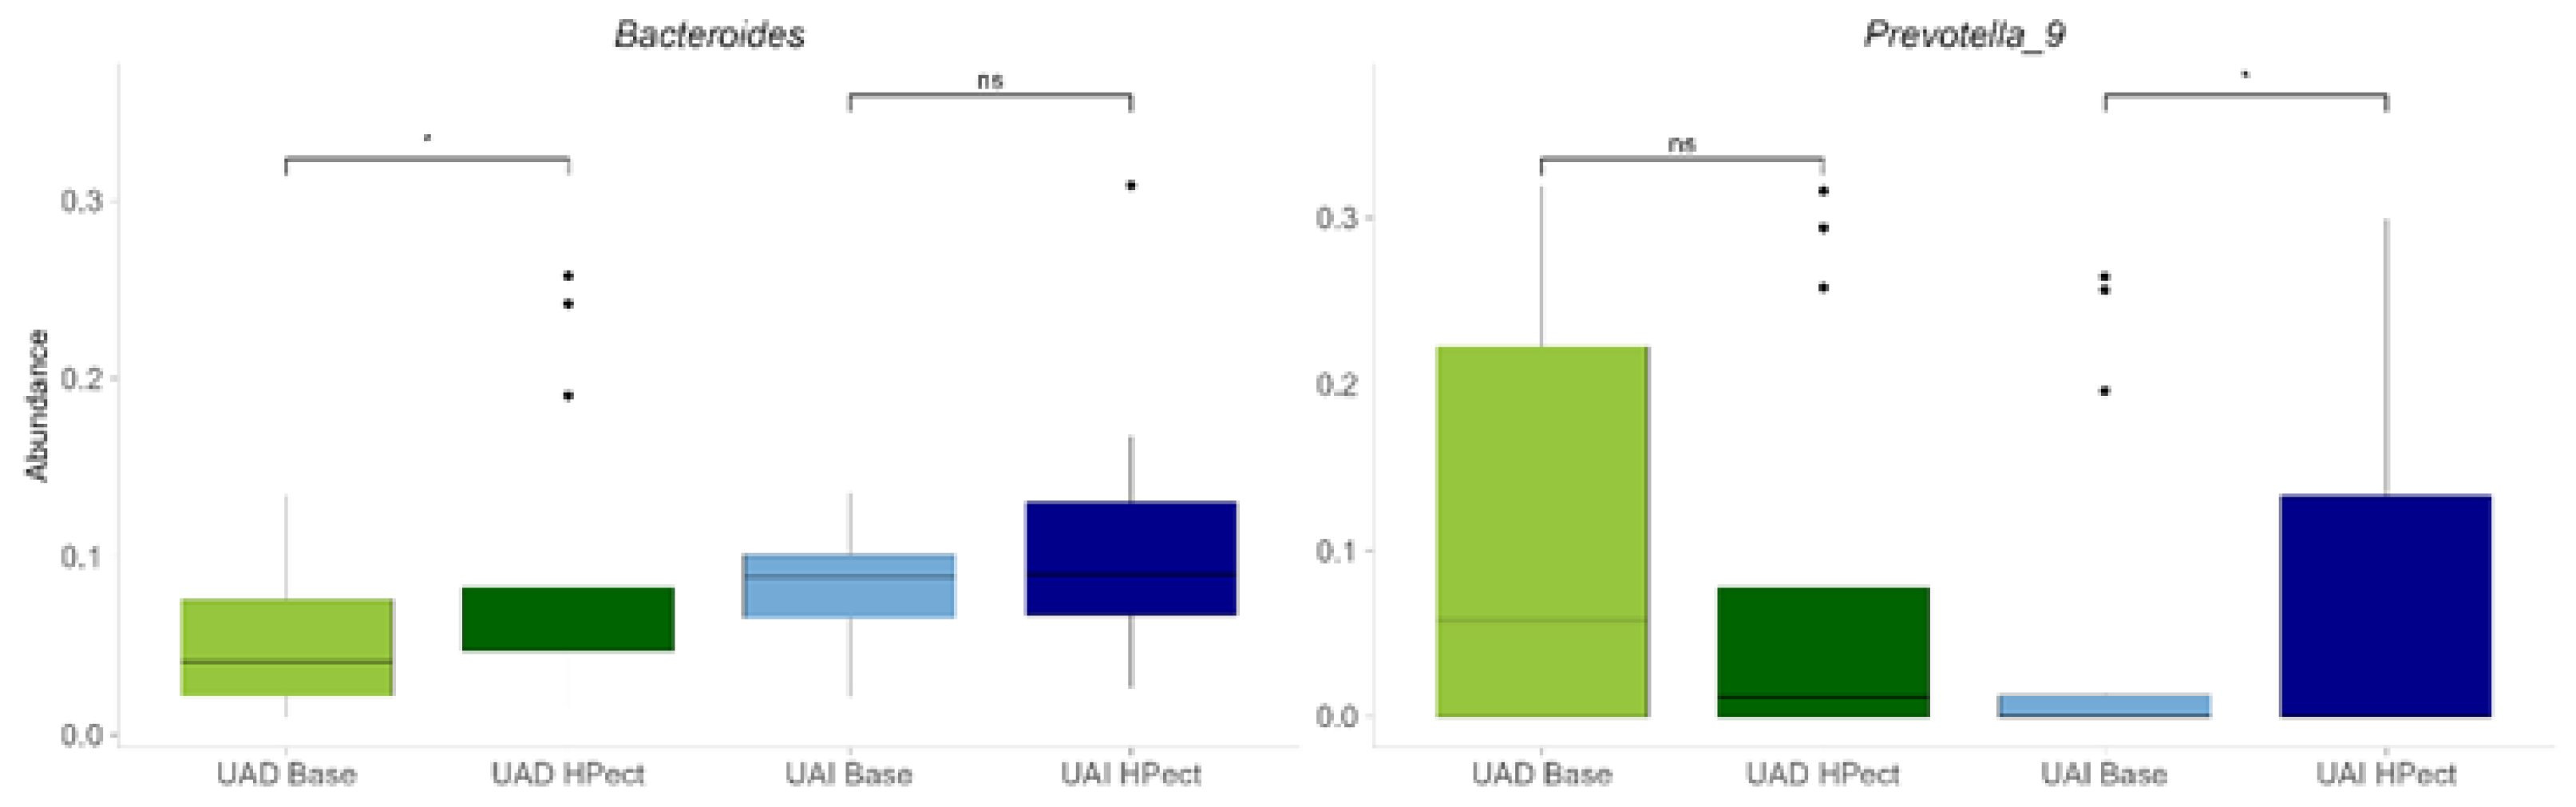
Figure 4.
The changes in relative abundance of bacterial genera after HPect intake in the UAI group. The Wilcoxon signed-rank test was performed, and outliers were shown. ** p-value < 0.01. p-values 0.00043, 0.0084, 0.0067, 0.0021 and 0.008 respectively.
Figure 4.
The changes in relative abundance of bacterial genera after HPect intake in the UAI group. The Wilcoxon signed-rank test was performed, and outliers were shown. ** p-value < 0.01. p-values 0.00043, 0.0084, 0.0067, 0.0021 and 0.008 respectively.
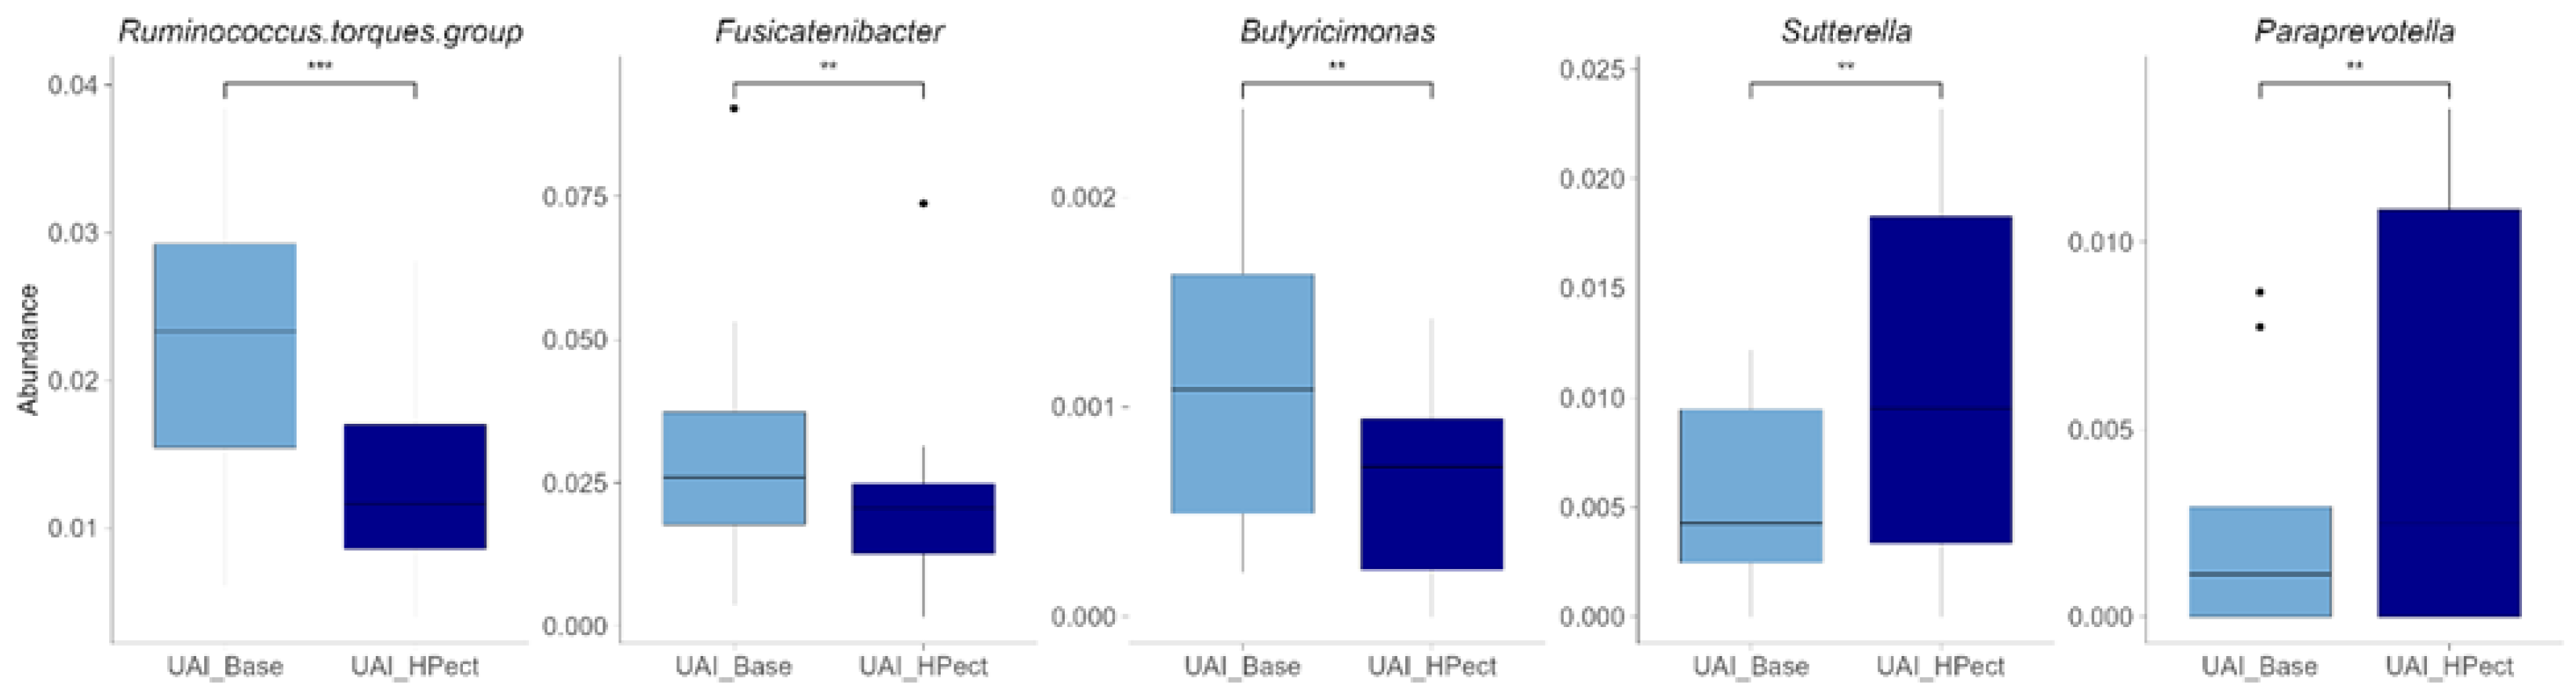
Figure 5.
The changes in the realtive abundance of bacterial genera after HPect intake in the UAD group. The Wilcoxon signed-rank test was performed, and outliers were shown. ** p-value < 0.01. p-values 0.0061 and 0.0034 respectively.
Figure 5.
The changes in the realtive abundance of bacterial genera after HPect intake in the UAD group. The Wilcoxon signed-rank test was performed, and outliers were shown. ** p-value < 0.01. p-values 0.0061 and 0.0034 respectively.
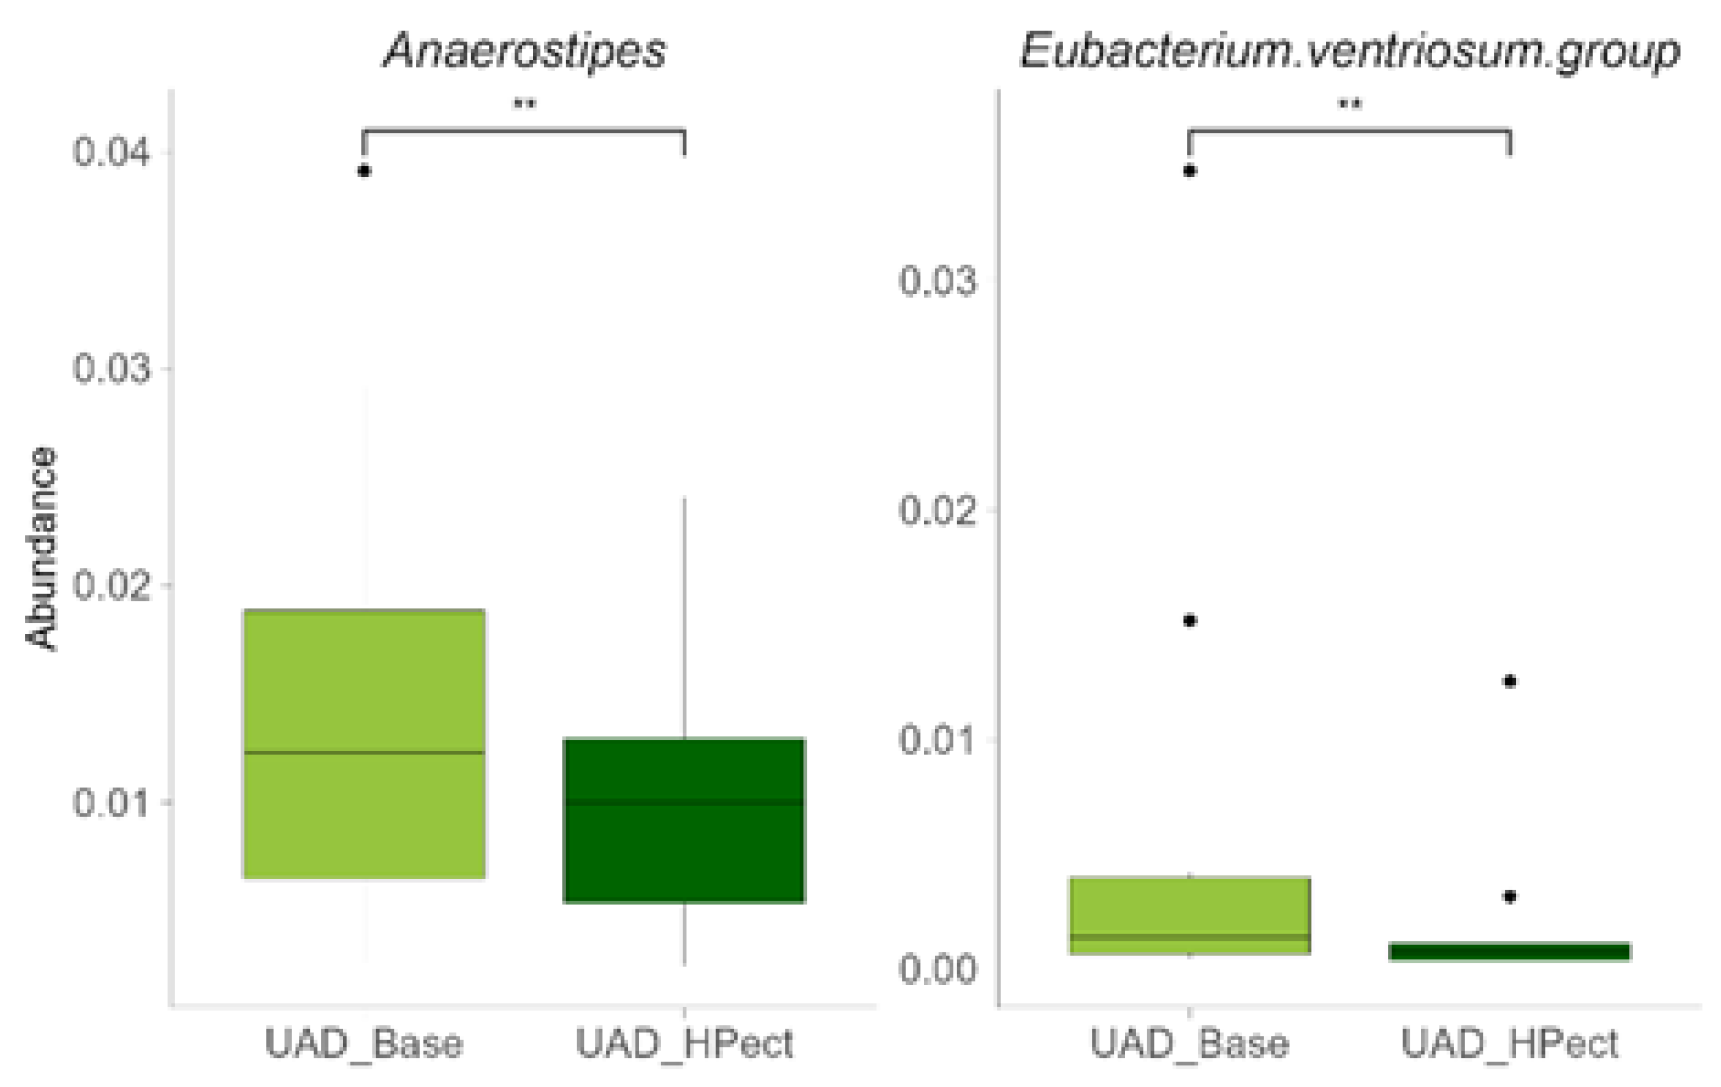

Table 1.
Baseline period daily energy and macronutrient intake.
| UAD group (n=13) | UAI group (n=15) | |
|---|---|---|
| Energy (kcal/day) | 1888.8 (±497.0) | 1809.7 (±561.1) |
| Fiber (g/day) | 23.9 (±8.4) | 24.2 (±10.9) |
| Carbohydrates (g/day)/(%) | 218.4 (±57.1)/46.0 | 210.8 (±66.4)/44.7 |
| Fat (g/day) /(%) | 81.2 (±31.9)/38.0 | 77.0 (±35.3)/37.3 |
| Protein (g/day) /(%) | 74.8 (±27.1)/16.0 | 79.4 (±35.9)/18.0 |
Data is presented as average (±stdev). Macronutrients are given as a percentage of daily energy expenditure of regular diet periods (no smoothie consumption). Distribution was compared between the groups using the Wilcoxon rank-sum test. UAD – group where uric acid decreased; UAI– group where uric acid increased.
Disclaimer/Publisher’s Note: The statements, opinions and data contained in all publications are solely those of the individual author(s) and contributor(s) and not of MDPI and/or the editor(s). MDPI and/or the editor(s) disclaim responsibility for any injury to people or property resulting from any ideas, methods, instructions or products referred to in the content. |
© 2024 by the authors. Licensee MDPI, Basel, Switzerland. This article is an open access article distributed under the terms and conditions of the Creative Commons Attribution (CC BY) license (http://creativecommons.org/licenses/by/4.0/).
Copyright: This open access article is published under a Creative Commons CC BY 4.0 license, which permit the free download, distribution, and reuse, provided that the author and preprint are cited in any reuse.


