
Submitted:
22 November 2024
Posted:
26 November 2024
You are already at the latest version
Abstract
This study identifies hydraulically amplified self-healing electrostatic (HASEL) transducers as electricity generators by assessing their capability to convert mechanical energy into electrical energy, contrary to their conventional role as actuators. HASELs are soft, variable-capacitance transducers inspired by biological muscles, which were developed to mimic the flexibility and functionality of natural muscle tissues. This research characterizes HASELs as generators by reversing their energy conversion mechanism—applying mechanical energy to deform the HASEL to generate electrical energy. The study includes analytic modeling and empirical evaluation, thereby assessing the practical laboratory performance of HASELs as electricity generators. Outcomes of the study include the following: (i) up to 2.5 mJ per cycle per HASEL pouch of positive net energy generation in experimental testing—corresponding to an energy density of 2.0 mJ cm−3; (ii) a maximum theoretical conversion of 5.2 mJ cm−3; (iii) the electromechanical characteristics governing efficient conversion; and (iv) future design optimization strategies to enhance the effectiveness of HASELs as electricity generators—potentially broadening their applicability and utility in research fields such as renewable energy and general adaptive electricity generation.
Keywords:
energy conversion
; energy transducers
; energy generation
; soft robotics
; distributed embedded energy conversion
; DEEC-Tec
; HASELs
1. Introduction
Electrostatic transducers utilizing the principle of variable capacitance to convert mechanical energy to electrical energy or vice versa can be used as actuators, sensors, or energy generators. In particular, an electrostatic transducer can generate electricity when an external mechanical load physically changes its capacitance and induces a change in either the transducer’s charge or voltage [1,2,3]. This electrostatic energy harvesting process requires an active priming voltage, unlike electromagnetic generators, which convert mechanical work to electric energy passively by induction. However, electrostatic transducers are particularly promising as an energy conversion method because they can be directly embedded into flexible structures, enabling energy conversion for applications such as flexible wave energy converters [3,4,5,6,7] where rigid and bulky electromagnetic transducers are not possible.
1.1. Dielectric Elastomer Actuators and Generators
Flexible electrostatic energy generators consist of electrodes on a compliant substrate. External mechanical work deforms the substrate, changing the distance between and/or area of the electrodes, therefore varying its capacitance. Dielectric elastomer generators (DEGs) are a type of electrostatic generator, also known as electro-active polymers, that have been widely explored and consist of a thin elastomer membrane with electrodes coated on either surface [1,2,8]. They generate electricity by amplifying the energy of a small priming voltage. First, in-plane tensile forces stretch the membrane and reduce a DEG’s elastomer thickness via the Poisson effect, leading to an increase in capacitance. After the priming voltage is applied, the elastomer is allowed to relax, capacitance decreases, and the mechanical energy of relaxation is converted to an electric current, which leaves the generator with greater energy than the initial priming electricity. In actuator mode, DEGs are known as dielectric elastomer actuators (DEAs), and when subjected to a high-voltage, they mechanically deform [9,10,11].
As energy generators, DEGs have been built in a wide range of deformation configurations, including uniaxial, equibiaxial, prestretched circular, and conical-shaped membranes [2], and have been used to harvest mechanical energy from waves [5,12,13,14], flows [15], and human motion [16]. In addition to DEGs, other types of electrostatic energy generators have been developed to improve the conversion between mechanical work and electrical energy. For example, dielectric fluid transducers have been developed to increase conversion efficiency and use mechanically driven fluid pressure to deform a membrane and separate the flexible electrode [17]. Hexagonal distributed embedded energy converters (HexDEECs) [18] have been developed as individual unit cells to create an energy converter metamaterial, where each HexDEEC consists of a hyperelastic force amplification frame with an air gap between flexible electrodes. Note that electrostatic energy generators are susceptible to failure by dielectric breakdown, which occurs when high electric fields overcome the breakdown voltage of the insulator separating the electrodes. DEGs are particularly susceptible to dielectric breakdown due to their thin elastomer membrane, and breakdown at a single location causes failure of the entire DEG by creating a short circuit between the electrodes [1,19].
1.2. Hydraulically Amplified Self-Healing Electrostatic Actuators and Generators
Hydraulically amplified self-healing electrostatic (HASEL) transducers were developed to overcome the limitations of DEAs. HASEL transducers consist of two layers of inextensible but flexible polymers that are heat-sealed to form a pouch filled with dielectric oil. Flexible electrodes are applied to the exterior of the two pouch sides, creating a compliant parallel-plate pouch capacitor [20]. A high voltage can be applied to a HASEL’s electrodes, causing its electrodes to “zip together” (via Maxwell electrostatic forcing), yielding a bulk contraction of the HASEL. The HASEL acts as an actuator in this case. Because HASELs have an internal fluid that moves during actuation, they can achieve larger mechanical actuation forces than a DEA with the same displacement because of hydraulic amplification.
The HASEL acronym refers to the benefits of using a dielectric fluid instead of a dielectric elastomer: hydraulic amplification and self-healing from dielectric breakdown [20,21]. HASELs can self-heal after dielectric breakdown because their dielectric fluid diffuses the local breakdown into the bulk volume of that same dielectric fluid. As actuators, HASELs are well suited for soft robotic applications, as they have similar mechanical efficiency to biological muscle, high force output, low stiffness, and high-frequency bandwidth [21]. To that end, HASELs have been used for a range of bio-inspired robotic actuation, including undulatory swimmers [22,23], jellyfish [24], grippers [25,26], and prostheses [27]. As variable capacitors, HASELs can also be used for sensing and energy generation. Indeed, a HASEL’s sensing capability has been implemented for haptic feedback [28] and self-sensing of position during actuation [26,29]. Nonetheless, while previous work into HASELs acting as electrostatic generators has occurred [30], their energy generation capabilities have not been experimentally determined.
This study presents the energy generation capability of contracting Peano-HASEL electrostatic transducers. The study experimentally generates electrical energy from commercially purchased HASEL transducers using a constant-voltage process and compares the results against an established analytic model of a HASEL’s behavior (e.g., force, stroke, voltage) [21,31]. Thus, this study reveals the net energy recovered from HASELs as a function of their priming voltage and their associated mechanical work input, quantifying their energy generation performance and efficiency. In addition, the study quantifies the accuracy of an existing HASEL analytic model to predict HASEL energy harvesting conversion performance. These results provide the first analysis of HASEL energy generation performance—results that will enable further research into the applied use of HASELs as electrical generators.
1.3. Paper Outline
The Materials and Methods in Section 2 presents the HASEL analytic model, the proposed energy generation method, the experimental energy harvesting platform, and high-voltage energy harvesting circuitry. Section 3 presents the results, including the energy generated by the HASELs characterized in this study, their mechanical efficiency, and their comparison with the analytic model. Concluding remarks are discussed in Section 4.
2. Materials and Methods
This study identifies the effectiveness and efficiency of HASEL transducers to generate electricity through analytic modeling and experimental characterization. In this section, an analytic model originally developed to describe a HASEL actuator’s performance [31] is adapted to predict its electrical generative performance. A constant-voltage (CV) energy harvesting method is proposed and implemented in an experimental test bed. To complete their characterization, the constitutive relationships governing a HASELs force, stroke, and voltage were measured for the HASEL used in this study.
2.1. Analytic Model of HASEL Electrostatics
HASELs are compliant variable capacitors made from pouches of dielectric fluid with opposing flexible electrodes painted outside the pouch. A photo of a two-pouch HASEL and the schematic for a single HASEL pouch are shown in Figure 1. A HASEL’s capacitance changes when the distance between its two electrodes changes via fluid movement in and out of the electrode-covered region of the pouch. In this section, the quasi-static analytic model of HASEL actuators, as derived by Kellaris et al. [31], is recontextualized to predict HASELs’ electricity generation performance. The model relates a HASEL’s capacitance—derived from the theory of parallel plate capacitors—to the maximum amount of electrical energy a HASEL transducer can produce. The analytic model is quasi-static, assuming that zipping and unzipping of the HASEL pouch occurs slowly enough that viscous and inertial effects within the dielectric oil can be neglected.
The HASEL pouch fluid-filled region is assumed to be made from cylindrical segments, which is valid when (i) the pouch zips homogeneously along its width and (ii) the fluid pressure inside the pouch is much greater than the Maxwell stress induced by the electric field. When the fluid makes cylindrical sections, the HASEL’s contraction can be parameterized by a single degree of freedom, —the pouch’s “zip angle”—which is shown in Figure 1b.
The electrical energy that a variable capacitor can generate is governed by Equation (1), which depends on the change in capacitance, , and the priming voltage, V.
The HASEL’s capacitance is determined by Equation (2), an integral over the surface projection of the electrodes onto the mid-line, S, of the capacitance of each material in the capacitor stack: the solid dielectric film with thickness and absolute permittivity and the liquid dielectric with its corresponding parameters and . The thickness of the fluid is a function of the internal pouch zipping angle, .
The maximum capacitance is reached when the HASEL is fully zipped and there is no fluid dielectric between the electrodes in the capacitor stack, Equation (3), where is the length of the electrode region and w is the pouch width into the page in Figure 1b.
For a constant applied voltage, energy generated is maximized with the largest change in capacitance. If the capacitance change between zipped and unzipped configurations is large, such that , then approximates , and the maximum theoretical energy can be defined by Equation (4).
The capacitance at an arbitrary zip state is needed to predict the energy harvesting performance between two partially zipped states. It was assumed that only the zipped portion of the electrodes contributes to the HASEL’s capacitance, , because the electric field between the electrodes in the unzipped region rapidly decays due to the fluid volume [30,31]. Therefore, the capacitance as a function of the zip angle is Equation (5), where is the length of the zipped portion of the electrode defined by Equation (6), in which A is the volume of the fluid pouch and is the arc length of the undeformed pouch [31]. Then, the theoretical electrical energy that the HASEL can produce between any two zip angles and is given by Equation (7).
2.2. Energy Generation Method
This study evaluates a CV method to characterize the HASEL’s energy generation capability. The CV method is a triangular energy harvesting method, so-called because the cycle creates a triangle in the charge-voltage plane, Figure 2a, bounded by the maximum and minimum capacitance and dielectric breakdown limit [2,33]. In the QV plane, the capacitance extrema form the left and bottom limits of the cycle, where the slope of the diagonal lines is the inverse of capacitance, . The dielectric breakdown limit informs the maximum voltage that can be applied. The area enclosed by these limits is the maximum energy that the HASEL electrical generator can produce, e.g., the shaded region in Figure 2a. The CV method was chosen for this study due to its high energy density and simplicity of implementation. Also known as a charge pump, this method forces current to flow from the HASEL when its capacitance decreases under constant voltage. The proposed HASEL CV energy harvesting method has three steps, visualized in Figure 2:
- Priming Phase (A-B): Apply priming voltage to the HASEL using a precharged in-parallel capacitor. Applying the priming voltage causes the HASEL electrodes to zip together and increase the capacitance.
- Generation Phase (B-C): While held at constant voltage, stretch the HASEL to decrease the capacitance and generate charge that flows onto the in-parallel capacitor.
- Discharge Phase (C-A): Disconnect the HASEL from the in-parallel capacitor and discharge the HASEL to ground at the lowest capacitance state.
HASEL transducers are unique among dielectric fluid transducers because the dielectric fluid is contained in a constant-volume pouch rather than pumped between a reservoir and the device [30]. HASEL’s constant-volume pouch is beneficial because it eliminates viscous losses from pumping fluid through valves. However, it introduces a challenge for generation because the typical priming stage for electrostatic transducers is not applicable. Typically, the capacitance is increased at null voltage, and then the priming voltage is applied. A HASEL’s electrodes cannot be brought together to increase capacitance without an applied voltage because the fluid cannot be removed from between the electrodes independently. The proposed CV process for HASELs involves zipping and priming simultaneously to produce the curved side of the triangle in the QV diagram shown in Figure 2a. As a result, the curved triangle has less area than that of the typical process (straight-edged triangle), in which priming occurs at a constant, maximum capacitance.
2.3. Energy Generation Experimental Platform
The energy generated with the proposed CV method was calculated by measuring the voltage throughout the energy harvesting cycle for varying priming voltages (3, 4, 5, and 6 kV) and applied forces generated by hanging weight (2, 5, 10, and 20 N). The experimental platform used to characterize HASEL energy harvesting performance is shown in Figure 3. This study used a two-pouch Peano-HASEL contracting actuator purchased from Artimus Robotics. The manufacturer’s rated unrestricted stroke is 1.6 mm, and the maximum force (at zero stroke) is 15 N [32]. The maximum and minimum capacitance of the HASEL used in this study were measured as pF and pF using a Keysight E4990A Impedance Analyzer. The exact capacitance range of every HASEL varies due to minor differences caused during manufacturing processes.
Constant weights were applied to unzip the HASEL during the Generation Phase (B-C in Figure 2). The weights were applied through several pulleys to prevent out-of-plane forces and movement interference. Displacement was measured with a Polytec VibroFlex Neo VFX-I-110 single-point laser Doppler vibrometer (LDV) with a mirror, which deflects the beam to measure the vertical displacement. The HASEL and mirror were fixed to a floating-top optical table to prevent external vibration from interfering with the LDV measurement. Each generation cycle was repeated times, and the mean voltages and displacements were used to calculate the electrical energy generated and the mechanical work that was expended.
The energy harvesting circuit used in this study, shown in Figure 4, was adapted from a CV circuit used to characterize a pumping dielectric fluid transducer [17]. High voltage was supplied by a Pico 5VV10-P amplifier, which required a preload resistor in parallel with the supply (), and a load resistor (), to stabilize the output. High voltage control was achieved through high-voltage reed relays S1, S2, and S3 (Sensata-Cynergy3 DAT72415P), switched using a dSpace MicroLabBox real-time machine. To implement the CV method, an in-parallel capacitor, , both applies the priming voltage to the HASEL and stores the generated electricity which leaves the HASEL. The in-parallel capacitor ( nF) was chosen to be at least ten times larger than the HASEL’s to approximate a CV cycle [2]. Resistors , , and (where ) limit the transient peak current to the instrumentation limits when switching occurs.
To monitor the voltage on the in-parallel capacitor, , throughout the energy harvesting cycle, a 6000:1 voltage divider was created with a Fluke 80K-40 high-voltage probe. The in-parallel capacitor voltage was measured instead of the HASEL directly to mitigate the capacitor discharging through the probe and interfering with the measurement. Because has much higher capacitance than the HASEL, the RC time constant, Equation (8), was large enough relative to the cycling period to have a negligible effect.
The voltages at states A, B, and C—between the phases in the energy harvesting cycle described in Section 2.2—were used to calculate the generated energy. The generation cycles were approximately 0.5 s long, and the HASEL was allowed to rest in the discharged state between cycles to control for the effect of cycling frequency. A representative plot of the voltage on the in-parallel capacitor, , is shown in Figure 5. Before the cycle, was charged to the nominal priming voltage, kV, with the high-voltage power supply. Then, was connected to the HASEL to apply the priming voltage, and the in-parallel capacitor and HASEL reached the same voltage, . During the Generation Phase (B-C), the HASEL and have the same voltage, which rises to when the HASEL is stretched by the weight because the HASEL capacitance decreases. The voltage has negative drift after state C because charges were lost to the measurement circuit; these errors were corrected in the data analysis by adding the voltage discharged through the measurement resistor, .
The average voltage at each state was used to generate an experimental QV plot, as shown in Figure 2a, and to calculate the electrical energy, . The charge held on the HASEL at each state was calculated using the relationship between a capacitor’s voltage, charge, and capacitance: . However, because the instantaneous capacitance of the HASEL is unknown during the cycle, the charge was computed relative to . The charge on the HASEL after priming, , equals the number of charges moved off the in-parallel capacitor during the Priming Phase (A-B); see Equation (9). Likewise, the charge pumped from the HASEL onto the in-parallel capacitor during the Generation Phase (B-C), , equals the charge that was accumulated on ; see Equation (10). Then, the charge on the HASEL at state C is the difference between the charge held after priming and the charges moved by generation; see Equation (11).
An experimental QV diagram was created for each applied weight using the measured voltages and , and the charge on the HASEL was calculated with Equation (9) and Equation (11). Then, the net energy generated by the HASEL was calculated by summing the energy consumed or generated in each phase according to (12). The electrical energies consumed or generated in each phase were found by numerical integration in the QV plane using the measured values, e.g., the energy used to prime the HASEL is . The analytic expression for converted electricity, Equation (7), cannot be used with the experimental data because the instantaneous capacitance of the HASEL is unknown during the energy harvesting cycle; the maximum capacitance depends on the priming voltage, and the minimum depends on the applied weight. Further, note that in this study, the output electrical energy was returned to the in-parallel priming capacitor, measured, and discharged via a grounding electrode. In an energy harvesting device made from HASELs, the charges moved during the Generation Phase could be diverted to power an electric load or stored in some form of energy storage device.
2.4. HASEL Constitutive Relation Experimental Platform
The HASEL was also tested to determine the constitutive relations between voltage, stroke (displacement), and force. An experimental platform was created to provide force measurements of the HASEL at different points along the stroke for different priming voltages. The setup consists of a uniaxial tensile actuator with a load cell and a high-voltage power supply. Figure 6a shows the experimental platform used to analyze the HASEL constitutive relations. The platform consists of a stepper motor and ball screw to provide the uniaxial tension and a 3D-printed adaptable mounting to accommodate different transducers. A load cell is mounted in line with the HASEL to measure the applied force. All force data were collected through a LabView cRIO. Measuring very low capacitance at high voltages directly is a challenge due to small RC time constants and coarse resolution with very high resistance probes. The HASEL’s voltage was monitored through an oscilloscope and a custom high-voltage circuit that was designed to measure components with low capacitance values (pF range) at high voltage (1-10 kV), as shown in Figure 6b.
3. Results
3.1. Charge-Voltage Relationship During Energy Harvesting Cycle
The QV diagram compiled for the experiments using the largest weight, 2 kg, is shown in Figure 7. The net energy, i.e., the shaded area in Figure 7a, is bounded by two curves defined by the charges and voltages measured after the Priming and Generation Phases for the different applied voltages (3, 4, 5, 6 kV). A least-squares quadratic trendline, , shows the priming relationship and highlights the curve induced by the HASEL priming and zipping simultaneously. The relationship was best fit by a logarithmic least squares trendline, , chosen because capacitors discharge according to the exponential law .
The net energy is the difference between the energy spent in the Priming Phase and the energy that leaves the HASEL during the Generation and Discharge Phases. The energy spent during the Priming Phase, , is the area under the priming curve shown in Figure 7b. The energy used in the Priming Phase is negative in the net energy calculation Equation (12). The positive contributions to net energy are the areas under the Generation and Discharge curves, , shown in Figure 7c. The area shaded in red is the difference between the observed charge at the end of the Generation Phase (B-C) and the expected charge at the HASEL’s minimum capacitance, , where pF.
The difference between the ideal low-capacitance discharge and the observed discharge means fewer charges were moved during the Generation Phase than were expected, indicating charge leakage loss in the experimental platform. The charge held on the HASEL before the Discharge Phase, , was calculated from the charge moved to during the Generation Phase. Because the HASEL was not measured directly due to challenges described in Section 2.3, the true discharge amount is likely less than that reported in this study, . The reported value assumes that there is a significant charge left on the HASEL after the Generation Phase, which is recovered in the Discharge Phase, and that the charge leakage losses highlighted in red do not affect . If the charge leaked during the Generation Phase, then would be further to the left (without contributing to a larger green area), and the orange area would be reduced. However, these losses are not quantifiable with this study’s experimental platform.
3.2. Net Energy Generation Performance
The mean electrical energy generated by the CV energy harvesting cycle for priming voltages and applied weights is presented in Figure 8 The net energy produced, shown in Figure 8a, increased quadratically with increasing applied voltage following the quadratric trend predicted by the analytic model (Equation (4)). The net energy increased linearly with applied weight. The net energy generated is up to 69% of the theoretical maximum calculated using Equation (4) (3 kV priming voltage, 2 kg applied mass). The maximum energy generated was 5.0 ± 0.36 mJ per cycle (6 kV priming voltage, 2 kg applied mass) which corresponds with an energy density of 2 mJ mL−1 per volume of the HASEL pouches. The volume of the HASEL’s mounting plates was not included in the volume for generality because HASELs with other pouch configurations may be used in an application.
The energy generated during the Generation Phase, , and Discharge Phase, , increase quadratically with voltage for all weights, as shown in Figure 8b (R2 = 0.99). Greater applied force linearly increases the amount of electricity during the Generation Phase (R2 = 0.98). Energy consumed during the Priming Phase, , also increases quadratically with voltage, as shown in Figure 8c (R2 = 0.99). Unlike the other two phases, the energy used during priming is independent of weight because the HASEL was allowed to contract under free conditions.
3.3. Efficiency Is Nonlinear with Mechanical Input
The mechanical efficiency was calculated as the ratio of the output electrical energy to the input mechanical work, Equation (13). The net electrical energy, , was calculated with Equation (12). The mechanical work, , was calculated with Equation (14), where is the applied weight and is the distance traveled during the Generation Phase as the HASEL is unzipped, measured with the LDV. A Pareto frontier plot of mechanical efficiency versus net electrical energy, Figure 9, visualizes the trade-offs between those competing objectives. This plot shows all tested weight and voltage combinations to form the space of realized efficiency and energy density performance. Mechanical efficiency was greatest at high voltage with low applied weight, but larger weights produced more net energy generation. The analytic model presented in Section 2 defines the boundary of the Pareto frontier shown in Figure 9 and captures the tradeoff between mechanical efficiency and net energy generation.
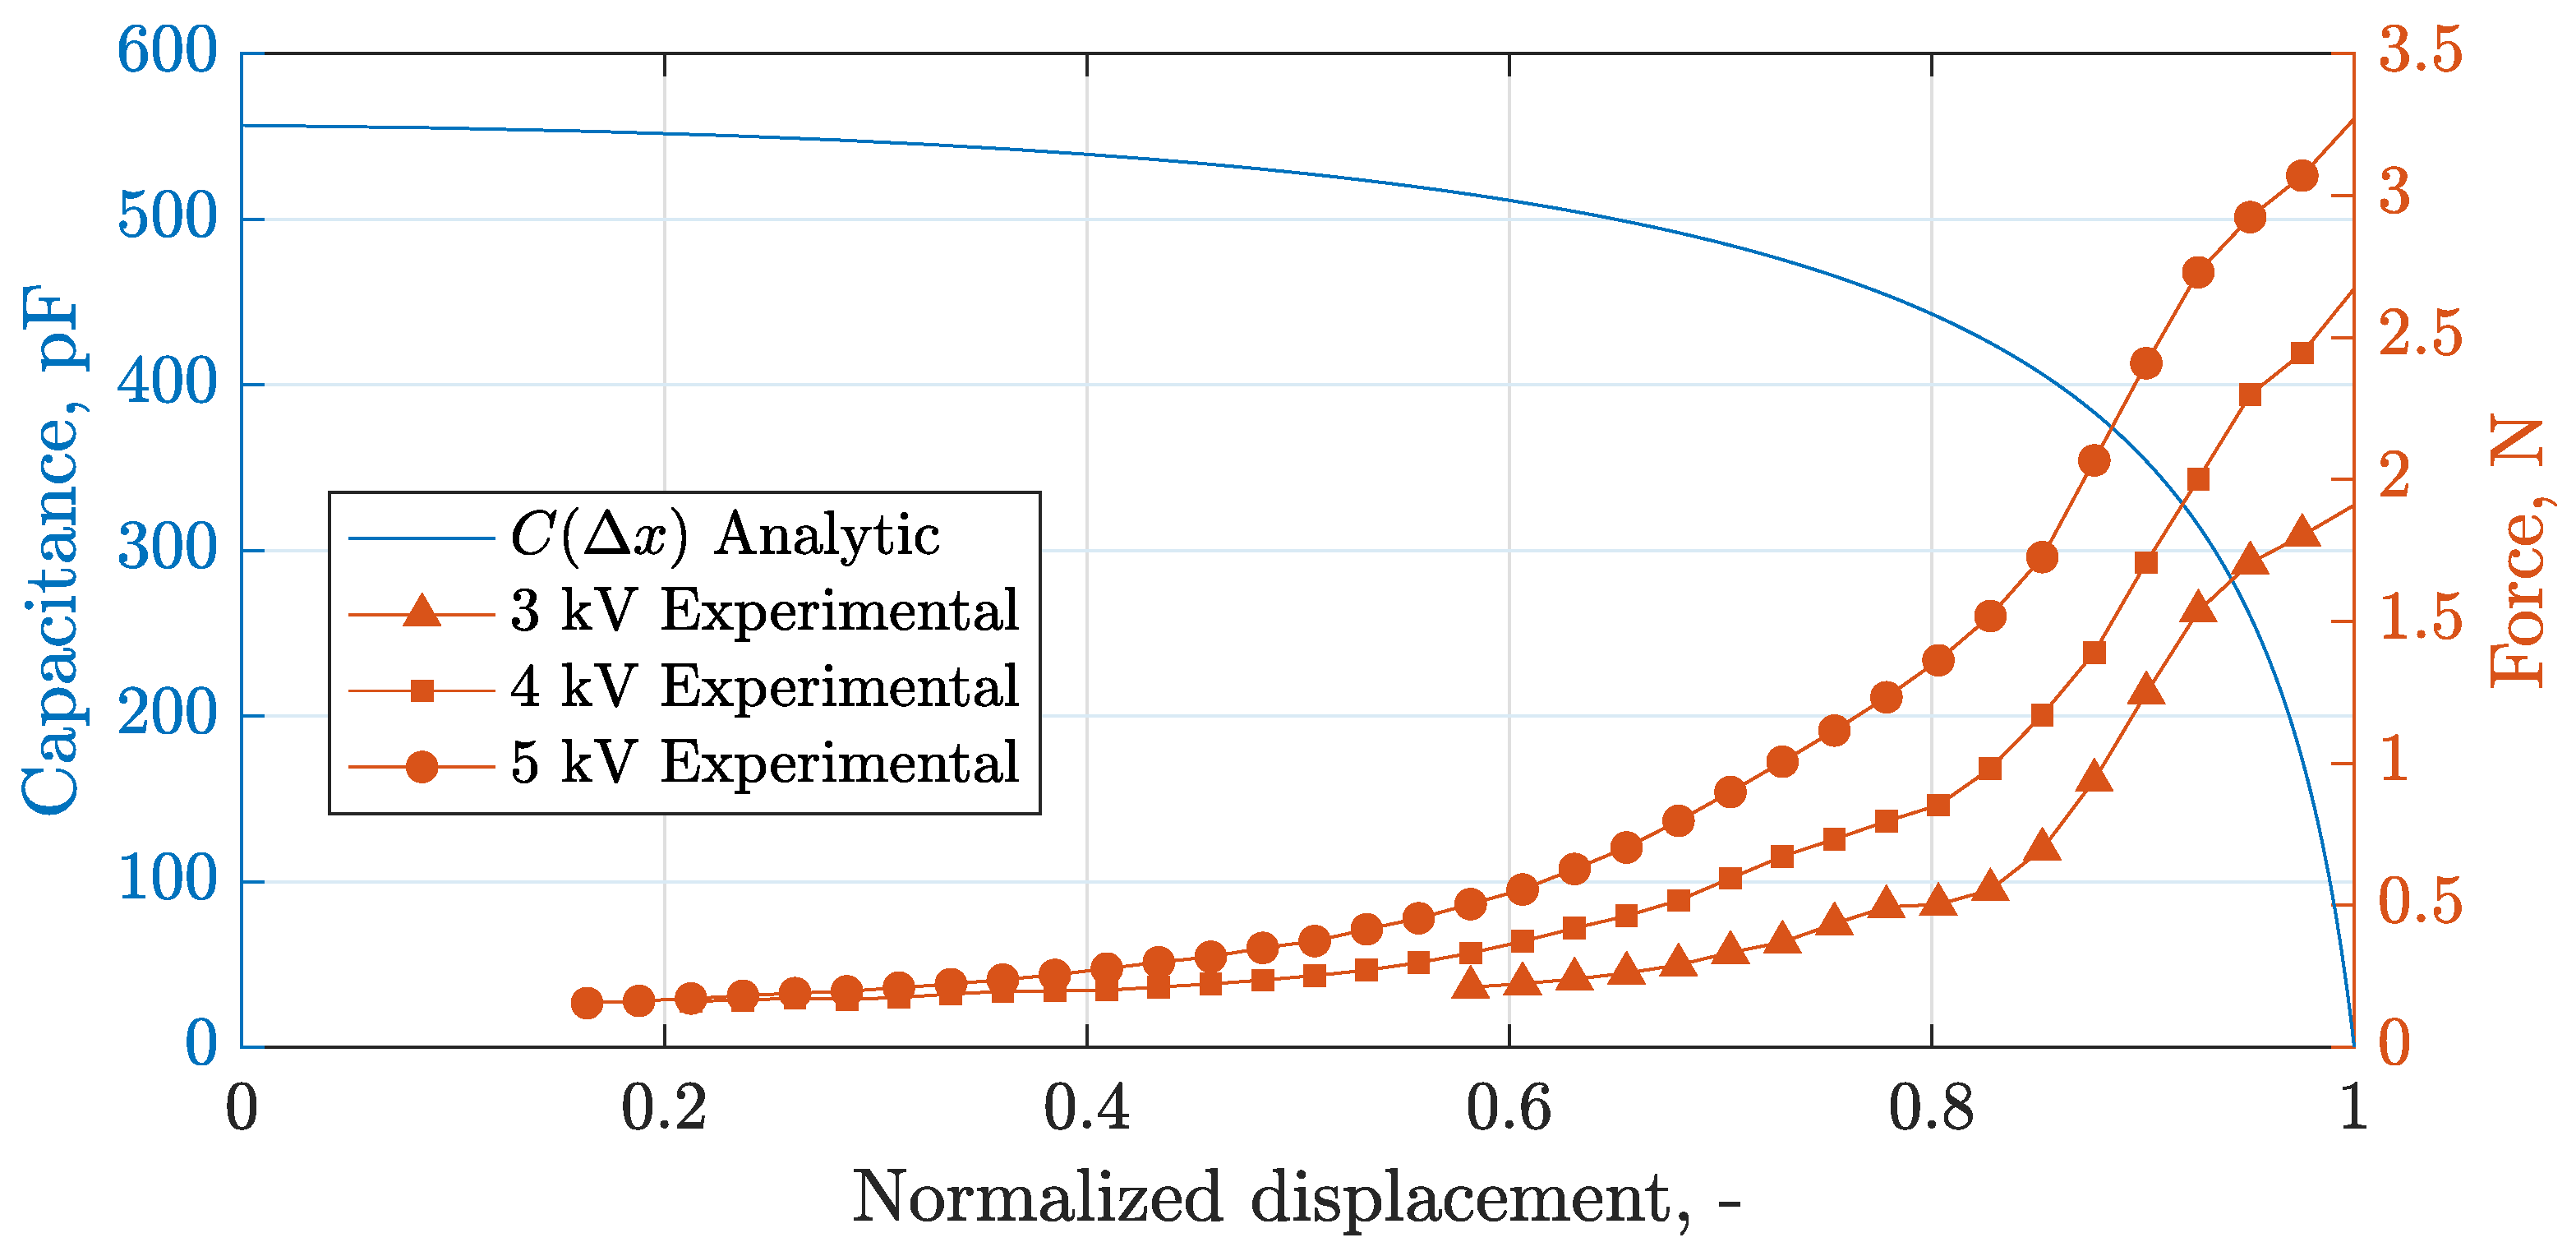
The Pareto frontier is curved because the HASEL’s capacitance and force are nonlinear with stroke. The capacitance-stroke relationship derived from the analytic model and the force-stroke curves measured using the experimental platform in Section 2.4 for the HASEL used in this study are shown in Figure 10. The nonlinear relationship between capacitance and stroke is defined analytically in Equations (5)–(6). The electrical energy produced is linearly dependent on the change in capacitance—see Equation (7)—leading to a nonlinear relationship between energy generated and stroke. In the experiments, the change in capacitance for an energy harvesting cycle is driven by both the priming voltage, which sets the initial zipped displacement—closer to , as shown in Figure 1b—and the applied weight, which stretches the HASEL to its final position. The force required to unzip the HASEL increases nonlinearly with stroke, leading to a nonlinear relationship between mechanical work and stroke. Each priming voltage creates its respective constitutive curve in the force-stroke plane, where higher voltage also requires more pulling force to unzip.
Note that the analytic model Equation (7) also reveals the intuitive result that a larger force creates a larger net energy up to a critical value. After the force meets the requirement to fully unzip the HASEL, no greater force will produce more energy. The critical force was not exceeded in this study because the maximum applied mechanical work (71 mJ) was less than the critical force predicted by the analytic model (141 mJ).
The Pareto frontier can inform the operating condition for a particular application depending on what is more desirable: energy density or mechanical efficiency. These results describing the mechanistic relationships governing mechanical efficiency highlight the importance of HASEL’s electromechanical characteristics in maximizing generation performance. Indeed, these characteristics may be combined with HASEL’s self-sensing capability to enable greater energy-conversion effectiveness in an overall generator device made from HASELs via active control schemes.
4. Conclusion
This study quantifies the ability of HASEL transducers to convert mechanical energy into electrical energy. While HASELs were initially developed to mimic the flexibility and functionality of biological muscles for soft robotics actuation, this research shifts the focus of HASEL usage into the realm of electricity generation, exploring the “reverse power flow" that converts mechanically induced HASEL deformation into electricity generation. Through a combination of analytic modeling and experimental evaluation, the study provides a foundational understanding of the characteristics of commercially available HASEL actuators to be used as electrical generators.
This study adopted an analytic model to describe a HASEL’s actuator performance and predict its electrical generation capability. Then, a HASEL generator’s performance was experimentally determined using a high-voltage CV energy harvesting platform created for this study. The energy generated and mechanical energy input for a single energy harvesting cycle were calculated for various applied forces and priming voltages. This study’s results demonstrate that a commercially available, two-pouch Peano-HASEL generates up to 5.2 mJ per cycle, corresponding to an energy density of approximately 2.0 mJ cm−3 per cycle with the proposed CV generation method. The HASEL captured up to 70% of the maximum electrical energy predicted by the analytic model and exhibited up to 23% mechanical efficiency. The findings confirm that HASELs, even in their conventional actuator-manufactured form, can effectively generate electricity when their energy conversion mechanism is reversed.
Future studies may investigate whether other energy harvesting cycles, such as constant current or constant electric field, may generate more energy. This study experimentally demonstrates HASELs as energy generators for the first time, with further research needed to analyze their performance more comprehensively. Moreover, this study highlights the significant potential for improving the efficiency of HASELs’ electricity generation if HASELs were specifically designed and manufactured for this purpose. Note that the relationship between the priming voltage, applied force, and total change in capacitance dictates the HASEL’s energy harvesting efficiency. Although this study used rectangular Peano-HASELs, future studies may investigate other pouch shapes and electrode coverage to change the capacitance-displacement relationship and alter the efficient operating conditions. Comparisons of HASELs to other variable-capacitance-based electrical generators may reveal whether the energy losses incurred by simultaneous zipping and priming are comparable to the viscous losses of pumping dielectric fluidic generators. Furthermore, integrating the HASEL into a larger energy-converting structure will need to be considered for individual devices. This consideration suggests a much broader application and utility for HASELs in the field of "smart and adaptable energy generation" beyond their initial scope in soft robotics.
Author Contributions
Conceptualization, Isabel Hess, Stephen Chamot, Patrick Musgrave, and Blake Boren; Methodology, Isabel Hess, Stephen Chamot, Patrick Musgrave, and Blake Boren; Software, Isabel Hess and Stephen Chamot; Validation, Isabel Hess and Stephen Chamot; Formal Analysis, Isabel Hess, Stephen Chamot, Patrick Musgrave, and Blake Boren; Investigation, Isabel Hess and Stephen Chamot; Resources, Patrick Musgrave and Blake Boren; Data Curation, Isabel Hess and Stephen Chamot; Writing – Original Draft Preparation, Blake Boren, Isabel Hess, Stephen Chamot, and Patrick Musgrave; Writing – Review and Editing, Blake Boren, Isabel Hess, Stephen Chamot, and Patrick Musgrave; Visualization, Isabel Hess and Stephen Chamot; Supervision, Blake Boren and Patrick Musgrave; Project Administration, Patrick Musgrave and Blake Boren; Funding Acquisition, Blake Boren and Patrick Musgrave. All authors have read and agreed to the published version of the manuscript.
Funding
This work was authored by the National Renewable Energy Laboratory, operated by Alliance for Sustainable Energy, LLC, for the U.S. Department of Energy (DOE) under contract no. DE-AC36-08GO28308. Funding is provided by the U.S. Department of Energy Office of Energy Efficiency and Renewable Energy Water Power Technologies Office. The views expressed in the article do not necessarily represent the views of the DOE or the U.S. Government. The U.S. Government retains, and the publisher, by accepting the article for publication, acknowledges that the U.S. Government retains a nonexclusive, paid-up, irrevocable, worldwide license to publish or reproduce the published form of this work, or allow others to do so, for U.S. Government purposes.
Data Availability Statement
The original contributions presented in this study are included in the article. Further inquiries can be directed to the corresponding author(s).
Acknowledgments
We sincerely thank Dr. Shuo Wang, Yuiri Yang, and Yanwen Lai (Electrical and Computer Engineering, University of Florida) for their invaluable contributions to the electrical experimental platform and for measuring the impedance of the HASELs. The authors also acknowledge and give thanks for the vision, advocacy, and support of Jochem Weber (Chief Engineer, National Renewable Energy Laboratory).
Conflicts of Interest
The authors declare no conflict of interest. The funders had no role in the study’s design, in the collection, analyses, or interpretation of data, in the writing of the manuscript, or in the decision to publish the results.
Abbreviations
The following abbreviations are used in this manuscript:
| HASEL | Hydraulically amplified self-healing electrostatic |
| DEG | Dielectric elastomer generator |
| DEA | Dielectric elastomer actuator |
| HexDEEC | Hexagonal distributed embedded energy converter |
| LDV | Laser Doppler vibrometer |
| CV | Constant voltage |
| QV | Charge voltage |
References
- Thomson, G.; Yurchenko, D.; Val, D.V. Dielectric Elastomers for Energy Harvesting. In Energy Harvesting; Manyala, R., Ed.; InTech, 2018. [CrossRef]
- Moretti, G.; Rosset, S.; Vertechy, R.; Anderson, I.; Fontana, M. A Review of Dielectric Elastomer Generator Systems. Advanced Intelligent Systems 2020, 2, 2000125. [Google Scholar] [CrossRef]
- Niffenegger, J.S.; Boren, B. Numerical Methods to Evaluate Hyperelastic Transducers: Hexagonal Distributed Embedded Energy Converters. Energies 2023, 16. [Google Scholar] [CrossRef]
- Boren, B. Distributed Embedded Energy Converters for Ocean Wave Energy Harvesting: Enabling a Domain of Transformative Technologies. European Wave and Tidal Energy Conference 2021. [Google Scholar]
- Collins, I.; Hossain, M.; Dettmer, W.; Masters, I. Flexible Membrane Structures for Wave Energy Harvesting: A Review of the Developments, Materials and Computational Modelling Approaches. Renewable and Sustainable Energy Reviews 2021, 151, 111478. [Google Scholar] [CrossRef]
- Boren, B. Prototype and Codesign of Nascent Flexible Wave Energy Converter Concepts 2021.
- Boren, B.; Mendoza, N.; Niffenegger, J. Distributed Embedded Energy Converter Technologies for Marine Renewable Energy (A Technical Report). Technical Report NREL/TP–5700-85158, 1997371, MainId:85931, 2023. [CrossRef]
- SBM Offshore. The S3® Wave Energy Converter represents a paradigm shift in wave energy conversion 2019.
- Rosset, S.; Shea, H.R. Flexible and Stretchable Electrodes for Dielectric Elastomer Actuators. Applied Physics A 2013, 110, 281–307. [Google Scholar] [CrossRef]
- Chen, Y.; Zhao, H.; Mao, J.; Chirarattananon, P.; Helbling, E.F.; Hyun, N.s.P.; Clarke, D.R.; Wood, R.J. Controlled Flight of a Microrobot Powered by Soft Artificial Muscles. Nature 2019, 575, 324–329. [Google Scholar] [CrossRef]
- Duduta, M.; Berlinger, F.; Nagpal, R.; Clarke, D.R.; Wood, R.J.; Temel, F.Z. Tunable Multi-Modal Locomotion in Soft Dielectric Elastomer Robots. IEEE Robotics and Automation Letters 2020, 5, 3868–3875. [Google Scholar] [CrossRef]
- Andritsch, T.; Morshuis, P.H.F.; Smit, J.J.; Jean, P.; van Kessel, R.; Wattez, A.; Fourmon, A. Challenges of Using Electroactive Polymers in Large Scale Wave Energy Converters. In Proceedings of the 2012 Annual Report Conference on Electrical Insulation and Dielectric Phenomena, 0014/2012-10-17; pp. 786–789.
- Jean, P.; Wattez, A.; Ardoise, G.; Melis, C.; Van Kessel, R.; Fourmon, A.; Barrabino, E.; Heemskerk, J.; Queau, J.P. Standing Wave Tube Electro Active Polymer Wave Energy Converter. In Proceedings of the SPIE Smart Structures and Materials + Nondestructive Evaluation and Health Monitoring; Bar-Cohen, Y., Ed., San Diego, California; 2012; p. 83400. [Google Scholar] [CrossRef]
- Moretti, G.; Papini, G.P.R.; Righi, M.; Forehand, D.; Ingram, D.; Vertechy, R.; Fontana, M. Resonant Wave Energy Harvester Based on Dielectric Elastomer Generator. Smart Materials and Structures 2018, 27, 035015. [Google Scholar] [CrossRef]
- Maas, J.; Graf, C. Dielectric Elastomers for Hydro Power Harvesting. Smart Materials and Structures 2012, 21, 064006. [Google Scholar] [CrossRef]
- Mathew, A.T.; Khanh, V.T.V.; Bin Mohamed Aliffi, M.D.; Liu, C.; Koh, S.J.A. A Self-Amplifying Dielectric-Elastomer-Amplified Piezoelectric for Motion-Based Energy Harvesting. Journal of Intelligent Material Systems and Structures 2020, 31, 152–166. [Google Scholar] [CrossRef]
- Duranti, M.; Righi, M.; Vertechy, R.; Fontana, M. A New Class of Variable Capacitance Generators Based on the Dielectric Fluid Transducer. Smart Materials and Structures 2017, 26. [Google Scholar] [CrossRef]
- Niffenegger, J.S.; Boren, B. Numerical Methods to Evaluate Hyperelastic Transducers: Hexagonal Distributed Embedded Energy Converters. Energies 2023, 16, 8100. [Google Scholar] [CrossRef]
- Kornbluh, R.D.; Pelrine, R.; Prahlad, H.; Wong-Foy, A.; McCoy, B.; Kim, S.; Eckerle, J.; Low, T. From Boots to Buoys: Promises and Challenges of Dielectric Elastomer Energy Harvesting. In Proceedings of the SPIE Smart Structures and Materials + Nondestructive Evaluation and Health Monitoring; Bar-Cohen, Y.; Carpi, F., Eds., San Diego, California, USA; 2011; p. 797605. [Google Scholar] [CrossRef]
- Acome, E.; Mitchell, S.K.; Morrissey, T.G.; Emmett, M.B.; Benjamin, C.; King, M.; Radakovitz, M.; Keplinger, C. Hydraulically Amplified Self-Healing Electrostatic Actuators with Muscle-like Performance. Science 2018, 359, 61–65. [Google Scholar] [CrossRef] [PubMed]
- Rothemund, P.; Kirkman, S.; Keplinger, C. Dynamics of Electrohydraulic Soft Actuators. Proceedings of the National Academy of Sciences 2020, 117, 16207–16213. [Google Scholar] [CrossRef] [PubMed]
- Hess, I.; Musgrave, P.F. A Continuum Soft Robotic Trout with Embedded HASEL Actuators: Design, Fabrication, and Swimming Kinematics. Smart Materials and Structures 2024. [Google Scholar] [CrossRef]
- Gravert, S.D.; Varini, E.; Kazemipour, A.; Michelis, M.Y.; Buchner, T.; Hinchet, R.; Katzschmann, R.K. Low-Voltage Electrohydraulic Actuators for Untethered Robotics. Science Advances 2024, 10, eadi9319. [Google Scholar] [CrossRef]
- Wang, T.; Joo, H.J.; Song, S.; Hu, W.; Keplinger, C.; Sitti, M. A Versatile Jellyfish-like Robotic Platform for Effective Underwater Propulsion and Manipulation. SCIENCE ADVANCES 2023, 9. [Google Scholar] [CrossRef]
- Park, T.; Kim, K.; Oh, S.R.; Cha, Y. Electrohydraulic Actuator for a Soft Gripper. Soft Robotics 2020, 7, 68–75. [Google Scholar] [CrossRef]
- Yoder, Z.; Macari, D.; Kleinwaks, G.; Schmidt, I.; Acome, E.; Keplinger, C. A Soft, Fast and Versatile Electrohydraulic Gripper with Capacitive Object Size Detection. Advanced Functional Materials 2023, 33, 2209080. [Google Scholar] [CrossRef]
- Yoder, Z.; Kellaris, N.; Chase-Markopoulou, C.; Ricken, D.; Mitchell, S.K.; Emmett, M.B.; Weir, R.F.F.; Segil, J.; Keplinger, C. Design of a High-Speed Prosthetic Finger Driven by Peano-HASEL Actuators. Frontiers in Robotics and AI 2020, 7, 586216. [Google Scholar] [CrossRef]
- Johnson, B.K.; Naris, M.; Sundaram, V.; Volchko, A.; Ly, K.; Mitchell, S.K.; Acome, E.; Kellaris, N.; Keplinger, C.; Correll, N.; et al. A Multifunctional Soft Robotic Shape Display with High-Speed Actuation, Sensing, and Control. Nature Communications 2023, 14, 4516. [Google Scholar] [CrossRef] [PubMed]
- Ly, K.; Kellaris, N.; McMorris, D.; Johnson, B.K.; Acome, E.; Sundaram, V.; Naris, M.; Humbert, J.S.; Rentschler, M.E.; Keplinger, C.; et al. Miniaturized Circuitry for Capacitive Self-Sensing and Closed-Loop Control of Soft Electrostatic Transducers. Soft Robotics 2021, 8, 673–686. [Google Scholar] [CrossRef] [PubMed]
- Moretti, G.; Duranti, M.; Righi, M.; Vertechy, R.; Fontana, M. Analysis of Dielectric Fluid Transducers. In Proceedings of the Electroactive Polymer Actuators and Devices (EAPAD) XX; Bar-Cohen, Y., Ed., Denver, United States; 2018; p. 29. [Google Scholar] [CrossRef]
- Kellaris, N.; Venkata, V.G.; Rothemund, P.; Keplinger, C. An Analytical Model for the Design of Peano-HASEL Actuators with Drastically Improved Performance. Extreme Mechanics Letters 2019, 29, 100449. [Google Scholar] [CrossRef]
- Artimus Robotics. C-Series Contracting HASEL Actuator C-5015-04-01-B-ACAC-50-096. Datasheet, Boulder, Colorado, USA, 2023.
- Koh, S.J.A.; Keplinger, C.; Li, T.; Bauer, S.; Suo, Z. Dielectric Elastomer Generators: How Much Energy Can Be Converted? IEEE/ASME Transactions on Mechatronics 2011, 16, 33–41. [Google Scholar] [CrossRef]
Figure 1.
Image and diagram of a HASEL transducer. (a) Image of a two-pouch HASEL actuator commercially purchased from Artimus Robotics [32]. The black bars are the flexible electrodes that are painted on the dielectric film surface. (b) Drawing of a HASEL pouch’s cross-section with geometric properties relevant to the model. The pouch stroke is measured from the zipped state. Its fully zipped state (top) has the highest capacitance, and the unzipped state (bottom) has the lowest capacitance.
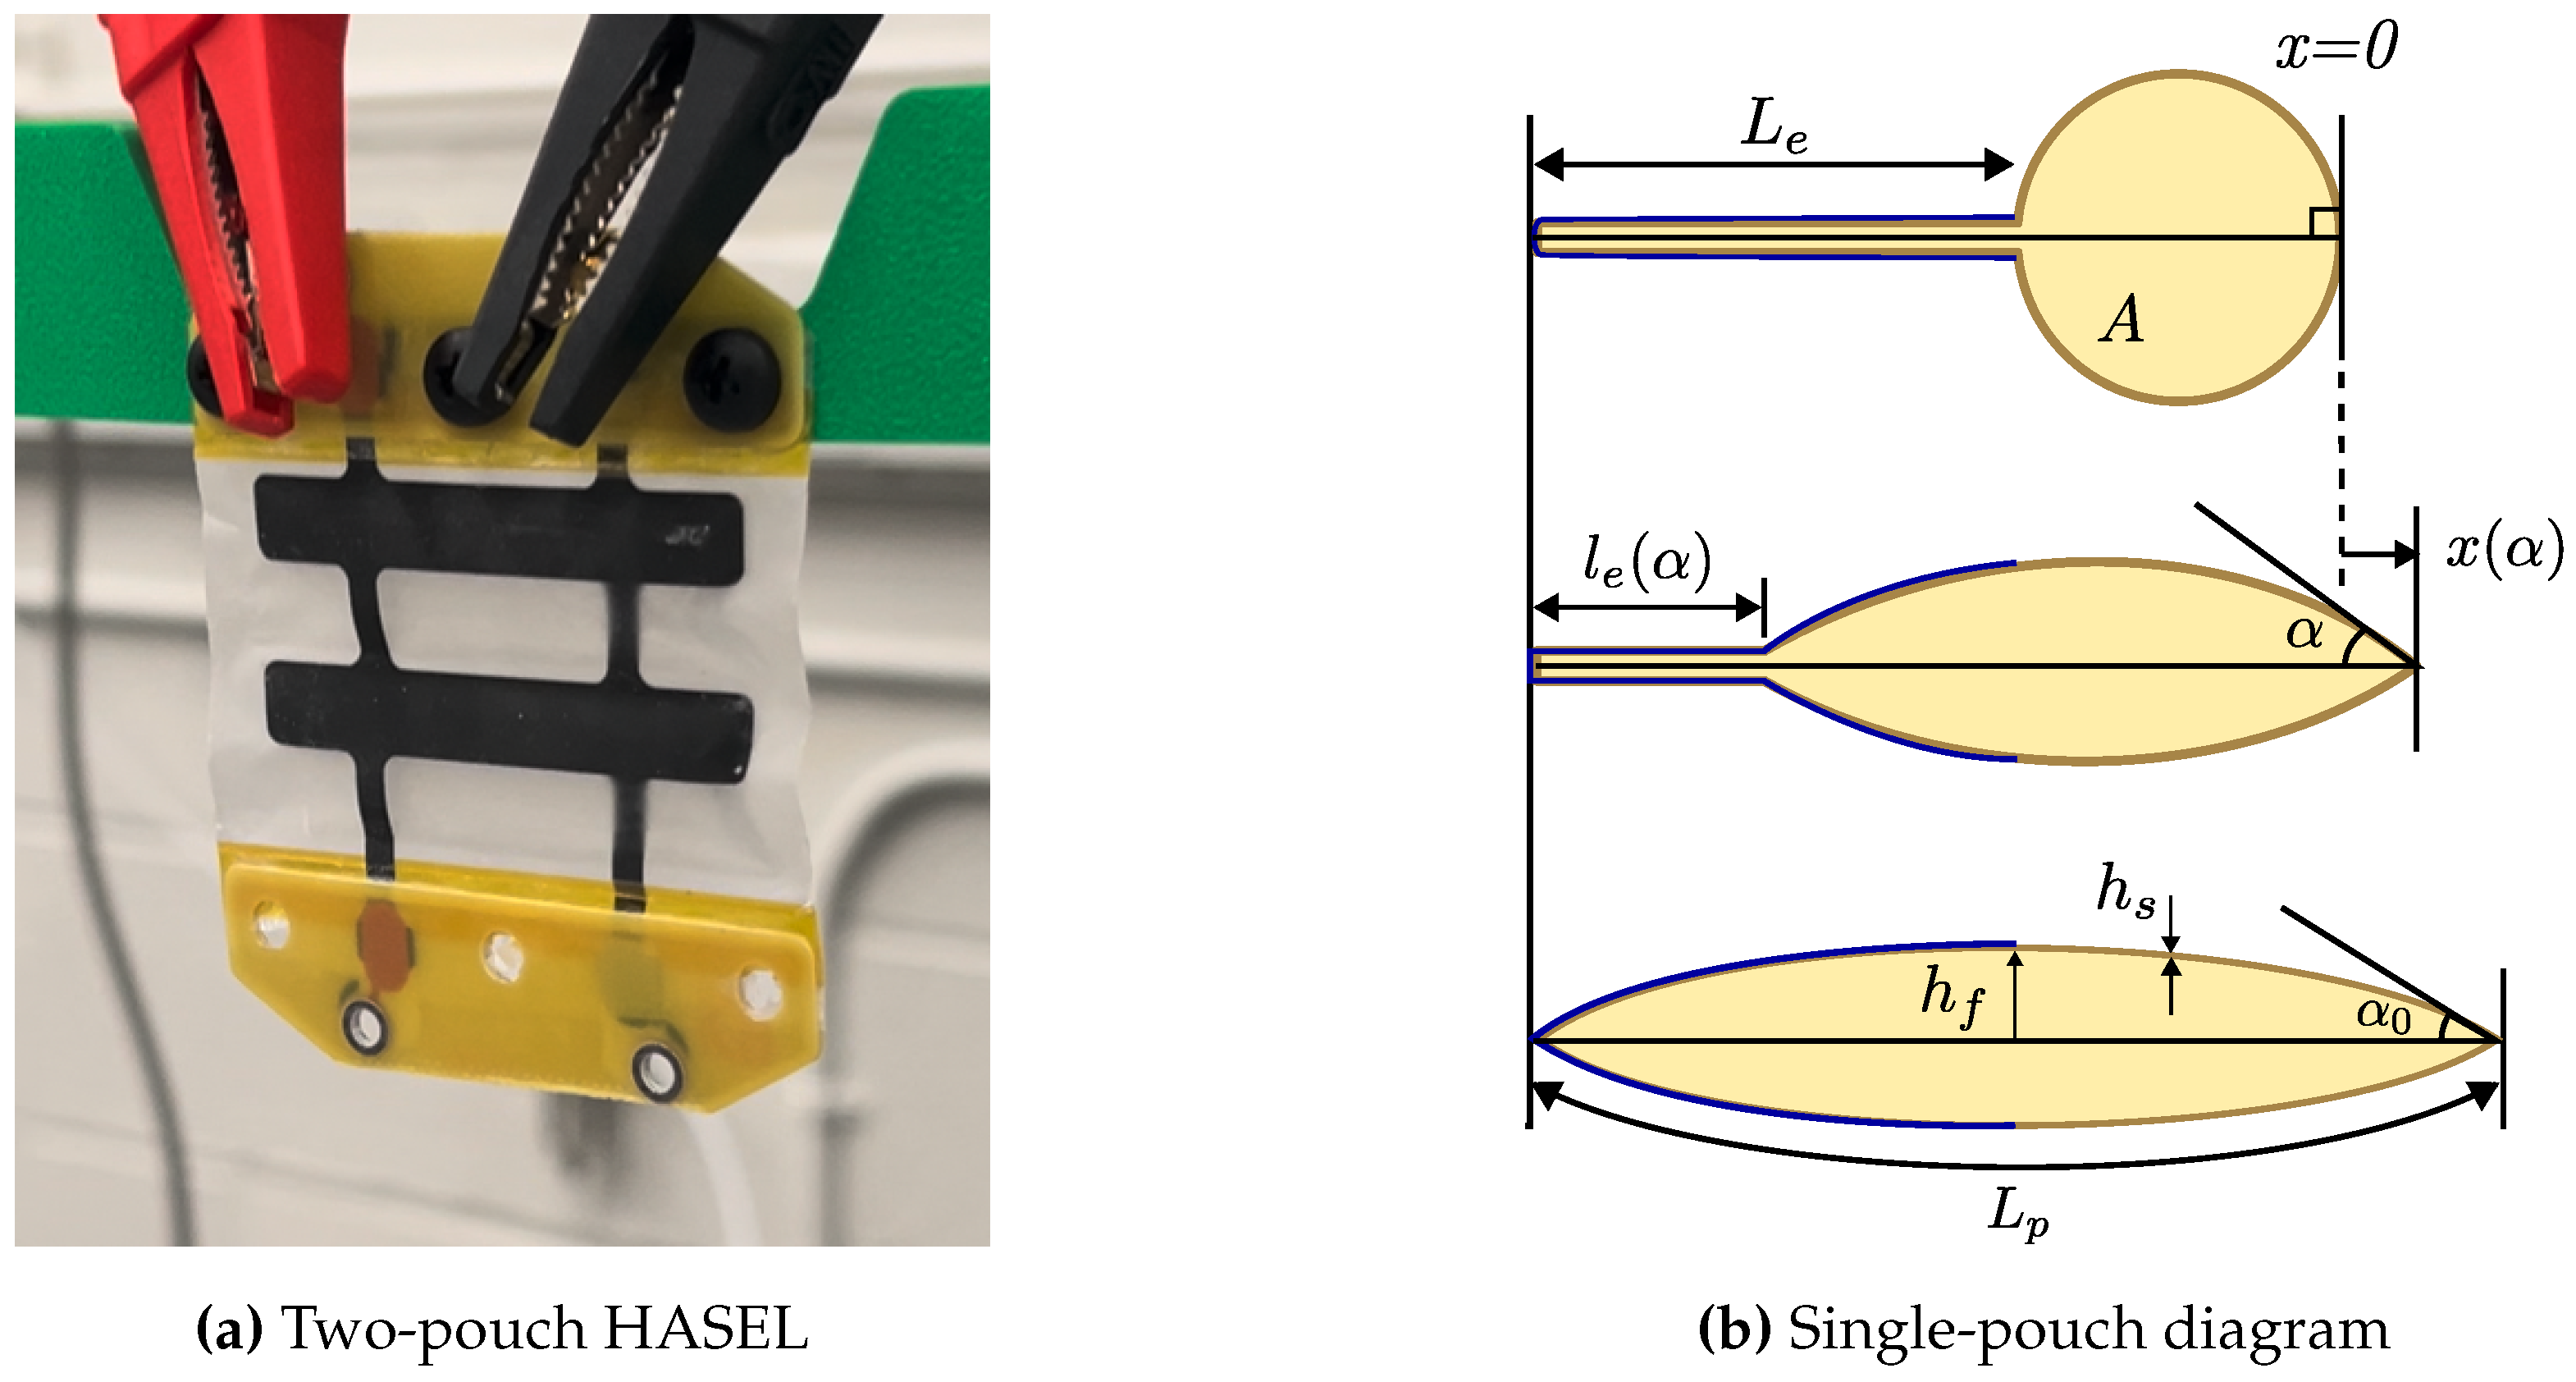
Figure 2.
Proposed energy harvesting method through the constant-voltage (CV) process. During the Priming Phase (A-B), the HASEL is charged to the priming voltage, and the electrodes zip together. In the Generation Phase (B-C), the HASEL is held at CV, and an applied force unzips the electrodes. The HASEL is returned to null voltage while force is applied in the Discharge Phase (C-A). Then, the force subsides to reset the cycle.
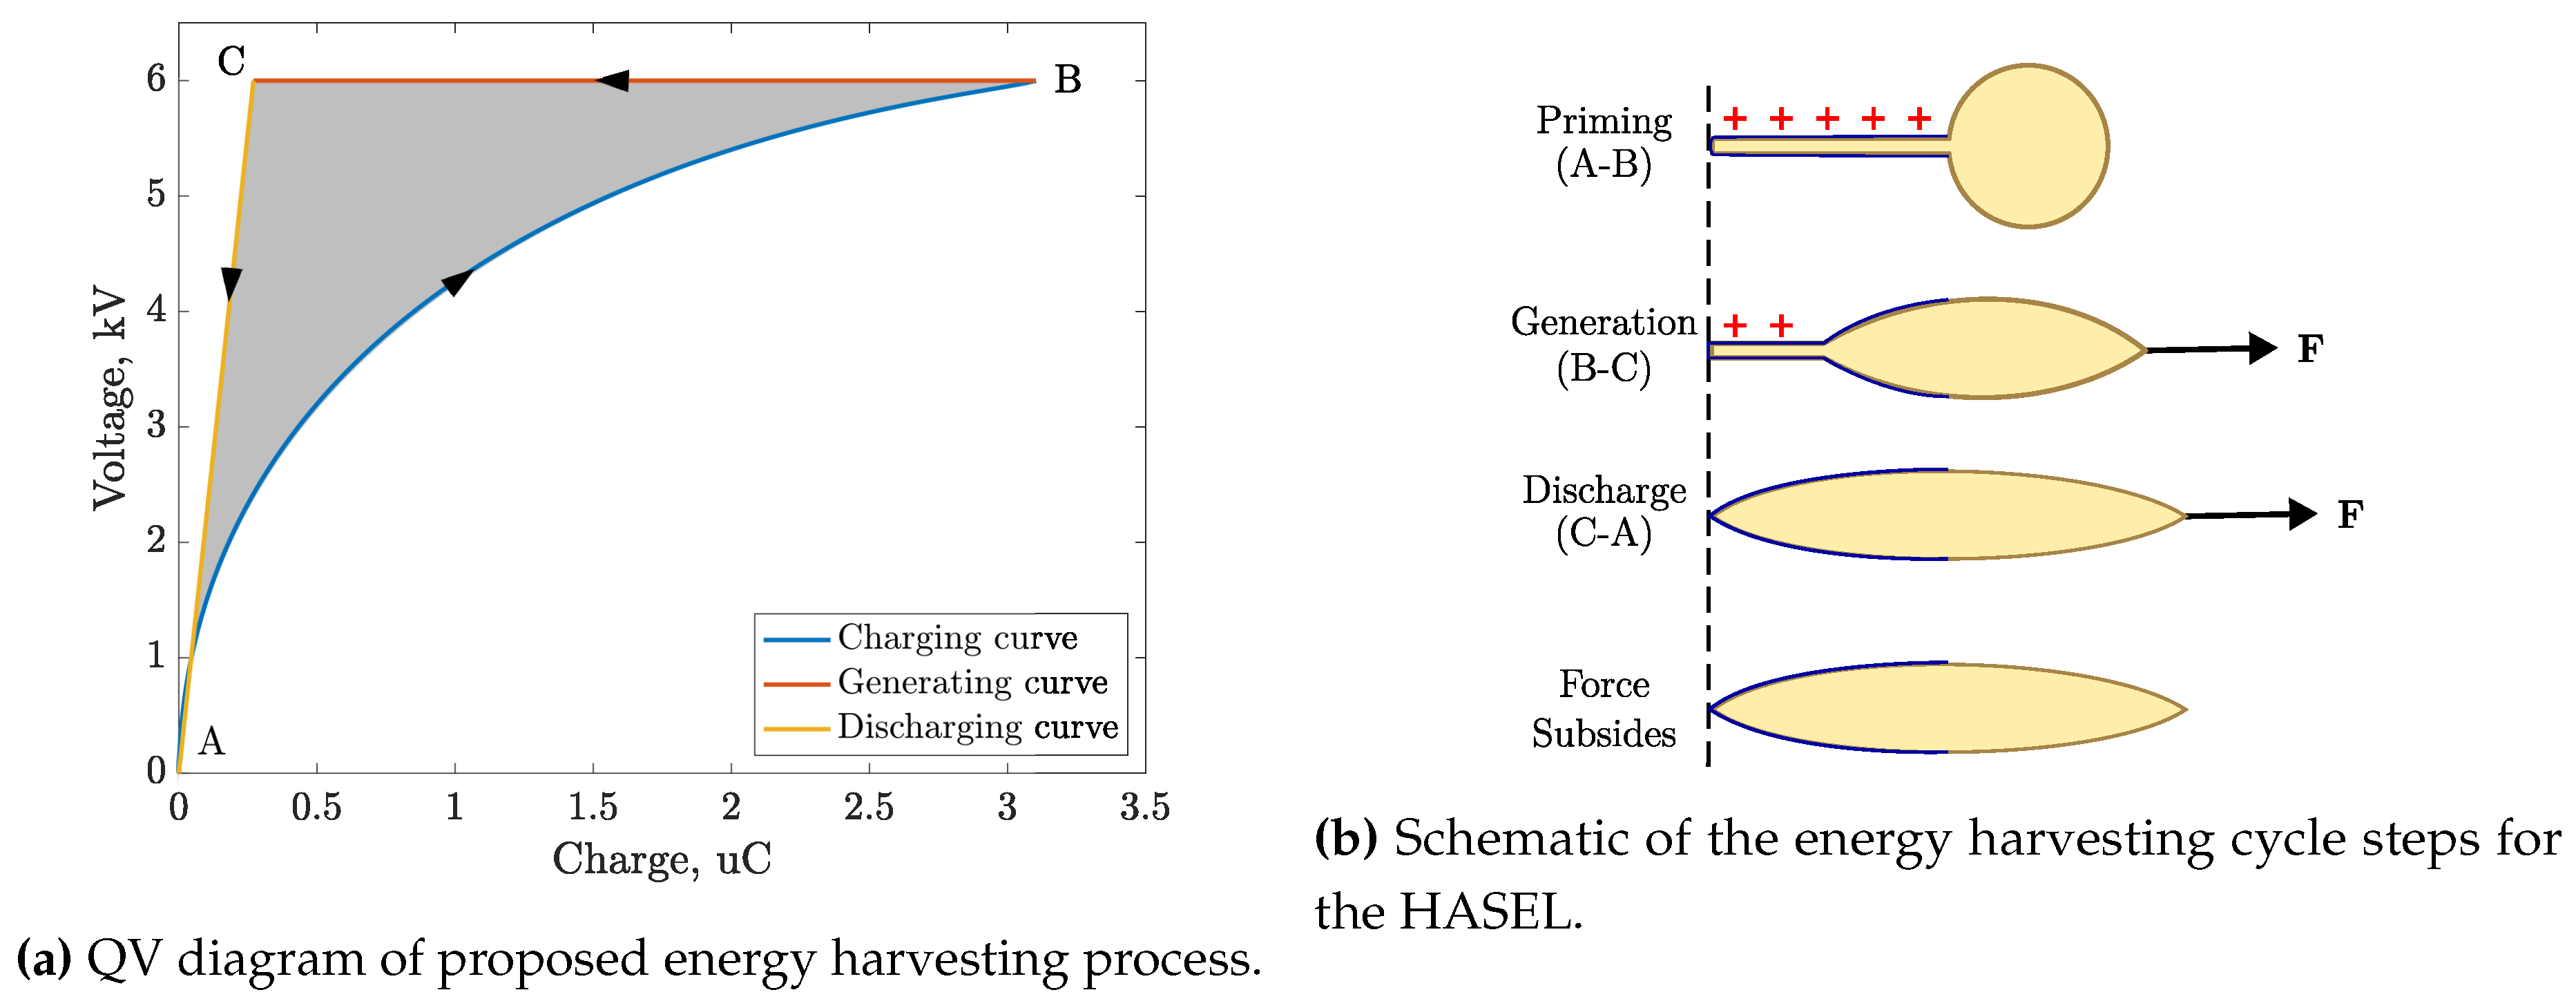
Figure 3.
Experimental setup to measure HASEL electricity generation performance. A frame suspends a HASEL, weight is applied through pulleys, and deformation is measured with a laser doppler vibrometer (LDV) via a mirror. The laser path is shown as a red line. A nylon line (highlighted in white) connects the applied weight to the HASEL via a series of pulleys.
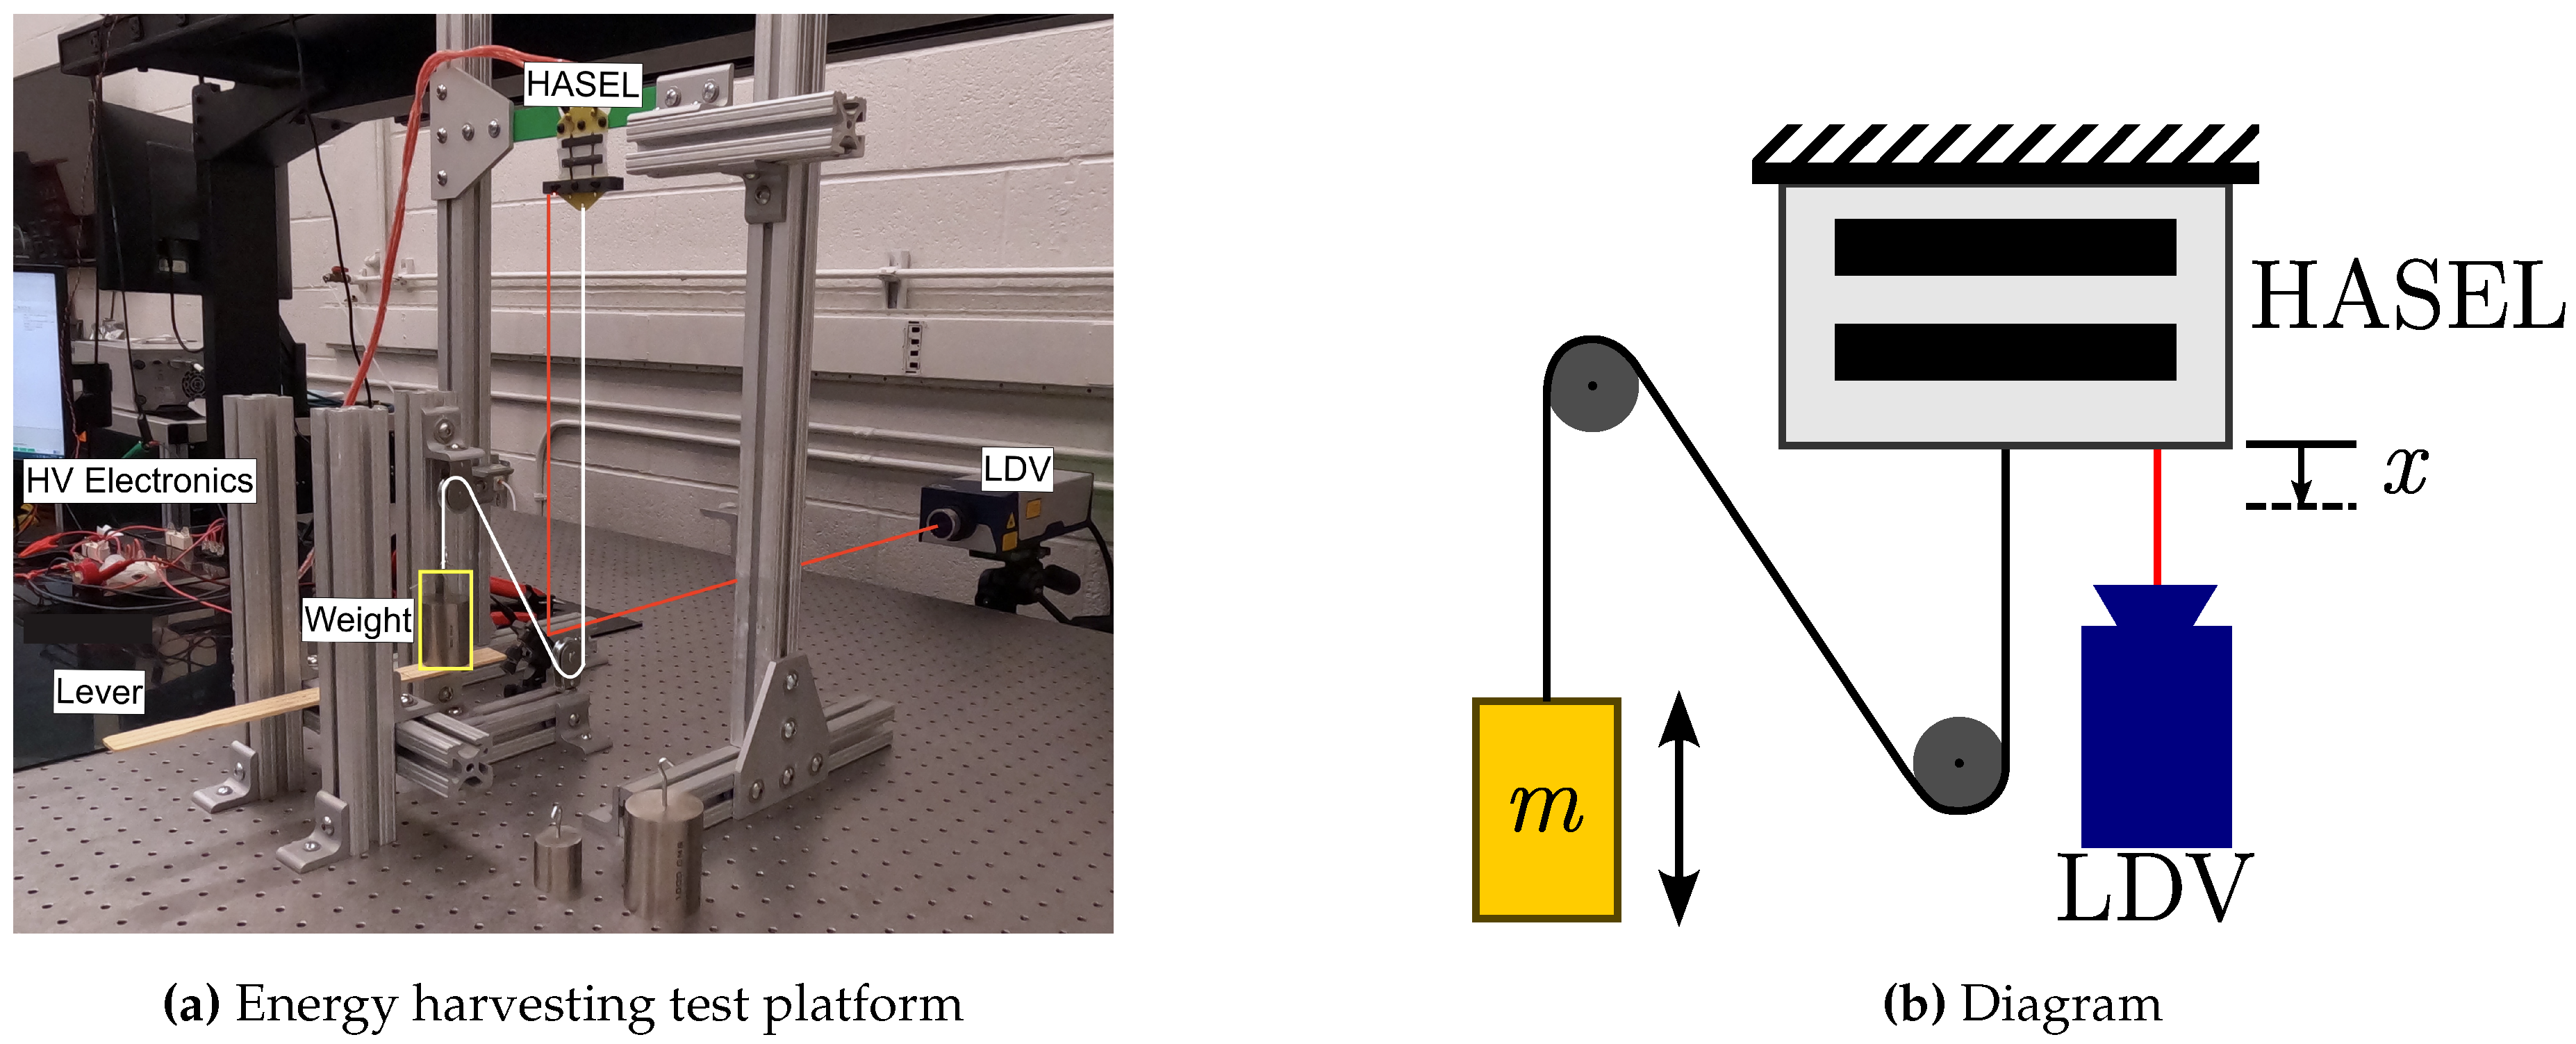
Figure 4.
The high-voltage control circuit that implements a CV energy harvesting cycle. The energy generation of the HASEL is monitored by measuring the voltage on the in-parallel capacitor, .
Figure 4.
The high-voltage control circuit that implements a CV energy harvesting cycle. The energy generation of the HASEL is monitored by measuring the voltage on the in-parallel capacitor, .
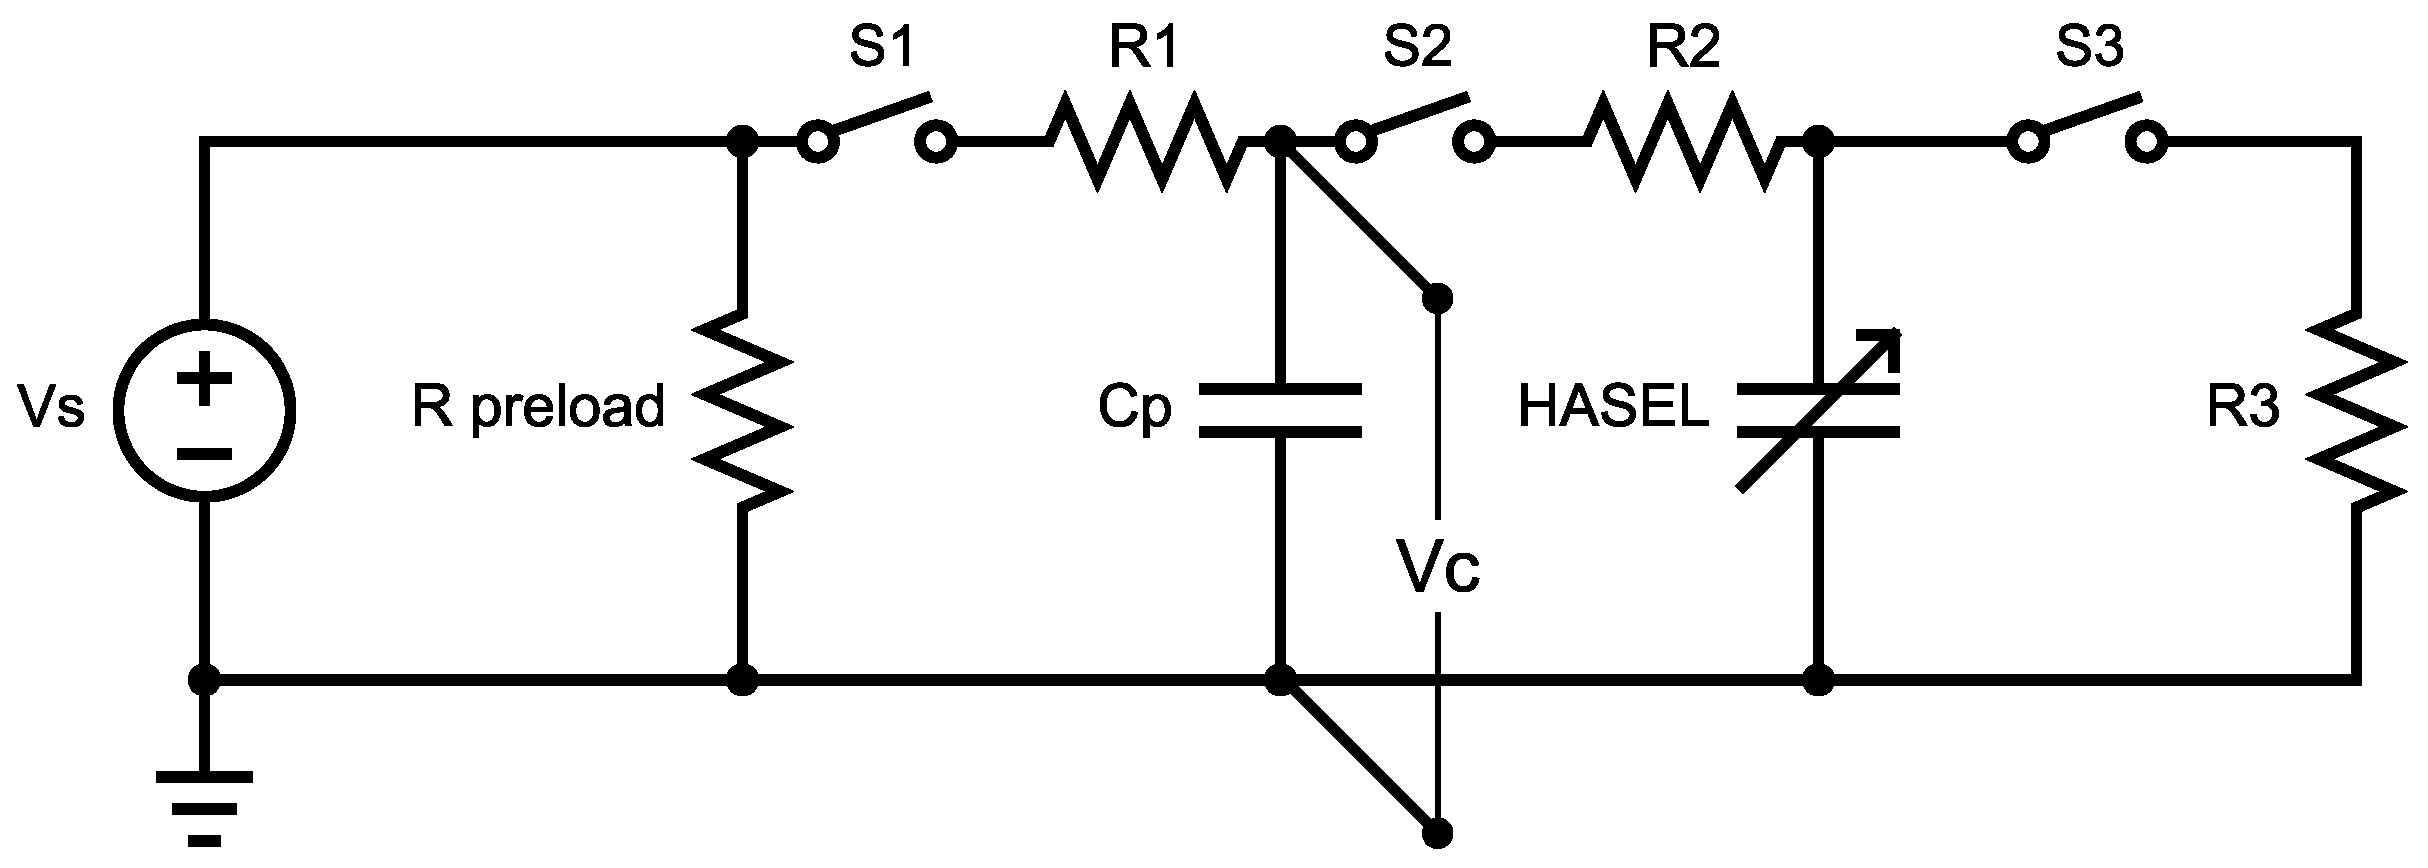
Figure 5.
Representative voltage on the in-parallel capacitor for a single generation cycle. Voltage drops when primes the HASEL at . During the Generation Phase (B-C), the voltage on and that on the HASEL are equal, and they rise together. The initial voltage, , voltage after priming, , and voltage after generation, , are extracted from the plot to calculate the net energy generated. Negative drift after generation is due to charge losses to the measurement resistor.
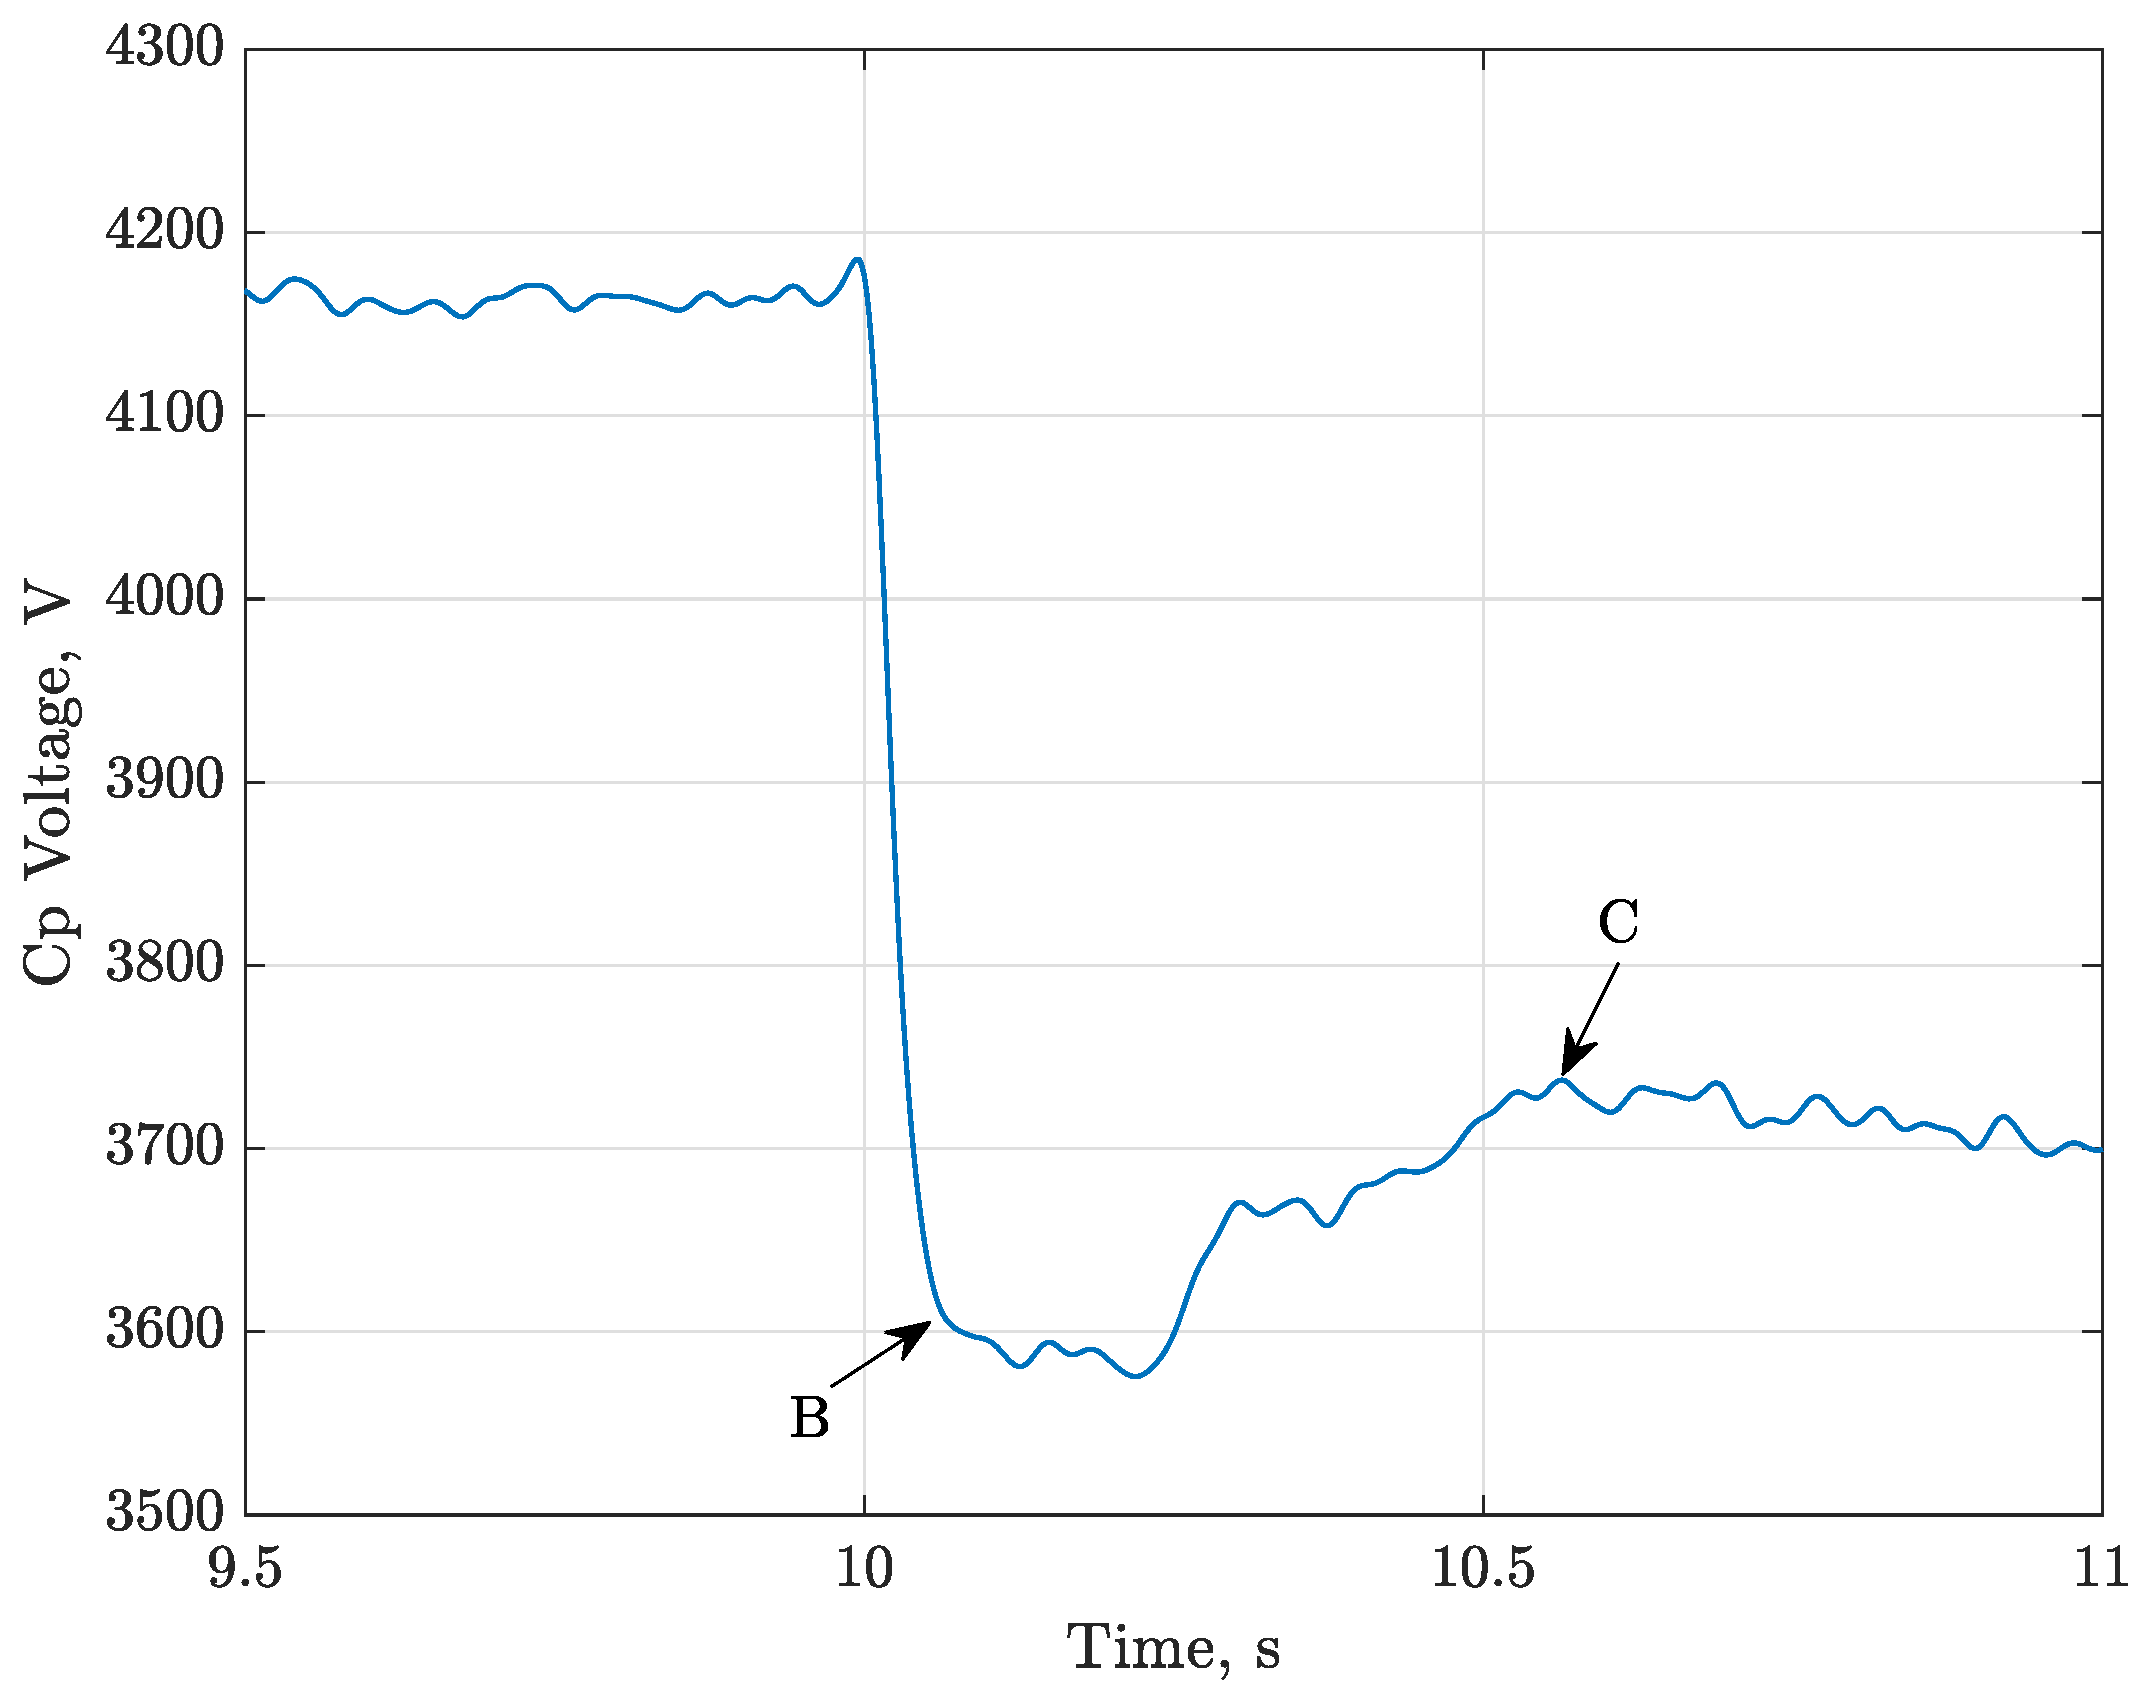
Figure 6.
Experimental platform for the constitutive testing of HASELs. (a) Testing rig to apply prescribed displacements while measuring force. A six-pouch HASEL is pictured; however, the 2-pouch HASEL pictured in Figure 1 was used during testing.The leads from the high-voltage circuit are attached to the contacts. (b) The high-voltage circuit diagram shows voltage dividers for the attached probes to protect them from high voltage and the probe in series with the HASEL (capacitor).
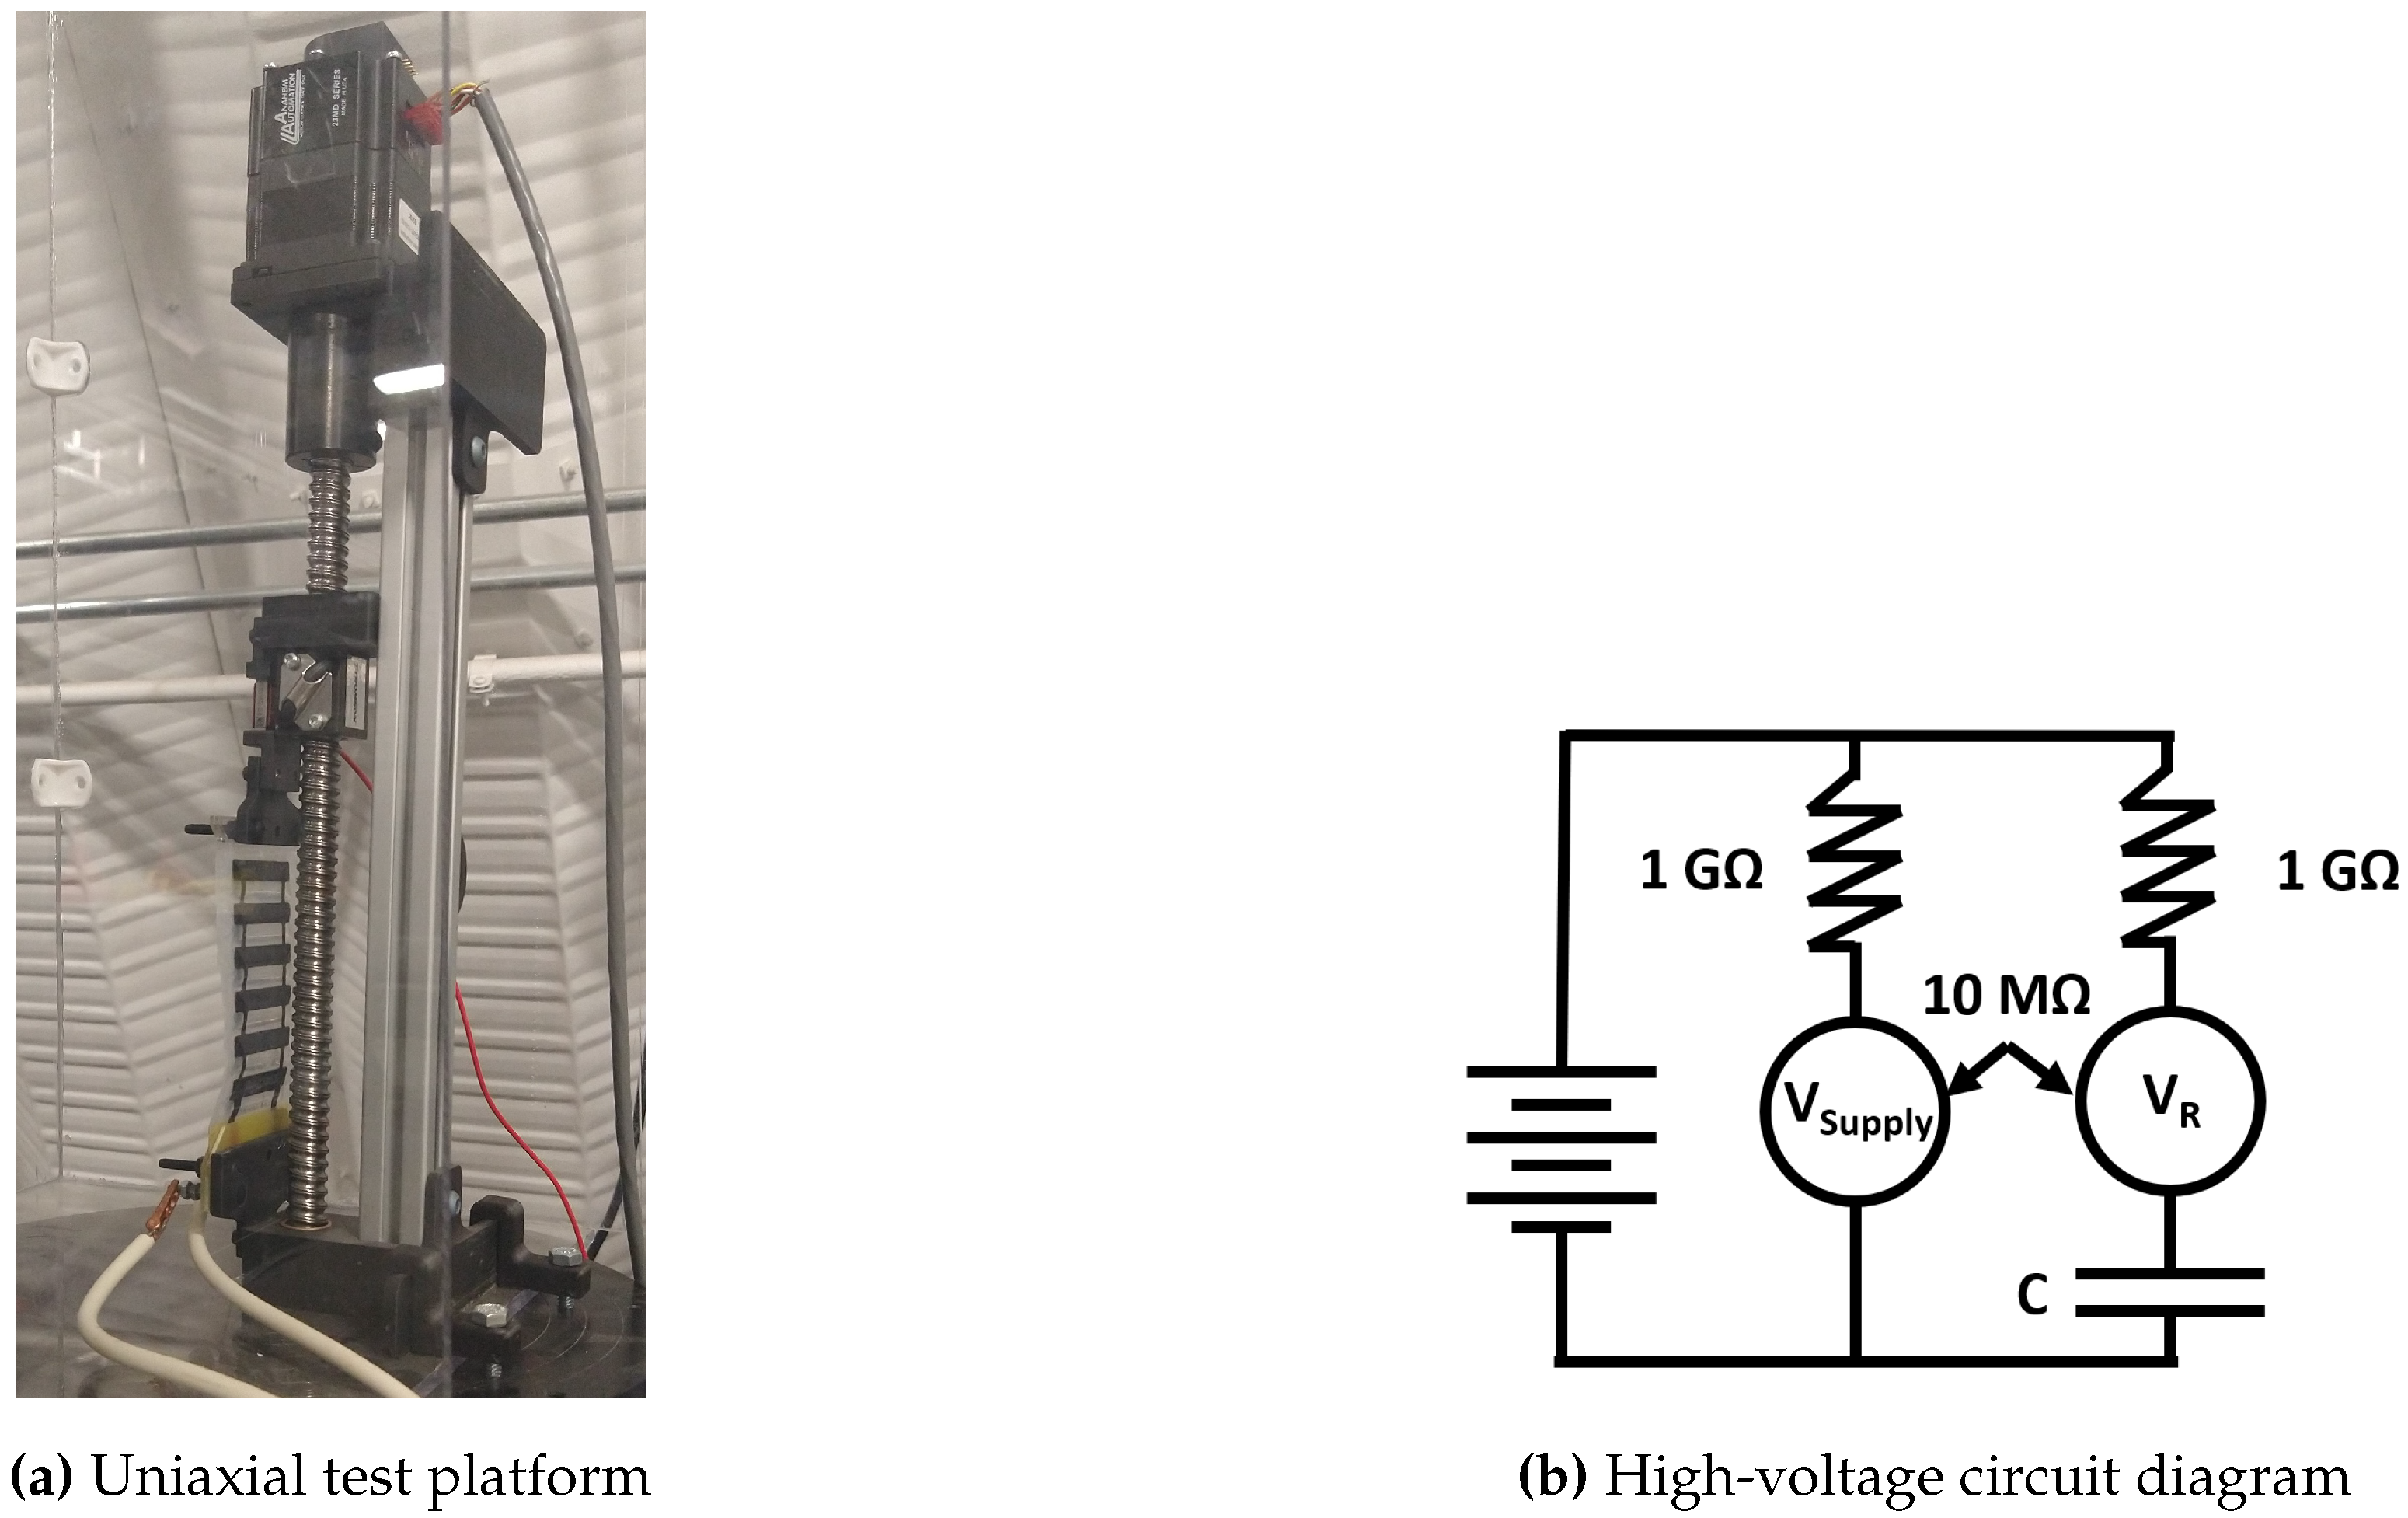
Figure 7.
The QV diagram of a HASEL under a 2 kg load. (a) The net energy generated over the entire energy harvesting cycle, with the shaded gray area representing this net gain. (b) Energy spent in the “Priming Phase”—where the area under the priming curve represents the initial energy required for the cycle. (c) “Generation and Discharge Phases”—shown by the areas under the generation and discharge lines. The red-shaded area shows the difference between the observed and theoretical minimum charge before discharge, highlighting energy output in these phases.
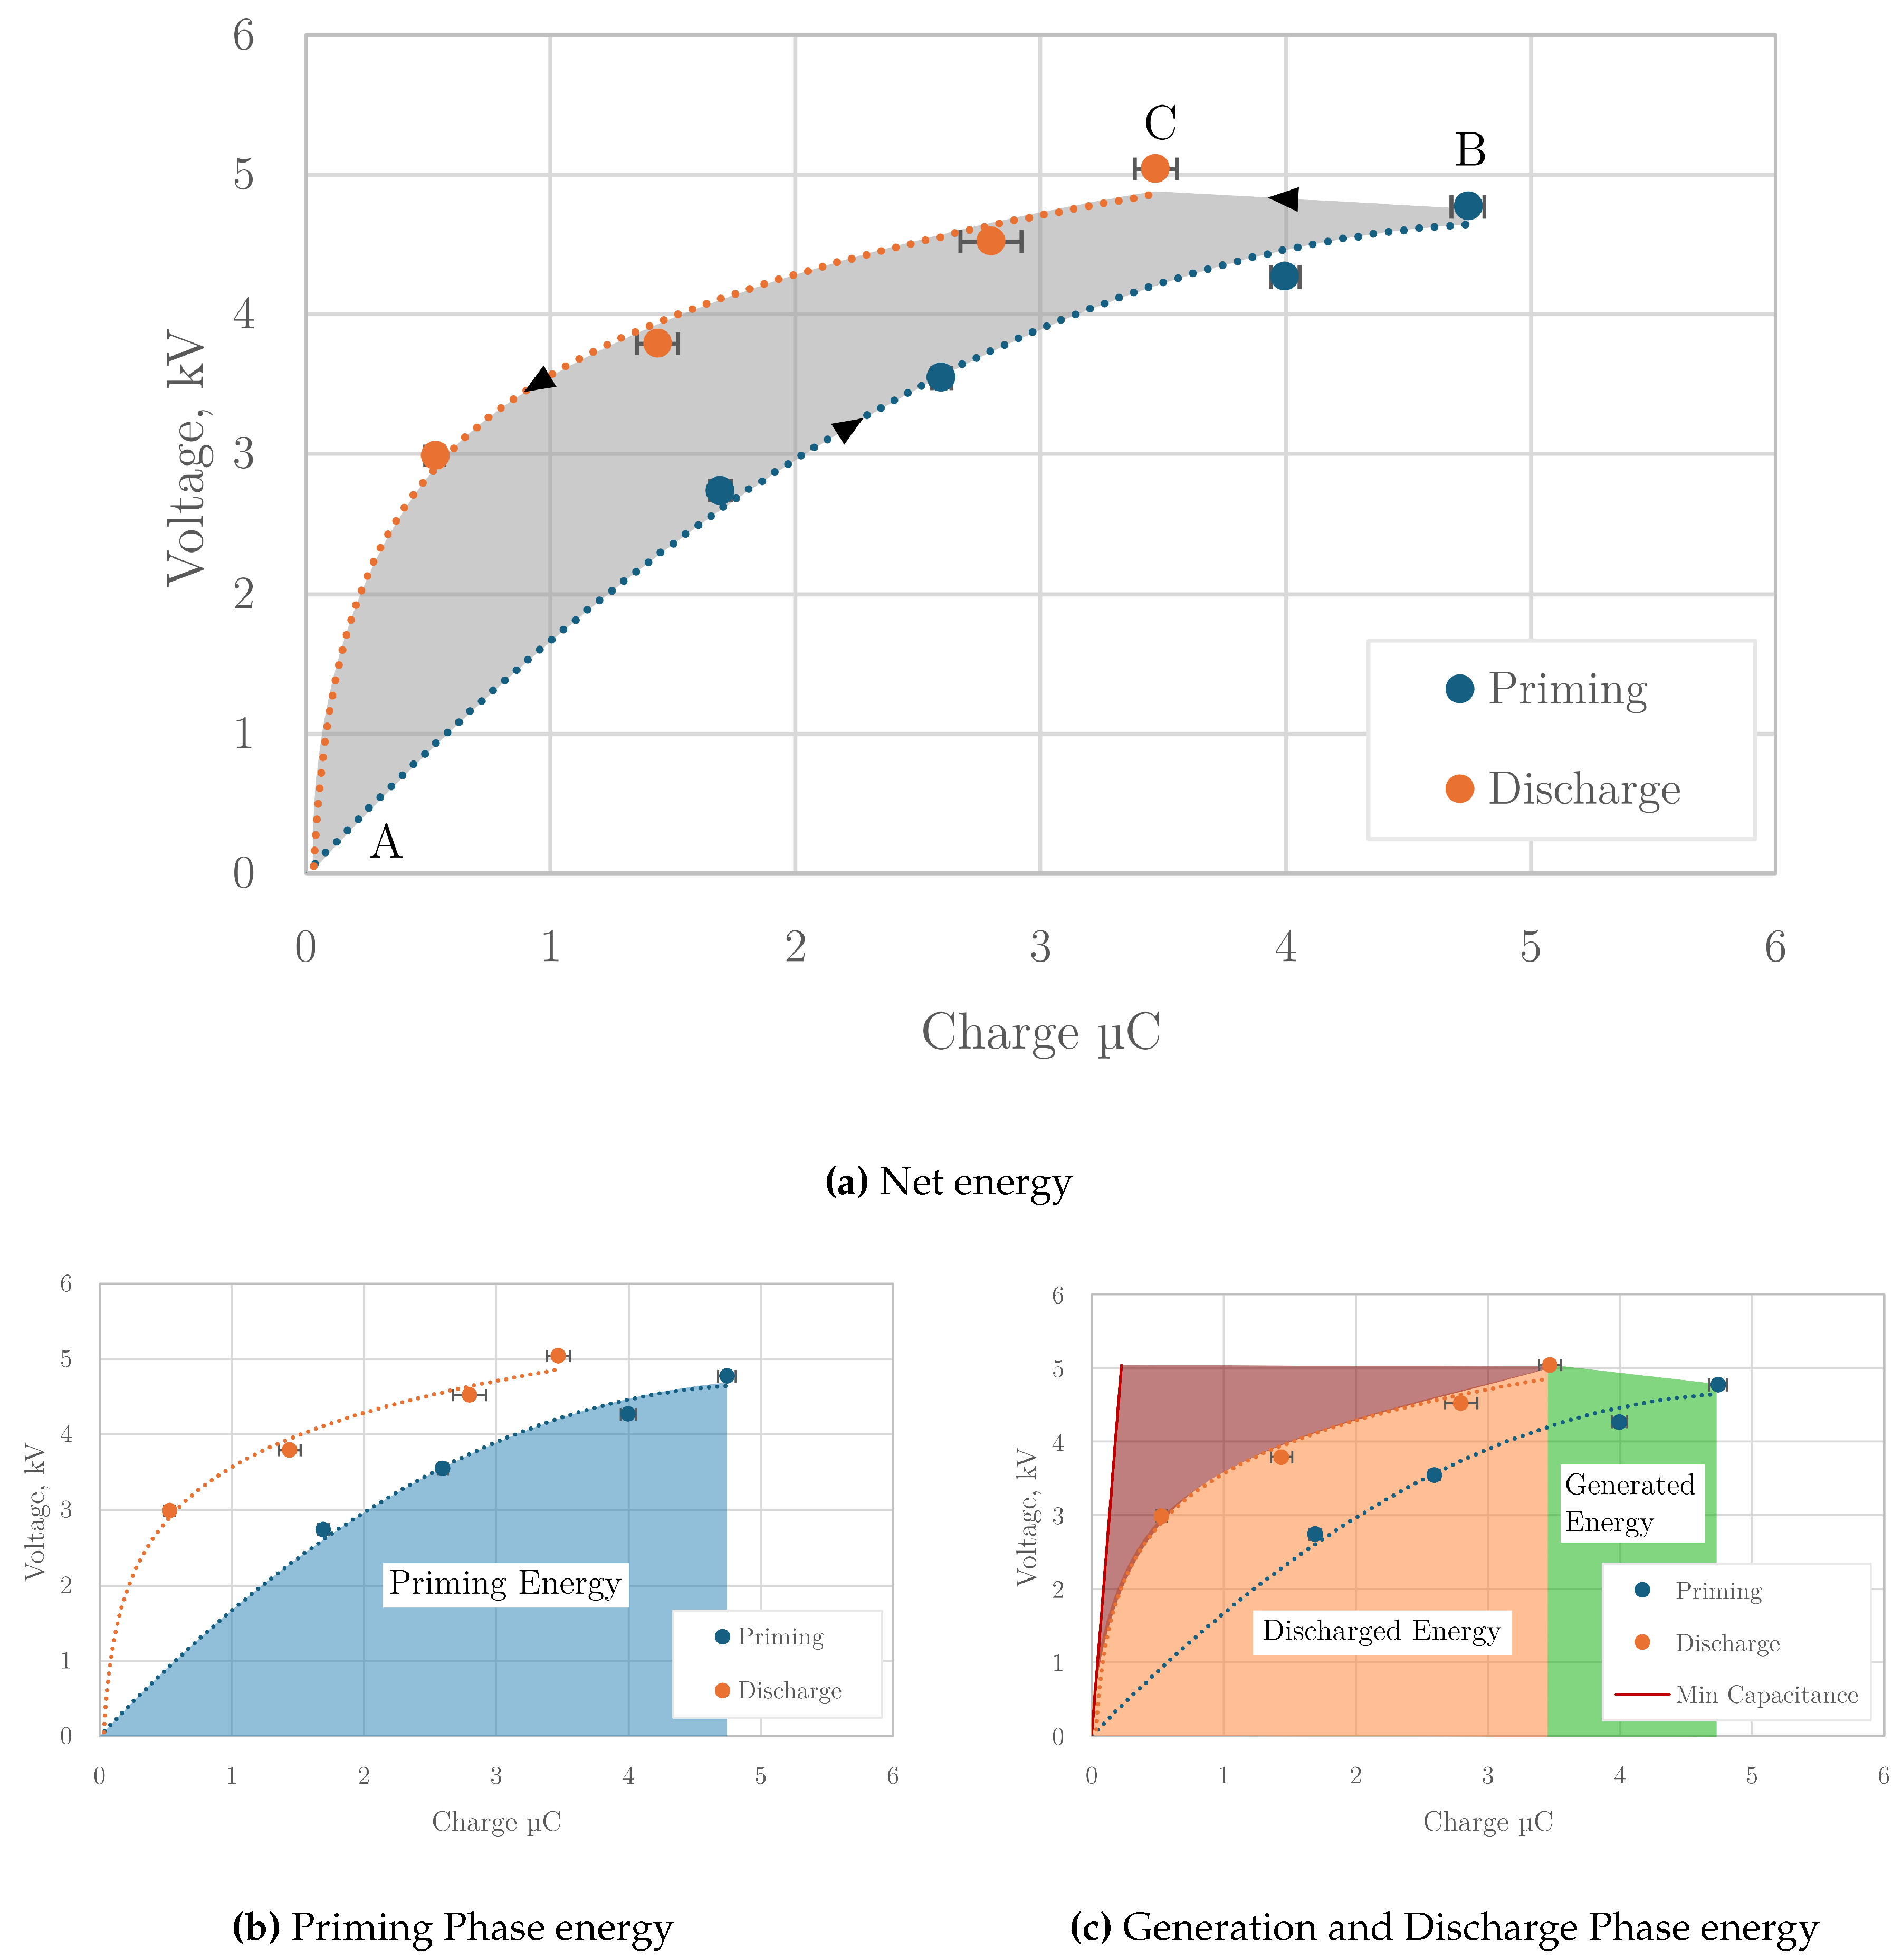
Figure 8.
Net, positive, and negative energy through HASEL generator for entire energy harvesting cycle as a function of the priming voltage for different applied weights: (a) Net energy generated by the HASELs as a function of priming voltage and applied weight compared with the analytic maximum; (b) positive energy is the sum of the Generation Phase and Discharge Phase energy: ; (c) negative energy is consumed in the Priming Phase: .
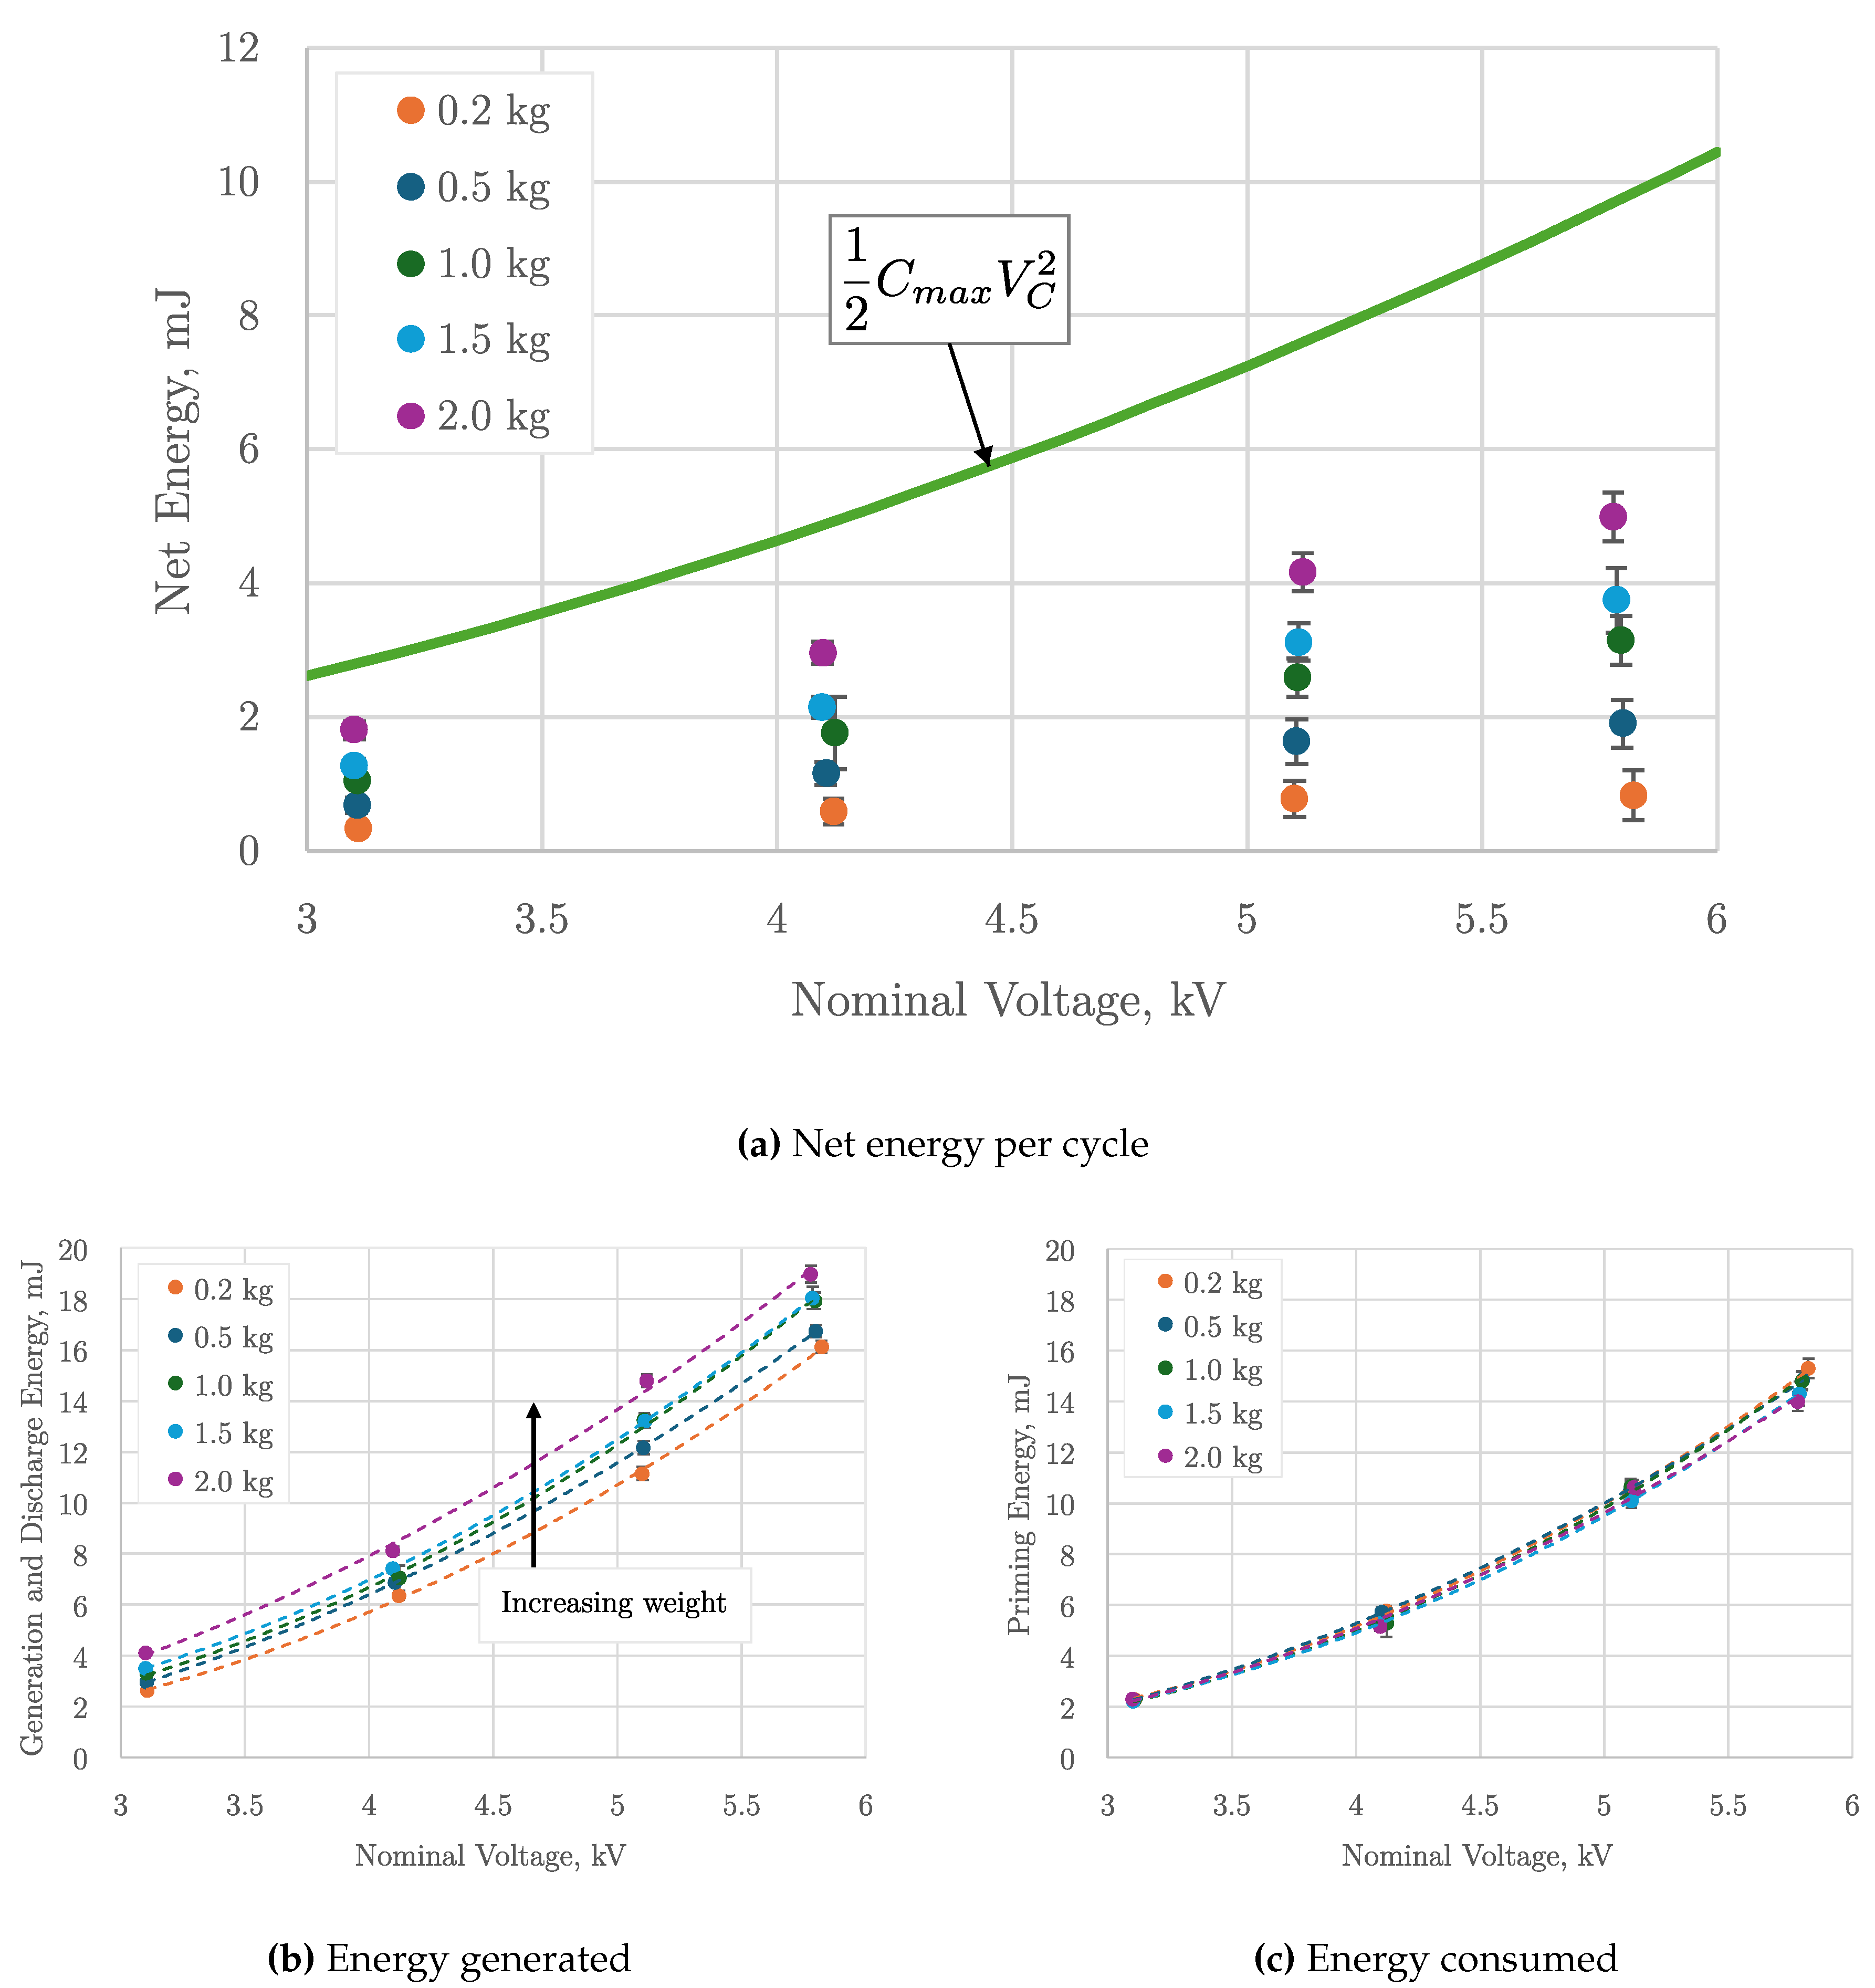
Figure 9.
Mechanical efficiency of HASEL electricity generation. The dashed line is the Pareto frontier, which defines the analytic boundary of optimal performance and the feasible region (under the curve). Two operational regions can be identified: "high efficiency–low power" and "high power–low efficiency."
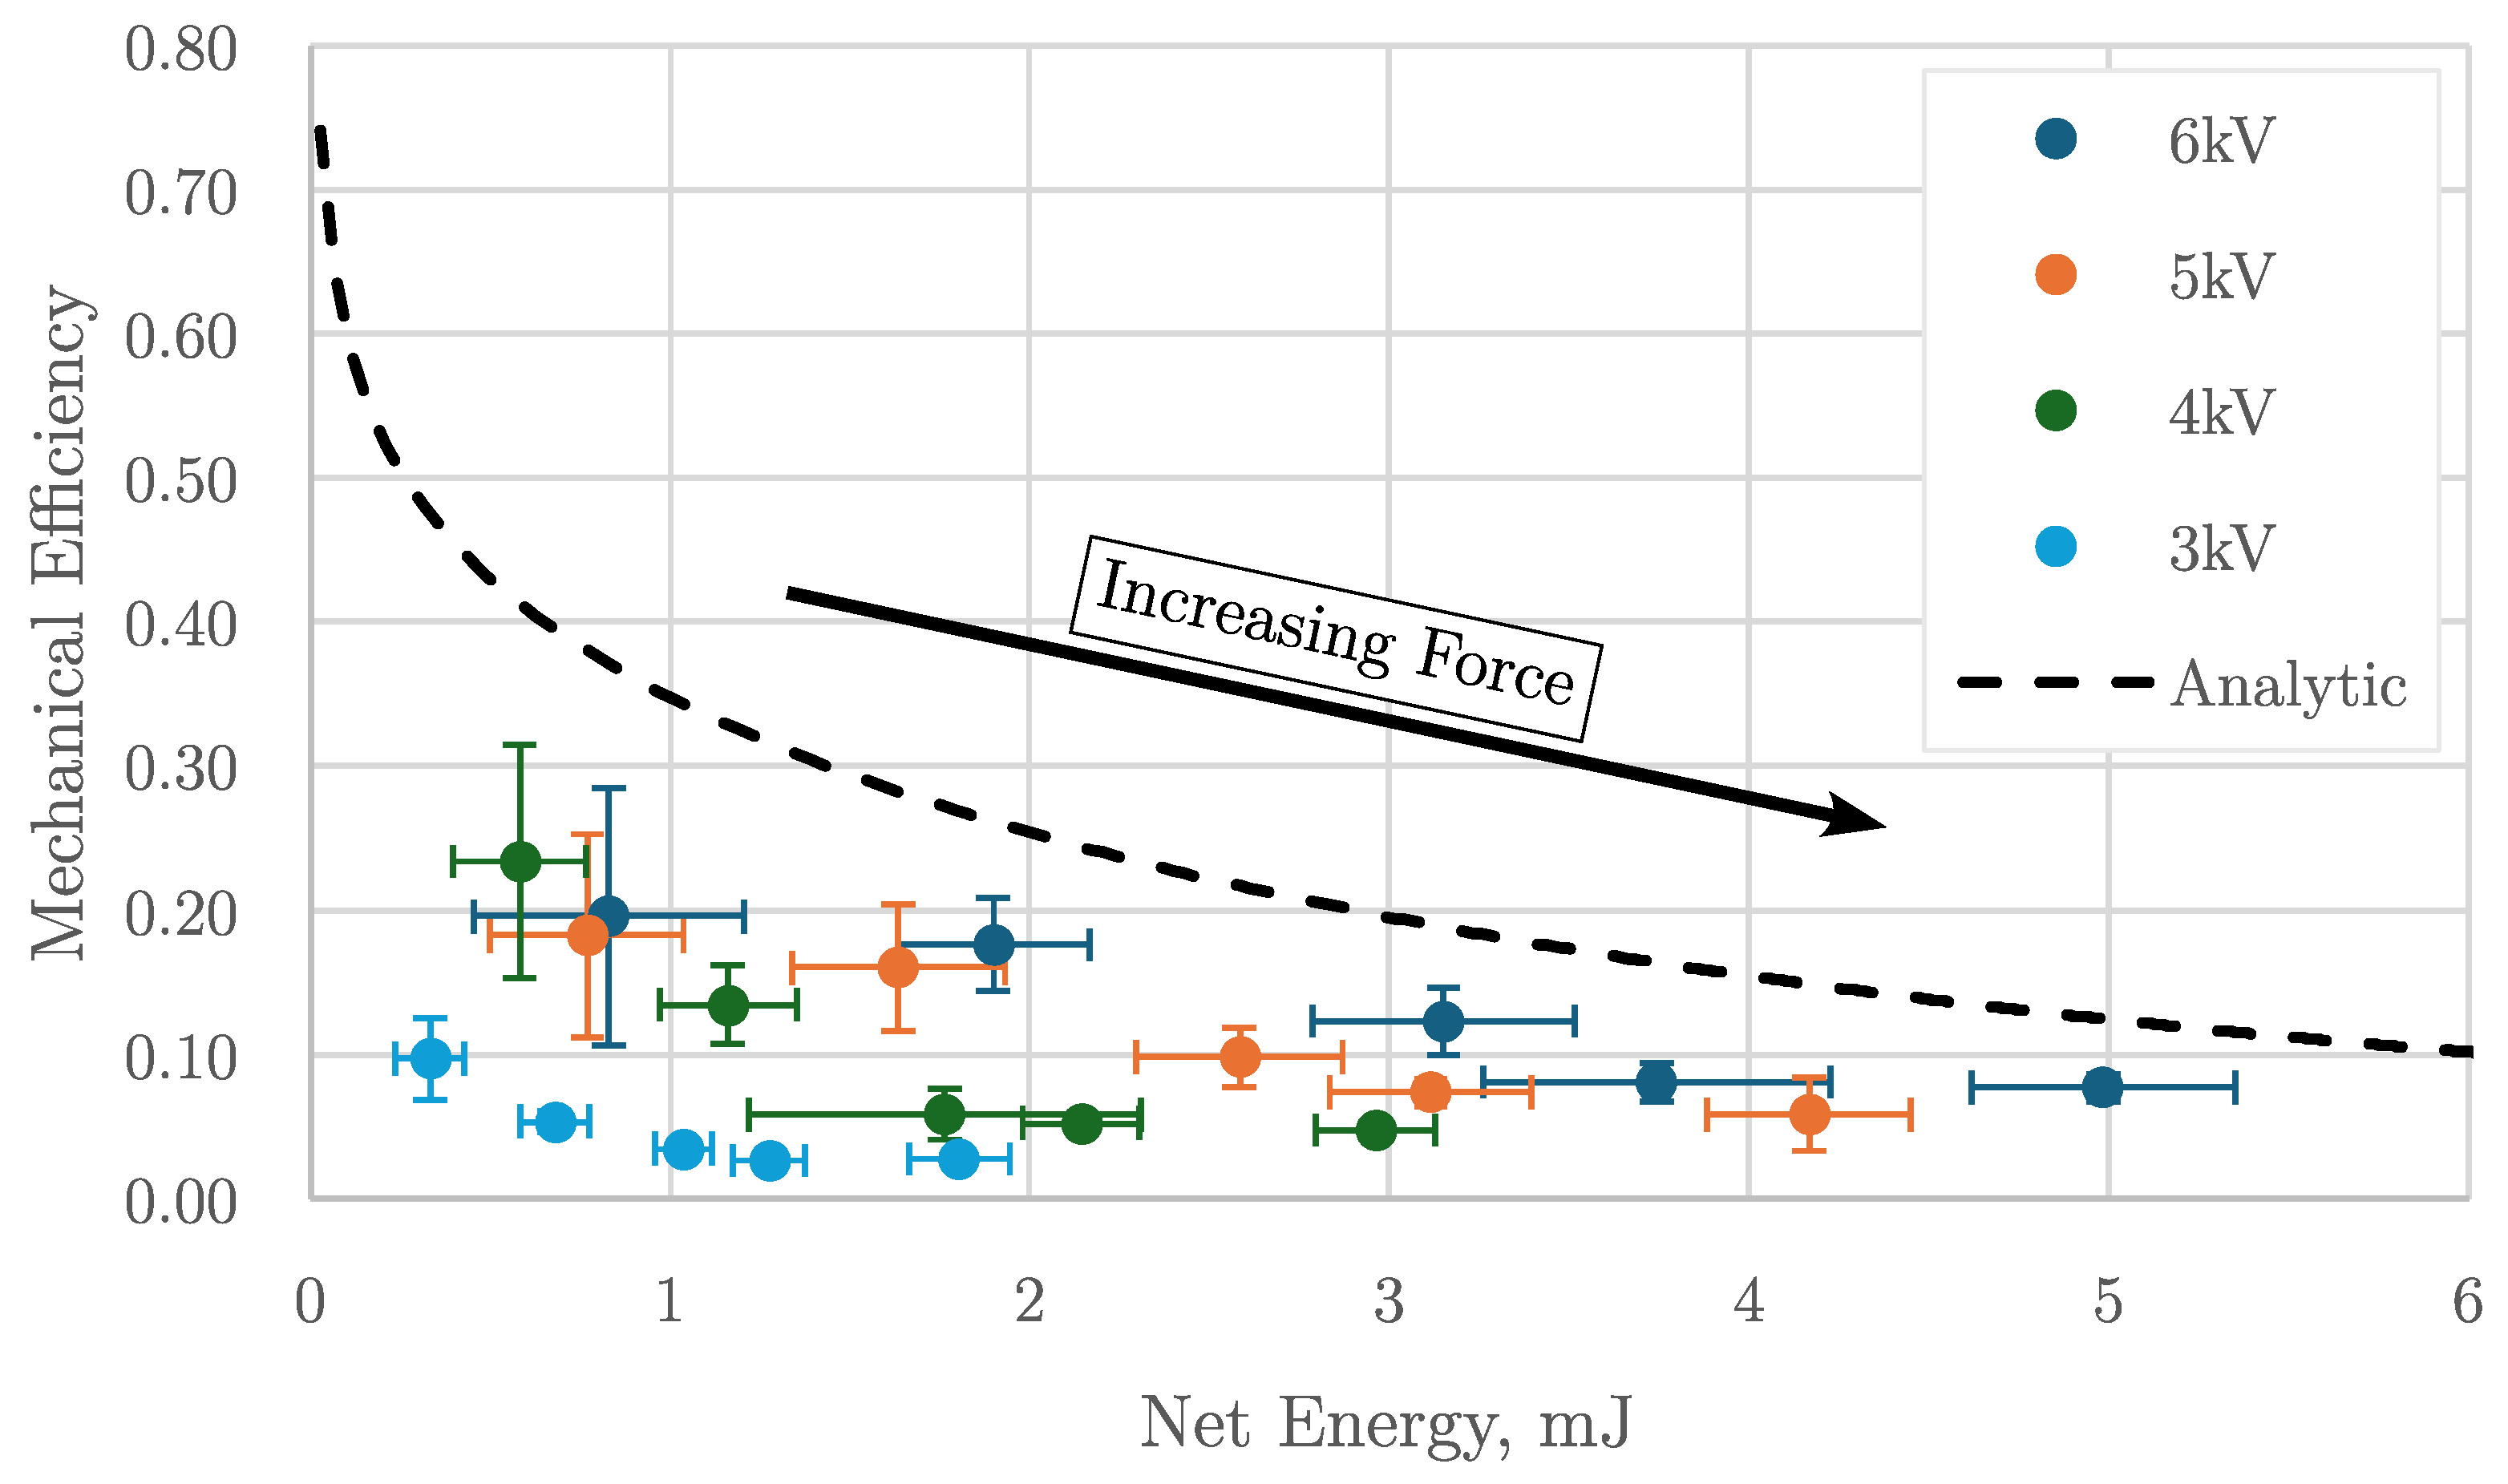
Figure 10.
Capacitance as a function of displacement as the HASEL unzips. The HASEL’s capacitance has the highest sensitivity to displacement near its fully unzipped state. The line is the result of the analytic model.
Figure 10.
Capacitance as a function of displacement as the HASEL unzips. The HASEL’s capacitance has the highest sensitivity to displacement near its fully unzipped state. The line is the result of the analytic model.
Disclaimer/Publisher’s Note: The statements, opinions and data contained in all publications are solely those of the individual author(s) and contributor(s) and not of MDPI and/or the editor(s). MDPI and/or the editor(s) disclaim responsibility for any injury to people or property resulting from any ideas, methods, instructions or products referred to in the content. |
© 2024 by the authors. Licensee MDPI, Basel, Switzerland. This article is an open access article distributed under the terms and conditions of the Creative Commons Attribution (CC BY) license (http://creativecommons.org/licenses/by/4.0/).
Copyright: This open access article is published under a Creative Commons CC BY 4.0 license, which permit the free download, distribution, and reuse, provided that the author and preprint are cited in any reuse.


