Submitted:
25 November 2024
Posted:
25 November 2024
You are already at the latest version
Abstract
Sensory evoked potentials (EPs), namely somatosensory, visual and brainstem acoustic EPs, are used in neurosurgery to monitor the corresponding functions with the aim of preventing iatrogenic neurological complications. Functional deficiency usually precede structural defect, being initially reversible, and prompt alarm may help surgeons to achieve this aim. However, sensory EPs registration requires presenting multiple stimuli and averaging of responses, which signifi-cantly lengthen this procedure. As delays can make intraoperative neuromonitoring (IONM) in-effective, it is important to reduce EP recording time.
The possibility of speeding up EP recording relies on differences between IONM and clinical neurophysiology (CN; all sensory EPs were borrowed to IONM from CN). Namely, in IONM, the patient is her/his own control and neurophysiologist is less constrained by norms and standards when in CN. Therefore, neurophysiologist can perform personalized selection of op-timal locations of recording electrodes, frequency filters passbands and stimulation rates. Vary-ing some or all of these parameters, it is often possible to significantly improve signal-to-noise ratio (SNR) for EPs, and accelerate EP recording by up to several times.
The aim of this paper is to review how this personalized approach is or may be applied during IONM for recording sensory EPs of each of abovementioned modalities. Also, the problems hindering implementation and dissemination of this approach and options for overcoming them are discussed here, as well as possible future developments.
Keywords:
intraoperative neurophysiological monitoring
; somatosensory evoked potentials
; visual evoked potentials
; brainstem acoustic evoked potentials
; signal-to-noise ratio
; frequency filters
; stimulation rate
; personalized approach
1. Introduction
Intraoperative neurophysiological monitoring (IONM) has been widely used in neurosurgical operations in recent two decades to prevent iatrogenic postoperative neurological complications. Registration of sensory evoked potentials (EPs) – somatosensory (SSEPs), visual (VEPs) and brainstem acoustic (BAEPs) is used to keep in check corresponding sensory functions during brain surgeries performed under general anesthesia. In all these cases, the stimuli of certain modality are delivered to a patient, and the responses to them are recorded from the corresponding areas of the cerebral cortex, brainstem structures or peripheral elements of the nervous system. The responses obtained at the beginning of the surgery are taken as a baseline, and those obtained during the operation are compared with them. If signs of intraoperative deterioration of the monitored function appear (these are, first of all, a decrease in amplitude and/or an increase in the latency of certain peaks in EP curves), the neurophysiologist informs the surgeons about it, and the latter, if possible, take actions to protect the neural structure at risk.
Sensory EPs have two fundamental drawbacks that can significantly reduce their effectiveness as a means of preventing iatrogenic neurological complications. First, like other monitoring methods, they detect a dangerous situation only when the dysfunction has already begun. Fortunately, in many cases functional deficiencies precede structural defect and are reversible at an early stage, which partially compensates for this drawback; however, a necessary condition for this compensation is prompt informing of surgeons about the signs of the onset of dysfunction. And at this stage the second drawback comes into play: recording of sensory EPs can take quite a long time. This is due to the fact that the amplitudes of the measured neural responses to the sensory stimulation are usually one to two orders of magnitude lower than the background (not associated with stimuli) activity of the nervous system, which can be considered noise from the point of view of EP recording. In addition, electrophysiological signals recorded in the operating room may contain significant noise from external electromagnetic fields. The classic solution to the problem of small signal-to-noise ratio (SNR) is to use the averaging method: the same stimulus is presented repeatedly and response segments time-locked to the moments of stimulus presentation are summed and averaged. The average value for stimulus-unrelated activity tends to zero with an increase in the number of averages, whereas responses to stimuli time-locked to them are preserved during averaging. The required number of averages depends on the SNR and, according to existing recommendations for recording sensory EPs, is up to 100–200 in the case of SSEPs [1] and VEPs [2] and up to 1000–2000 in the case of BAEPs [3,4]. The stimulation rate is limited by the properties of the nervous system, and resulting duration of EPs recording is from tens of seconds to several minutes. It is usually necessary to record several EPs of the same modality (for example, when stimulating the right and left sides), and multimodal monitoring is also a common option. Consequently, the intervals between successive records of sensory EPs may be too long, creating the risk of providing the surgeons with too delayed feedback and, accordingly, reducing the effectiveness of monitoring.
However, this problem could be solved, if one finds the ways to increase the SNR, which will reduce the required number of averages and allow controlling sensory EPs more often. And such methods exist indeed because, as noted above, in IONM the patient serves as her/his “own control.” This allows neurophysiologists to use a personalized approach to the choice of the parameters of signal recording and the methods of signal processing, as well as to vary the characteristics of the presented stimuli. Indeed, while in traditional clinical neurophysiology (CN) the task is to compare the EPs obtained from the patient with the normative ones, in IONM the task is different – to identify changes in EPs during surgery. In the first case, the recording and processing of EPs must be carried out with the same parameters as when obtaining normative data. In the second, these parameters can be varied between monitoring sessions: it is only necessary that the recorded responses are clearly distinguishable, and their changes are easily detected. This and other differences between registration of sensory EPs in outpatient clinics and their intraoperative monitoring are listed in Table 1.
This review examines the most effective methods for increasing SNR for SSEPs, BAEPs, and VEPs recording during brain surgery; namely, personalized selection of recording electrodes localization, frequency filter bandwidth, and stimulus frequency. Theoretical justifications for using these methods and examples of practical implementation of a personalized approach to monitoring sensory EPs are provided. In addition, factors that may hinder the implementation of a personalized approach to intraoperative monitoring of sensory EPs are analyzed and options for overcoming these problems are proposed as well as possible future developments.
2. Main Parameters to Be Optimized for Intraoperative Monitoring of Sensory Evoked Potentials
As noted above, one of the main problems in intraoperative monitoring of sensory EPs, which reduces its effectiveness, is the necessity to use the averaging method, which prolongs their registration. The possibility to optimize parameters of sensory EPs registration for their faster acquisition was first mentioned in the work of J. Fridman et al. [5]. They showed that the optimal frequency filter selection for the BAEPs registration allows a radical increase in the SNR and a several-fold decrease in the number of averages required to obtain well-reproducible responses. A personalized approach to the neuromonitoring parameters selection (in this case, to the choice of recording electrodes locations for intraoperative monitoring of SSEPs), which was also called “optimization”, was proposed by D.B. MacDonald [6]. The search for the most effective parameters for sensory EPs monitoring is indeed a variant of the classical optimization problem with a multidimensional parameter space, a set of boundary conditions, and an objective function. The later can be either SNR (maximized for a given recording time for EPs obtained by averaging) or the duration of EPs recording (minimized for a given target SNR). The main parameters to be optimized are the localization of the recording electrodes, the passband of the frequency filter, and the stimuli presentation rate.
Localization of recording electrodes. Since EPs are a type of bioelectrical activity, their registration requires measuring the difference in electrical potential between two electrodes. The location of one of these electrodes is usually predetermined by the localization of the area in which the activity is being monitored; it is usually located as close as possible to this area and is called active. The second electrode, the reference, relative to which the potential on the active electrode is measured, is commonly located in the area with minimal own activity. In the case of sensory EPs of cortical origin (VEPs, cortical SSEPs), their sources in many cases can be adequately represented using the equivalent dipole model [7]. In this situation, the location of the reference electrode at the projection of the opposite pole of the dipole may allow obtaining higher signal amplitude than with the “zero” reference. Moreover, if the orientation of equivalent dipole is tangential to the cranial surface, the optimal location of not only the reference, but also the active electrode can be quite far from the true source of activity. Importantly, such factors as individual neuroanatomical features, the impact of existing pathology, differential effects of anesthetics and brain shift, which may occur during surgery lead to significant variability in the optimal placings of the electrodes among patients, rising the task of their personalized selection. Also of note is that changes in the volume conductivity associated with incision, trepanation and opening of the dura mater can significantly change the configuration of the potentials distribution on the scalp, especially if an intracranial air gap occurs at the cortical projection zone of the monitored sensory modality. In this regard, the final choice of the optimal localization of recording electrodes should be made after opening the dura mater. During brain surgeries, the head surface is usually inaccessible for placing new electrodes, so all electrodes, among which it is planned to select the optimal combinations, must be installed at the stage of preparation for the operation.
Passband of the frequency filter. The frequency filter is a powerful tool that allows cutting off activity with irrelevant frequency characteristics when registering Eps; this tool is almost always in use when registering sensory EPs [1,8,9]. The recommended passband of the frequency filter for registering EPs in outpatients is usually quite wide, since in this case it is important to compare the characteristics of the undistorted signal with the normative data. In the case of IONM, the patient is her/his own “control” and even in the presence of filtering distortions, they equally affect both the baseline and the subsequently obtained data, without hindering the feasibility to detect changes in latencies and amplitudes of EP peaks. This allows for more “aggressive” filtering, with significantly narrowed filter passband. However, narrowing the passband not only distorts the shape of EPs, but also decrease amplitudes of their peaks, creating a trade-off between the reductions of amplitudes of noise and signal. At the same time, the characteristics of the frequency spectrum of both the EPs themselves and the activity regarded as a noise during EPs registration (true noise and background EEG and EMG) vary among patients and are also subject to significant influence of anesthetics. This is what calls for a personalized choice of the frequency filter passband.
Stimuli presentation rate. For each modality of sensory EPs, the existing recommendations suggest using its own stimuli presentation rate: from about 1 Hz for VEPs [9] to 2–5 Hz for SSEPs [1] and 10–15 Hz for BAEPs [3]. In order to minimize the time required for recording EPs, it would be desirable to present stimuli as frequently as possible. However, an increase in frequency is limited, firstly, by the need to avoid overlapping of responses to successive stimuli, and secondly, by the phenomenon of attenuation of responses when stimuli are delivered too frequently. The first factor limits the presentation rate of visual stimuli to about 3 Hz, somatosensory stimuli to 20 Hz for stimulation of the upper limbs and 15 Hz for stimulation of the lower limbs, and acoustic stimuli to 100 Hz. The second factor creates another trade-off: at a certain frequency, the effect of decreasing the amplitudes of the EPs begins to outweigh the effect of increasing the stimulation frequency. However, for BAEPs and SSEPs, there are studies [10,11] indicating that, in terms of accelerating the EPs recording, the optimal stimulation frequency is higher than that given in clinical recommendations, including that for IONM. There is also some room for a personalized approach regarding this parameter: the relation between the increase of stimulation rate and the EPs attenuation varies among patients and depends not only on individual characteristics and the effects of existing dysfunctions, but also on the depth of anesthesia, body temperature, etc. As an additional note, it should be mentioned that if artifactual oscillations with a fixed frequency are observed during the record, a small (a few percent) change in the stimulation frequency in any direction may sometimes significantly improve the quality of the recording. [12]. The network interference is a fixed frequency artifact that is almost always present, having a frequency of 50 or 60 Hz depending on the country. Therefore, when selecting the optimal stimulation frequency, values that are submultiple of the network frequency should be avoided.
Thus, for all three parameters considered, their personalized optimization is possible to minimize the time required to record the EPs with a given SNR, or to maximize the SNR of the obtained EPs under given time constraints. Below, the options for this optimization will be considered for each of the three modalities of sensory EPs used in IONM..
3. Somatosensory Evoked Potentials
SSEPs have a long history of use in IONM and are the most widely used sensory EPs for IONM [1]. This probably explains the best development of their monitoring methodology, including the issue of its personalization. The latter can be largely attributed to the merits of D.B. MacDonald, who has been promoting the idea of optimization of (de facto personalized approach to) SSEPs monitoring for more than 20 years [6,13,14,15,16]. In the first publications [6,13] optimization concerned the optimal choice of derivations for recording cortical SSEPs from the lower extremities. It was shown that, firstly, the then recommended derivation CPz–FPz1 was not optimal for any patient, and secondly, that several variants were preferred, which could be different for different patients and even for different stimulation sides in the same patient. The derivations being optimal most frequently were Cz–CPc and CPz–CPc; Pz–CPc, CPi–CPc and some other variants were also optimal for a little number of patients. Compared with the CPz–FPz derivation, the optimal variants allowed an increase in SNR by more than 2 times on average, and a decrease in the required number of averages by 4 times.
Neuroanatomically, the superiority of the “transverse orientation” of leads over the “longitudinal orientation” when recording cortical SSEPs from the lower extremities is quite understandable: the cortical representation of foot is located in the interhemispheric fissure [17] and the axis of the corresponding equivalent dipole [7] is oriented across its plane tangentially to the surface of the skull. Accordingly, in the “transversely oriented” leads, the two electrodes occur in zones with opposite polarity of potential, and in the “longitudinally oriented” ones – near the equipotential line. For SSEPs from the upper extremities, this “dipole effect” is expressed to a lesser extent, since the cortical representation of the hand is located convexitally, and at least some of the sources of these SSEPs generate a potential equivalent to a radially oriented dipole located close to the skull [7]. As a result, the distribution of potentials on the scalp varies among patients to a lesser extent. Accordingly, the study by MacDonald et al. [14] showed that in most cases the CPc–CPz derivation was optimal, which they recommended to adopt as the standard. At the same time, in some patients the CPc–Fz and CPc–CPi derivations occurred optimal, which were recommended to be adopted as possible alternatives. The current ISIN clinical guidelines [15] propose using the above-described approaches to the choice of derivations when monitoring cortical SSEPs from the lower and upper extremities. In a more recent position statement by the ACNS [1], the localization of active electrodes coincides with that proposed by MacDonald, and the question of reference electrodes localization is omitted, which leaves the neurophysiologist the freedom of choice even if she/he is obliged to follow published standards.
Since the personalized approach involves placing recording electrodes in advance in several locations (see the previous section), with a sufficient number of channels in the equipment used, it becomes possible to record SSEPs simultaneously from several derivations. The advantage of multichannel EPs is the ability to avoid false alarms in cases when signs of dysfunctions in SSEPs are observed only in one of the derivations, while in the remaining SSEPs do not change significantly [19]. Such a situation may arise, for example, when a local intracranial air gap appears near the resection zone after removal of a large volume of pathological tissue.
It should be noted that in the above reasoning, SNR was determined in fact only by the amplitude of the SSEPs itself (signal), and the noise factor, both from the background EEG and myographic, was ignored. For intraoperative monitoring of cortical SSEPs, this approach turns out to be acceptable, since when recording them, it is permissible to use a high-pass filter (HPF) up to 30 Hz and a low-pass filter (LPF) of about 300 – 500 Hz, which is directly indicated in modern clinical guidelines [1,15]. With such filtering, high-amplitude “EEG noise” in the alpha range is almost completely suppressed and the amplitude of EMG artifacts is significantly reduced. As a result, when using this filter, it is almost always possible to select the localization of the SSEPs recording electrodes without taking these factors into account. At the same time, the range of 30 – 300 Hz is wide enough and in most cases contains the frequencies corresponding to the SSEPs waves analyzed during monitoring [20]. In such a situation, there is often no need to specifically select a personalized frequency filter passband for the SSEPs. However, in cases, for example, of a significant effect of the existing pathology or excessive depth of anesthesia, SSEPs can slow down considerably, which may require lowering the lower passband edge, especially for SSEPs from the lower extremities. And, when using a high stimulation rate (see below) together with interleaving stimulation, the stimulation artifact from the next limb may overlap with the response from the previous one. In this case it may be necessary to raise the upper passband edge so that these sharp high-amplitude artifacts are clearly distinguished from true SSEPs.
The possibility of varying the stimulation frequency when monitoring cortical SSEPs is discussed in the recent position statement by ASNM [1]. It is proposed to use a stimulus frequency of 2 to 5 Hz for SSEPs from the lower limbs, with the possibility of increasing it to 9 Hz for SSEPs from the upper limbs. The possibility of improving the quality of responses by using a stimulation frequency near the lower limit was also mentioned, especially for the cases with pre-existing dysfunctions [16]. In a recent study by Dimakopoulos et al. [11], a direct comparison of SNR achieved for a fixed recording time at different stimulation frequencies was performed for cortical SSEPs from the upper and lower extremities. For the upper extremities, it was shown that when the recording duration was limited to 5 seconds, the maximum SNR (median value of about 22) for the N20 peak was achieved at a stimulation frequency of 12.7 Hz, and for 10 and 20 seconds, at a stimulation frequency of 4.7 Hz (median SNR values of about 35 and about 55, respectively). For the lower extremities, the optimal option was a stimulation frequency of 4.7 Hz in all cases, with median SNR values for the P40 peak of about 20, 30, and 35 at 5, 10, and 20 seconds of recording, respectively. These values for the stimulation frequency were obtained in the group level analysis, and the interindividual scattering was very large (e.g., the interquartile range for the SNR for the N20 peak at 12.7 Hz stimulation was about 20 with a median of about 22). Therefore, they should not be considered as recommendations for all individual cases. However, they can be used as a starting point for personalized selection of stimulation rate. Of note, the proposals to increase the stimulation rate are met with some objections, citing the fact that a decrease in SSEPs amplitudes is already observed when moving from 1 to 3 Hz and continues with a further increase in rate [21]. However, the data presented in this publication show that the amplitudes of the SSEP peaks for the stimulation rates from 1 to 5.5 – 8.5 Hz decrease to a much lesser extent than the increase in rate, which makes this increase justified for the task of quickly obtaining well-reproducible responses.
In general, for intraoperative SSEPs monitoring, the issue of personalized optimization of its parameters has been well developed by now, and modern clinical guidelines directly or indirectly mention the possibility of its use [1,15]. The use of optimization in combination with interleaving stimulation allows in many cases to obtain SSEPs from all four extremities in less than one minute, which allows informing surgeons promptly about the appearance of dysfunction signs and increases the effectiveness of monitoring [16].
4. Visual Evoked Potentials
For VEPs, IONM standards have not yet been developed, and publications describe methods for their registration that differ significantly in electrode localization, frequency filter ranges, and the number of averages used in VEPs registration. Some of these publications and the parameters of intraoperative VEP recording addressed in them are presented in Table 2. It is worth noting that almost none of these works substantiated the choice of these parameters. Below, we will consider the advantages and disadvantages of various options for each of these parameters, and propose an algorithm for their selection for personalized optimization of intraoperative VEP monitoring.
If the VEPs are recorded for clinical diagnostic purposes, the reference electrode is usually recommended to be placed in the Fz lead [9] of the 10-10 [18] EEG electrodes placement system (Figure 1, green); the same choice is sometimes used for intraoperative monitoring of these EPs [22,23]. However, under general anesthesia, the nature of the background bioelectrical activity can change significantly. In particular, under anesthesia with propofol, which is considered the preferred anesthetic for monitoring VEPs [24], anteriorization of the alpha rhythm occurs [25]. A similar effect occurs in some patients under inhalation anesthesia with sevoflurane [26]. As a result, the reference electrode in the frontal region turns out to be a source of high-amplitude “EEG noise”, which makes it preferable to place reference electrodes in other areas where background EEG activity is lower. Indeed, reference electrodes placements have been described not only in the medial frontal region (Fz) [22,23], but also on the earlobes (A1/A2) [27,28,29], on the mastoids (M1/M2) [30], and posterior to the vertex (CPz) [31].
Adapted from “Intraoperative monitoring of visual evoked potentials: experience of 240 operations,” by E.A. Levin, M.G. Kilchukov and A.A. Glushaeva, 2024, Neyrokhirurgiya = Russian Journal of Neurosurgery, 26 (3), p.59, Figure 1a (https://doi.org/10.17650/1683-3295-2024-26-3-57-71). CC BY 4.0 (https://creativecommons.org/licenses/by/4.0/).
In our recent publication [32], we described the use of a personalized approach to selecting the reference electrode in VEPs recording. For this purpose, when preparing for monitoring, we installed possible reference electrodes in four positions: Fz, Cz, M1 and M2, and active electrodes in three: O1, O2, Oz – in the left, right and medial occipital regions (Figure 1). After that, we recorded VEPs 2–3 times before the start of the surgery, using all variants of reference electrodes, and then selected combinations of electrodes for further monitoring basing on the criteria of reproducibility, distinguishability and amplitude of the peaks of the obtained VEPs, also taking into account various options for frequency filtering of the signal (see below). A retrospective analysis of 240 surgeries in which VEPs monitoring was performed using this approach showed that M1/M2 were selected in 47% of cases, Fz in 24%, CPz in 23% (Figure 1, derivations shown in red, green and blue, correspondingly). Another 3% each were for combinations with an occipital reference electrode (derivations O1–O2/O2–O1, Figure 1, black) and for cases in which VEPs could not be obtained for neither the left nor the right eye with any combination of electrodes. This diversity might be explained by the fact that in various patients and situations effects of different types of noise may prevail. On the one hand, in the flash VEPs, the most reproducible and well-defined is the N2–P2–N3 complex with latencies of the corresponding peaks of about 75, 110, and 150 ms [9] (p. 7, Fig. 4), and these peaks are usually monitored in VEPs. These oscillations correspond to a frequency of about 15 Hz, and consequently the attempts to reduce the effect of “EEG noise” in the alpha range (8 - 13 Hz) by frequency filtering are often substantially limited by the trade-off between noise suppression and the need to avoid significant suppression of the controlled response itself. This trade-off and other effects of applying different filters to VEP monitoring data is demonstrated in Figure 2. On the other hand, reference electrodes in the temporal region (M1 / M2 / A1 / A2) are susceptible to myographic artifacts from the temporal, masseter and sternocleidomastoid muscles, especially if the need to control motor functions (e.g., oculomotor) deters the use of muscle relaxants. It could seem that the best option should be CPz, located in the area devoid of cranial muscles and outside the zone of anteriorized alpha rhythm. However, in this case, the amplitude of the recorded VEPs is reduced by the relative proximity of CPz to the active electrodes. Thus, there is no clearly preferred option for localizing reference electrodes when monitoring VEPs, and an individual approach to each case is required to obtain the best SNR. In the case of VEPs this is perhaps most evident, but remains true for other sensory EPs as well.
The variants of frequency filters used in intraoperative VEPs monitoring are no less diverse (see Table 2) than the variants of the used derivations. The use of frequency filter passbands from 1–5 to 100 Hz (corresponds to the standard for clinical VEPs) [2,22,23,33], from 20 to 500 Hz [30,34], from 10 to 1000 Hz [24,27], from 2 to 400 Hz [31], from 0.1 to 200 Hz [28] is described. In the case of VEPs, the choice of the optimal frequency filter passband, especially its lower limit, is a more complex task than for SSEP, since, as mentioned above, VEPs partially overlap with the alpha rhythm range of the background EEG. Since the characteristics of the VEPs, the alpha rhythm range, their responses to anesthetics and existing pathologies vary among patients, the passband of the frequency filter should be selected individually. In cases of prechiasmal lateralized pathology, the optimal options may even differ for different eyes of the same patient. With regard to frequency filtering, we also used a personalized approach [32] – simultaneously with the selection of reference electrodes. At the beginning of the surgery, after recording the VEPs using different variants of reference electrodes locations, we tried different frequency filtering options on all of them, choosing combinations of derivations and filters based on reproducibility, distinguishability and amplitude of the VEP peaks. In the case of VEPs, simultaneous optimization by two parameters is important. Indeed, if more aggressive filtering is possible, the contribution of “EEG noise” to the SNR value will be significantly reduced, which means that the derivations that maximize the VEPs itself will be preferable. If a “softer” filter is used, then derivations with high background EEG amplitude will be suboptimal. The analysis of 240 operations revealed that the optimal frequency filter boundaries vary over a wide range (Table 3). The most used high-pass filter was the one with a cutoff frequency of 10 Hz, and the most used low-pass filter – with a cutoff at 200 Hz, but the 10–200 Hz passband was used in less than half of the cases. Thus, as with derivations selection, it is impossible to offer a frequency filter option that suits almost everyone. The use of a personalized approach here is also well justified.
During VEP monitoring, the stimulation rate is limited mainly by the retinal adaptation time; the recommended frequency in most studies is 1 Hz (see Table 2): as the frequency increases, the amplitude of the responses decreases. Moreover, in some cases, response exhaustion is observed even at a stimulation rate of 1 Hz. In such situation, paradoxically, reducing the stimulation frequency can lead to an acceleration of EPs acquisition by reducing the required number of averages [32].
The issue of personalized optimization of intraoperative VEPs monitoring is only beginning to be developed, but the potential for its application seems to be no less than for SSEPs. Indeed, after the start of using a personalized approach to VEPs monitoring, we were able to reduce the number of averages from the generally accepted 100 to 20–50 [32]; and in a large number of cases, excellent reproducibility of VEPs was achieved already with 20 averages as demonstrated in Figure 3. Personalized optimization of VEP monitoring deserves wider dissemination and hopefully would be included in clinical recommendations when they are developed.
5. Brainstem Acoustic Evoked Potentials
Unlike cortical SSEPs and VEPs, in BAEPs, in accordance with the name, the activity of the brainstem nuclei (cochlear nucleus, peak III; superior olivary complex and lateral lemniscus, IV; lateral lemniscus and inferior colliculus, V) and the vestibulocochlear nerve (peaks I and II) are recorded [8]. The potentials of these structures, recorded on the surface of the head, have latencies and amplitudes that are an order of magnitude smaller than that of EPs of cortical origin. As a result, the number of averages required to record BAEPs reaches 500–2000 [3,35], which is partially compensated by the possibility to deliver stimuli with a high rate. However, the BAEPs recording duration can reach 2 minutes for each ear [3], and reducing it could significantly improve the BAEPs monitoring.
The recommended derivations for intraoperative recording of BAEPs in almost all publications (e.g., [3,4,35,36]) are Mi–Cz and Mc–Cz (where M stands for mastoid processes). If the location of the incision prevents placement of the electrode on the mastoid, it is recommended to place it over the preauricular notch or on the ear lobe (Ai and Ac). As additional options, the Ai–Ac or Mi–Mc and Ncf–Cz (Ncf refers to noncephalic reference) derivations are also suggested [35,36]. The use of several derivations is a standard recommendation because different BAEP waves are generated in different locations and are projected with maximum amplitude in distinct areas of the head surface. Accordingly, if all the main peaks (I, III and V) are usually recorded in standard derivations, then Ai–Ac/Mi–Mc usually “specialize” in peak I, and Ncf–Cz – in peak V. Regarding the latter, Greve et al. [37] showed that the EPi–Cz derivation (EPi is the ipsilateral Erb’s point) provides a statistically significant increase in the amplitudes of peaks IV and V by approximately 50%. At the same time, the authors note that the effect of increasing the signal amplitude can be leveled out by an increase in the noise level. This consideration is highly likely to be relevant for the EPi–Cz derivation. Indeed, a higher level of myographic noise can be expected for EPi than for A1/A2/M1/M2, and surgeries in which BAEP monitoring is executed are often performed without muscle relaxation to allow monitoring of motor evoked potentials and mapping the motor branches of the cranial nerves.
Regarding the frequency filtering during BAEP monitoring, clinical guidelines [3] and other publications [35,36] are also close to consensus: it is proposed to use a cutoff frequency of 100–150 Hz for the HPF, and 2500–3000 Hz for the LPF. A high cutoff for the HPF is possible since the interpeak intervals in the BAEPs do not exceed 3–4 ms even in the case of prolongation due to impacts on the auditory nerve or tract [35]. As a result, the HPF cuts off not only all high-amplitude oscillations of the background EEG, but also network interference. At the same time, a filter with this passband almost completely passes myographic artifacts, which largely explains the optimality of using Cz, located remote from the cranial muscles, as a reference electrode. At the same time, the Mi/Mc/Ai/Ac/Ncf leads are more susceptible to noise; consequently, the single-trial SNR remains low. To solve this problem, a method for selecting the optimal filter for BAEPs registration was proposed back in 1982 [5]. For this purpose, the recorded signal was subjected to Fourier decomposition, after which two indices were calculated and analyzed by making comparisons between stimulus-locked epochs and epochs from background records without stimuli for each frequency subband,. The first index was spectral amplitude attenuation after increasing the number of averages from 200 to 2000. Attenuation in epochs without stimuli was large for the whole band, while for stimulus-locked averages it was small within 450 – 1400 Hz subband. The second index was the mean phase variance across trials. And, again, the phase variance in the 450 – 1400 Hz subband was significantly smaller for stimulus-locked trials. Based on this, the authors concluded that the components outside this subband represent noise and that a 450 – 1400 Hz bandpass filter should be used. As a result, the number of averages for which good reproducibility of responses was achieved was 400, which made it possible to obtain BAEPs in less than a minute even at the relatively low stimulation frequency (10 Hz) used in the study. In 1986, Hammerschlag et al. [38] described the successful use of this method [5] for intraoperative BAEP monitoring. This time, the stimulation frequency was higher (27.8 Hz), and only 5 – 10 sec were required to obtain BAEPs allowing authors to call their method “the real-time monitoring”. Experience of about 70 operations demonstrated the effectiveness of this method with several cases of changes in surgical maneuvers after detecting signs of dysfunction by the BAEPs with subsequent recovery and postoperative hearing preservation. However, despite these results, this approach was not developed further. One of the possible reasons could be excessive smoothness of the filtered BAEPs. In some cases, the morphology of consecutive waves may look quite similar [5] (p. 411, Fig. 5). Being unable to differentiate the waves by their appearance is rather uncomfortable; moreover, it bears a risk of missing the latency shift if this shift is close to the interval between the BAEPs waves. Nonetheless, optimizing the bandpass filter optimization in BAEPs looks promising and deserves to be revisited.
Another way to reduce the time of obtaining BAEPs may be to increase the stimulation rate. Indeed, normally the monitored I–V waves fit into approximately 8 seconds; under the influence of existing pathology and/or anesthetics the latencies may increase, but 15 msec will be sufficient in almost any case. Thus, the theoretical limit of stimulation frequency is about 70 Hz. In the literature, however, various stimulation frequencies are recommended – from 5–12 Hz [3], to 33.1 [36] and 10–40 [4] Hz. Similarly to SSEPs and VEPs, amplitudes of BAEP peaks tend to decrease with increasing stimulation frequency and the question is at what frequency lies the optimum in terms of the speed of obtaining sufficiently reproducible responses. Joo et al. [10] attempted to find it by analyzing the SNR at different stimulation frequencies and numbers of averaging. According to their data, the optimal frequency was 43.9 Hz, which ensured obtaining well-reproducible BAEPs in less than 10 seconds with 400 averaging, which also allowed them to call the resulting technique “the real-time monitoring”. It should also be noted that the authors used an unconventional frequency filter bandwidth of 100–1000 Hz, but did not justify its choice. Perhaps, such “aggressive” filtration allowed them to fare with a relatively small number of averages. In this work, the same stimulation frequency determined at the preliminary stage was used in all 254 analyzed microvascular decompressions in patients with hemifacial spasm. Such patients usually do not have hearing impairment before surgery, but in patients with already impaired hearing, a lower stimulation frequency may be optimal. A method for personalized selection of the frequency of acoustic stimuli presentation is proposed in the review by Simon [4]: starting with a rate of 20 Hz, and reducing it until high-quality BAEPs are obtained if they were not obtained for 20 Hz, or increasing rate if high-amplitude, well-reproducible BAEPs were obtained initially. In this way, it is possible to achieve the fastest possible recording of high-quality BAEPs; usually, according to Simon, the stimulation frequency is in the range from 10 to 40 Hz. Probably, taking into account the data of Joo et al. [10], it is possible to start selecting the stimulation rate from values of about 40 Hz, especially for patients with preserved hearing.
Optimization of the intraoperative BAEPs monitoring parameters is not often used, although there are convincing evidences of a significant increase in the monitoring effectiveness due to its use. Importantly, this is evidenced not only by a significant reduction in the duration of BAEPs recording (this is an important index, but still indirect), but also by a statistically significant decrease in the incidence of iatrogenic hearing impairment after the optimization of the intraoperative BAEPs monitoring was introduced [10].
6. Problems in the Implementation of a Personalized Approach to Intraoperative Sensory EPs Monitoring and Their Possible Solutions
One may ask: if personalized optimization of intraoperative sensory EP monitoring really increases its effectiveness, why is this approach not implemented as widely as possible? The probable answer is that there are a number of factors that hinder such implementation.
First, there is a factor of professional mindset. Both IONM technicians and supervising physicians are typically required to have basic training or experience in “general” clinical neurophysiology [39]. Such training is usually focused on the use of neurophysiological methods in clinical diagnostics, which forms an attitude towards adherence to standards when registering EP (see Table 1). And, as in most cases one actually can obtain EPs using these standards (albeit spending more time for it), they would rather just continue to practice using this approach. Moreover, the mechanical transfer of methods for recording sensory EPs from neurophysiological clinical diagnostics to IONM is directly recommended, for example, in the current Clinical practice guidelines for IONM of the Korean Neurological Association [40]. This mindset can be addressed by focusing during IONM training on the differences between clinical neurophysiological diagnostics and IONM and on the benefits of optimizing EP monitoring parameters. However, at present, only the most recent clinical guidelines for SSEP monitoring from ISIN [15] and ACNS [1] promote optimization, while the guidelines for BAEP monitoring issued earlier [3,8] do not address this aspect, and there are no specific guidelines for IONM for the VEPs at all. Nonetheless, recent progress in this direction is notable not only for the SSEPs. Thus, in the recent revision of the Standards and guidelines for the accreditation of educational programs in intraoperative neurophysiologic monitoring issued by the Commission on accreditation of allied health education programs (CAAHEP) [41], the required competencies list includes not only the anesthesia parameters optimization for IONM (as in previous revision), but also the signal optimization techniques.
Second, the implementation of a personalized approach to intraoperative monitoring of sensory EPs may also be hampered by limitations of existing IONM systems and their software. In the case of entry-level systems, which is relevant for low-income countries, the number of input channels may be limited, which does not allow for the selection of the optimal combination of electrodes in the most convenient way of direct comparison of simultaneously obtained responses. In this case, it is possible to use sequential comparison by installing electrodes for all possible combinations on the patient and bringing their connectors to the contact box (which is usually accessible during surgery) and connecting them set by set. The software in some IONM systems allows using only a fixed set of settings (in particular, options for the cutoff frequency of frequency filters) without the possibility of more flexible adaptation to specific conditions. More active interaction of neurophysiologists and neurophysiological societies with equipment manufacturers may help in solving this problem.
Third, personalized EP optimization may be quite time-consuming. And if having sufficient experience usually allows one to understand which direction to move in, a beginner have to go through many variants before finding optimal one. Here, a cooperation within the whole neurosurgical team can help. Being allowed to start preparation as early as possible and maybe to have a three minute delay before starting surgery to record all EPs without interferences, neurophysiologist usually can find optimal recording parameters without feeling excessive pressure. And don’t let the perfect be the enemy of good. If, for example, one manage to find a combination of parameters allowing to obtain well-reproducible SSEPs in 15 seconds, there is usually little reason to persist in searching for an option that takes 8 seconds to record them (even though it is 2 times faster). Anyway, the pauses in monitoring caused by the use of electrocautery will most likely be several times longer.
Last, but certainly not least, some possible errors associated with sensory EP monitoring optimization may discourage practitioners from using it. For example, too aggressive filtering may result in an artifact being mistaken for a real signal. As Betty L. Grundy put it: «Filtered artifact may appear pleasing to the eye, but it bears no relationship to neurological function» [42] (p. 562). This mistake is very dangerous, as it can lead to false negative interpretation and missing alarms with devastating consequences to a patient. A possible solution might be to make a control recording with more averagings and a wider bandwidth to make sure that real EPs are being recorded (or at least to understand that a certain peak is an artifact) and then apply filtering. Another possible type of optimization-related false-negative monitoring results may occur because recording electrodes, when placed in non-standard (and sometimes standard, though) positions, may record some subcortical activity. For example, if Fz is placed too anteriorly during VEP recording, it may pick up an electroretinogram, and its later waves may be confused with the early and mid-latency waves of the VEPs. When monitoring SSEPs, the subcortical N18 peak may in some derivations be “mixed” with a cortical N20 peak [43]. In these cases dysfunction arising at a higher level sometimes may not be identified because the subcortical component of the wave partially masks reduction or disappearance of the cortical one. The proposed above multi-derivation recording approach can help preventing such errors by increasing the chance of obtaining EPs in which cortical and subcortical signals are differentiated. In the case of VEPs, it is recommended to additionally record ERG from each eye using needle electrodes placed near the outer corners of the eyes [30] or below the eyebrows [29]. It allow not only to control the stimuli delivery to retina, but also to identify contamination of VEP with electroretinogram and avoid the use of derivations susceptible to it.
7. Conclusions
Summing up, the IONM practitioners community is currently developing an understanding not only of the existence of the problem of a low SNR in the sensory EPs registration, but also of the opportunities to significantly improve the situation. The most recent clinical guidelines [1,15] on intraoperative SSEP monitoring use the concept of “optimization” for this purpose, which actually means a personalized selection of parameters of stimulation and registration of SSEPs. However, such an approach is not only missed in the guidelines, but is also found only in isolated papers on monitoring BAEPs [4,10,38] and VEPs [32,44]. The widespread introduction of a personalized approach to sensory EPs monitoring, including the adaptation of IONM equipment and software to it, will speed up the acquisition of these EPs and bring us closer to a true real-time monitoring mode. In turn, providing the fastest possible information to surgeons about the onset of disturbances in the controlled sensory functions will help them achieving the surgical goals with maximal safety for the patient.
8. Perspectives
One of the problems hampering implementation of changes in IONM methods is difficulty in collecting data that meet the requirements of evidence-based medicine. Indeed, the top of the pyramid of evidence is occupied by randomized controlled trials (RCT) and systematic reviews of RCTs [45]. But, in case of comparing different methodological approaches in IONM, this top hardly can be achieved due to conflict with ethical restrictions. Indeed, within the RCT concept, it would be necessary to follow strictly some algorithm, in accordance with the group to which the patient was assigned, even if this algorithm is obviously not effective enough in this case. This is clearly unethical in a situation where it is possible to try to change it to achieve greater effectiveness. As an alternative, providing a high level of evidence and avoiding ethical problems, the “virtual IONM” approach may be proposed. For this purpose, while conducting neuromonitoring in the usual manner, one would simultaneously record raw single-trial responses in all used derivations with precise timing of all important intraoperative events. The resulting array of collected raw data can then be processed offline in various ways, comparing them with each other in terms of the reproducibility of the EPs, the speed of their acquisition, sensitivity and the speed of response to intraoperative events. Similar approach was used, for example, by Jin et al. [46] to substantiate the superiority of their “slope measure” for identifying significant changes in SSEPs over the traditional alarm criteria.
Actually, the reactions of EPs on intraoperative events and setting reporting thresholds for these reactions is an important point which was not addressed in this review. Traditionally a so-called 10-50 warning criterion is used in IONM; i.e., the warning is reported if 10% latency delay or 50% amplitude decrease has occurred. However, this criterion is purely empirical and lacks justification. EP monitoring optimization allows shortening time intervals between obtaining consecutive EPs and/or increasing SNR and reproducibility of EPs. Therefore, smaller changes in EPs could be detected and there is evidence that reporting them can increase the safety of surgery [47]. The “virtual IONM” approach described in the previous paragraph could also be used to propose optimized warning criteria for sensory EPs monitoring.
An important problem which prevents widespread use of a personalized approach to selecting optimal parameters for monitoring sensory EPs is the time-consuming nature of this selection, especially for less experienced neurophysiologists. In the conditions of time constraints typical for real-life monitoring, finding the optimal option may be difficult. Overcoming this difficulty may be assisted by developing software that would automatically compare various options for processing raw single-trial responses obtained in the “quiet” fragment of the recording and offer parameters of EP recording and signal processing that maximize SNR and/or minimize the time required to obtain reproducible responses. Development, certification, and integration in IONM systems of a module suggesting variants of personalized optimization for a specific monitoring session could become a competitive advantage for certain IONM systems manufacturer.
Author Contributions
All stages of preparation of this article were performed by Evgeny A. Levin.
Funding
The research was funded by Russian Science Foundation, Grant Number 23-25-00322. The APC was funded Russian Science Foundation, Grant Number 23-25-00322.
Institutional Review Board Statement
Not applicable.
Informed Consent Statement
Not applicable.
Data Availability Statement
Not applicable.
Acknowledgments
The author thank Irina Georgievna Mukhina for valuable assistance in translating the draft of this manuscript to English.
Conflicts of Interest
The author declare no conflicts of interest. The funder had no role in the design of the study; in the collection, analyses, or interpretation of data; in the writing of the manuscript; or in the decision to publish the results.
| 1 | From here on, when considering SSEPs and BAEPs, the locations of the electrodes along the fronto-occipital axis are designated in accordance with the 10–10 system [18]. For electrodes along the midline, the designations are completely consistent with this system (e.g., CPz). For electrodes located lateral to the midline, instead of numerical values encoding the side (odd numbers – left side, even – right) and distance from the midline (a higher number corresponds to a greater angular distance), the designations i and c (e.g., CPi and CPc) will be used meaning the hemisphere ipsi- and contralateral to the stimulation side, respectively. Here, they correspond to electrodes with a numerical codes of 3 or 4 (20% distance from the midline). In the VEPs section, all electrode location designations are the same as in [18]. |
References
- Toleikis, J. R.; Pace, C.; Jahangiri, F. R.; Hemmer, L. B.; Toleikis, S. C. Intraoperative somatosensory evoked potential (SEP) monitoring: an updated position statement by the American Society of Neurophysiological Monitoring. Journal of Clinical Monitoring and Computing 2024, 38, 1003–1042. [Google Scholar] [CrossRef] [PubMed]
- Luo, Y.; Regli, L.; Bozinov, O.; Sarnthein, J. Clinical utility and limitations of intraoperative monitoring of visual evoked potentials. PLoS ONE 2015, 10, e0120525. [Google Scholar] [CrossRef] [PubMed]
- American Clinical Neurophysiology Society. Guideline 11C: Recommended standards for intraoperative monitoring of auditory evoked potentials. Available online: https://www.acns.org/pdf/guidelines/Guideline-11C.pdf (accessed on 20 November 2024).
- Simon, M. V. Neurophysiologic intraoperative monitoring of the vestibulocochlear nerve. Journal of Clinical Neurophysiology 2011, 28, 566–581. [Google Scholar] [CrossRef] [PubMed]
- Fridman, J.; John, E. R.; Bergelson, M.; Kaiser, J. B.; Baird, H. W. Application of digital filtering and automatic peak detection to brain stem auditory evoked potential. Electroencephalography and Clinical Neurophysiology 1982, 53, 405–416. [Google Scholar] [CrossRef]
- MacDonald, D. B. Individually optimizing posterior tibial somatosensory evoked potential P37 scalp derivations for intraoperative monitoring. Journal of Clinical Neurophysiology 2001, 18, 364–371. [Google Scholar] [CrossRef]
- Scherg, M.; Berg, P.; Nakasato, N.; Beniczky, S. Taking the EEG back into the brain: the power of multiple discrete sources. Frontiers in Neurology 2019, 10, 855. [Google Scholar] [CrossRef]
- Martin, W. H.; Stecker, M. M. ASNM Position Statement: Intraoperative monitoring of auditory evoked p otentials. Journal of Clinical Monitoring and Computing 2007, 22, 75–85. [Google Scholar] [CrossRef]
- Odom, J. V.; Bach, M.; Brigell, M.; Holder, G. E.; McCulloch, D. L.; Mizota, A.; Tormene, A. P. ISCEV standard for clinical visual evoked potentials: (2016 update). Documenta Ophthalmologica 2016, 133, 1–9. [Google Scholar] [CrossRef]
- Joo, B.-E.; Park, S.-K.; Cho, K.-R.; Kong, D.-S.; Seo, D.-W.; Park, K. Real-time intraoperative monitoring of brainstem auditory evoked potentials during microvascular decompression for hemifacial spasm. Journal of Neurosurgery 2016, 125, 1061–1067. [Google Scholar] [CrossRef]
- Dimakopoulos, V.; Selmin, G.; Regli, L.; Sarnthein, J. Optimization of signal-to-noise ratio in short-duration SEP recordings by variation of stimulation rate. Clinical Neurophysiology 2023, 150, 89–97. [Google Scholar] [CrossRef]
- Stecker, M. M. Generalized averaging and noise levels in evoked responses. Computers in Biology and Medicine 2000, 30, 247–265. [Google Scholar] [CrossRef] [PubMed]
- MacDonald, D. B.; Zayed, Z. A.; Stigsby, B. Tibial somatosensory evoked potential intraoperative monitoring: Recommendations based on signal to noise ratio analysis of popliteal fossa, optimized P37, standard P37, and P31 potentials. Clinical Neurophysiology 2005, 116, 1858–1869. [Google Scholar] [CrossRef] [PubMed]
- MacDonald, D. B.; Al-Zayed, Z.; Stigsby, B.; Al-Homoud, I. Median somatosensory evoked potential intraoperative monitoring: Recommendations based on signal-to-noise ratio analysis. Clinical Neurophysiology 2009, 120, 315–328. [Google Scholar] [CrossRef] [PubMed]
- MacDonald, D. B.; Dong, C.; Quatrale, R.; Sala, F.; Skinner, S.; Soto, F.; Szelényi, A. Recommendations of the International Society of Intraoperative Neurophysiology for intraoperative somatosensory evoked potentials. Clinical Neurophysiology 2019, 130, 161–179. [Google Scholar] [CrossRef]
- MacDonald, D. B. Monitoring somatosensory evoked potentials. In Elsevier eBooks; 2020; pp 35–51. [CrossRef]
- Dietrich, C.; Blume, K. R.; Franz, M.; Huonker, R.; Carl, M.; Preißler, S.; Hofmann, G. O.; Miltner, W. H. R.; Weiss, T. Dermatomal organization of SI leg representation in humans: Revising the somatosensory homunculus. Cerebral Cortex 2017, 27, 4564–4569. [Google Scholar] [CrossRef]
- Nuwer, M. R.; Comi, G.; Emerson, R.; Fuglsang-Frederiksen, A.; Guérit, J.-M.; Hinrichs, H.; Ikeda, A.; Luccas, F. J. C.; Rappelsburger, P. IFCN standards for digital recording of clinical EEG. Electroencephalography and Clinical Neurophysiology 1998, 106, 259–261. [Google Scholar] [CrossRef]
- Hanson, C.; Lolis, A. M.; Beric, A. SEP montage variability comparison during intraoperative neurophysiologic monitoring. Frontiers in Neurology 2016, 7, 105. [Google Scholar] [CrossRef]
- De Weerd, J. P. C.; Kap, J. I. Spectro-temporal representations and time-varying spectra of evoked potentials. Biological Cybernetics 1981, 41, 101–117. [Google Scholar] [CrossRef]
- Allison, D. W.; Silverstein, J. W.; Thirumalai, S. S.; D’Amico, R. S. Misconceptions in IONM Part III: Stimulation repetition rate effects on intraoperative somatosensory evoked potential amplitude and latency. The Neurodiagnostic Journal 2022, 62, 239–250. [Google Scholar] [CrossRef]
- Houlden, D. A.; Turgeon, C. A.; Polis, T.; Sinclair, J.; Coupland, S.; Bourque, P.; Corsten, M.; Kassam, A. Intraoperative flash VEPs are reproducible in the presence of low amplitude EEG. Journal of Clinical Monitoring and Computing 2013, 28, 275–285. [Google Scholar] [CrossRef]
- Shcherbuk A. Yu.; Shcherbuk Yu. A.; Pyanzin S. Yu. Intraoperative monitoring of visual evoked potentials as a component of a comprehensive neurophysiological supply of transnasal endoscopic interventions for tumors of chiasmatic-sellar region. Rossiiskii neirokhirurgicheskii zhurnal im. prof. A.L. Polenova = Russian Journal of Neurosurgery n. a. prof. A.L. Polenov 2011, 3(4), 37–43. (In Russ.).
- Kodama, K.; Goto, T. Neurophysiology of the visual system: basics and intraoperative neurophysiology techniques. In Elsevier eBooks; 2020; pp 53–64. [CrossRef]
- Vijayan, S.; Ching, S.; Purdon, P. L.; Brown, E. N.; Kopell, N. J. Thalamocortical Mechanisms for the Anteriorization of Alpha Rhythms during Propofol-Induced Unconsciousness. Journal of Neuroscience 2013, 33, 11070–11075. [Google Scholar] [CrossRef] [PubMed]
- Blain-Moraes, S.; Tarnal, V.; Vanini, G.; Alexander, A.; Rosen, D.; Shortal, B.; Janke, E.; Mashour, G. A. Neurophysiological correlates of sevoflurane-induced unconsciousness. Anesthesiology 2014, 122, 307–316. [Google Scholar] [CrossRef] [PubMed]
- Kodama, K.; Goto, T.; Sato, A.; Sakai, K.; Tanaka, Y.; Hongo, K. Standard and limitation of intraoperative monitoring of the visual evoked potential. Acta Neurochirurgica 2010, 152, 643–648. [Google Scholar] [CrossRef] [PubMed]
- Sato, A. Interpretation of the causes of instability of flash visual evoked potentials in intraoperative monitoring and proposal of a recording method for reliable functional monitoring of visual evoked potentials using a light-emitting device. Journal of Neurosurgery 2016, 125, 888–897. [Google Scholar] [CrossRef] [PubMed]
- Nakagawa, I.; Park, H.; Kotsugi, M.; Yokoyama, S.; Omoto, K.; Myochin, K.; Takeshima, Y.; Matsuda, R.; Nishimura, F.; Yamada, S.; Takatani, T.; Nakase, H. Diagnostic impact of monitoring visual evoked potentials to prevent visual complications during endovascular treatment for intracranial aneurysm. Frontiers in Neurology 2022, 13, 761263. [Google Scholar] [CrossRef]
- Sasaki, T.; Itakura, T.; Suzuki, K.; Kasuya, H.; Munakata, R.; Muramatsu, H.; Ichikawa, T.; Sato, T.; Endo, Y.; Sakuma, J.; Matsumoto, M. Intraoperative monitoring of visual evoked potential: introduction of a clinically useful method. Journal of Neurosurgery 2010, 112, 273–284. [Google Scholar] [CrossRef]
- Gutzwiller, E. M.; Cabrilo, I.; Radovanovic, I.; Schaller, K.; Boëx, C. Intraoperative monitoring with visual evoked potentials for brain surgeries. Journal of Neurosurgery 2018, 1–7. [Google Scholar] [CrossRef]
- Levin, E. A.; Kilchukov, M. G.; Glushaeva, A. A. Intraoperative monitoring of visual evoked potentials: experience of 240 operations. Russian Journal of Neurosurgery 2024, 26, 57–71. [Google Scholar] [CrossRef]
- San-Juan, D.; Cortés, M. E.; Tena-Suck, M.; Garduño, A. J. O.; Pizano, J. A. L.; Domínguez, J. V.; Gónzalez-Aragón, M. F.; Gómez-Amador, J. L. Neurophysiological intraoperative monitoring during an optic nerve schwannoma removal. Journal of Clinical Monitoring and Computing 2016, 31, 1059–1064. [Google Scholar] [CrossRef]
- Uribe, A. A.; Mendel, E.; Peters, Z. A.; Shneker, B. F.; Abdel-Rasoul, M.; Bergese, S. D. Comparison of visual evoked potential monitoring during spine surgeries under total intravenous anesthesia versus balanced general anesthesia. Clinical Neurophysiology 2017, 128, 2006–2013. [Google Scholar] [CrossRef]
- Seubert, C. N.; Herman, M. Auditory-Evoked potentials. In Monitoring the Nervous System for Anesthesiologists and Other Health Care Professionals; Koht, A., Sloan, T., Toleikis, J., Eds.; Springer, 2017; pp 35–49. [CrossRef]
- Zamel, K. M. Brainstem auditory evoked potential monitoring. In Cambridge University Press eBooks; 2010; pp 90–100. [CrossRef]
- Greve, T.; Beyer, F.; Szelényi, A. Intraoperative Erb’s Point-Vertex recording increases brainstem auditory evoked potential wave V amplitude. Clinical Neurophysiology 2019, 131, 420–424. [Google Scholar] [CrossRef] [PubMed]
- Hammerschlag, P. E.; Berg, H. M.; Prichep, L. S.; John, E. R.; Cohen, N. L.; Ransohoff, J. Real-Time Monitoring of Brainstem Auditory Evoked Response (BAER) during Cerebellopontine Angle (CPA) Surgery. Otolaryngology 1986, 95, 538–542. [Google Scholar] [CrossRef] [PubMed]
- Nuwer, M. R. Introduction, history, and staffing for intraoperative monitoring. In Intraoperative Neurophysiologic Monitoring; Galloway, G. M., Nuwer, M. R., Lopez, J. R., Zamel, K. M..; Cambridge University Press, 2010; pp 1–9. [CrossRef]
- Clinical practice guidelines for intraoperative neurophysiological monitoring: 2020 update. Annals of Clinical Neurophysiology 2021, 23, 35–45. [CrossRef]
- Commission on Accreditation of Allied Health Education Programs. Standards and guidelines for the accreditation of educational programs in intraoperative neurophysiologic monitoring. Available online: https://cdn.prod.website-files.com/5f466098572bfe97f28d59df/614b674da83bc04a1fab718a_IONM_Standards_Approve3192021.pdf (accessed on 18 November 2024).
- Grundy, B.L. Monitoring of sensory evoked potentials during neurosurgical operations: methods and applications. Neurosurgery 1982, 11, 556–575. [Google Scholar] [CrossRef]
- Fried, S. J.; Smith, D. M.; Legatt, A. D. Median nerve somatosensory evoked potential monitoring during carotid endarterectomy. Journal of Clinical Neurophysiology 2014, 31, 55–57. [Google Scholar] [CrossRef]
- Rajan, S.; Simon, M. V.; Nair, D. Intraoperative visual evoked potentials: there is more to it than meets the eye. Journal of Neurology and Neuroscience 2016, 7, 106. [Google Scholar] [CrossRef]
- Burns, P. B.; Rohrich, R. J.; Chung, K. C. The levels of evidence and their role in Evidence-Based Medicine. Plastic & Reconstructive Surgery 2011, 128, 305–310. [Google Scholar] [CrossRef]
- Jin, S.-H.; Chung, C. K.; Kim, J. E.; Choi, Y. D. A new measure for monitoring intraoperative somatosensory evoked potentials. Journal of Korean Neurosurgical Society 2014, 56. [Google Scholar] [CrossRef]
- Park, S.-K.; Lee, H.S.; Cho, K.R.; Park, K. Recent advances in intraoperative brainstem auditory evoked potential monitoring during microvascular decompression surgery for hemifacial spasm. Life 2023, 13, 1789. [Google Scholar] [CrossRef]
Figure 1.
Possible electrodes locations for visual evoked potentials monitoring. Notation mostly follows the 10–10 EEG system [18], M1 and M2 mean electrodes placed over left and right mastoid process correspondingly. Black circles – active electrodes over occipital cortex (visual cortical area), colored circles – possible reference electrodes.
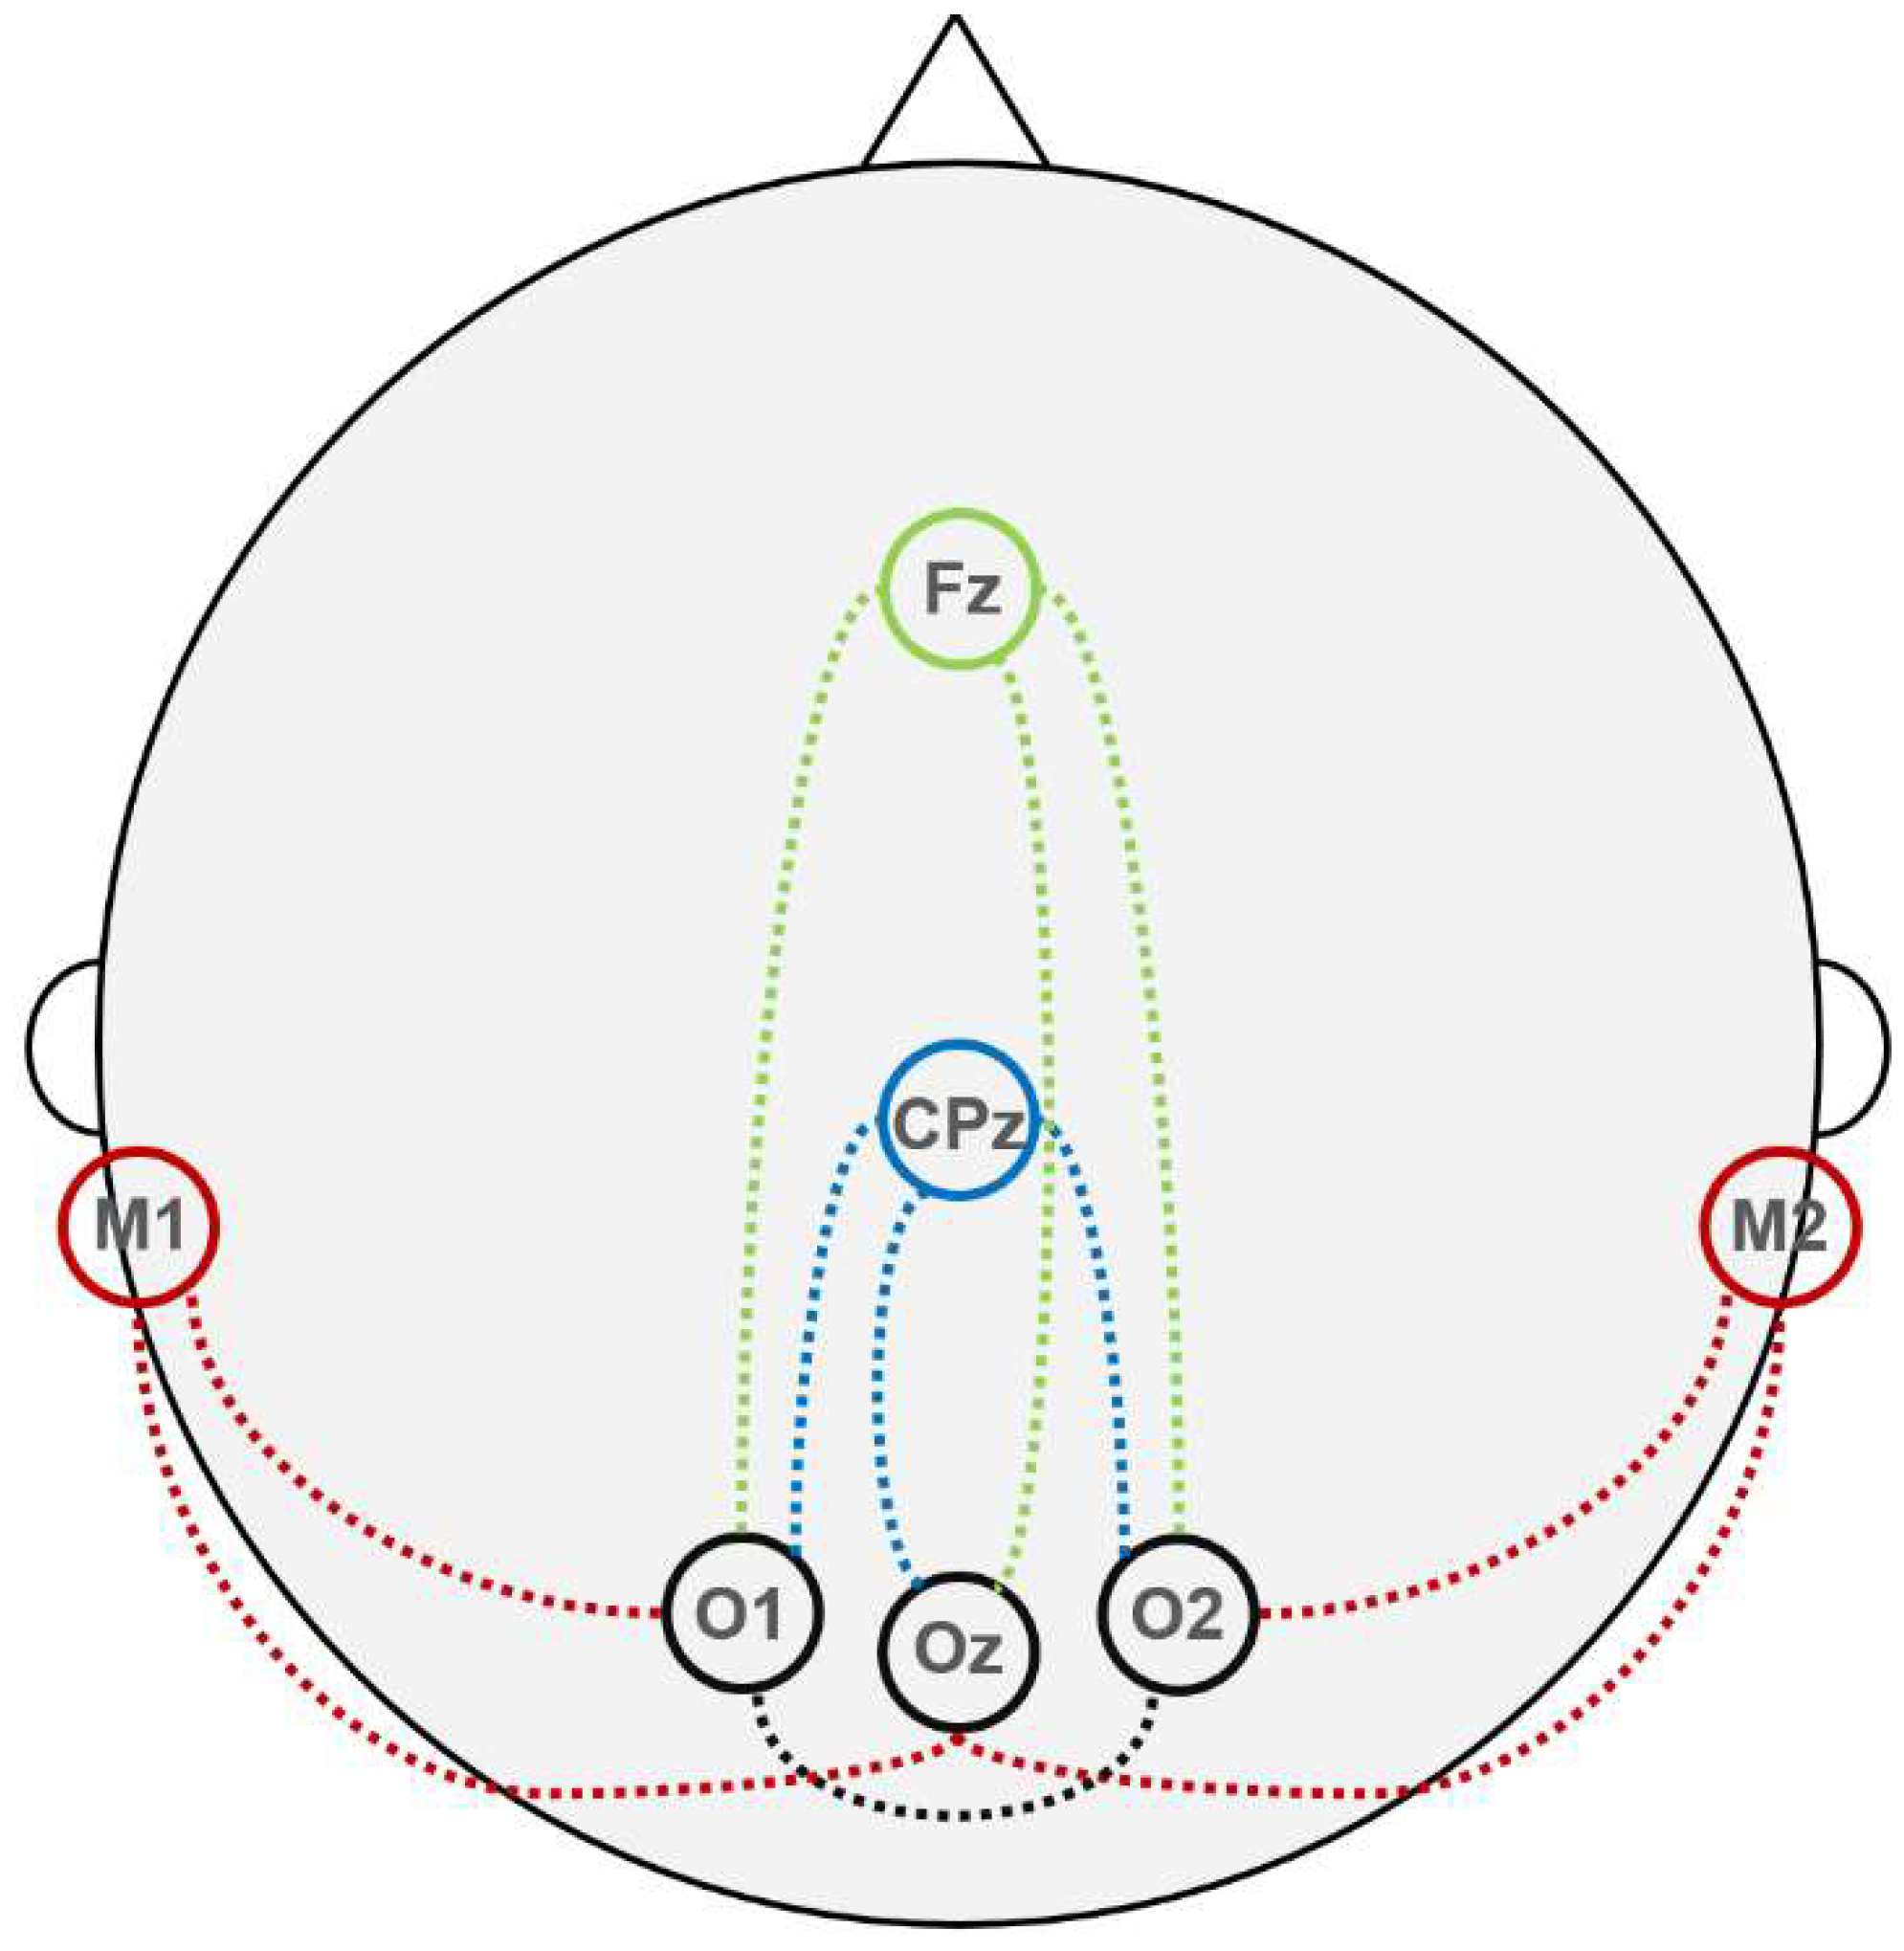
Figure 2.
Results of applying filters with different high- and low-pass cutoffs to the same set of VEP recordings. Data from Oz–CPz derivation are presented. Differences on the reproducibility, amplitude and shape of the VEP curves are clearly visible, as well as trade-off between amplitudes of VEP peaks and of noise. Adapted from “Intraoperative monitoring of visual evoked potentials: experience of 240 operations,” by E.A. Levin, M.G. Kilchukov and A.A. Glushaeva, 2024, Neyrokhirurgiya = Russian Journal of Neurosurgery, 26 (3), p.59, Figure 1b (https://doi.org/10.17650/1683-3295-2024-26-3-57-71). CC BY 4.0 (https://creativecommons.org/licenses/by/4.0/).
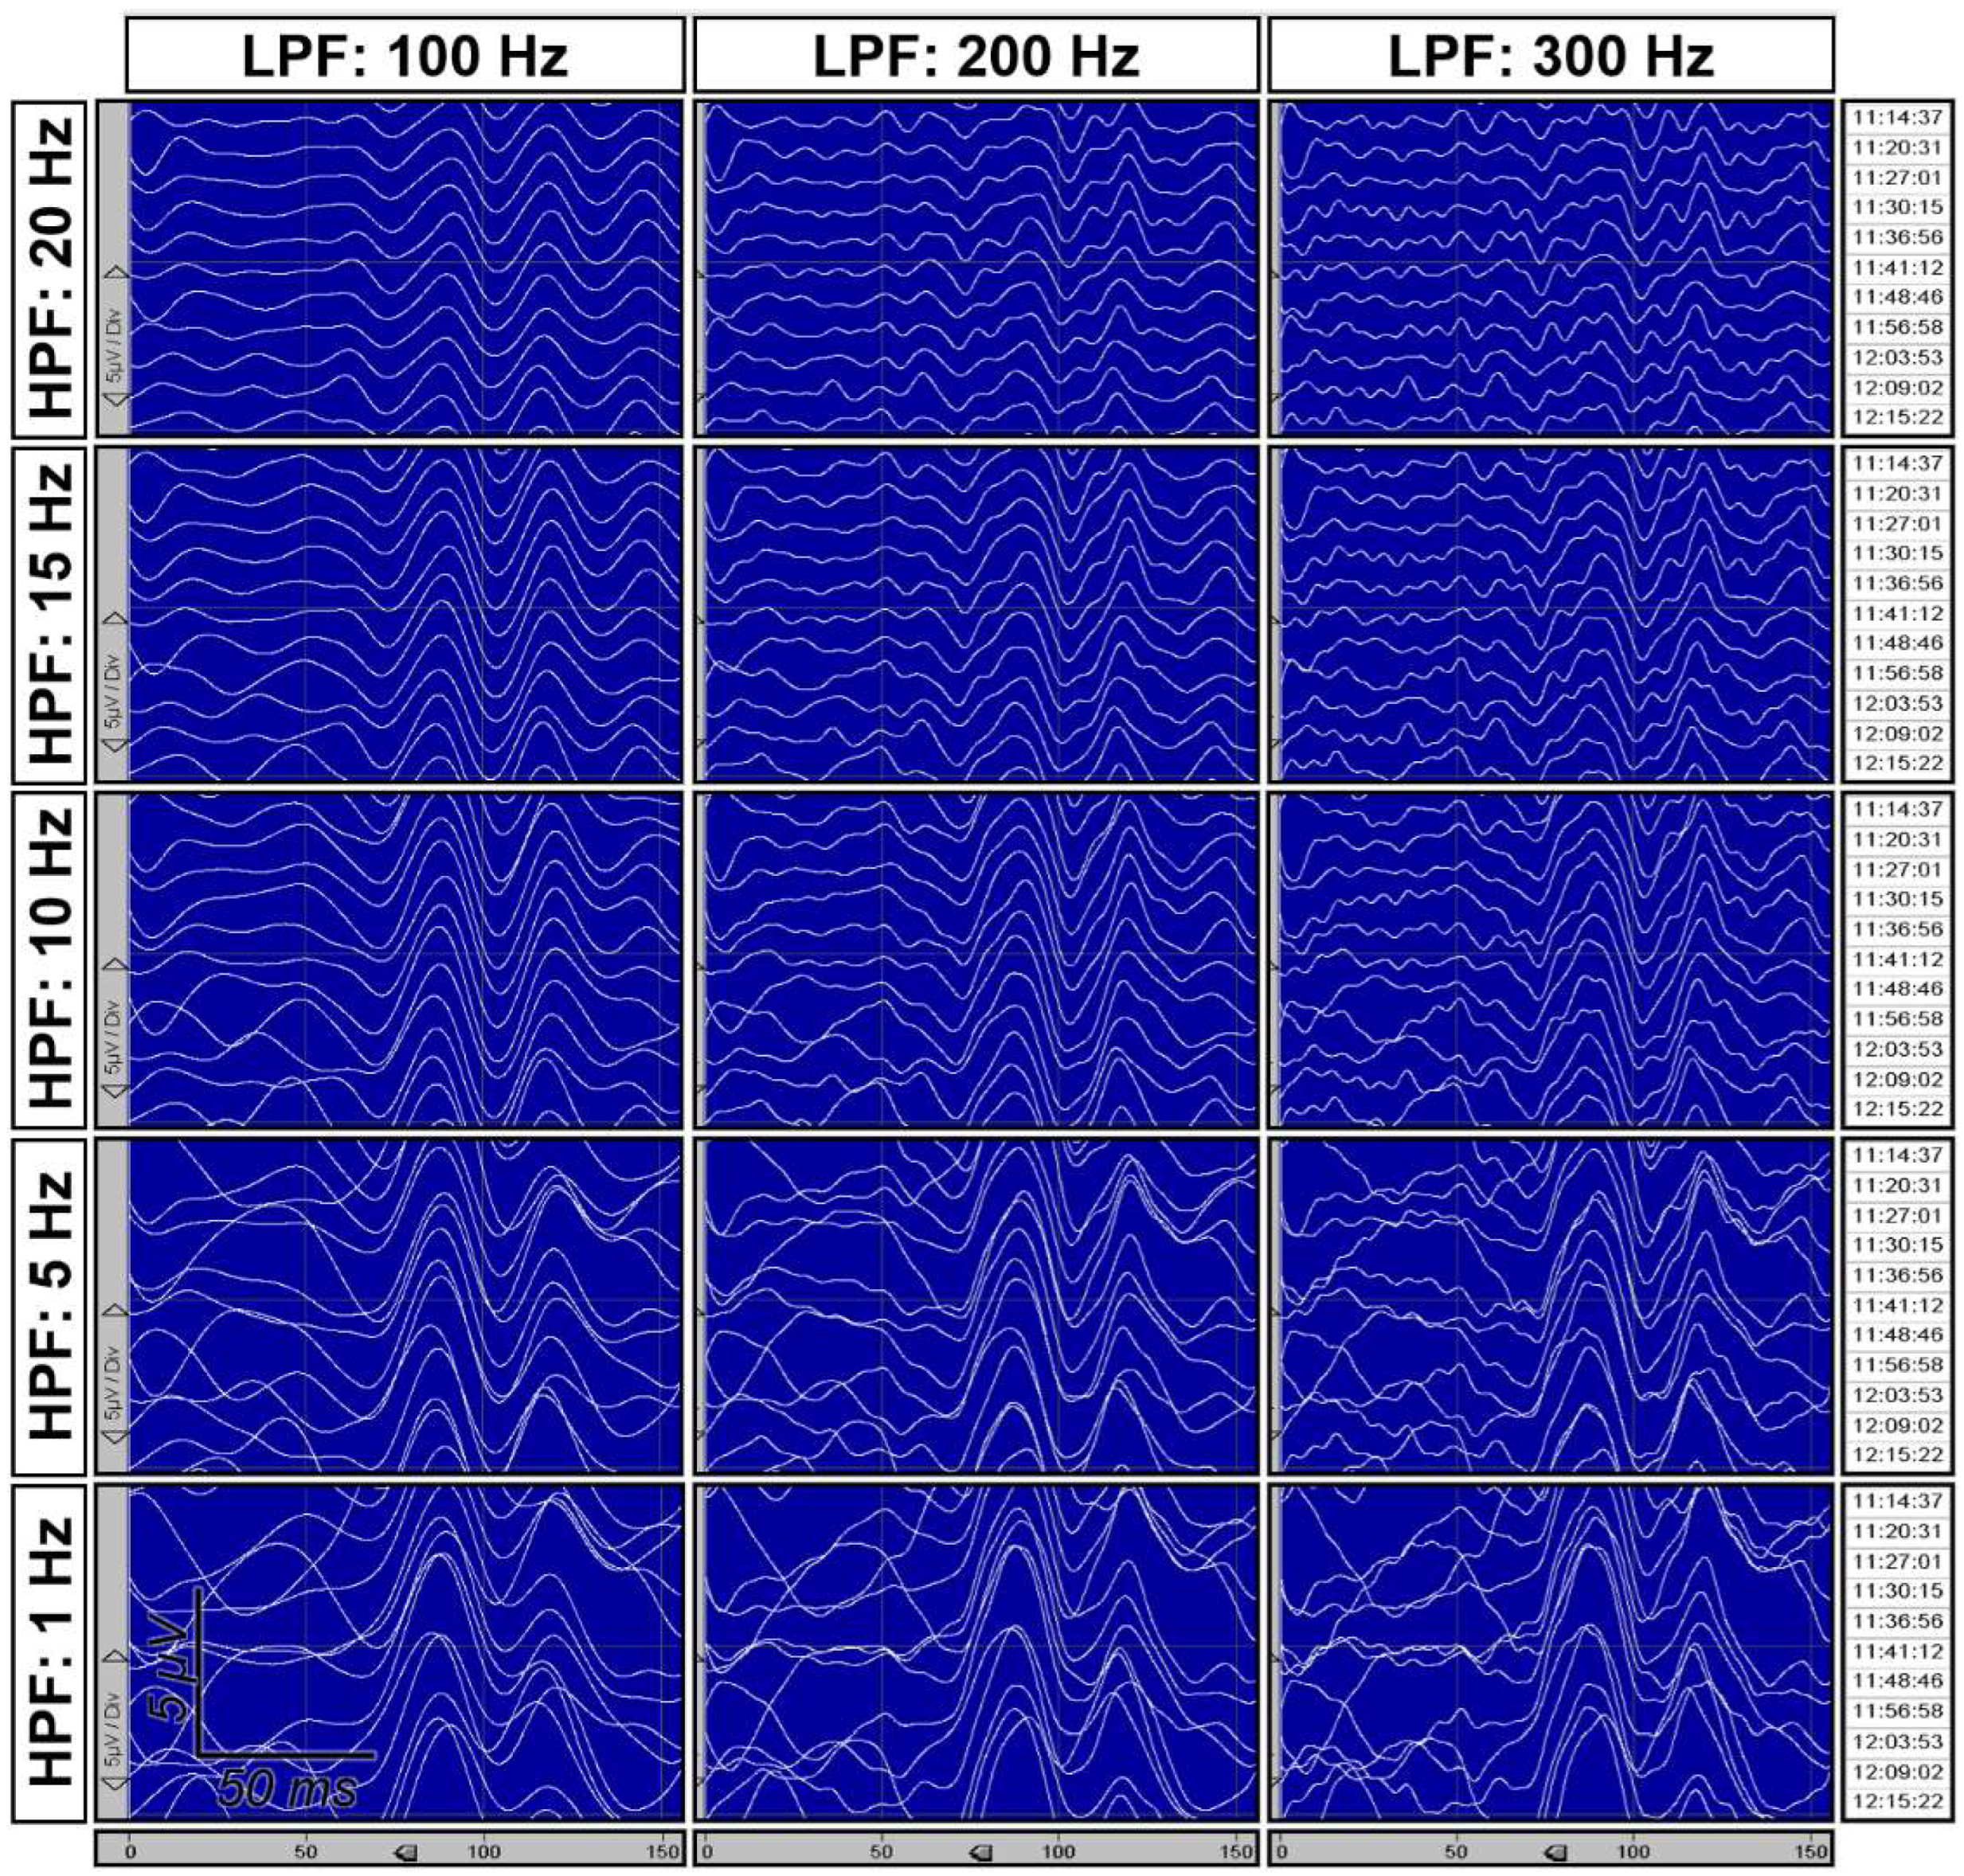
Figure 3.
Example of excellently reproducible VEPs, obtained using 15 – 300 Hz frequency filter. In both panels, baselines are shown in green thicker lines; they were recorded earlier with 100 averages. The thinner white lines represent results recorded with 20 (left panel) and 75 (right pannel) averages under the same conditions, suggesting that there is no need to accumulate more averages after 20. Between-derivation variability of VEP amplitudes could also be clearly seen. Adapted from “Intraoperative monitoring of visual evoked potentials: experience of 240 operations,” by E.A. Levin, M.G. Kilchukov and A.A. Glushaeva, 2024, Neyrokhirurgiya = Russian Journal of Neurosurgery, 26(3), p.59, Figure 1c (https://doi.org/10.17650/1683-3295-2024-26-3-57-71). CC BY 4.0 (https://creativecommons.org/licenses/by/4.0/).
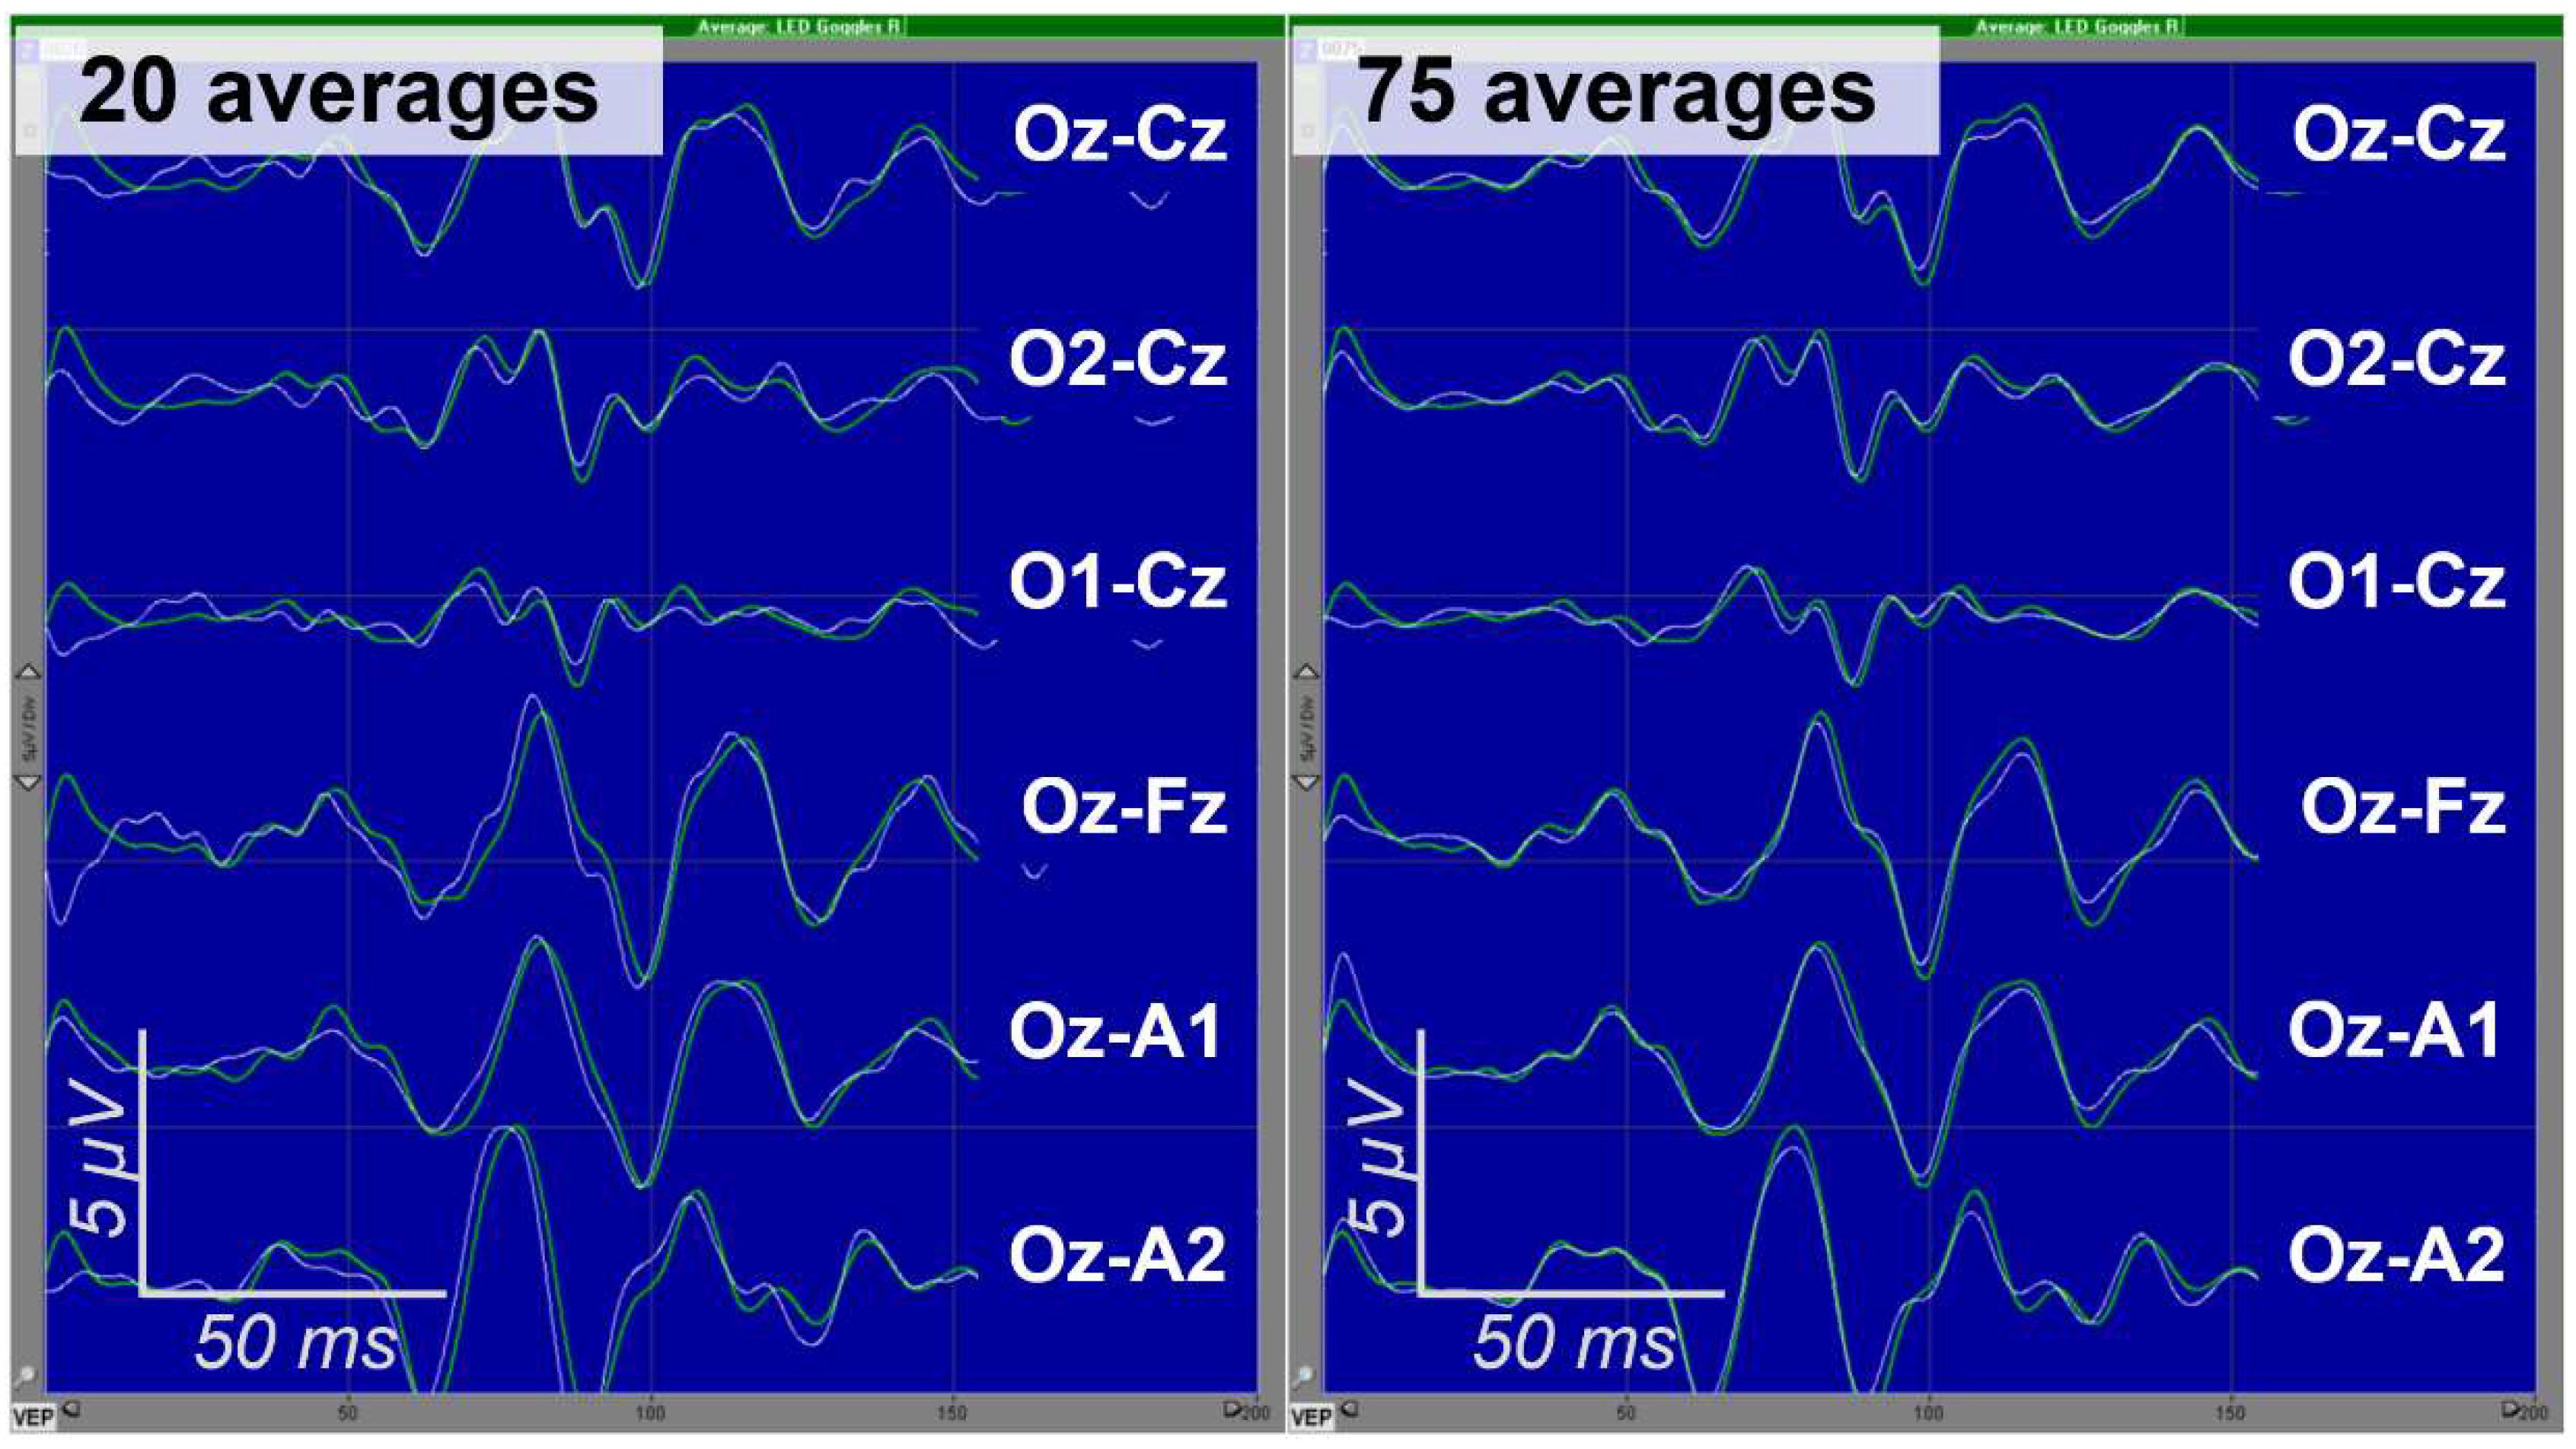

Table 1.
Differences between evoked potentials recording during clinical neurophysiological diagnostics and during their intraoperative monitoring.
Table 1.
Differences between evoked potentials recording during clinical neurophysiological diagnostics and during their intraoperative monitoring.
| Recording of EPs during clinical neurophysiological diagnostics | Intraoperative monitoring of EPs | |
|---|---|---|
| Task | Identification of existing sensory impairments | Detection of emerging new sensory dysfunctions |
| Dysfunction detection method | Comparison with population standart | Comparison with the same patient’s records obtained at the beginning of the operation |
| Conditions | Patient is conscious; external interference is minimized; electromyographic interference may be significant |
Patient is under general anesthesia; external interference (electrocoagulation, mechanical, etc.) is usual; electromyographic interference can be reduced by muscle relaxation |
| Registration parameters | Same as for the normative population, same for all patients | Changes during monitoring are undesirable, but differences between patients are acceptable |
| Time limits | Nosignificant time limitations | It is necessary to update records as often as possible |
Table 2.
Variability of intraoperative VEP recording parameters among different publications.
| Publication | Locations of recording electrodes | Filter passband | Number of averages | Stimulation rate |
|---|---|---|---|---|
| Kodama et al., 2010 [27] * | P7/O1/Oz/O2/P8 – (A1+A2) | 10 – 1000 Hz | 40 – 100 | 1/sec |
| Sasaki et al., 2010 [30] | O1 – M1, O2 – M2 | 20 – 500 Hz | 100 | 1/sec |
| Scherbuk et al., 2011 [23] | O1/O2/Oz – Fz | 2 – 100 Hz | 200 | 1/sec |
| Houlden et al., 2013 [22] | Oz – Fz | 1–5 – 100 Hz | 150 | 1.41/sec |
| Luo et al., 2015 [2] | O1/Oz/O2 – Fz/Cz/(A1+A2) | 5 – 100 Hz | 100 – 200 | ND |
| San-Juan et al., 2016 [33] | O1–O2, O1–Oz, O2–Oz, Oz–Fz | 2 – 100 Hz | 250 | 4.1/sec |
| Sato, 2016 [28] * | P7/PO7/O1/Oz/O2/PO8/P8 – (A1+A2) | 0.1 – 200 Hz | 100 | 1/sec |
| Uribe et al., 2017 [34] | O1/Oz/O2 – M1/M2/Fz | 20 – 500 Hz | 100 | 1.1/sec |
| Gutzwiller et al. 2018 [31] | O1/Oz/O2 – CPz | 2 – 400 Hz | 50 | 0.9/sec |
| Kodama, Goto, 2020 [24] * | P7/O1/Oz/O2/P8 – (A1+A2) | 10 – 1000 Hz | 40 – 100 | 1/sec |
| Nakagawa et al., 2022 [29] | O1/Oz/O2 – (A1+A2) | ND | 100 | 1/sec |
Data presented in the table are derived from the Methods sections of the corresponding papers. In “Locations of recording electrodes” column the designations before dashes correspond to active electrodes, and after dashes – to reference. Slashes (/) mean that several active electrodes are used with the same reference or vice versa. (A1+A2) means linked earlobe electrodes. ND means no relevant data were found in the paper. * – in these papers own naming of active electrodes was used. For the seek of uniformity they are renamed here according to 10–10 system [18] designations for electrodes located similarly to them.
Table 3.
Low- and high-pass filters selected for the intraoperative VEP monitoring in the group of patients, analyzed in Levin et al., 2024 [32].
Table 3.
Low- and high-pass filters selected for the intraoperative VEP monitoring in the group of patients, analyzed in Levin et al., 2024 [32].
| High-pass filter, Hz | The number of eyes for which VEPs were recorded using the specified frequency filters, n | ||||||
|---|---|---|---|---|---|---|---|
| Low-pass filter, Hz | Total | ||||||
| 100 | 150 | 200 | 250 | 300 | 350-400 | ||
| 5 | 1 | 6 | 29 | 1 | 0 | 0 | 37 |
| 10 | 2 | 47 | 196 | 13 | 26 | 2 | 286 |
| 15 | 2 | 4 | 74 | 6 | 7 | 1 | 94 |
| 20 | 0 | 2 | 1 | 0 | 0 | 1 | 4 |
| Total | 5 | 59 | 300 | 20 | 33 | 4 | 421 |
Data on 480 eyes of 240 patients were analyzed. At the beginning of the monitoring session the filter passband was selected for each eye basing on criteria of reproducibility and amplitudes of main VEP peaks. In some cases, different filter settings were used for left and right eyes. Numbers in each cell show how many eyes were monitored with corresponding LPF and HPF combination. In 59 of 480 eyes VEPs were unobtainable (most of them had visual dysfunctions preoperatively) and they are not included in this table. Of note, 10 Hz HPF cut-off and 200 Hz LPF cut-off were by far the most often-used, but their combination, i.e., 10 – 200 Hz passband covered significantly less than 50% of eyes. From “Intraoperative monitoring of visual evoked potentials: experience of 240 operations,” by E.A. Levin, M.G. Kilchukov and A.A. Glushaeva, 2024, Neyrokhirurgiya = Russian Journal of Neurosurgery, 26 (3), p.61, Table 1 (https://doi.org/10.17650/1683-3295-2024-26-3-57-71). CC BY 4.0 (https://creativecommons.org/licenses/by/4.0/).
Disclaimer/Publisher’s Note: The statements, opinions and data contained in all publications are solely those of the individual author(s) and contributor(s) and not of MDPI and/or the editor(s). MDPI and/or the editor(s) disclaim responsibility for any injury to people or property resulting from any ideas, methods, instructions or products referred to in the content. |
© 2024 by the authors. Licensee MDPI, Basel, Switzerland. This article is an open access article distributed under the terms and conditions of the Creative Commons Attribution (CC BY) license (http://creativecommons.org/licenses/by/4.0/).
Copyright: This open access article is published under a Creative Commons CC BY 4.0 license, which permit the free download, distribution, and reuse, provided that the author and preprint are cited in any reuse.


