
Submitted:
22 November 2024
Posted:
25 November 2024
You are already at the latest version
Abstract
Economic science provides a rich methodological toolkit for sustainable development combined with the principles of circular economy and green marketing. The practical adaptation of a set of assessment tools helped the realisation of this study in the form of the systematisation of interaction factors between the economic growth and environmental branding of industrial companies in the Republic of Kazakhstan. Descriptive models were used to assess the economic and technological state of enterprises and to analyse the effectiveness of capital investments for the implementation of green technology projects and social environmental investments. In the course of research of the population's requests to manufacturers of industrial products, it was found out that the requirements to the environmental characteristics of finished products have increased, and the price of ecological products is of concern. Producers and end consumers can be brought closer together through eco-branding, creation of special platforms for green integration participants. To unlock the reserves of economic growth, it is proposed that green investment flows with the participation of industrial capital should be intensified in order to increase investments in the eco-cultural transformation of eco-consumers of the new generation.
Keywords:
sustainable economy
; eco-branding
; sustainable company development
; industrial economics
; sustainable consumption
; consumer behavior
1. Introduction
The Rational use of natural resources and a positive environmental image can enable national economies and industrial companies to reach a high level of sustainable development. In the past decade, environmental issues have been on the international agenda, for example, touching on the management of hazardous waste and increasing gross value added in a circular economy. Between 2018 and 2021, European Union countries managed to increase gross value added in the environmental goods and services sector by 13.9% [1]. For Kazakhstan’s economy, the adoption of the Carbon Neutral Strategy was a long-awaited step towards the formation of a closed-cycle economy [2]. Industrial companies and households in Kazakhstan were able to reduce hazardous waste emissions (all hazard levels) per capita from 55.77 million tonnes per capita in 2010 to 2.2 million tonnes in 2021 [3]. Industrial enterprises are now seeking to increase their investment attractiveness through participation in green economy programmes [4]. According to the Carbon Disclosure Project, in 2023, 23,000 companies representing more than 60% of global market capitalisation have disclosed some information on their climate impact. At the same time, 330 major supply chain players have obtained specific data on their carbon footprint and strategies with the aim of achieving carbon neutrality. More than 400 companies (mostly from Europe, Asia, and North and South America) received an “A” grade for leadership in environmental transparency and performance on climate change, deforestation, and water security issues [5]. In Kazakhstan, a trend towards the formation of a positive environmental image of companies at the cores of industrial and technological clusters has begun to be observed. Starting from 1 September 2024, all issuers listed on the Kazakhstan Stock Exchange JSC are required to provide data on their activities in the area of managing their impact on the environment, economy, and society, as well as in the area of corporate governance. At the same time, a comprehensive mechanism of environmental branding has been activated. Ecological branding is the promotion of the ecological properties of high-quality goods (services) aimed at meeting the sustainable demand of socially responsible consumption in order to mitigate negative impacts on the environment.
Examining sustainable growth through green initiatives highlights three critical approaches to a sustainable economy.
Firstly, approaches to the management of technological processes in the field of mining and processing of minerals are gradually changing, and the use of natural resources in the agro-industrial complex has become more rational. Global companies in the energy, oil and metallurgical sectors are developing alternative energy sources and supporting the transition to a closed-cycle economy [6]. Researchers have noted that innovations and environmentally friendly approaches implemented in industrial companies help the development of the institution of stakeholders and involve educational institutions in the joint work of greening of production processes [7]. Environmental priorities have become the basis for minimising the greenhouse gas emissions of agro-industrial companies and organic food production and natural agricultural production concepts have been put into practice [8]. In turn, strategic green innovation impacts corporate financial and environmental performance [9]. At the same time, issues of organisational change in the context of sustainable development in production systems are still debatable [10]. Nearly a decade has passed since the United Nations adopted the Sustainable Development Goals, but solutions to the technical and economic aspects of energy infrastructure are still needed and changes in the state policy of subsidising environmental protection measures remain relevant [11,12].
Secondly, the diversification and risk coordination of the supply chains of industrial companies with trading partners has begun. It should be noted that it is at the intersection of production processes and sales of finished products that the phenomenon of environmental branding manifests itself, which meets the sustainable needs of the new generation of eco-consumers. The preferences of modern green consumers have a positive impact on the profits of manufacturing companies. We can agree with the arguments of researchers that the share of green consumers and their preferences contribute to the inflow of capital for the majority of industrial companies [13]. The openness of trade and international co-operation provides an incentive for cleaner producers to further adopt resource efficient technologies, regulate technology takeovers, digitalise cleaner management and automate warehousing processes [14,15,16,17,18]. In parallel to the green transformation of technological processes, service programmes to support eco-consumer loyalty and financial success through increased targeting have received new impetus [19]. Attributes such as dynamic pricing, brand names, types of materials used, and eco-labelling, as well as specific green marketing techniques, are increasingly influencing companies’ revenue growth [20,21,22].
Thirdly, there is a gradual “green” transformation of investment policy at the level of the global economy, as well as in the economies of individual regions and enterprises. Priorities comprise planning long-term investments, increasing the share of special public spending on environmental protection, and developing the mechanisms of market incentives on the basis of carbon pricing [23,24,25,26]. Practice shows that industrial companies that are committed to environmental initiatives gain additional competitive advantages in developing markets for environmentally friendly products. In microeconomics, green investments have a direct impact on demand and labour productivity growth, which depend on the level of environmental friendliness [27]. At the national economy level, some countries are emerging comprehensive and balanced indicators to assess the environmental performance of regional governments. In particular, research in China has analysed green GDP, environmental compensation, and public satisfaction [28]. However, industrial companies in most developing countries still face an acute dilemma: should they continue to grow with existing traditional technologies or should they invest capital in environmental innovation, achieve sustainability in raw material supply chains, and modernise production by adopting resource-saving technologies? Taken together, these directions create the foundation for eco-branding of manufactured products.
In this regard, the purpose of this study is to examine the factors of interaction between sustainable growth and environmental branding of industrial companies in the Republic of Kazakhstan and to develop recommendations for the active promotion of green economy principles. The following tasks contribute to the achievement of the objectives:
- The assessment of the current economic and technological state of enterprises in the manufacturing industry of the Republic of Kazakhstan;
- The identification of reserves for economic growth through environmental transformation in the area of resource conservation management, including eco-branding;
- The development of proposals for the sustainable development of industrial enterprises on the basis of investment policy and environmental branding.
This study will contribute to the green transformation of Kazakhstani industrial companies and their partners on the basis of the ecological branding of manufactured products. As a result of this, the build-up of ecological culture of producers and consumers is instigated and the export of ecological products in domestic and foreign markets will increase.
2. Review of the Literature
Eco-branding as a scientific direction in the system of brand management began to play a direct role in the transformation of the aggregate management system of industrial companies and their partners. The works of scientists help to realize in practice the mechanisms of promoting environmentally friendly goods and green technologies.
The diversity of environmental branding and its relationship to sustainable economic growth is typical of many industries. For example, organizations from the hospitality and tourism sector attract customers with their corporate image, environmental care and environmental awareness [29]. People become interested in joint environmental activities. Attributes of commitment to eco-labels, green color accompanies consumers of the service sector [30]. Special attitude to the promotion of ecological brands in the fashion and beauty industry. Manufacturers of clothing, accessories pay attention to environmental and social sustainability. Finished products have begun to possess new emotional, social and functional characteristics [31]. The category of environmental branding adherents includes representatives of the banking sector providing green loans and subsidies [32,33].
Along with the positive effects of green marketing, you can see the manifestation of the flip side—“greenwashing”. Researchers investigate corporate governance problems for companies that use eco-branding as a source of additional benefits. For example, the issue of green securities, additional revenue from the sale of products with the name “eco”. In these cases, there is a distortion of the purpose of bona fide green marketing. Scientists call for the development of mechanisms to control public information on sustainable development [34]. To mitigate the risk of greenwashing, an independent area of eco-branding promotion is defined, which will involve examining the integrity of industrial companies, their relations with government agencies, bureaucratic leverage, and the financial technologies used [35,36].
At the same time, green branding of industrial companies also requires special scientific approaches to research and promotion. Green technological processes, special marketing policy, access to green finance determine the potential for sustainable growth of enterprises. Here is a classification of the essential, in our opinion, approaches to environmental branding (Table 1).
3. Methods
In this study of the relationship between sustainable economic growth and investments in the development of eco-branding technologies for enterprises of the industrial complex of the Republic of Kazakhstan, official information from international organisations and research centres engaged in solving the problems of “green” transformation of production and economic systems was used. Classical methods of synthesis and analysis, such as comparative methods, and methods for strategic planning and forecasting were utilized. To assess readiness for eco-branding based on the economic and technological state of enterprises, descriptive models were used, which formed the basis for the construction of the system of balances in production capacity utilisation and for the calculation of analytical indicators.
The information basis is provided by Eurostat open sources (the Statistical Office of the European Union), Kazstat (the Bureau of the National Statistics Agency for Strategic Planning and Reforms of the Republic of Kazakhstan), Adilet (legal information resource of the Republic of Kazakhstan), and the Carbon Disclosure Project (official resource for the international non-profit charity organisation CDP Global).
Since 2017, Kazakhstani industrial companies have been starting to create special platforms for interaction with stakeholders, represented by the teachers and students of educational institutions located in the regions where these companies Thanks to open reporting for the first time, it was possible to assess and visualise the operate [53]. results of the survey of the population—stakeholders of industrial enterprises of the Pavlodar region, Republic of Kazakhstan (Appendix A, Table A1). The purpose of the survey was to diagnose the key problems of sustainable development in combination with the mechanisms of environmental branding of the industrial complex. A total of 302 people participated in the survey. The survey was distributed via email, comprising a link to the questionnaire Google form and an accompanying information letter with a description of the survey objectives. The questionnaire did not contain questions involving the disclosure of state secrets, official information with only restricted distribution allowed, or the confidential personal in-formation of respondents [54].
The notional structural and logical scheme of this study is presented in Figure 1.
The causal analysis method between different variables was used to determine the effectiveness of capital investment in green projects to improve a company’s environmental image. Modern applied research in the field of investment project efficiency is an important source of practical and theoretical recommendations. Researchers have studied the relationship between an increase in raw material processing capacity and an increase in total capital costs, comparing them with annual operating costs [55]. When launching new production facilities, the return on investment (ROI), the internal rate of return adjusted for inflation, is calculated [56]. Researchers diversify assets using cluster analysis, which involves grouping sample objects according to a set of defined attributes, and study the geological, environmental, social, and economic aspects of investment portfolios [57]. In this study, the focus is on changes in the volume of revenue from sales of manufactured products; costs and expenses incurred; earnings before interest, taxes, depreciation, and amortisation (EBITDA); and capital investment in green projects (Capital Expenditure, CAPEX); Return on capital investments, yielding the number of monetary units of total profit per one monetary unit of capital investments in green projects. A proven correlation analysis between various economic indicators is also used to develop recommendations for sustainable growth management and eco-branding. The set of indicators may include the dynamics of environmental innovations, production capacity reserves, the level of equipment depreciation, labour productivity, and the volumes of capital investments in green projects (resource-saving technologies, green marketing technologies, social environmental investments, etc.). For each variable, their mean values and mean deviations are calculated. Through the calculation algorithm, the products of deviations are found and then summarised. For each variable, the sums of the squares of deviations are calculated. Pearson’s linear correlation coefficients are calculated for the most significant variables, as shown in Formula (1):
- r is Pearson’s correlation coefficient;
- x and y are the values of variables x and y.
After that, the relationship between the variables was checked by observing the correlation condition. If the value of “r” is close to “−1”, it indicates a strong negative correlation between the selected variables. In cases where the value of “r” is close to zero “0”, then there is no linear relationship between the variables. If “r” is close to “1”, then a strong linear correlation is found between the variables.
Based on the results of the analysis, recommendations have been developed to improve mechanisms for managing sustainable economic growth and investments in the environmental transformation of industrial enterprises in Kazakhstan, including the environmental branding of products. This methodological approach, along with non-formalised approaches, can be adapted to the activities of enterprises of various industries. The conclusions of the analysis are the basis for proposals to promote environmental branding, for economic development proposals for the industrial enterprises of the Republic of Kazakhstan, which have reliable business partners in different countries and should fully meet the sustainability criteria.
4. Results
4.1. Economic and Technological Conditions of Enterprises in the Manufacturing Industry of the Republic of Kazakhstan in the Light of Environmental Transformations
In order to establish the relationship between sustainable economic growth and environmental branding of companies, it is important to identify a set of influencing factors. These are divided into external factors (exogenous), which have little dependence on industrial companies, and internal factors (endogenous), which directly depend on the companies’ activities [58,59,60,61] (Figure 2).
When analysing the current economic and technological state of manufacturing enterprises, it is important to take into account the peculiarities of the functioning of the national economy and its raw material orientation. In the two years after the COVID-19 pandemic, the country managed to achieve growth of almost a quarter of the gross domestic product. The production of industrial products has gained momentum with an increase of almost 30% in 2022. At the same time, the production of environmentally friendly products increased by half (56.6%), but its low share in the total production volume is of concern (Figure 3).
Kazakhstan’s industrial companies export most of their finished products to Eura-sian and European countries. For instance, in 2021, about 40% of exports went to the EU countries, 34.6% to Asian countries, and 20% to countries in the Commonwealth of Inde-pendent States. To date, the geography of sales markets has not changed significantly. In 2023, due to a decrease in effective demand and the diversification of transport routes, the volume of total shipments decreased by 4.1%. Despite the complexity of the foreign economic environment, enterprises continue to work towards the sustainability of business processes, including digitalisation. The increase in the implementation of digital technologies, including a system for tracking environmental parameters in production, was 65.4% in 2022 and 27.1% in 2023. Observations show that environmental compliance and carbon footprint reduction have become goals aiming to support the sustainable growth of large and medium-sized industrial companies that are active in terms of innovation both within and outside their regions (Table 2).
By analysing the technological state of industrial companies, we can confidently state that the achieved technological redesigns and the level of environmental innovation activity are the growth points of the economy of enterprises for the coming years. In order to make economic growth measures effective, it is necessary to compare the possibilities of the full use of the existing production base and take steps to ensure green business processes and eco-branding. In assessing progress in the first instance, it is important to note the positive inflow of investments in projects in areas such as air protection, combating climate change, wastewater treatment (especially important for this period of severe floods), energy-saving technologies, and energy efficiency (Figure 4).
Starting from 2023, we chose the industrial complex of Kazakhstan and enterprises of the Pavlodar region as the objects of study in terms of sustainable economic growth and eco-branding [64]. According to statistics, at the beginning of 2024, more than 7% of all Kazakhstani industrial production was concentrated in the Pavlodar region. Today, industrial facilities employ more than a quarter of the working population of the oblast and generate about 43% of the gross regional product. When assessing reserves of economic growth, it is advisable to rely on the data of the analysis of the balance of production capacity utilisation (Appendix B, Table A2). There were favourable conditions for identifying the potential and increasing of environmentally friendly production volumes by the enterprises of the Pavlodar region. Enterprises can count on the reserve capacity of their production facilities.
- Agro-industrial cluster—The companies Rubikom LLP, Laska LLP, Dyusembaev IE, and Kachir Sausages IE saw an increase in the production of sausages of 43.4%; Ruff LLP and Galitskoye LLP saw an increase in production of canned meat and meat-sauce products of 77.5%; and Galitskoye LLP, Maslodel LLP, and AGREX Company LLP saw an increase in production of unrefined vegetable oil of 96.1%. Advanced competitive positions in the Pavlodar region involve producers of dairy products (yoghurt, milk, and cream), which utilise their own resource-saving technologies and registered trademarks—MolCom LLP, Foodmaster LLP, Galitskoe LLP, Rodnik & K LLP, and Kachirsky Molzavod LLP. In Kazakhstan, the leaders of milk processing production are Agrofirma Rodina and Imeni Karl Marx LLP.
- Food products cluster—Producers of mineral and carbonated water Zhana Rosa LLP (trademark “Pavlodarskaya”) additionally developed up to 88.7% production capacity.
- Petrochemical cluster—Pavlodar Oil Chemistry Refinery LLP saw an increase in production of oil fuel of 32.0% and in oil road bitumen of 42.3%; the company Neftekhim LTD LLP saw an increase in the production of sacks and packaging bags of 29.6%; Polymer LLP saw an increase in the production of rubber and plastic products of 74.3%; and Lacquer Factory “Lacra” has the potential to increase the production of paints and varnishes and related products by 98%.
- Metallurgical cluster—The Eurasian Resources Group (ERG), Aluminium of Kazakhstan JSC, and Kazakhstan Aluminium Smelter JSC achieved optimal capacity utilisation; Kasting LLP and KSP Steel LLP saw an increased output of rolled steel and steel pipes of 65.2%.
Environmental norms and standards aid in the compliance of the primary production assets and applied technologies with the requirements of lean production. According to statistics, the degree of depreciation in the fixed assets of enterprises in 2023 was 46.5%, the renewal rate was 11.4%, and the liquidation rate was 1.3% [65]. Fixed assets of industrial enterprises need modernisation, and new equipment should meet the requirements of high environmental friendliness and energy efficiency. In this case, capital investments can be classified as “green” investment projects. This will directly affect the formation of a positive environmental image of companies.
4.2. Unlocking Reserves of Economic Growth Through Environmental Transformation, Including Eco-Branding
In order to unlock economic growth reserves, it is necessary to intensify activities for the development of environmental initiatives; for this purpose, it is advisable to move in parallel in two directions:
- Activation of the green investment flow through investments in resource-saving and environmental protection projects involving industrial capital, public, and private investments;
- Investments in the eco-cultural transformation of the new generation of eco-consumers, involvement of young people in the development of new ideas for the formation of ecological brands of national products, expanding the boundaries of eco-cultural communication in the global economy, and greening industrial projects on special platforms along the lines of “Industrial Clusters plus Generation Z”, in particular, the Eurasian Resources Group (ERG) Platform [53].
4.2.1. Activation of Green Investment Flows—The Case of the Eurasian Resources Group (ERG)
As an example of how to activate green investment flow, let us look at the case of the ERG and its subsidiary Aluminium of Kazakhstan JSC, which is located in Pavlodar and is part of the division “Metallurgical Cluster. Aluminium”. It is important to point out that the ERG comprises 18 integrated companies, and the share of the ERG’s full contribution to the GDP of the Republic of Kazakhstan is about 2.5% [66]. Since 2021, the ERG’s Analytical Centre for Decarbonisation has been active in the group. The ERG is currently implementing decarbonisation projects with a total investment of KZT 143,295.5 million (or USD 300 million).
The results of the analysis of the ERG and Aluminium of Kazakhstan JSC showed an increase in investments in projects including environmental, social, and governmental (ESG) projects from USD 1135 million in 2022 to USD 1440 million in 2023 (Appendix C, Table A3, Figure A1, Figure A2). The products of the ERG and Aluminium of Kazakhstan JSC are export-oriented; so, in 2023, Aluminium of Kazakhstan sold products worth a total of 245,828.5 KZT million (or USD 538.7 million), of which 34.9% were exported to Europe, 30.5% to Eurasia, and 34.6% to Kazakhstan. The downward trend in sales volumes is due to a decline in global prices for the group’s main products. As a result, ERG companies suffered losses in the efficiency of their capital expenditures (Figure 5).
Despite the influence of external factors, in 2022–2023, projects aiming to implement resource-saving technologies continued, and ERG companies increased social investments, including maintaining environmental culture in their teams and among residents of the region. The ERG has managed to cover the costs of the investments made. This created a safety cushion for the project implementation period; no deadlines were missed and no adjustments to the investment cost estimates were required. Given the dependence of the profitability of capital investments on the results of core activities, managers of structural units responsible for the implementation of green projects were included in the working group promoting the green finance policy. This group oversees corporate finance, sustainable development, risk management, production, energy supply, and environmental protection. It ensures transparency in the processes of attracting investments through green finance instruments in accordance with the International Capital Market Association (ICMA) and green loan principles (GLP), green bonds principles (GBP), the Loan Market Association (LMA), the Asia Pacific Loan Market Association (APLMA), and the Loan Syndications and Trading Association (LSTA).
The implementation of green projects is a factor for strengthening the positive environmental image of enterprises. By promoting ESG principles, ERG enterprises provide a positive example for other Kazakhstani producers. Ecological concerns in product quality, openness in reporting on finance and sustainable development, and care for employees and the general population became the “green intangible” assets in the Group companies.
4.2.2. Investing in the Eco-Cultural Transformation of the New Generation of Eco-Consumers—Opinions of Stakeholders of Industrial Companies
As an important area of eco-branding development measures contributing to the sustainable growth prospects of the industrial complex, it is possible to define investments in terms of the eco-cultural transformation of the new generation of eco-consumers as part of social investments. According to the ecological code of the Republic of Kazakhstan, environmental culture is understood as “a system of knowledge, skills and value orientations, expressing and defining the nature of relations between man and nature, the measure and method of human involvement in activities for the conservation and development of the natural environment” [67].
Eco-cultural transformation activities require investment injections. According to statistics, Kazakhstan spent KZT 4,921,332 million (or USD 11.6 million) on research and development in the field of environmental protection in 2021, KZT 3,479,430 million (or USD 7.6 million) in 2022, and KZT 5,063,347 million (or USD 11.1 million) in 2023. Large companies, which are at the core of regional industrial and technological clusters, finance ecological projects as part of social investment projects. For example, the ERG Way Production System promotes the formation of a more efficient production culture and enables efficiency throughout the entire product life cycle, including through the application of lean production principles. Thanks to the Idea Factory Concept, 61,811 active proposals have been accepted for implementation in 2023, which will result in production cost reductions of USD 37.8 million [66].
In order to diagnose the key problems of ensuring sustainable development in combination with the mechanisms of environmental branding of the industrial complex, researchers from Toraighyrov University conducted a survey that allows us to determine the points of interaction between industrial companies of Pavlodar region and their stakeholders, represented by the population [54]. Out of the 302 people who took part in the survey, most of the respondents (72.3%) were young people under 30 years of age, who were studying, in internships, or already working at the enterprises in the region (Figure 6).
According to the responses received, the region’s residents associate the characteristics of a “new generation eco-consumer” with a desire to preserve the ecosystem combined with responsible consumption (Figure 7). According to the majority of respondents, ecological products are associated with a high price (66.2% of answers). Many people believe that more information about the advantages of organic products is needed (47.0% of answers). The population expects counter measures from the government in the form of financial injections and tax preferences for eco-producers (36.4% of answers). (Figure 8).
Thanks to the survey, it was possible to rank attributes for the development of eco-branding in the region in terms of their importance. According to the majority of respondents, enterprises should ensure compliance with increased requirements for the environmental characteristics of finished products (53.3% of responses). The eco-labelling of the product production chain from raw materials to product consumption and utilisation is also important (47.3% of responses). It is advisable to compare the answers of enterprises to the same question and the answers of people. If the proposed measures are implemented comprehensively in the near future, the industrial sector will make significant progress towards a green economy (Figure 9).
4.3. Development of Proposals for Sustainable Development of Industrial Enterprises on the Basis of Investment Policy and Promotion of Environmental Branding
The sustainable development of industrial enterprises is seen in the formation of special approaches that will promote the combination of economic priorities in the form of value added growth, ensuring the profitability of capital investments and environmental priorities in the form of greening industrial projects and the ecological branding of manufactured products. As an effective tool of interaction between industrial capital, ecological innovation, and human capital, the creation of special platforms like “Industrial clusters plus Generation Z” is proposed. In Kazakhstan, the equivalent of such a platform is the “Student Entrepreneurship Ecosystem”, supported by industrial companies from the Eurasian Resources Group [53]. On this platform, training sessions on the digitalisation of business processes and the development of green tools are held with the participation of enterprises and educational institutions. There are regular competitions for the best idea for the introduction of resource-saving technologies, thus popularising knowledge about environmental initiatives both globally and in Kazakhstan. Students, together with mentor teachers, participate in the promotion of innovative business ideas and present their projects at annual competitions. Investors and sponsors, who have real skills in implementing environmental innovations, can sponsor youth projects and provide jobs in their companies, thus allowing them to participate as collaborators with business entities. The successful practice of social environmental investment can be scaled up as a prospect for sustaining sustainable growth. For example, a group of young entrepreneurs proposed the production of an environmentally friendly national product called “Eco Kurt”. Kurt is a type of hard cheese made from pressed and dried fermented sour milk. Due to technological process, it is possible to modify the finished product, for example, to give it a creative taste and colour, using natural fruit jams, dried fruits, nuts, and cereal grains from local producers as additives. The sites of the business centre of Toraighyrov University could be offered as a testing ground. Production facilities and investment capital could be provided by regional entrepreneurs, in particular, Galitskoe LLP and the ERG enterprises. Let us consider the implementation of this case study on the basis of Pearson’s correlation coefficient, which will help to substantiate the relationship between investment in the green project and the potential output of the national sour-milk product “Eco Kurt” (Appendix D, Table A4).
According to the forecast model, the value of Pearson’s correlation coefficient “r” is close to 1, which indicates a close relationship between the planned production volumes of environmentally friendly sour-milk product “Eco Kurt” and investments in this project from a five-year perspective. In addition, this project could be realised through the technological integration of related youth projects for the production of ecological packaging for “Eco Kurt”, an advertising campaign for a national ecological brand based on the principles of green marketing.
Based on the data from the study, we see those investments in green projects, environmental initiatives by industrial companies and the public help promote environmental brands and provide the basis for a sustainable economy.
5. Conclusions and Discussion
The generalisation of approaches to the sustainable economic growth of industrial enterprises and the eco-branding helps society to move towards progressive ecological development in order to fully and competently utilise the natural resources and human capital at their disposal. Having assessed external and internal factors that could fundamentally change the position of any company in the market, we can observe the following picture. In the coming years, Kazakhstani manufacturers and their partners in Eurasia, Europe, and America will have to implement carbon neutrality projects, the “smart” logistics of goods and raw materials, and the development and implementation of digital management systems for high-tech production. Kazakhstani companies have set goals for themselves to implement green technologies, involve the public in solving existing environmental problems, which forms their green image as a new type of asset. To unlock the potential of economic growth, it is important to adapt modern developments in the field of sustainable economics and eco-branding (Table 3 and Table 4).
Research in the field of economic growth taking into account environmental factors serves as a basis for successful implementation of projects aimed at achieving carbon neutrality. Successful environmental branding is an incentive for industrial enterprises and their stakeholders to work closely together.
The sustainable growth points identified in the course of the study can serve as a basis for future research:
- Greening of production technologies, introduction of green marketing mechanisms at enterprises to continuously study the needs of the new generation of eco-consumers;
- Engaging the younger generation in new green projects to produce branded products that are environmentally friendly and reflect the national traditions of each country;
- Development of digital technologies and special platforms to facilitate the interaction of participants in green integration;
- Formation of progressive images of responsible consumption and environmental protection.
Green transformation is a long and costly process that requires great efforts from economic actors. The implementation of sustainable projects brings its real achievements aimed at the well-being of future generations.
Author Contributions
Conceptualization and methodology, L.D.; formal analysis, investigation, resources, writing—original draft, writing—review and editing, and visualization, L.D., A.T., N.S., and A.B. All authors have read and agreed to the published version of the manuscript.
Funding
This research was funded by the Science Committee of the Ministry of Science and Higher Education of the Republic of Kazakhstan (grant no. AP19676924, ”Development of technology and promotion of ecological branding of the industrial complex of the region”).
Data Availability Statement
Publicly available datasets were analysed in this study. The data used are open-source. Neither classified nor trade secret data were used. These data can be found at https://stat.gov.kz/ (accessed on 1 September 2024), https://science.tou.edu.kz/storage/Report_on_the_sociological_survey_Population.pdf (accessed on 31 October 2024).
Conflicts of Interest
The authors declare no conflicts of interest.
Appendix A

Table A1.
Roadmap for conducting and approbation of the results of sociological survey (online questionnaire) of the population - stakeholders of industrial enterprises of Pavlodar region, Republic of Kazakhstan.
Table A1.
Roadmap for conducting and approbation of the results of sociological survey (online questionnaire) of the population - stakeholders of industrial enterprises of Pavlodar region, Republic of Kazakhstan.
| Process stage | Period |
|---|---|
| The purpose of the survey—to diagnose the key problems of sustainable development in combination with the mechanisms of eco-branding of the industrial complex | Q4 2023 |
| Organization of a discussion platform in Pavlodar Youth Initiatives Development Center with youth, public and governmental bodies on the topic “Eco-branding in youth entrepreneurship” | Q1 2024 |
| Estimating the volume of investment in the implementation of eco-branding technology | Q2 2024 |
| Development of principles for the implementation of eco-branding technology | Q3 2024 |
| Preparation of a scientific publication (article) based on the results of the survey | Q4 2024 |
| Scaling / extrapolation of platform green manufacturing to regions of Kazakhstan and networking to promote national eco-branding | 2025 |
Appendix B
Table A2.
Analysis of the balance of production capacity utilisation by types of finished products, compliant with environmental standards for 2023, Growth Reserve for 2024-2030.
Table A2.
Analysis of the balance of production capacity utilisation by types of finished products, compliant with environmental standards for 2023, Growth Reserve for 2024-2030.
| Region/Oblast | Capacity at the Beginning of the Year | Capacity at the End of the Year | Average Annual Capacity | Output or Quantity of Raw Materials Processed | Average Annual Capacity Utilisation in the Reported Year, in % | Growth Reserve, in % |
|---|---|---|---|---|---|---|
| Sausages and similar meat products, tonnes | ||||||
| Republic of Kazakhstan | 101,537.0 | 99,708.0 | 87,308.0 | 46,305.0 | 53.0 | 47.0 |
| Pavlodar region | 10,437.0 | 10,467.0 | 10,467.0 | 5927.0 | 56.6 | 43.4 |
| Canned meat, tonnes | ||||||
| Republic of Kazakhstan | 1724.0 | 1724.0 | 1471.0 | 1147.0 | 78.0 | 22.0 |
| Pavlodar region | 160.0 | 160.0 | 160.0 | 36.0 | 22.5 | 77.5 |
| Unrefined vegetable oil, tonnes | ||||||
| Republic of Kazakhstan | 1,592,343.0 | 1,689,111.0 | 1,442,391.0 | 505,646.0 | 35.1 | 64.9 |
| Pavlodar region | 28,904.0 | 29,154.0 | 15,834.0 | 612.0 | 3.9 | 96.1 |
| Butter and dairy spreads (pastes), tonnes | ||||||
| Republic of Kazakhstan | 58,229.0 | 62,228.0 | 60,839.0 | 27,133.0 | 44.6 | 55.4 |
| Pavlodar region | 3320.0 | 3740.0 | 3540.0 | 2459.0 | 69.5 | 30.5 |
| Cheese and cottage cheese, tonnes | ||||||
| Republic of Kazakhstan | 94,572.0 | 100,815.0 | 98,592.0 | 37,237.0 | 37.8 | 62.2 |
| Pavlodar region | 3836.0 | 3856.0 | 3846.0 | 1816.0 | 47.2 | 52.8 |
| Yoghurt, milk, and cream, other fermented or squashed dairy products, tonnes | ||||||
| Republic of Kazakhstan | 353,652.0 | 353,307.0 | 330,865.0 | 194,717.0 | 58.9 | 41.1 |
| Pavlodar region | 47,245.0 | 47,791.0 | 47,791.0 | 43,624.0 | 91.3 | 8.7 |
| Macaroni, noodles, couscous, and similar flour products, tonnes | ||||||
| Republic of Kazakhstan | 427,912.0 | 409,183.0 | 389,761.0 | 154,484.0 | 39.6 | 60.4 |
| Pavlodar region | 11,831.0 | 11,831.0 | 11,831.0 | 9539.0 | 80.6 | 19.4 |
| Mineral and carbonated waters, unsweetened and unflavoured, thousand litres | ||||||
| Republic of Kazakhstan | 1,492,852.6 | 1,520,356.4 | 1,733,334.2 | 657,046.3 | 37.9 | 62.1 |
| Pavlodar region | 122,350.0 | 123,335.2 | 123,245.2 | 13,924.2 | 11.3 | 88.7 |
| Bed linen, thousand pieces | ||||||
| Republic of Kazakhstan | 54,768.8 | 52,817.2 | 43,495.6 | 28,830.6 | 66.3 | 33.7 |
| Pavlodar region | 25.0 | 25.0 | 25.0 | 11.1 | 44.4 | 55.6 |
| Packaging bags and pouches, thousand pieces | ||||||
| Republic of Kazakhstan | 265,134.3 | 255,568.8 | 228,253.0 | 162,471.2 | 71.2 | 28.8 |
| Pavlodar region | 60,144.9 | 60,145.2 | 60,145.2 | 42,335.3 | 70.4 | 29.6 |
| Bags and pouches (including conical) made of polyethylene, kg | ||||||
| Republic of Kazakhstan | 42,276,132.0 | 43,026,217.0 | 40,329,248.0 | 18,976,952.0 | 47.1 | 52.9 |
| Pavlodar region | 2,378,318.0 | 2,090,000.0 | 2,090,000.0 | 1,516,260.0 | 72.5 | 27.5 |
| Petroleum fuel (fuel oil), gas oil (diesel fuel), and petroleum distillates, thousand tonnes | ||||||
| Republic of Kazakhstan | 20,599.4 | 20,877.7 | 20,067,8 | 14,540.5 | 72.5 | 27.5 |
| Pavlodar region | 6058.0 | 6062.0 | 6062.0 | 4124.3 | 68.0 | 32.0 |
| Petroleum road bitumen, thousand tonnes | ||||||
| Republic of Kazakhstan | 1386.6 | 1486.6 | 1486.6 | 801.5 | 53.9 | 46.1 |
| Pavlodar region | 500.0 | 500.0 | 500.0 | 288.4 | 57.7 | 42.3 |
| Rubber and plastic products, pipes, tubes, sleeves, and hoses made of rubber (except ebonite), kg | ||||||
| Republic of Kazakhstan | 1,346,700.0 | 1,399,948.0 | 1,399,678.0 | 625,193.0 | 44.7 | 55.3 |
| Pavlodar region | 290,000.0 | 290,000.0 | 290,000.0 | 74,590.0 | 25.7 | 74.3 |
| Plates, sheets, films, foils, and strips of plastics, unreinforced or not combined with other materials, kg | ||||||
| Republic of Kazakhstan | 71,812,174.0 | 76,947,406.0 | 64,038,565.0 | 33,159,853.0 | 51.8 | 48.2 |
| Pavlodar region | 1,065,812.0 | 610,000.0 | 610,000.0 | 373,366.0 | 61.2 | 38.8 |
| Paints and varnishes and other related products, artists’ paint and printing ink, tonnes | ||||||
| Republic of Kazakhstan | 17,945.0 | 18,058.0 | 4805.0 | 3496.0 | 72.8 | 27.2 |
| Pavlodar region | 600.0 | 600.0 | 600.0 | 7 | 1.2 | 98.8 |
| Unprocessed aluminium, tonnes | ||||||
| Republic of Kazakhstan | 345,664.0 | 325,551.0 | 303,587.0 | 275,102.0 | 90.6 | 9.4 |
| Pavlodar region | 304,991.0 | 279,488.0 | 261,484.0 | 260,876.0 | 99.8 | 0.2 |
| Rolled steel and steel pipes, tonnes | ||||||
| Republic of Kazakhstan | 13,500.0 | 13,500.0 | 12,000.0 | 4176.0 | 34.8 | 65.2 |
| Pavlodar region | 12,000.0 | 12,000.0 | 12,000.0 | 4176.0 | 34.8 | 65.2 |
Source: compiled by the authors [62].
Appendix C
Table A3.
Calculations on the factor model for assessing the efficiency of capital investments in green projects of the Eurasian Resources Group enterprises.
Table A3.
Calculations on the factor model for assessing the efficiency of capital investments in green projects of the Eurasian Resources Group enterprises.
| Indicator | 2019 | 2020 | 2021 | 2022 | 2023 |
|---|---|---|---|---|---|
| Proceeds from sales (sales), million USD | 4872 | 5356 | 8530 | 7924 | 6509 |
| Costs and expenses (costs), million USD | 4145 | 4701 | 6397 | 6159 | 6136 |
| EBITDA, million USD | 1538 | 2023 | 4210 | 3392 | 1530 |
| Capital expenditures (CAPEX), million USD | 869 | 572 | 735 | 1135 | 1440 |
| R (EBITDA/CAPEX) | 1.7699 | 3.5367 | 5.7279 | 2.9885 | 1.0625 |
| Change in capital investment efficiency (R), in points | −0.7740 | 1.7669 | 2.1912 | −2.7393 | −1.9260 |
Source: Compiled by the authors [66].
Figure A1.
Factors influencing the sustainable growth of ERG Group companies.
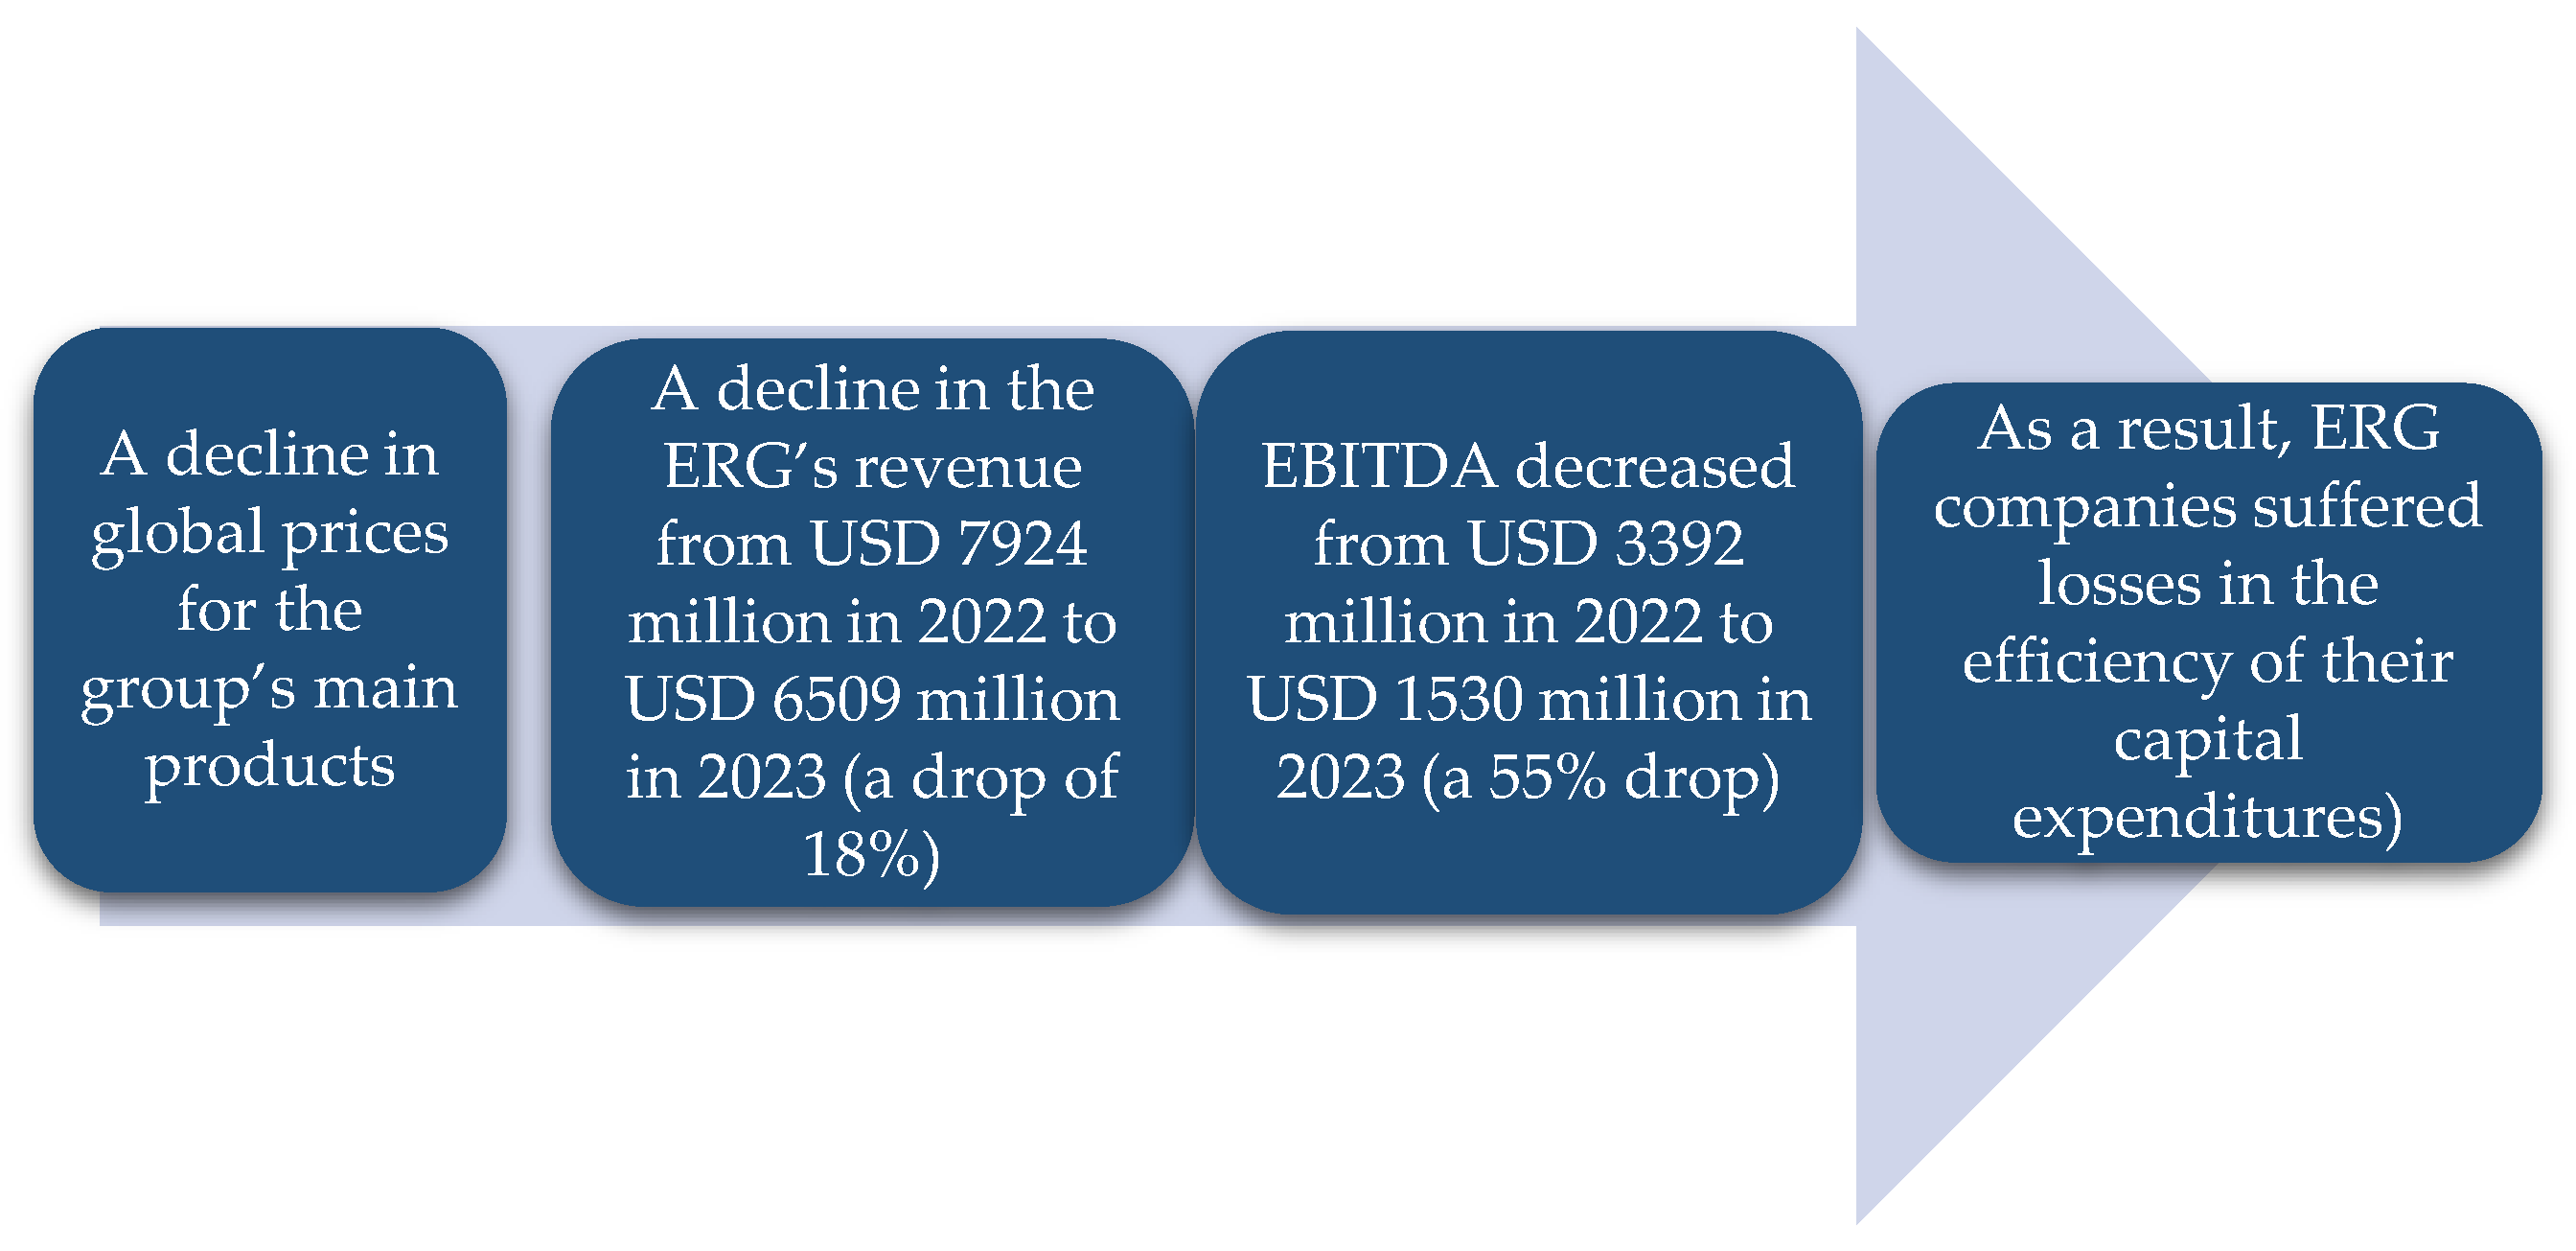
Figure A2.
Factors influencing the environmental image of ERG Group companies.
Appendix D
Table A4.
Dynamics of capital investments and production volumes of national sour-milk product “Eco Kurt”, relationship based on Pearson’s correlation coefficient.
Table A4.
Dynamics of capital investments and production volumes of national sour-milk product “Eco Kurt”, relationship based on Pearson’s correlation coefficient.
| Indicators | 2025 | 2026 | 2027 | 2028 | 2029 |
|---|---|---|---|---|---|
| Volume of planned investments (present value), million KZT (variable “x”) | 3 | 5 | 7 | 9 | 11 |
| “Eco Kurt” production volume, tonnes (variable “y”) | 300 | 320 | 350 | 380 | 400 |
| Average planned investments | () = (3 + 5 + 7 +9 + 11)/5 = 35/5 = 7 | ||||
| Average production volume of “Eco Kurt”, | ) = (300 + 320 + 350 +380 + 400)/5 = 1750/5 = 350 | ||||
| Calculation of deviation from the mean for each variable “x” | 3 − 7 = −4 | 5 − 7 = −2 | 7 − 7 = 0 | 9 − 7 = 2 | 11 − 7 = 4 |
| Calculation of the deviation from the mean for each variable “y” | 300 − 350 = −50 | 320 − 350 = −30 | 350 − 350 = 0 | 380 − 350 = 30 | 400 − 350 = 50 |
| Multiplication of deviations of variable “x” by deviations of variable “y” | 200 | 60 | 0 | 60 | 200 |
| Sum of products |
200 +60 + 0 +60 + 200 = 520 | ||||
| Sum of squares of deviations of “x” |
|||||
| Sum of squares of deviations of “y” |
|||||
Source: authors’ calculations.
References
- Eurostat. Gross Value Added in Environmental Goods and Services Sector. EC Data Browser. Available online: https://ec.europa.eu/eurostat/databrowser/view/sdg_12_61/default/table?lang=en&category=sdg.sdg_12/ (accessed on 1 September 2024).
- Adilet. On Approval of the Strategy for Achieving Carbon Neutrality of the Republic of Kazakhstan Until 2060. Decree of the President of the Republic of Kazakhstan. No. 121. Available online: https://adilet.zan.kz/kaz/docs/U2300000121 (accessed on 2 February 2023).
- Kazstat. Ensure Sustainable Consumption and Production Patterns. Bureau of National Statistics Agency for Strategic Planning and Reforms of the Republic of Kazakhstan. Available online: https://kazstat.github.io/sdg-site-kazstat/ru/12-4-2/ (accessed on 1 September 2024).
- Varavin, Y.V.; Kozlova, M.V.; Kuur, O.V.; Pestunova, G.B. Assessment of Investment Attractiveness of Regional Industries in the Context of Green Development. Econ. of Reg. 2023, 19, 494–510. [Google Scholar] [CrossRef]
- Carbon Disclosure Project. Companies. Available online: https://www.cdp.net/en/companies/ (accessed on 1 September 2024).
- Afanasyev, M.P.; Shash, N.N. The Strategy of “Green” Reindustrialization: Managerial and financial aspects. Vopr. Gos. i Munit. Upr.-Publ. Admin. 2024, 2, 41–63. [Google Scholar] [CrossRef]
- Javed, M.Y.; Hasan, M.; Aqil, M.; Ziaur Rehman, M.; Salar, S.A.А. Exploring Sustainable Investments: How They Drive Firm Performance in Indian Private and Publicly Listed Companies. Sustainability 2024, 16, 7240. [Google Scholar] [CrossRef]
- Cakmakci, Y.; Hurma, H.; Cakmakci, C. Determination of Consumer Perceptions of Eco-Friendly Food Products Using Unsupervised Machine Learning. J. of Tekir. Agr. Fakult.-Tekir. Zir. Fakult. Derg. 2024, 21, 634–47. [Google Scholar] [CrossRef]
- Liu, M.; Liu, L.; Feng, A. The Impact of Green Innovation on Corporate Performance: An Analysis Based on Substantive and Strategic Green Innovations. Sustainability 2024, 16, 2588. [Google Scholar] [CrossRef]
- Patalas-Maliszewska, J.; Łosyk, H. Changes in Sustainable Development in Manufacturing in Cases of Unexpected Occurrences—A Systematic Review. Sustainability 2024, 16, 717. [Google Scholar] [CrossRef]
- Clerici, A.; Cova, B.; Callegari, G. Decarbonization of the electrical power sector in Europe: An asset, an opportunity or a problem? Energy & Environ. 2015, 26, 127–142. [Google Scholar] [CrossRef]
- Halkos, G.E.; Papageorgiou, G.J.; Halkos, E.G.; Papageorgiou, J.G. Dynamic Modeling of Environmental Subsidies. Economies 2024, 12, 75. [Google Scholar] [CrossRef]
- Mu, Z.; Li, Q.; Shen, W.; Xia, Y.; Sun, H.; Cheng, L. Optimal green product segmentation and differential pricing in a platform supply Chain. J. of Indust. and Manag. Optimiz. 2023, 20, 1371–1394. [Google Scholar] [CrossRef]
- Paleari, S. The Role of Strategic Autonomy in the EU Green Transition. Sustainability 2024, 16, 2597. [Google Scholar] [CrossRef]
- Xu, Y.; Du, Z.; Kong, L.; Xu, K. Research on the impact of public environmental participation on foreign direct investment: Evidence from China. Environ. Res. Comm. 2024, 6, 025019. [Google Scholar] [CrossRef]
- Liu, X.; Fang, J.; Hu, X.; Lv, Y. Do Cross-Border Mergers and Acquisitions by Emerging Market Enterprises Enhance Long-Term Productivity? The Host Country Market Size Effect Moderated by Technological Absorption Efforts. Systems 2024, 12, 161. [Google Scholar] [CrossRef]
- Wang, C.; Guo, J.; Xu, W.; Qin, S. The impact of digital transformation on corporate green governance under carbon peaking and neutrality goals: Evidence from China. PLoS ONE 2024, 19, e0302432. [Google Scholar] [CrossRef] [PubMed]
- Batarlienė, N.; Jarašūnienė, A. Improving the Quality of Warehousing Processes in the Context of the Logistics Sector. Sustainability 2024, 16, 2595. [Google Scholar] [CrossRef]
- Lu, X. Influence of financial accounting information transparency on supply chain financial decision-making. Heliyon 2024, 10, e33113. [Google Scholar] [CrossRef]
- Adomako-Kwakye, C. Would Ghana Escape the Resource Curse? Reflections on the Minister of Finance’s Power under the Petroleum. Afr. J. of Inter. and Comp. Law 2023, 31, 153–75. [Google Scholar] [CrossRef]
- Jannah, N.; Irvanni Bahri, M. , Kismawadi, E. R.; Handriana, T. 2024. The Effect of Green Brand Image and Green Satisfaction on Green Brand Equity Mediated Green Trust Outpatient’s. Qual.-Ac. to Succ. 2024, 25, 381–390. [Google Scholar] [CrossRef]
- Lou, X.; Xu, Y. Consumption of Sustainable Denim Products: The Contribution of Blockchain Certified Eco-Labels. J. of Theor. and App. Electr. Comm. Res. 2024, 19, 396–411. [Google Scholar] [CrossRef]
- Bagadeem, S.; Ayesha, S.; Narula, S.A.; Farhan, N.H.S.; Magry, M.A. Impact of Firm-Specific and Macroeconomic Determinants on Environmental Expenditures: Empirical Evidence from Manufacturing Firms. Economies 2024, 12, 159. [Google Scholar] [CrossRef]
- Pan, A.; Jiang, P.; Wang, C.; Wang, F. Does environmental regulation promote green technological innovation of companies? Evidence from green patents of Chinese listed companies. Inter. J. of Low-Carb. Techn. 2024, 19, 807–820. [Google Scholar] [CrossRef]
- Wang, R.; Yan, J.; Wang, W. The economic and environmental effects of China’s environmental expenditure under financing constraints. PLoS ONE 2024, 19, e0305246. [Google Scholar] [CrossRef] [PubMed]
- Han, A.; Yu, T.; Ke, Y.; Liu, C.; Liu, Y. Study on the effect of carbon trading on the carbon emission intensity of enterprises-a mechanism test based on ESG performance. Front. in Environ. Sc. 2024, 12, 1406577. [Google Scholar] [CrossRef]
- Dey, B.K.; Seok, H.; Chung, K. Optimal Decisions on Greenness, Carbon Emission Reductions, and Flexibility for Imperfect Production with Partial Outsourcing. Mathematics 2024, 12, 654. [Google Scholar] [CrossRef]
- Li, Z.; Kong, L.; Xu, K. Do environmental target constraints promote corporate pollution reduction? Environ. Res. Comm. 2024, 6, 035007. [Google Scholar] [CrossRef]
- Cao, P.; Sial, M.S.; Alvarez-Otero, S.; Brugni, T.V.; Comite, U. Eco-engagement: Tracing CSR communication’s ripple effect on consumer hospitality loyalty. J. of Retail. and Cons. Serv. 2024, 79, 103879. [Google Scholar] [CrossRef]
- Nosrati, S.; Altinay, L.; Darvishmotevali, M. Multiple mediating effects in the association between hotels’ eco-label credibility and green WOM behavior. J. of Hosp. Mark. & Manag. 2024, 33, 917–942. [Google Scholar] [CrossRef]
- Behre, B.; Cauberghe, V. “Eco-style” perceptions: The interplay of different sustainability cues and fashion styles in consumers’ fashion brand attitudes. Intern. J. of Consum. Stud. 2024, 48, e13032. [Google Scholar] [CrossRef]
- Chen, F.Y.; Zeng, X.; Guo, X. Green finance, climate change, and green innovation: Evidence from China. Fin. Resear. Lett. 2024, 63, 105283. [Google Scholar] [CrossRef]
- Shi, R.Y.; Zhou, H.Y.; Li, X.Q.; Miao, X’.; Zhao, X. Green finance, investor preferences, and corporate green innovation. Fin. Res. 2024, 66, 105676. [CrossRef]
- Wang, Y.; Xing, C.; Zhang, L.X. ; Is greenwashing beneficial for corporate access to financing? Evidence from China. Fin. Res. Lett. 2024, 65, 105538. [Google Scholar] [CrossRef]
- Wang, H.; Shen, H. Self-restraint or external supervision: Green bond issuance and greenwashing. Res. in Inter. Bus. and Fin. 2024, 70, 102402. [Google Scholar] [CrossRef]
- Zhao, Y.N.; Lee, C.C. The impact of vertical environmental regulation mechanism on greenwashing. J. of Clean. Prod. 2024, 475, 143637. [Google Scholar] [CrossRef]
- Bao, Z.; Lin, Z.; Jin, T.; Lv, K. Regional Breakthrough Innovation Change Strategies, Ecological Location Suitability of High-Tech Industry Innovation Ecosystems, and Green Energy. Energies 2024, 17, 3938. [Google Scholar] [CrossRef]
- Li, C.; Ahmad, S.F.; Ahmad Ayassrah, A.Y.A.B.; Irshad, M.; Telba, A.A.; Mahrous Awwad, E.; Imran Majid, M. Green production and green technology for sustainability: The mediating role of waste reduction and energy use. Heliyon 2023, 19, e22496. [Google Scholar] [CrossRef]
- Xie, M.Y.; Zhao, S.N.; Lv, K. The Impact of Green Finance and Financial Technology on Regional Green Energy Technological Innovation Based on the Dual Machine Learning and Spatial Econometric Models. Energies 2024, 17, 2521. [Google Scholar] [CrossRef]
- Lingaitiene, O.; Burinskiene, A. Development of Trade in Recyclable Raw Materials: Transition to a Circular Economy. Economies 2024, 12, 48. [Google Scholar] [CrossRef]
- AlKetbi, A.; Rice, J. The Impact of Green Human Resource Management Practices on Employees, Clients, and Organizational Performance: A Literature. Review. Adm. Sci. 2024, 14, 78. [Google Scholar] [CrossRef]
- Shah, N. , Soomro B. Effects of green human resource management practices on green innovation and behavior. Manag. Decis. 2023, 61, 290–312. [Google Scholar] [CrossRef]
- Tufail, M.; Song, L.; Khan, Z. Green finance and green growth nexus: evaluating the role of globalization and human capital. J. of Appl. Econ. 2024, 27, 2309437. [Google Scholar] [CrossRef]
- Wallo, A.; Martin, J.; Elg, M., Harlin, U.; Gremyr, I.; Bozic, N.; Skagert, K.; Williamsson, A. Charting the path to a sustainable, competitive and green industry in an era of rapid change: proposing a research agenda. Cog. Busn. & Manag. 2024, 11, 2344189. [CrossRef]
- Lofgren, A.; Ahlvik, L.; Bijgaart, I.; Coria, J.; Jaraite-Kazukauske, J.; Johnsson, F.; Rootzen, J. Green industrial policy for climate action in the basic materials industry. Clim. Change 2024, 177, 147. [Google Scholar] [CrossRef]
- Junaid, M.; Hamid, A.A.; Ya’akub, N.I.B.; Akram, U.; Hussain, K. Destination love and addiction: Insights from positive addiction theory. J. of Vac. Mar. 2024. [Google Scholar] [CrossRef]
- Ho, K.C.; Shen, X.; Yan, C.; Hu, X. Influence of green innovation on disclosure quality: Mediating role of media attention. Techn. Forecast. and Soc. Change 2023, 188, 122314. [Google Scholar] [CrossRef]
- Lin, J.L.; Huang, Y.B.; Li, M.Y. Consumer perceived green brand innovativeness and green word-of-mouth intention: the moderating role of green knowledge. Tot. Qual. Manag. & Busn. Exc. 2024, 35, 814–834. [Google Scholar] [CrossRef]
- Unal, U.; Bagci, R.B.; Tascioglu, M. The perfect combination to win the competition: Bringing sustainability and customer experience together. Busn. Str. and the Environ. 2024, 33, 4806–4824. [Google Scholar] [CrossRef]
- Todorova, S. Green trademarks and sustainability. Strat. for Pol. in Scien. and Educ.-Str. na Obr. i Nauch. Pol. 2024, 32, 87–97. [Google Scholar] [CrossRef]
- Huh, J.; Kim, N.L. Green as the new status symbol: Examining green signaling effects among Gen Z and Millennial consumers. J. of Fash. Mar. and Manag. 2024, 28, 1237–1255. [Google Scholar] [CrossRef]
- Alyahya, M. Information and Communication Technology, Integrated Marketing Communication, Social Media Branding and Memorable Tourist Experience Impact on Heritage Green Tourism. Prof. de La Inf. 2024, 33, e330323. [Google Scholar] [CrossRef]
- Ecosystem ERG. Student Entrepreneurship Ecosystem. Eurasian Resources Group (ERG) Platform. Available online: https://ecosystemerg.kz/ (accessed on 1 September 2024).
- Scientific & Innovative HUB of ToU. Results of sociological survey (online questionnaire). Target audience – population. NJSC Toraighyrov University. Available online: https://science.tou.edu.kz/storage/Report_on_the_sociological_survey_Population.pdf (accessed on 31 October 2024).
- He, Y.; Chen, R.; Li, W.; Yang, R.; Yi, C.; Wu, Y.; Xia, G.; Xu, X.; Liu, Y. 2024. Simulation and Economic Analysis of Helium Extraction Process from Natural Gas. Processes 2024, 12, 1892. [Google Scholar] [CrossRef]
- Fajimi, L.I.; Bilainu, O.O. A techno-economic study on the co-production of syngas and activated carbon from waste tyre gasification process. J. of Mat. Cycl. and Waste Manag. 2023, 25, 3462–3475. [Google Scholar] [CrossRef]
- Nikolaichuk, L.; Ignatiev, K.; Filatova, I.; Shabalova, A. Diversification of Portfolio of International Oil and Gas Assets using Cluster Analysis. Int. J. of Engineer. 2023, 16, 1783–1792. [Google Scholar] [CrossRef]
- Lin, J.; Zhang, L.; Dong, Z. Exploring the effect of green finance on green development of China’s energy-intensive industry—A spatial econometric analysis. Res. Environ. and Sustain. 2024, 16, 100159. [Google Scholar] [CrossRef]
- Sarker, S.I.; Bartok, I. A Systematic Review of Green and Digital Transitional Factors in the Fashion Industry. Busn. Sys. Res. J. 2024, 15, 1–21. [Google Scholar] [CrossRef]
- Zhang, N.; Deng, J.; Gu, Y.; Ahmad, F. Does the agglomeration of high-tech industries improve the efficiency of China’s green economy? Analysis based on the marketization. Front. in Environ. Sc. 2024, 11, 1326393. [Google Scholar] [CrossRef]
- Chaudhuri, R.; Singh, B.; Agrawal, A.K.; Chatterjee, S.; Gupta, S.; Mangla, S.K. A TOE-DCV approach to green supply chain adoption for sustainable operations in the semiconductor industry. Int. J. of Prod. Econ. 2024, 275, 109327. [Google Scholar] [CrossRef]
- Kazstat. Statistics of industrial production. Ensure Sustainable Consumption and Production Patterns. Bureau of National Statistics Agency for Strategic Planning and Reforms of the Republic of Kazakhstan. Available online: https://stat.gov.kz/ru/industries/business-statistics/stat-industrial-production/publications/182339/ (accessed on 1 November 2024).
- Kazstat. Statistics of environment. Bureau of National Statistics Agency for Strategic Planning and Reforms of the Republic of Kazakhstan. Available online: https://stat.gov.kz/en/industries/environment/stat-eco/publications/199907/ (accessed on 1 September 2024).
- Davidenko, L.; Sherimova, N.; Kunyazova, S.; Amirova, M.; Beisembina, A. Sustainable Economy: The Eco-Branding of an Industrial Region in Kazakhstan. Sustainability 2024, 16, 413. [Google Scholar] [CrossRef]
- Kazstat. Structural statistics. Bureau of National Statistics Agency for Strategic Planning and Reforms of the Republic of Kazakhstan. Available online: https://stat.gov.kz/en/industries/business-statistics/stat-struct/ (accessed on 1 September 2024).
- ERG. Sustainability Reports. Available online: https://www.erg.kz/en/report-cards (accessed on 1 September 2024).
- Adilet. Ecological Code of the Republic of Kazakhstan. The Code of the Republic of Kazakhstan. No. 400-VI LRK. Available online: https://adilet.zan.kz/eng/docs/K2100000400 (accessed on 2 January 2021).
- Tyshchenko, V.; Kovtun, O.; Fomenko, D. Conceptual bases of strategic management of integrated economic sustainability of entrepreneurial structures in crisis conditions. Baltic J. of Econ. Stud. 2024, 10, 258–264. [Google Scholar] [CrossRef]
- Chen, X.; Huajie, L.; Liu, S. Environmental regulation and environmental performance of enterprises: Quasi-natural experiment of the new environmental protection law. Int. Stud. of Econ. 2024, 19, 406–30. [Google Scholar] [CrossRef]
- Ning, J.; Zhang, C.; Hu, M.; Sun, T. Accounting for Greenhouse Gas Emissions in the Agricultural System of China Based on the Life Cycle Assessment Method. Sustainability 2024, 16, 2594. [Google Scholar] [CrossRef]
- Colangelo, S. Reducing the environmental footprint of glass manufacturing. Int. J. of Appl. Gl. Scien. 2024, 15, 350–366. [Google Scholar] [CrossRef]
- Bajar, R.G.C.A.; Ong, A.K.S.; German, J.D. Determining Sustainable Purchase Behavior for Green Products from Name-Brand Shops: A Gen Z Perspective in a Developing Country. Sustainability 2024, 16, 3747. [Google Scholar] [CrossRef]
- Shah, S.S.H.; Khalid, M.B.; Khan, M.A.; Haddad, H.; Alramahi, N.M. Shades of green: Exploring the fascinating landscape of consumer behavior towards eco-friendly cosmetics in Pakistan. J. of Infr. Pol. and Develop. 2024, 8, 2760. [Google Scholar] [CrossRef]
- Gosal, G.A.; Jaury, C.; Jason, S.; Ananda, A.S. Perceived Consumer Values of Green Packaging as Antecedents of Attitude Toward Fashion Brand Qual. -Ac. to Succ. 2024, 25, 291–298. [Google Scholar] [CrossRef]
- Sun, K.A.; Moon, J. Relationships between Psychological Risk, Brand Trust, and Repurchase Intentions of Bottled Water: The Moderating Effect of Eco-Friendly Packaging. Sustainability 2024, 16, 5736. [Google Scholar] [CrossRef]
- Huang, C.; Song, T.; Wang, H. Alone or Mixed? The Effect of Digital Human Narrative Scenarios on Chinese Consumer Eco-Product Purchase Intention. J. of Theor. and App. Electr. Comm. Res. 2024, 19, 1734–55. [Google Scholar] [CrossRef]
- Bravo, A.; Vieira, D. Modelling the Purchase of Green Packaged Products: The Significant Impact of the West-East Cultural Context. Sustainability 2024, 16, 1206. [Google Scholar] [CrossRef]
Figure 1.
Structural and logical framework of this study. Source: compiled by the authors.
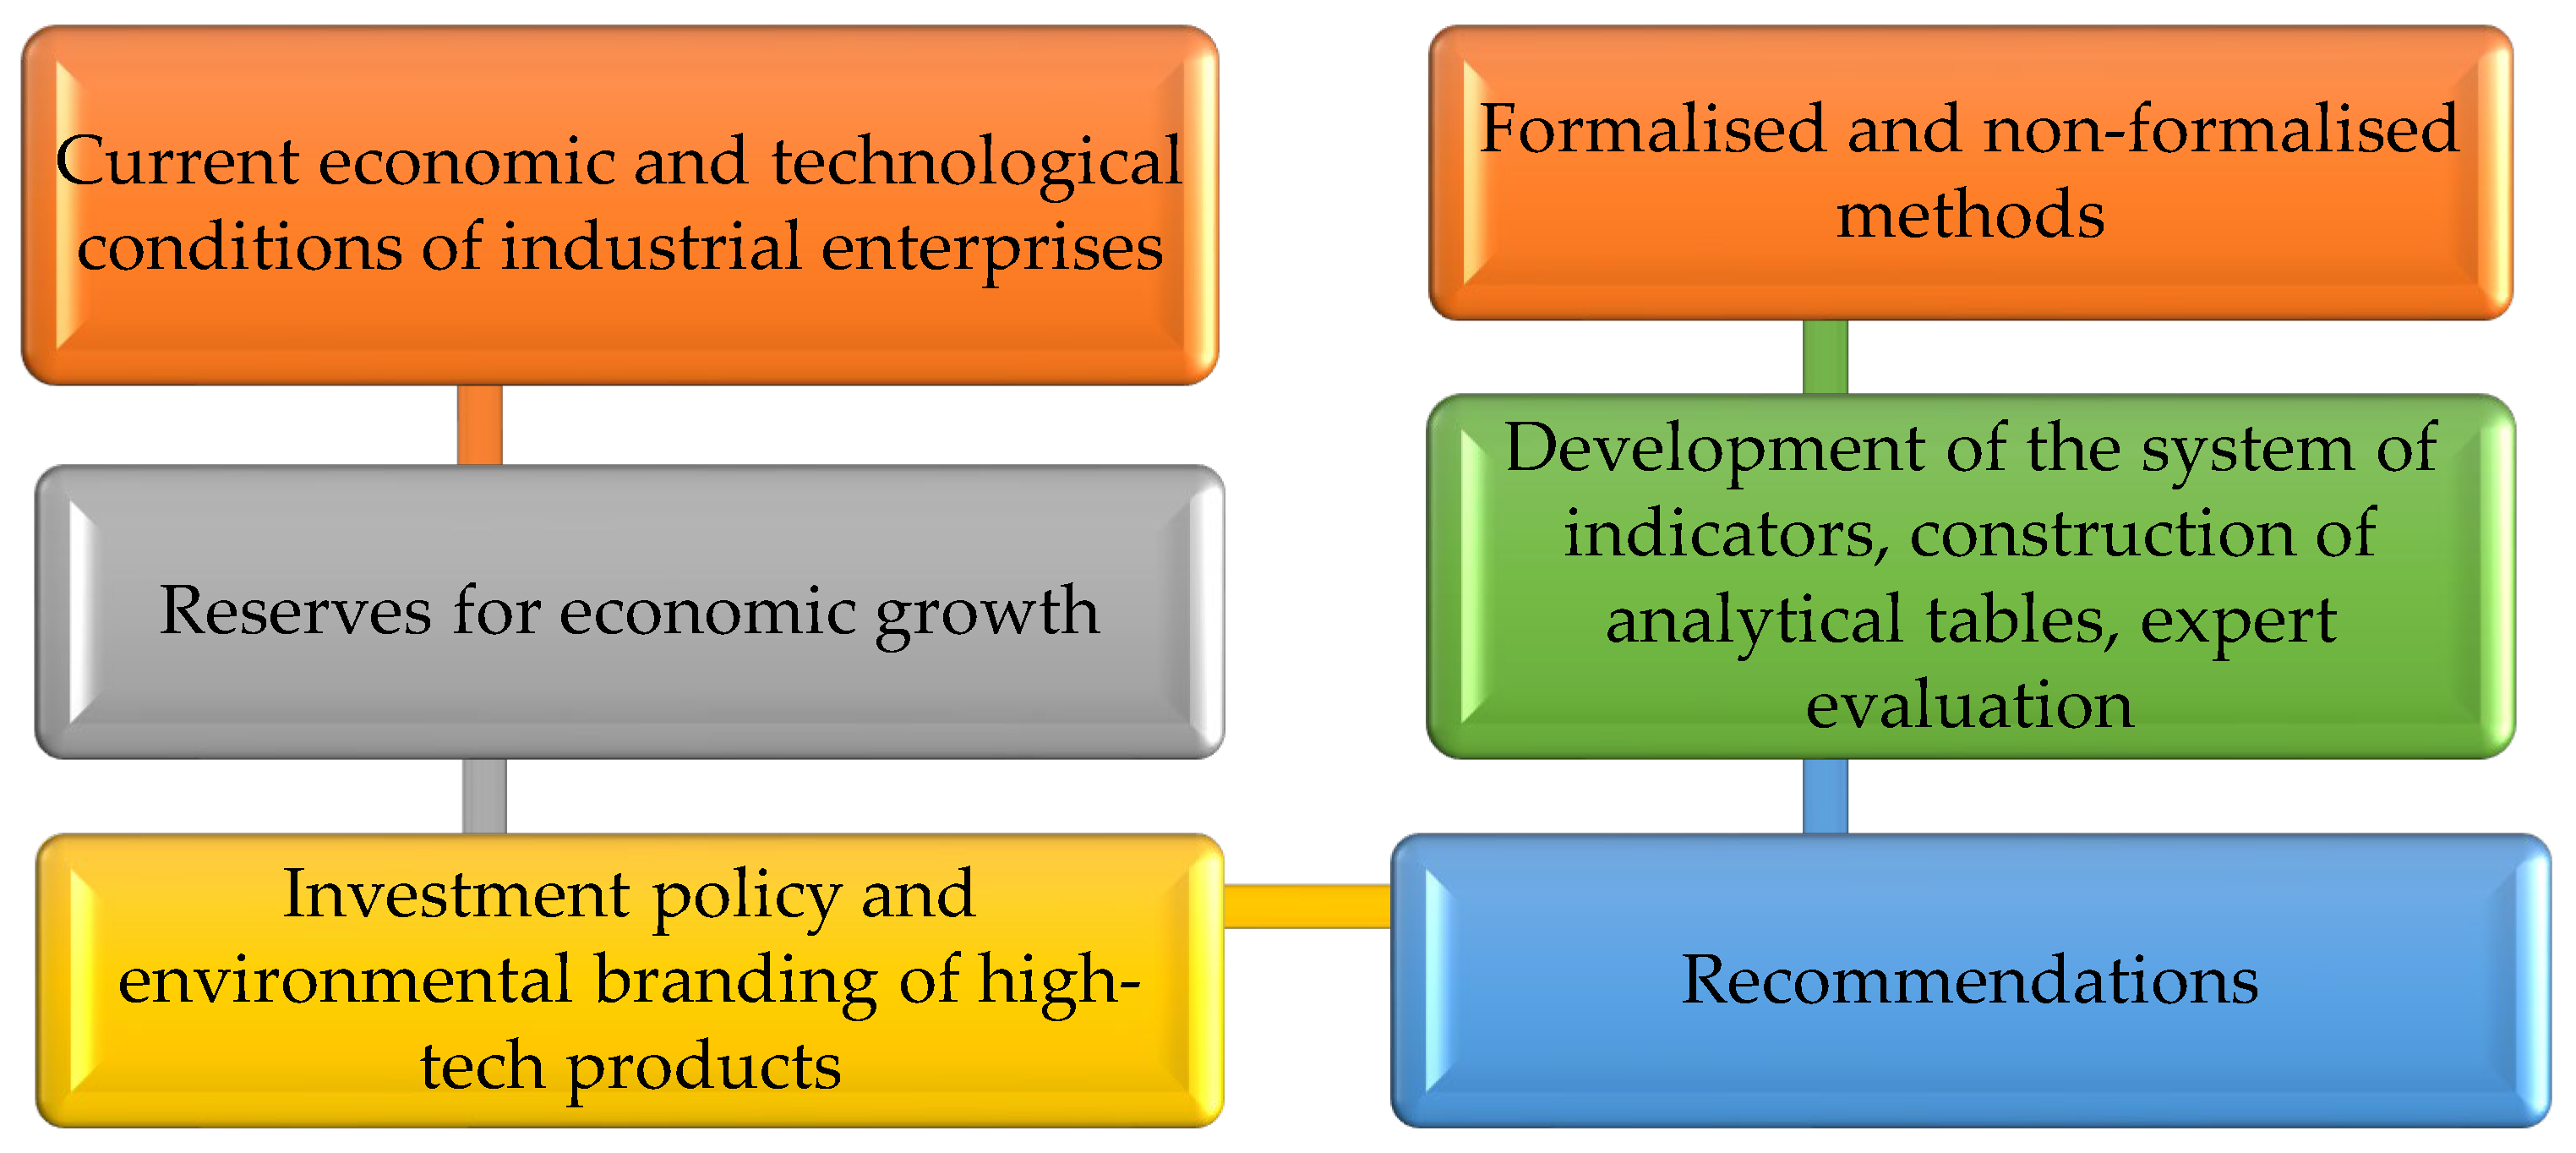
Figure 2.
Factors of the relationship between sustainable economic growth and environmental branding of industrial companies. Source: compiled by the authors.
Figure 2.
Factors of the relationship between sustainable economic growth and environmental branding of industrial companies. Source: compiled by the authors.
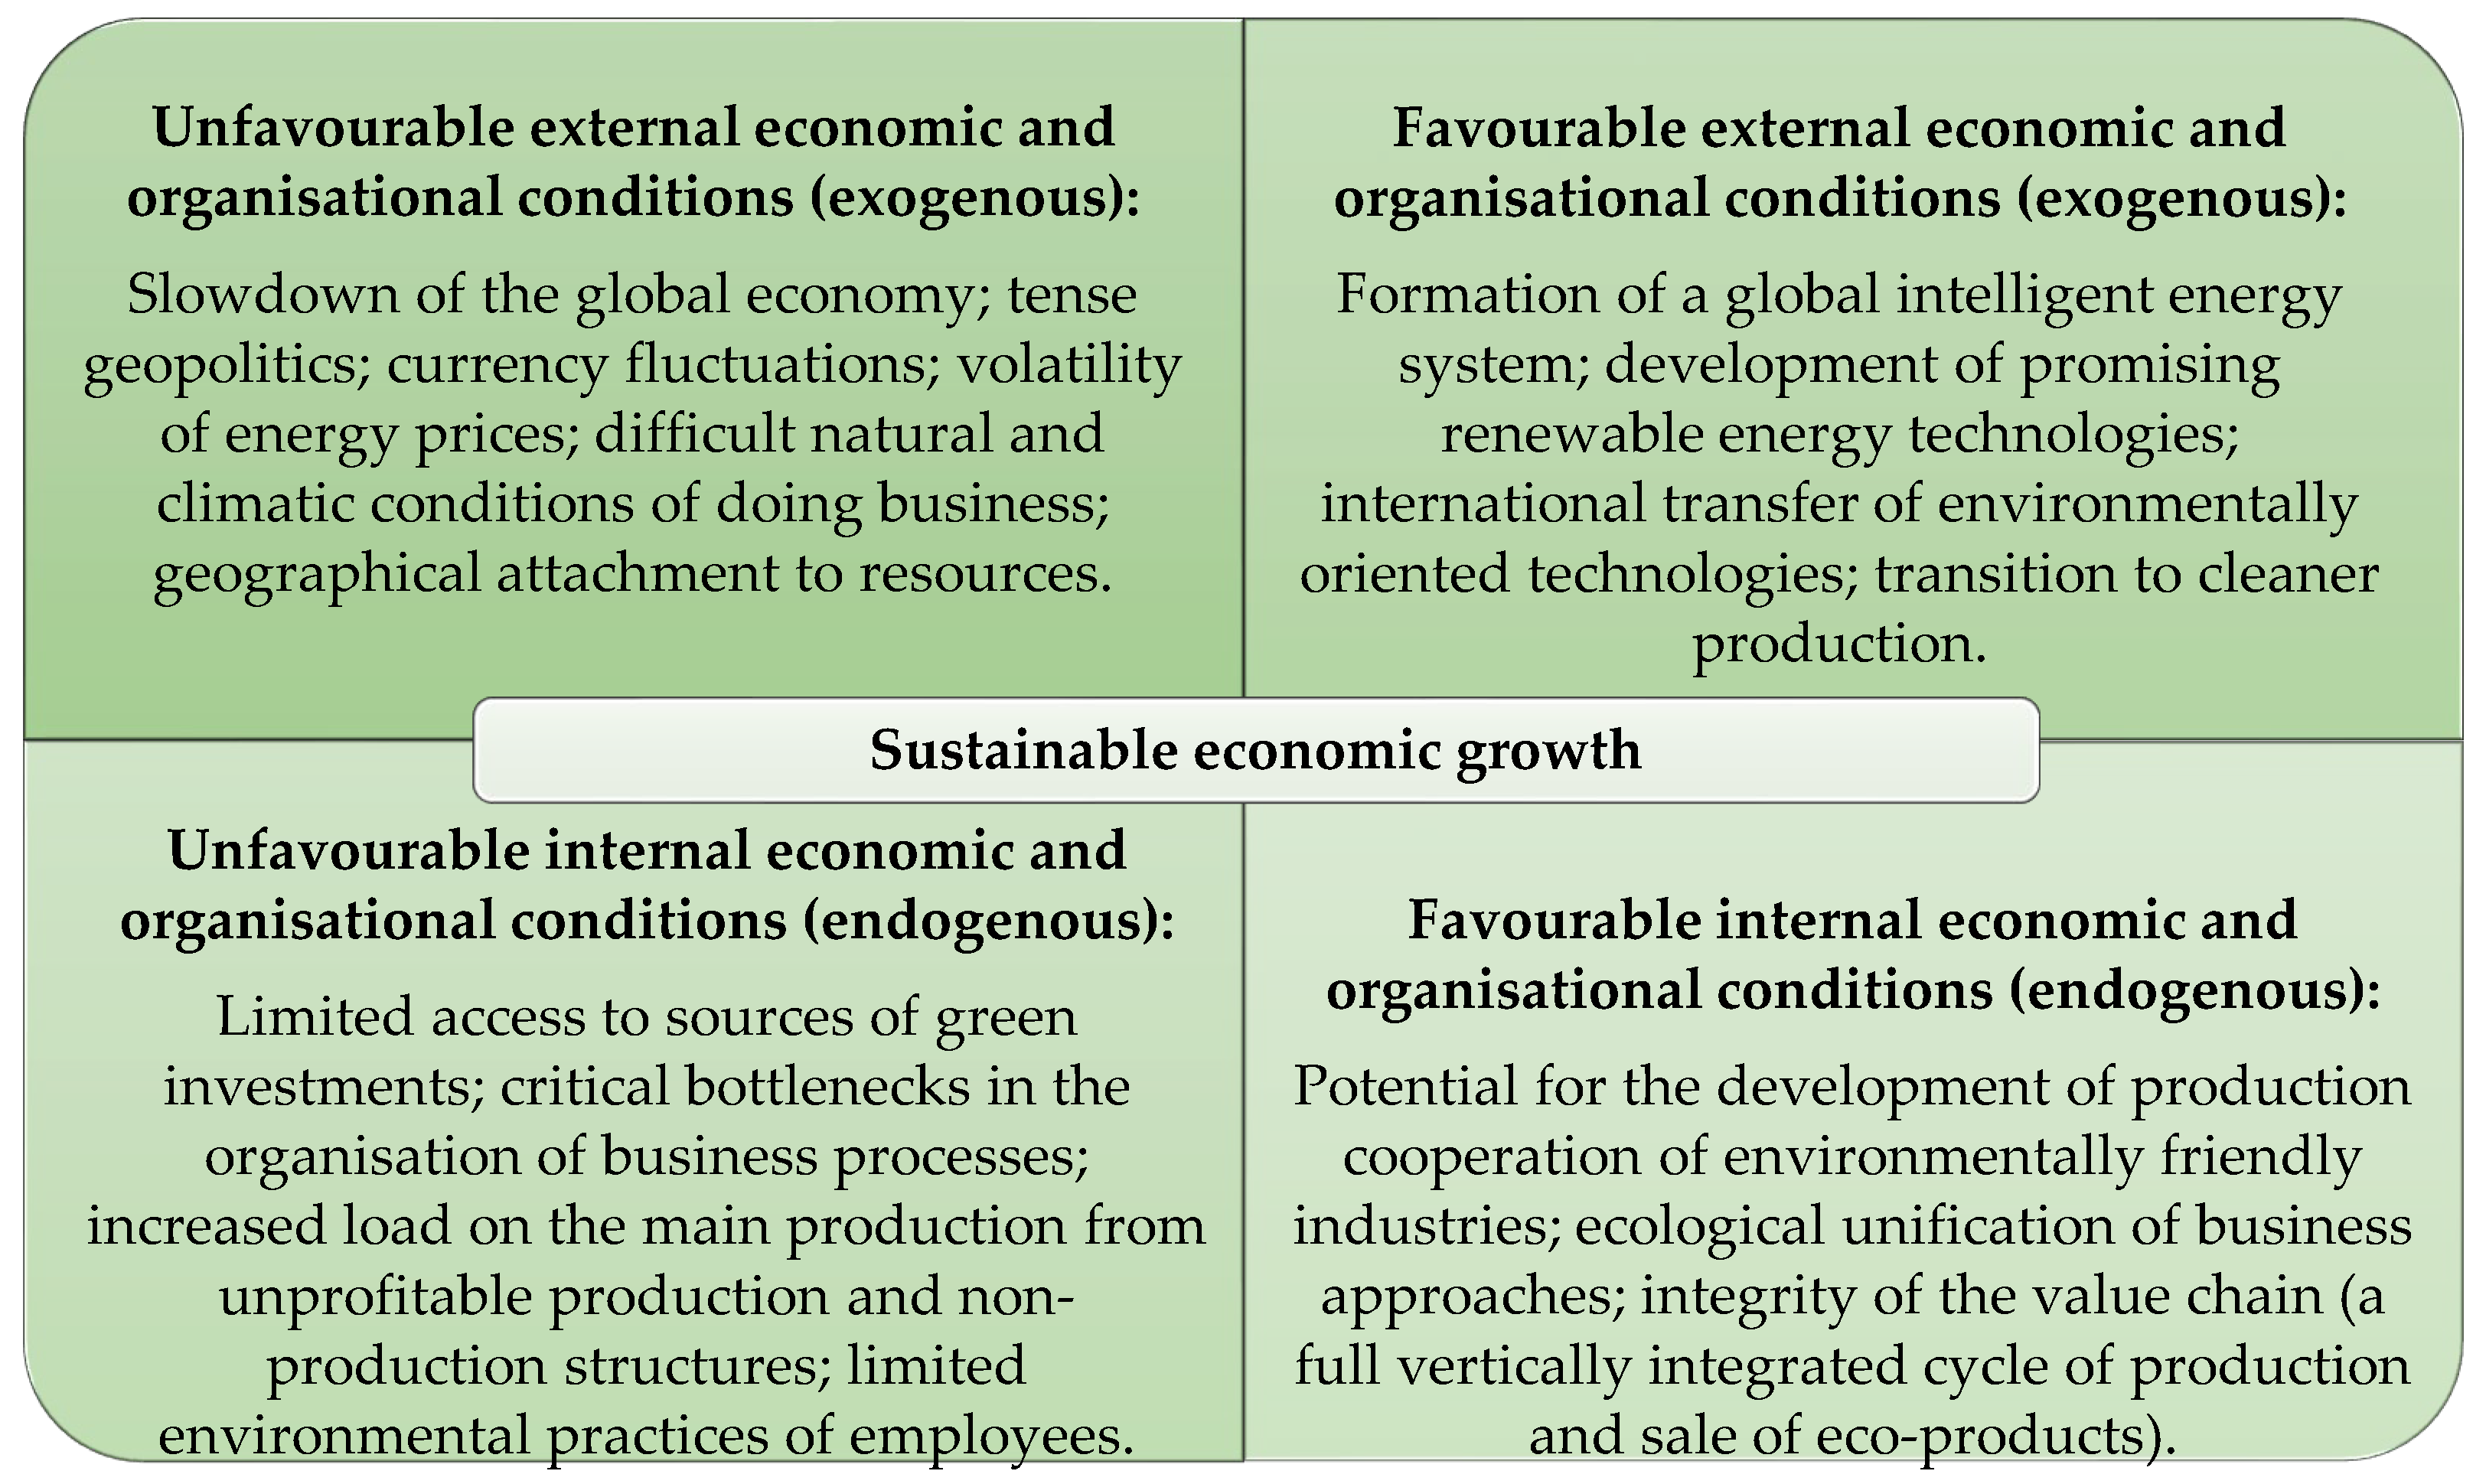
Figure 3.
Dynamics of changes in industrial production volumes. Source: compiled by the authors [62].
Figure 3.
Dynamics of changes in industrial production volumes. Source: compiled by the authors [62].
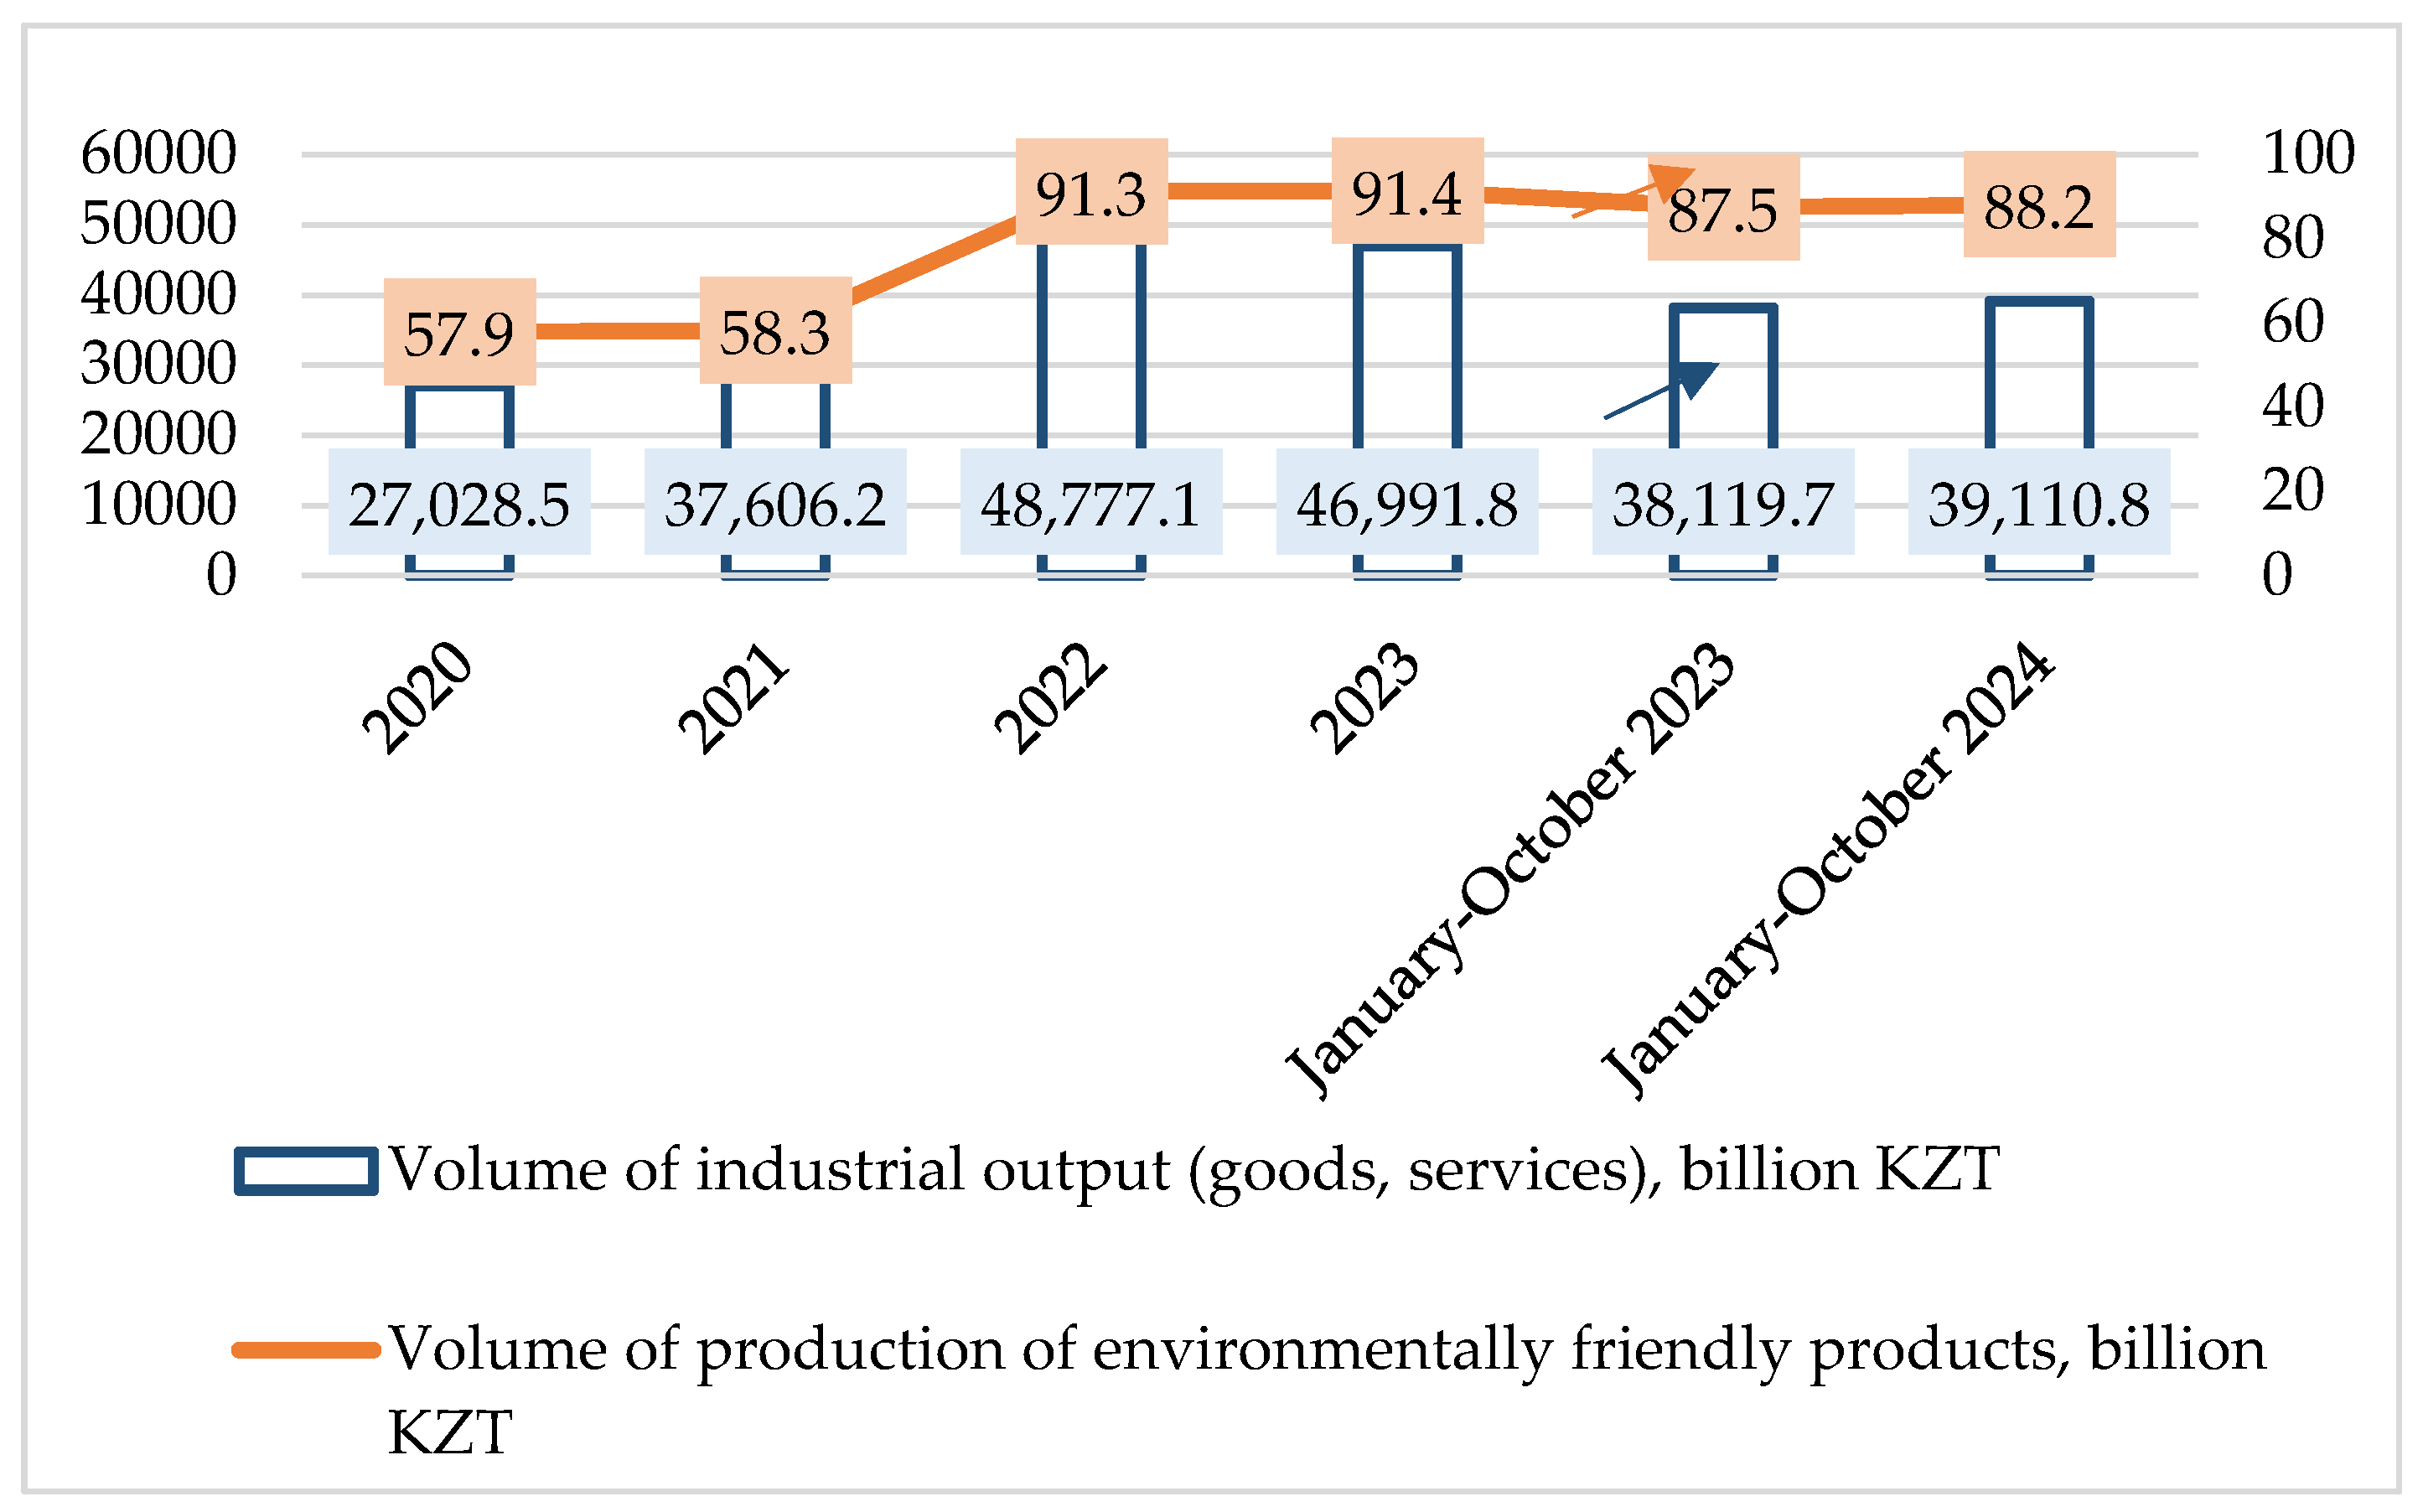
Figure 4.
Areas of green investment in Kazakhstan, USD million. Source: compiled by the authors [63].
Figure 4.
Areas of green investment in Kazakhstan, USD million. Source: compiled by the authors [63].
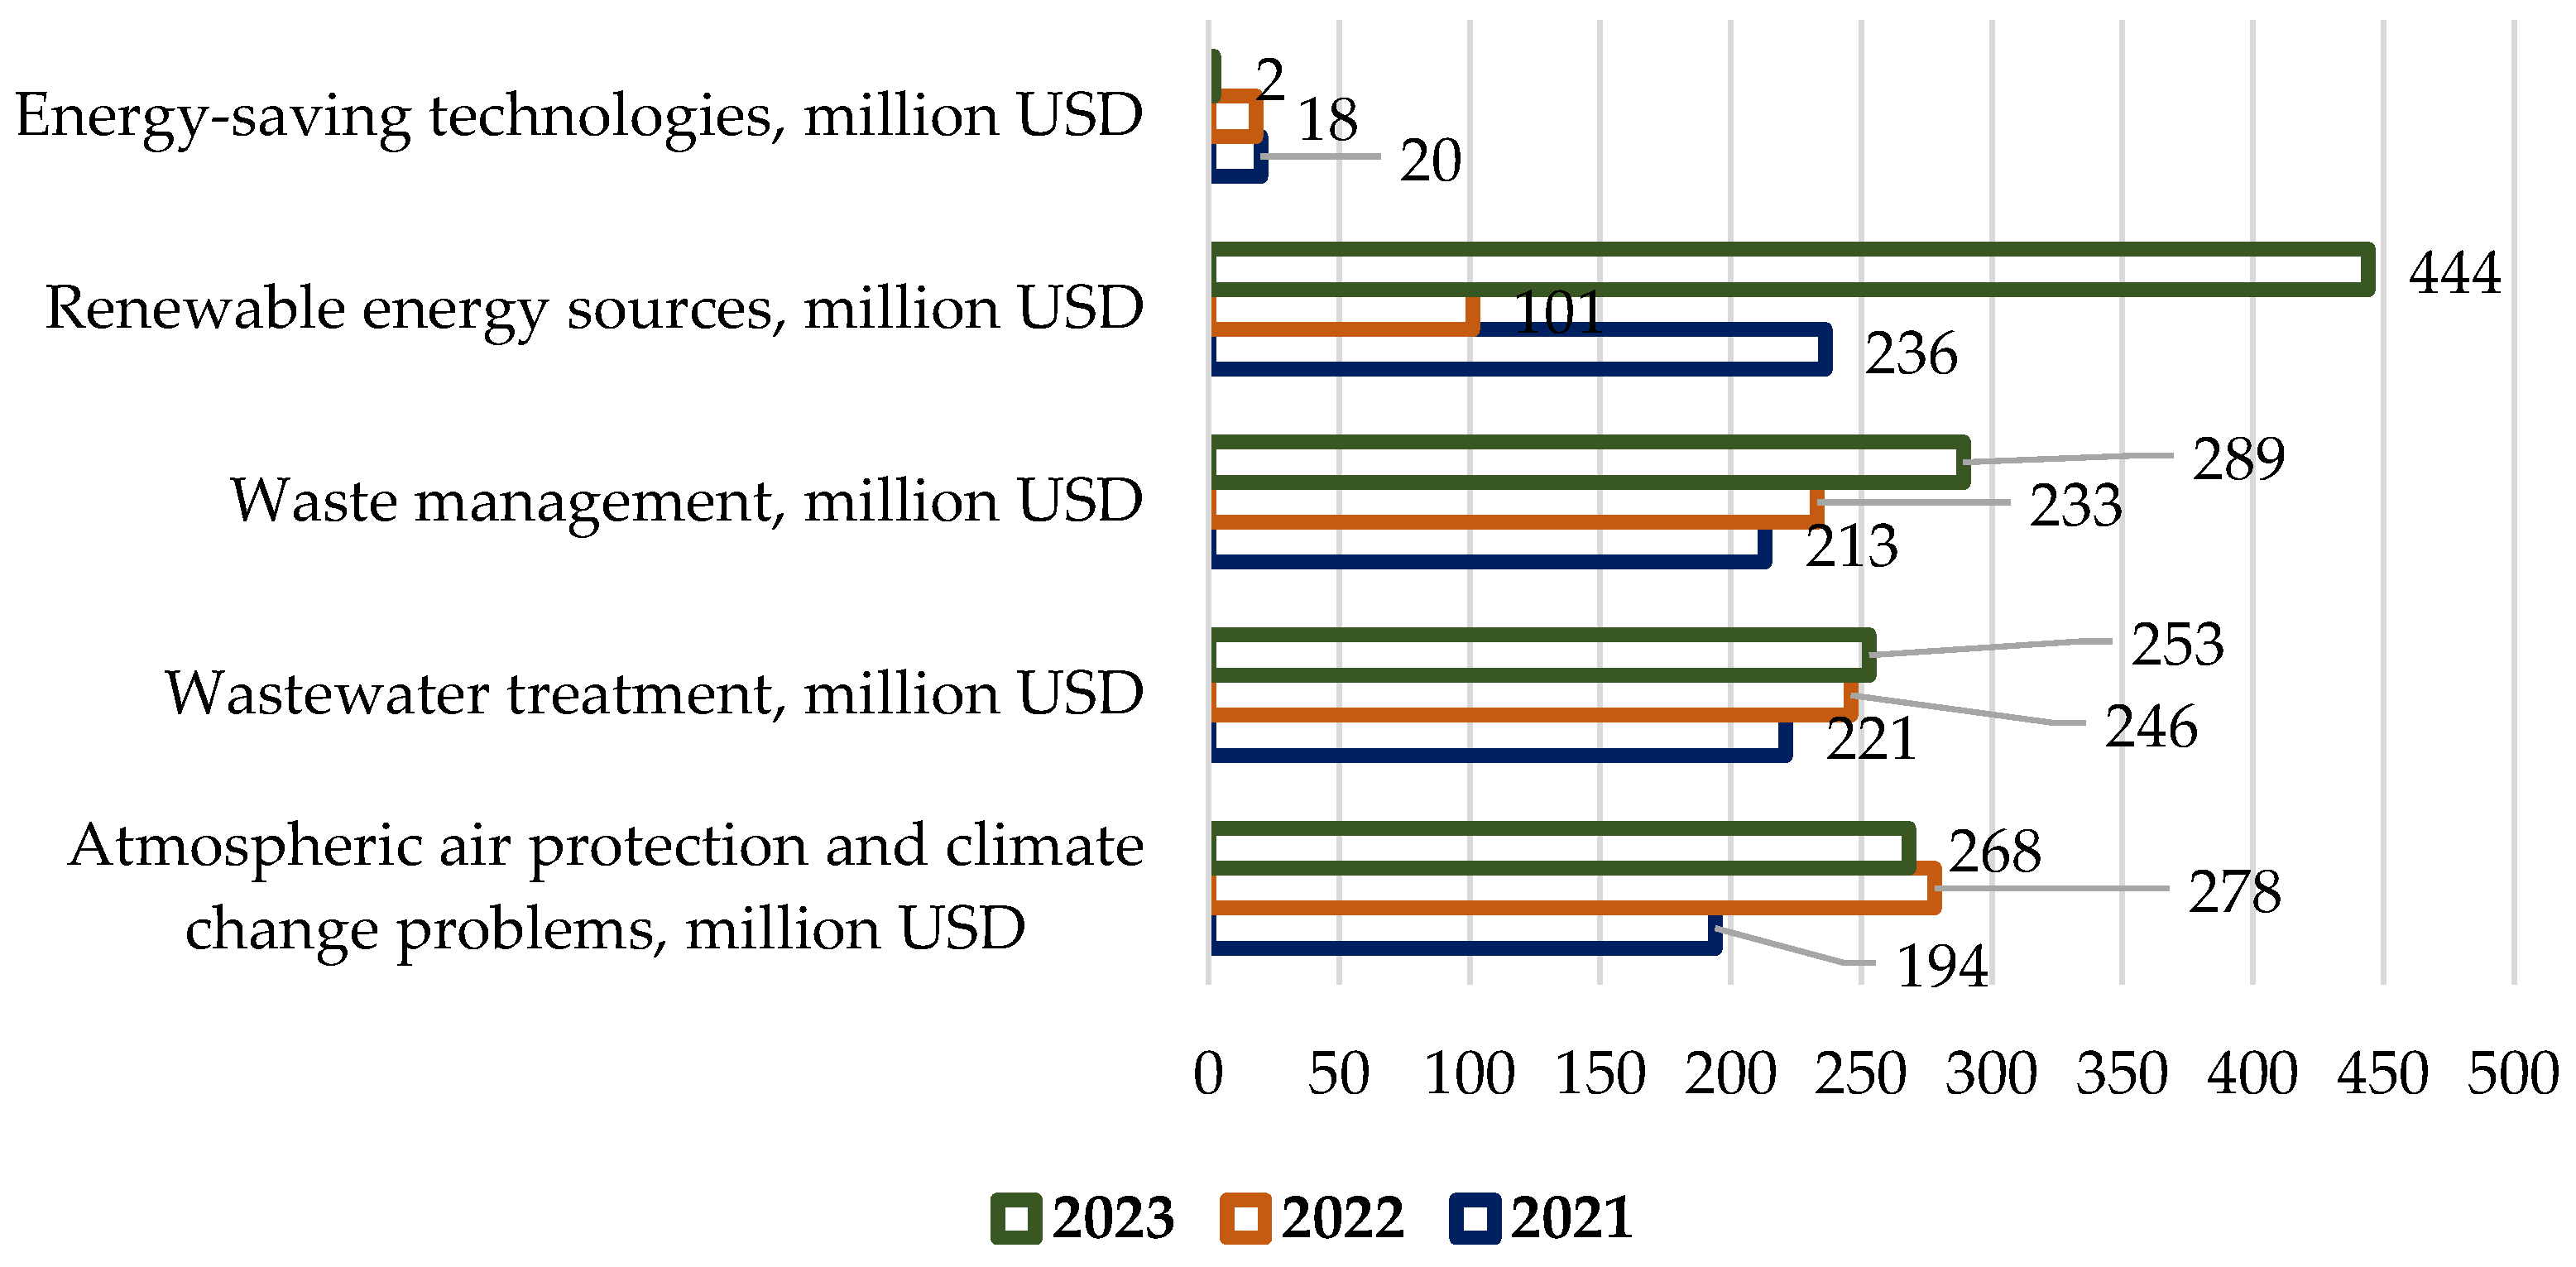
Figure 5.
Dynamics of financial and economic indicators of the enterprise: (a) sales, EBITDA, and CAPEX dynamics of the Eurasian Resources Group (ERG); (b) sales, EBITDA, and CAPEX of Aluminium of Kazakhstan JSC. Source: compiled by the authors [66].
Figure 5.
Dynamics of financial and economic indicators of the enterprise: (a) sales, EBITDA, and CAPEX dynamics of the Eurasian Resources Group (ERG); (b) sales, EBITDA, and CAPEX of Aluminium of Kazakhstan JSC. Source: compiled by the authors [66].
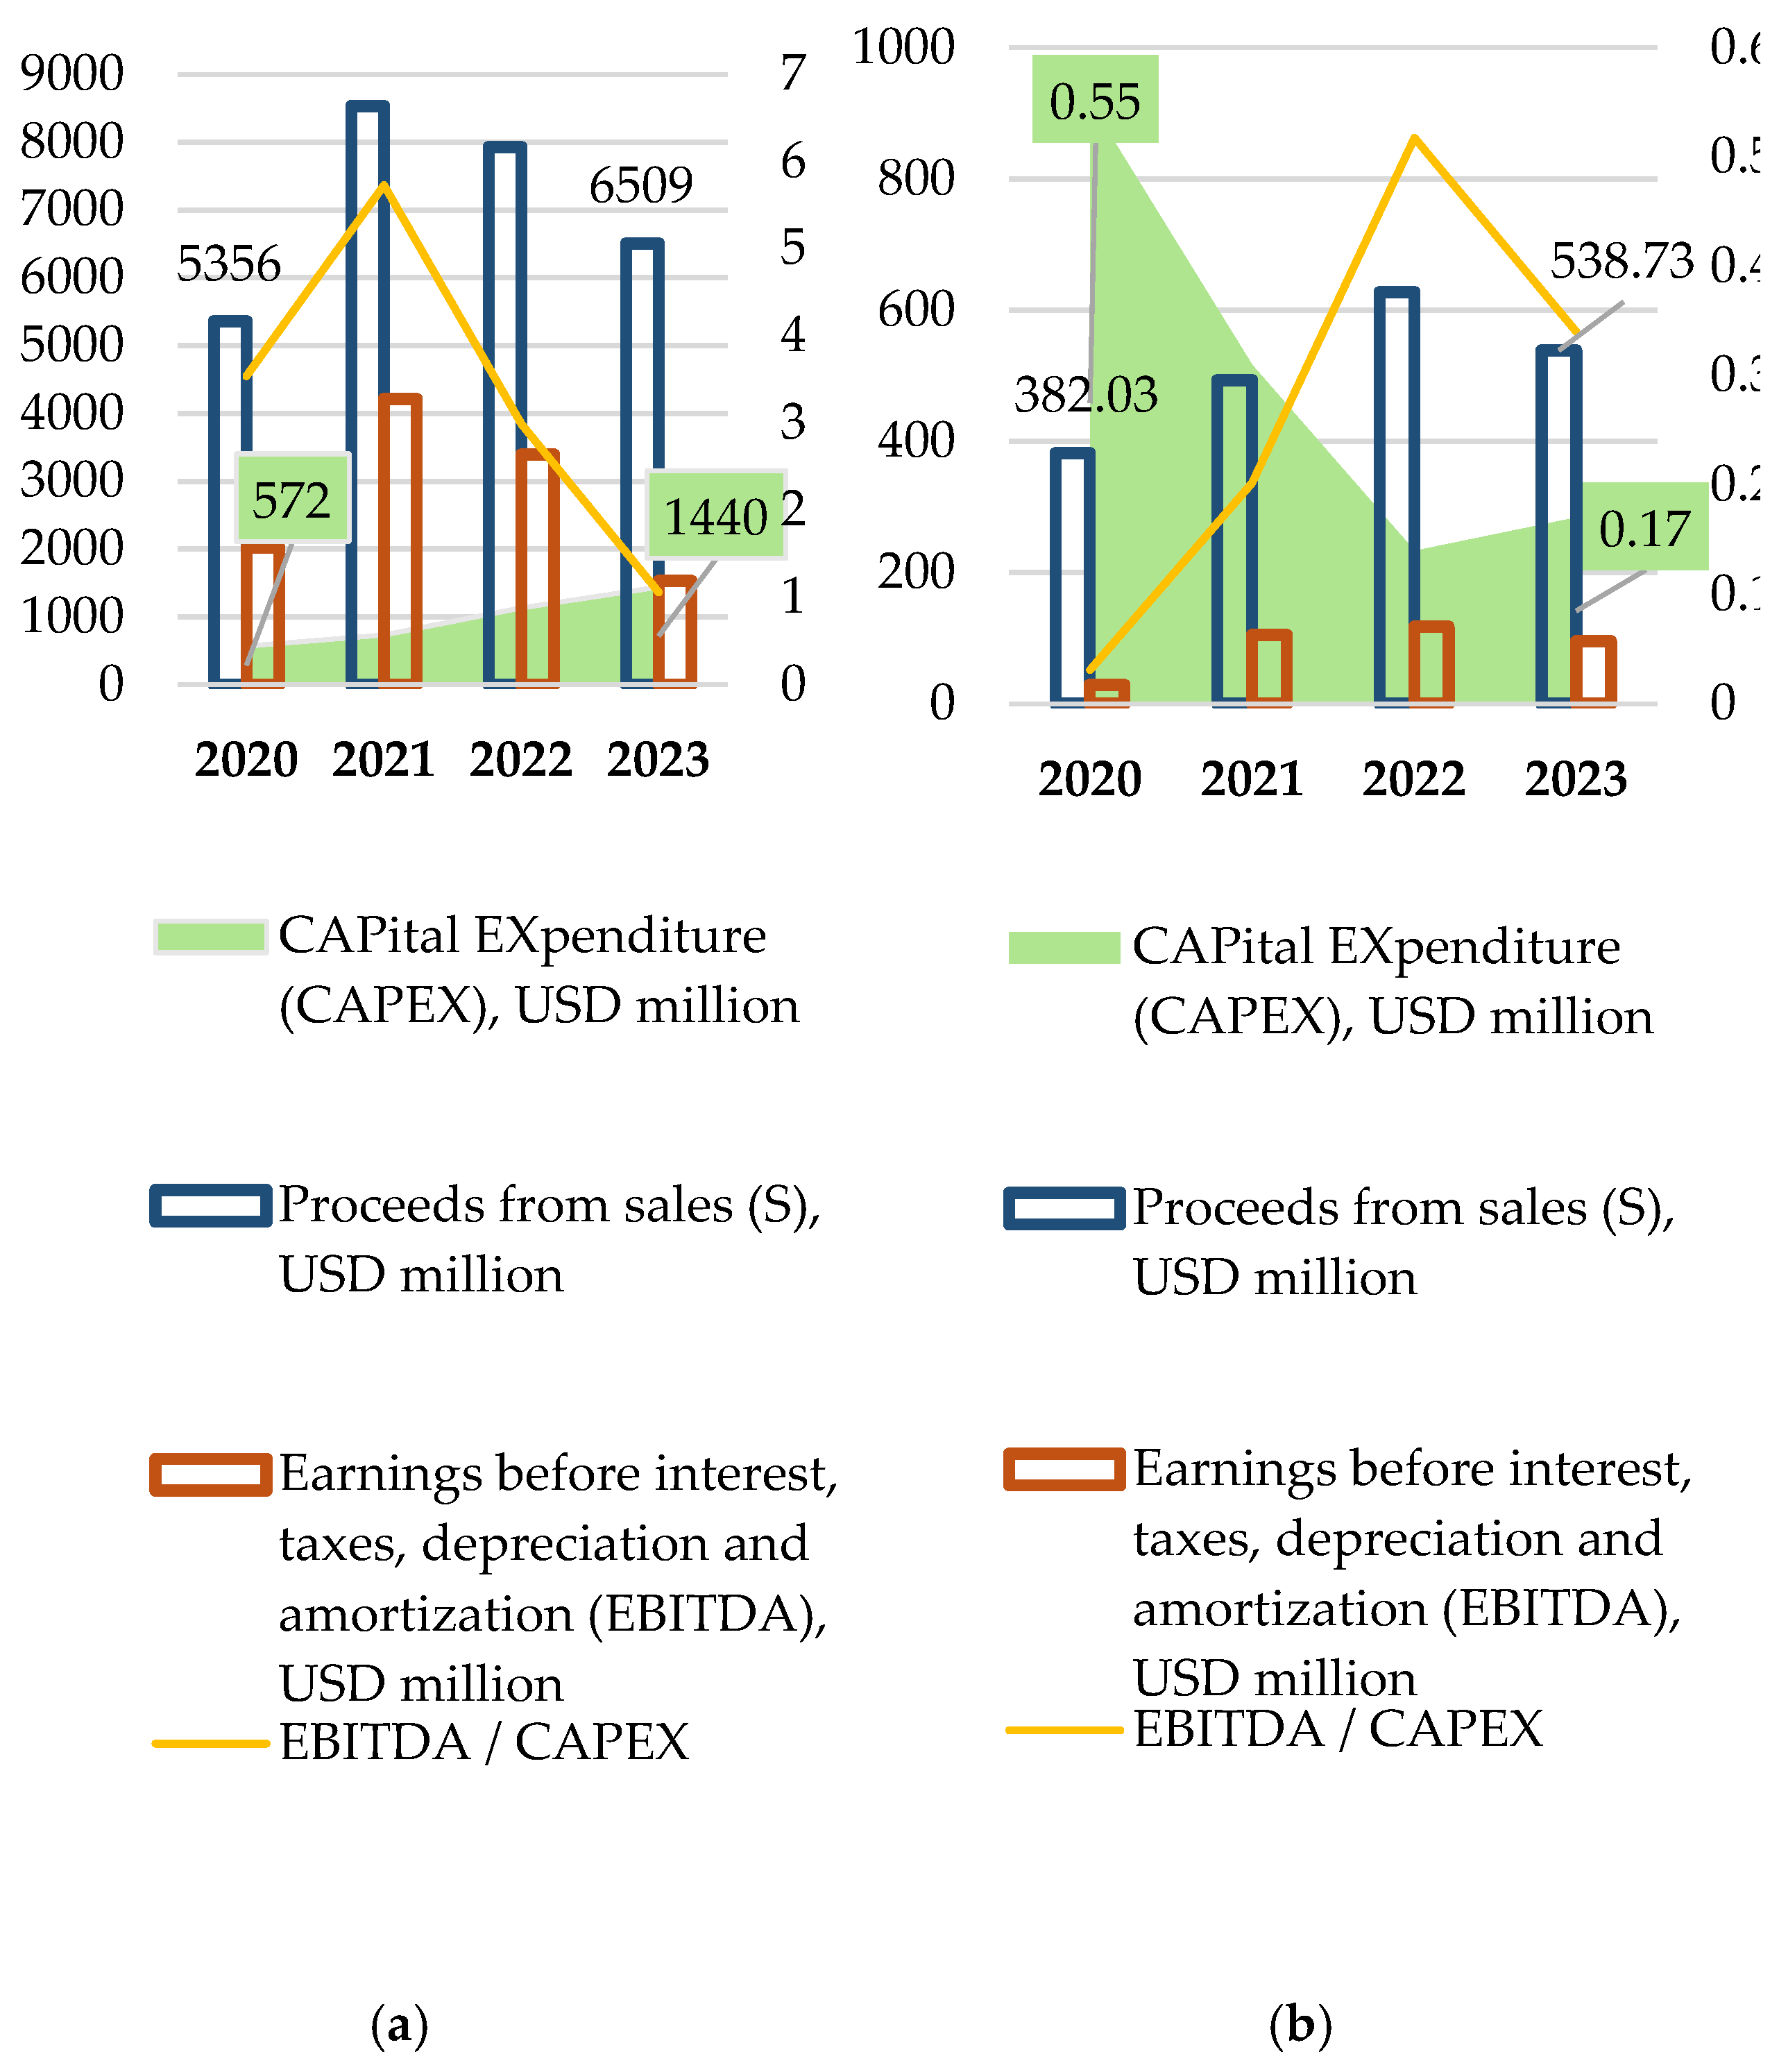
Figure 6.
Age structure of respondents. Distribution of responses of the population — stakeholders of industrial enterprises of the Pavlodar region, Republic of Kazakhstan, in % of the number of respondents. Source: compiled by the authors.
Figure 6.
Age structure of respondents. Distribution of responses of the population — stakeholders of industrial enterprises of the Pavlodar region, Republic of Kazakhstan, in % of the number of respondents. Source: compiled by the authors.
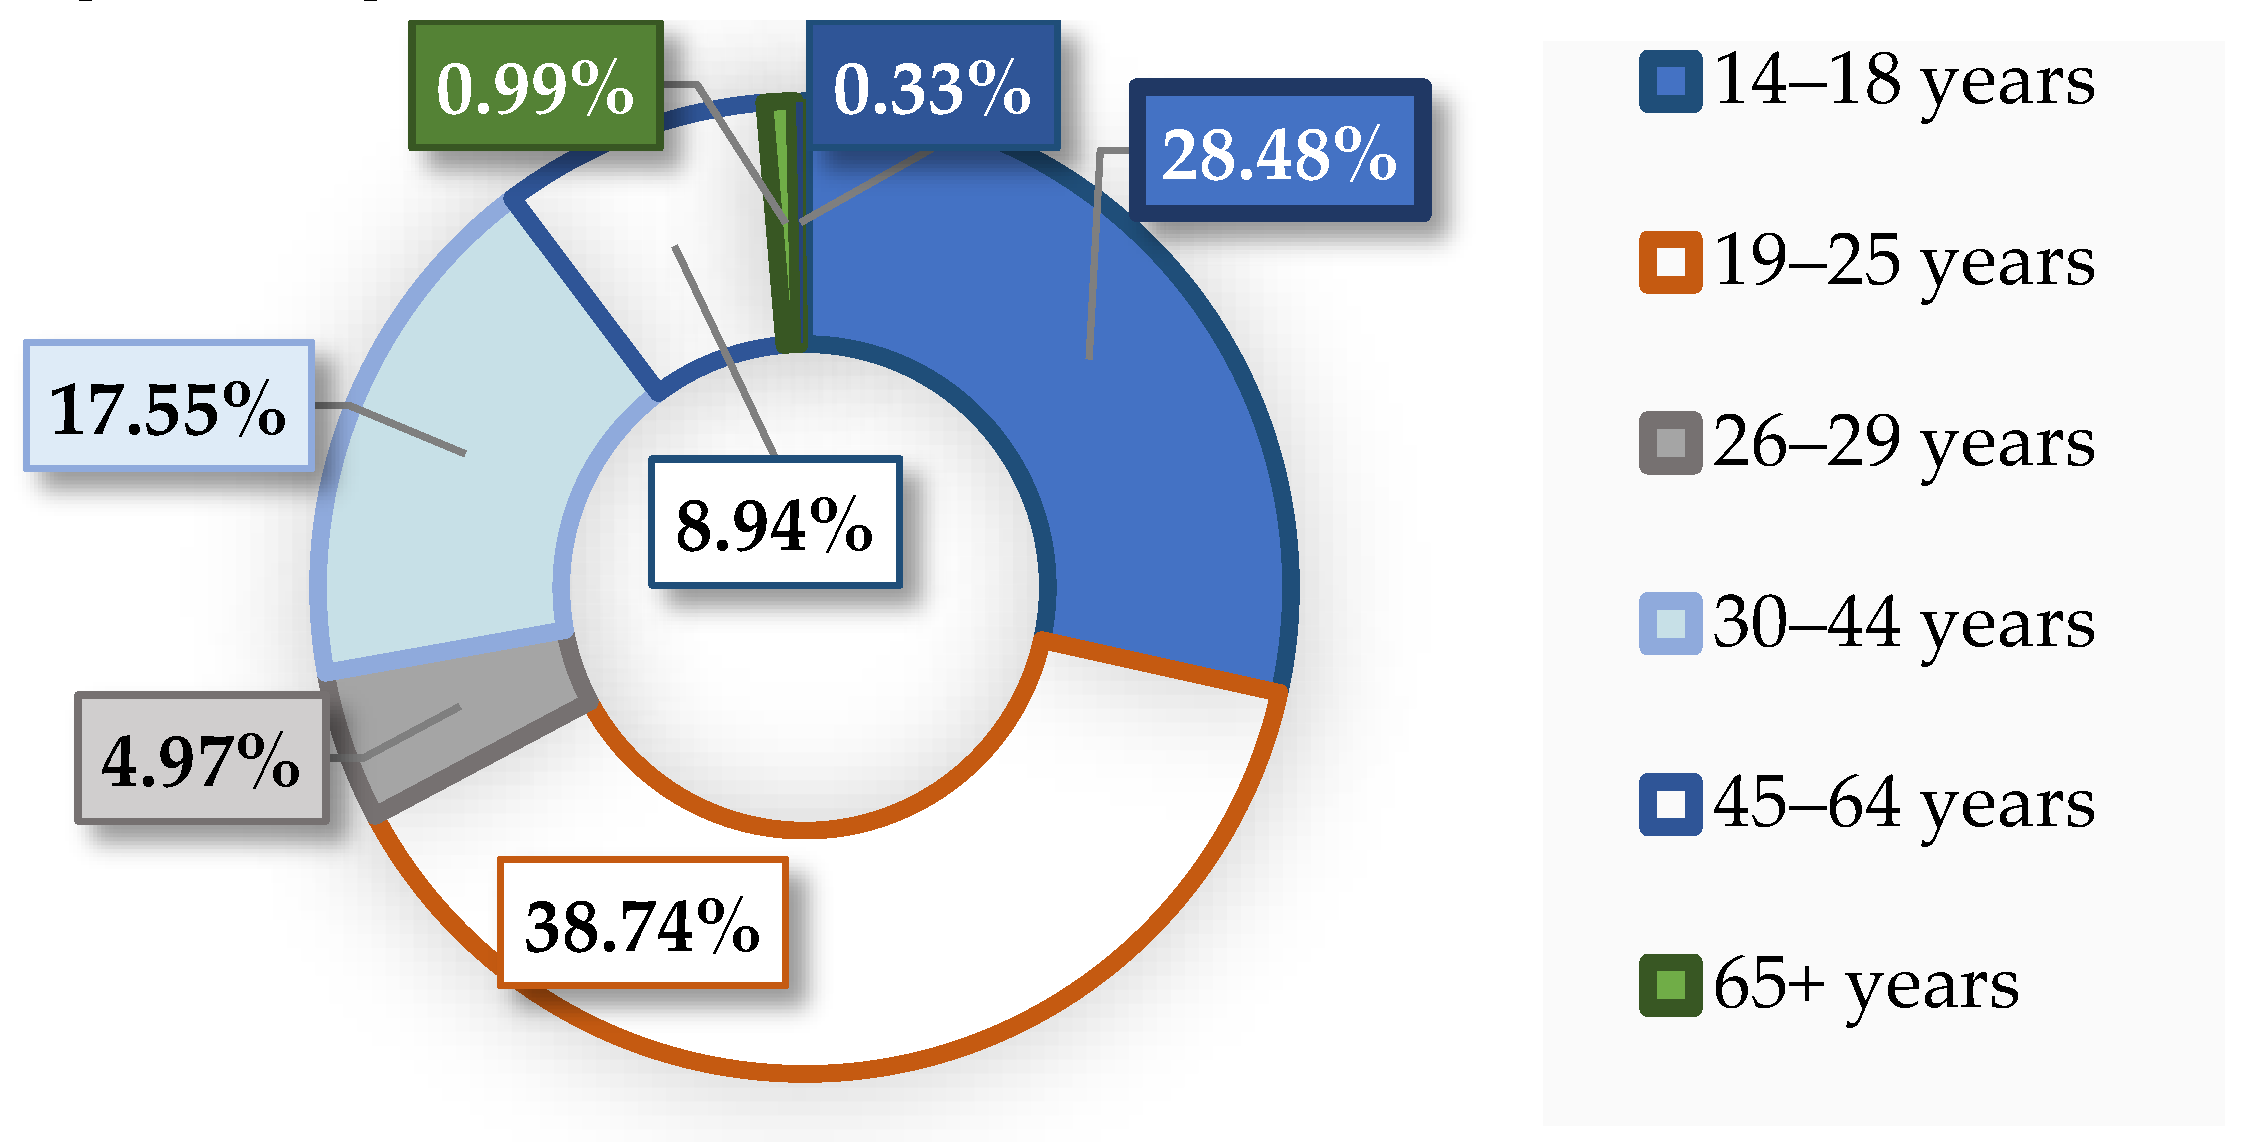
Figure 7.
Behavioural attributes of the “New generation eco-consumer” (multiple choice). Distribution of responses of the population — stakeholders of industrial enterprises of the Pavlodar region, Republic of Kazakhstan, in % of the number of respondents. Source: compiled by the authors.
Figure 7.
Behavioural attributes of the “New generation eco-consumer” (multiple choice). Distribution of responses of the population — stakeholders of industrial enterprises of the Pavlodar region, Republic of Kazakhstan, in % of the number of respondents. Source: compiled by the authors.
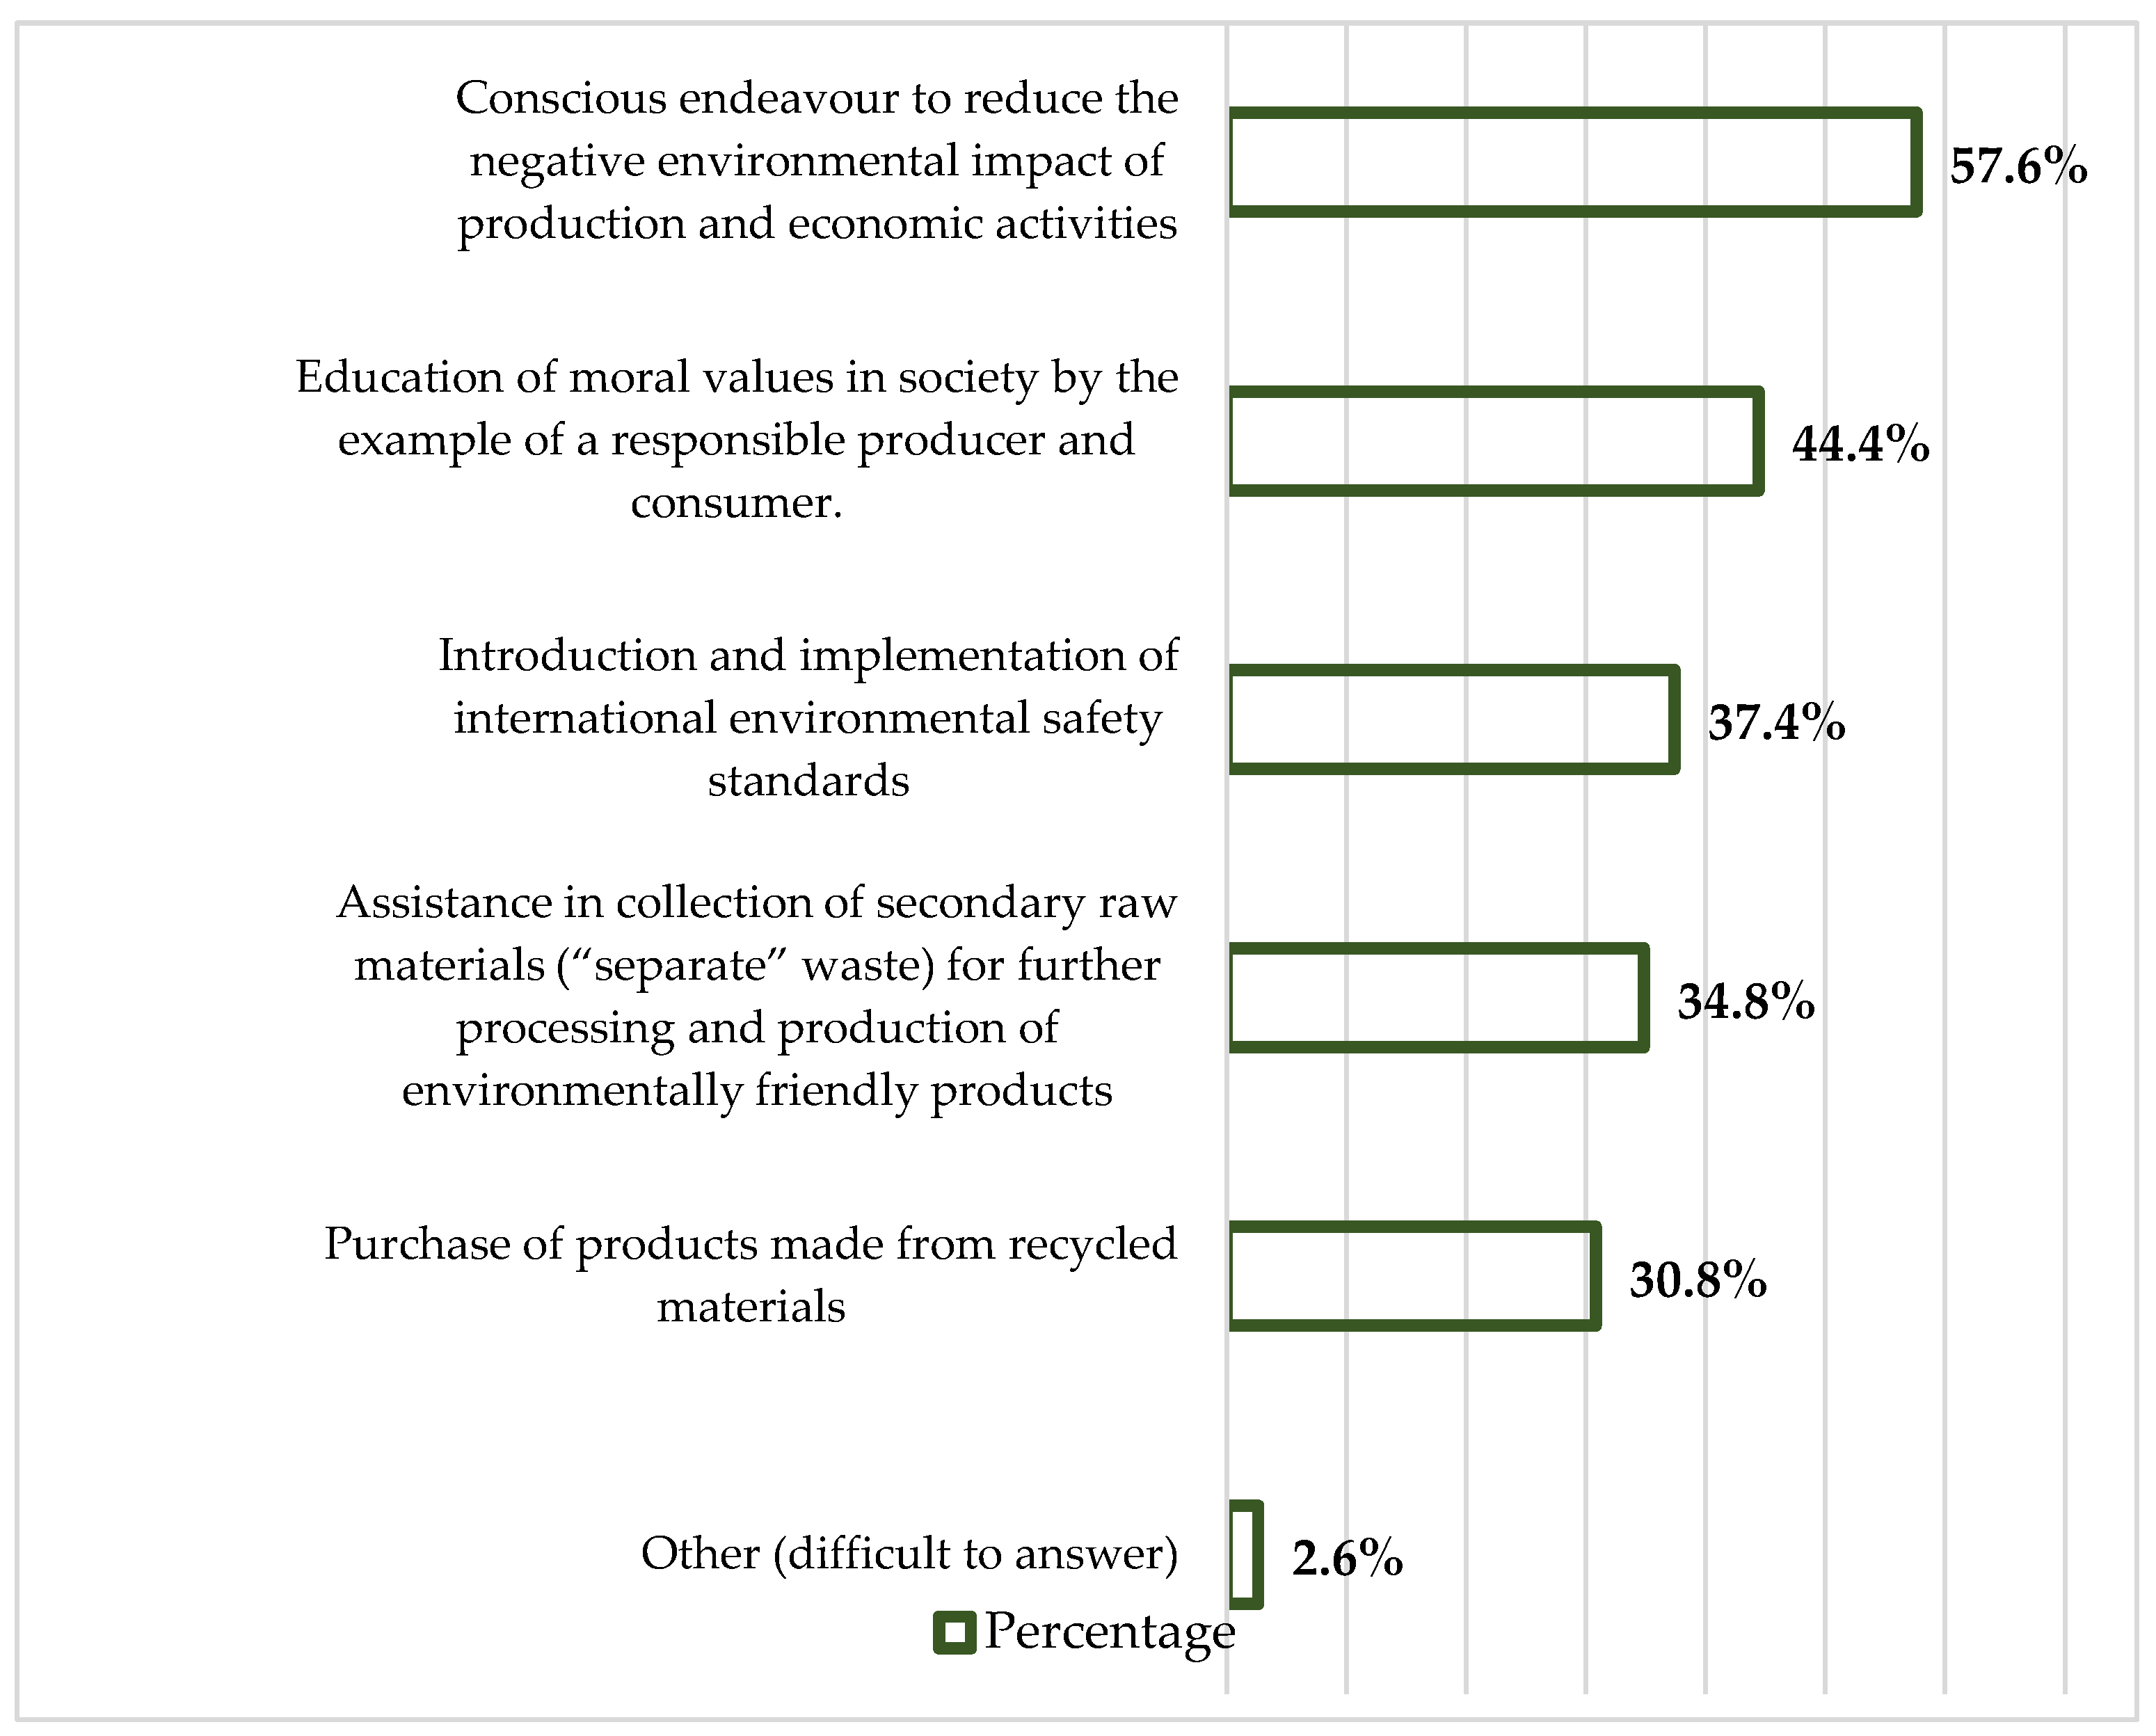
Figure 8.
What would persuade to spend more money on environmentally friendly goods (services) if you do not yet do so? (multiple choice). Distribution of responses of the population — stakeholders of industrial enterprises of the Pavlodar region, Republic of Kazakhstan, in % of the number of respondents. Source: compiled by the authors.
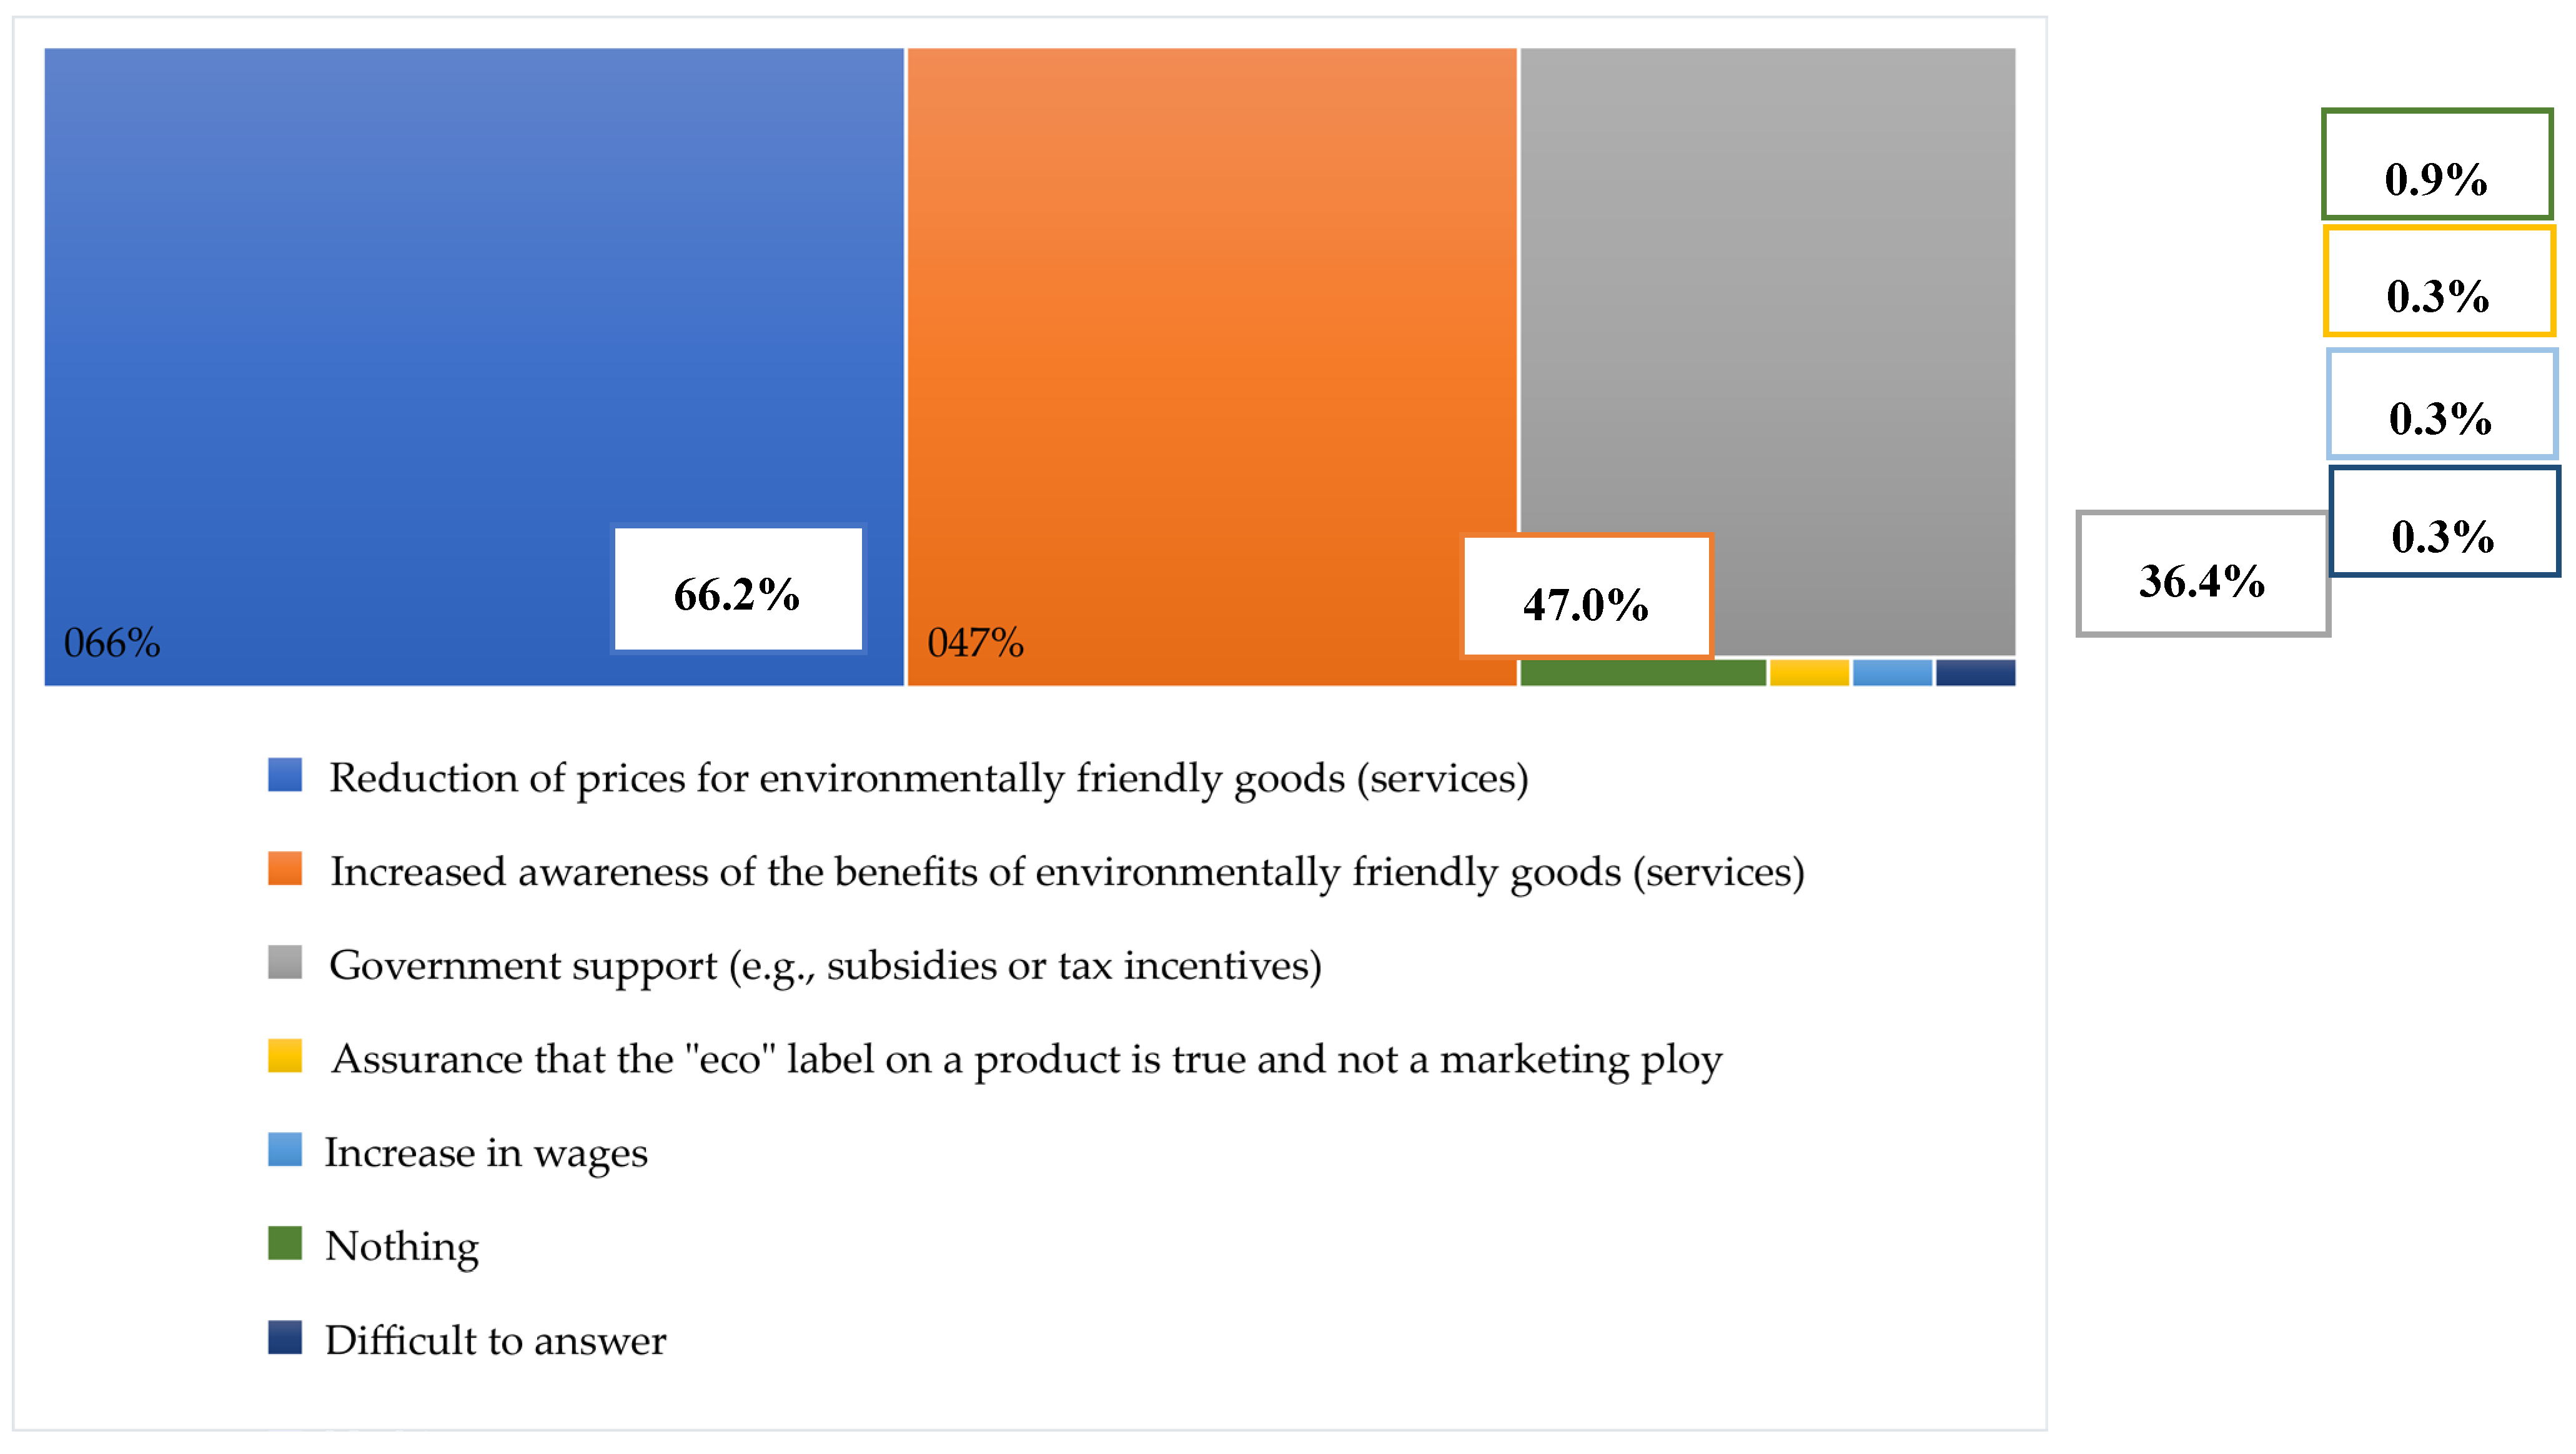
Figure 9.
Funnel of attributes for the development of eco-branding in the region. Comparison of responses of backbone companies of the region and their key partners with the responses of the population - stakeholders of industrial enterprises of Pavlodar region, Republic of Kazakhstan, in % of the number of respondents. Source: compiled by the authors [54,64].
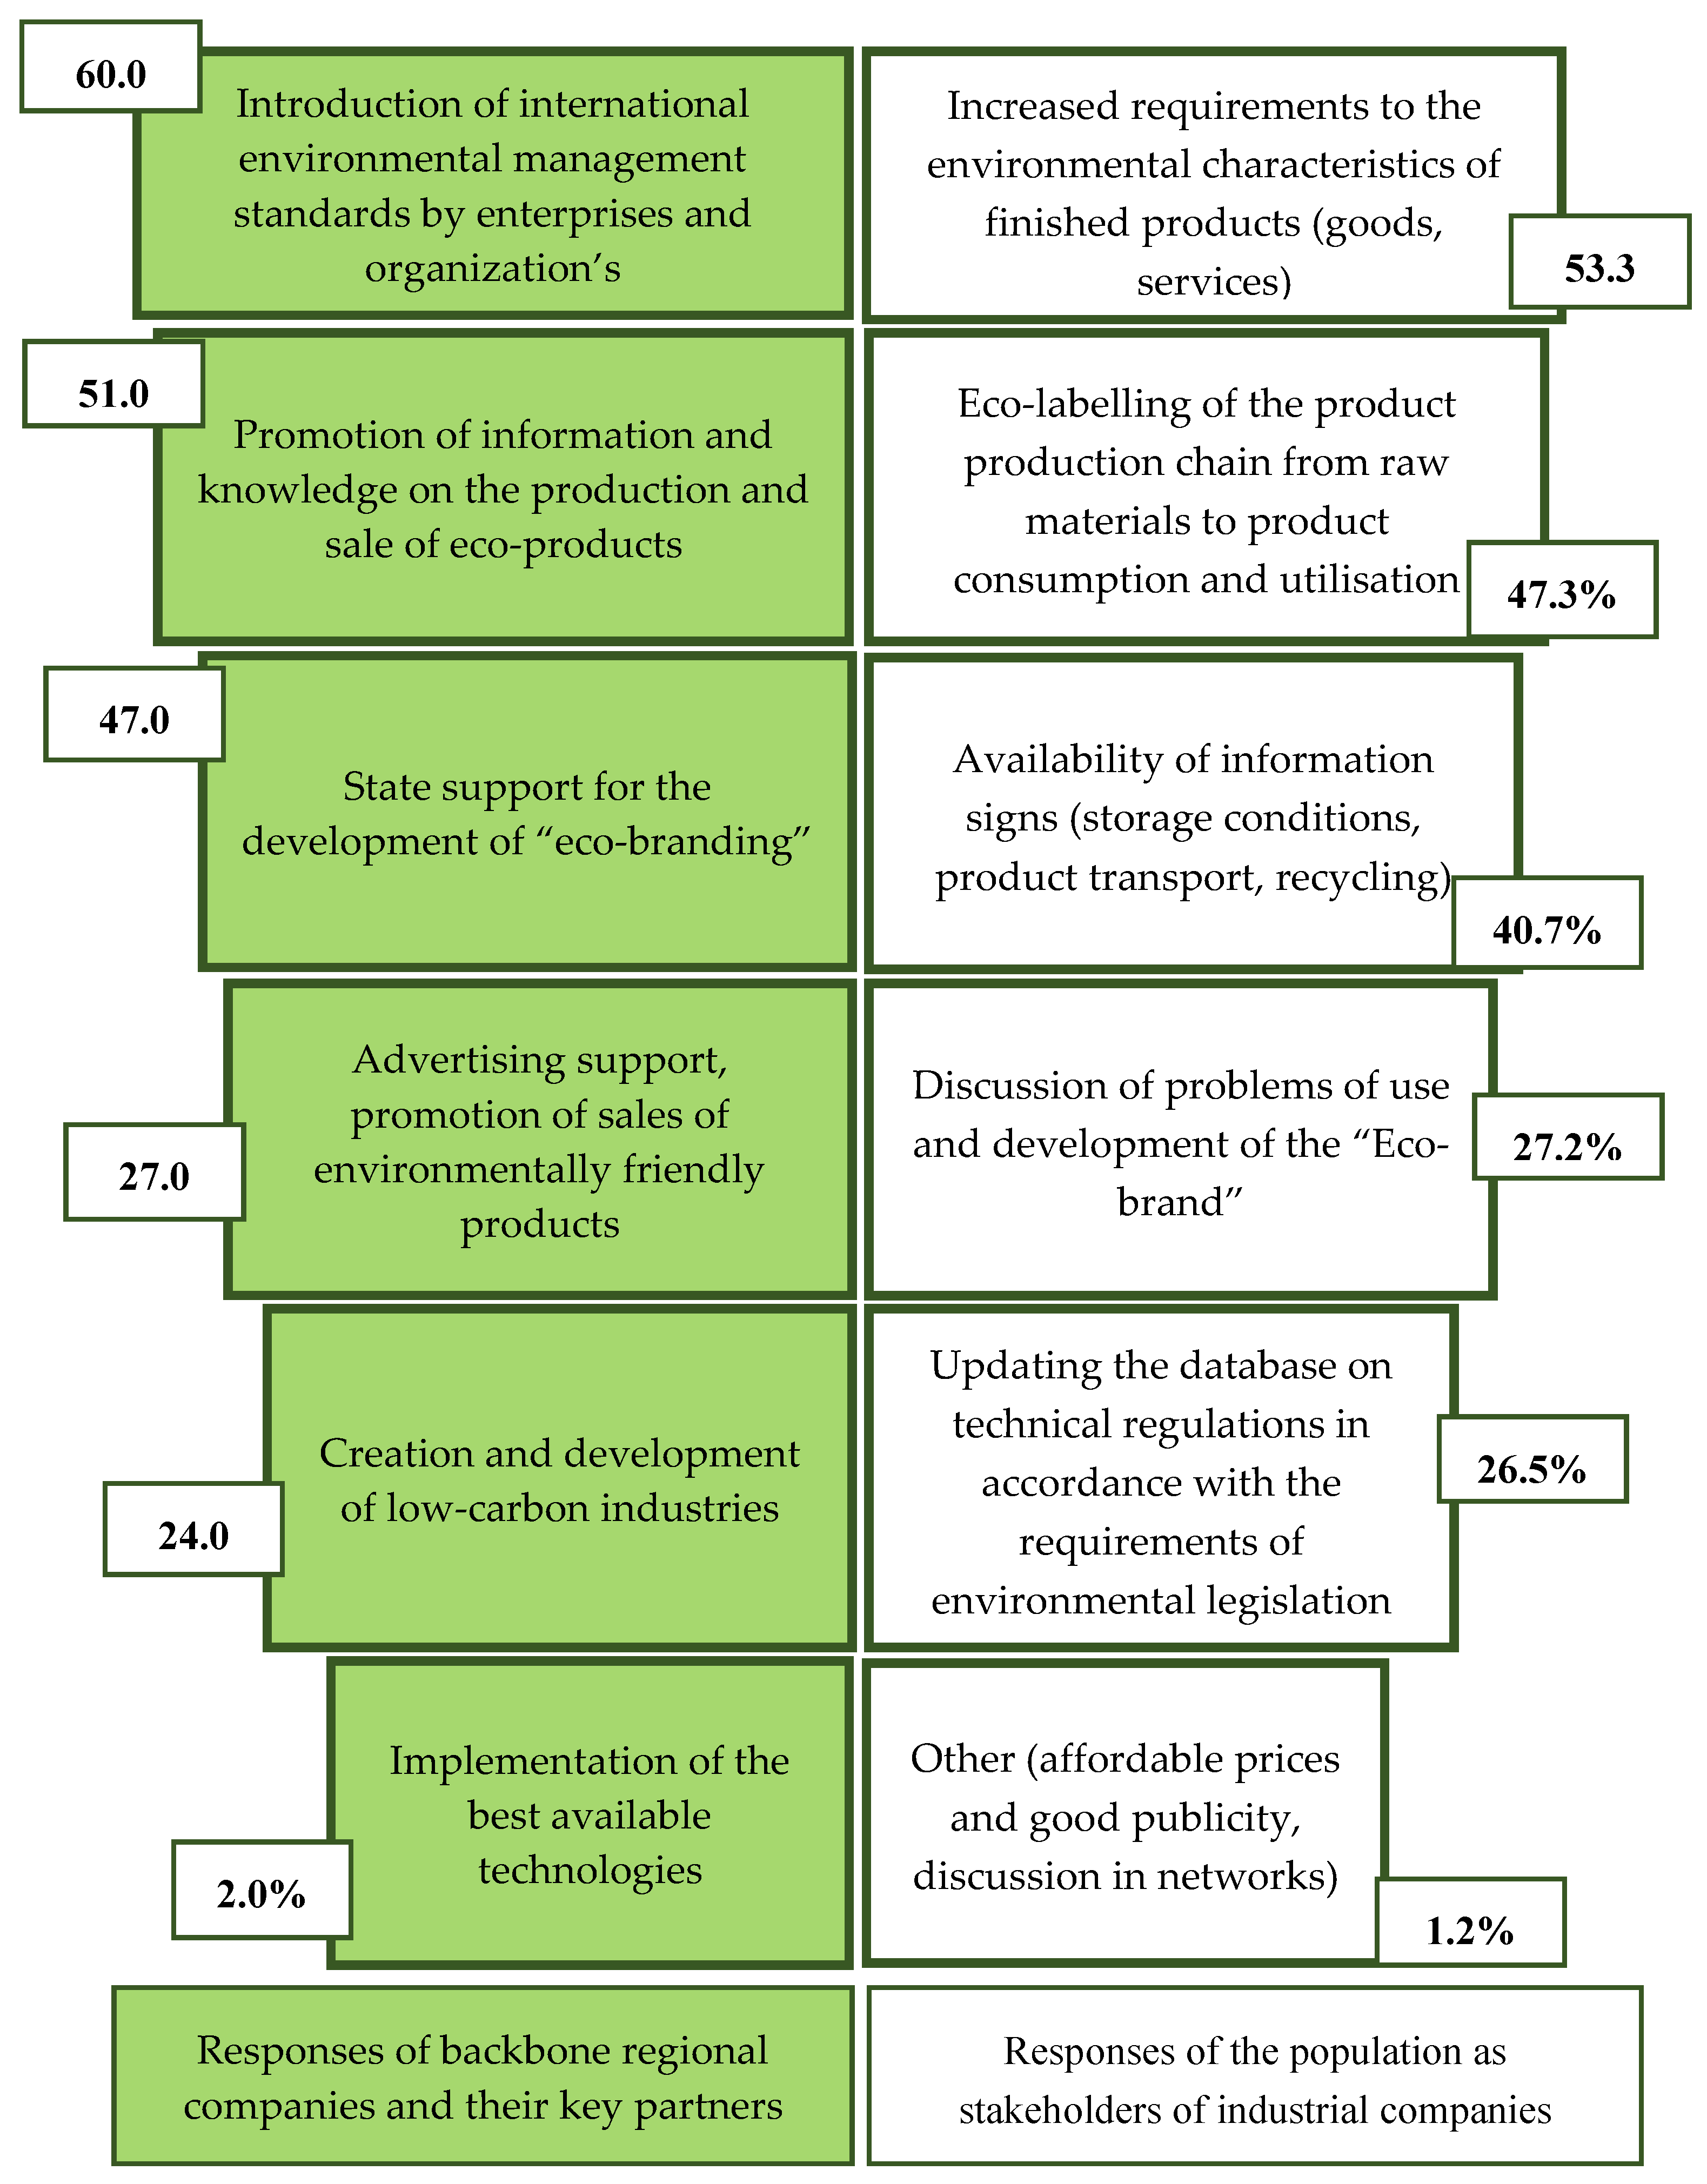
Table 1.
Approaches to the implementation of Eco-branding mechanisms.
| Scientific and Methodological Approaches/Impact Measures | The object of Eco-branding | Subjects of Eco-branding | Literature | |
|---|---|---|---|---|
| Creation of innovation ecosystems of high-tech industry | Regional strategies for breakthrough environmental innovation | Regional sales representatives, digital platform developers | [37] | |
| Green energy infrastructure | [38] | |||
| Green Finance | ||||
| [39] | ||||
| Transformation of the trade system for recycled materials | Secondary raw material markets | Primary producers, Environmental and sustainable organizations, Recycling companies |
[40] | |
| Formation of green culture and values in the production environment of the enterprise and among the population | Green processes, green products, economic and social performance | Green HRM | [41,42,43] | |
| Digital competence ecosystem | [44] | |||
| Environmental innovation, green R&D | [45] | |||
| Practitioners of eco-friendly destination brands (eco-travel) | [46] | |||
| Formation of a green information field | Internal corporate environment, media | Business Managers, Information Intermediaries | [47] | |
| Green image | [48,49] | |||
| Green trademarks | [50,51] | |||
| Information and marketing communication | ||||
| [52] |
Source: compiled by the authors.
Table 2.
Dynamics of economic indicators of the manufacturing industry of the Republic of Kazakhstan (post-pandemic period).
Table 2.
Dynamics of economic indicators of the manufacturing industry of the Republic of Kazakhstan (post-pandemic period).
| Indicators | 2021 | 2022 | 2023 | Growth Rate, in % | |
|---|---|---|---|---|---|
| 2022 to 2021 | 2023 to 2022 | ||||
| Number of individuals employed in the manufacturing industry, thousand people | 585.6 | 613.7 | 605.6 | 4.8 | −1.3 |
| Volume of manufacturing industry exports, USD million | 19,851.8 | 26,819.6 | 25,721.6 | 35.1 | −4.1 |
| Export volume of goods of medium technological complexity, USD million | 4088.9 | 4829.8 | 4467.5 | 18.1 | −7.5 |
| Export volume of goods of high technological complexity, USD million | 4552.0 | 7924.1 | 9698.4 | 74.1 | 22.4 |
| Number of operating enterprises in the manufacturing industry, units | 18,163.0 | 19,998.0 | 20,858.0 | 10.1 | 4.3 |
| total | 17,437.0 | 19,246.0 | 20,091.0 | 10.4 | 4.4 |
| small enterprises | 474.0 | 501.0 | 517.0 | 5.7 | 3.2 |
| medium-sized enterprises | 252.0 | 251.0 | 250.0 | −0.4 | −0.4 |
| Share of large and medium-sized enterprises in the manufacturing industry using digital technologies, in % | 7.8 | 12.9 | 16.4 | 65.4 | 27.1 |
| Share of innovation-active enterprises in the manufacturing industry, in % | 12.9 | 14.8 | 14.7 | 14.7 | −0.7 |
Source: authors’ calculations [62].
Table 3.
Promising research in the field of sustainable economy and eco-branding.
| Research Direction | Description | Researchers | |
|---|---|---|---|
| State mechanisms to support economic sustainability in entrepreneurship | Improvement of state support instruments in standardisation, technical regulation, certification, export-import operations | [68] | |
| Mechanisms for regulating corporate environmental performance | Disclosure of a company’s philosophy on environmental protection, environmental policy, organisational structure of circular economy management | [69,70] | |
| The new production culture of the circular economy | Introducing circular thinking, redesigning production processes for primary raw materials | [71] | |
| Mechanisms for sustainable behaviour when purchasing green products | Supporting and motivating consumers to purchase green products through environmental programmes | [72,73] | |
| Branding mechanisms through design developments in creative spheres | Developing sustainable packaging, promoting the biosphere value of the brand, levelling reputational risks in the market | [74,75] | |
| Mechanisms for an effective green marketing strategy | Adapting digital technologies to study consumer preferences to promote the consumption of eco-products. Exploring environmental cultural sensitivity and cross-cultural understanding in the global economy | [76,77] |
Source: compiled by the authors.
Table 4.
Growth prospects in the field of sustainable economy and eco-branding for companies of the Republic of Kazakhstan and their partners.
Table 4.
Growth prospects in the field of sustainable economy and eco-branding for companies of the Republic of Kazakhstan and their partners.
| Direction of transformational change | Description | Key economic sectors | |
|---|---|---|---|
| Improvement of the management system at the level of companies and sectoral government agencies, introduction of ESG principles | Replenish low carbon technology databank, make the case for leveraging the Green Climate Fund | Industrial sector, financial sector, construction, transport, state structures | |
| Renewal of power and heat generation technologies | Attract investment in replacing outdated carbon-intensive equipment and technological infrastructure with innovative low- and no-carbon technologies, introduction of renewable energy sources | Extractive and manufacturing industries | |
| Digital technologies and Decarbonisation of industrial processes | Adoption of new zero greenhouse gas emission production technologies combined with smart carbon capture and storage systems | Extractive and manufacturing industries | |
| Construction of infrastructure for industrial and domestic waste treatment and utilisation | Development of Joint projects on collection, recycling and utilisation of wastes | Extractive and manufacturing industries, construction | |
| Investing in the transition to a green and carbon-neutral economy | Updating the regulatory, legal and institutional framework, creating conditions for the development of innovative green finance instruments | Government agencies, financial sector, science and education | |
| Branding of environmentally friendly high-tech-logic products | Searching for and scaling up the best eco-branding practices, environmental education of the younger generation | Industries, government agencies, science and education |
Source: compiled by the authors.
Disclaimer/Publisher’s Note: The statements, opinions and data contained in all publications are solely those of the individual author(s) and contributor(s) and not of MDPI and/or the editor(s). MDPI and/or the editor(s) disclaim responsibility for any injury to people or property resulting from any ideas, methods, instructions or products referred to in the content. |
© 2024 by the authors. Licensee MDPI, Basel, Switzerland. This article is an open access article distributed under the terms and conditions of the Creative Commons Attribution (CC BY) license (http://creativecommons.org/licenses/by/4.0/).
Copyright: This open access article is published under a Creative Commons CC BY 4.0 license, which permit the free download, distribution, and reuse, provided that the author and preprint are cited in any reuse.


