
Submitted:
22 November 2024
Posted:
22 November 2024
You are already at the latest version
Abstract
Air pollution remains a critical global health concern, with 91% of the world's population exposed to air quality exceeding World Health Organization (WHO) standards and indoor pollution causing approximately 3.8 million deaths annually due to incomplete fuel combustion. Subways, as major public transportation modes in densely populated cities, can exhibit fine particulate matter (PM) levels that surpass safety limits, even in developed countries. Contributing factors include station location, ambient air quality, train frequency, ventilation efficiency, braking systems, tunnel structure, and electrical components. While elevated PM levels in underground platforms are recognized, the vertical and horizontal variations within stations are not well understood. This study examines the vertical and horizontal distribution of PM₂.₅ and PM₁₀ levels at Shibuya Station, a structurally complex hub in the Tokyo Subway System. Portable sensors were employed to measure PM concentrations across different platform levels—both above and underground—and at various locations along the platforms. The results indicate that above-ground platforms have significantly lower PM₂.₅ and PM₁₀ levels compared to underground platforms (17.09 μg/m³ vs. 22.73 μg/m³ for PM₂.₅; 39.54 μg/m³ vs. 56.98 μg/m³ for PM₁₀). Notably, the highest pollution levels were found not at the deepest platform but at the one with the least effective ventilation. On the same platform, PM levels varied by up to 63.72% for PM₂.₅ and 120.23% for PM₁₀, with elevated concentrations near the platform extremities compared to central areas. These findings suggest that ventilation efficiency plays a more significant role than elevation in vertical PM variation, while horizontal differences are likely influenced by piston effects from moving trains. The study underscores the risk of exposure to unsafe PM₂.₅ levels in underground platforms, particularly at platform extremities, highlighting the need for improved ventilation strategies to enhance air quality in subway environments.
Keywords:
air quality
; IoT devices
; public health
; public transport
; low-cost sensors
1. Introduction
The importance of indoor air quality was recognized during the hygienic revolution in the 1850s, but attention shifted to outdoor environmental issues around 1960 [1]. Despite the fact that humans spend most of their time indoors—whether in houses, offices, factories, or during transportation—less emphasis is placed on the quality of indoor air compared to ambient air. The history of indoor air pollution dates back to early humans who used campfires for warmth and cooking. Eventually, these campfires were brought into shelters to improve efficiency, leading to poor air quality within these spaces [2]. 91% of the population is exposed to air quality levels that exceed WHO standards, and indoor air pollution alone causes 3.8 million deaths annually. Poor air quality is associated with severe health issues, including stroke, lung cancer, and heart disease, with impacts comparable to those of smoking [3]. In developing regions, unvented indoor biomass burning significantly contributes to mortality, causing at least 2 million deaths per year [1]. Studies show that indoor air quality is influenced by factors like occupant density, ambient air quality, and emissions from vehicles and industries [4,5].
Among many air pollutants, particulate matter (PM) is particularly hazardous, as it can penetrate deep into the lungs and enter the bloodstream, leading to short- and long-term health effects, including asthma, respiratory infections, reduced lung function, chronic bronchitis, and premature death. The WHO's safe limits for particulate matter are 50 μg/m³ for PM10 and 25 μg/m³ for PM2.5 over 24 hours, and 20 μg/m³ for PM10 and 10 μg/m³ for PM2.5 annually.
Besides accommodation and workplace, air quality during transportation is an important aspect to consider. Research highlights significant variation in air pollution exposure across different transport modes [6,7,8]. Among public transport modes, subway systems have the highest PM concentrations, with levels up to 8.4 times greater than those in cars [9]. In London, Adams et al. [10] found cyclists had the lowest exposure, while subway users experienced exposure levels 3-8 times higher than those using surface transport. These findings underline the need to assess air quality that subway users are exposed to in order to mitigate health risks.
Subway systems contribute significantly to PM levels due to mechanical wear and tear of components such as wheels, rails, and brakes, which release metallic particles into the underground environment. Studies have identified iron (Fe) as a dominant component of subway PM, often accompanied by other trace metals such as manganese (Mn), chromium (Cr), copper (Cu), and various rare earth elements. For example, Jung et al. [11] found that in Seoul, the majority of magnetic floor dust particles less than 25 µm were composed of iron metal, which is relatively harmless, but variations in the presence of elements like Na, Mg, Al, Si, S, Ca, and C between stations were attributed to different ballast types used. In Mexico City, increased levels of metals such as Fe, Mn, and Cr in the subway were linked to mechanical disintegration of steel components, while Cu was associated with arc ablation and mechanical friction [12]. Research comparing European subway systems in Barcelona, Athens, and Oporto demonstrated that higher PM₂.₅ concentrations in subways compared to ambient air are linked to the specific chemical compositions of wheels, rails, brakes, and current supply metals used in different systems [13]. In Barcelona, distinctive "brake flake" particles with inhomogeneous distributions of trace elements like barium were identified as originating from frictional brake wear, highlighting the impact of brake pad materials on PM composition [8]. Additionally, ambient air particles and biological matter can enter the underground environment through ventilation systems and commuter movement, contributing to the overall PM levels observed in subway stations.
Current findings on PM₂.₅ levels in subway systems worldwide reveal significant variations across different cities, with many underground systems have . London exhibits exceptionally high average PM₂.₅ concentrations, reaching 890 µg/m³, which far exceed the World Health Organization's recommended 24-hour mean limit of 25 µg/m³ [10,14]. Shanghai [15,16,17] and Seoul [11,18,19]also report elevated PM₂.₅ levels in their subways, with averages of 231-366 µg/m³ and 118-150 µg/m³. In contrast, New York City presents lower PM₂.₅ concentration, an average PM₂.₅ level of 30.6 µg/m³ [20,21]. These disparities suggest that factors such as the age of the subway system, ventilation efficiency, maintenance practices, and local environmental policies play critical roles in influencing air quality. Kam et al. [22] observed that the PM2.5 levels in underground stations are higher than that of ground-level stations in the Los Angeles (56.7 vs 29.4 µg/m3), but at different stations. However, there are uncertainties in the difference in air quality between above-ground train platforms and underground of the same station, as well as among different positions on a platform. The complex metro system of Tokyo, exemplified by Shibuya station, presents a unique opportunity to observe the vertical and horizontal variation of PM2.5 within the station.
Recent development in portable sensors may enable measurements to clarify those differences. Air quality measurement tools include satellites, ground stations, and portable sensors, each with distinct advantages and limitations. Satellite imagery is effective for large-area monitoring but provides data only once daily and at a spatial resolution of 1 km by 1 km, making it less suitable for analyzing smaller variations or providing precise quantitative data for specific pollutants. Ground stations offer highly accurate measurements of individual pollutants but are limited by their fixed locations and the high costs associated with widespread deployment, making them impractical for regional air quality representation. Portable sensors, on the other hand, provide real-time, flexible data collection capabilities, including indoor monitoring. However, they can face calibration issues and may be influenced by environmental factors such as humidity, which can lead to overestimation of particulate matter levels. Despite these challenges, portable sensors are versatile and valuable for comprehensive air quality assessments in various environments.
This research aims to compare the air quality at both above-ground and underground platforms, and its variation at various positions on the same platform using portable sensors. It is hypothesized that underground platforms would have poorer air quality due to the lack of ventilation. Furthermore, positions near the extremes of the platforms are thought to have higher PM levels due to the piston effects. Even though in a closed environment, the air quality may vary within short distances even, positions close to the train front part are exposed to more PM concentrations due to train piston effect [13,23]. The train piston effect describes the phenomenon when the train passes is arriving at the platform in a tunnel, it pushes the air in front of it, to the sides and top of it. Hence, when a train passes by, the walls of the tunnel constraints the air unlike for above the ground lines, it pushes the air in front it, when train stops, and is accumulated there. When the train starts to leave the station, there is a negative pressure generated in the rear part of the train, so fresh air from the rear ventilation shaft is sucked into the tunnel[23].
As subway is an important means of transport for the majority of people in densely populated cities, understanding its environment and potential health risks will benefit the well-beings of the population. The outcome of this study will be crucial for improving air quality of metro stations and ensuring a healthy environment for metro users.
2. Materials and Methods
2.1. Measurement Device
For this research, the sensor "Pocket PM2.5", developed by Yaguchi Electric Corporation [24], shown in Figure 1 and Figure 2, was used for data collection. This portable air quality monitor is a compact device designed to measure particulate matter (PM2.5 and PM10) using laser scattering technology. With a measurement range of 0 to 999 µg/m³ and a response time of 10 seconds, it provides accurate real-time data, maintaining a relative error within ±15% or ±10 µg/m³ under standard conditions (25°C and 50% humidity). The device draws power directly from a smartphone via a Micro USB connection, eliminating the need for external batteries, and outputs data in CSV format for spreadsheets and KML for Google Earth and Google Maps integration. Although the product has been discontinued, it was compatible with various Android smartphones and tablets from brands like SHARP, Samsung, Huawei, Sony, ASUS, and Google Nexus. Software applications for Android and Windows, along with user manuals and technical documents, were provided to assist users.
2.2. Description of the Measurement Site and Measurement Setup
The readings were taken at Shibuya Station in Tokyo, Japan, the second busiest train station in the city, with approximately 2.8 million daily users. The station was chosen thanks to its complex structure, having four underground lines and four above-ground lines. This vertical and horizontal variation may help elucidate the variation in air quality within the station. Data was collected from six lines: Lines 1 and 2 are above ground, while Lines 3, 4, 5, and 6 are underground, with Line 3, 4 being on basement level 3 and Line 5, 6 on basement level 5.
The data for particulate matter was collected using portable sensors in subway stations and platforms. The device was held at chest level while standing two meters from the railway to avoid obstructing ongoing traffic. Readings were taken at various positions on the platforms of these six lines, and the timing of train arrivals and departures was also recorded. The position of the lines can be seen in Figure 2. For trains with five to six cars, readings were taken at three positions on the platform, and for trains with eight to ten cars, readings were taken at four positions.
Line 1: The platform is above-ground and ventilated with outdoor air. Trains have five cars, arrive from the left, stop, then depart towards the left side of the figure. The readings were taken at three positions as shown in Figure 3 to measure PM levels at the two extremes positions on the platform and at its center.
Line 2: The platform is above-ground, ventilated with outdoor air . Trains have six cars, inbound trains arrive at platform 2 from the right and continue without passengers towards the left. Outbounds train arrive at platform 1 from the left and departs towards the right. The readings were taken at three positions as shown in Figure 4.
Line 3 and Line 4 are underground lines located opposite to each other in the same tunnel at the B3 level, without any ventilation facilities. Trains on both lines have 10 cars each, trains on Line 3 run from left to right and vice versa for Line 4. Air quality readings were taken at four positions (Figure 5): Positions 1 and 2 on Line 3’s platform, and Positions 3 and 4 on Line 4’s platform. Positions 1 and 4 are at the ends of their respective platforms, while Positions 2 and 3 are located three cars away from the ends toward the center of the platform.
Line 5 and Line 6: The platforms are underground (B5 level), ventilated with air conditioners. These two lines have two platform each, totaling four rail lines in sharing the same space, with one platform for rail line. Trains have 8-10 cars, trains of line 5 run from right to left and vice versa for trains of line 6. Occassionally, the train may run continuously pass the station without stopping. The readings were taken at four positions for each line as shown in Figure 6.
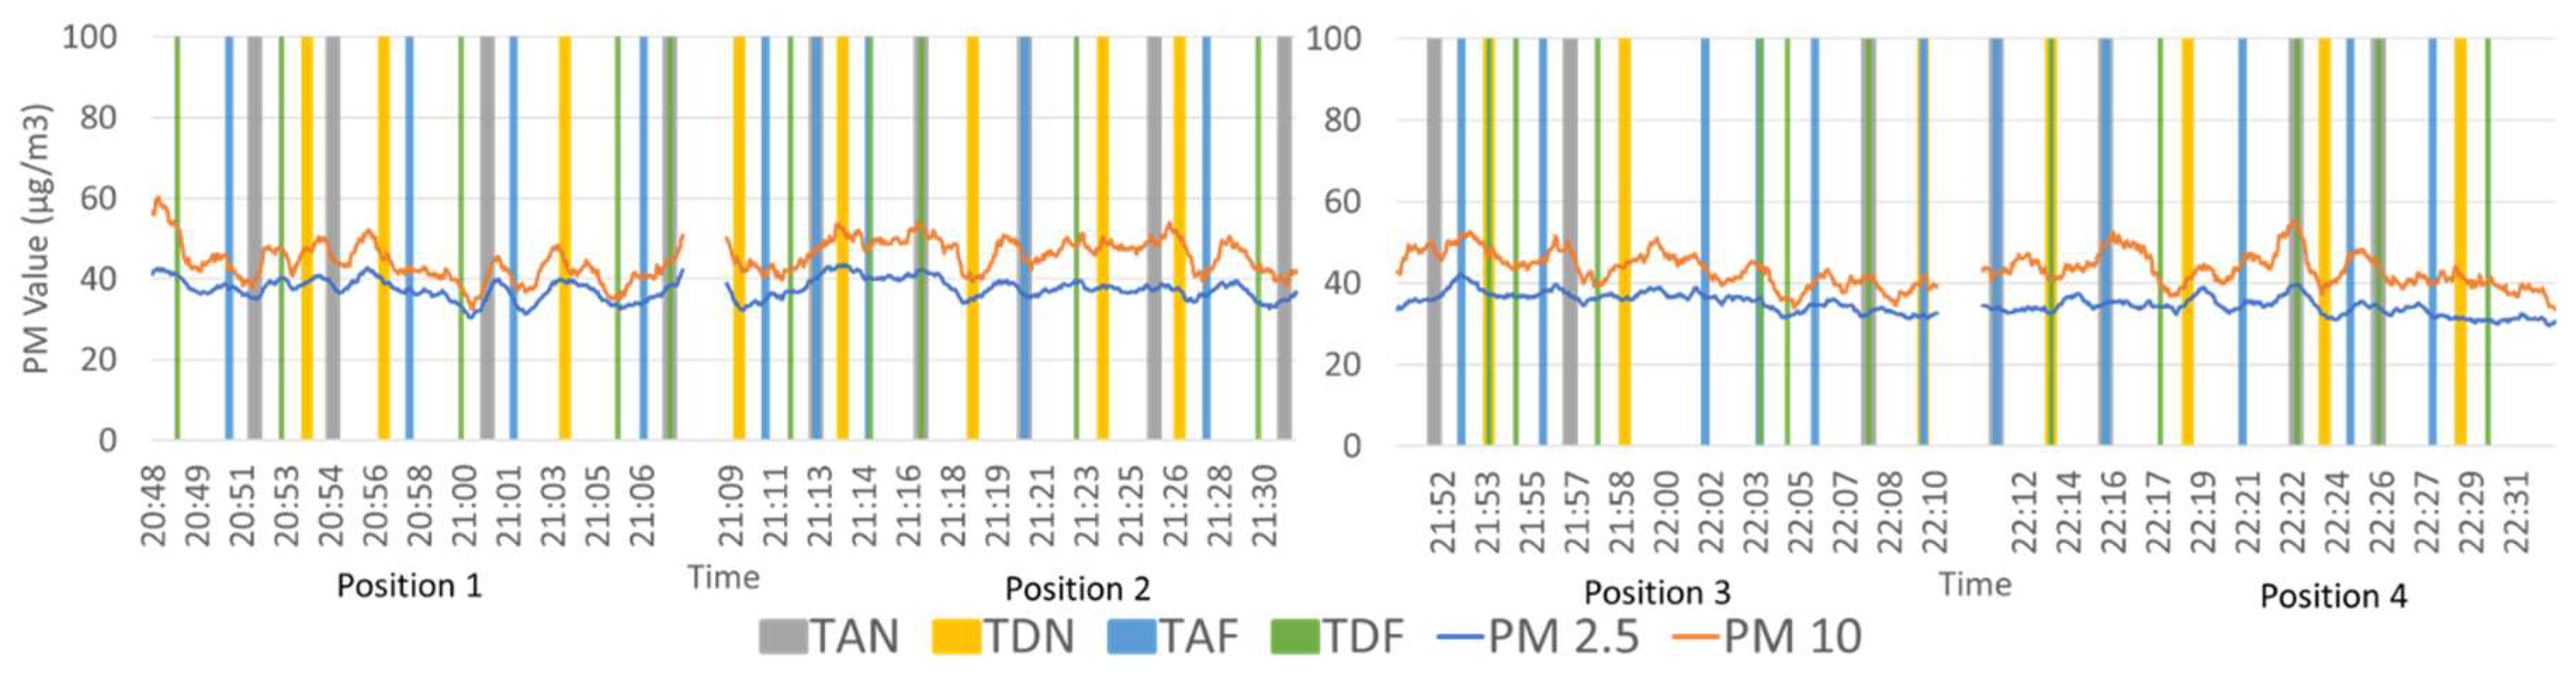
Data of PM2.5 and PM10 was collected for 15 minutes at each position, with readings recorded every 5 second to observe the change in the readings with respect to arrival and departure of the train. It was also observed previously by [26] that PM values are not only affected by train arrival and departure at the nearby rail line, but also, by train arrival and departure at the far away. We define that for measures taken at P1, a train arriving and departing on Line 1 is a Train Arrival Near (TAN) and Train Departure Near (TDN); and a train arriving and departing on Line 2 is a Train Arrival Far (TAF) and Train Departure Far. Two identical devices were used simultaneously to measure in a part of the measurement campaign. A sample recording was shown in Figure 8, and the rest of the recording was shown in Figure A1, Figure A2, Figure A3, Figure A4, Figure A5, Figure A6, Figure A7, Figure A8 and Figure A9.
2.3. Parameter Selection
Air quality within subway stations is influenced by various factors. This study focuses on two key parameters—platform location (above ground vs. underground), and positions on the platform—to examine their effects on particulate matter (PM) concentrations.
Platform Location plays a significant role in determining the air quality inside subway stations. Underground stations tend to have higher PM concentrations compared to above-ground stations due to limited natural ventilation and reduced air exchange with the external environment [18]. The confined spaces of underground platforms can lead to the accumulation of pollutants, whereas above-ground stations benefit from open-air conditions that facilitate pollutant dispersion. By comparing PM levels at different platform locations, we aim to understand how structural differences influence air quality.
It is noted that each train line has a different operation frequency. Train Frequency affects PM concentrations and varies depending on weekdays, weekends, and the time of day. During peak hours on weekdays, trains run more frequently to accommodate higher passenger volumes, which can lead to increased turbulence and resuspension of settled particles [12]. Conversely, reduced train frequency during off-peak hours or weekends may result in lower PM levels. By analyzing PM concentrations in relation to train schedules, we can assess how operational patterns influence air quality within the stations.
Positions on the Platform impact passenger exposure to PM due to spatial variations in pollutant distribution. Studies have shown that certain areas on the platform, such as those near the front of incoming trains, experience higher PM concentrations. This is attributed to the piston effect, where the train pushes air—and suspended particles—ahead of it as it enters the station [13,23]. By measuring PM levels at different positions, we can identify hotspots of higher pollution and propose strategies to mitigate exposure in these areas.
While our research focuses on these two parameters, other factors may also affect PM concentrations but are beyond the scope of this paper. Ventilation conditions, including the design and efficiency of mechanical and natural ventilation systems, significantly influence air quality by controlling pollutant removal and fresh air intake [27]. Train design elements, such as materials used in wheels and braking systems, contribute to PM through abrasion and wear, releasing metals and other particles into the [8,28]. Atmospheric conditions like wind speed, humidity, temperature, and ambient air quality also impact PM levels within subway stations [29,30]. Future studies could incorporate these parameters for a more comprehensive analysis of factors affecting air quality in subway systems.
3. Results
3.1. Comparison of Particulate Matter Measurements Above-Ground and Underground Lines
Figure 9 shows that The underground lines (Line 3, 4, 5 and 6) have more particulate matter as compared to the ones above-ground (Line 1 and 2). Notably, the PM2.5 and PM10 concentrations are near, or exceed safety 24 hours standards for underground lines, while above-ground lines are within safe limits. Additionally, above-ground platforms have better air quality than underground platforms. However, while Lines 3 and 4 are at basement level 3, and Lines 5 and 6 are at basement level 5, Lines 5 and 6 have better air quality than Lines 3 and 4.
For Line 1, it was observed that even though PM2.5 and PM10 concentration was within WHO safety limits, the values were higher on weekends compared to weekdays (Figure 9). For Line 2, PM2.5 concentration levels were almost the same for both weekdays and weekends, and PM10 were higher on weekdays. For Line 3 and Line 4, the average PM2.5 and PM10 concentration levels were higher on weekdays. For Line 5 and 6, PM2.5 levels were slightly higher on weekends, but PM10 levels were higher on weekdays.

Table 3.
Average, minimum, and maximum PM2.5 values on weekdays across various lines and positions.
| Line | Position | Average PM2.5 (µg/m3) | Min PM2.5 (µg/m3) | Max PM2.5 (µg/m3) |
|---|---|---|---|---|
| Line 1 | Position 1 | 11.1 | 9.2 | 13.9 |
| Position 2 | 10.4 | 8.1 | 13.1 | |
| Position 3 | 9.86 | 8.3 | 12.6 | |
| Position 4 | NaN | NaN | NaN | |
| Line 2 | Position 1 | 13.44 | 8.6 | 17.5 |
| Position 2 | 13 | 10.9 | 16 | |
| Position 3 | 18.55 | 15 | 22.5 | |
| Position 4 | NaN | NaN | NaN | |
| Line 3 & 4 | Position 1 | 54.61 | 29.8 | 73.7 |
| Position 2 | 43.33 | 29.3 | 67.9 | |
| Position 3 | 49.81 | 38.4 | 70.4 | |
| Position 4 | 49.97 | 30.5 | 66 | |
| Line 5 | Position 1 | 47.36 | 30 | 56.6 |
| Position 2 | 37.25 | 26.5 | 52.2 | |
| Position 3 | 32.41 | 20.8 | 52.7 | |
| Position 4 | 29.62 | 18.7 | 49.3 | |
| Line 6 | Position 1 | 31.34 | 17.4 | 43.4 |
| Position 2 | 26.13 | 17 | 40.2 | |
| Position 3 | 32.41 | 19.7 | 47 | |
| Position 4 | 42.78 | 32.8 | 58.6 |
3.2. Comparison of PM Level at Different Positions on the Platform
Firstly, the PM₂.₅ and PM₁₀ concentrations during weekdays and weekends appear consistent across different positions on the above-ground lines (Lines 1 and 2). For Line 1, the values remain relatively uniform throughout all positions (Figure 10, Figure 11, Figure 12 and Figure 13; Table 3, Table 4, Table 5 and Table 6). However, on Line 2 during weekdays, there is a slight elevation in PM₂.₅ and PM₁₀ levels at position 3 (Figure 10 and Figure 12; Table 3 and Table 5).
In contrast, the underground lines (Lines 3–6) exhibit variations in PM levels among different positions, though these variations are not consistent across all lines. One observable pattern is that the extreme positions—positions 1 and 4—tend to have higher PM concentrations than the middle positions (positions 2 and 3). For instance, on Line 6 during weekdays, the PM₁₀ readings at the extremes are significantly higher: position 1 records 58.52 µg/m³ and position 4 records 60.20 µg/m³, which are approximately 33% higher than the readings at position 2 (45.32 µg/m³) and position 3 (43.93 µg/m³) (Table 5). Another pattern is that position 1 consistently shows higher PM levels than the other positions, while position 4 sometimes has lower PM levels, as observed on Line 5 and, to some extent, Line 4 (Figure 10, Figure 11, Figure 12 and Figure 13). For example, on Line 5 during weekdays, the PM₁₀ level at position 1 is 86.44 µg/m³, which is 120% higher than the level at position 4, 39.25 µg/m³ (Table 5).
In these cases, positions with lower PM concentrations fall within safety standards, whereas higher PM levels at the extremes tend to exceed these standards. The variation among different positions on the platforms suggests that air quality may be better at certain locations, while other areas may require enhanced ventilation or air purification measures.
4. Discussion
4.1. PM2.5 Levels at Different Platforms
According to WHO guidelines (WHO Air Quality Guideline Values), the concentration of fine particulate matter (PM2.5) should be less than 25 μg/m³ for the 24-hour mean, and the concentration of coarse particulate matter (PM10) should be less than 50 μg/m³ for the 24-hour mean. Based on these guidelines, above-ground lines (Lines 1 and 2) are within the limits (assuming the 24-hour mean for these lines would be the average value for the period of observation).
However, underground lines (Lines 3, 4, 5, and 6) PM levels are equal to or exceed the safety limits. Air quality is better in Lines 5 and 6 compared to Lines 3 and 4, perhaps because Lines 5 and 6 are located in a wider tunnel with four platforms, while the latter are in a narrower tunnel with only two platforms [31]. Furthermore, despite Line 5 and Line 6 being in the same tunnel (i.e., Platform 3 and 4; Figure 9), Line 6's platforms have better air quality. This is perhaps due to the air conditioners equipped on Line 6's platforms, which are absent from Line 5. This suggests that better ventilation and air filtering improved air quality.
It can be noted that train frequency does not affect the average PM values. The least count for train arrival and departure times is 1 minute, which is not very precise. If it were more accurate, it would provide a better understanding of its effect on PM values. However, it was noted that when the train doors open (with the air inside the train initially having lower PM values compared to the platform), there is an exchange of air between the train and the platform. It was observed that the PM value of the air inside the train gradually increases, while the PM value on the platform gradually decreases.
Ventilation plays a critical role, as poor ventilation can lead to higher PM concentrations, particularly in deeper stations [31,32]. The "piston effect," caused by train movement, pushes air through tunnels, influencing PM distribution [23]. Effective mitigation strategies include improved ventilation, use of electric brakes, and air conditioning systems to reduce exposure and improve air quality [26,29,33]. Understanding and managing these factors is essential for minimizing health risks in subways [34,35]. Effective air conditioning reduced PM exposure inside trains [8].
Table 7.
Comparison between PM levels measured in this study and other studies.
| City | Measurement Year | PM₂.₅ (µg/m³) | PM₁₀ (µg/m³) | Platform Location |
|---|---|---|---|---|
| Athens [36] | Jun–Aug 2012 | 50.18 | 195.27 | Underground |
| Athens [33] | Apr 2013–Mar 2014 | 68.3 | — | Underground |
| Barcelona [33] | Apr 2013–Mar 2014 | 58.3 | — | Underground |
| Barcelona [31] | Oct-Nov 2014 | 42.7 | — | Underground |
| Beijing [37] | Oct 2016 | 250 | 425 | Underground |
| Frankfurt [38] | August 2013 | 52 | 92 | Underground |
| Helsinki [39] | March 2004 | 60 | — | Underground |
| Hong Kong [40] | May–Sep 2013 | 10.2 | — | Underground |
| Istanbul [41,42] | Sep–Oct 2007 | 105 | 200 | Underground |
| Italian Metro [43] | January 2014 | 52.3 | 195 | Underground |
| Lisbon [44] | Oct 2014–Mar 2015 | 13 | 40 | Underground |
| Los Angeles [22] | May–Aug 2010 | 56.7 | 78 | Underground |
| Los Angeles [22] | May–Aug 2010 | 29.4 | 38.2 | Above ground |
| Mexico City [45] | Apr–Aug 2002 | 106.2 | — | Underground |
| Mexico City [12] | Nov–Dec 2007 | 37 | 44 | Underground |
| Montreal [46] | 2010–2013 | 31.3 | — | Underground |
| Oporto [33] | Apr 2013–Mar 2014 | 83.7 | — | Underground |
| Prague [47] | Mar 2003–Feb 2004 | — | 120.2 | Underground |
| Seoul [18] | Nov 2004–Feb 2005 | 129 | 359 | Underground |
| Seoul [48] | Mar 2008–Feb 2009 | 52.2 | 75.7 | Underground |
| Seoul [19] | Jan 2007 | 115.6 | 129.3 | Underground |
| Shanghai [49] | 2008 | 287 | 366 | Underground |
| Stockholm [50] | Jan–Feb 2000 | 258 | 469 | Underground |
| Sydney [51] | Sep–Nov 2015 | 40.6 | 54.9 | Underground |
| Sydney [52] | June 2015 - June 2016 | 98 | 102 | Underground |
| Taipei [53] | Oct–Dec 2007 | 35 | 51 | Underground |
| Taipei [54] | Aug–Nov 2010 | 28 | 37 | Underground |
| Taipei [55] | 2016 | 75.4 | 97.2 | Underground |
| Toronto [46] | 2010–2013 | 124.6 | — | Underground |
| Vancouver [46] | 2010–2013 | 18.3 | — | Underground |
| Tokyo (this study) | Aug 2019 | 17.09 | 22.73 | Above ground |
| Tokyo (this study) | Aug 2019 | 39.54 | 56.98 | Underground |
4.2. PM2.5 Levels at Different Positions on the Platform
Train arrivals and departures have a major impact on PM levels on the platforms. Additionally, train arrivals and departures at distant platforms also significantly influence PM peaks, not just those at nearby platforms. This phenomenon can be explained by the train piston effect. Although this effect helps reduce PM levels inside the station—since when a train enters the tunnel, it drags air along with it due to fluid viscosity and draws in fresh air from the other end (provided there is ventilation)—it eventually accumulates PM at the train exit point. This is consistent with findings by [31], in the Barcelona subway system.
For instance, in Line 1, at Position 1 on a weekday (Figure 12, Table 5), the peak PM10 value is 23.2 μg/m³, whereas the average value at that position is 18.4 μg/m³. There are also more peaks observed at or near train arrivals and departures. A similar observation is seen for Line 2. At Position 1 on Line 3 on a weekday (Figure 12, Table 5), the PM10 value reaches up to 142.8 μg/m³ during to a train arrival at another platform, while the average value at the same location is 99.4 μg/m³. Similarly, for Line 5, the peak at Position 1 during to a train departure at a distant platform is 107.3 μg/m³, whereas the average is 86.4 μg/m³. Moreover, on Line 6, at Positions 1 and 4, the peak is observed at 91.7 μg/m³ during to a train departure at another platform, whereas the average value is around 60 μg/m³ for both. It is challenging to explain why the train piston effect due to train arrivals and departures at distant platforms is more pronounced compared to nearby platforms.
It can be noted that on above-ground rail lines (Line 1 and Line 2), there is very little difference in PM levels at various positions on the platform (Positions 1, 2, and 3). This is because the train piston effect is more prominent in closed tunnels. However, on the underground rail lines (Line 3, 4, and 5), there are some differences at various positions, particularly higher at Position 1 (the train exit point for Lines 3, 4, and 5) compared to other positions. On Line 6, PM levels are almost the same at all positions; this line's platforms are equipped with air conditioners, unlike any other line.
However, there is an irregularity in average PM10 concentrations at different positions on the underground lines, namely Line 5 and Line 6. In these lines, for Line 5, Positions 1 and 2 experience higher average PM levels than the desired permissible limits, while Positions 3 and 4 are within the safety limits. This is predominantly due to the train piston effect; at these positions, PM accumulates when the train arrives, carrying PM along with the wind, and it accumulates over that region when the train stops. PM can be generated by friction between rail lines and wheels (depending on their material properties) and between catenaries and pantographs. There is also a possibility of PM accumulating from ambient air through ventilation shafts. However, it was observed that ambient air had much lower concentrations for both PM2.5 and PM10.
5. Conclusions
In Shibuya Station, which is the second busiest station in Japan, it was found that white above-ground train lines have healthy air quality with an average PM2.5 and PM10 levels at 17.09 μg/m³ and 39.54 μg/m³ respectively, underground train lines have PM2.5 and PM10 levels that are nearly equal or exceed the safety limit for daily exposure (22.73 μg/m³ and 56.98 μg/m³). The difference could due to above-ground platforms having better exchange of air with the environment. In addition, it was suggested that having proper ventilation facilities may significantly improve air quality in underground platforms, as we found deeper platforms with better ventilation had better air quality than shallower ones with poorer ventilation. Also, it was observed that there was much horizontal variation among positions at the underground platforms, with as much as 120% difference between two points on the same platform at in the same measurement session. It could be attributed to the piston effects, where in a tunnel, the extreme positions near the entrances and exits of the train carriage have elevated PM concentration compared to those in the middle. There are positions on the underground subway platforms that exceed the safety standards, especially at the extremes of the platforms, necessicating improvements in ventilation. To summarize, this research revealed variations in air quality within the Shibuya metro station, which can help in further station designing of trains and station structure to reduce the exposure of an individual commuting via subway system.
Author Contributions
Conceptualization, D.A.; methodology, D.A.; software, D.A.; validation, D.A.; formal analysis, D.A.; investigation, D.A.; resources, D.A. and W.T.; data curation, D.A., X.T.; writing—original draft preparation, D.A.; writing—review and editing, X.T. and W.T..; visualization, D.A and X.T.; supervision, W.T.; project administration, W.T.; funding acquisition, W.T. All authors have read and agreed to the published version of the manuscript.
Funding
This research received no external funding.
Data Availability Statement
Raw data is available upon request to the author.
Acknowledgments
I am deeply grateful to my supervisors for their invaluable guidance and encouragement, and to the lab members and staff for their support throughout this journey. I also appreciate the scholarship that made this opportunity possible. Lastly, my heartfelt thanks go to my family for their unwavering support and to the Almighty for this blessing.
Conflicts of Interest
The authors declare no conflicts of interest.
Appendix A
Figure A1.
Concentration profiles of PM2.5 and PM10 on different positions on Line 1 on a weekend [17th August 2019].
Figure A1.
Concentration profiles of PM2.5 and PM10 on different positions on Line 1 on a weekend [17th August 2019].
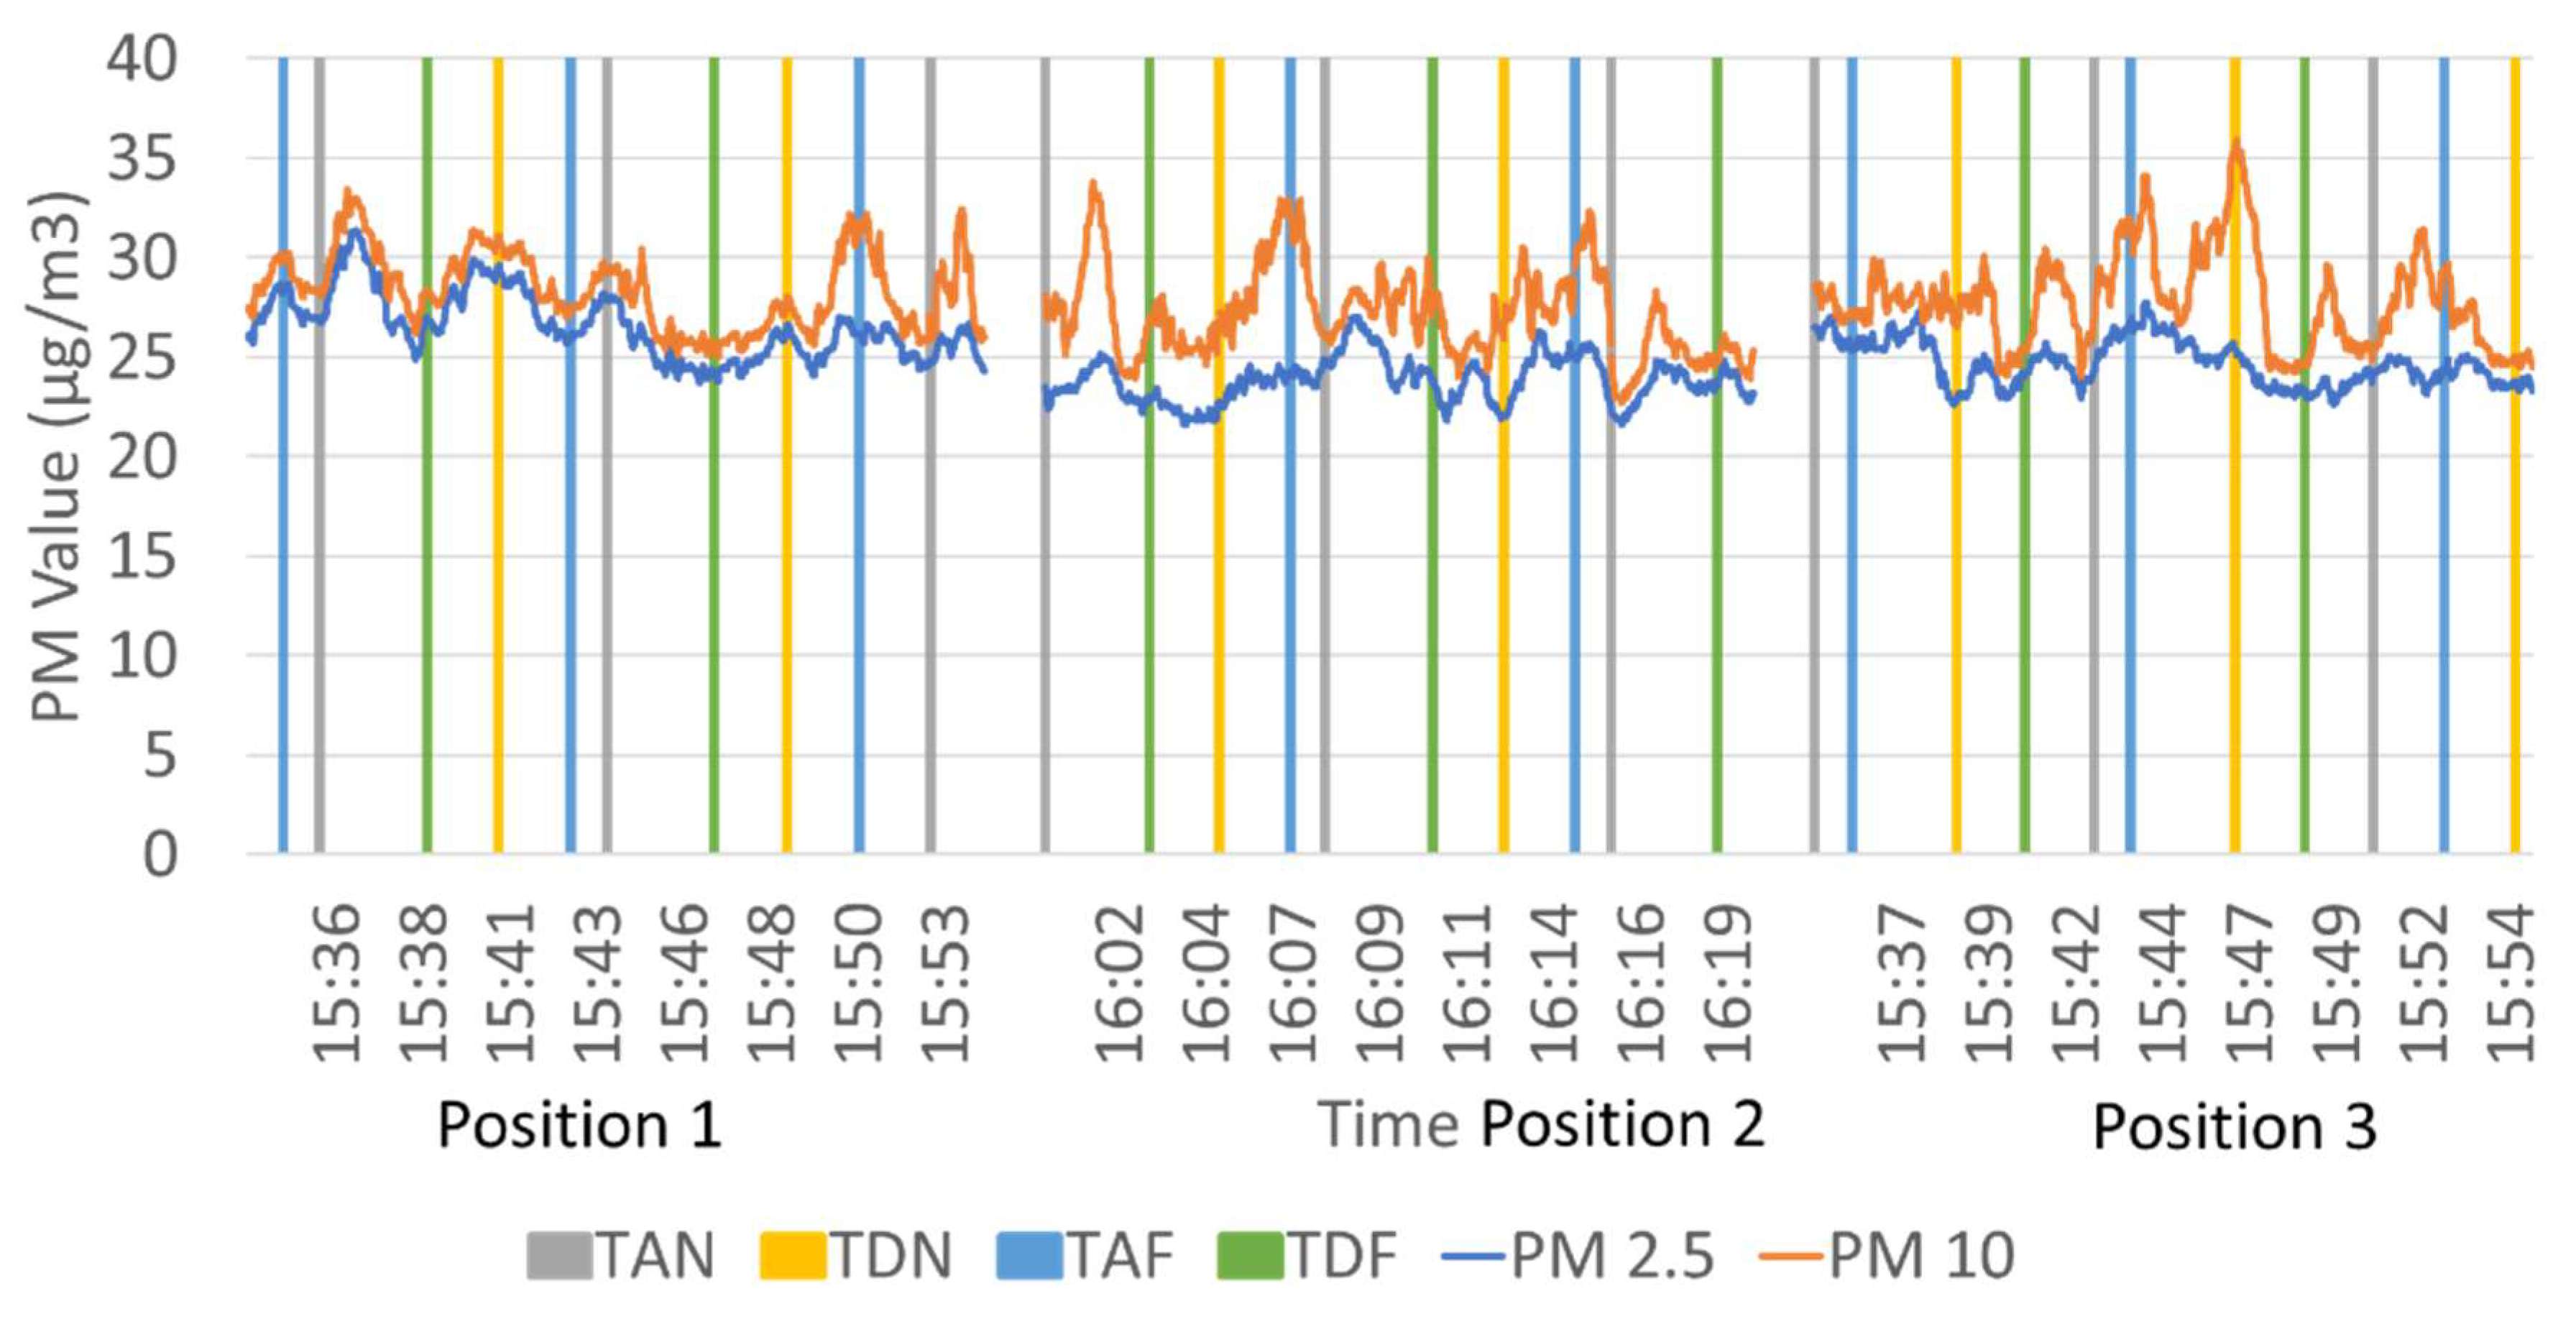
Figure A2.
Concentration profiles of PM2.5 and PM10 on different positions on Line 2 on a weekday [15th August 2019].
Figure A2.
Concentration profiles of PM2.5 and PM10 on different positions on Line 2 on a weekday [15th August 2019].
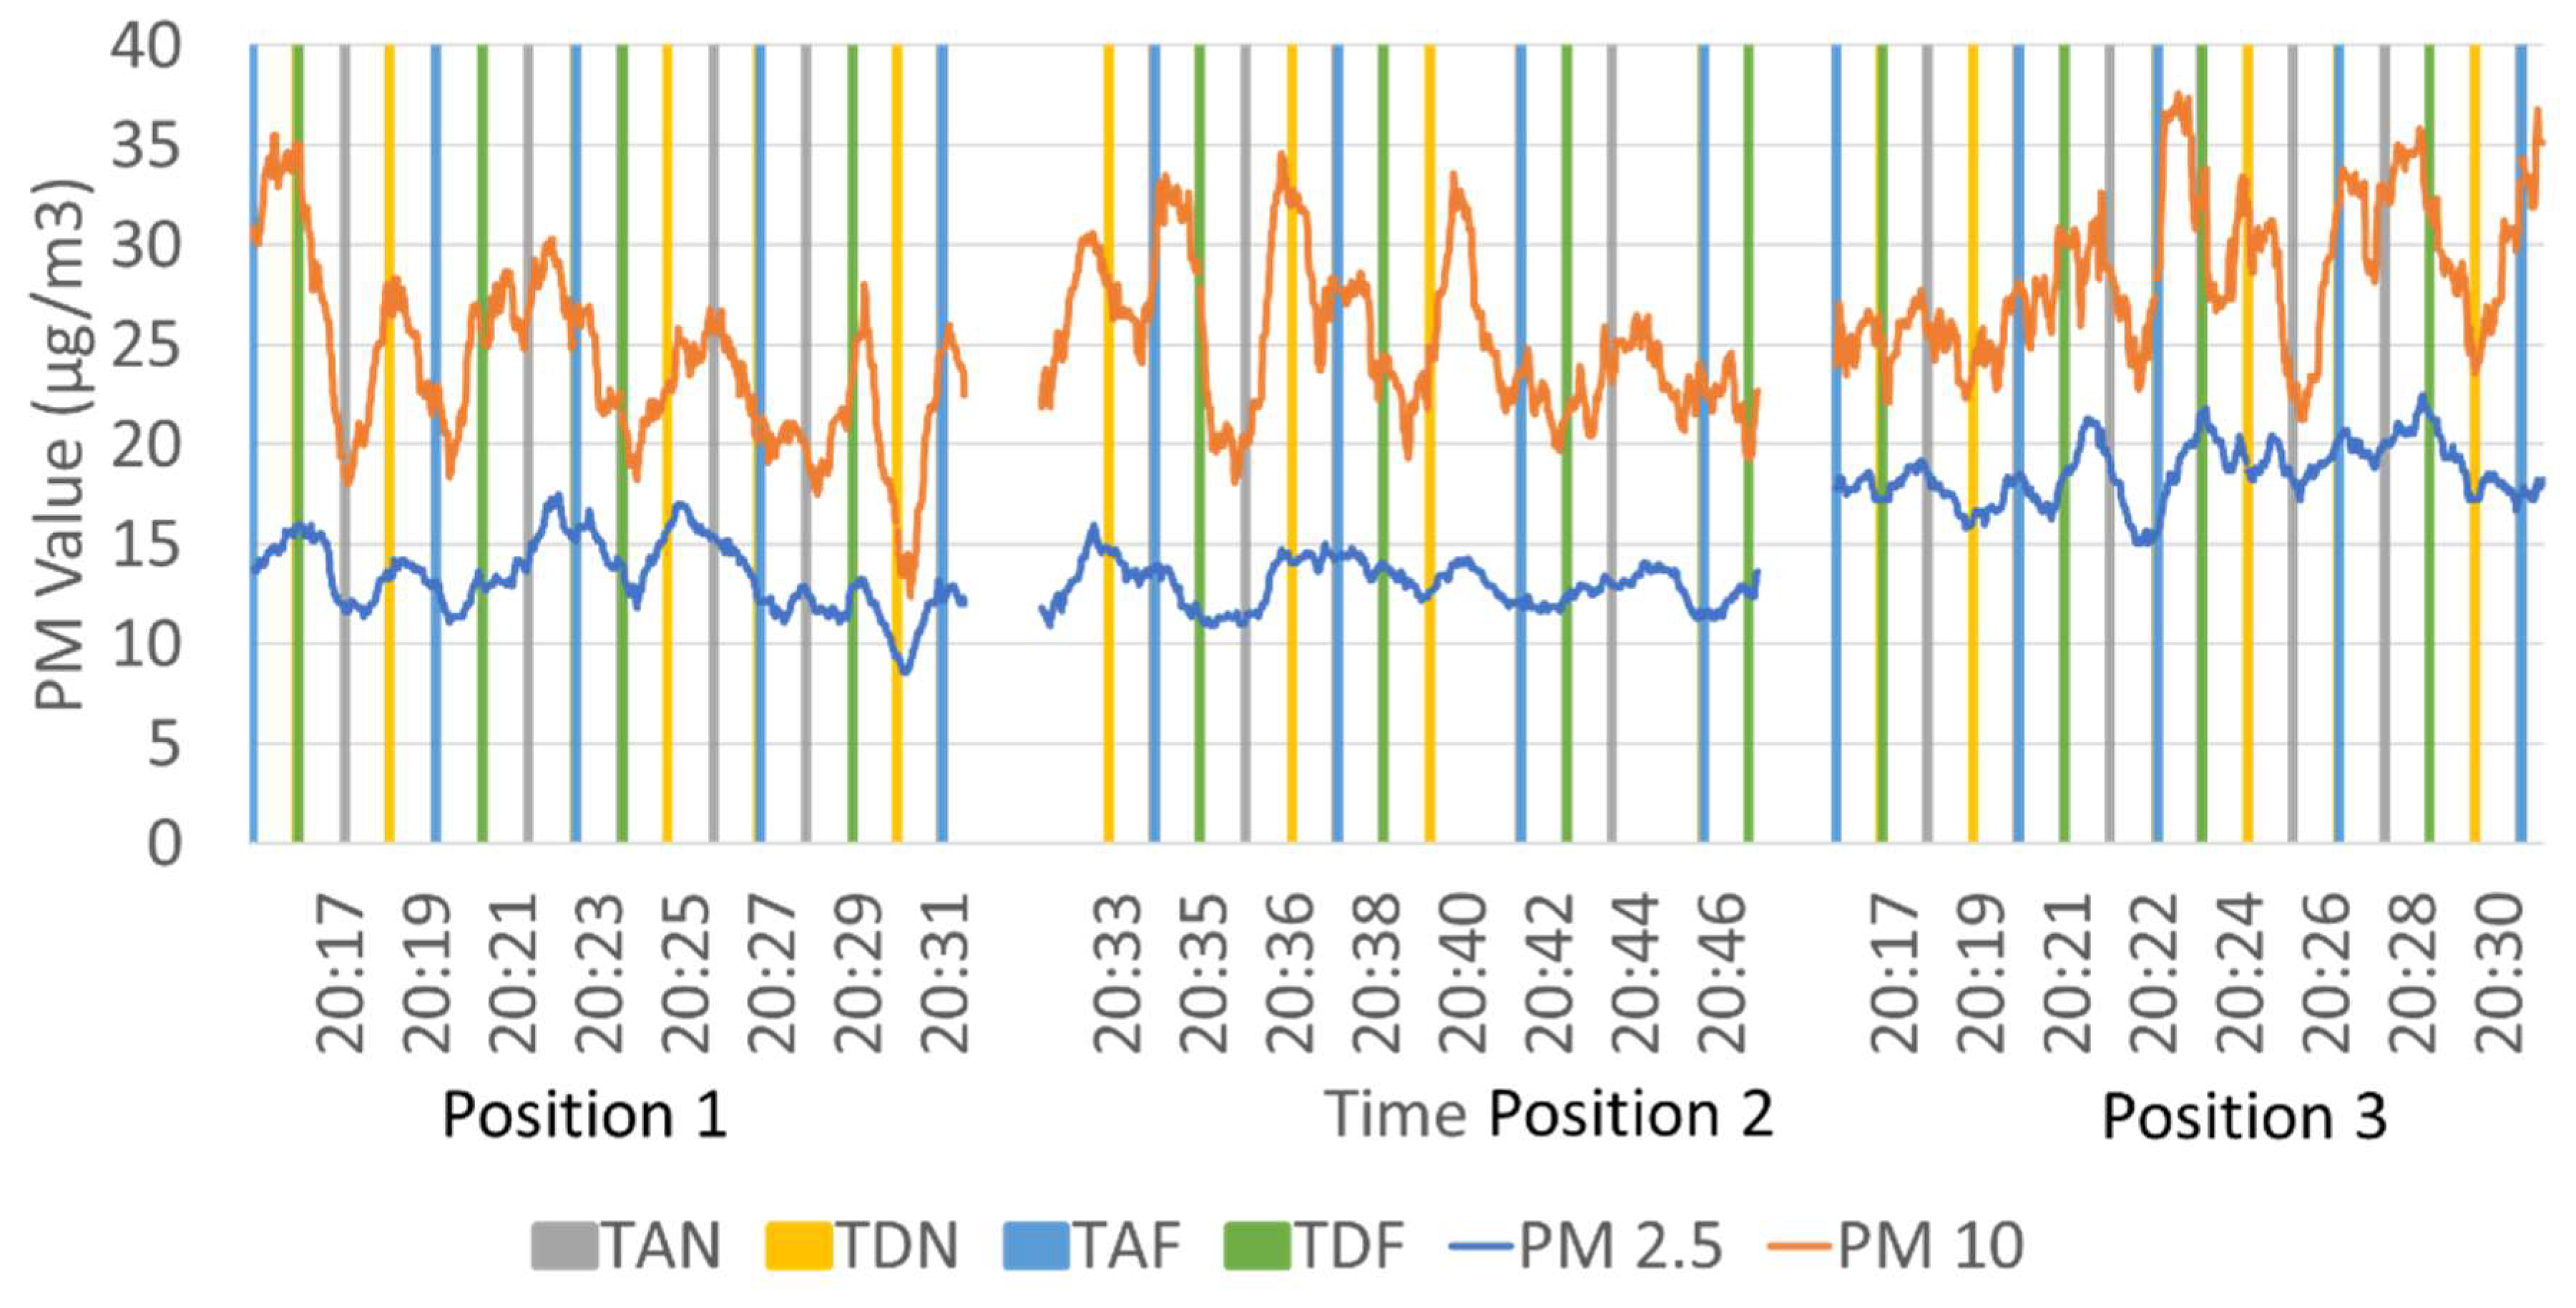
Figure A3.
Concentration profiles of PM2.5 and PM10 on different positions on Line 2 on a weekend [18th August 2019].
Figure A3.
Concentration profiles of PM2.5 and PM10 on different positions on Line 2 on a weekend [18th August 2019].
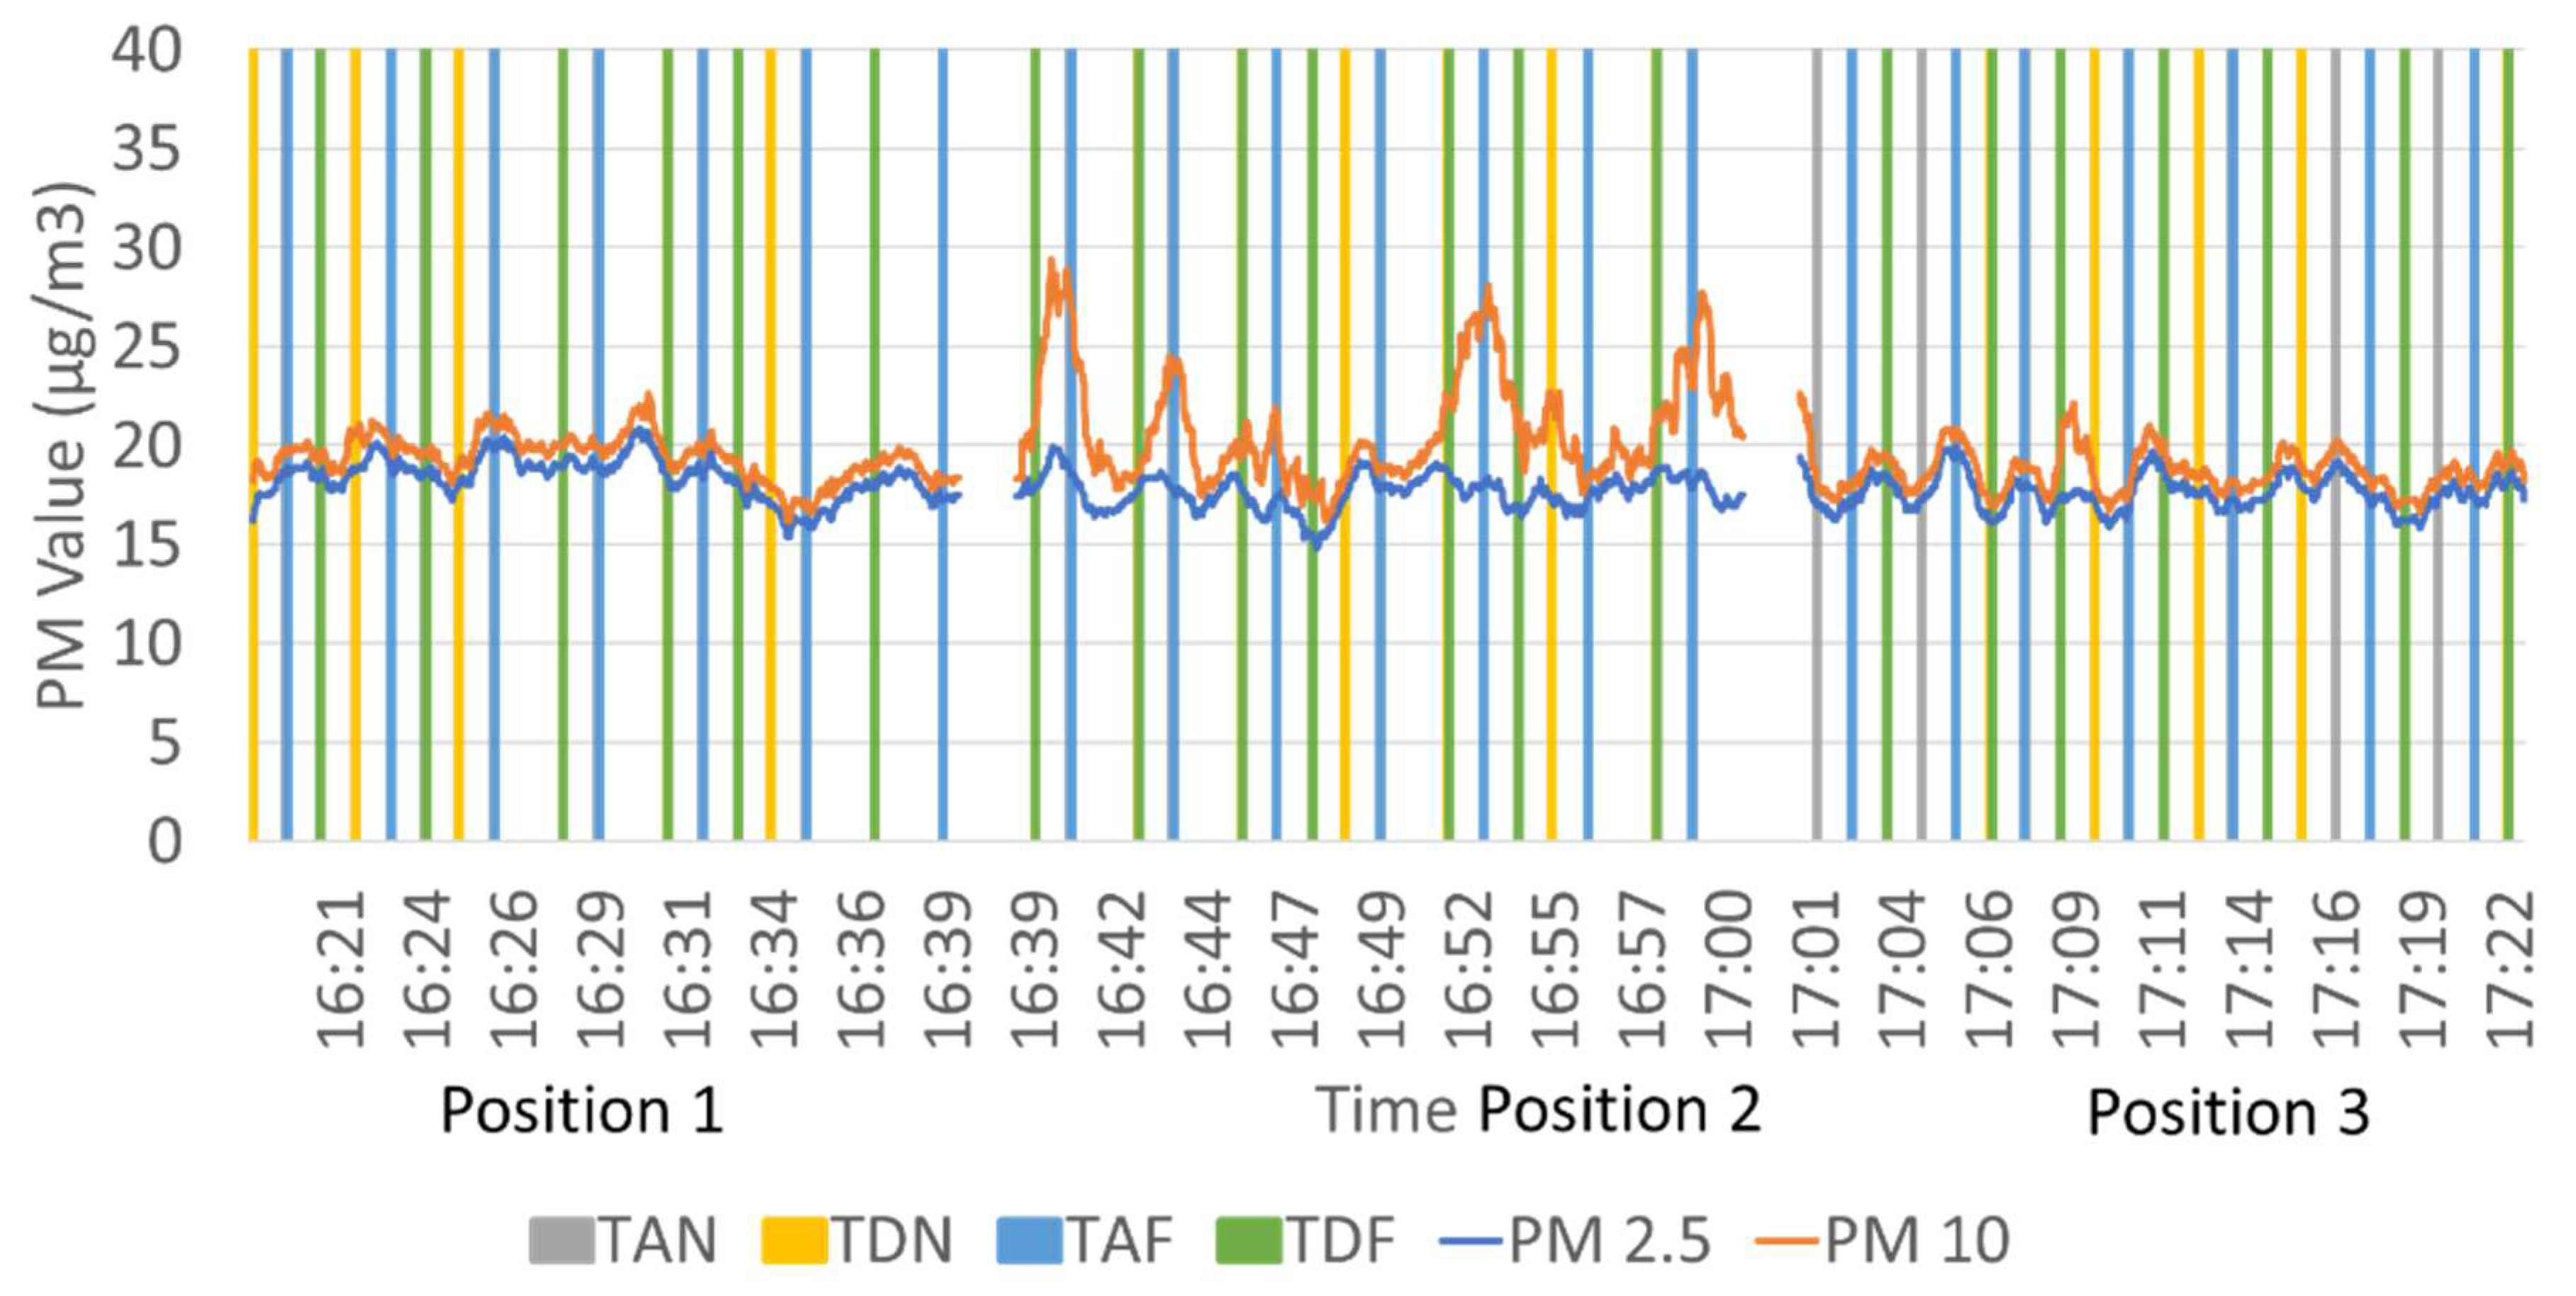
Figure A4.
Concentration profiles of PM2.5 and PM10 on different positions on Line 3 and Line 4 on a weekday [15th August 2019].
Figure A4.
Concentration profiles of PM2.5 and PM10 on different positions on Line 3 and Line 4 on a weekday [15th August 2019].
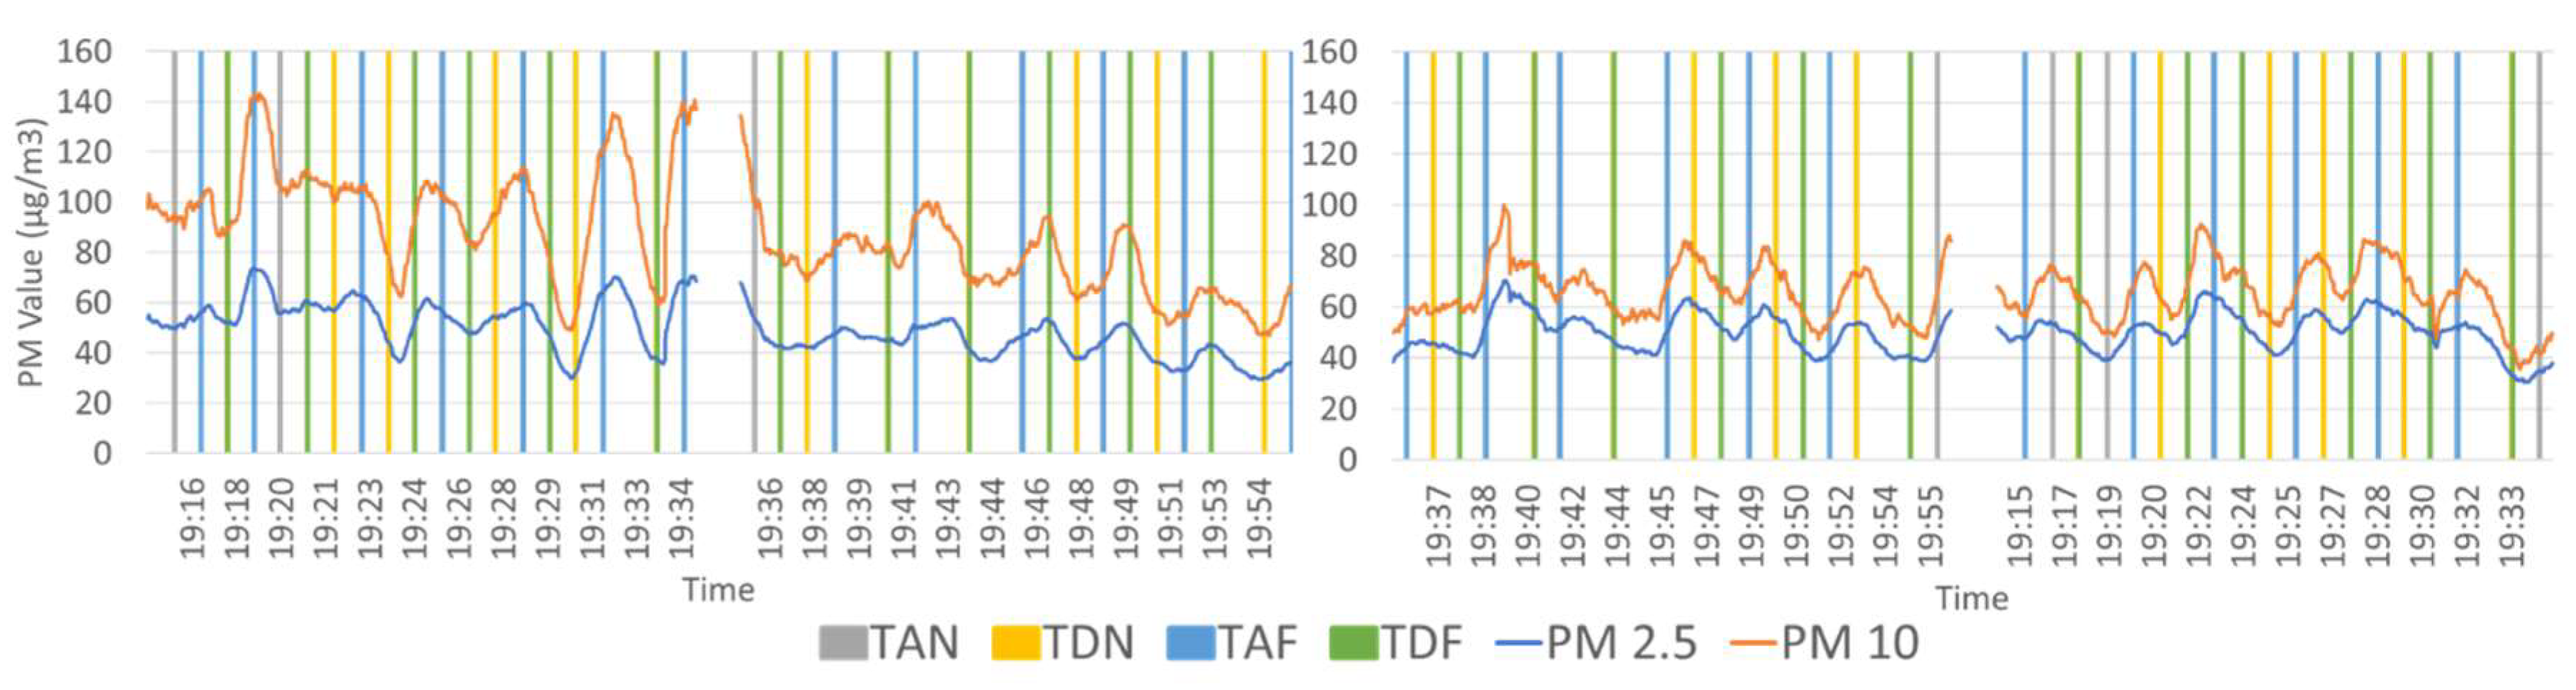
Figure A5.
Concentration profiles of PM2.5 and PM10 on different positions on Line 3 and Line 4 on a weekend [18th August 2019].
Figure A5.
Concentration profiles of PM2.5 and PM10 on different positions on Line 3 and Line 4 on a weekend [18th August 2019].
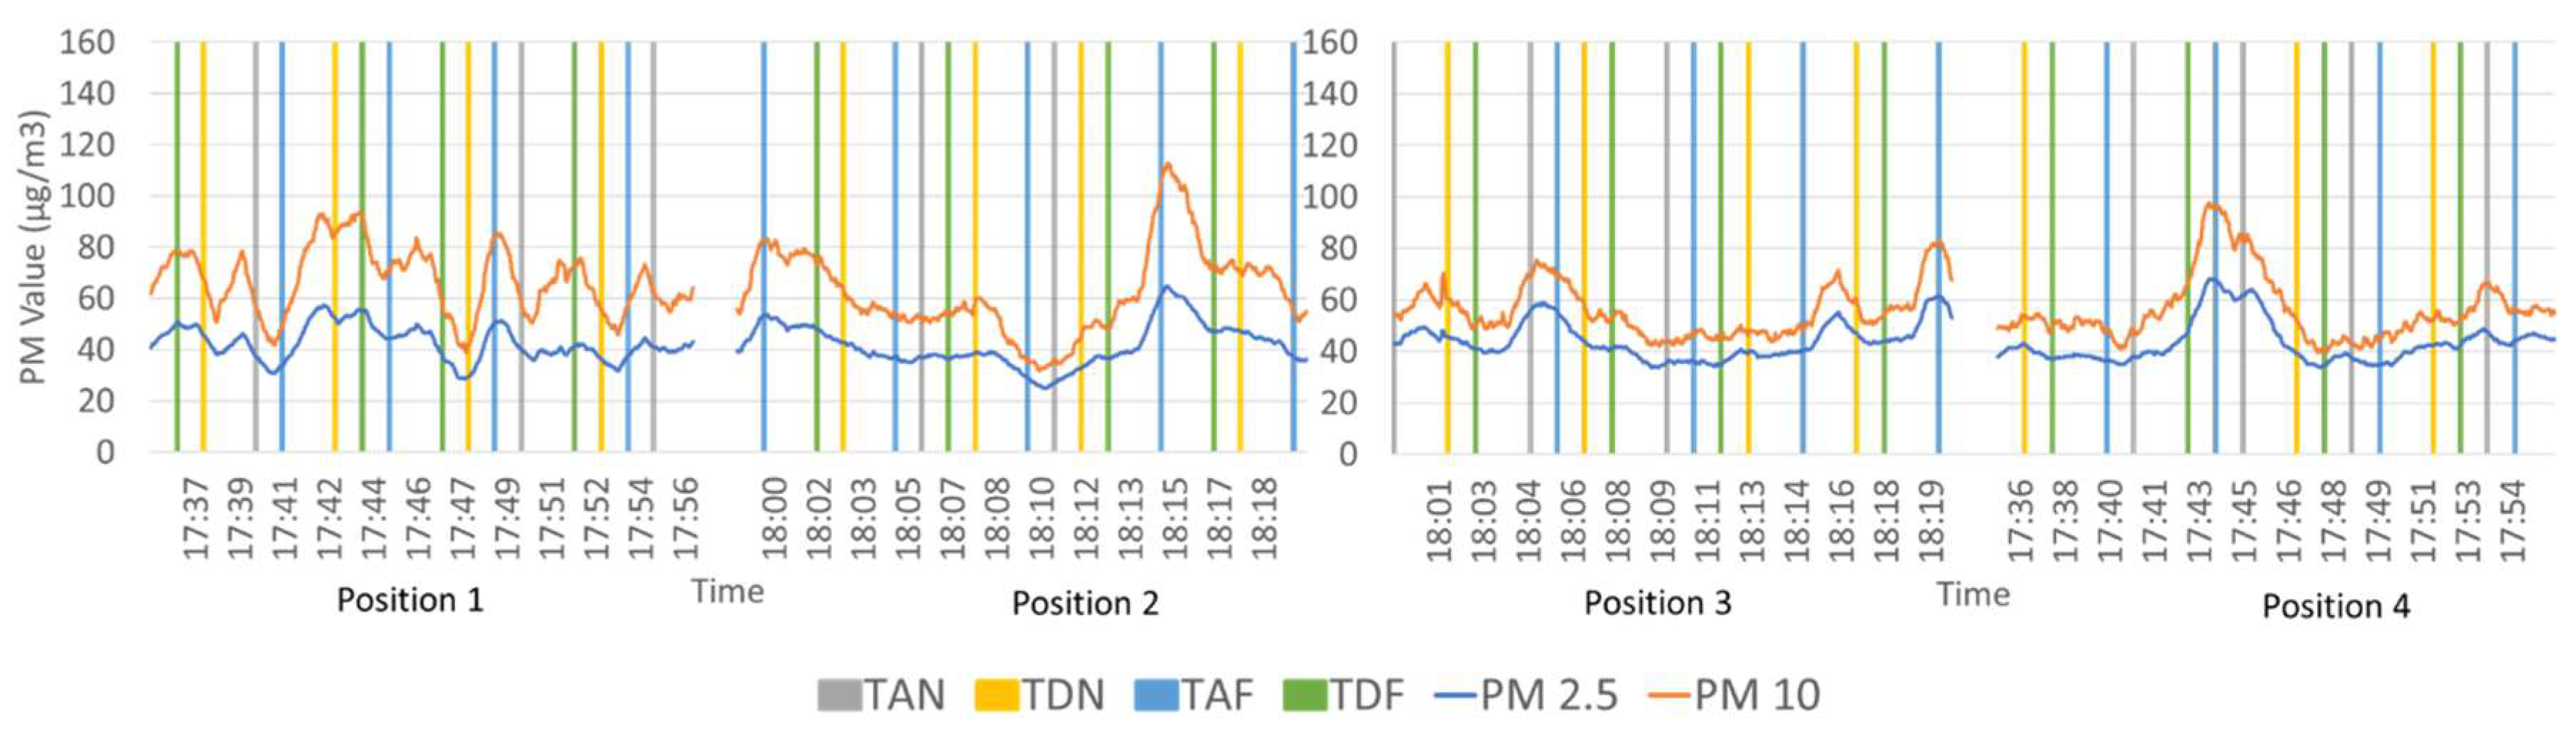
Figure A6.
Concentration profiles of PM2.5 and PM10 on different positions on Line 5 on a weekday [15th August 2019].
Figure A6.
Concentration profiles of PM2.5 and PM10 on different positions on Line 5 on a weekday [15th August 2019].
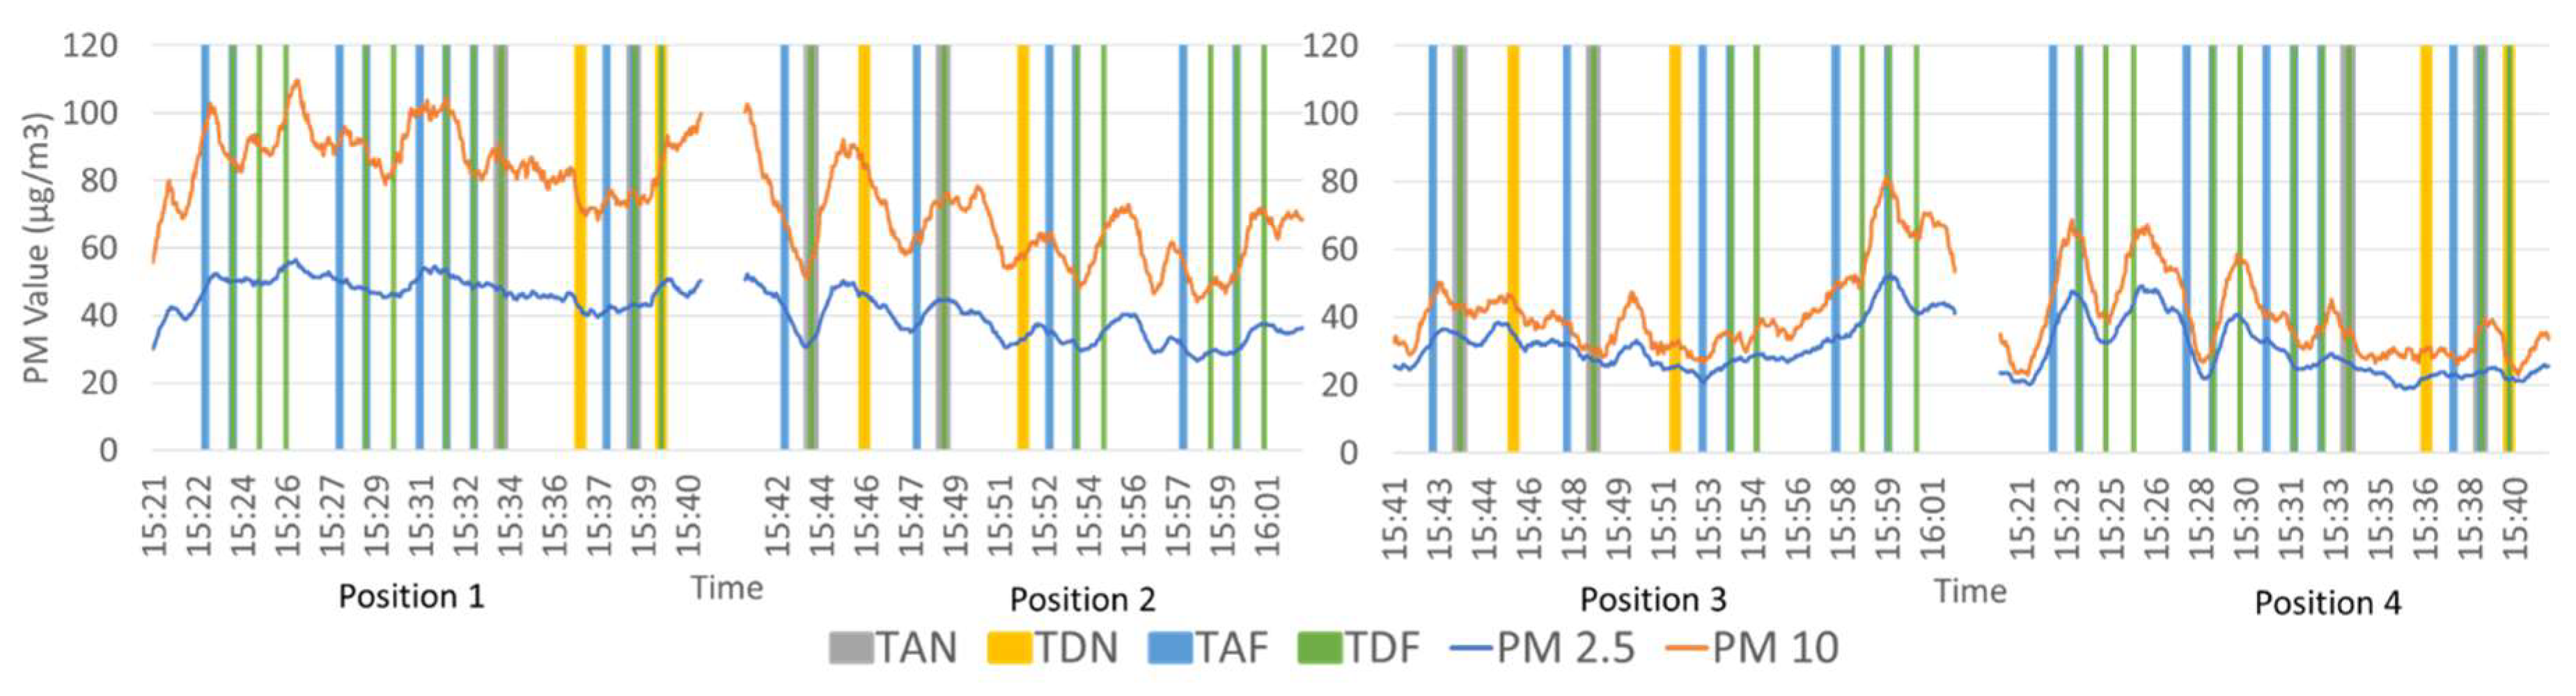
Figure A7.
Concentration profiles of PM2.5 and PM10 on different positions on Line 5 on a weekend [17th August 2019].
Figure A7.
Concentration profiles of PM2.5 and PM10 on different positions on Line 5 on a weekend [17th August 2019].
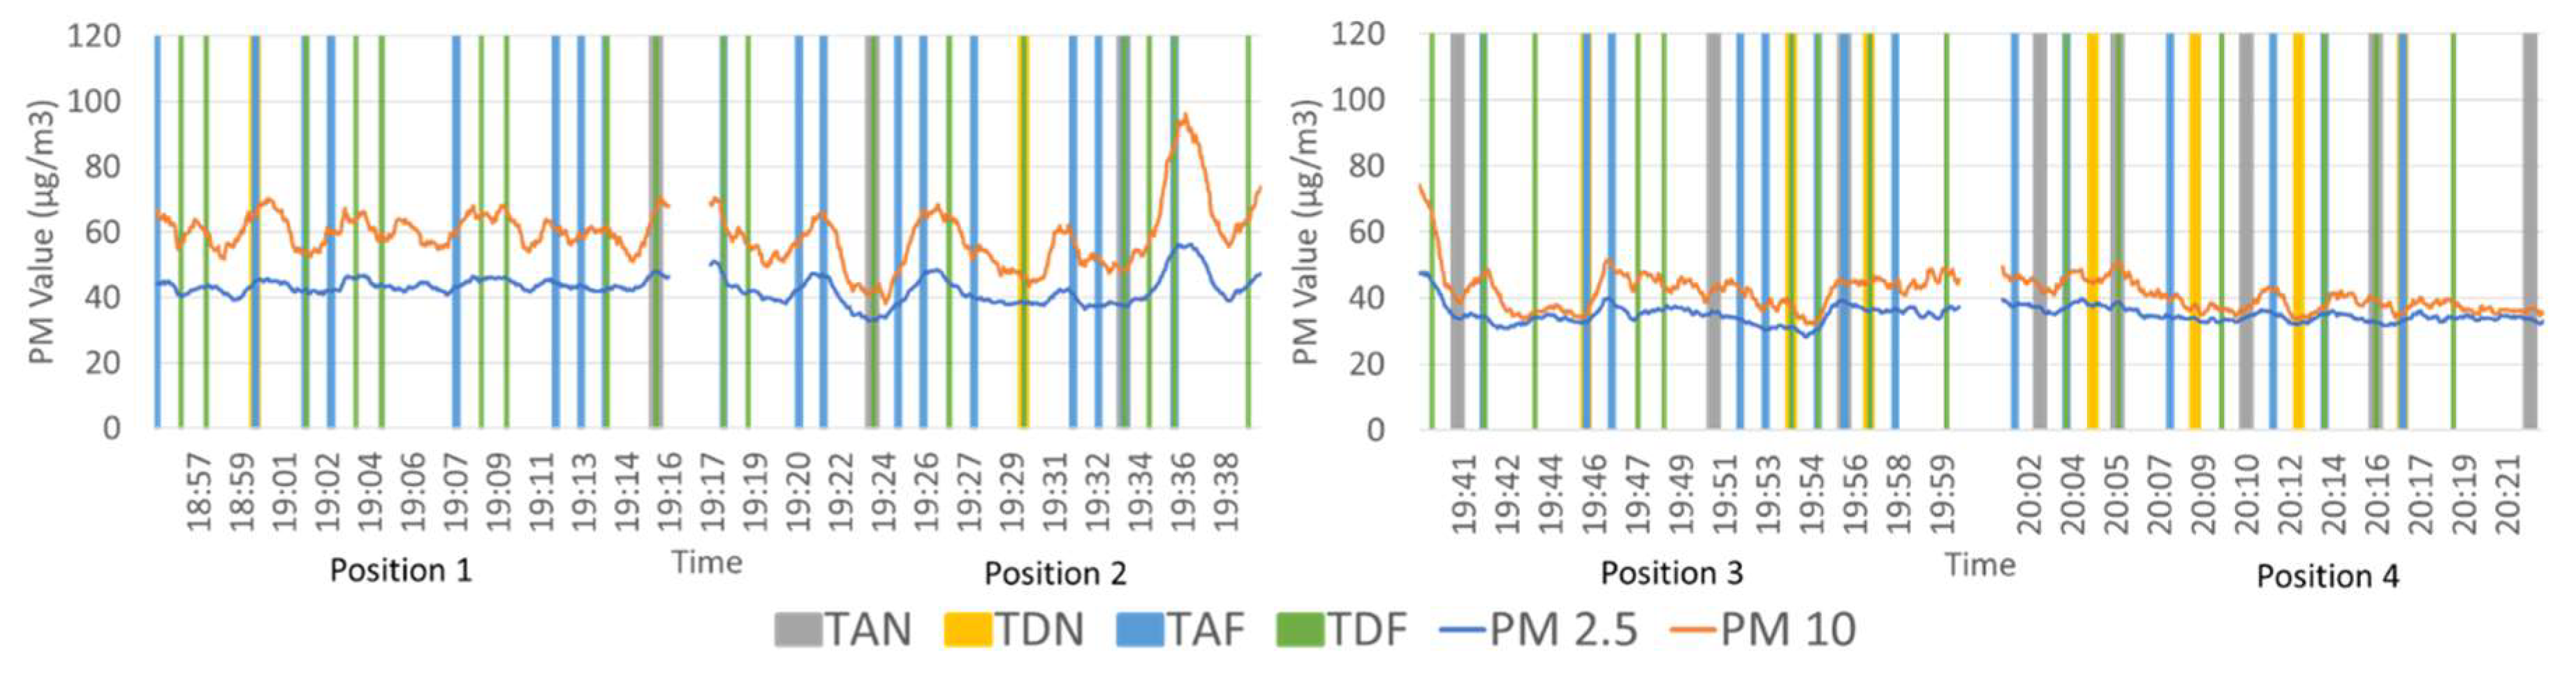
Figure A8.
Concentration profiles of PM2.5 and PM10 on different positions on Line 6 on a weekday [15th August 2019].
Figure A8.
Concentration profiles of PM2.5 and PM10 on different positions on Line 6 on a weekday [15th August 2019].
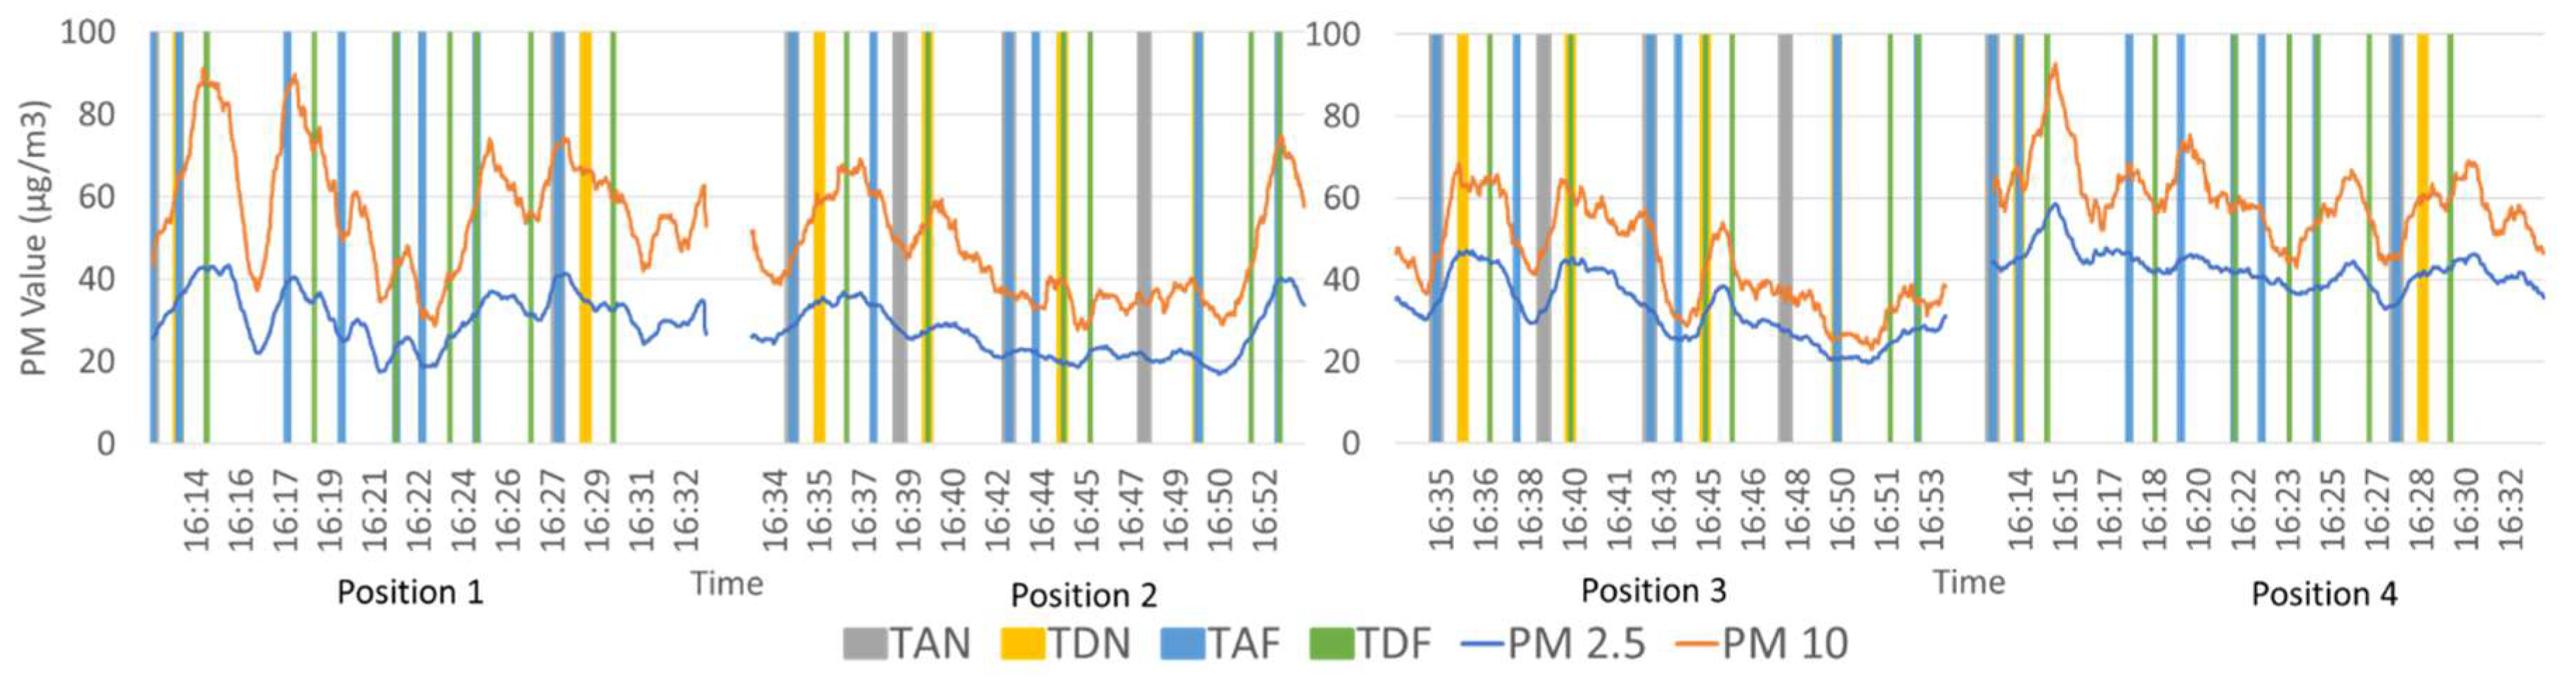
Figure A9.
Concentration profiles of PM2.5 and PM10 on different positions on Line 6 on a weekend [17th August 2019].
Figure A9.
Concentration profiles of PM2.5 and PM10 on different positions on Line 6 on a weekend [17th August 2019].
References
- Sundell, J. On the History of Indoor Air Quality and Health History. Indoor Air 2004, 14, 51–58. [Google Scholar] [CrossRef] [PubMed]
- Centnerová, L.H. On the History of Indoor Environment and It’s Relation to Health and Wellbeing. REHVA Journal 2018, 55, 14–20. [Google Scholar]
- Brunekreef, B.; Holgate, S.T. Air Pollution and Health. The Lancet 2002, 360, 1233–1242. [Google Scholar] [CrossRef] [PubMed]
- Datta, A.; Suresh, R.; Gupta, A.; Singh, D.; Kulshrestha, P. Indoor Air Quality of Non-Residential Urban Buildings in Delhi, India. International Journal of Sustainable Built Environment 2017, 6, 412–420. [Google Scholar] [CrossRef]
- Baek, S.O.; Kim, Y.S.; Perry, R. Indoor Air Quality in Homes, Offices and Restaurants in Korean Urban Areas—Indoor/Outdoor Relationships. Atmos Environ 1997, 31, 529–544. [Google Scholar] [CrossRef]
- Int Panis, L.; de Geus, B.; Vandenbulcke, G.; Willems, H.; Degraeuwe, B.; Bleux, N.; Mishra, V.; Thomas, I.; Meeusen, R. Exposure to Particulate Matter in Traffic: A Comparison of Cyclists and Car Passengers. Atmos Environ 2010, 44, 2263–2270. [Google Scholar] [CrossRef]
- de Nazelle, A.; Fruin, S.; Westerdahl, D.; Martinez, D.; Ripoll, A.; Kubesch, N.; Nieuwenhuijsen, M. A Travel Mode Comparison of Commuters’ Exposures to Air Pollutants in Barcelona. Atmos Environ 2012, 59, 151–159. [Google Scholar] [CrossRef]
- Martins, V.; Moreno, T.; Minguillón, M.C.; Amato, F.; de Miguel, E.; Capdevila, M.; Querol, X. Exposure to Airborne Particulate Matter in the Subway System. Science of The Total Environment 2015, 511, 711–722. [Google Scholar] [CrossRef]
- Rivas, I.; Kumar, P.; Hagen-Zanker, A. Exposure to Air Pollutants during Commuting in London: Are There Inequalities among Different Socio-Economic Groups? Environ Int 2017, 101, 143–157. [Google Scholar] [CrossRef]
- Adams, H.S.; Nieuwenhuijsen, M.J.; Colvile, R.N.; McMullen, M.A.S.; Khandelwal, P. Fine Particle (PM2.5) Personal Exposure Levels in Transport Microenvironments, London, UK. Science of The Total Environment 2001, 279, 29–44. [Google Scholar] [CrossRef]
- Jung, H.J.; Kim, B.W.; Malek, M.A.; Koo, Y.S.; Jung, J.H.; Son, Y.S.; Kim, J.C.; Kim, H.K.; Ro, C.U. Chemical Speciation of Size-Segregated Floor Dusts and Airborne Magnetic Particles Collected at Underground Subway Stations in Seoul, Korea. J Hazard Mater 2012, 213–214, 331–340. [Google Scholar] [CrossRef] [PubMed]
- Mugica-Álvarez, V.; Figueroa-Lara, J.; Romero-Romo, M.; Sepúlvea-Sánchez, J.; López-Moreno, T. Concentrations and Properties of Airborne Particles in the Mexico City Subway System. Atmos Environ 2012, 49, 284–293. [Google Scholar] [CrossRef]
- Martins, V.; Moreno, T.; Minguillón, M.C.; Van Drooge, B.L.; Reche, C.; Amato, F.; De Miguel, E.; Capdevila, M.; Centelles, S.; Querol, X. Origin of Inorganic and Organic Components of PM2.5 in Subway Stations of Barcelona, Spain. Environmental Pollution 2016, 208, 125–136. [Google Scholar] [CrossRef] [PubMed]
- Sitzmann, B.; Kendall, M.; Watt, J.; Williams, I. Characterisation of Airborne Particles in London by Computer-Controlled Scanning Electron Microscopy. Science of The Total Environment 1999, 241, 63–73. [Google Scholar] [CrossRef]
- Xu, B.; Yu, X.; Gu, H.; Miao, B.; Wang, M.; Huang, H. Commuters’ Exposure to PM2.5 and CO2 in Metro Carriages of Shanghai Metro System. Transp Res D Transp Environ 2016, 47, 162–170. [Google Scholar] [CrossRef]
- Qiao, T.; Xiu, G.; Zheng, Y.; Yang, J.; Wang, L.; Yang, J.; Huang, Z. Preliminary Investigation of PM1, PM2.5, PM10 and Its Metal Elemental Composition in Tunnels at a Subway Station in Shanghai, China. Transp Res D Transp Environ 2015, 41, 136–146. [Google Scholar] [CrossRef]
- Lu, S.; Liu, D.; Zhang, W.; Liu, P.; Fei, Y.; Gu, Y.; Wu, M.; Yu, S.; Yonemochi, S.; Wang, X.; et al. Physico-Chemical Characterization of PM2.5 in the Microenvironment of Shanghai Subway. Atmos Res 2015, 153, 543–552. [Google Scholar] [CrossRef]
- Kim, K.Y.; Kim, Y.S.; Roh, Y.M.; Lee, C.M.; Kim, C.N. Spatial Distribution of Particulate Matter (PM10 and PM2.5) in Seoul Metropolitan Subway Stations. J Hazard Mater 2008, 154, 440–443. [Google Scholar] [CrossRef]
- Park, D.U.; Ha, K.C. Characteristics of PM10, PM2.5, CO2 and CO Monitored in Interiors and Platforms of Subway Train in Seoul, Korea. Environ Int 2008, 34, 629–634. [Google Scholar] [CrossRef]
- Vilcassim, M.J.R.; Thurston, G.D.; Peltier, R.E.; Gordon, T. Black Carbon and Particulate Matter (PM2.5) Concentrations in New York City’s Subway Stations. Environ Sci Technol 2014, 48, 14738–14745. [Google Scholar] [CrossRef]
- Wang, X.R.; Oliver Gao, H. Exposure to Fine Particle Mass and Number Concentrations in Urban Transportation Environments of New York City. Transp Res D Transp Environ 2011, 16, 384–391. [Google Scholar] [CrossRef]
- Kam, W.; Cheung, K.; Daher, N.; Sioutas, C. Particulate Matter (PM) Concentrations in Underground and Ground-Level Rail Systems of the Los Angeles Metro. Atmos Environ 2011, 45, 1506–1516. [Google Scholar] [CrossRef]
- Pan, S.; Fan, L.; Liu, J.; Xie, J.; Sun, Y.; Cui, N.; Zhang, L.; Zheng, B. A Review of the Piston Effect in Subway Stations. https://doi.org/10.1155/2013/950205 2013, 2013. [CrossRef]
- Ishigaki, Y.; Tanaka, K.; Pradana, H.A.; Matsumoto, Y.; Maruo, Y.Y. Citizen Sensing for Environmental Risk Communication. CYBER 2017.
- Keio Corporation Shibuya Station Map.
- Moreno, T.; Reche, C.; Minguillón, M.C.; Capdevila, M.; de Miguel, E.; Querol, X. The Effect of Ventilation Protocols on Airborne Particulate Matter in Subway Systems. Science of The Total Environment 2017, 584–585, 1317–1323. [Google Scholar] [CrossRef] [PubMed]
- Yang, L.; Zhang, Y.; Xia, J. Case Study of Train-Induced Airflow inside Underground Subway Stations with Simplified Field Test Methods. Sustain Cities Soc 2018, 37, 275–287. [Google Scholar] [CrossRef]
- Ripanucci, G.; Grana, M.; Vicentini, L.; Magrini, A.; Bergamaschi, A. Dust in the Underground Railway Tunnels of an Italian Town. J Occup Environ Hyg 2006, 3, 16–25. [Google Scholar] [CrossRef]
- Nieuwenhuijsen, M.J.; Gómez-Perales, J.E.; Colvile, R.N. Levels of Particulate Air Pollution, Its Elemental Composition, Determinants and Health Effects in Metro Systems. Atmos Environ 2007, 41, 7995–8006. [Google Scholar] [CrossRef]
- Miskell, G.; Salmond, J.A.; Williams, D.E. Use of a Handheld Low-Cost Sensor to Explore the Effect of Urban Design Features on Local-Scale Spatial and Temporal Air Quality Variability. Science of The Total Environment 2018, 619–620, 480–490. [Google Scholar] [CrossRef]
- Moreno, T.; Pérez, N.; Reche, C.; Martins, V.; de Miguel, E.; Capdevila, M.; Centelles, S.; Minguillón, M.C.; Amato, F.; Alastuey, A.; et al. Subway Platform Air Quality: Assessing the Influences of Tunnel Ventilation, Train Piston Effect and Station Design. Atmos Environ 2014, 92, 461–468. [Google Scholar] [CrossRef]
- Kwon, S.B.; Jeong, W.; Park, D.; Kim, K.T.; Cho, K.H. A Multivariate Study for Characterizing Particulate Matter (PM10, PM2.5, and PM1) in Seoul Metropolitan Subway Stations, Korea. J Hazard Mater 2015, 297, 295–303. [Google Scholar] [CrossRef]
- Martins, V.; Minguillón, M.C.; Moreno, T.; Mendes, L.; Eleftheriadis, K.; Alves, C.A.; Querol, E. de M. and X.; Martins, V.; Minguillón, M.C.; Moreno, T.; et al. Characterisation of Airborne Particulate Matter in Different European Subway Systems. Urban Transport Systems 2017. [Google Scholar] [CrossRef]
- Wen, Y.; Leng, J.; Shen, X.; Han, G.; Sun, L.; Yu, F. Environmental and Health Effects of Ventilation in Subway Stations: A Literature Review. International Journal of Environmental Research and Public Health 2020, Vol. 17, Page 1084 2020, 17, 1084. [Google Scholar] [CrossRef] [PubMed]
- Wang, Q. Urbanization and Global Health: The Role of Air Pollution. Iran J Public Health 2018, 47, 1644. [Google Scholar] [PubMed]
- Barmparesos, N.; Assimakopoulos, V.D.; Assimakopoulos, M.N.; Tsairidi, E. Particulate Matter Levels and Comfort Conditions in the Trains and Platforms of the Athens Underground Metro. AIMS Environ Sci 2016, 3, 199–219. [Google Scholar] [CrossRef]
- Pan, S.; Du, S.; Wang, X.; Zhang, X.; Xia, L.; Liu, J.; Pei, F.; Wei, Y. Analysis and Interpretation of the Particulate Matter (PM10 and PM2.5) Concentrations at the Subway Stations in Beijing, China. Sustain Cities Soc 2019, 45, 366–377. [Google Scholar] [CrossRef]
- Gerber, A.; Bohn, J.; Groneberg, D.A.; Schulze, J.; Bundschuh, M. Airborne Particulate Matter in Public Transport: A Field Study at Major Intersection Points in Frankfurt Am Main (Germany). Journal of Occupational Medicine and Toxicology 2014, 9, 1–4. [Google Scholar] [CrossRef]
- Aarnio, P.; Yli-Tuomi, T.; Kousa, A.; Mäkelä, T.; Hirsikko, A.; Hämeri, K.; Räisänen, M.; Hillamo, R.; Koskentalo, T.; Jantunen, M. The Concentrations and Composition of and Exposure to Fine Particles (PM2.5) in the Helsinki Subway System. Atmos Environ 2005, 39, 5059–5066. [Google Scholar] [CrossRef]
- Yang, F.; Kaul, D.; Wong, K.C.; Westerdahl, D.; Sun, L.; Ho, K.f.; Tian, L.; Brimblecombe, P.; Ning, Z. Heterogeneity of Passenger Exposure to Air Pollutants in Public Transport Microenvironments. Atmos Environ 2015, 109, 42–51. [Google Scholar] [CrossRef]
- Şahin, Ü.A.; Onat, B.; Stakeeva, B.; Ceran, T.; Karim, P. PM10 Concentrations and the Size Distribution of Cu and Fe-Containing Particles in Istanbul’s Subway System. Transp Res D Transp Environ 2012, 17, 48–53. [Google Scholar] [CrossRef]
- Onat, B.; Stakeeva, B. Assessment of Fine Particulate Matters in the Subway System of Istanbul. Indoor and Built Environment 2014, 23, 574–583, doi:10.1177/1420326X12464507/ASSET/IMAGES/LARGE/10.1177_1420326X12464507-FIG8.JPEG.
- Cartenì, A.; Cascetta, F.; Campana, S. Underground and Ground-Level Particulate Matter Concentrations in an Italian Metro System. Atmos Environ 2015, 101, 328–337. [Google Scholar] [CrossRef]
- Ramos, M.J.; Vasconcelos, A.; Faria, M. Comparison of Particulate Matter Inhalation for Users of Different Transport Modes in Lisbon. In Proceedings of the Transportation Research Procedia; Elsevier, 2015; Vol. 10, pp. 433–442.
- Vallejo, M.; Lerma, C.; Infante, O.; Hermosillo, A.G.; Riojas-Rodriguez, H.; Cardenas, M. Personal Exposure to Particulate Matter Less than 2.5 Μm in Mexico City: A Pilot Study. Journal of Exposure Science & Environmental Epidemiology 2004, 14, 323–329. [Google Scholar] [CrossRef]
- Van Ryswyk, K.; Anastasopolos, A.T.; Evans, G.; Sun, L.; Sabaliauskas, K.; Kulka, R.; Wallace, L.; Weichenthal, S. Metro Commuter Exposures to Particulate Air Pollution and PM2.5-Associated Elements in Three Canadian Cities: The Urban Transportation Exposure Study. Environ Sci Technol 2017, 51, 5713–5720, doi:10.1021/ACS.EST.6B05775/ASSET/IMAGES/ES-2016-05775P_M004.GIF.
- Branǐ, M. The Contribution of Ambient Sources to Particulate Pollution in Spaces and Trains of the Prague Underground Transport System. Atmos Environ 2006, 40, 348–356. [Google Scholar] [CrossRef]
- Kim, M.; Sankararao, B.; Kang, O.; Kim, J.; Yoo, C. Monitoring and Prediction of Indoor Air Quality (IAQ) in Subway or Metro Systems Using Season Dependent Models. Energy Build 2012, 46, 48–55. [Google Scholar] [CrossRef]
- Ye, X.; Lian, Z.; Jiang, C.; Zhou, Z.; Chen, H. Investigation of Indoor Environmental Quality in Shanghai Metro Stations, China. Environ Monit Assess 2010, 167, 643–651. [Google Scholar] [CrossRef] [PubMed]
- Johansson, C.; Johansson, P.Å. Particulate Matter in the Underground of Stockholm. Atmos Environ 2003, 37, 3–9. [Google Scholar] [CrossRef]
- Mohsen, M.; Ahmed, M.B.; Zhou, J.L. Particulate Matter Concentrations and Heavy Metal Contamination Levels in the Railway Transport System of Sydney, Australia. Transp Res D Transp Environ 2018, 62, 112–124. [Google Scholar] [CrossRef]
- Bolourchi, A.; Atabi, F.; Moattar, F.; Ehyaei, M.A. Experimental and Numerical Analyses of Particulate Matter Concentrations in Underground Subway Station. International Journal of Environmental Science and Technology 2018, 15, 2569–2580. [Google Scholar] [CrossRef]
- Cheng, Y.H.; Lin, Y.L.; Liu, C.C. Levels of PM10 and PM2.5 in Taipei Rapid Transit System. Atmos Environ 2008, 42, 7242–7249. [Google Scholar] [CrossRef]
- Cheng, Y.H.; Liu, Z.S.; Yan, J.W. Comparisons of PM10, PM2.5, Particle Number, and CO2 Levels inside Metro Trains between Traveling in Underground Tunnels and on Elevated Tracks. Aerosol Air Qual Res 2012, 12, 879–891. [Google Scholar] [CrossRef]
- Chen, Y.Y.; Sung, F.C.; Chen, M.L.; Mao, I.F.; Lu, C.Y. Indoor Air Quality in the Metro System in North Taiwan. International Journal of Environmental Research and Public Health 2016, 13, 1200. [Google Scholar] [CrossRef]
Figure 1.
(a) Portable Sensor used in this research; (b) Measuring PM 2.5 and PM 10 using portable sensor at the underground metro platform.
Figure 1.
(a) Portable Sensor used in this research; (b) Measuring PM 2.5 and PM 10 using portable sensor at the underground metro platform.
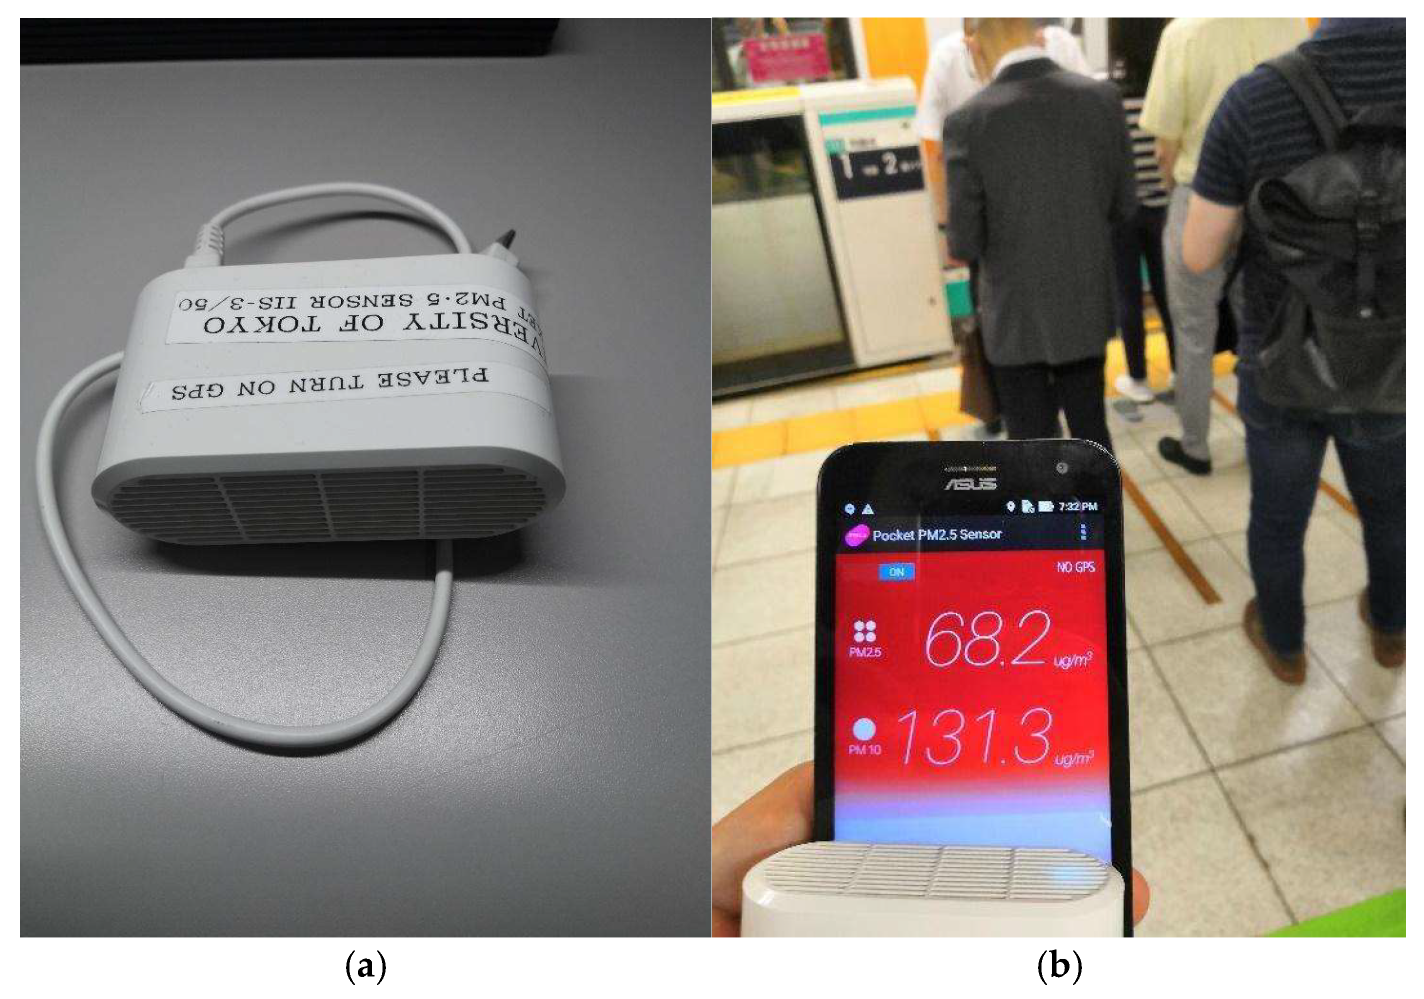
Figure 2.
Map of Shibuya Station as of 2019, with the name of Lines anonymized [25].
Figure 2.
Map of Shibuya Station as of 2019, with the name of Lines anonymized [25].
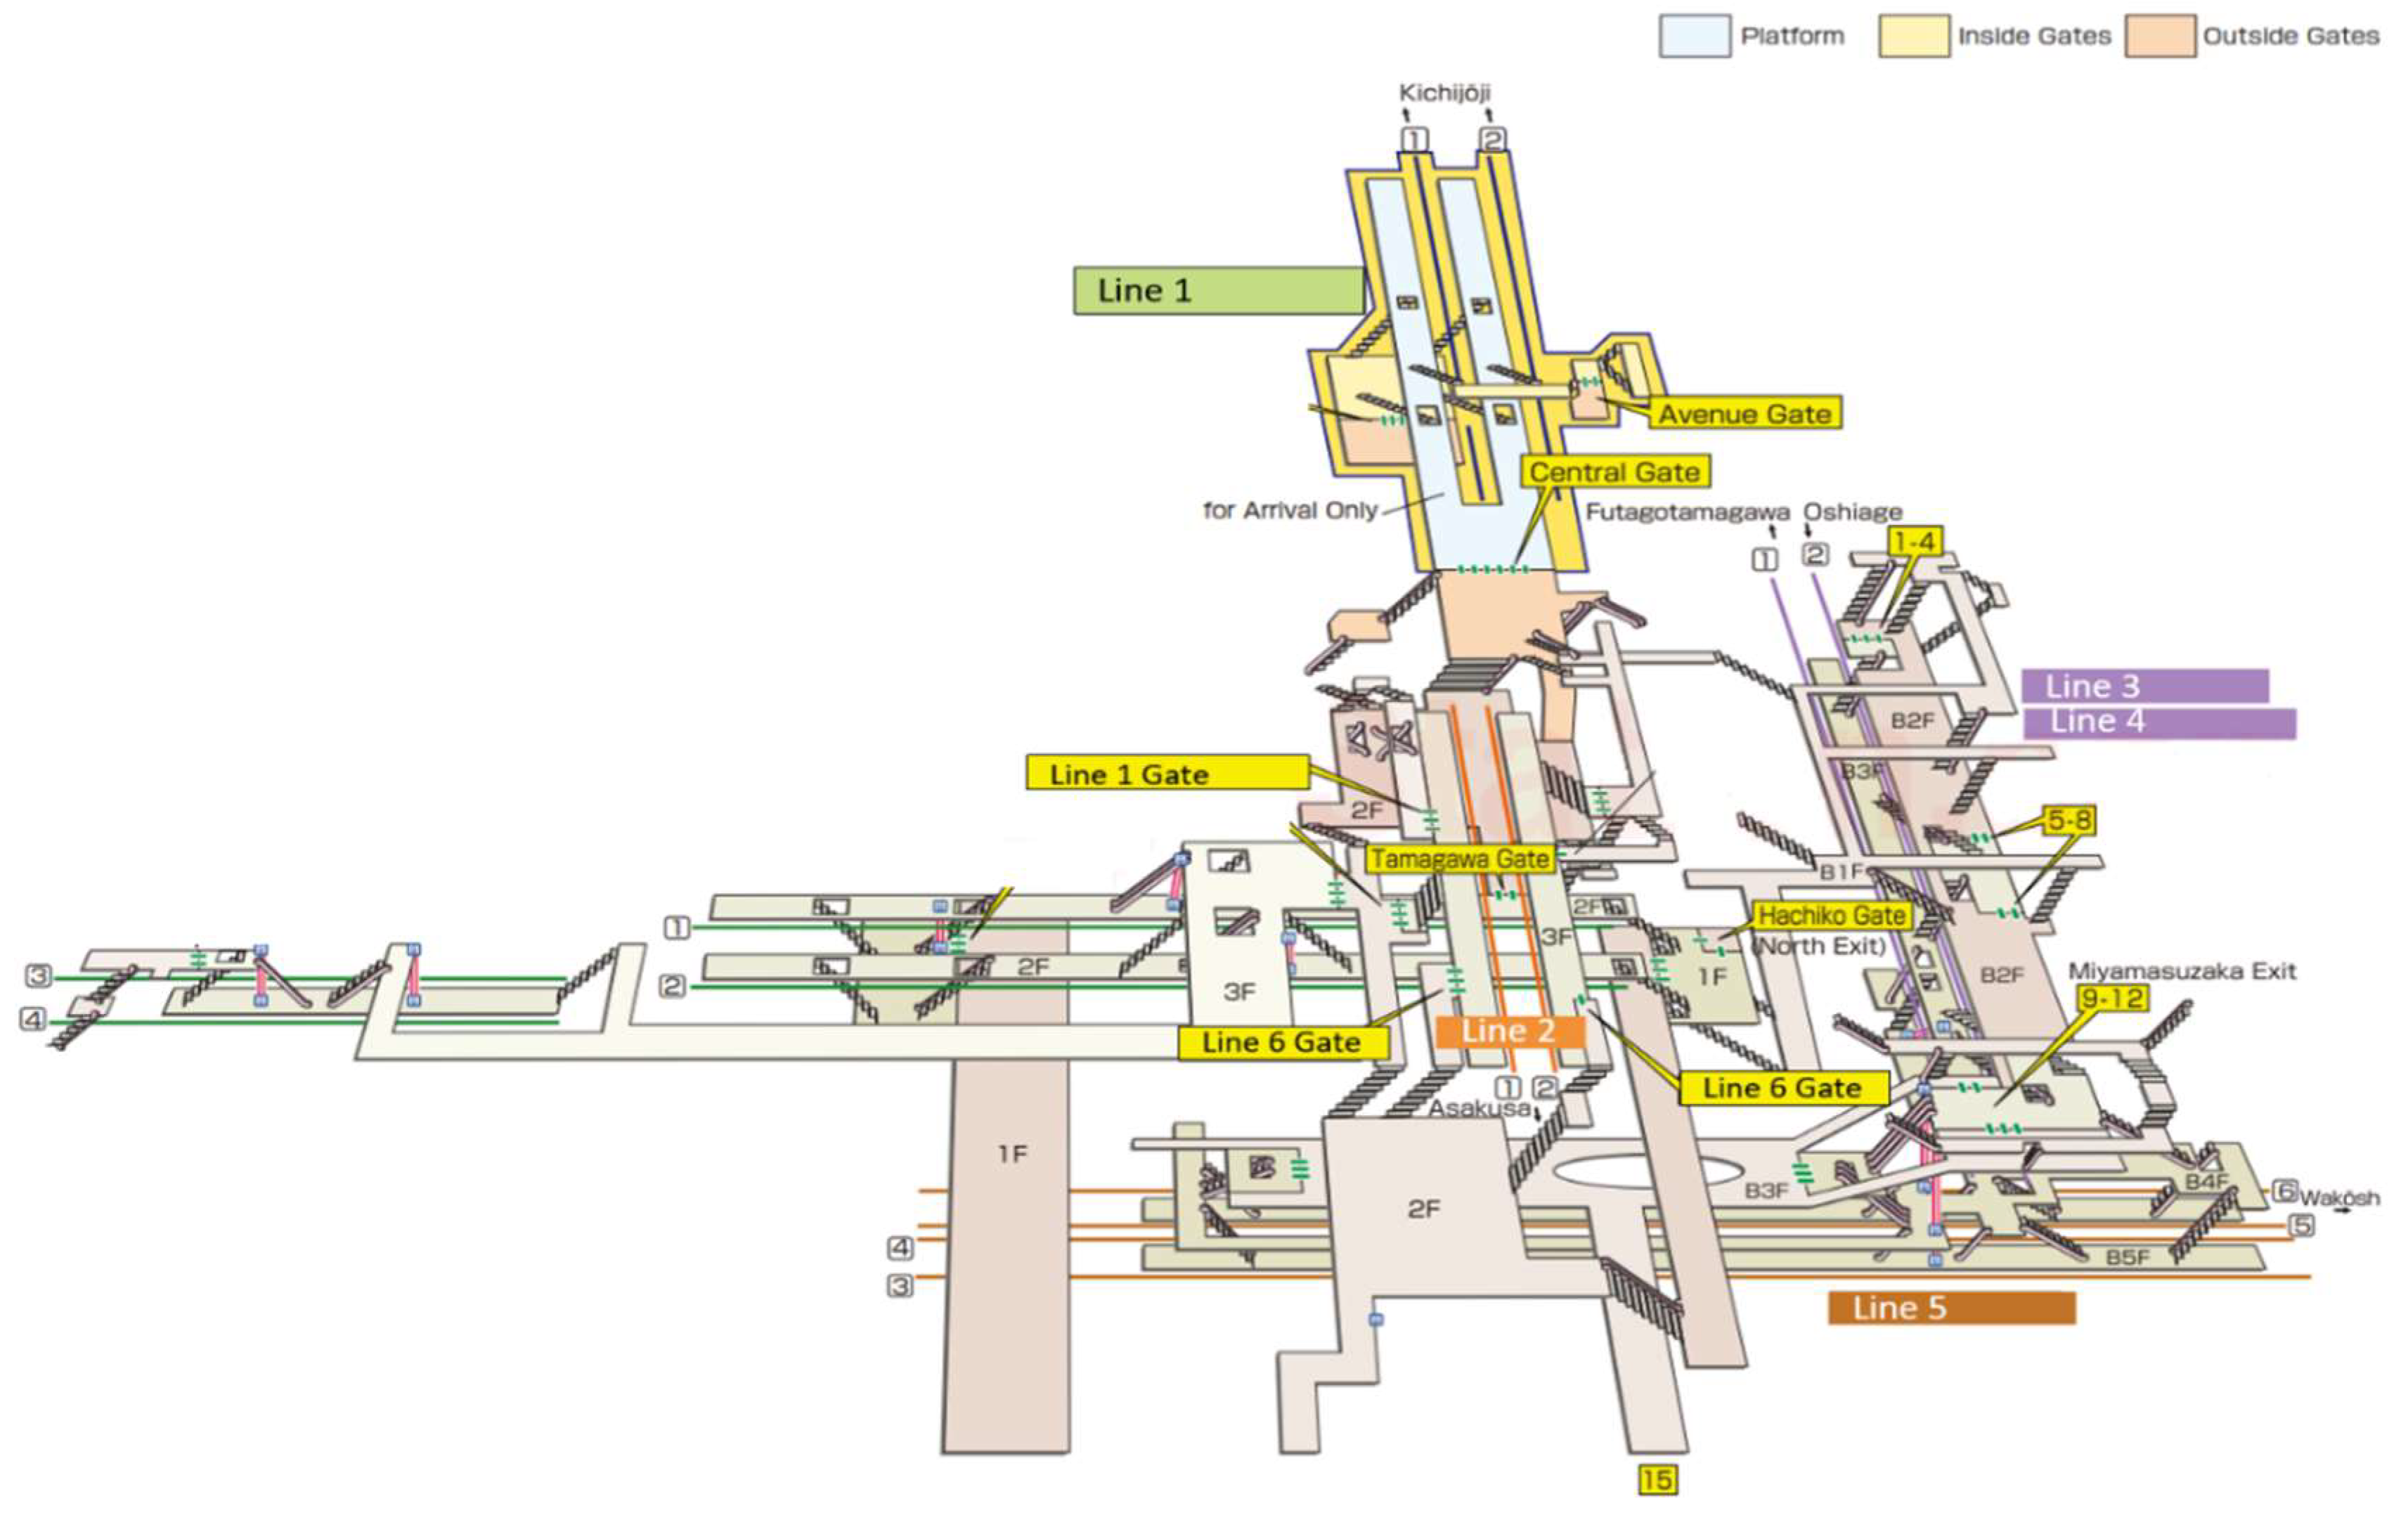
Figure 3.
Plan view of Line 1.
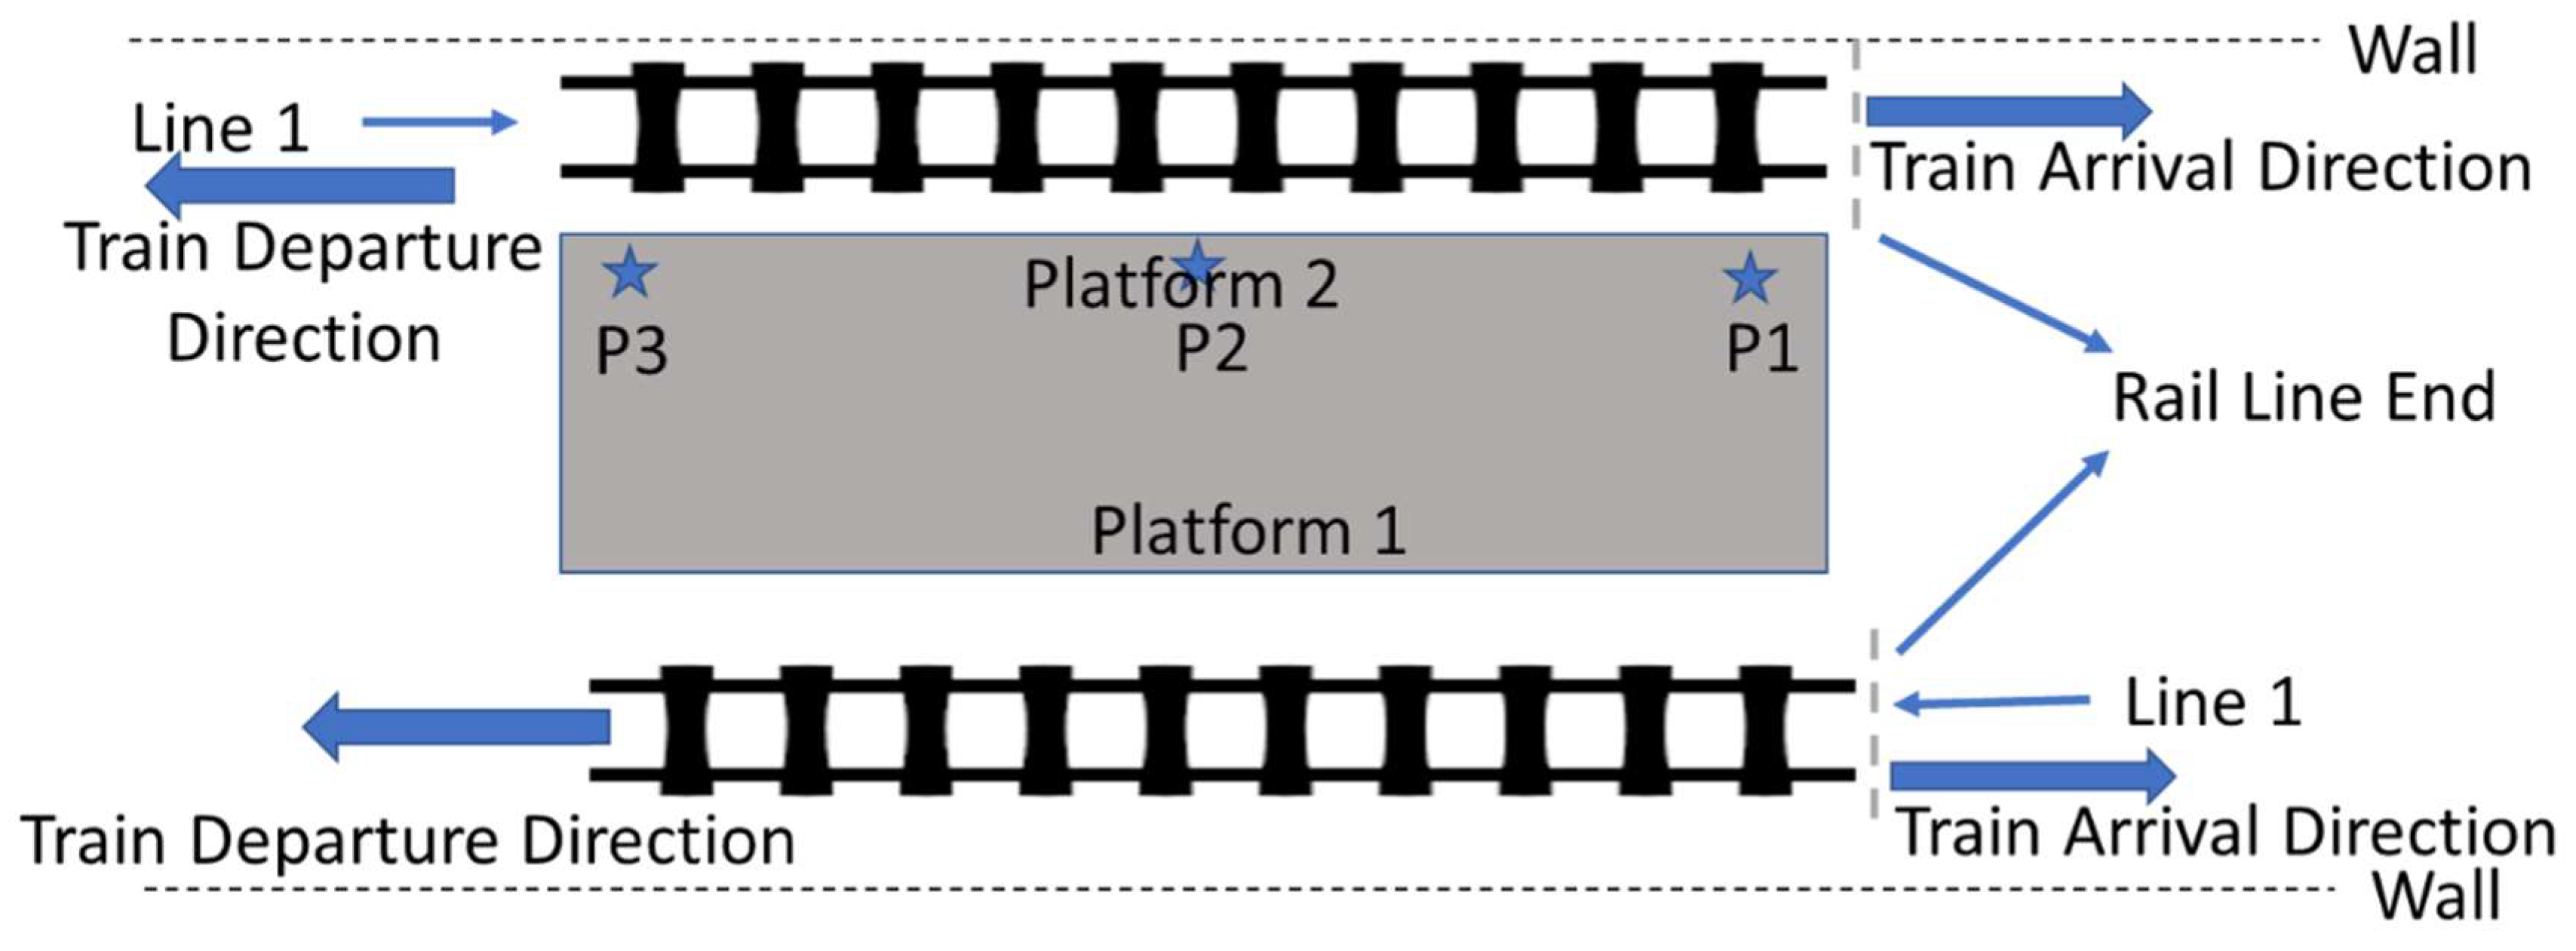
Figure 4.
Plan view of Line 2.
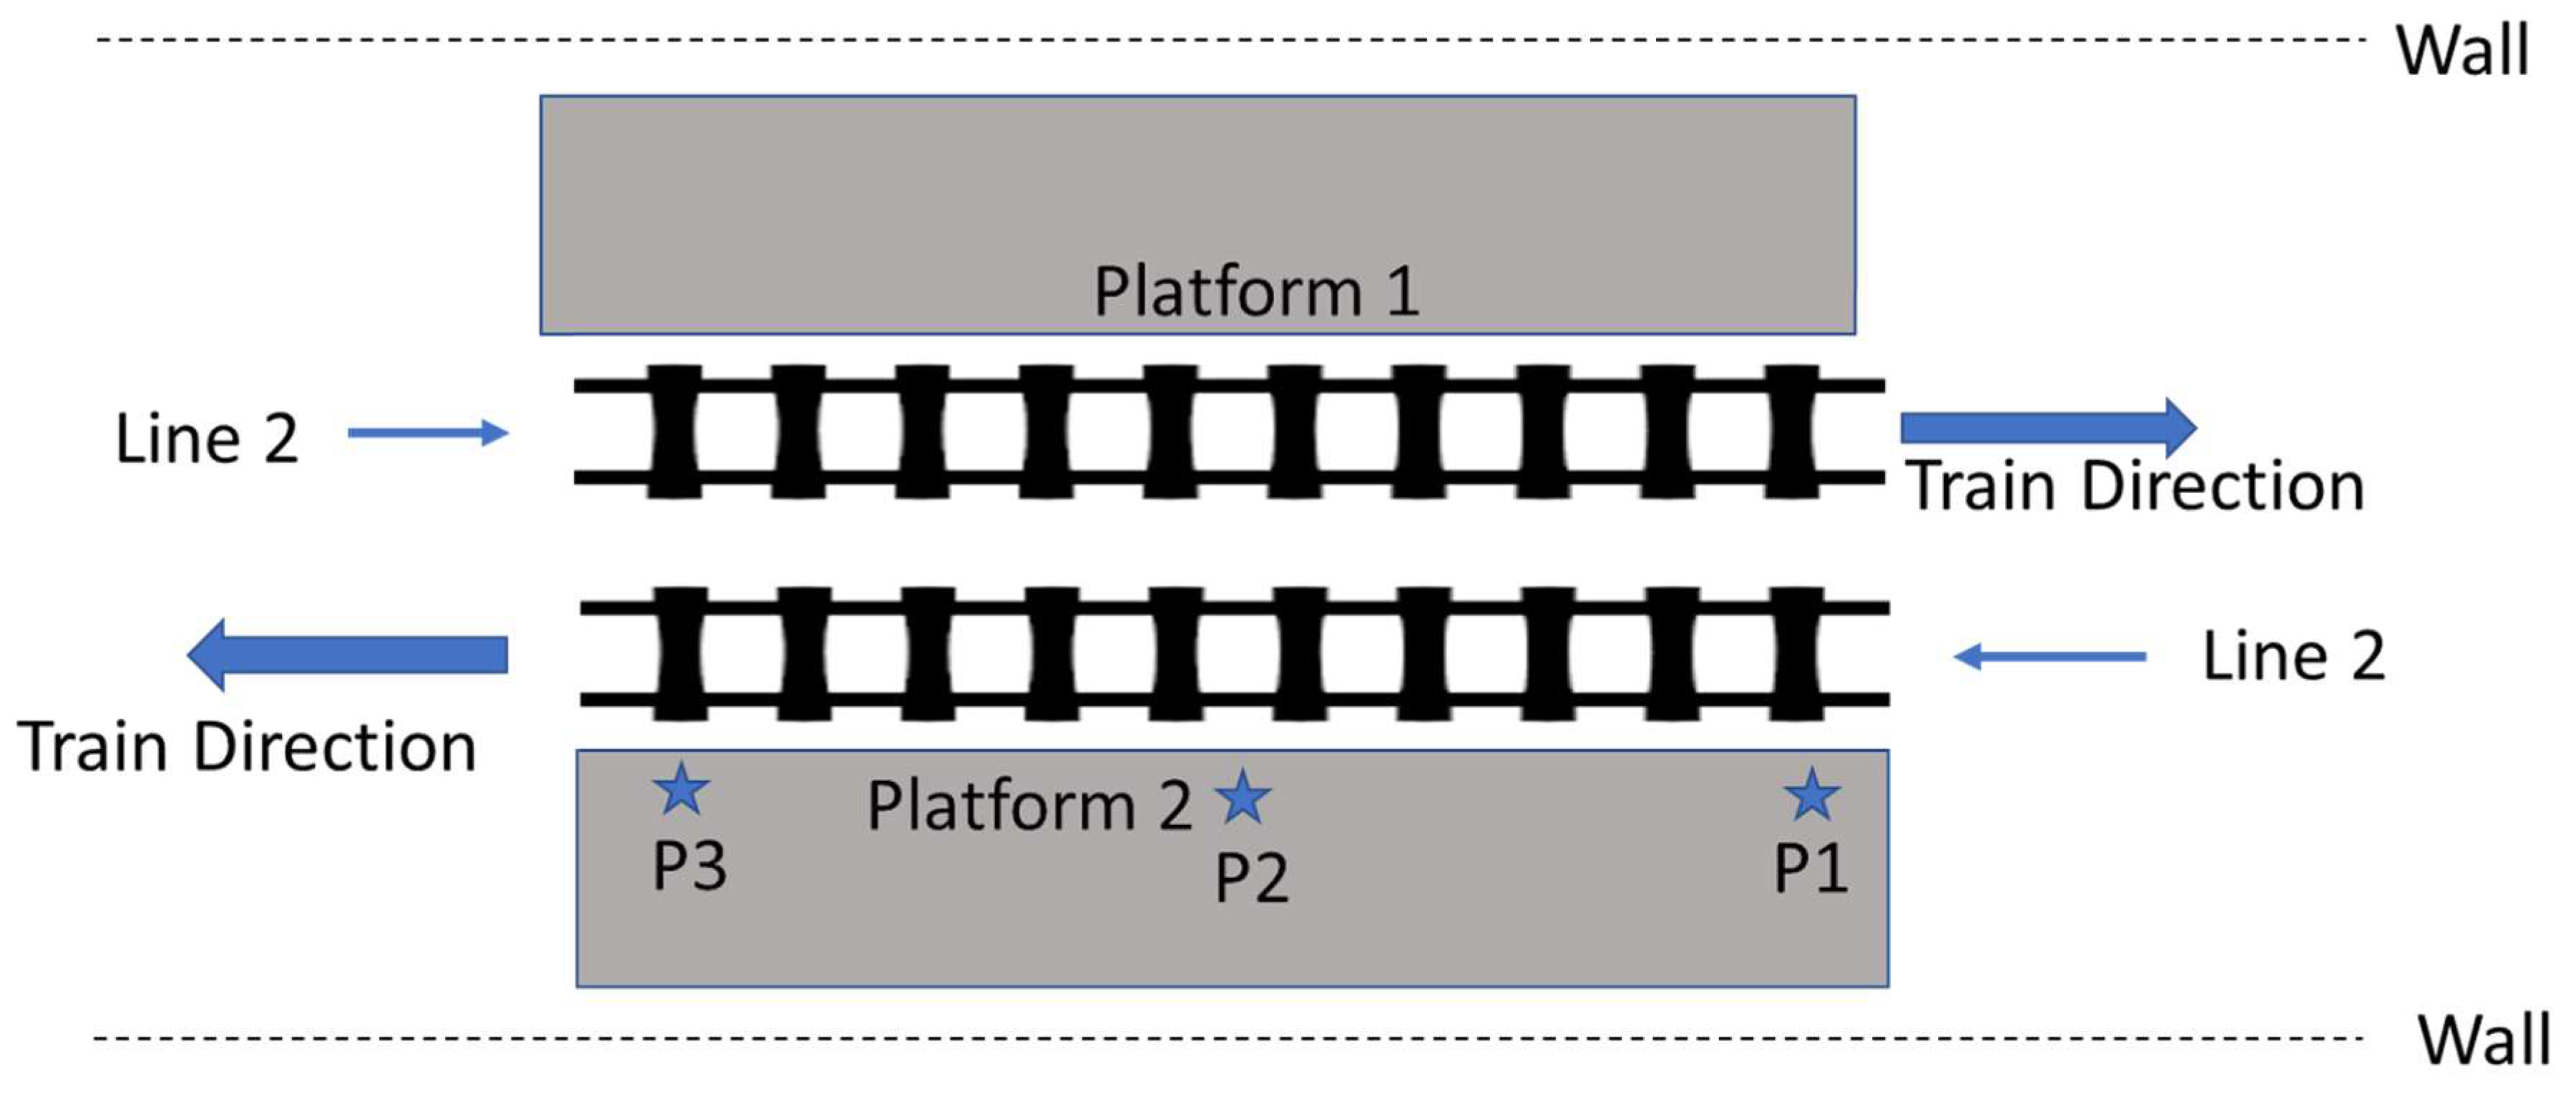
Figure 5.
Plan view of Line 3 and 4.
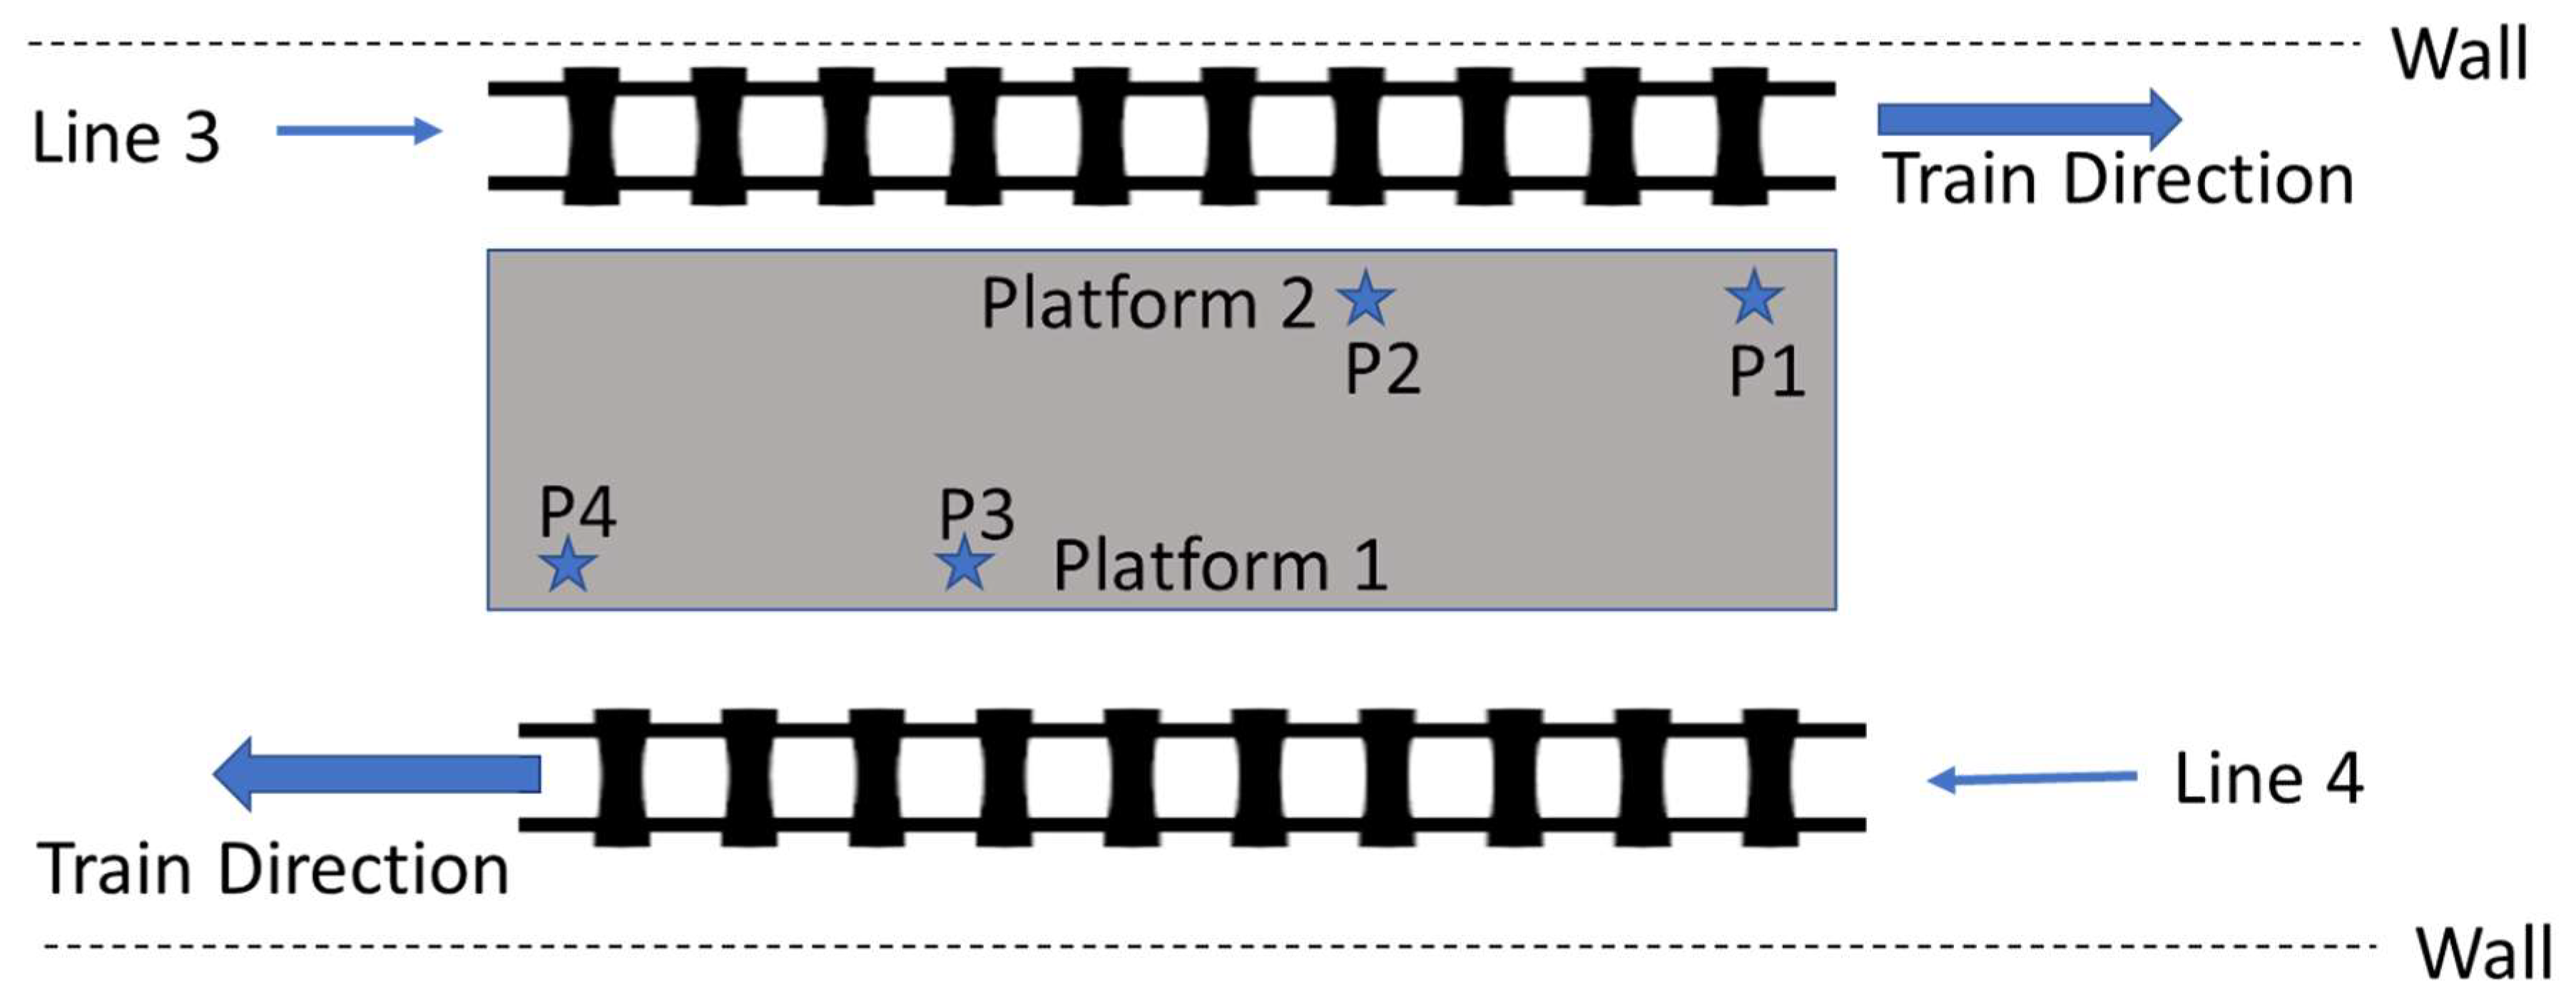
Figure 6.
Plan view of Line 5 and 6.
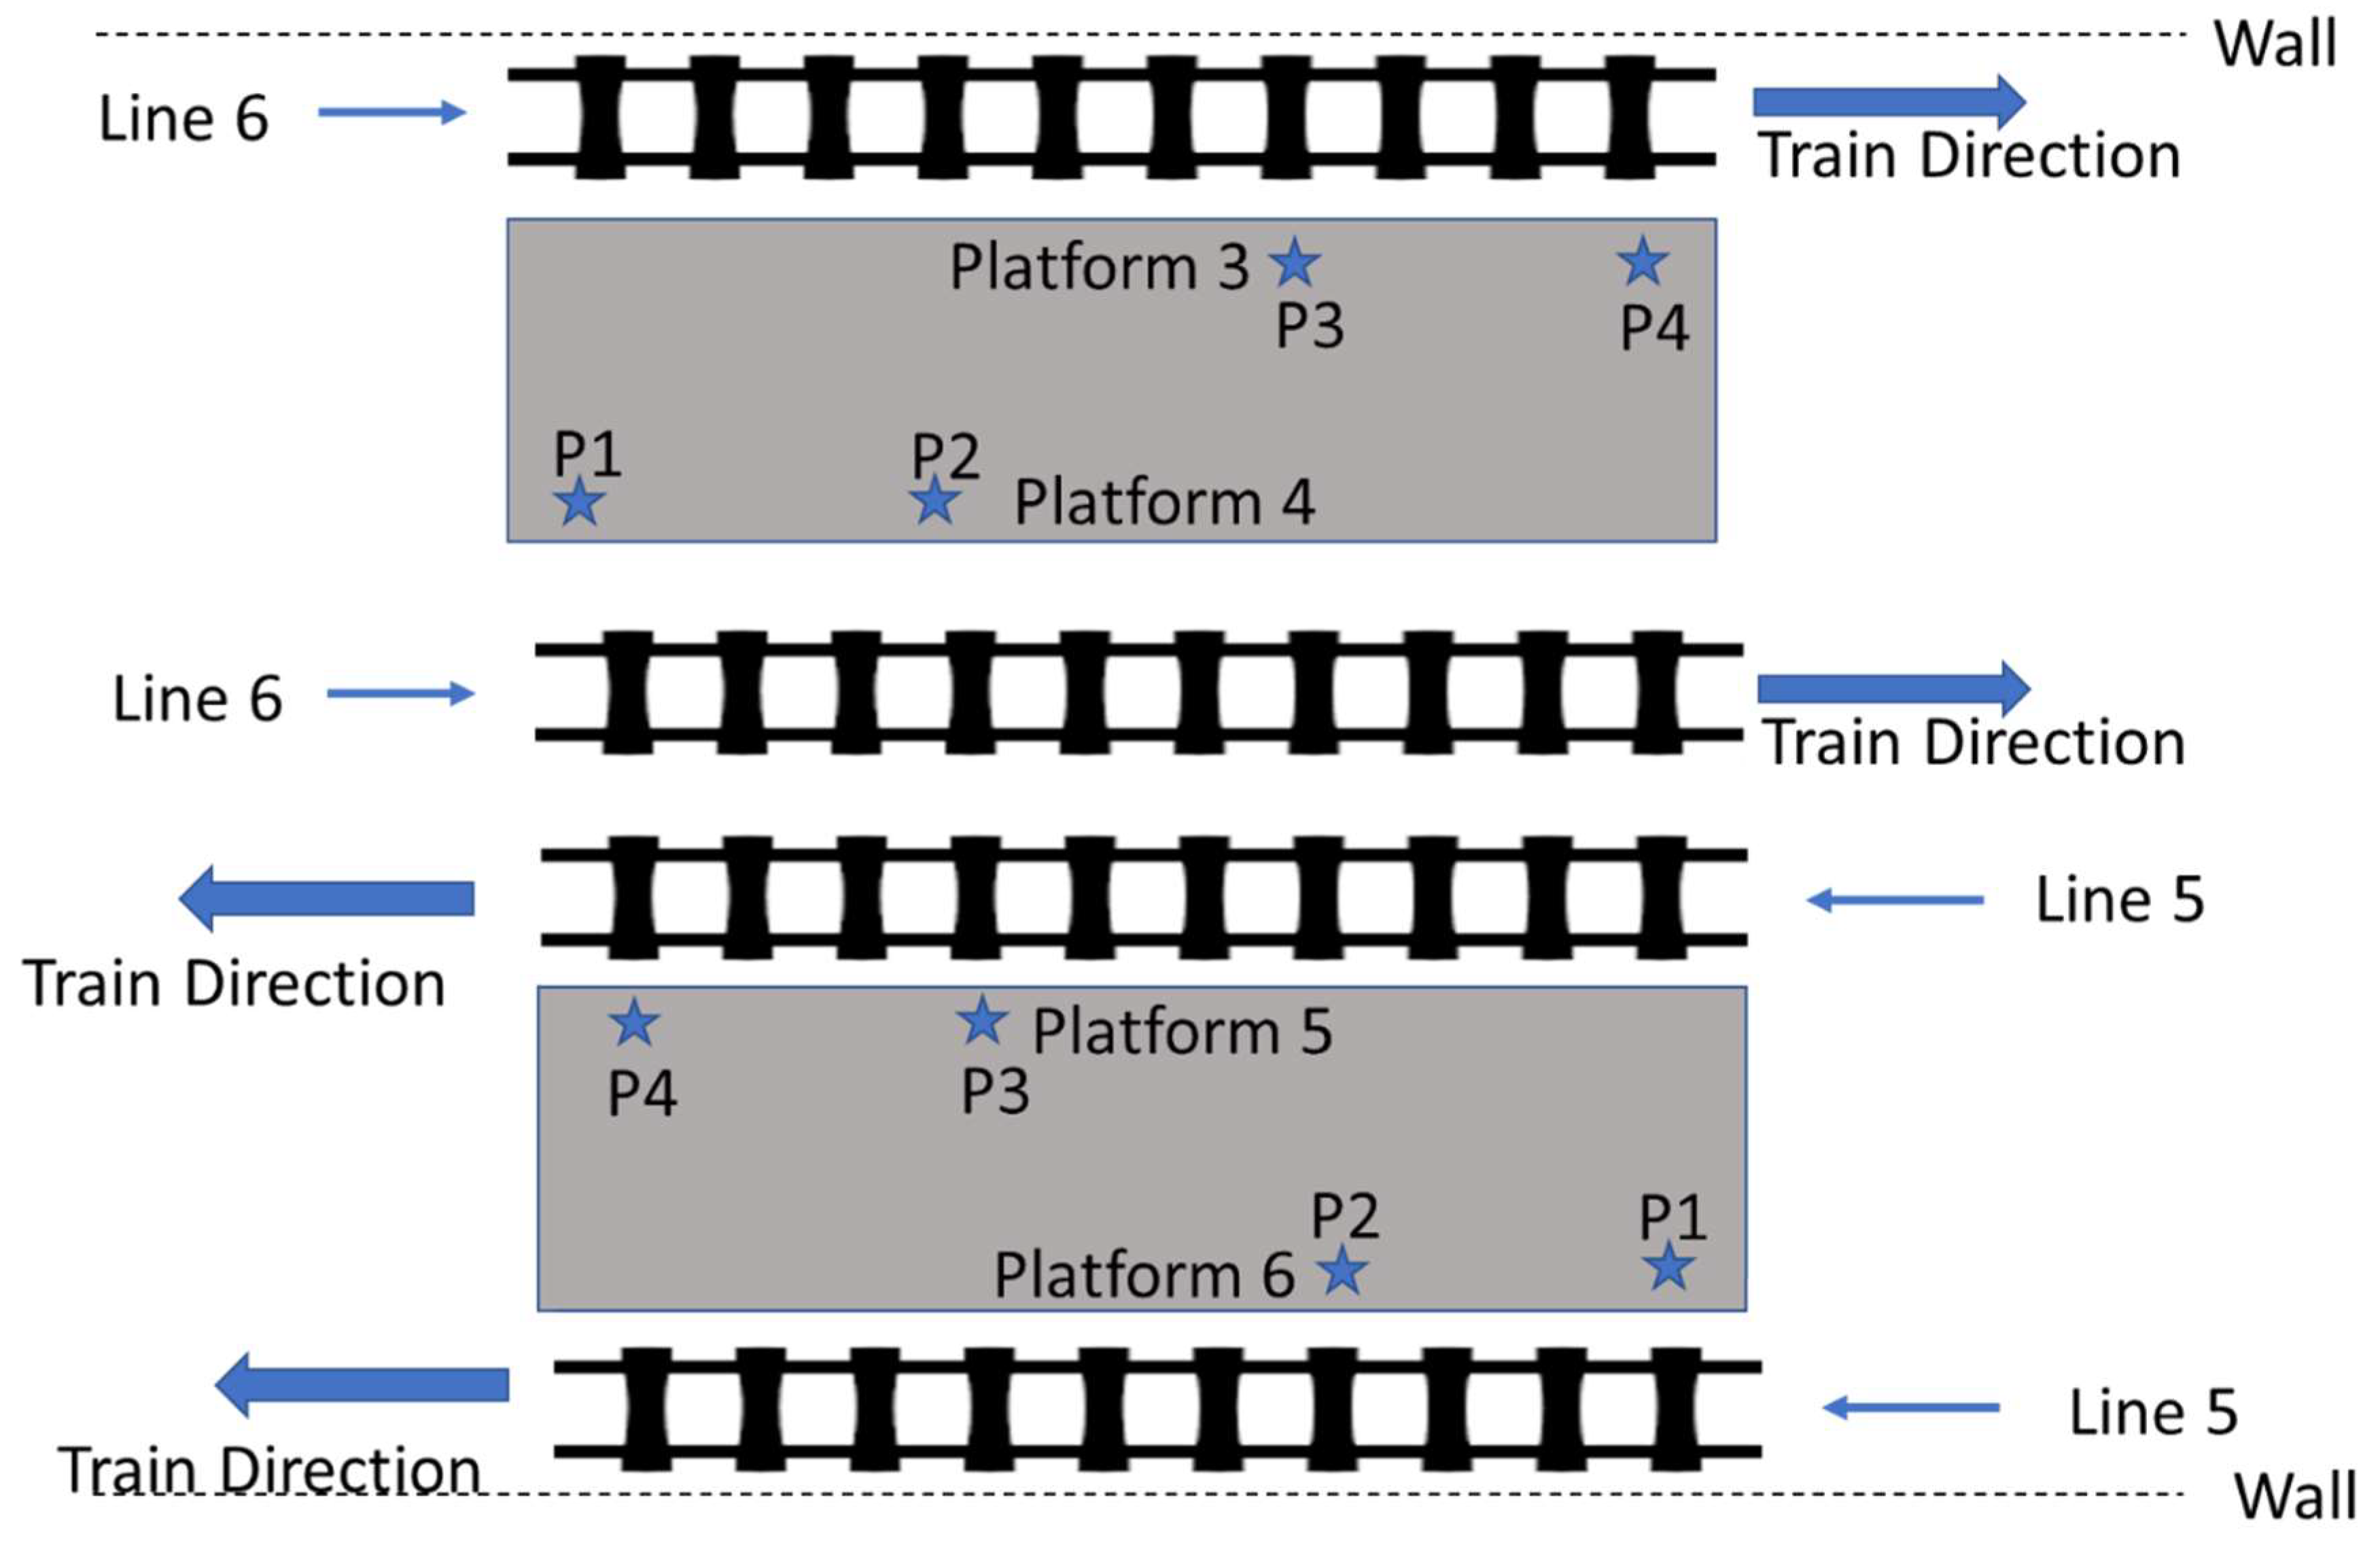
Figure 7.
Schematic diagram explaining the terminology at the platform.
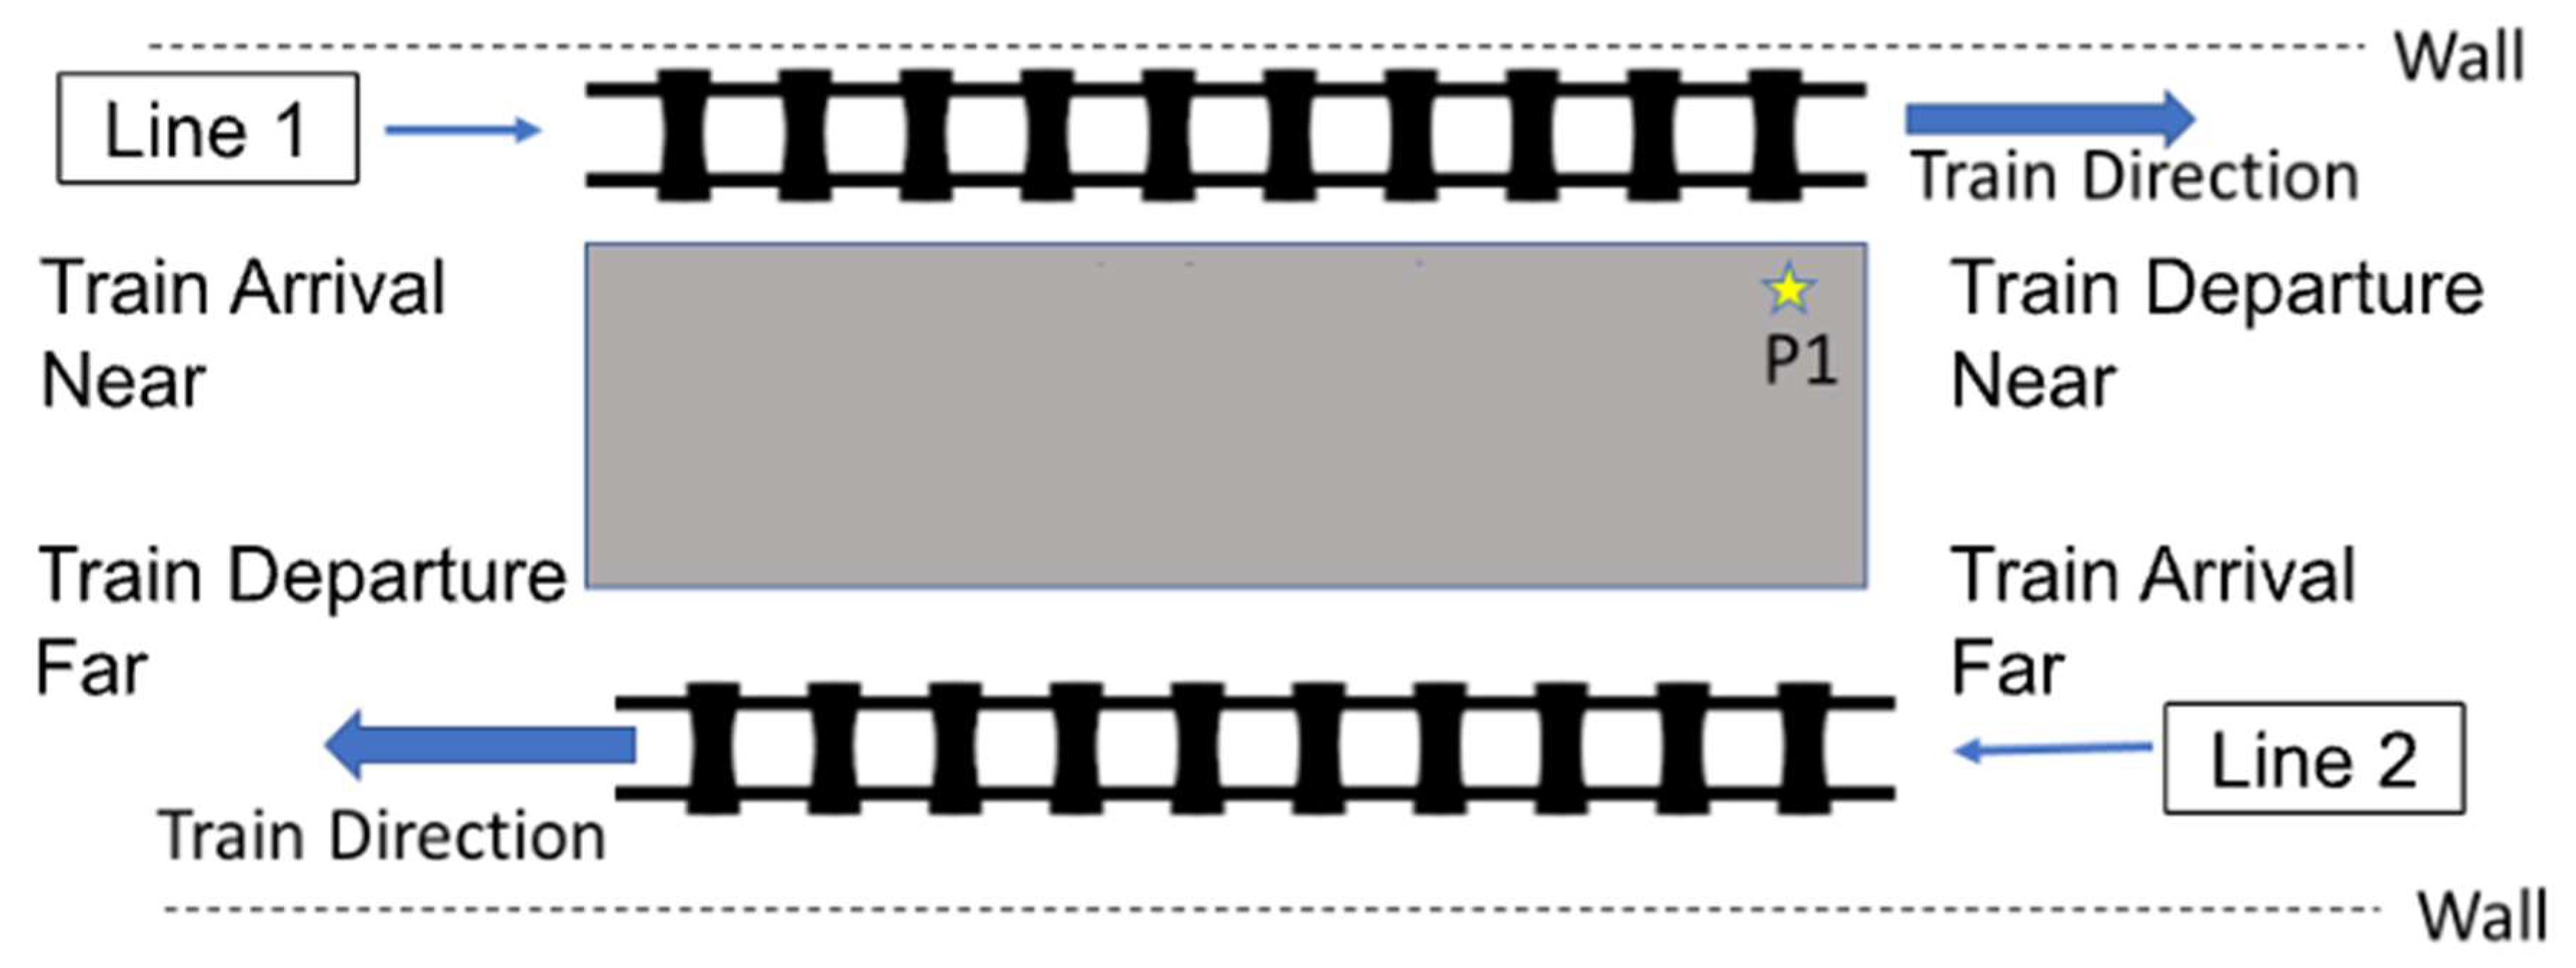
Figure 8.
Example of recorded data. Concentration profiles of PM2.5 and PM10 on different positions on Line 1 on a weekday (15th August 2019) (TAN: Train Arrival Near, TDN: Train Departure Far, TAF: Train Arrival Far and TDF: Train Departure Far).
Figure 8.
Example of recorded data. Concentration profiles of PM2.5 and PM10 on different positions on Line 1 on a weekday (15th August 2019) (TAN: Train Arrival Near, TDN: Train Departure Far, TAF: Train Arrival Far and TDF: Train Departure Far).
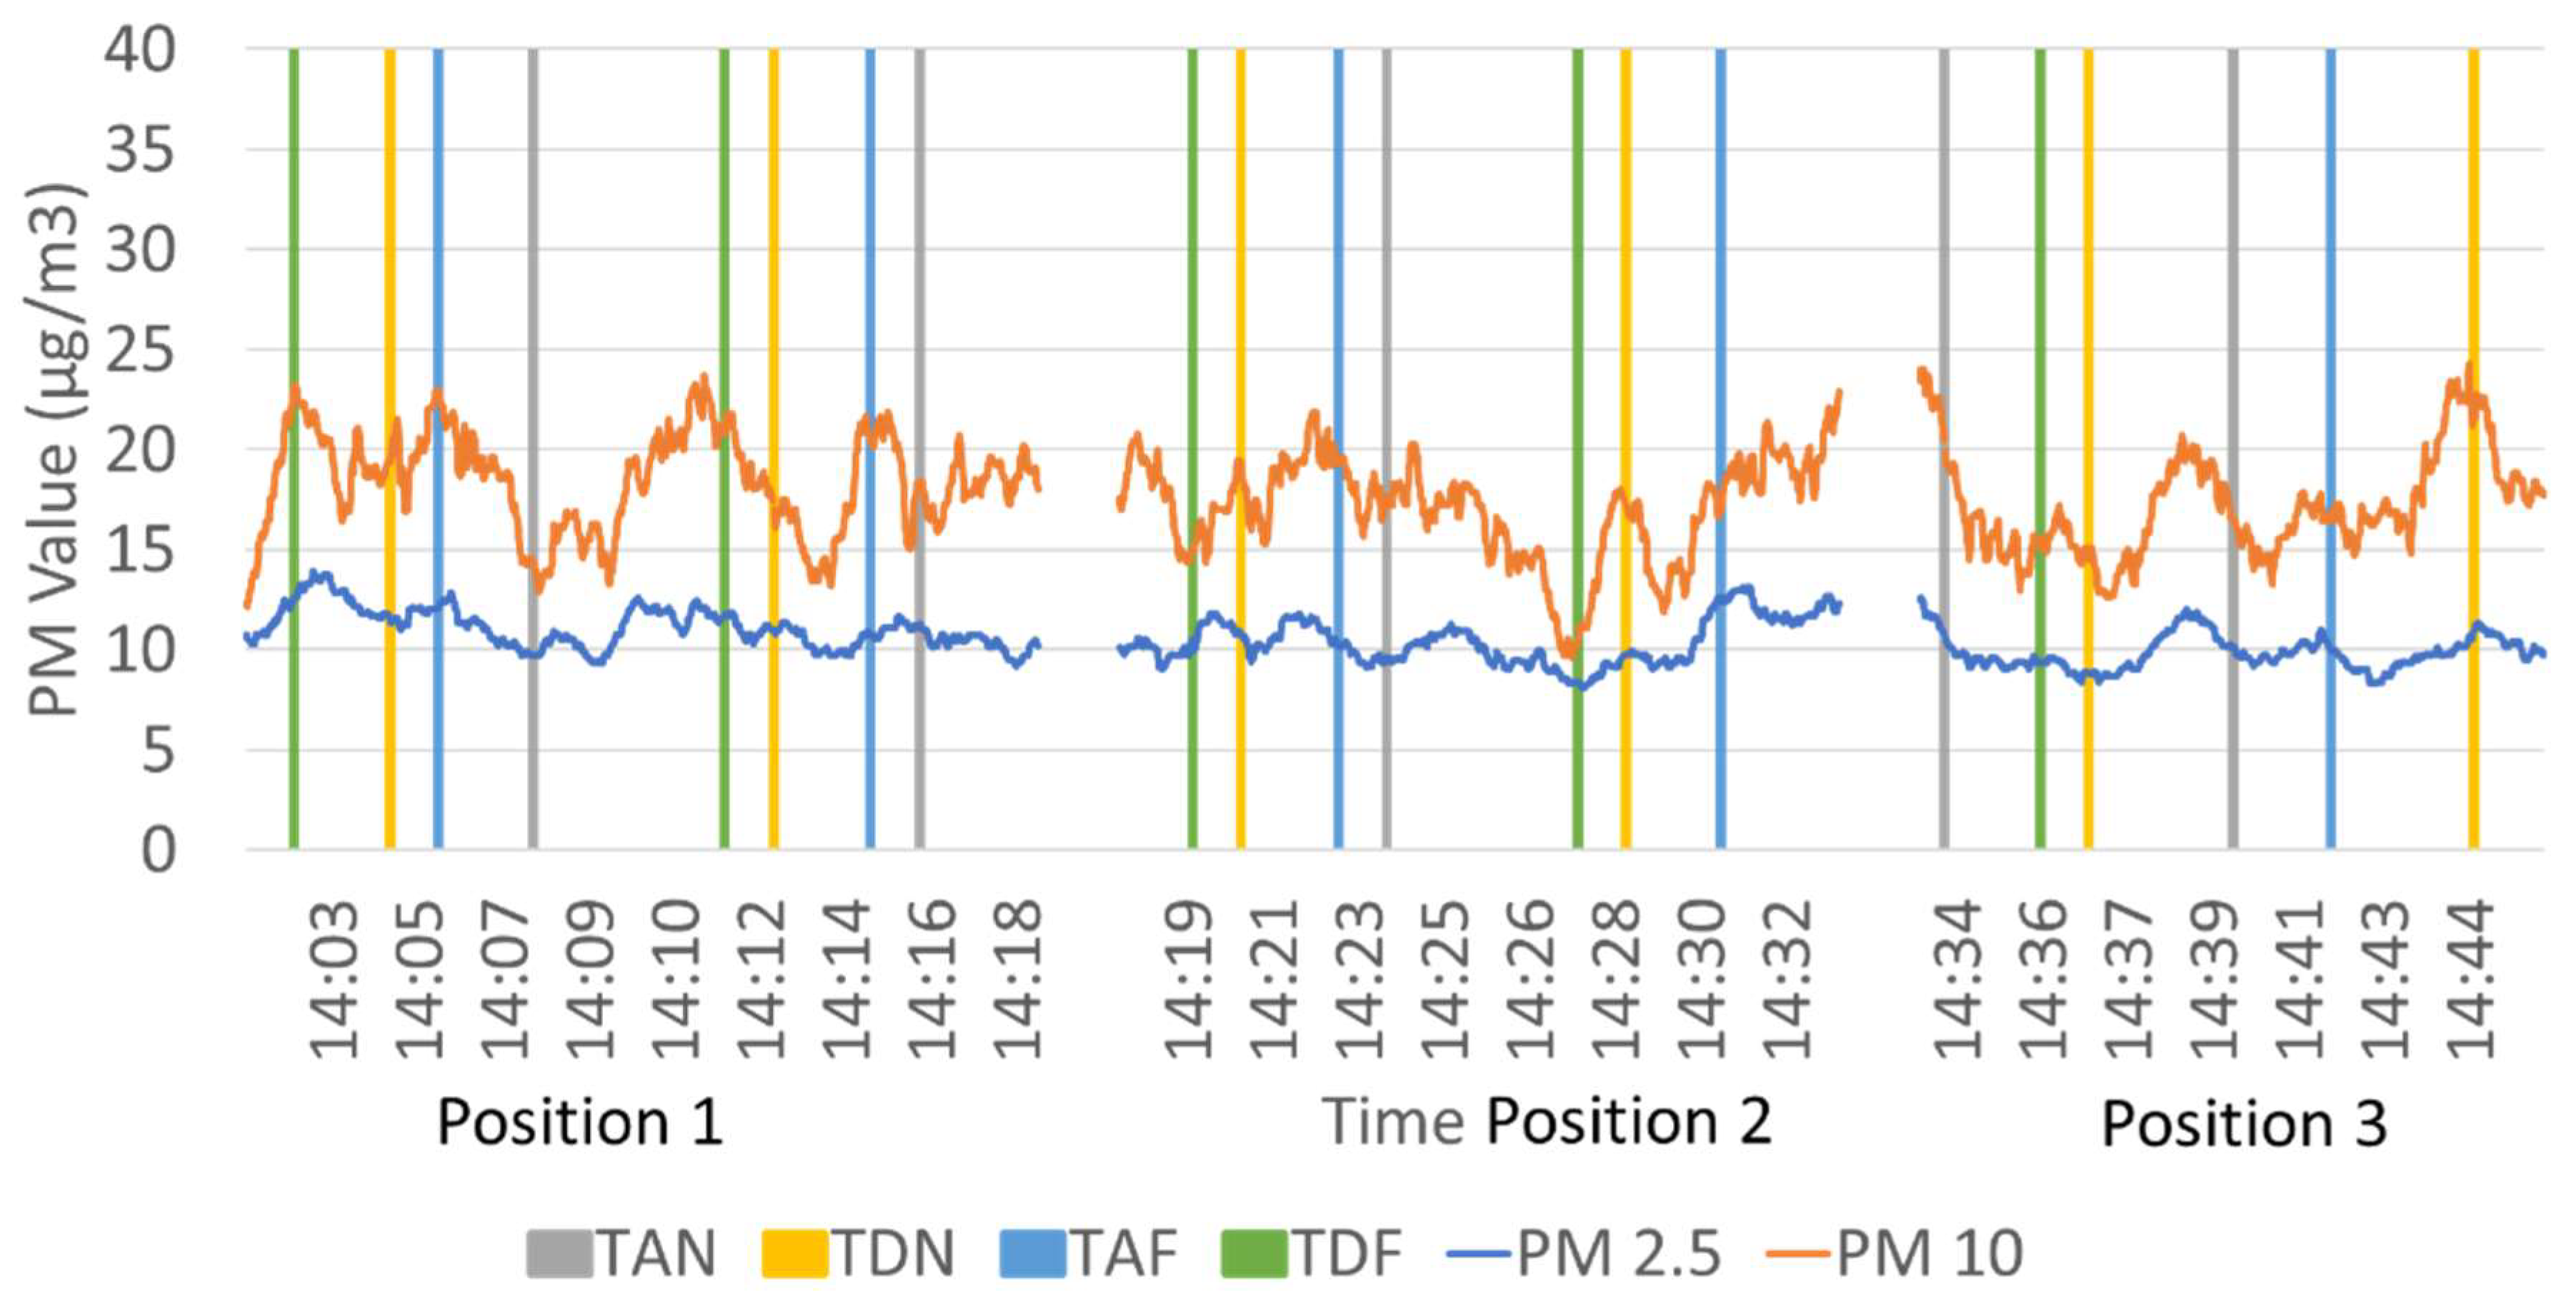
Figure 9.
Average values of (a) PM2.5 and (b) PM10 for Above-ground (Line 1 and 2) and Underground Lines (Line 3-6).
Figure 9.
Average values of (a) PM2.5 and (b) PM10 for Above-ground (Line 1 and 2) and Underground Lines (Line 3-6).
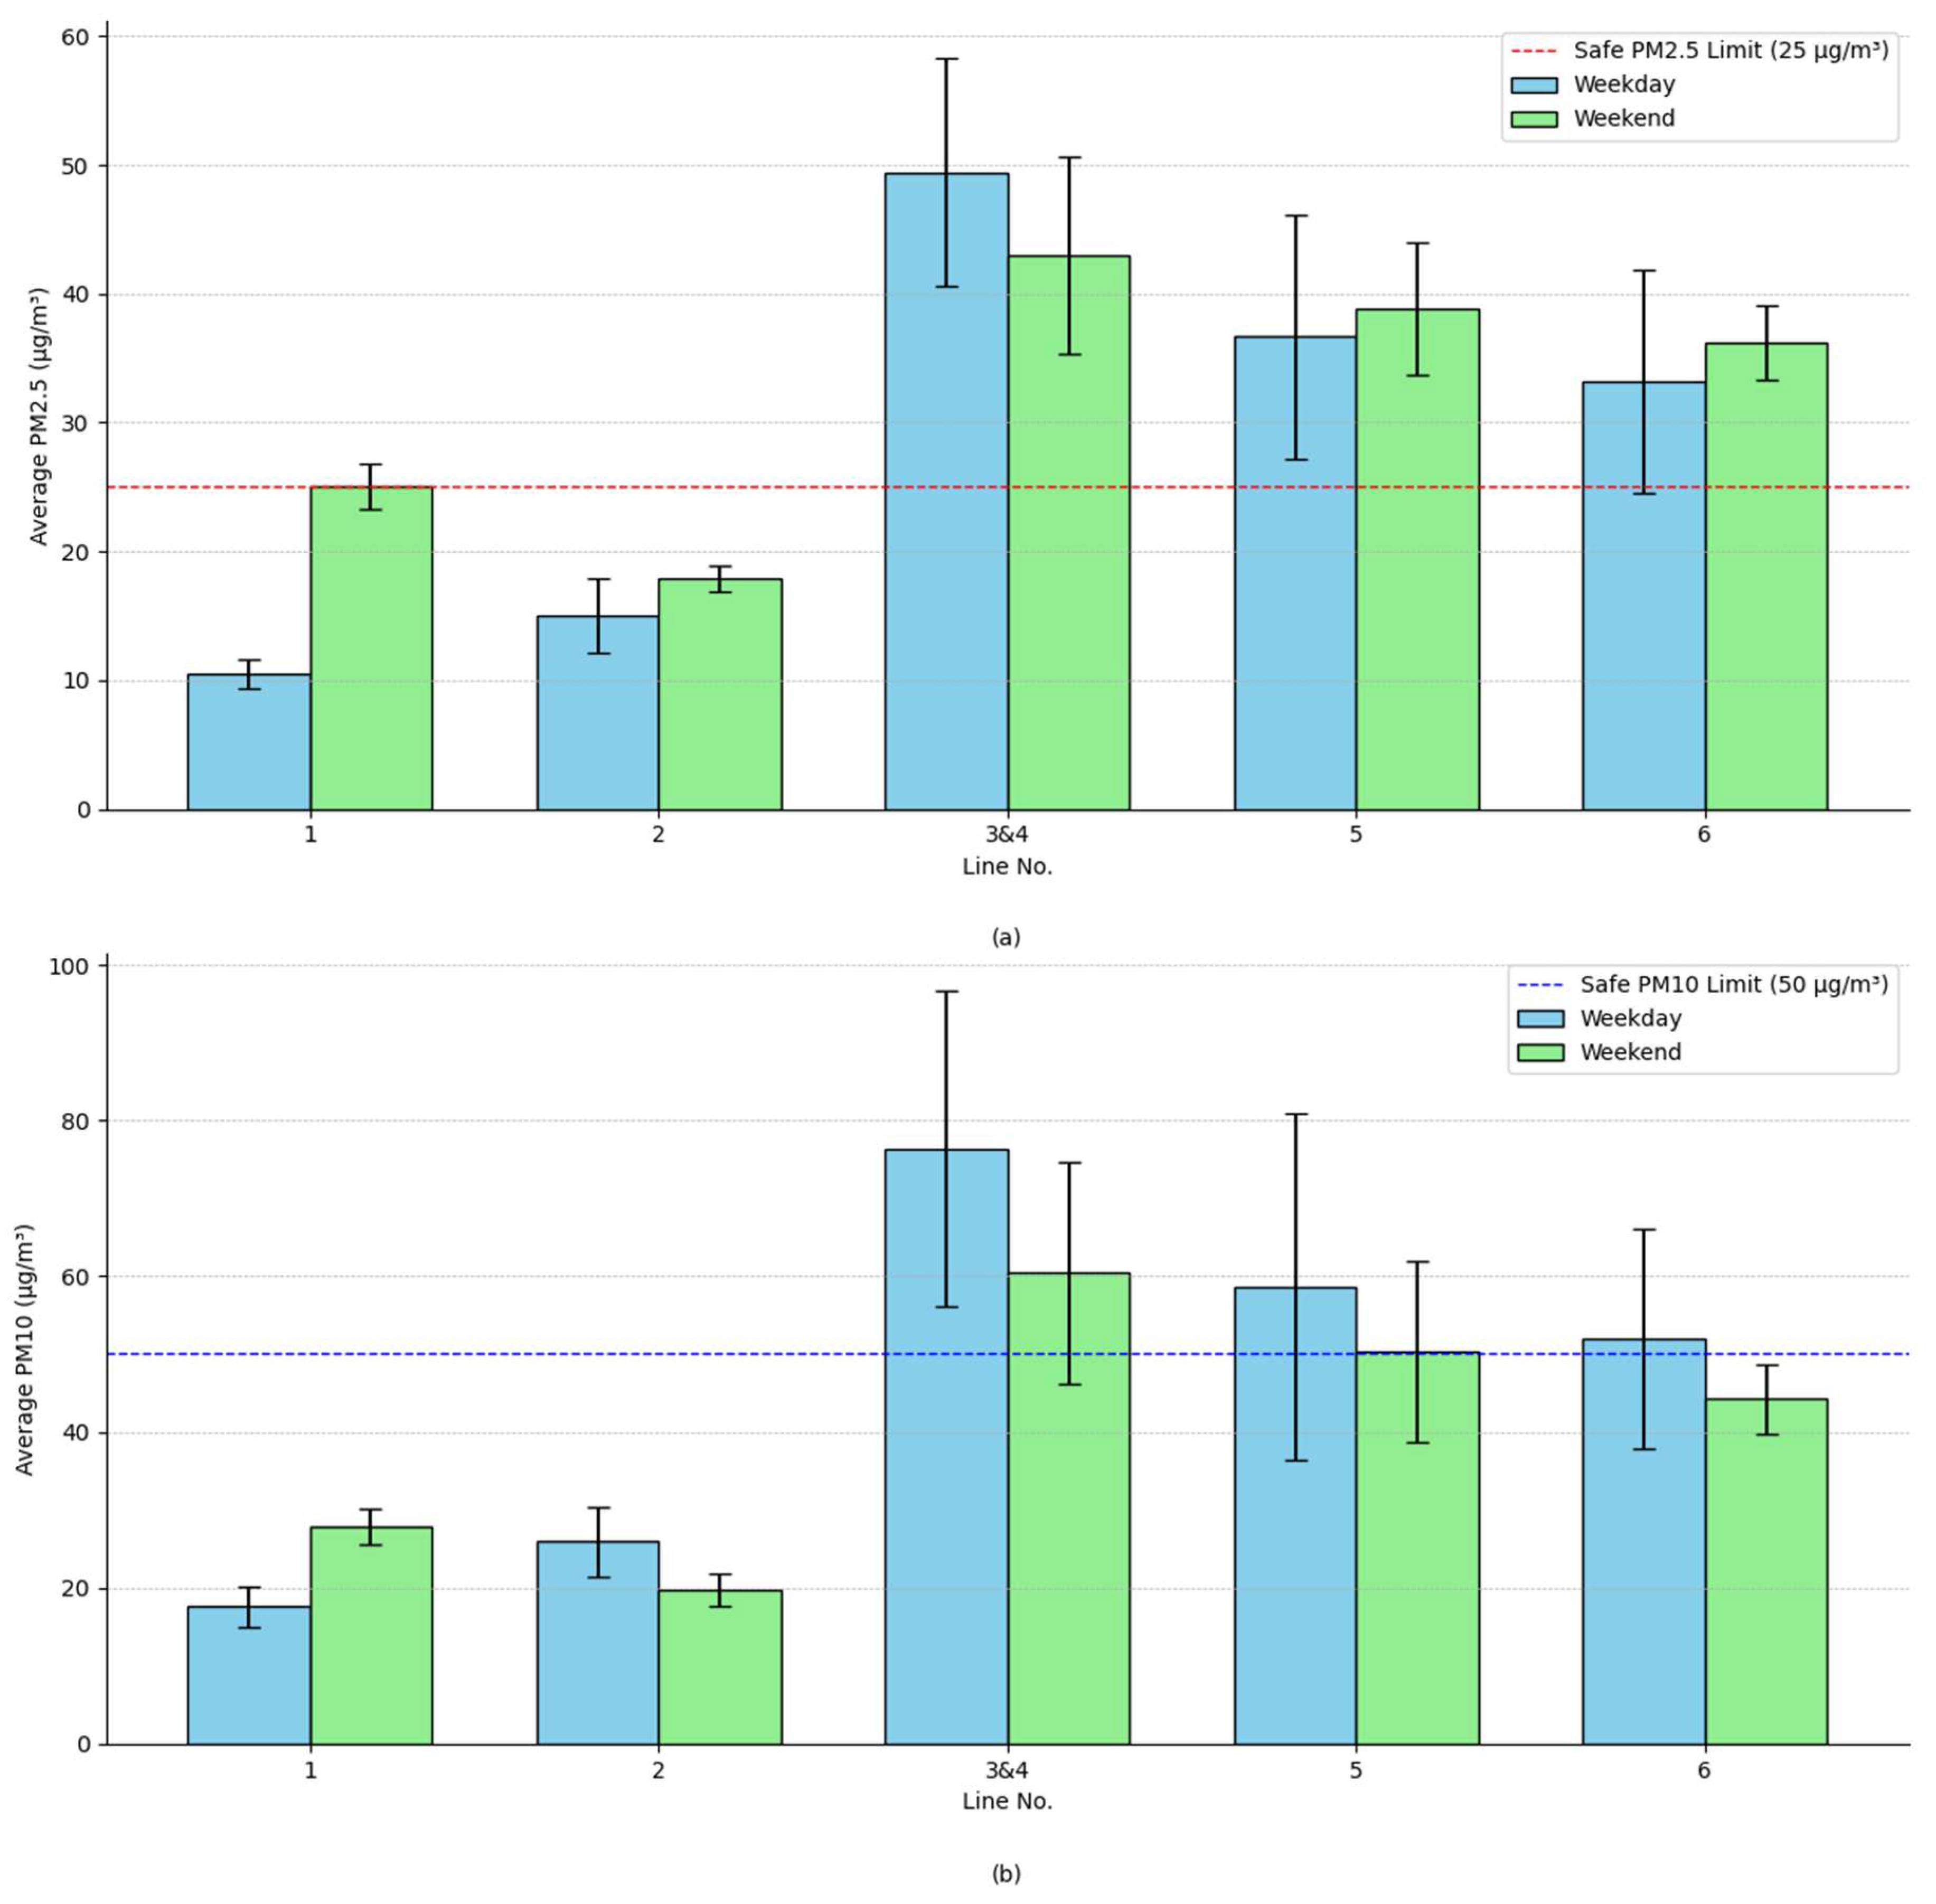
Figure 10.
Average PM2.5 on Weekdays at different positions, whiskers showing the range of values.
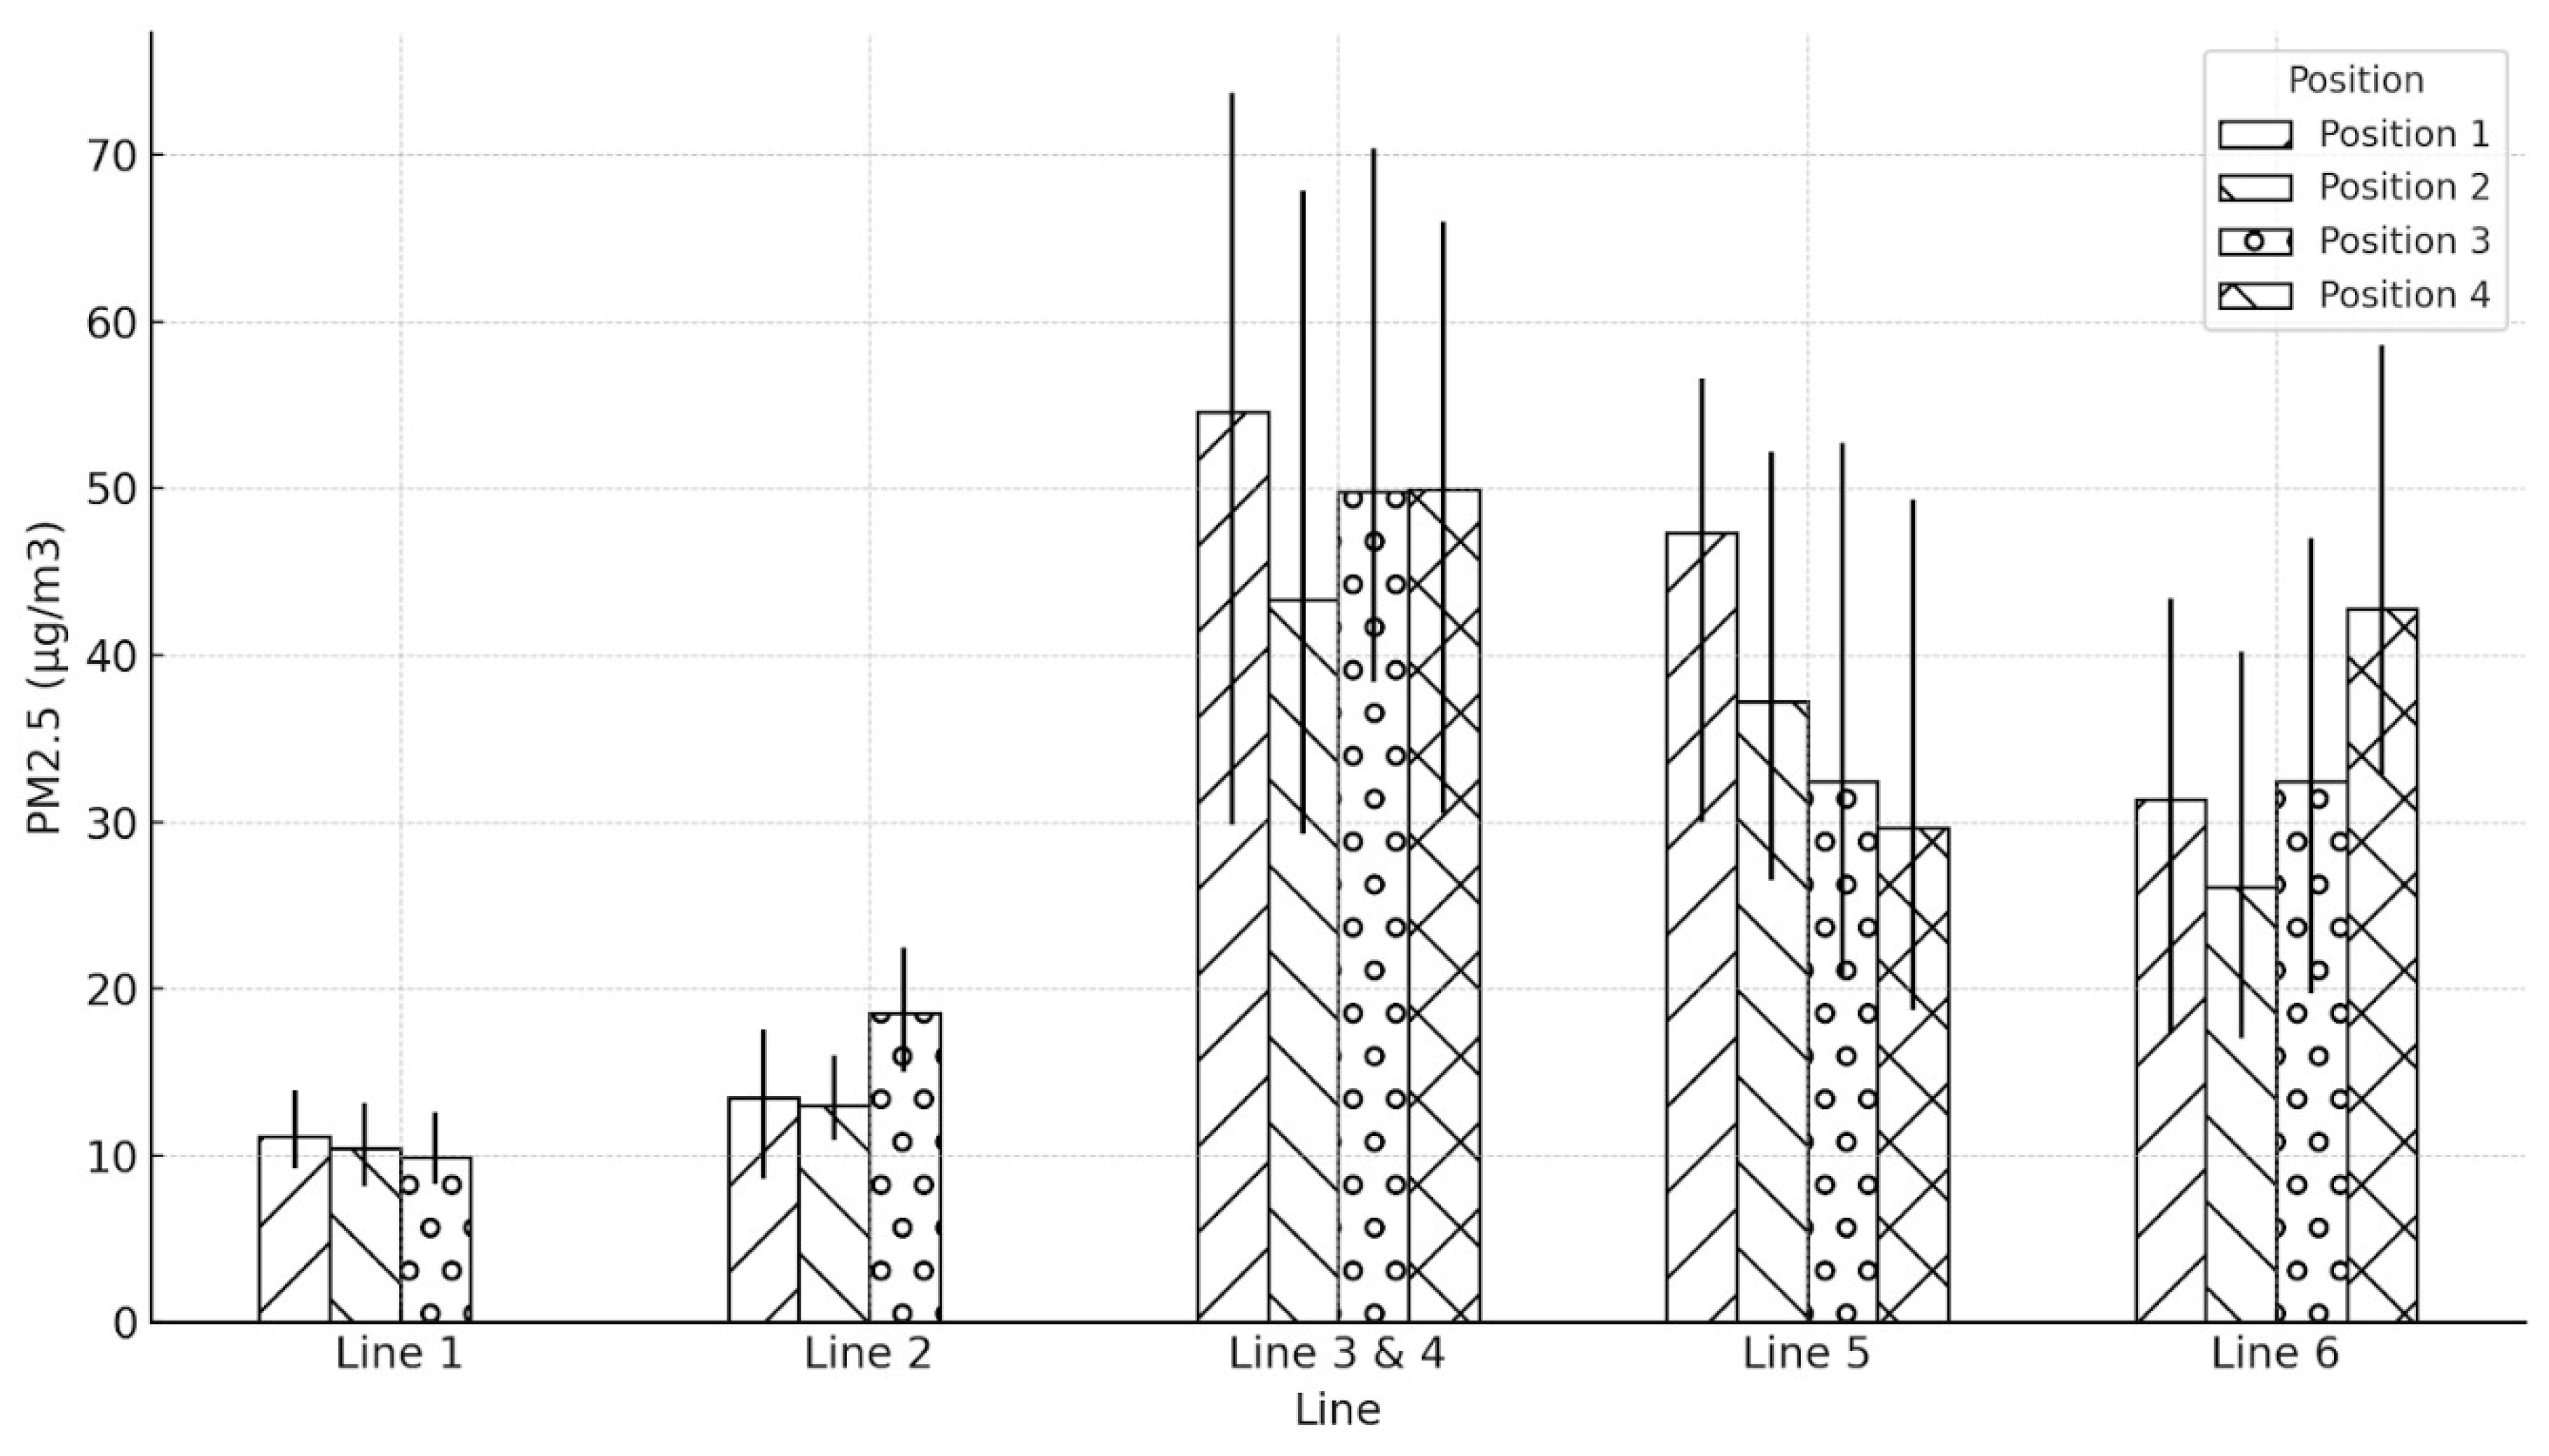
Figure 11.
Average PM2.5 on Weekends at different positions, whiskers showing the range of values.
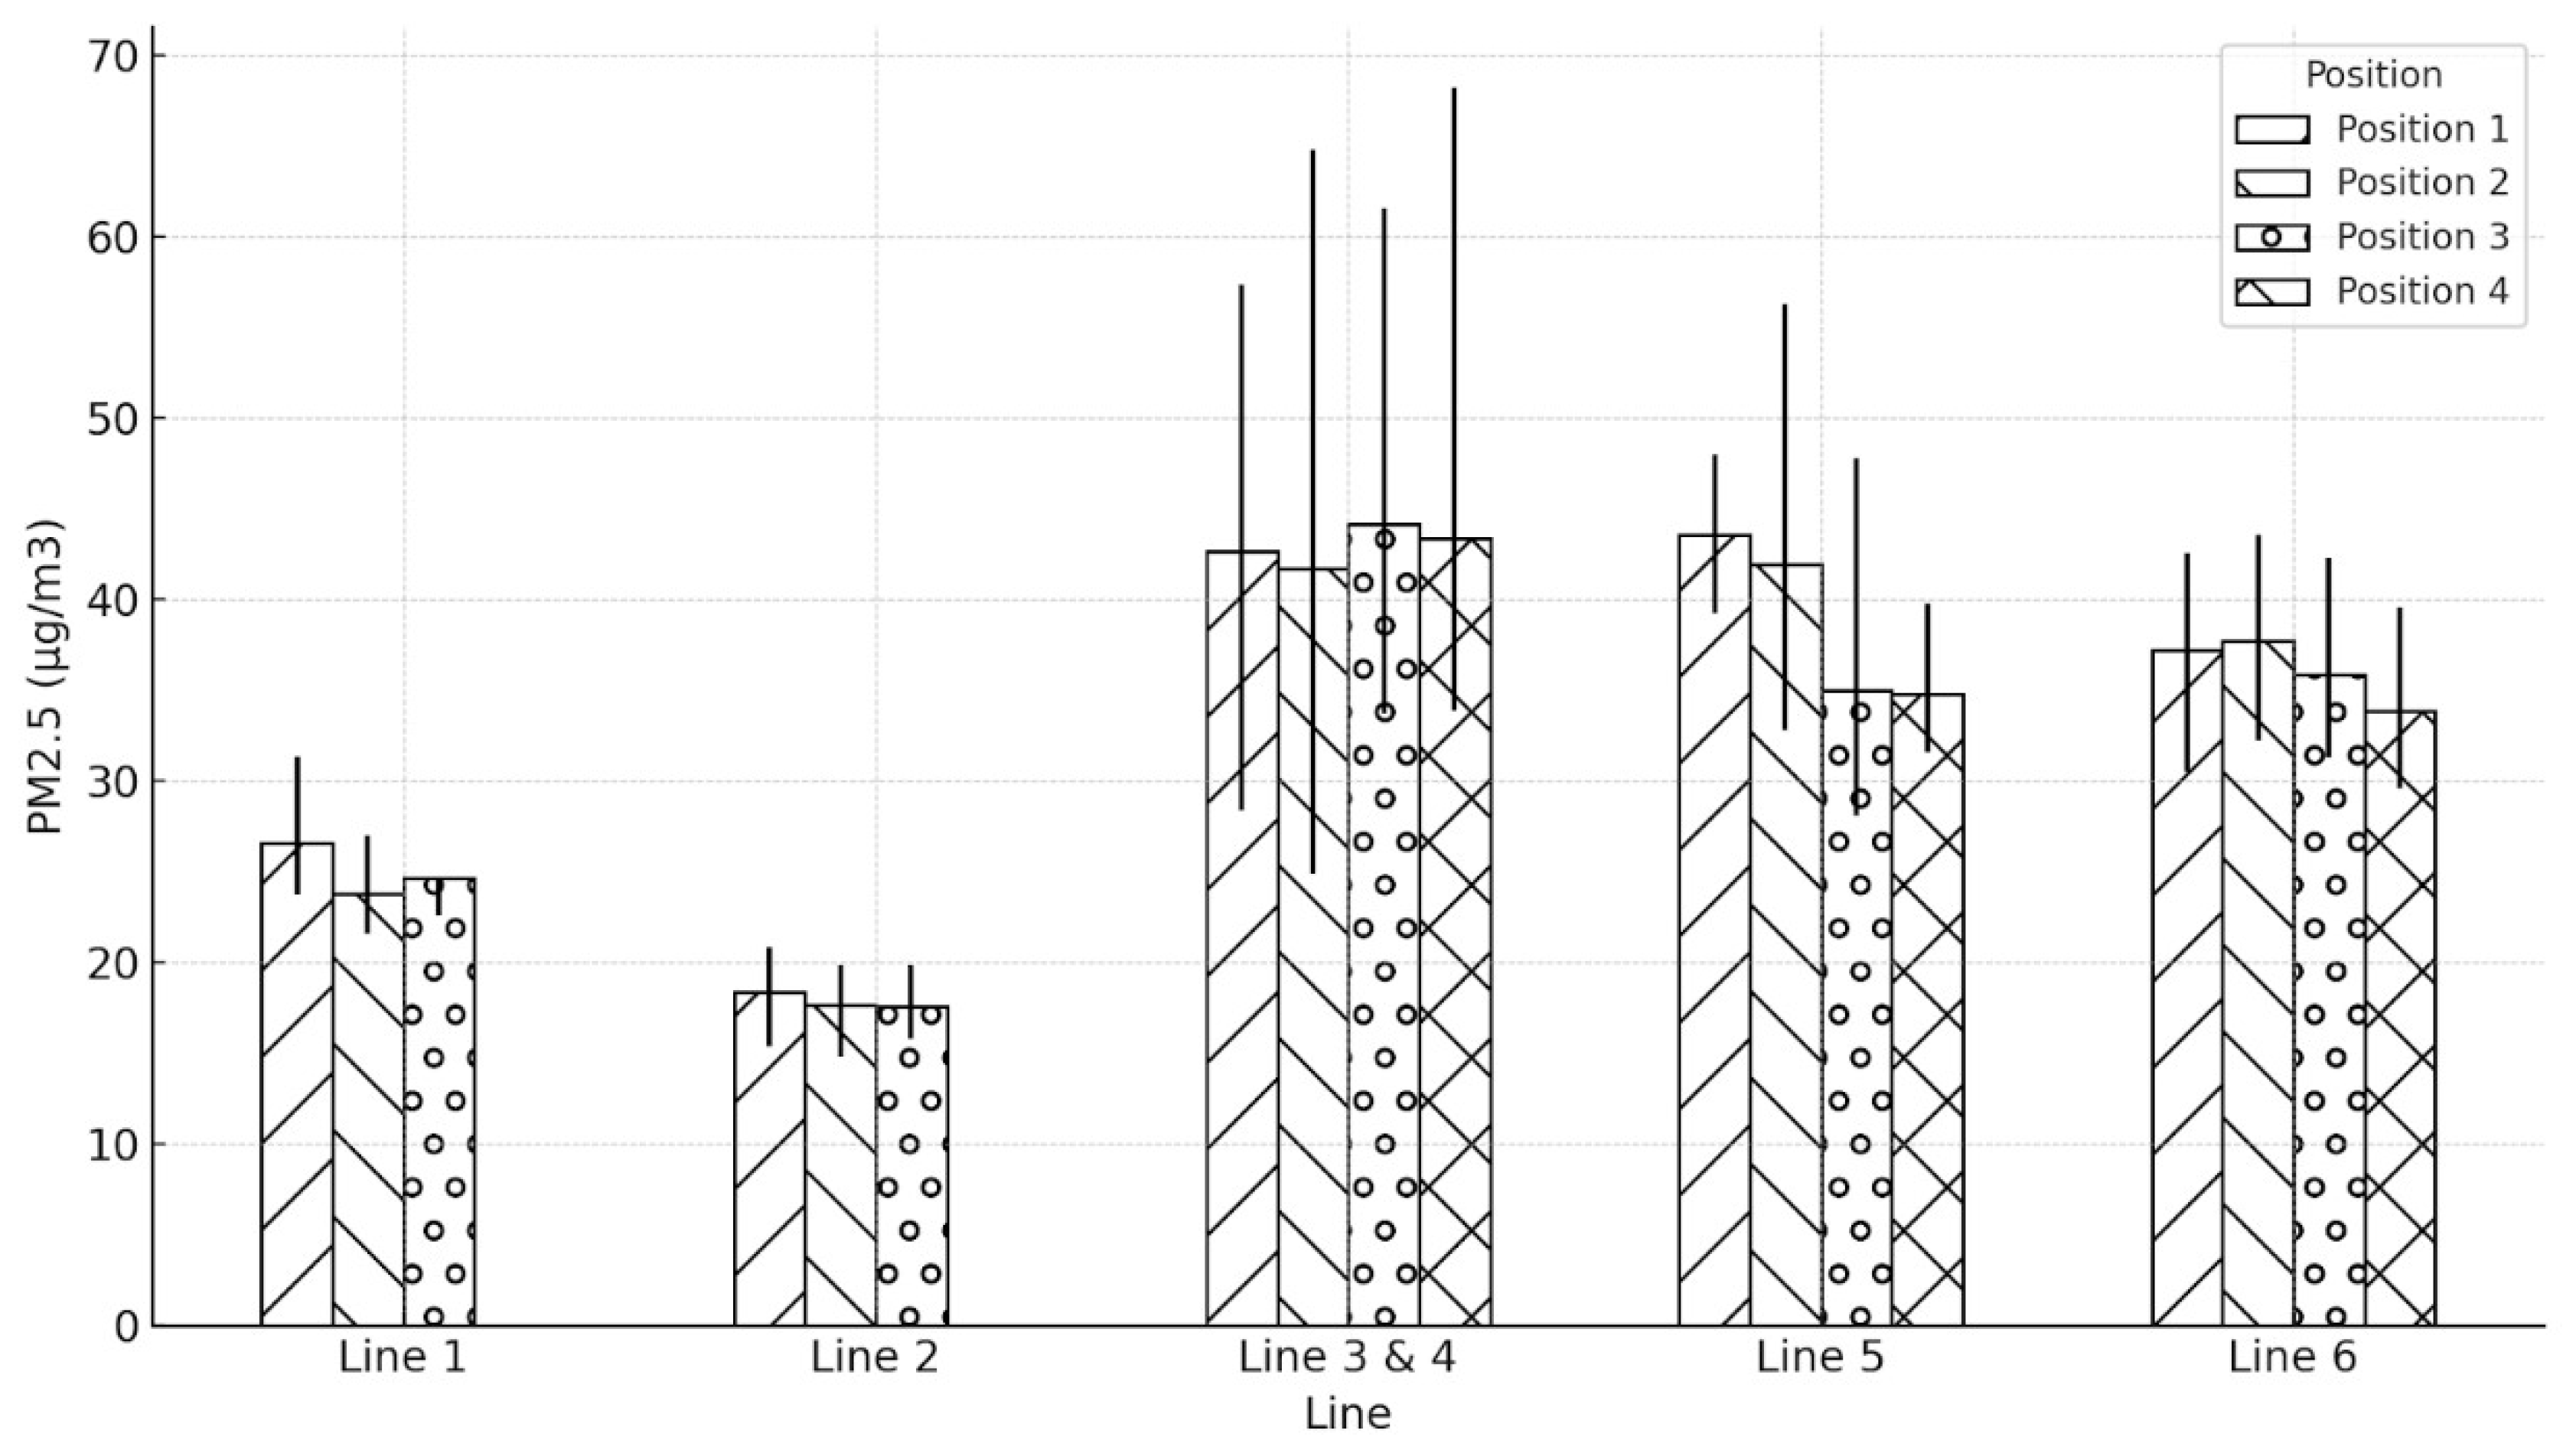
Figure 12.
Average PM10 on Weekdays at different positions, whiskers showing the range of values.
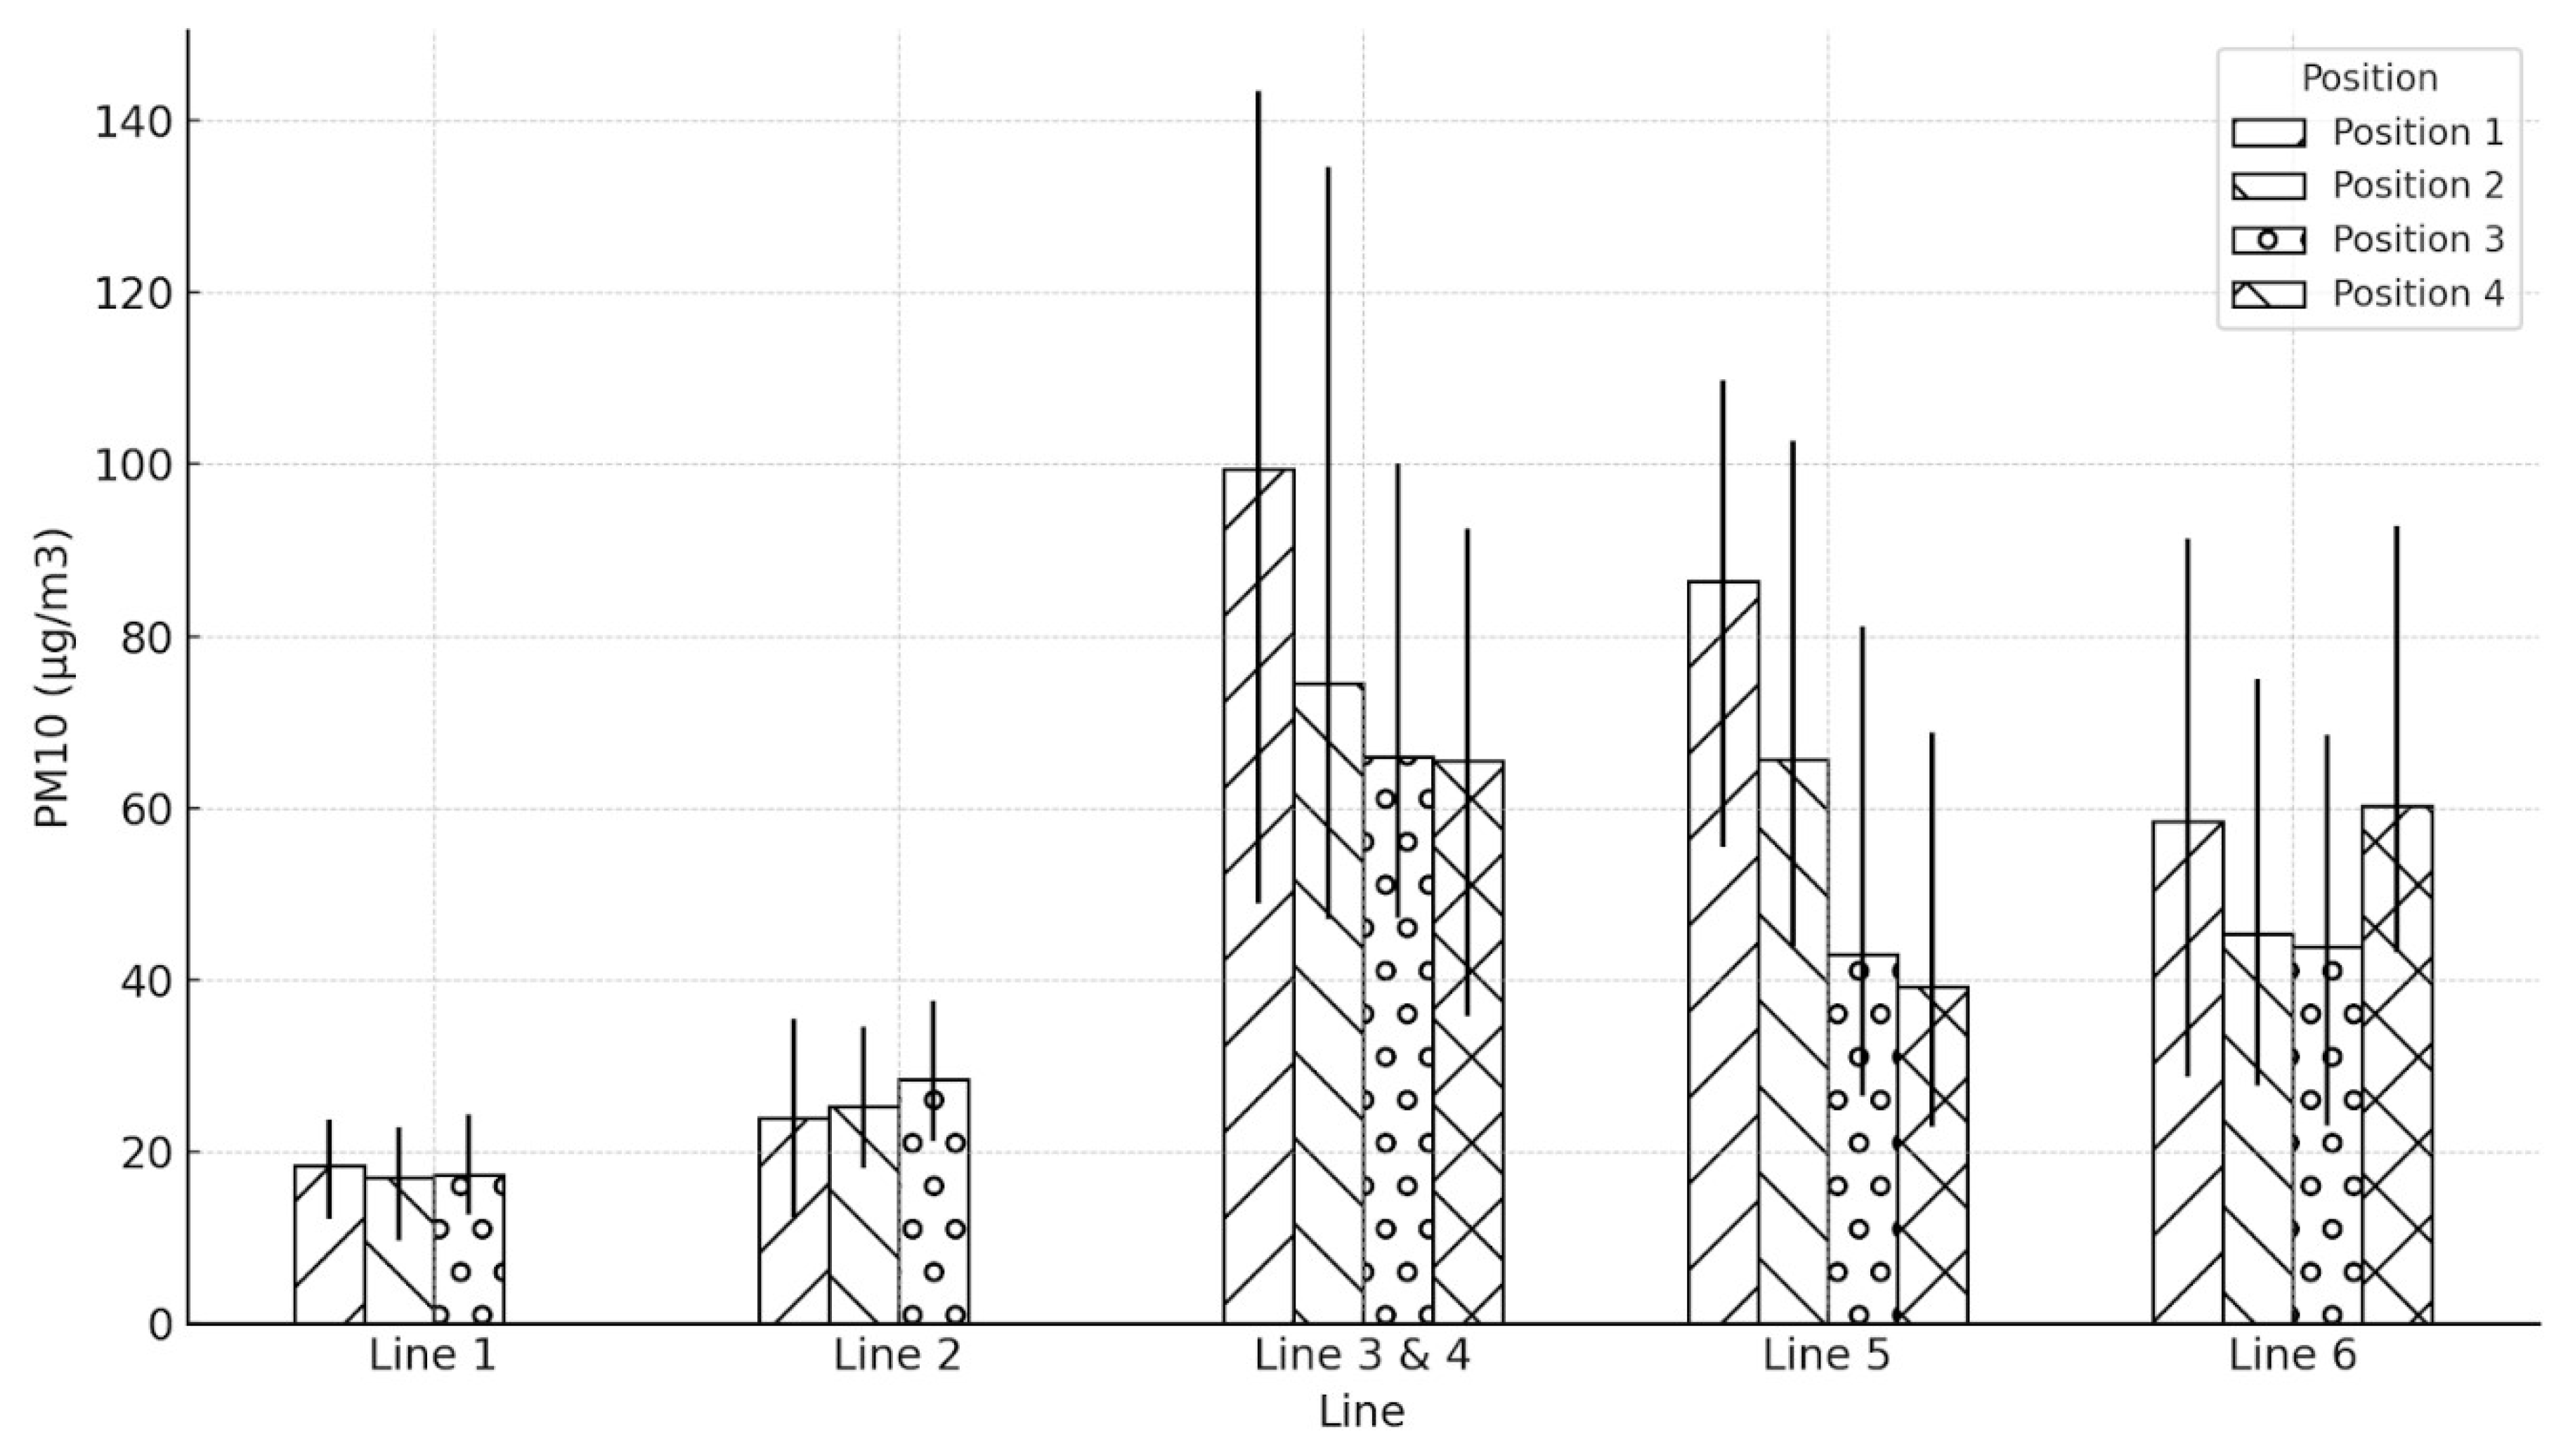
Figure 13.
Average PM10 on Weekends at different positions, whiskers showing the range of values.
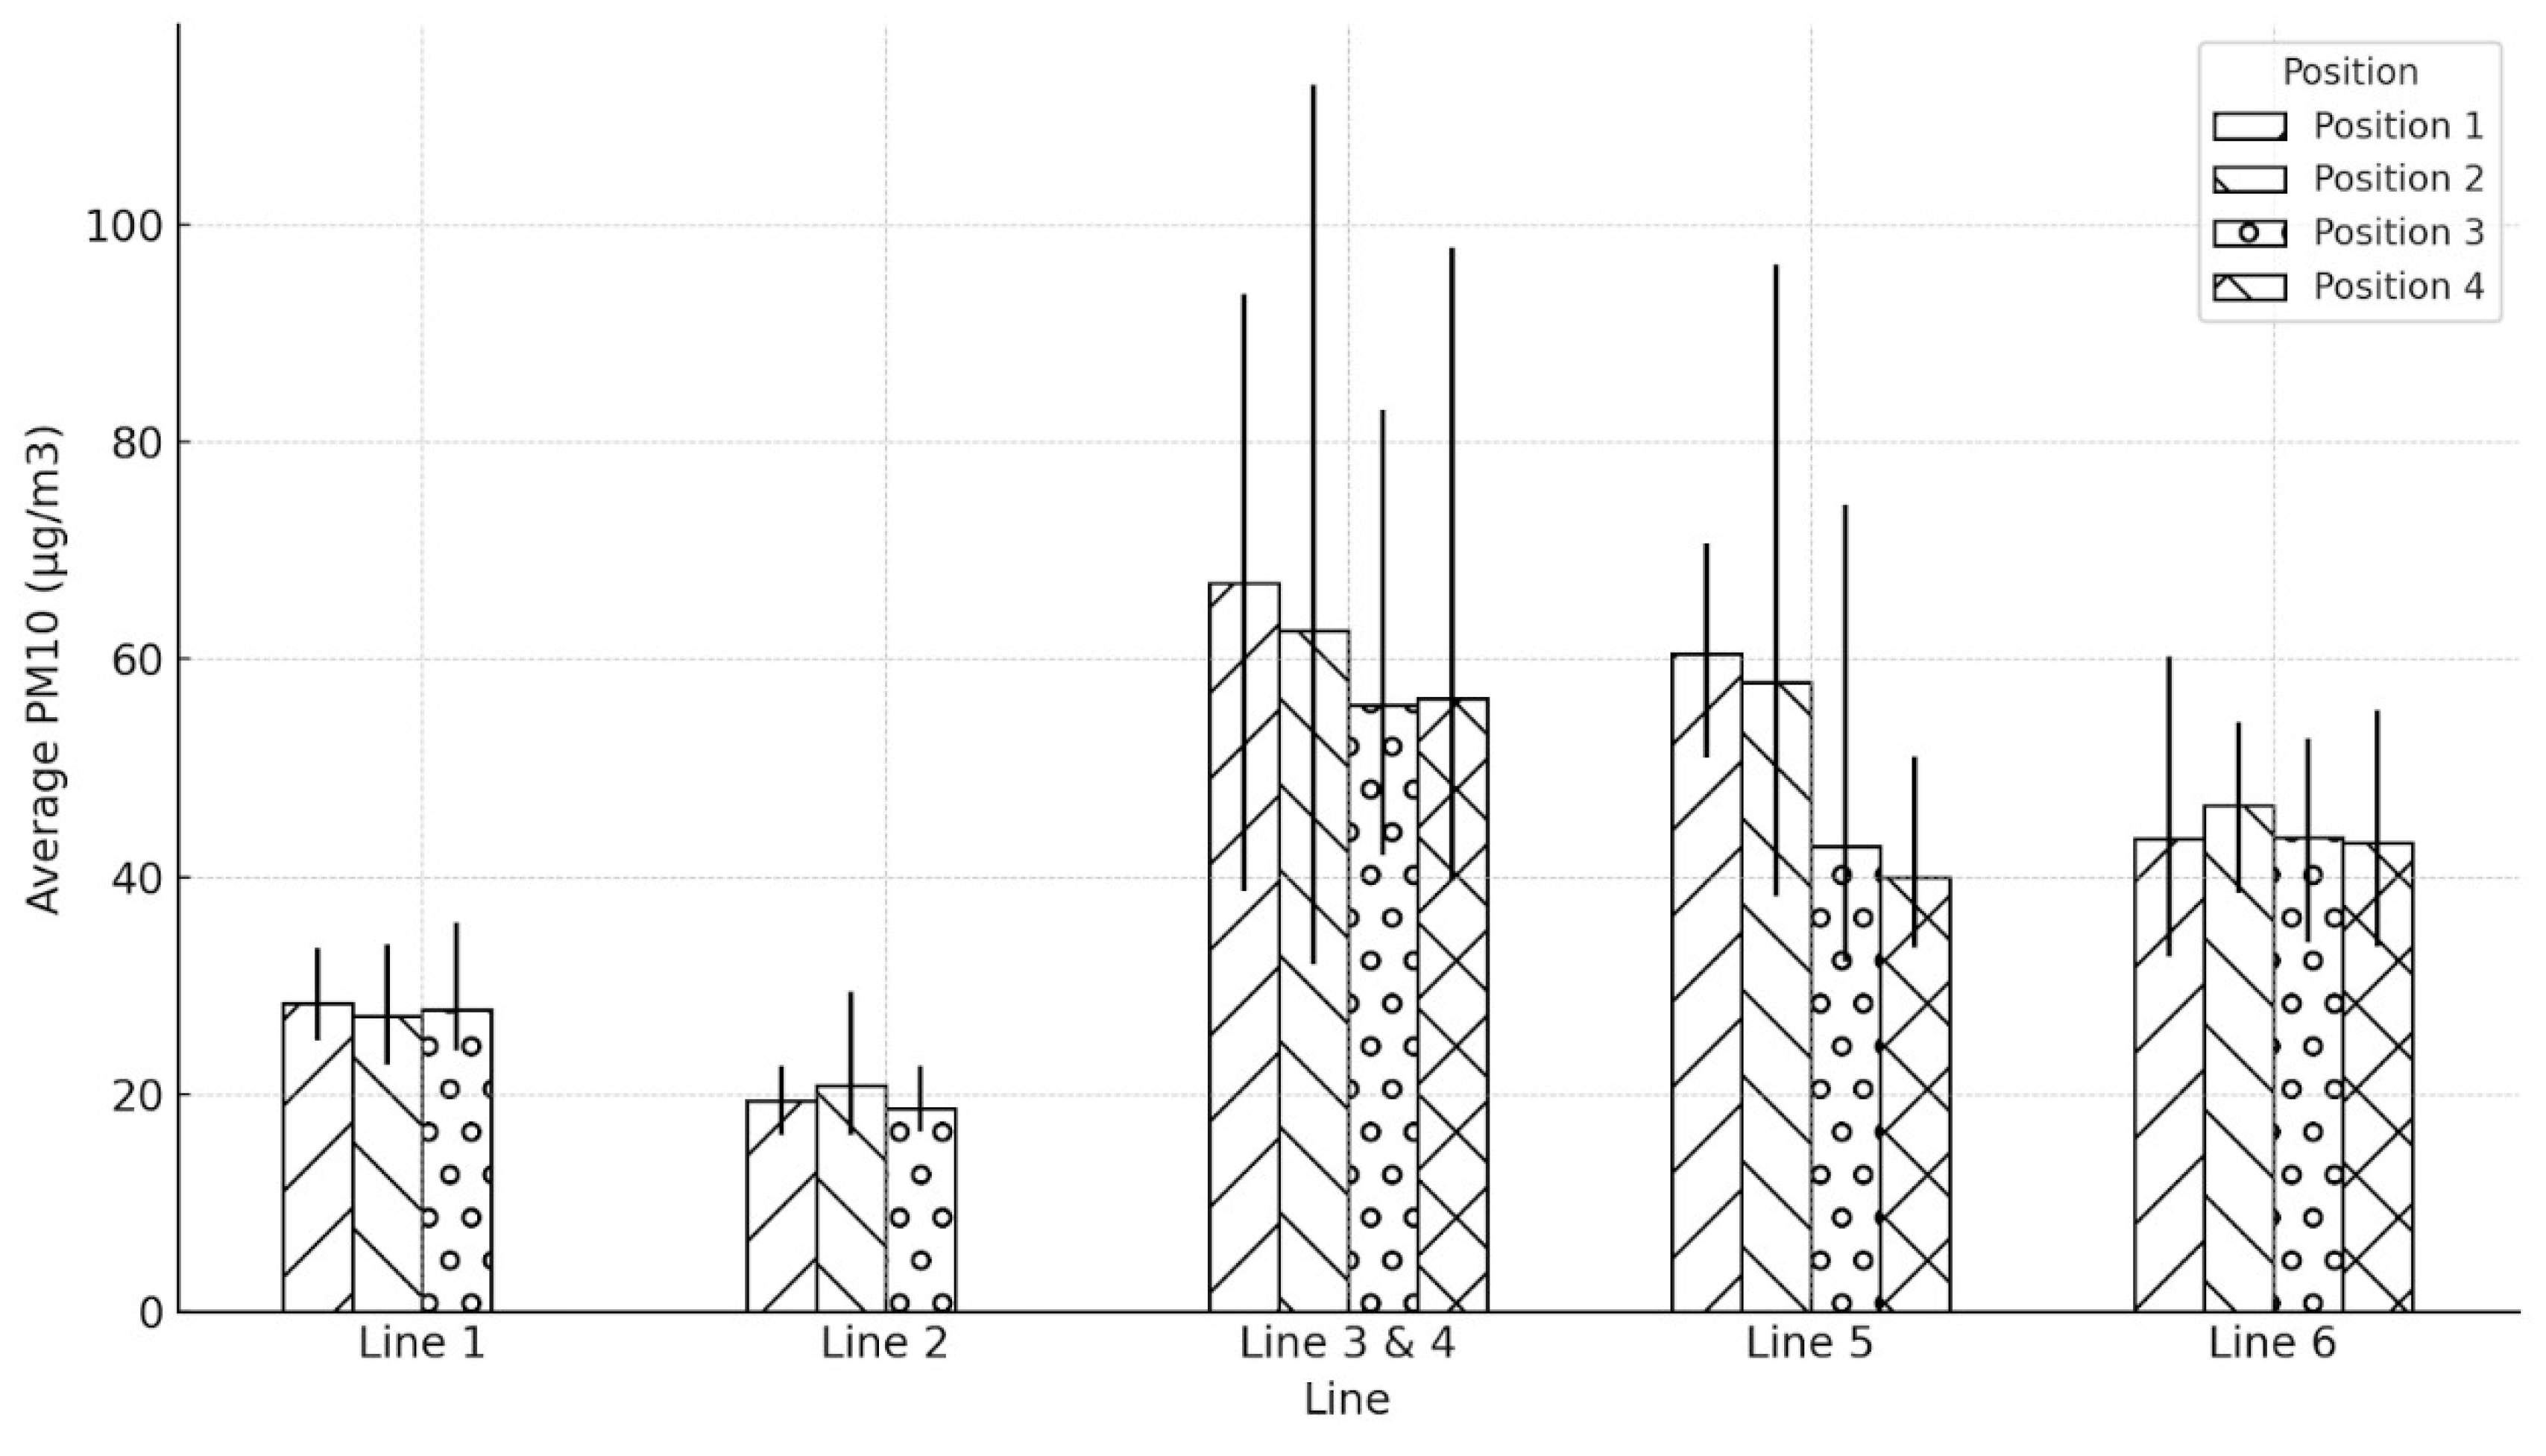
Table 1.
Description of train lines and platforms of Shibuya station.
| Line No. | Line Location | Number of measurement positions | Measurement Date | Day Type | Measurement Time | Measurement Duration (minutes) | Average intervals between trains (minutes) |
|---|---|---|---|---|---|---|---|
| 1 | Above Ground | 3 | 2019/08/15 | Weekday | 14:02 – 14:46 | 45 | 4 |
| 2019/08/17 | Weekend | 15:34 – 16:19 | 45 | 4 | |||
| 2 | Above Ground | 3 | 2019/08/15 | Weekday | 20:17 – 20:46 | 29 | 1.7 |
| 2019/08/18 | Weekend | 16:21 – 17:22 | 61 | 1.5 | |||
| 3 & 4 | Underground (B3F) | 4 | 2019/08/15 | Weekday | 19:16 – 19:54 | 38 | 1.6 |
| 2019/08/18 | Weekend | 17:37 – 18:18 | 41 | 2.3 | |||
| 5 | Underground (B5F) | 4 | 2019/08/15 | Weekday | 15:21 – 16:01 | 40 | 1.9 |
| 2019/08/18 | Weekend | 18:57 – 20:21 | 84 | 1.9 | |||
| 6 | Underground (B5F) | 4 | 2019/08/15 | Weekday | 16:15 – 16:55 | 40 | 1.9 |
| 2019/08/18 | Weekend | 20:45 – 22:35 (with 25 minutes rest) | 85 | 1.9 |
Table 2.
Average and variance of PM values in different lines in the Shibuya station.
| Line No. | Average PM2.5 levels (µg/m3) | Variance PM2.5 | Average PM10 levels (µg/m3) | Variance PM10 | ||||||
|---|---|---|---|---|---|---|---|---|---|---|
| Weekday | Weekend | Overall | Weekday | Weekend | Weekday | Weekend | Overall | Weekday | Weekend | |
| 1 | 10.45 | 25.03 | 17.74 | 1.28 | 3.14 | 17.57 | 27.79 | 22.68 | 6.91 | 5.03 |
| 2 | 15.00 | 17.87 | 18.10 | 8.58 | 0.98 | 25.89 | 19.66 | 22.78 | 19.34 | 4.25 |
| 3&4 | 49.43 | 42.98 | 46.20 | 78.24 | 58.53 | 76.35 | 60.47 | 68.41 | 410.85 | 203.42 |
| 5 | 36.66 | 38.84 | 37.75 | 89.16 | 26.43 | 58.58 | 50.28 | 54.43 | 494.41 | 134.40 |
| 6 | 33.17 | 36.18 | 34.67 | 74.82 | 8.12 | 51.99 | 44.22 | 48.11 | 197.85 | 19.85 |
Table 4.
Average, minimum, and maximum PM2.5 values on weekends across various lines and positions.
| Line | Position | Average PM2.5 (µg/m3) | Min PM2.5 (µg/m3) | Max PM2.5 (µg/m3) |
|---|---|---|---|---|
| Line 1 | Position 1 | 26.57 | 23.7 | 31.4 |
| Position 2 | 23.83 | 21.6 | 27 | |
| Position 3 | 24.69 | 22.6 | 24.69 | |
| Position 4 | NaN | NaN | NaN | |
| Line 2 | Position 1 | 18.38 | 15.4 | 20.9 |
| Position 2 | 17.63 | 14.8 | 19.9 | |
| Position 3 | 17.61 | 15.8 | 19.9 | |
| Position 4 | NaN | NaN | NaN | |
| Line 3 & 4 | Position 1 | 42.65 | 28.4 | 57.4 |
| Position 2 | 41.75 | 24.9 | 64.8 | |
| Position 3 | 44.16 | 33.7 | 61.6 | |
| Position 4 | 43.35 | 33.9 | 68.2 | |
| Line 5 | Position 1 | 43.58 | 39.2 | 48 |
| Position 2 | 41.93 | 32.8 | 56.3 | |
| Position 3 | 35.04 | 28.1 | 47.8 | |
| Position 4 | 34.81 | 31.6 | 39.8 | |
| Line 6 | Position 1 | 37.26 | 30.5 | 42.6 |
| Position 2 | 37.74 | 32.2 | 43.6 | |
| Position 3 | 35.85 | 31.3 | 42.3 | |
| Position 4 | 33.86 | 29.6 | 39.6 |
Table 5.
Average, minimum, and maximum PM10 values on weekdays across various lines and positions.
| Line | Position | Average PM10 (µg/m3) | Min PM10 (µg/m3) | Max PM10 (µg/m3) |
|---|---|---|---|---|
| Line 1 | Position 1 | 18.42 | 12.2 | 23.7 |
| Position 2 | 17.04 | 9.6 | 22.9 | |
| Position 3 | 17.24 | 12.6 | 24.3 | |
| Position 4 | NaN | NaN | NaN | |
| Line 2 | Position 1 | 23.92 | 12.4 | 35.5 |
| Position 2 | 25.29 | 18.1 | 34.6 | |
| Position 3 | 28.46 | 21.2 | 37.6 | |
| Position 4 | NaN | NaN | NaN | |
| Line 3 & 4 | Position 1 | 99.39 | 48.9 | 143.4 |
| Position 2 | 74.53 | 47 | 134.6 | |
| Position 3 | 66.01 | 47.2 | 100.1 | |
| Position 4 | 65.45 | 35.7 | 92.5 | |
| Line 5 | Position 1 | 86.44 | 55.5 | 109.8 |
| Position 2 | 65.61 | 43.9 | 102.7 | |
| Position 3 | 43.02 | 26.4 | 81.1 | |
| Position 4 | 39.25 | 22.8 | 68.8 | |
| Line 6 | Position 1 | 58.52 | 28.7 | 91.3 |
| Position 2 | 45.32 | 27.6 | 75 | |
| Position 3 | 43.93 | 23 | 68.5 | |
| Position 4 | 60.2 | 43.1 | 92.9 |
Table 6.
Average, minimum, and maximum PM10 values on weekends across various lines and positions.
| Line | Position | Average PM10 (µg/m3) | Min PM10 (µg/m3) | Max PM10 (µg/m3) |
|---|---|---|---|---|
| Line 1 | Position 1 | 28.39 | 25 | 33.4 |
| Position 2 | 27.15 | 22.7 | 33.8 | |
| Position 3 | 27.84 | 24 | 35.8 | |
| Position 4 | NaN | NaN | NaN | |
| Line 2 | Position 1 | 19.41 | 16.2 | 22.6 |
| Position 2 | 20.87 | 16.2 | 29.4 | |
| Position 3 | 18.69 | 16.6 | 22.6 | |
| Position 4 | NaN | NaN | NaN | |
| Line 3 & 4 | Position 1 | 67.06 | 38.7 | 93.6 |
| Position 2 | 62.59 | 31.9 | 112.8 | |
| Position 3 | 55.84 | 42 | 83 | |
| Position 4 | 56.37 | 39.6 | 97.8 | |
| Line 5 | Position 1 | 60.55 | 50.9 | 70.7 |
| Position 2 | 57.87 | 38.2 | 96.3 | |
| Position 3 | 42.76 | 32.2 | 74.2 | |
| Position 4 | 39.92 | 33.5 | 51 | |
| Line 6 | Position 1 | 43.54 | 32.6 | 60.3 |
| Position 2 | 46.61 | 38.5 | 54.3 | |
| Position 3 | 43.59 | 33.9 | 52.7 | |
| Position 4 | 43.14 | 33.6 | 55.3 |
Disclaimer/Publisher’s Note: The statements, opinions and data contained in all publications are solely those of the individual author(s) and contributor(s) and not of MDPI and/or the editor(s). MDPI and/or the editor(s) disclaim responsibility for any injury to people or property resulting from any ideas, methods, instructions or products referred to in the content. |
© 2024 by the authors. Licensee MDPI, Basel, Switzerland. This article is an open access article distributed under the terms and conditions of the Creative Commons Attribution (CC BY) license (http://creativecommons.org/licenses/by/4.0/).
Copyright: This open access article is published under a Creative Commons CC BY 4.0 license, which permit the free download, distribution, and reuse, provided that the author and preprint are cited in any reuse.


