
Submitted:
21 November 2024
Posted:
22 November 2024
You are already at the latest version
Abstract
(1) Background: NGC 3516 is an active Seyfert galaxy, which has become a focal point of astronomical studies due to its variable luminosity and emission lines, linked to the activity of its central supermassive black hole (SMBH). This paper presents an analysis of long-term observations from 2014 to 2024, including photometric and spectroscopic data collected at the Fesenkov Astrophysical Institute (FAI, Kazakhstan) and the Shamakhy Astrophysical Observatory (SHAO, Azerbaijan). The primary aim of this study was to investigate the changes in luminosity and spectral characteristics of NGC 3516, providing insights into the dynamics of the galaxy’s activity and its evolving chemical composition. (2) Methods: The research utilized photometric data in the B, V, R filters, along with spectroscopic observations in the wavelength range of λ4000 Å–λ7000 ÅThe spectroscopic data were normalized to analyze the profiles of emission lines and their variations over time. Broad emission line profiles (Hα and Hβ) were also analyzed to estimate radial velocities. A three-component model was applied, demonstrating a better statistical fit to the observed data, indicating a complex structure and dynamics within the galaxy’s Broad Line Region (BLR).; (3) Results: The main results of the study show that from 2018 to 2024, the brightness of NGC 3516 varied with amplitudes of ΔB=0.35 mag, ΔV=0.18 mag, ΔR=0.20 mag. An increase in brightness was observed in April 2020, likely associated with an X-ray flare detected simultaneously. Spectroscopic observations revealed a gradual weakening of the Hγλ4340 Å emission line starting from mid-2023. Narrow emission lines of [FeII] λ4814.53 Å and [FeVII] λ6087 Å were detected, indicating an active phase of the galaxy in May 2020. Photometric observations also revealed an increase in the object’s brightness in 2020. These observations suggest intriguing changes in the object’s activity, potentially indicating luminosity and chemical composition dynamics over the observed period. For the broad Hα line profile in the spectrum of NGC 3516, obtained with the AZT-8 on April 20, 2020, the radial velocity v=981−20+19 km/s. The radial velocity for the Hβ profile was 937−576+584 km/s; (4) Conclusions: Long-term observations of NGC 3516 have revealed significant changes in its luminosity and spectral characteristics, suggesting dynamic processes within the active nucleus of the galaxy. The observed variability in the broad emission line profiles could be linked to processes within the Broad Line Region (BLR) interacting with the SMBH and surrounding matter. These results may help in a more accurate estimation of the SMBH mass and provide deeper insights into the dynamics and evolution of active Seyfert galaxies.
Keywords:
Seyfert galaxy
; spectral observations
; photometric observations
; light curves
; emission lines
; broad emission components
1. Introduction
NGC 3516 is a Seyfert galaxy of spectral type Sy , with spectral variability first detected in 1968 [1,2]. Over the past 50 years, significant changes have been observed in the optical range. The variability in the line and the first measurement of the time delay of line variations relative to the continuum were first reported in 1973 [3]. NGC 3516 has permitted FeII lines and forbidden [OIII] lines, but they are much narrower compared to those in spectra of typical Sy 1 galaxies. Interestingly, the width of the lines in the spectrum of NGC 3516 is significantly narrower than in typical Sy 1 galaxies [4]. De Rosa et al. (2018) [5] found that the time delay between changes in the continuum and is ∼4–8 days, which, agreed with the measured profile width of (around 2440 km/s), yields a central black hole mass of . Observations also showed an increase in the object’s brightness due to periodic outbursts.
In 2019 and early 2020, a significant flash in the continuum was recorded, declaring several changing looks features of the galaxy [6]. Spectral features of Sy 1.5 galaxy NGC 3516 are variability and an increase of coronal lines [7], as well as a strong asymmetry in the profiles of broad lines [8].
In paper [2], long-term optical spectral monitoring of the active galactic nucleus NGC 3516 from 1996 to 2018 revealed significant changes in both the continuum and the broad lines. A minimum of activity was recorded in 2014 when the broad lines almost disappeared. This possibly indicates the presence of an obscuring region in NGC 3516 and is supported by absorption in the ultraviolet and X-ray [9,10,11]. The profiles of the broad and lines in NGC 3516 show a complex structure with features in the wings of the line profiles and an enhanced peak, indicating the complexity of the accretion disk. The time delays between changes in the continuum and the broad emission lines allowed the estimation of the central black hole mass, which is consistent with previous calculations [5].
Popovic et al. (2020) [8] discovered a very complex structure of the broad lines region (BLR) during the active phase of Sy 1 type galaxies by looking at broad and strong emission lines. There is a distinct disk-like BLR that contributes to the enhancement of the flux in the wings of the broad lines, as well as an additional intermediate line region (ILR) that enhances the intensity in the core of the line. During the high activity phase, the ILR emission is located near the centre of the line, although in some cases, it is slightly red-shifted. In the low activity phase (i.e., type 2 phase), the ILR component is significantly blue-shifted, indicating gas outflow.
To analyze the variability of the broad emission line components as reflections of dynamic processes in the circumnuclear regions of the galaxy NGC 3516, we relied on the works of various researchers in this field. For the first time, the mass of the massive central body of the galaxy was estimated using echo mapping based on the measurement of the BLR size [12]. Urry & Padovani (1995) [13] used continuous temporal photometric data and spectral observations to determine the parameters of the BLR.
Despite the large number of observations, it has not yet been possible to definitively answer which of the two scenarios better explains the observed changes in NGC 3516: the attenuation of the flux along the line of sight due to the presence of dust [14], or internal changes in the physics of the accretion disk. To understand the nature of the variability of the galaxy, it is crucial to detect transitional events not only during increased activity but also during its decline. It gave us a stimulus to monitor NGC 3516 and other objects with broad emission lines continuously.
2. Materials and Methods
2.1. Observatories, Telescopes and Equipment
The presented study used observational data obtained at Fesenkov Astrophysical Institute (Kazakhstan) and Shamakhy Astrophysical Observatory, named after Nasreddin Tusi (Azerbaijan). Several instruments were employed for conducting photometric and spectral observations and further research on the galaxy NGC 3516. Description and characteristics of the instruments used are presented in Table 1.
2.2. Methodology of Photometric Analysis
A standard method for photometric data reduction was used, including operations with dark subtractions and flat fielding. Brightness measurements were performed using the MaximDL Pro6 software suite. For a measure of images of galaxy NGC 3516, an aperture of was used. The star GSC 04391−00762 with coordinates RA: ::; Dec: :: and known brightness values B=; V=; R= [15] was chosen as photometric standard. To convert instrumental magnitudes to the standard B, V, and Rc system, the corresponding systems of equations were applied [16].
2.3. Methodology of Spectral Analysis
Variability of the broad components of emission lines may reflect the dynamic processes in the circumnuclear regions of the galaxy. The velocity dispersion of broad emission lines may be used to estimate the mass of supermassive black holes in active galactic nuclei. In our work, we used the approximation of the broad components of and with the composite models, applying Gaussian and Voigt functions to describe the line profile shapes. Bayesian analysis and the Bayesian factor were suitable for selecting the most likely model [12]. The nested sampling method was used to reach the models’ reliability and posterior distributions of the parameters, implemented in the DYNESTY package [17,18]. Non-informative uniform distributions were chosen as prior information for the parameters.
3. Results
3.1. Results of Photometric and Spectral Studies of the Galaxy NGC 3516
Spectral observations of the Seyfert galaxy NGC 3516 of the class Sy 1.5 have been conducted at FAI since 1976, while photometric studies have been ongoing since 2014 [19]. The light curve in Figure 1 presents the results of the measurements obtained between 2014 and 2024.
The brightness of NGC 3516 fluctuated during 2018–2024 with the amplitudes: mag, mag, mag. During the outburst, the X-ray flux peaked on April 1, 2020, showing the highest value recorded for NGC 3516 by the Neil Gehrels Swift Observatory [20]. Later, on April 18, 2020 brightness of the galaxy started to increase in optical range with the temporal decline by (Figure 1). Such correlations are also shown in previous studies [20]. The authors believe this may be due to partial attenuation of the emission along the line of sight by Compton-thick clouds with strong Compton scattering. The data obtained from SHAO and FAI from 2020 to 2024 were used for the spectral analysis. The spectra of NGC 3516 in the spectral range from Å to Å were normalized to the mean value for profile comparison Figure 2. It was noted that on May 29, 2020, the spectrum presents prominent narrow resolved emission lines [FeII] Å and [FeVII] Å, which confirms the ongoing object’s activity phase.
When approximating emission line profiles in the spectrum with composite models, we apply a so-called “uninformative” approach as prior information for each model parameter. In this approach, the probability of a given parameter value is uniformly distributed within a specific range derived, for example, from previous studies of this object. This paper presents an analysis of spectral data of NGC 3516 obtained in April 20, 2020 with the AZT-8 telescope.
To describe the stellar component of the galaxy, we approximate the combined (stitched) spectrum of the galaxy using a set of templates with metallicity = and ages of billion years (a total of 9 spectra). In other words, we use a combination of spectra to accurately describe the light emitted by all the stars in the galaxy and account for their contribution to the overall spectrum. The result is shown in Figure 3.
We apply a Bayesian approach to determining the main parameters in the region of narrow emission lines (NLE) and broad emission lines (BLE), such as velocity dispersion and radial velocities, and identifying the most plausible model (the number of components in BLE). The “Bayesian evidence” factor is determined using the nested sampling method implemented in the DYNESTY package. Recall that the task in the Bayesian approach is formulated as follows. Given observational data (D) and a model with free parameters (), Bayes’ theorem is stated as:
where the likelihood function is determined by the observed data, and the prior information about the parameters and what we already know about the model’s parameters is given by the probability distribution function . Often, is specified as a uniform distribution over a specific range of values, though in some cases, it is set as a normal distribution centred around a most likely value.
The greatest difficulty in obtaining absolute values of comes from the parameter , Bayesian evidence, which defines the probability distribution of obtaining the observed data across the entire parameter space , which is
which is often not possible. In the case where is specified as a uniform distribution over the entire parameter space and we assume that , we obtain
which automatically leads us to the standard least squares method if the likelihood function is a normal distribution.
The selection of the most “plausible” model between model 0 and model 1 is based on the Bayesian factor:
or, equivalent:
There is a Jeffreys scale on which the preference for one model (0) over another (1) is evaluated. It is generally accepted that if , the decision is inconclusive, and the models are essentially equivalent. If , there is significant preference for model 0; if model 0 is clearly preferable to model 1; and if , model 0 should definitely be chosen as the priority over model 1.
3.1.1. Approximation of the Spectrum in the Range 4652 Å–5172 Å
In the considered spectral range, the NLE are represented by Å, [OIII] 4959 Å, and [OIII] 5007 Å. A Voigt function describes the NLE in the spectrum. All NLE in the given spectral range are assumed to have the same velocity dispersions. The amplitude ratio in the [OIII] doublet is related by .
3.2. Two-Component Profile of BLE in H
The total number of parameters in the model spectrum is 12 in this case. The approximation result is shown in Figure 4 (left). On the right of Figure 4, the corresponding tracers are displayed, reflecting the search path for the value range of each parameter.
Based on the approximation results, , and the parameter values are: km/s, v km/s, km/s.
3.3. Approximation of the Spectrum in the Range 6192 Å–6894 Å
In the considered spectral range, we analyze the lines at , , H , , , , and . A Voigt function describes the NLE lines in the spectrum. All NLE in the given spectral range are assumed to have the same velocity dispersions. The amplitude ratio in the doublet is related by a factor of .
3.4. Two-Component Profile of BLE in H
3.5. Three-Component Profile of BLE in H
The total number of parameters in the model spectrum is 15 in this case. The approximation result is shown in Figure 6 (left). On the right of Figure 6, the corresponding tracers are displayed, reflecting the search path for the value range of each parameter. Based on the approximation results, , and the parameter values are: km/s, km/s, km/s, km/s.
Based on the approximation results, , and the parameter values are: km/s, km/s, km/s.
3.6. Three-Component Profile of BLE in
The total number of parameters in the model spectrum is 20 in this case. The approximation result is shown in Figure 7 (left). On the right of Figure 7, the corresponding tracers are displayed, reflecting the search path for the value range of each parameter.
Based on the approximation results, , and the parameter values are: km/s, km/s, km/s, km/s.
In our case, for the H range, the value of , which indicates a significant preference for the three-component model (almost 16 times more likely). For the spectral range around H, , which, given the precision of this parameter’s determination, does not allow for a definitive decision on which model is more likely. Considering the higher noise level and the error values in the H range, we will choose the two-component model for describing in the and lines. FWHM km/s, FWHM km/s, v km/s, km/s, km/s,
km/s.
3.7. Explanations for the Definition of Parameter Values (Notations)
the parameter is determined by the difference between the central wavelengths of the “red” and “blue” components of the broad profile relative to the Å value. We assume the velocity value is the same for both components, differing only in sign. The same applies to the parameter.
4. Conclusions
The study presents the analysis of the results of the long-term observations (2014–2024) of the Seyfert galaxy NGC 3516. According to our photometric data, in 2018–2024, the brightness of the galaxy NGC 3516 varied, with amplitudes: mag, mag, mag. The X-ray flash, which took place in April 2020, also appeared in the optical range (Figure 1).
The spectra of NGC 3516 in the wavelength range Å– Å during the period from 2020 to 2023 were normalized to the mean value for profile comparison (Figure 2). Analyzing the normalized spectra showed that starting from mid-2023, the emission lines of Å have gradually weakened compared to observations from 2020. The bright, narrow emission lines (FeII) Å and [FeVII] Å were detected in the spectrum of the object on May 29, 2020. They indicated an active stage of the object’s evolution.
For the broad line profile in the spectrum of NGC 3516, obtained with the AZT-8 on April 20, 2020, the radial velocity km/s. The radial velocity for the profile was km/s.
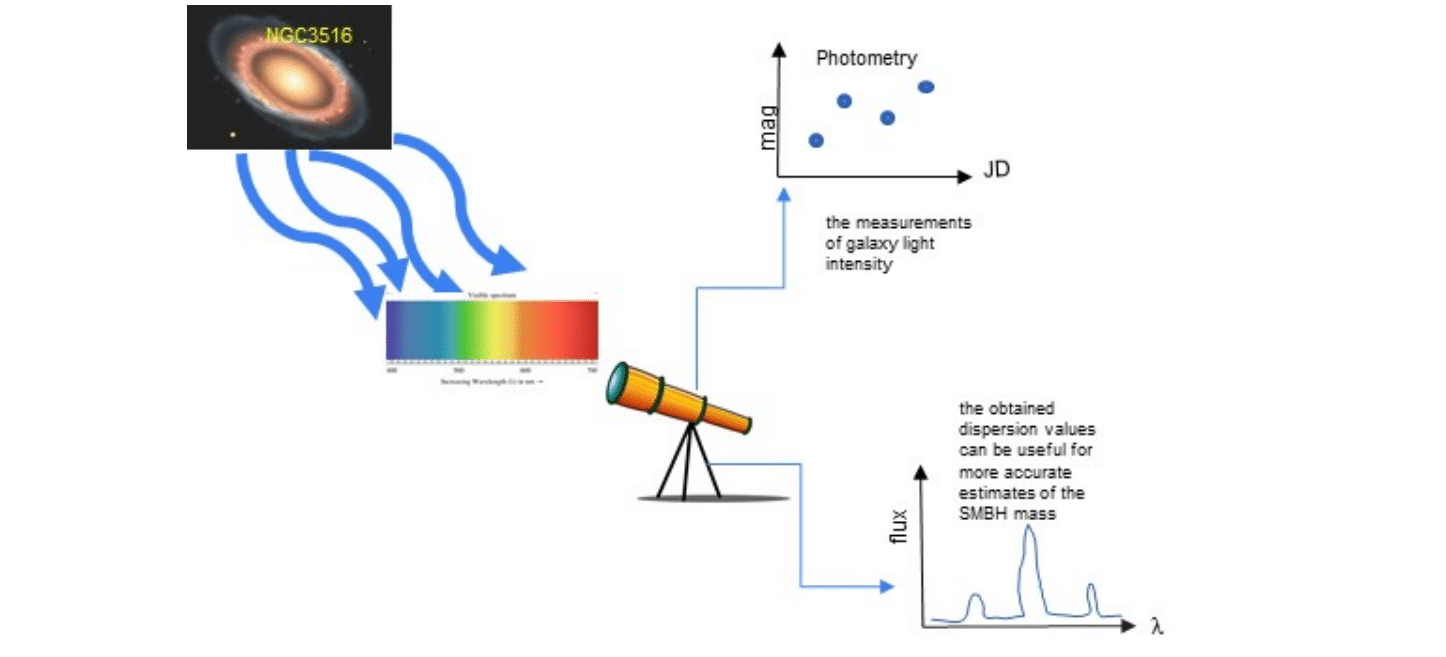
These observations may signify significant changes in the object’s activity and allow us to make conclusions about its luminosity and chemical composition dynamics over the considered period. The analysis of broad emission lines turned out to be quite complex. Our work demonstrates that a three-component model, including an additional broad component, provides better statistical compliance with the observed data. Observed optical variability in the profiles and fluxes of broad emission lines may provide crucial insights into the Broad Line Region (BLR) dynamics and its interactions with the Supermassive Black Hole (SMBH) and surrounding structures. Obtained dispersion values for narrow and broad emission lines can be useful for more accurate estimates of the SMBH mass. These results expand our understanding of the dynamics and activity of NGC 3516 and significantly contribute to the study of Seyfert galaxies.
Author Contributions
Conceptualization, methodology and visualization, S.S. and A.S.; software, A.S.; validation, L.A.; formal analysis, L.K. and Y.A.; investigation, S.S. and L.K.; resources, V.K., N.H. and S.R.; data curation, S.S. and L.A.; writing—original draft preparation, review and editing, S.S., A.S. and L.K.; supervision, project administration and funding acquisition, S.S. All authors have read and agreed to the published version of the manuscript.
Funding
This research is funded by the Ministry of Science and Higher Education of the Republic of Kazakhstan (Grant No. AP22784884 and Grant No.BR24992759).
Informed Consent Statement
Not applicable.
Data Availability Statement
Research data can be provided upon reasonable request.
Acknowledgments
The authors express their gratitude to the SHAO team and the FAI observers for their assistance in organizing and conducting the spectral and photometric observations.
Conflicts of Interest
The authors declare no conflicts of interest. The funders had no role in the design of the study, in the collection, analyses, or interpretation of data, in the writing of the manuscript, or in the decision to publish the results.
References
- Andrillat, Y.; Souffrin, S. Variations du Spectre du Noyau de la Galaxie de Seyfert NGC 3516. Astrophysical Letters 1968. [Google Scholar]
- Shapovalova, A.I.; Popovic, L.C.; Afanasiev, V.L.; Ilic, D.; Kovacevic, A.; Burenko, A.N.; Chavushyan, V.H.; et al. . Long-term optical spectral monitoring of a changing-look active galactic nucleus NGC 3516 - I. Continuum and broad-line flux variability. Monthly Notices of the Royal Astronomical Society 2014, 485, 4790–4803. [Google Scholar] [CrossRef]
- Cherepashchuk, A.M.; Lyutyi, V.M. Rapid Variations of Halpha Intensity in the Nuclei of Seyfert Galaxies NGC 4151, 3516, 1068. Astrophysical Letters 1973, 13, 165. [Google Scholar]
- Pogge, R. Narrow-line Seyfert 1s: 15 years later. New Astronomy Reviews 2000, 44. [Google Scholar] [CrossRef]
- De Rosa, G.; Fausnaugh, M.M.; Grier, C.J.; et al. . Velocity-resolved Reverberation Mapping of Five Bright Seyfert 1 Galaxies. ApJ 2018, 866, 133. [Google Scholar] [CrossRef]
- Oknyansky, V.; Mikailov, K.; Huseynov, N. Changing Looks of the Nucleus of Seyfert Galaxy NGC 3516 during 2016–2020. Astronomy Reports. 2020, 64, 979–984. [Google Scholar] [CrossRef]
- Ilic, D.; Oknyansky, V.; Popovic, L.; Tsygankov, S.; Belinski, A.; et al. . A flare in the optical spotted in the changing-look Seyfert NGC 3516. Astronomy and Astrophysics. 2020, 638, 7. [Google Scholar] [CrossRef]
- Popovic, L.; Ilic, D.; Burenkov, A.; et al. . Long-term optical spectral monitoring of a changing-look active galactic nucleus NGC 3516. II. Astronomy and Astrophysics. 2020, 675, 14. [Google Scholar] [CrossRef]
- Kraemer, S.B.; Crenshaw, D.M.; George, I.M.; Netzer, H.; Turner, T.J.; R., G.J. Variable Ultraviolet Absorption in the Seyfert 1 Galaxy NGC 3516: The Case for Associated Ultraviolet and X-Ray Absorption. 2002, 577. [CrossRef]
- Mathur, S. and Wilkes, B. J. and Aldcroft, T. The X-Ray Warm Absorber in NGC 3516. The Astrophysical Journal 1997, 478. [Google Scholar] [CrossRef]
- Turner, T.J.; Kraemer, S.B.; George, I.M.; Reeves, J.N.; Bottorff, M.C. Complex X-Ray Absorption and the Fe Kα Profile in NGC 3516. The Astrophysical Journal 2005, 618. [Google Scholar] [CrossRef]
- Blandford.; McKee. Reverberation mapping of the emission line regions of Seyfert galaxies and quasars. Astrophysical Journal 1982, 255. [CrossRef]
- Urry.; Padovani. Unified Schemes for Radio-Loud Active Galactic Nuclei. Astronomical Society of the Pacific 1995, 107. [CrossRef]
- Mehdipour, M.; Kriss, G.A.; Brenneman, L.W.e.a. Changing-look Event in NGC 3516: Continuum or Obscuration Variability? The Astrophysical Journal 2022, 925. [Google Scholar] [CrossRef]
- Doroshenko, V.; Sergeev, S.; et al. . BVRI CCD Photometry of Comparison Stars in the Fields of 44 Active Galaxies. Astronomical Society of the Pacific. 2007, 360. [Google Scholar]
- Shomshekova, S.A.; Reva, I.V.; Kondratyeva, L. Standardization of the photometric system of the 1-meter telescope on TSHAO. National Academy of Sciences of the Republic of Kazakhstan Physico-Mathematical Series. 2017, 4. [Google Scholar]
- Speagle, J. Dynesty: a dynamic nested sampling package for estimating Bayesian posteriors and evidences. Monthly Notices of the Royal Astronomical Society 2020, 493. [Google Scholar] [CrossRef]
- Sergey Koposov, Josh Speagle, Kyle Barbary, Gregory Ashton, Ed Bennett, Johannes Buchner, Carl Scheffler, Ben Cook, Colm Talbot, James Guillochon, Patricio Cubillos, Andrés Asensio Ramos, Ben Johnson, Dustin Lang, Ilya, Matthieu Dartiailh, Alex Nitz, Andrew McCluskey and Anne Archibald.., 2023. DYNESTY.
- Shomshekova, S.; Denissyuk, E.; et al. . Photometric studies of the Seyfert Galaxies NGC3516, NGC5548, NGC3227, NGC4051, NGC415 and NGC7469. Astrophysics 2019, 62. [Google Scholar]
- Oknyansky, V.L. and Brotherton, M.S. and Tsygankov, S.S. and Dodin, A.V. and et al.. Multi-Wavelength Monitoring and Reverberation Mapping of a Changing Look Event in the Seyfert Galaxy NGC 3516. Monthly Notices of the Royal Astronomical Society 2021, 505. [Google Scholar] [CrossRef]
Figure 1.
Light curves of NGC 3516 in B, V, Rc filters. On the X-axis: Julian Date, on the Y-axis: apparent stellar magnitude. FAI data (2014–2024).
Figure 1.
Light curves of NGC 3516 in B, V, Rc filters. On the X-axis: Julian Date, on the Y-axis: apparent stellar magnitude. FAI data (2014–2024).
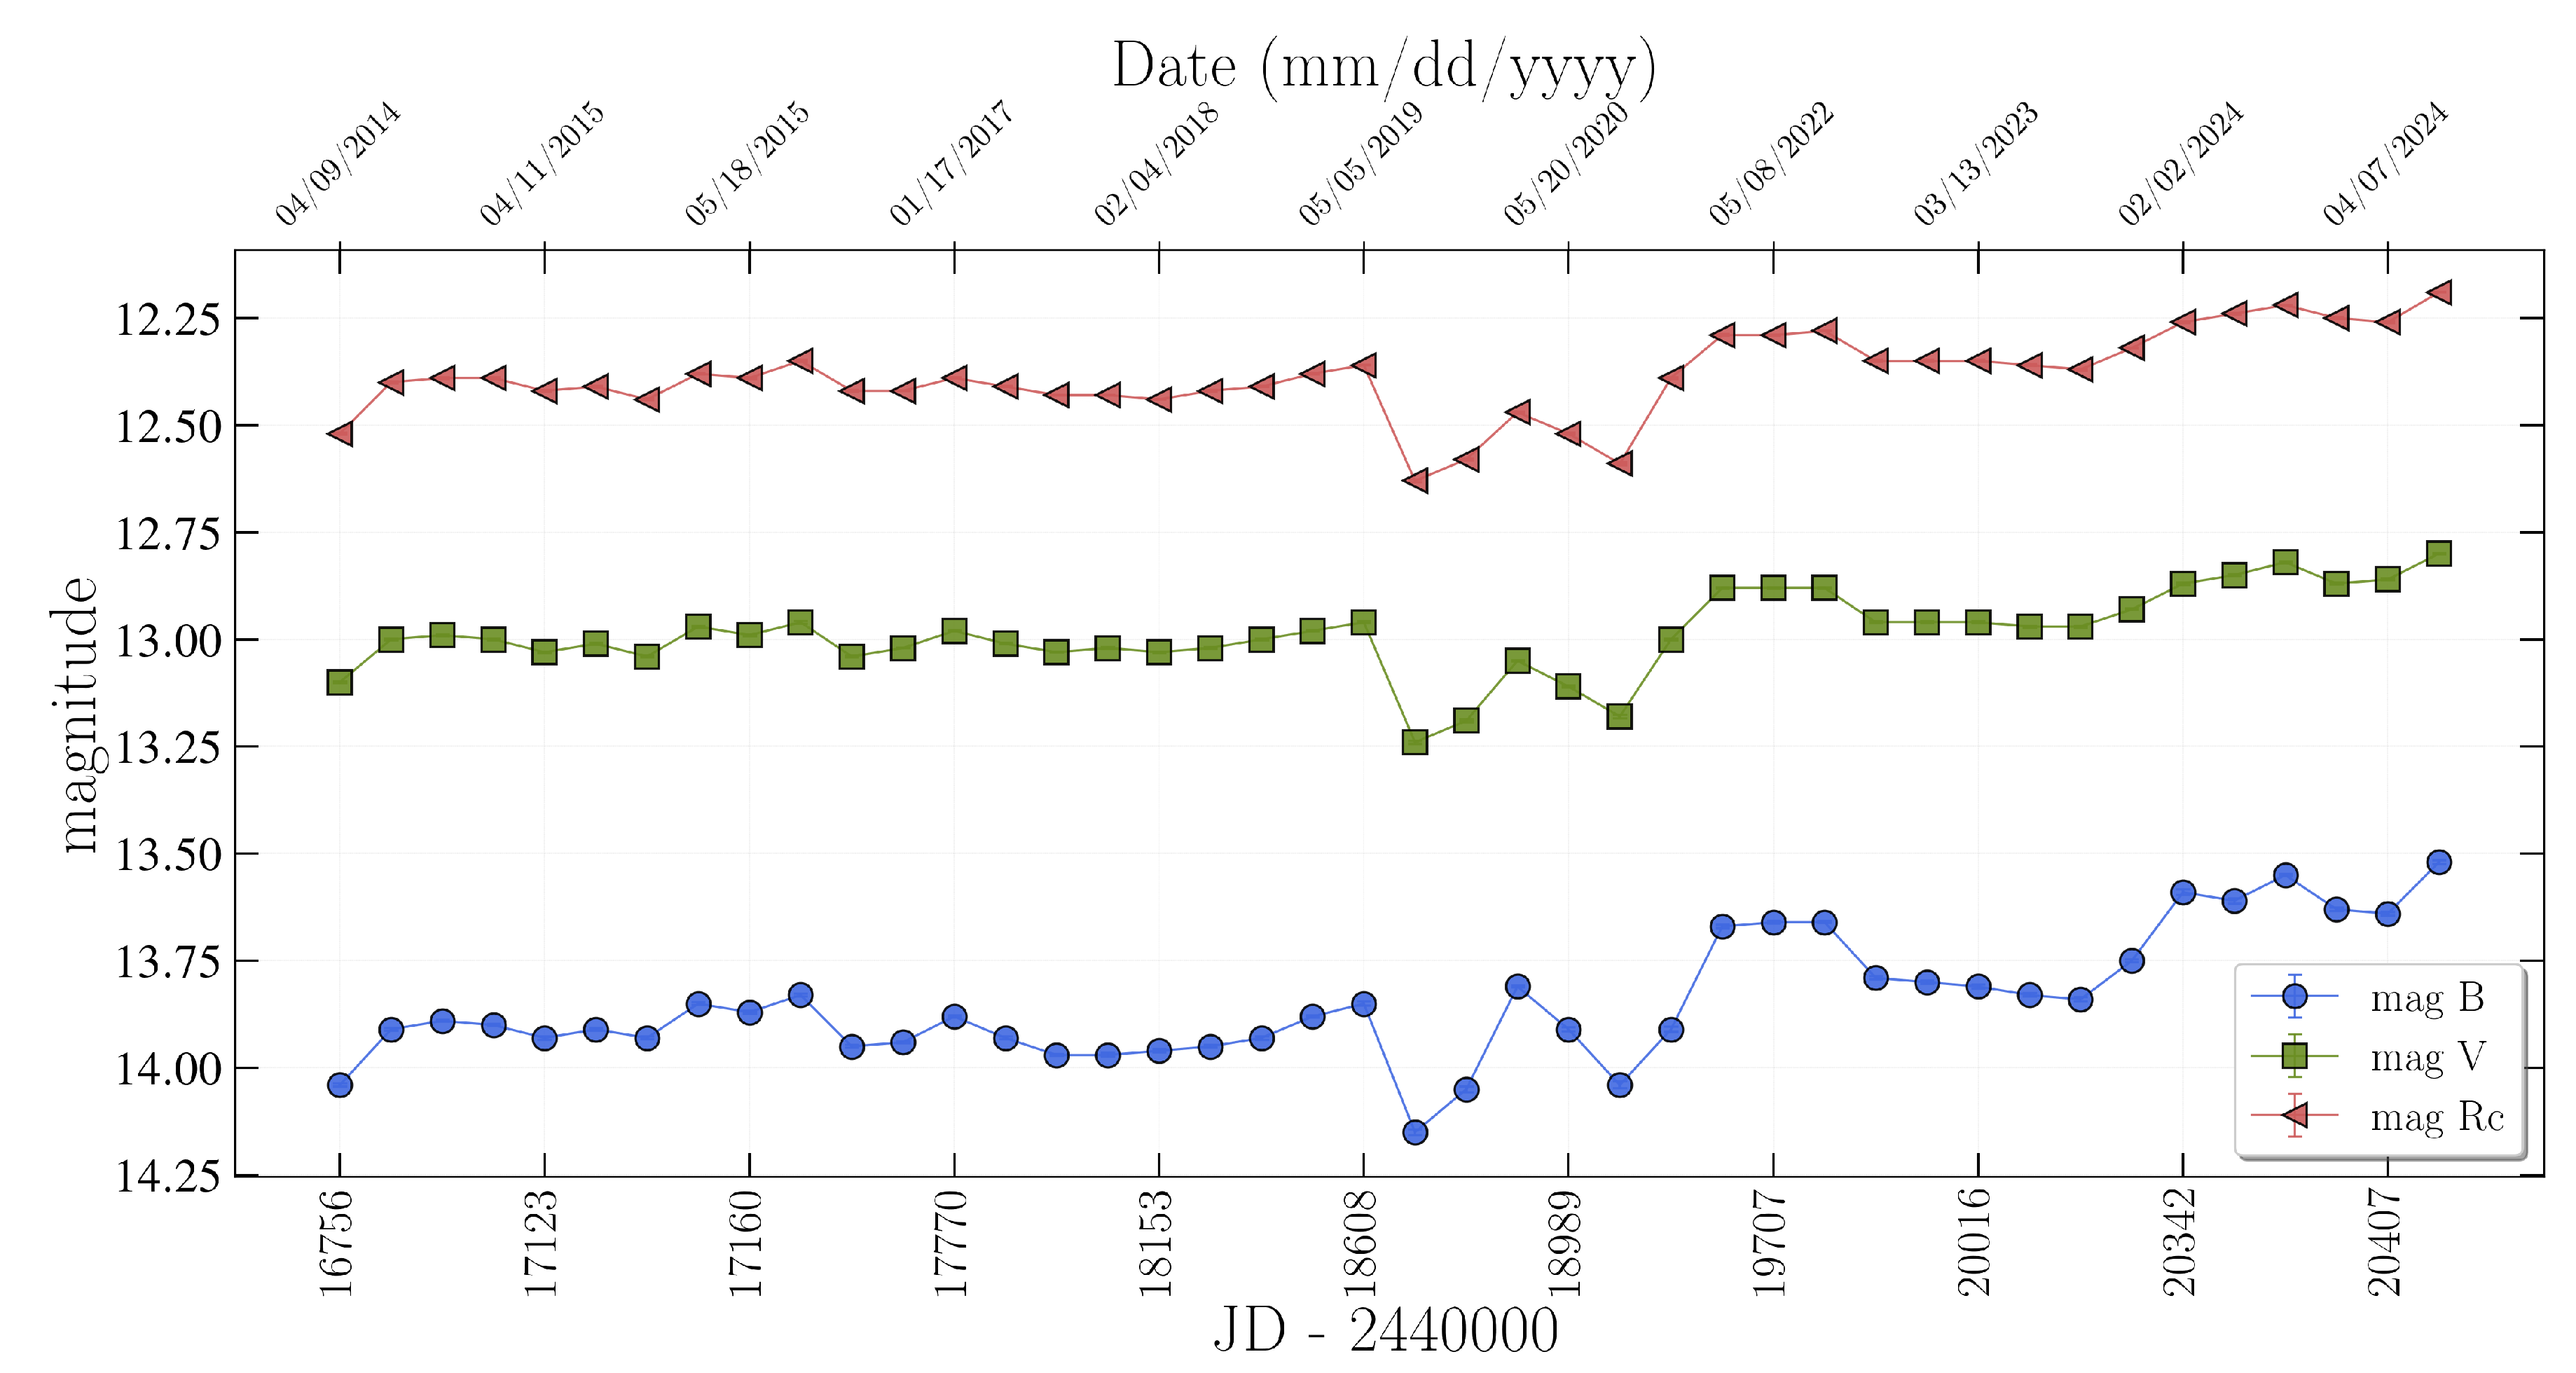
Figure 2.
Spectra of NGC 3516, in the spectral range from Å to Å during the period of 2020–2023. For comparison purposes, the spectra are normalized to the mean value (Observations of SHAO).
Figure 2.
Spectra of NGC 3516, in the spectral range from Å to Å during the period of 2020–2023. For comparison purposes, the spectra are normalized to the mean value (Observations of SHAO).
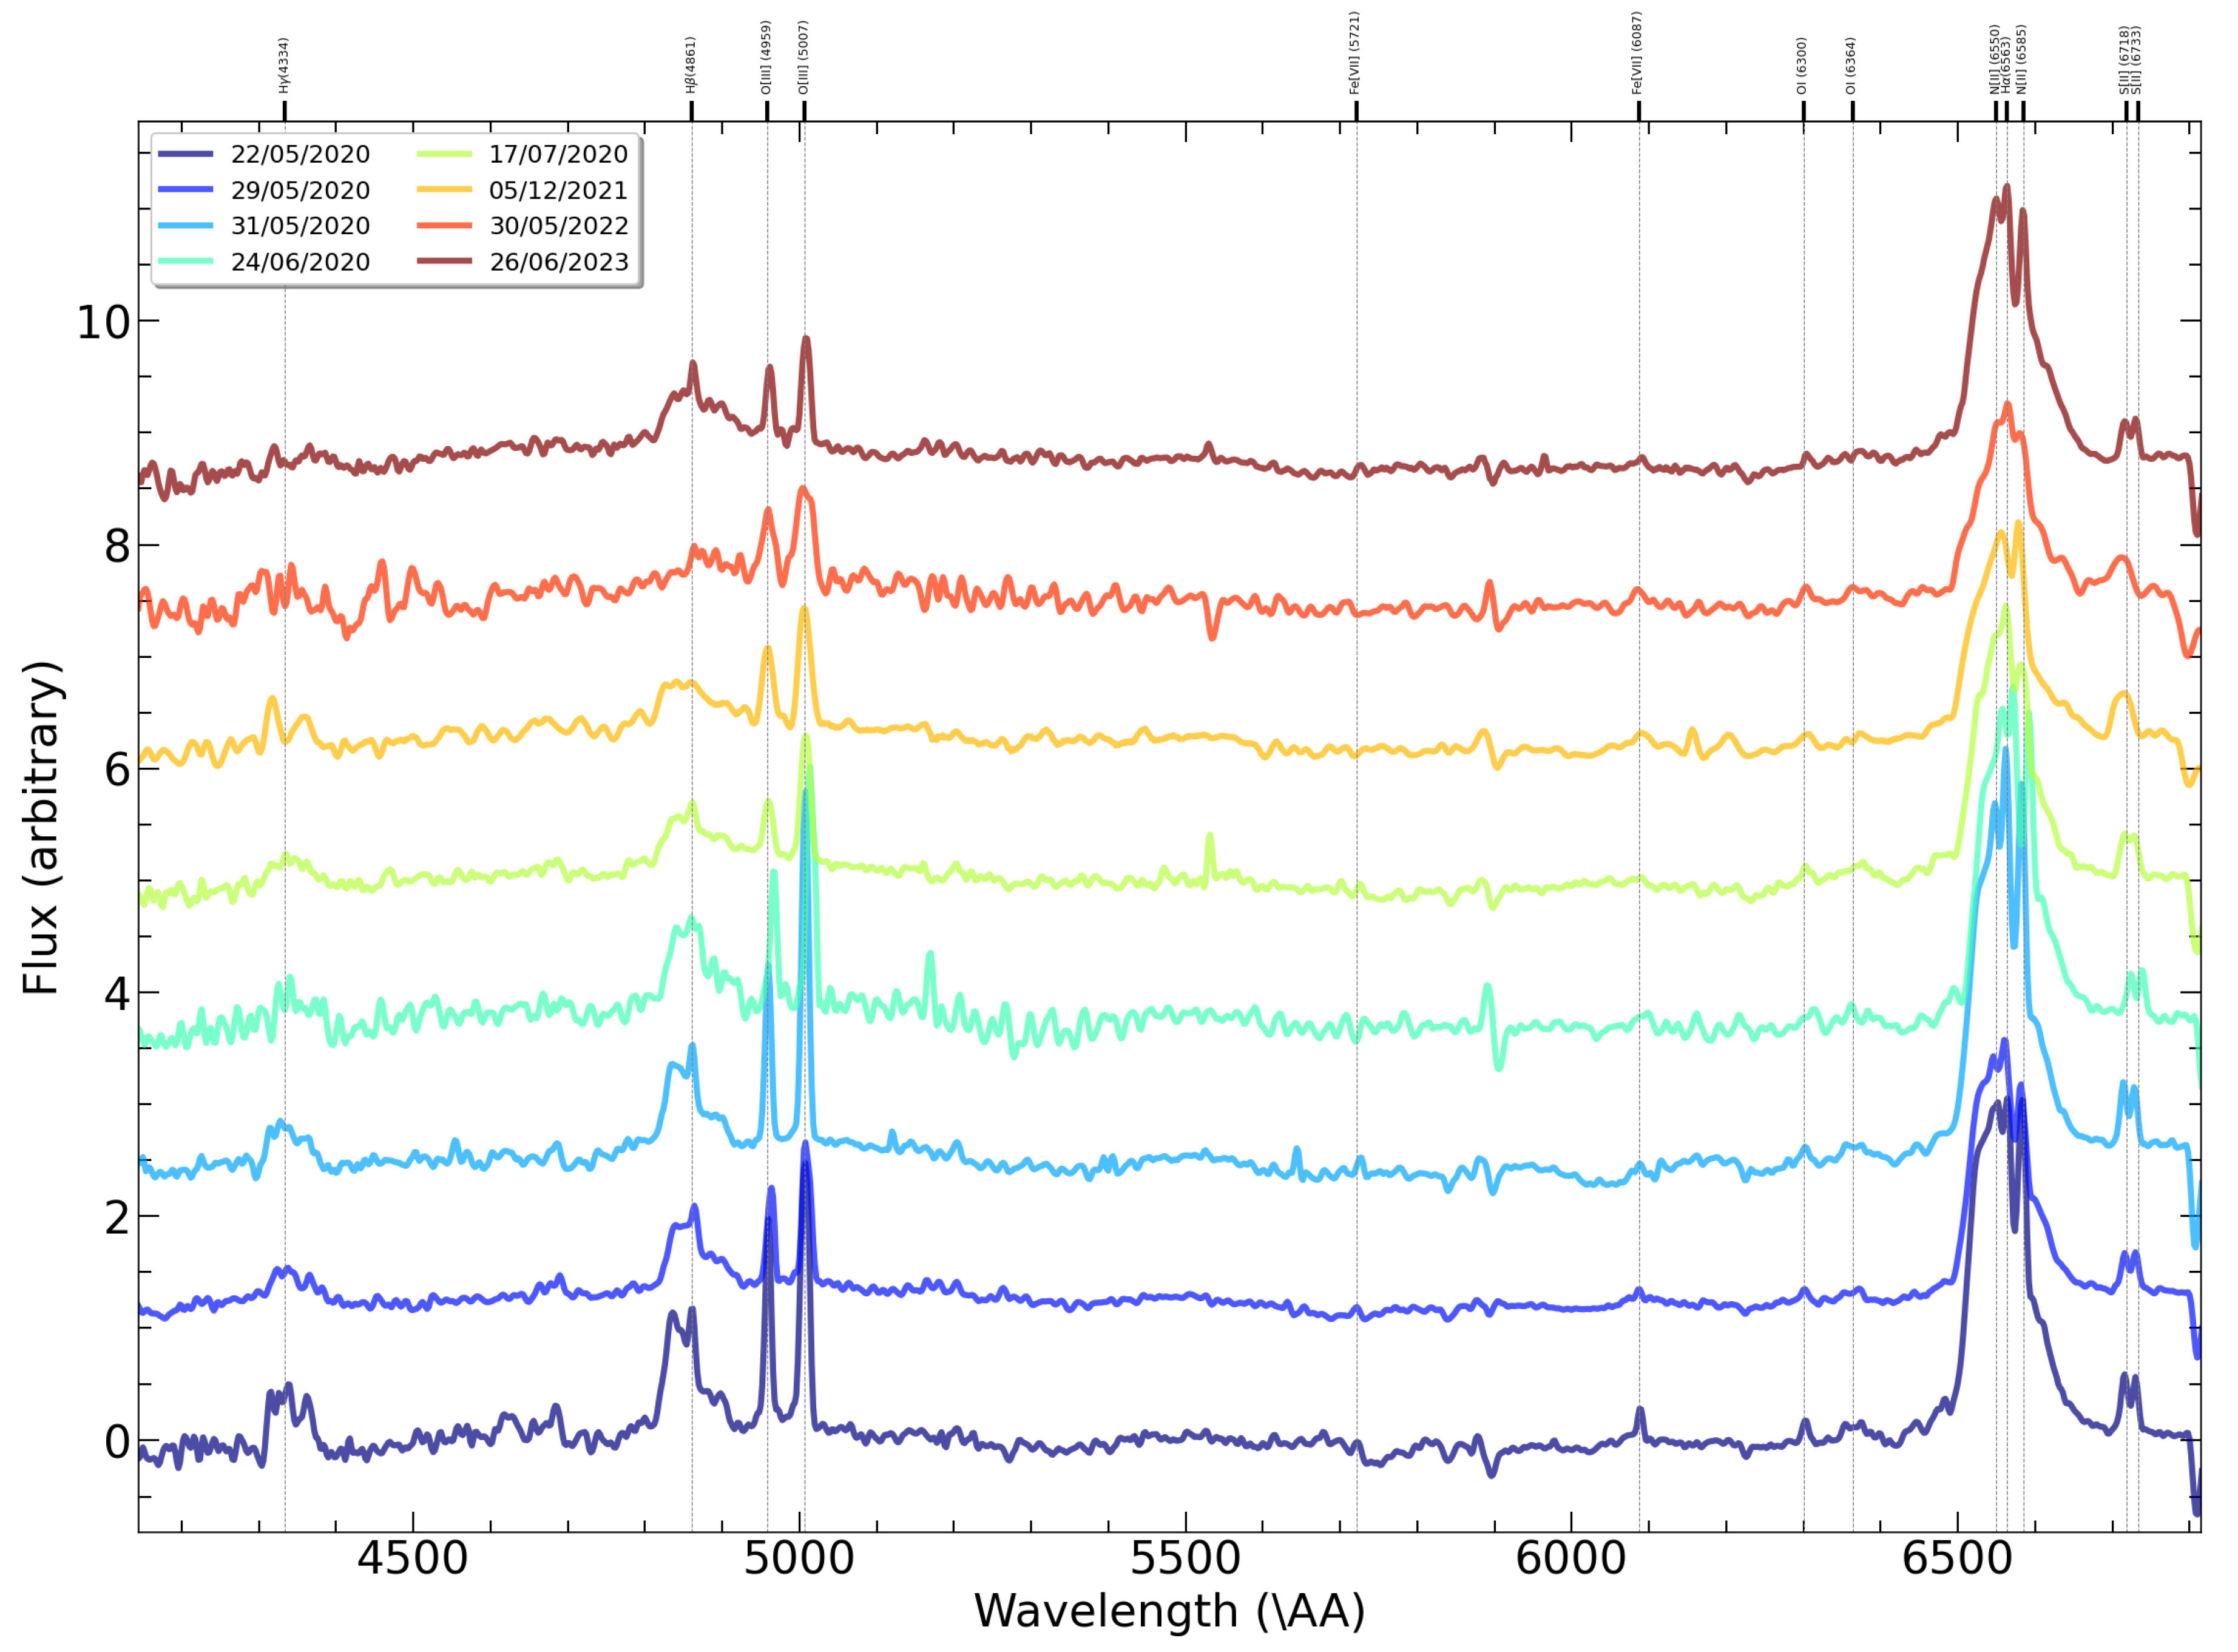
Figure 3.
Result of considering the stellar component in the spectrum of the galaxy NGC 3516 using the STARLIGHT package for observations dated April 20, 2020.
Figure 3.
Result of considering the stellar component in the spectrum of the galaxy NGC 3516 using the STARLIGHT package for observations dated April 20, 2020.
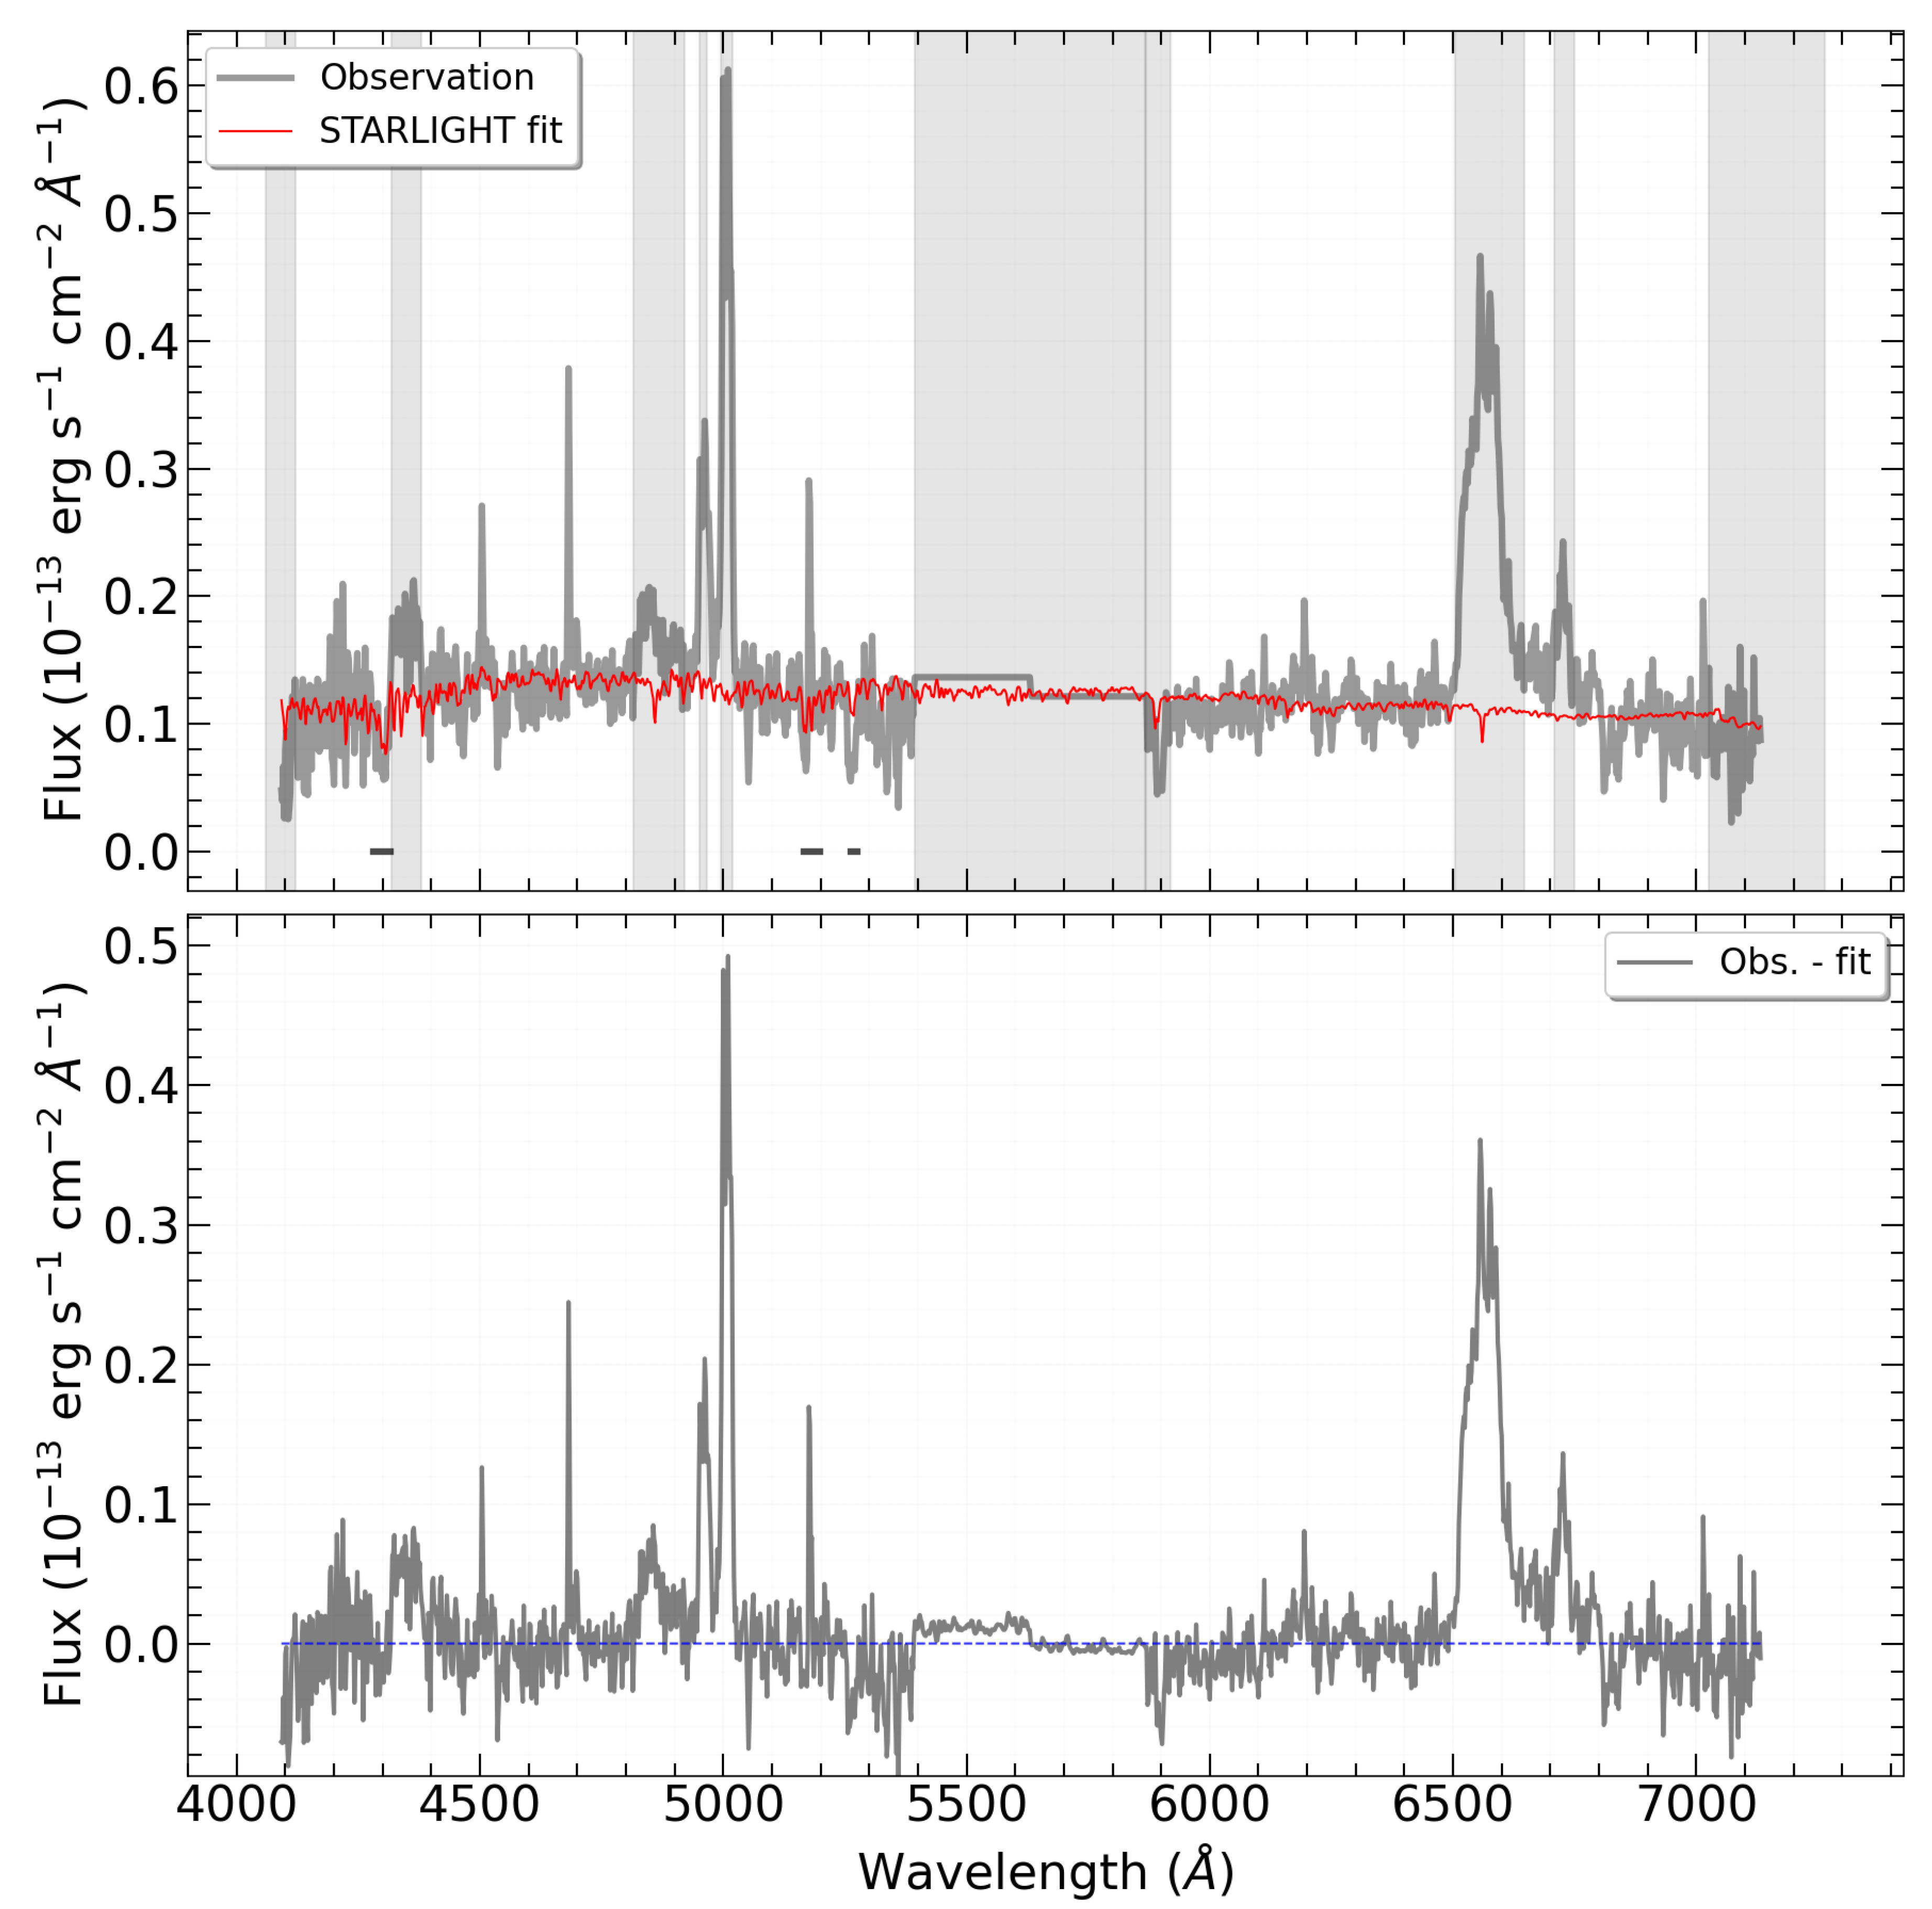
Figure 4.
The result of the approximation with the combined profile (left) and the tracers for each parameter (right).
Figure 4.
The result of the approximation with the combined profile (left) and the tracers for each parameter (right).
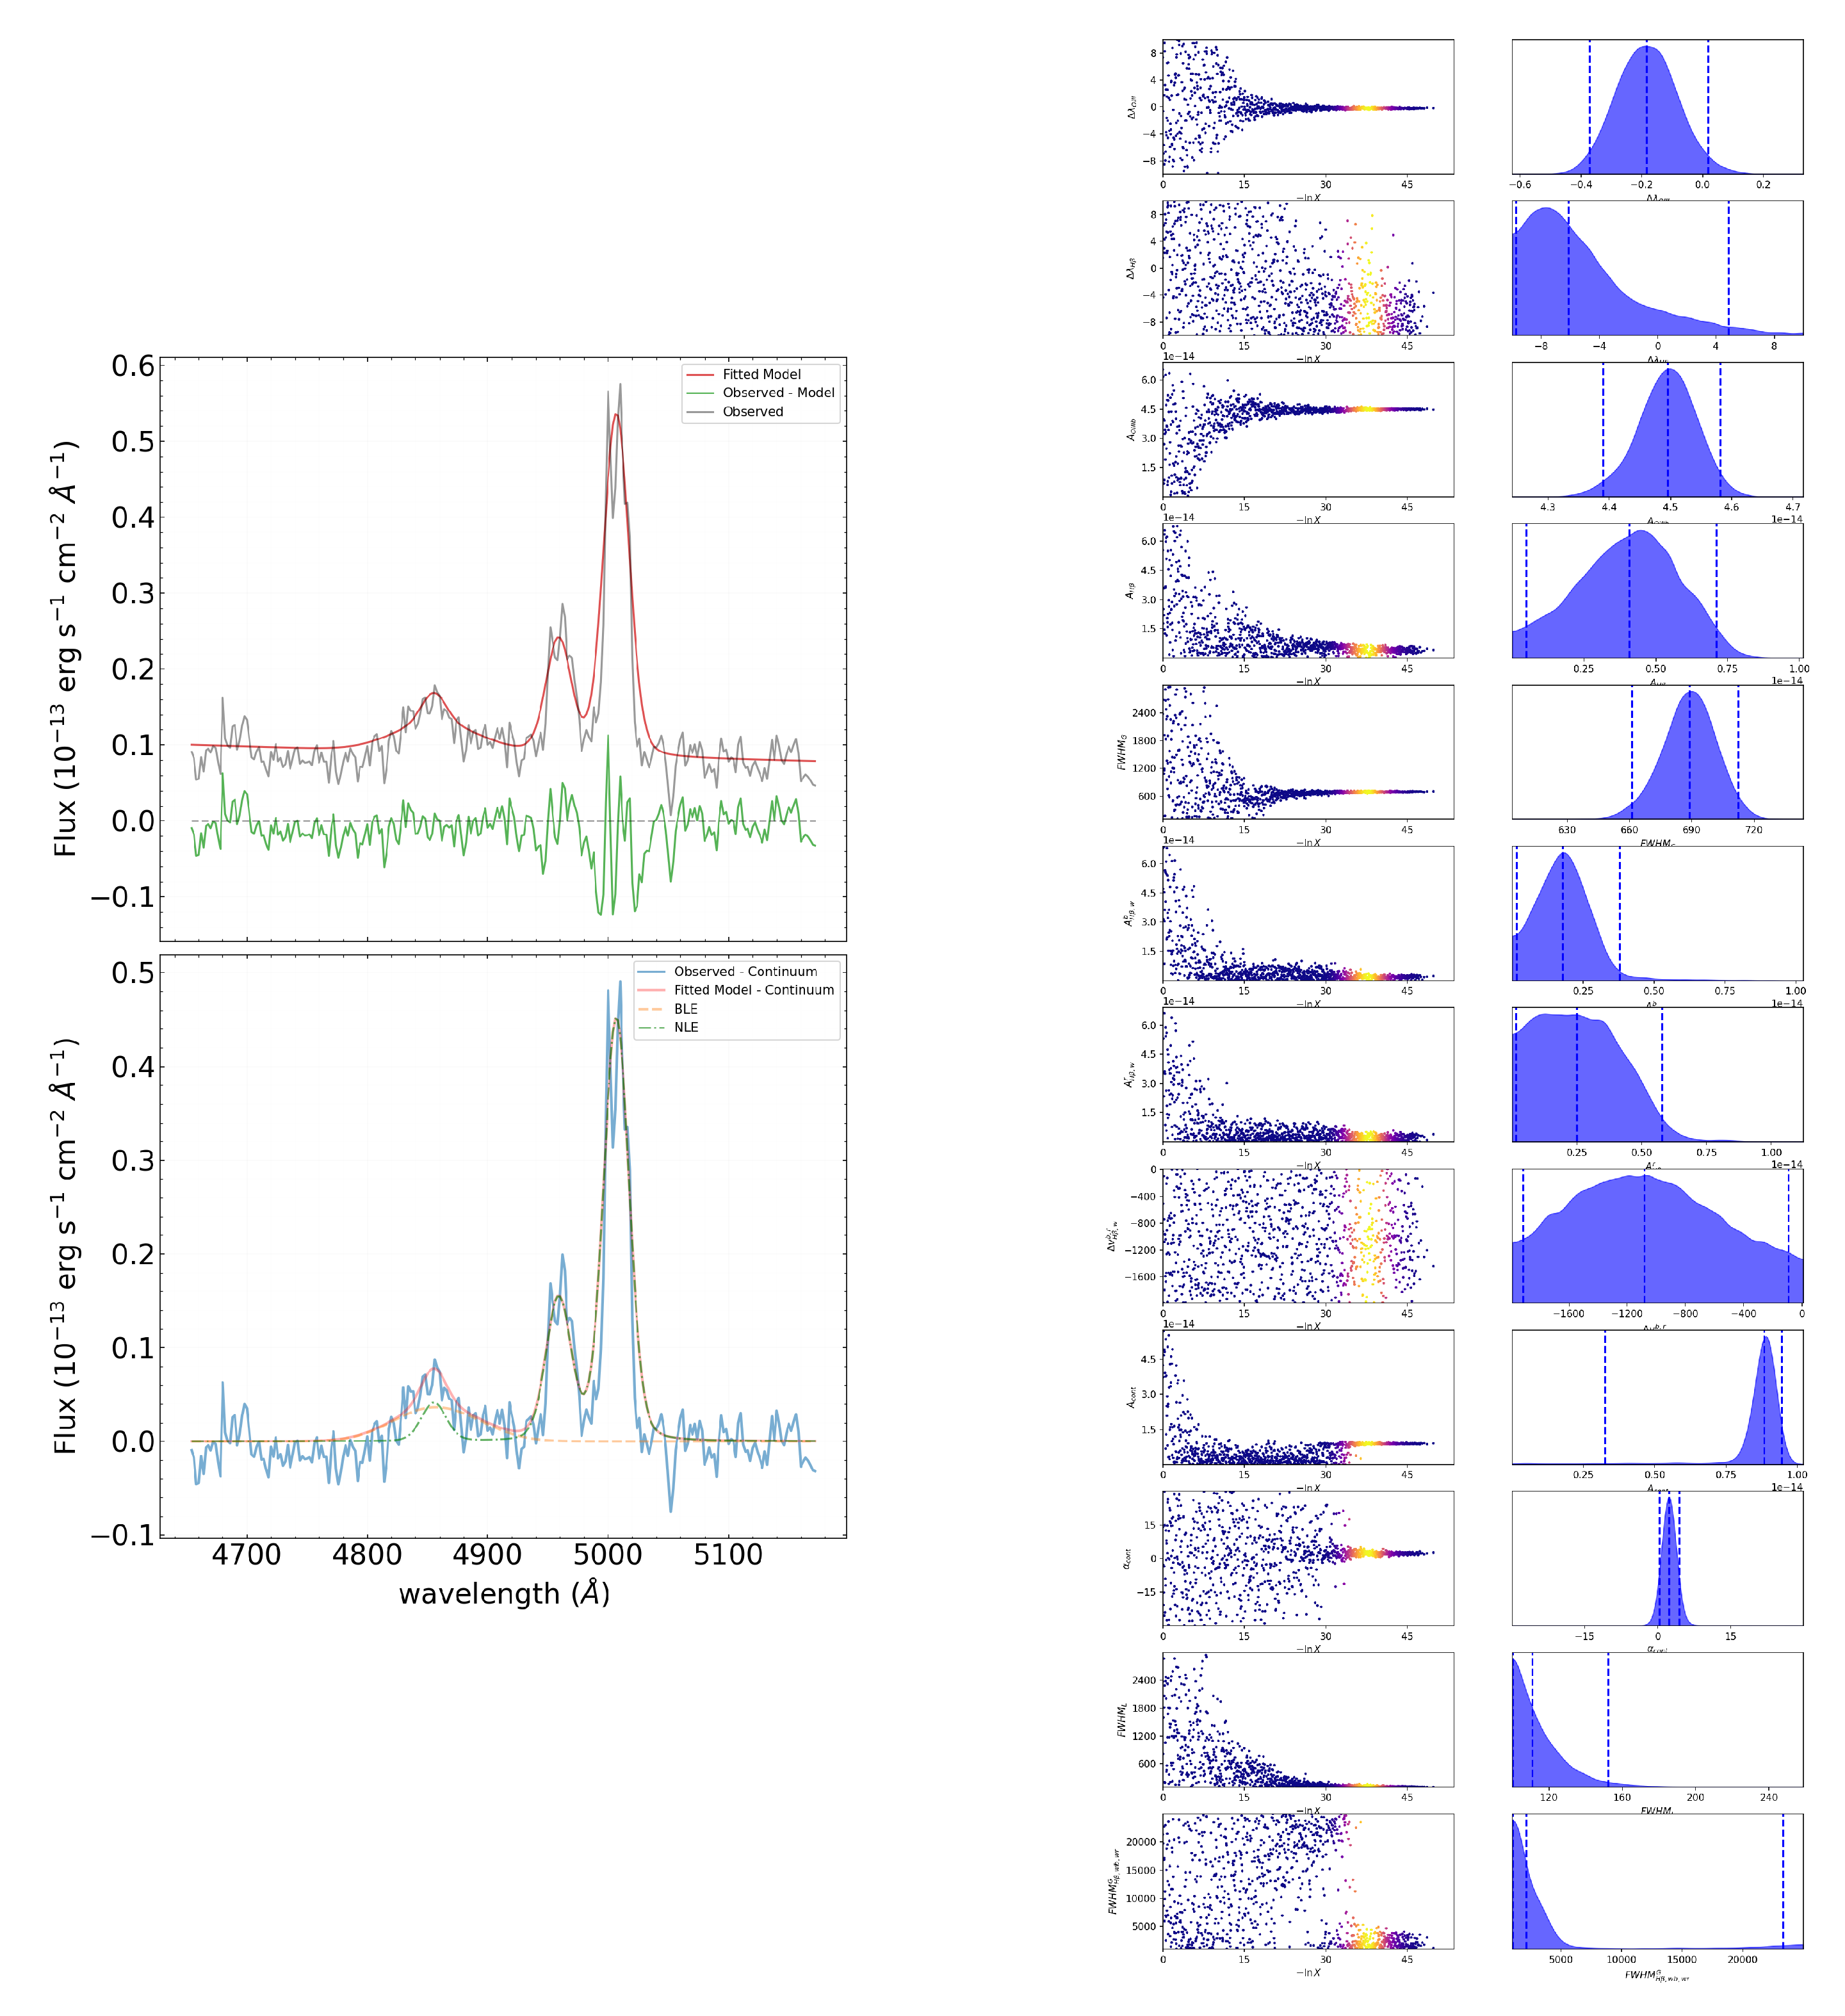
Figure 5.
The result of the approximation with the combined profile (left) and the tracers for each parameter (right).
Figure 5.
The result of the approximation with the combined profile (left) and the tracers for each parameter (right).
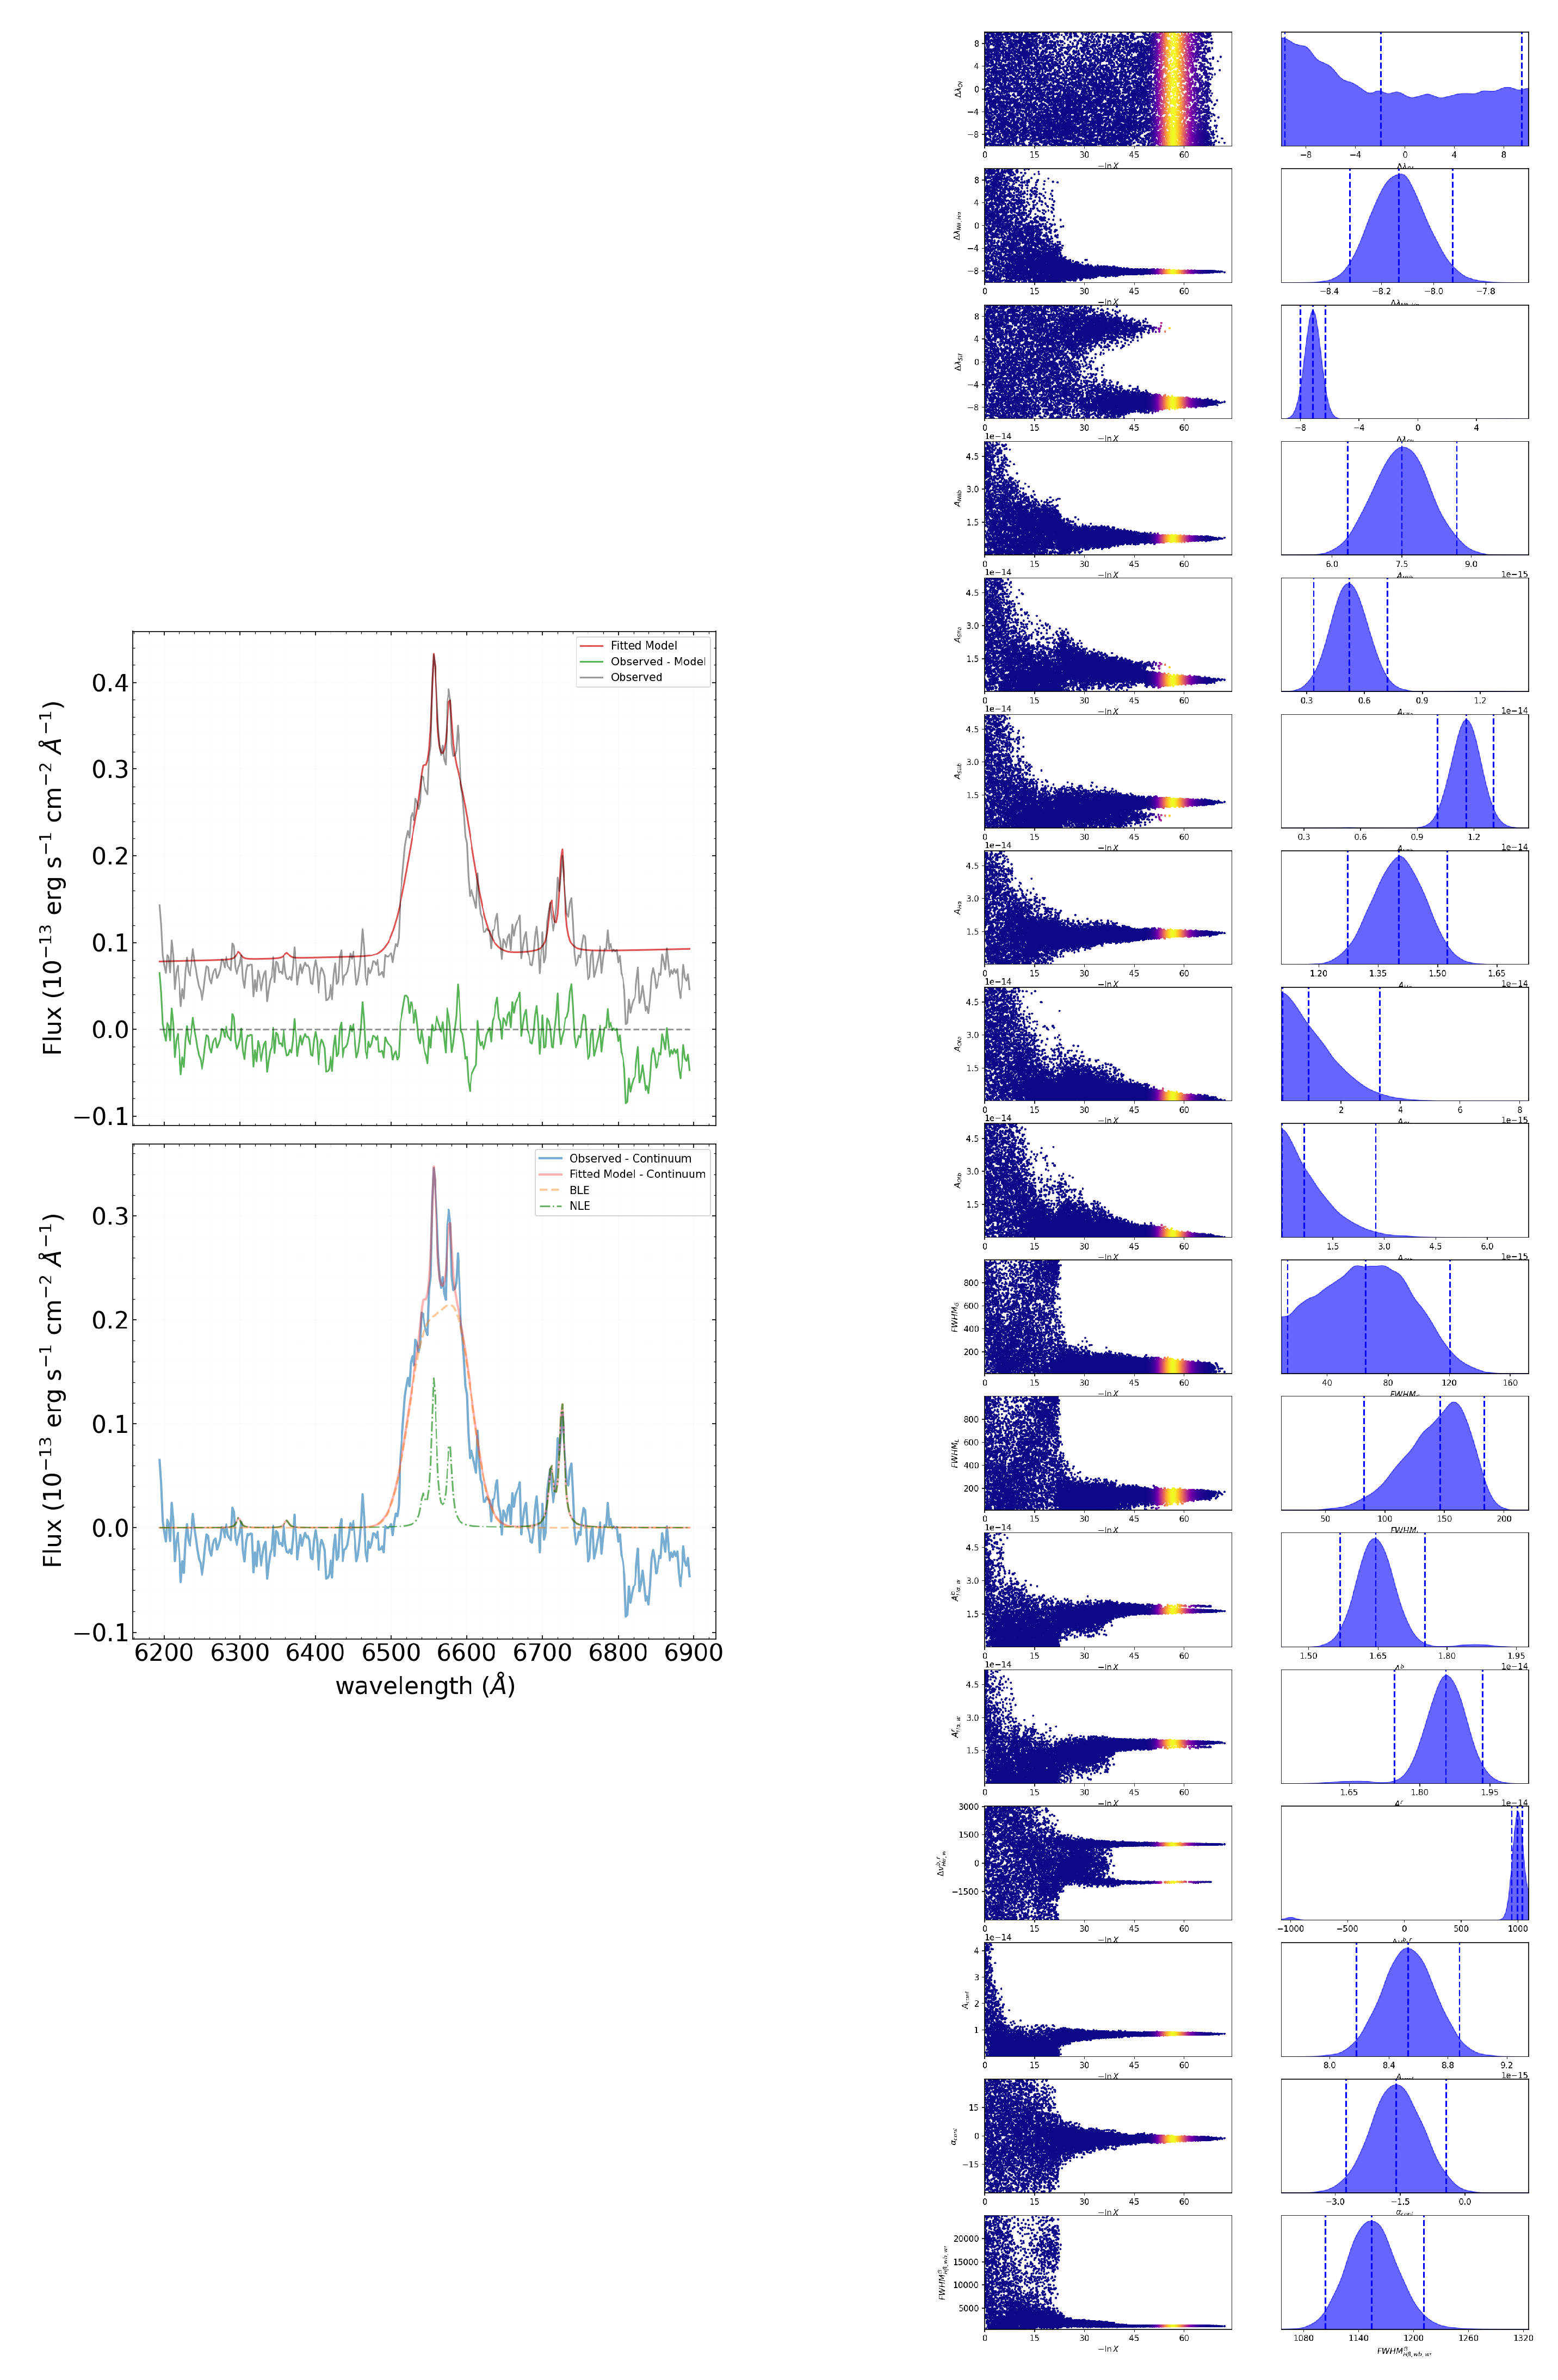
Figure 6.
The result of the approximation with the combined profile (left) and the tracers for each parameter (right).
Figure 6.
The result of the approximation with the combined profile (left) and the tracers for each parameter (right).
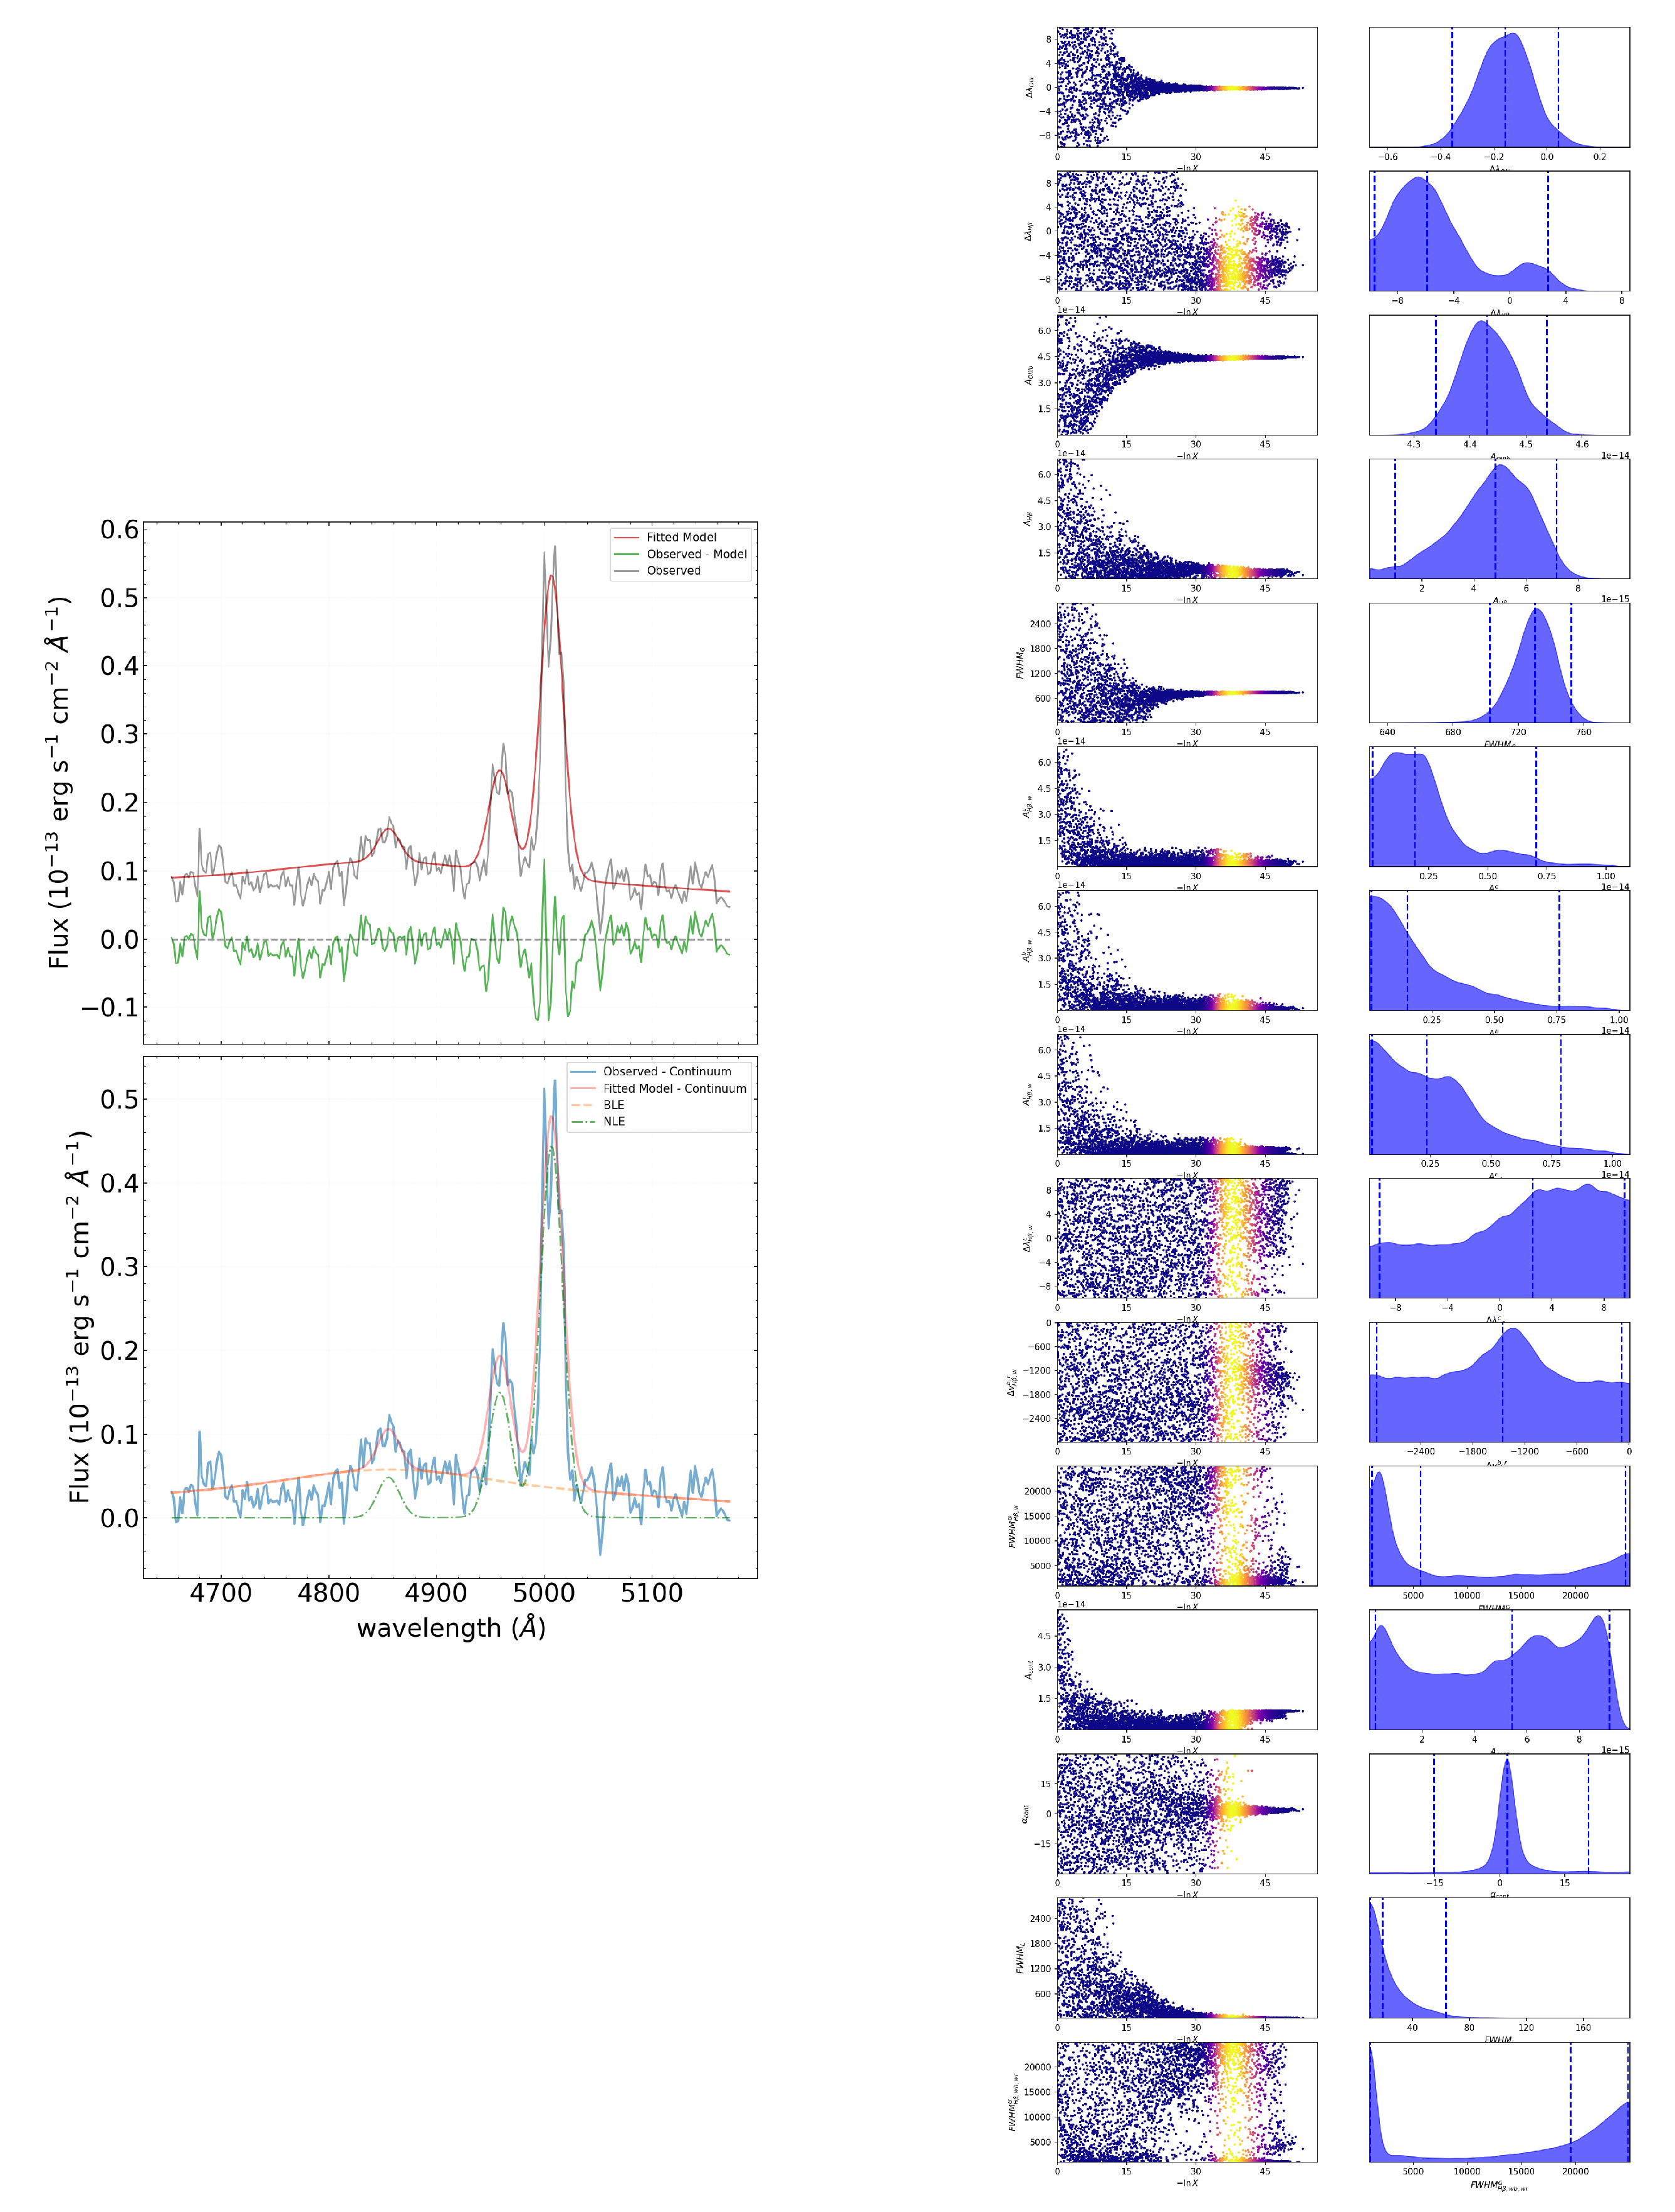
Figure 7.
The result of the approximation with the combined profile (left) and the tracers for each parameter (right).
Figure 7.
The result of the approximation with the combined profile (left) and the tracers for each parameter (right).
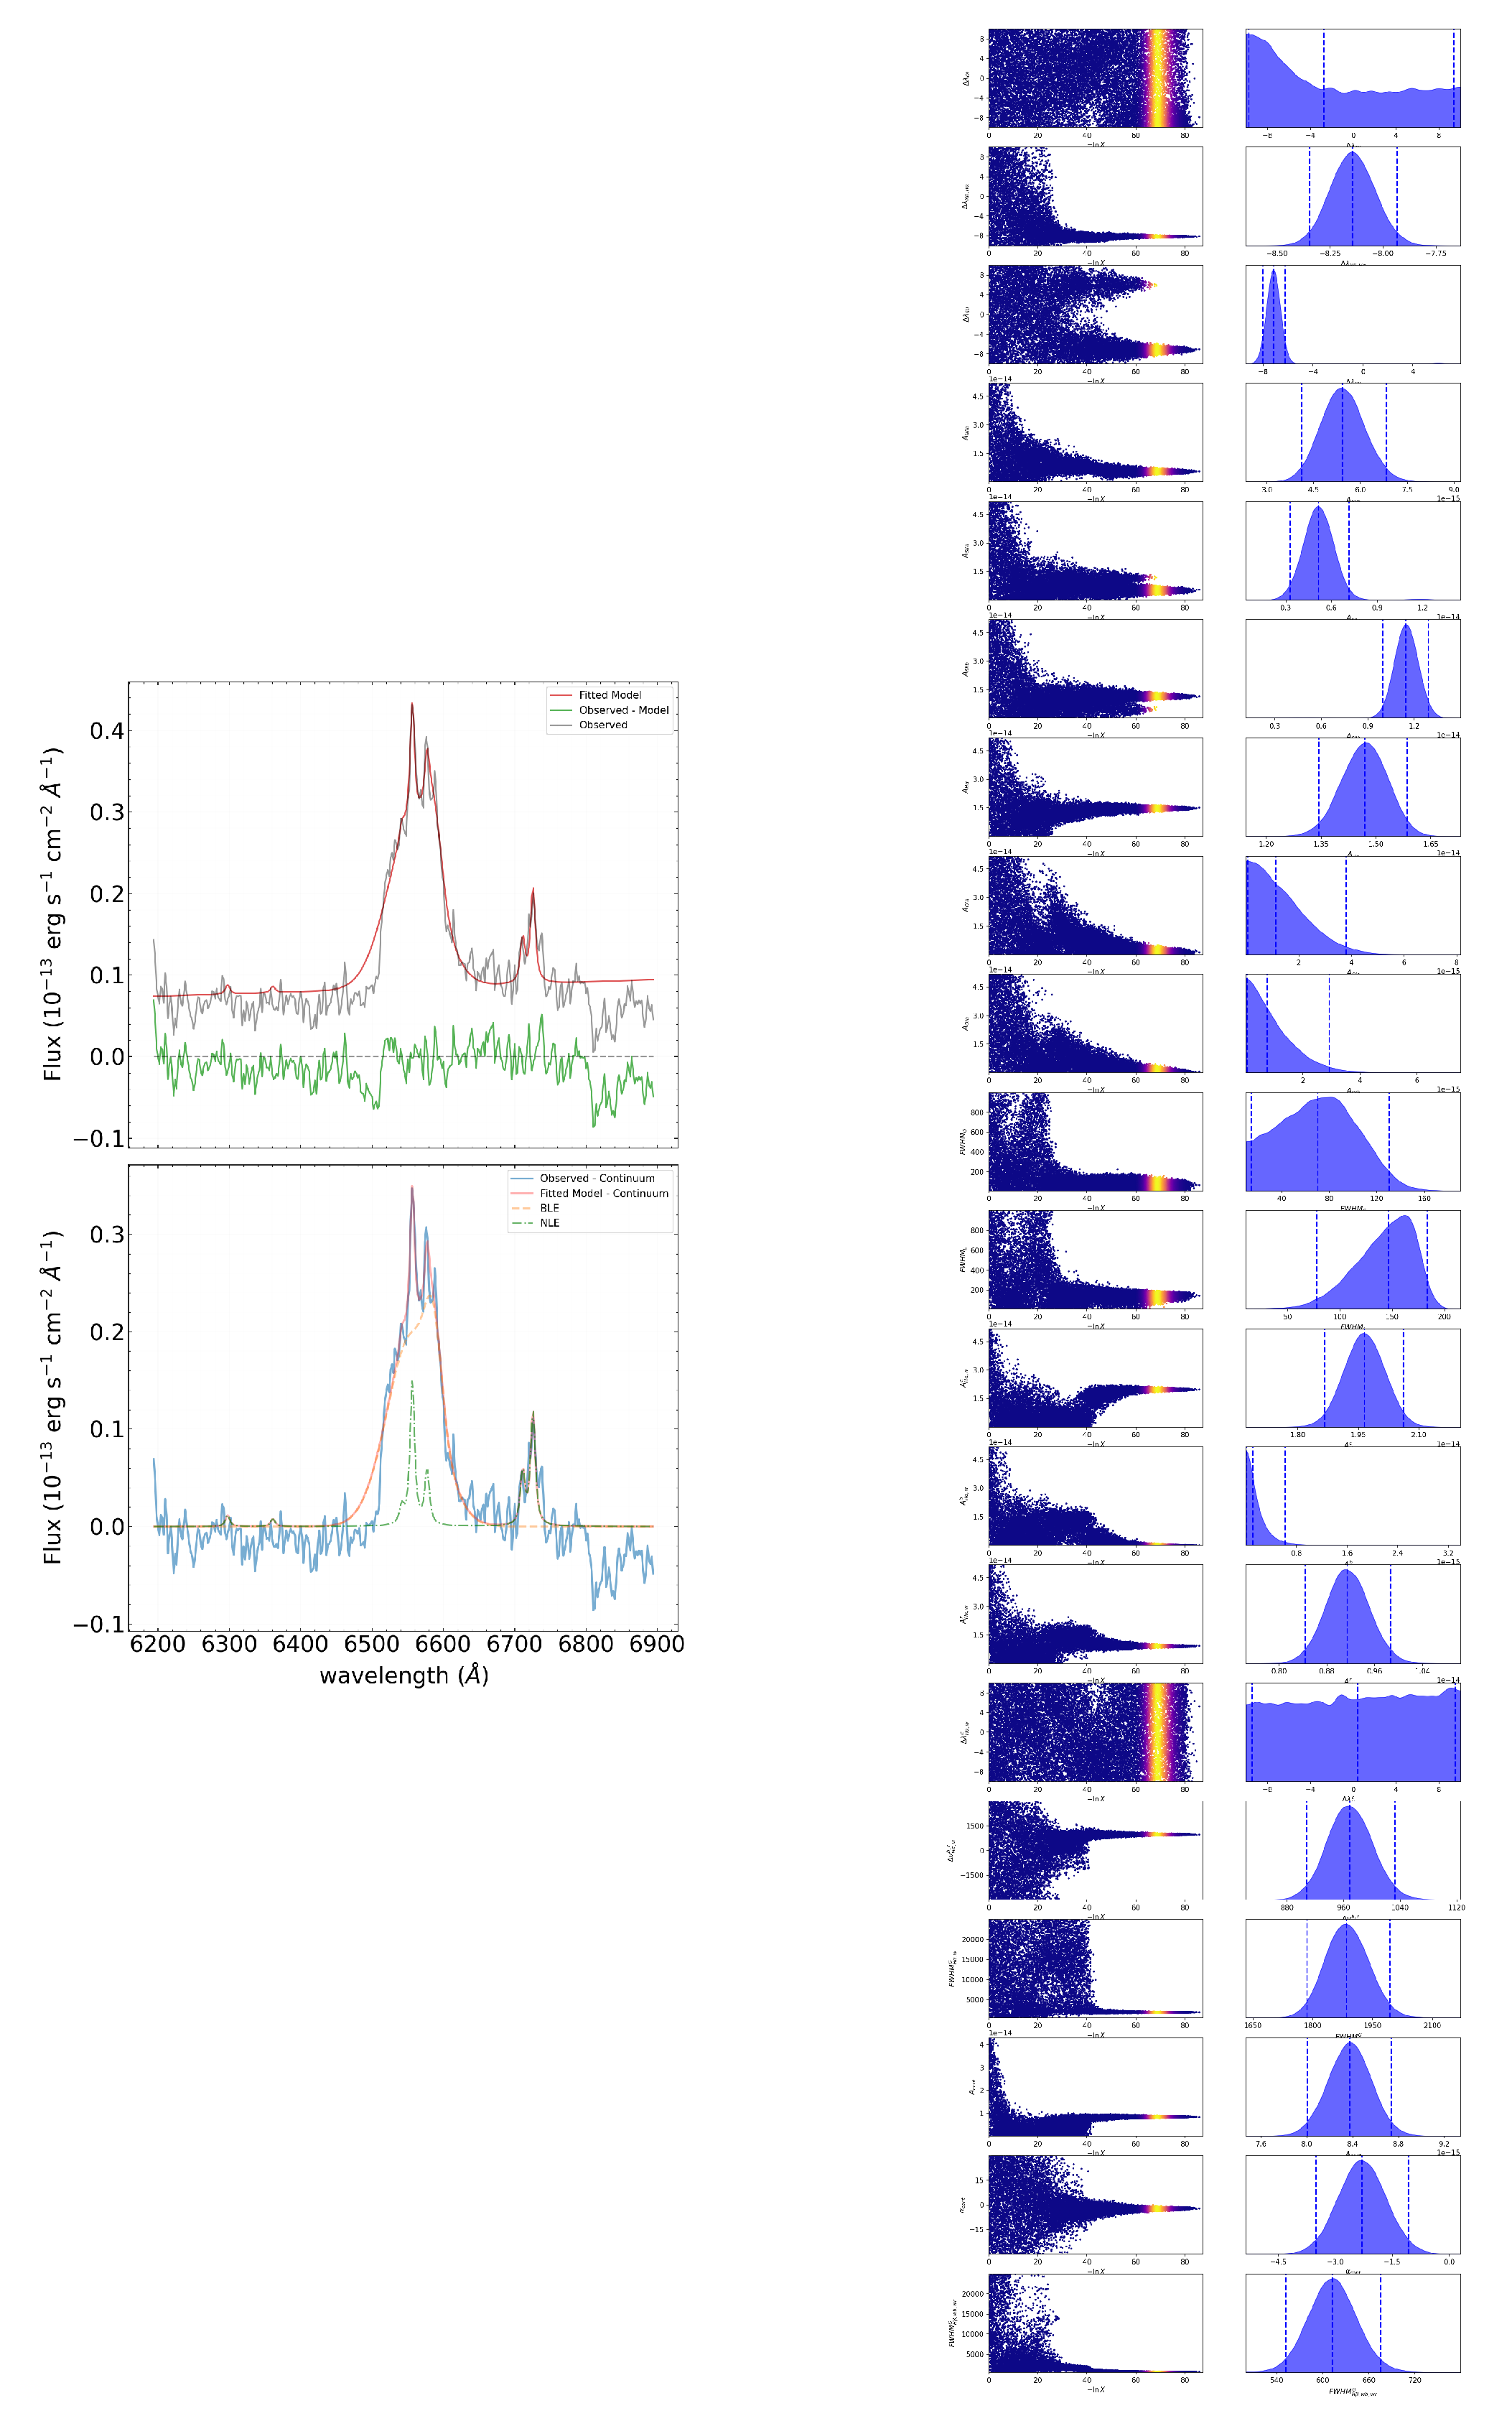

Table 1.
Characteristics of Observational Instruments.
| Telescope | Detector | Gratings | Tasks | Field of View | Location2 |
| Zeiss-1000 “East”1 | CCD Apogee Alta U9000, BVR filters | – | Photometry | TSHAO | |
| AZT-8 (70 cm) | CCD SBIG 3200 | 400 lines/mm | Spectroscopy | KPO | |
| Zeiss-2000 | Andor, 2048×2048, 1 pix = 13.5 m | UAGS, F = 200 mm, f/2, D = 146 Å/mm | Spectroscopy | SHAO |
1 Zeiss-1000 “East”: D = 1050 mm, F = 6700 mm; Zeiss-2000: D = 2000 mm, F = 3600 mm. 2 TSHAO: Tien-Shan Astronomical Observatory, Kazakhstan; KPO: Kamenskoye Plato Observatory, Kazakhstan; SHAO: Shamakhy Astrophysical Observatory, Azerbaijan.
Disclaimer/Publisher’s Note: The statements, opinions and data contained in all publications are solely those of the individual author(s) and contributor(s) and not of MDPI and/or the editor(s). MDPI and/or the editor(s) disclaim responsibility for any injury to people or property resulting from any ideas, methods, instructions or products referred to in the content. |
© 2024 by the authors. Licensee MDPI, Basel, Switzerland. This article is an open access article distributed under the terms and conditions of the Creative Commons Attribution (CC BY) license (http://creativecommons.org/licenses/by/4.0/).
Copyright: This open access article is published under a Creative Commons CC BY 4.0 license, which permit the free download, distribution, and reuse, provided that the author and preprint are cited in any reuse.


