
Submitted:
19 November 2024
Posted:
20 November 2024
You are already at the latest version
Abstract
Hydrocarbon fuel biofouling and biocorrosion requires expensive cleanup of aviation infrastructures unless appropriate sustainment measures are applied. Alternative to current chemical biocides used in fuel sustainment, the identification of novel biological control agents offers promising alternatives. In this study, 493 microbial fuel isolates from our in-house repository were screened to identify new endogenously produced antimicrobial compounds. Using agar plug screening, liquid culture growth testing, and Jet A fuel culture assays, the two fuel isolate strains Pseudomonas protegens #133, and Bacillus subtilis # 232 demonstrated promising biocontrol activity against bacteria, yeast and filamentous fungi. Mass spectrometry analysis (LC-MS/MS) of #232 culture filtrate identified several common lipopeptide antimicrobials including gageostatin C, gageopeptin B, and miscellaneous macrolactins. In contrast, LC-MS/MS identified the siderophore pyochelin as one of the predominant compounds in #133 culture filtrate with previously demonstrated antimicrobial effect. Jet fuel microbial consortium culture testing of #133 culture filtrate including flow-cytometry live/dead cell mechanism determination demonstrated antimicrobial action against Gram-positive Gordonia sp. bacteria. The study concludes that antimicrobial compounds secreted by #133 have bactericidal effect against Gordonia sp. and cause cell death through bacterial lysis and membrane damage with potential applications in biocidal treatment of hydrocarbon-based aviation fuels.
Keywords:
Biocontamination of hydrocarbon fuels
; fuel-derived microbial isolate repository
; antimicrobial screening
; Agar plug screening
; biocontrol culture filtrate testing
; Jet A fuel
; Pyochelin
; Gordonia sp.
; aviation fuel sustainment
1. Introduction
Present fuel system infrastructure sustainment efforts require frequent fuel quality and contaminant testing, to prevent clogging of fuel lines and replacement of fuel system parts that are affected by biofouling and bio-based corrosion [1,2,3]. The identification of specialized microbes that that can use jet fuel hydrocarbons as a substrate and the study microbial metabolism and biofilm formation has given insight into potential antimicrobial treatment options [3,4,5,6]. For instance, microbes can achieve antimicrobial resistance via multiple biochemical pathways, that include activation of solvent tolerance via activating efflux pumps as well as biofilm formation [5,7,8,9,10]. In previous efforts, our group tested the use of small-molecule efflux pump blockers in the treatment of fuel microbial contamination. This research effort tries to identify natural biocontrol compounds that are intrinsically produced by microbes that can be applied along with efflux pump inhibitors as a combinatorial strategy to overcome microbial resistance in fuel tanks.
Laboratory screening for novel antimicrobials has utilized the competitive nature of environmental consortium microbes where nutrient-competing strains produce inhibitory compounds to block other competitors [11,12,13,14]. One class of bacterial and fungal biocides, with relatively higher stability includes antimicrobial peptides (AMP) [13,15]. The mechanism of action of most AMP is either through inhibition of cell division by causing intracellular toxicity or through exterior membrane permeabilization [13]. Recently, our group demonstrated the application of sheep myeloid antimicrobial peptide (SMAP-18) and synthetic pyochelin in treatment of fuel biocontamination [16].
In this study, 493 microbial fuel isolates from our in-house repository were tested for antimicrobials activity against target microbes by agar plug screening to identify potential biocontrol compounds that are naturally produced and target other fuel system microorganisms. Agar plug diffusion screening represents a common and well-established method to screen for antimicrobials activity throughout the microbiology community [17,18]. To distinguish between potential cell-to-cell interactions and compound-dependent antimicrobial growth inhibition, we established a liquid culture screening assay to confirm production of soluble biocontrol compounds in microbial culture filtrates. Using these methods, two fuel-isolate strains Pseudomonas protegens #133 and Bacillus subtilis #232 demonstrated promising biocontrol activity against Gram-positive and Gram-negative bacteria, yeast and filamentous fungi. According to previous studies, B. subtilis is known to produce over 200 antimicrobial compounds including bacillaene, bacilysin, surfactin [19], and lipopeptides such as gageostatins and gageopeptins [20,21,22] iturins and fengycins [19,23], polyketide macrolactins [20,24,25], and volatile organic compounds (VOG) with antifungal properties [23,26,27]. In contrast, most of the antimicrobial compounds produced by P. protegens include small molecules and lipid compounds such as rhamnolipids and quorum sensing molecules including pyoverdine, pyocyanin, and pyochelin [28].
To identify potential compounds contained within #133 and #232 culture filtrates, this study used high performance liquid chromatography mass spectrometry with an Agilent 6546 Q-TOF mass analyzer. Our selection criteria for antimicrobial compound screening included good molecular stability in the fuel phase with semi-polar characteristics allowing diffusion in the water/biofilm phase, without producing fuel emulsification. To better characterize compounds that match these criteria, two different culture filtrate purification methods were used including ethyl acetate liquid/liquid extraction for purification of semi-polar compounds such as lipids and lipopeptides and semi-preparative HPLC for purification of lipopeptide compounds. Crude culture filtrates and extracts of purified compounds were further tested using liquid culture screening assays and Jet A fuel microbial consortium culture testing. To further assess the mode of actions of the identified antimicrobials, flow cytometry (FCM) was used to detect cellular viability and structural morphology for determination of cell death [29,30,31]. Knowing the mode of action of these antimicrobials is helpful for designing future combinatorial mitigation strategy. Using FCM as a tool, we were able to estimate live/dead, and viable but non-culturable (VBNC) cells after microbes were exposed to the novel antimicrobial compounds and made assumptions about the underlying mechanism of action of the identified biocontrol agents. The subsequent findings show promising results for the use of #133 crude culture filtrate as a biocontrol agent for Gram-positive bacteria with notable bactericidal efficacy against the fuel contaminant Gordonia sp.
2. Material and Methods
2.1. Materials
Pyochelin I/II (Cat#sc-506665 was obtained from Santa Cruz Biotechnologies, Santa Cruz, CA). The filamentous fungi Hormoconis resinae (ATCC 22711), yeast Yarrowia lipolytica (ATCC 20496), and Gram-positive bacterium Gordonia sp. (ATCC BAA-559) were obtained from the American Type Culture Collection (ATCC) (Manassas, VA). The Pseudomonas putida bacteria and Meyerozyma guilliermondii were obtained from AFRL microbial repository, isolated from bio-contaminated fuel samples). The Pseudomonas aeruginosa PAO1 bacteria represent a laboratory strain (taxonomy ID 208964.1).
2.2. Colony Forming Unit Determination
For colony forming units (CFU)/mL determination, 200 µL of culture samples were collected, serial diluted and plated onto agar media. Plates were incubated at 28 °C overnight followed by CFU counting. Three replicates of different dilutions were either plated manually or by using an easySpiral Pro Plater (Interscience, Woburn, MA) according to the manufacturer’s protocol. CFU/mL was either determined by counting colonies on manually spread plates or by using the automatic plate reader Scan 1200 Colony Counter (Interscience, Woburn, MA) according to the manufacturer’s protocol.
2.3. Agar Plug Diffusion Testing
Donor and recipient test microbes were plated on agar culture plates with growth medium e.g., Tryptic Soy Agar (TSA, REF 236950, Difco), or Potato Dextrose Agar (PDA, REF 213400, Difco) and incubated at 28 °C for 1-3 days. To generate plates, bacterial cells or fungal spores were directly suspended into the 50% agar medium at 1 x 10⁶ fungal spores or bacteria cells/mL as the final concentration to allow for evenly distribution of microbes throughout the dried plate. Donor plates were punched with 5 mm sterile cork borers that were excised to produce agar plate plugs. The excised donor plugs were placed onto the recipient plate containing the test microbes. Following addition of plugs, plates were incubated at 28 °C overnight. Control plates only received non-inoculated plugs. After incubation, radius of inhibition zones from control and treatment are measured in mm at 24, 48, 72, and 96 hours after incubation. Following live (SYTO 9; green)/dead (Propidium iodide; red) cell staining with BacLight (Molecular probes) fluorescence microscope images, including phase-contrast images and SEM microscopic images were taken from the agar plug edges.
2.4. Purification of Culture Filtrates for Antimicrobial Testing
Isolates were pre-cultured from frozen stock and grown overnight at 28 °C on either Tryptic Soy Agar (TSA) for bacterial or Potato Dextrose Agar (PDA) for fungal cultures. The next day, one colony was transferred to 20 mL liquid culture containing Tryptic Soy Broth (TSB) and incubated overnight under agitation (200 revolutions per minute, (RPM)) at 28 °C. For fungal cultures, the spores were scraped off at 72 hours incubation and filtered with a 0.2 µm filter to only collect the spores, then steps were continued in a similar fashion. The next day, liquid cultures were washed 3x with Phosphate buffered saline (PBS) followed by serial dilution and incubation over-night at 28 °C for CFU determination. According to the CFU, 3 x 10⁷ cells/ mL of isolate were added to 25 mL of M9 minimum medium supplemented with 0.5% glycerol. Samples were placed in a 28 °C shaking incubator at 200 rpm for 24-72 hours. 1 mL of liquid culture was diluted and plated to get the CFU count of the isolate. To generate culture filtrates, cultures were spun down at 8500 RPM for 10 min and filtered with 0.2 µm nylon filters (Corning Cat. # 431224). The absorbance of culture filtrates was read at 205 and 254 nm in a Nanodrop (Nanodrop 2000c, Thermo Scientific) instrument to obtain the protein, peptide and lipid concentration. Prior to use in experiments, an aliquot of culture filtrates was plated to assure complete removal of microbial cells. For 96-well liquid culture testing, and fuel consortium culture testing, the #232 and #133 crude culture filtrates were dried down by nitrogen evaporation and re-diluted in the assay buffers with a stock concentration of 1 mg/mL. The reconstituted crude filtrate stock solutions were sterile filtered with a 0.2 µm filter and added to the experiments according to the given final concentrations at 25, 50, 100 or 500 µg/mL.
2.5. Antimicrobial Liquid Culture Screening Assay
Liquid media culture studies were performed in 96-well plates with 200 µL total volume using either M9 minimum medium/0.5% glycerol (bacteria) or yeast nitrogen basewithout amino acids (YNB)/0.5% glycerol (fungi), followed by inoculation with or without (medium control) the test microbial strains Gram-negative bacteria, Gram-positive bacteria, yeast, and filamentous fungi at a final concentration of 1 x 10⁴ cells/mL with at least three replicates. Cultures were supplemented with the corresponding test culture filtrate at 1:1 v/v e.g. 100 µl containing a concentration of 1.38 mg/mL of isolate #133 dry weight or 1.96 mg/mL dry weight for isolate #232 over a course of 14 days. To account for enhanced evaporation on the plate edge, samples were plated in the middle of the 96-well plate by leaving the edges unfilled prior to addition of the clear sterile plate sealing membrane. Prior to and after sample collection at the corresponding time points, plates were spun for 10 min at 3,000 RPM to remove condensation. Serial dilutions were made prior to CFU culture plating.
2.6. Fuel Microbial Consortium Culture Assay
Fuel microbial consortium culture was performed in a 40 mL glass vials using 20 mL Jet A fuel as a carbon source underlain with 5 mL water bottom containing minimal growth media in a 1:1 (v/v) mixture of M9 medium/YNB. Fuel cultures were inoculated with a microbial consortium of gram-negative bacteria: P. putida, Gram-positive bacteria: Gordonia sp., yeast: Y. lipolytica, and filamentous fungi: H. resinae at a final concentration of 1 x 10⁴ cells/mL containing an equal amount of each microbe. Cultures were supplemented with the chosen antimicrobials, e.g., crude culture filtrate at doses of 0.0 µg/mL (microbial growth control) administered at 100 µl (1.38 mg/mL), 1 mL (13.8 mg/mL) and 2.5 mL (34.5 mg/mL) total volume followed by incubation at 28 ºC without agitation. Samples were taken over a course of 29 days. 200 µL of each sample was collected across different time points and serial dilutions were made for CFU culture plating. Three technical samples were collected from each bottle for CFU culture plating on TSA plates (bacteria) and PDA supplemented with ampicillin, kanamycin, and spectinomycin at 50 µg/mL (fungi).
2.7. Culture Filtrate Compound Purification by Ethyl Acetate Lipid Extraction
For lipid extraction, microbes were grown for three days at a staring concentration of 3 x 10⁷ cells/mL in M9 minimum medium supplemented with 0.5% glycerol prior to sterile filtration with a 0.2 µm filter to obtain crude culture filtrates. For ethyl acetate lipid extraction, crude culture filtrates were acidified with 10 µL 1N HCl followed by an over-night incubation. In brief, ethyl acetate liquid-liquid extractions were done in Corning Falcon (Cat. #1495949A, Thermo Fisher) 50 mL vials using a 1:1 (v/v) ethyl acetate to culture filtrate ratio followed by vortexing for 30 s and incubation for 5 min to accomplish phase separation. The upper organic ethyl acetate phase was carefully removed by not disturbing the interphase or the lower water phase using a serological pipet. Following replenishment of the upper phase with fresh ethyl acetate, the extraction was repeated two more times. The resulting ethyl acetate extracts were combined and evaporated to dryness under nitrogen to obtain lipid extracts and re-diluted in the assay buffers with a stock concentration of 1 mg/mL. The reconstituted crude filtrate stock solutions were to the experiments according to the given final concentrations at 25, 50, 100 or 500 µg/mL. Lipid extracts were either analyzed directly by Liquid Chromatography (LC) Q-TOF mass spectrometry or fractionated by Semi-Preparative High Performance Liquid Chromatography (Semi-Prep HPLC).
2.8. Culture Filtrate Compound Purification by Fractionation using Semi-Prep High-Performance Liquid Chromatography (HPLC)
For Semi-Prep HPLC, culture filtrates or ethyl acetate lipid extracts were taken up at 1 mg/mL concentration in 60% LC-MS grade water and 40% Acetonitrile (Optima Thermo Fisher) supplemented with 0.1% Formic Acid. The column separation was done on a ZORBAX Eclipse Plus C18, 95Å, 4.6 x 250 mm, 5 µm, 400 bar pressure limit (cat. 959990-902, Agilent, CA) by applying an acetonitrile/water gradient at 1.2 mL/min flow rate, and a temperature of 60 °C. The mobile phase consisted of water, 0.1% formic acid (A) and acetonitrile 0.1% formic acid (B). The following gradient conditions were used: from 0 min at 5% B ramped up to 40% B at 15 min ramped up to 90% B at 18 min which was ramped down to 5% B at 23 min and kept at this concentration for 1 min post-run. Fractions were collected either at the corresponding VWD peak for the pyochelin compound at 254 nm (proportional at 2 min retention time) or at the corresponding peak for peptides at 205 nm (proportional 4 min). The resulting fractions were evaporated to dryness under nitrogen to obtain purified extracts and re-diluted in the assay buffers with a stock concentration of 1 mg/mL and analyzed directly by Liquid Chromatography (LC) Q-TOF mass spectrometry.
2.9. Compound Profiling by LC-QTOF Analysis
Samples obtained from culture filtrate fractionation, or ethyl acetate extractions or sample standards (i.e., pyochelin) were loaded at 0.1 µg/µl with a 10 µl total load onto an Agilent 1290 Infinity II HPLC. A ZORBAX RRHD Eclipse Plus C18, 95Å, 2.1 x 50 mm, 1.8 µm, 1200 bar pressure limit (cat. 959757-902, Agilent, CA) was used for separation with a flow rate of 0.3 mL/min, and a temperature of 40 °C. The mobile phase consisted of water, 0.1% formic acid (A) and acetonitrile 0.1% formic acid (B). The following gradient conditions were used: 0.5 min 40% B ramped up to 95% B at 25 min which was kept at this concentration for 5 min post-run. Following HPLC separation samples were analyzed in an Agilent 6546 Q-TOF LC-MS-MS at positive ion electrospray mode, acquisition range 100–1700 amu, scan rate of 3 spectra/s, source 225 °C with a gas flow of 12 L/min, sheath gas temperature of 300 °C and sheath gas flow of 11 L/min. The VCap was set at 3500, the nozzle voltage at 1000 V, fragmentor at 150, skimmer 65 V, and octopole RF peak 750. MS/MS fragmentation was done at 20, 40, and 70 eV. Data acquisition was performed using Agilent MassHunter LC-MS Data Acquisition Software (version 10.0). Data analysis was performed using Agilent Profinder for raw file spectrum alignment followed by Mass Profiler Professional statistical analysis including identification of unique compounds by subtracting compounds present in the M9 minimum medium control followed by compound identification with established PCDL libraries from Bacillus subtilis, Pseudomonas aeruginosa, and the METLIN 3.1.5 lipid library. MassHunter Qualitative Analysis Software was used to generate base peak chromatograms and compound mass-specific extracted ion chromatograms including METLIN library alignment of compounds by using the “Find by Formula” function for compound identification.
2.10. Fluorescence Microscopy
The LIVE/DEAD® BacLightTM Bacterial Viability Kit (BacLight; Molecular Probes, Invitrogen Waltham, MA) was utilized to differentiate between live and dead cells according to the manufacture’s recommendations. Samples were spotted onto glass slides prior to analysis by fluorescence microscopy using a Nikon Eclipse Fluorescence Microscope with an X-Cite 120Q fluorescence illumination system with a DS Qi2 monochrome microscope camera under 100x objective in oil and green or red fluorescence wave filter.
2.11. Flow Cytometry
Fuel microbial cultures were set-up in 40 mL glass vials containing 5 mL water bottom (1x M9 minimal media) overlaid with 20 mL filter sterilized Jet-A fuel as a carbon source. Fuel cultures were inoculated with Gram-positive bacterium Gordonia sp. at a final concentration of 1 x 10⁵ cells/mL. Cultures were supplemented with the chosen antimicrobials, e.g., crude culture filtrate at doses of 0.0 µl (microbial growth control) and administered at 100 µl (proportional 1.38 mg compound mixture dry weight), 500 µl, 1 mL, and 2.5 mL followed by incubation at 28 ºC with agitation. Samples were taken over a course of 7 days and 1 mL of each sample was collected across different time points. Serial dilutions were made for CFU culture plating to confirm the number of viable culturable cells. A negative control with M9 + 0.5% glycerol with 1 x 10⁵ cells/mL Gordonia sp. without any fuel to confirm only the filtrate was the reason for an antimicrobial effect and not the fuel itself. In addition, the cells were stained with live (0.5 µm SYTO 9; green)/ dead (0.25 µm Propidium iodide; red), and analyzed by flow cytometry (Attune, NxT Invitrogen) including determination of live-, and dead and total cell number as well as adjustment of side scatter and forward scatter to determine appearance of cells and cellular debris. Detection thresholds were set using green and yellow fluorescence, and live and dead cells were gated on dot plots.
2.12. Statistical Analysis
Statistical analysis for growth experiments included consideration of number of independent samples (n) that included the average of at least triplicates of colony forming units (CFU) plating. Two-way ANOVA was done for multiple dose comparisons with Dunnet’s post-test using GraphPad Prism 10.0 software (Dotmatics, Boston, MA).
3. Results
3.1. Agar Plug Biocontrol Agent Diffusion Screening
Agar plug screening included a total of 493 microbes from our fuel isolate repository that were tested for potential production of antimicrobials against the four target microbial groups including Gram-negative bacteria Pseudomonas putida, Gram-positive bacteria Gordonia sp., yeast Yarrowia lipolytica, and filamentous fungi Hormoconis resinae (Table 1 and Figure 1 (a)). The agar plug screening assay is based on measuring the radius of microbial inhibition zones produced by the diffusion of potential antimicrobial compounds from the donor biocontrol isolate agar plugs that are inserted into the test recipient culture plate.
To distinguish between potential cell-to-cell interactions that might confound the screening assay of produced soluble antimicrobial compounds, the inhibition zone formation was further analyzed by light/fluorescence microscopy and scanning electron microscopy (SEM). While light microscopy and fluorescence microscopy lacked the resolution to identify potential damage of fungal mycelia and spores (data not shown), SEM was able to detect damage resulting from cell-to-cell interactions. Using this method, we excluded some of the promising isolate candidates, including Delftia sp. #329. In detail, isolate #329 showed agar plug inhibition of H. resinae, but when tested by SEM, damage in hyphae and spore structures indicated cell-to-cell interactions, rather than damage due to antimicrobial compound diffusion (Figure 1 (b)). In detail, the fungal mycelium localized inside the inhibition area was surrounded by biocontrol bacterial cells that seemed to induce fungal death (live/dead cells stain was positive, red) by proximity of the bacteria to the fungal hyphae. This is also supported by detailed SEM images (Figure 1 (b)) that shows fungal mycelium and spores from the inhibited fungal growth zone compared to outside of the inhibition area.
Following exclusion of antimicrobial activity due to cell-to-cell interaction by the microscopy, analyses, Pseudomonas protegens #133 and Bacillus subtilis #232 were used in further testing by agar plugs. This included the chosen fuel-contaminating microbial groups of Gram-negative bacteria: Acinetobacter venetianus, Hydrocarboniphaga effusa, and Jm109 E. coli, Gram-positive bacteria Bacillus atrophaeus, Nocardioides albus, and Rhodococcus equi, yeast Candida ethanolica and Meyerozyma guilliermondii, and filamentous fungi Aspergillus versicolor and Fusarium oxysporum. As shown in (Table 1), there is a consistency of biocontrol efficacy across the four different microbial classifications reflecting a wide range application of biocontrol products. It is noticeable that the tested strains of filamentous fungi showed the largest inhibition zones followed by the Gram-negative bacteria, Gram-positive bacteria, and yeast as the most resistant microbial species.
3.2. Antimicrobial Activity Screening of Crude Filtrates from Bacillus Subtilis #232 and Pseudomonas Protegens #133 in Liquid Culture
In accordance with observations that a positive inhibition zone in agar plug screening can also result from biocontrol-cell to target-cell interactions and not necessarily from secreted antimicrobial agents, a liquid culture screening assay was developed using 96-well plates. This assay was solely based on soluble biocontrol compounds in culture filtrates by eliminating potential cell-to-cell interactions. Using the 96-well liquid culture assay, the chosen biocontrol isolates #232 and #133 were tested for antimicrobial activity against Gram-negative, and Gram-positive bacteria, yeast, and filamentous fungi.
Isolate #232 crude culture filtrate testing over 11 days demonstrated complete growth inhibition of all tested Gram-positive bacteria including B. atrophaeus (-6.78 log-fold change, p < 0.0005, n = 6, Figure 2 (a1), N. albus (-6.17 log-fold change, p < 0.0001, n = 12, Figure 2 (b1), and Gordonia sp. (-3.34 log-fold change, p<0.05, n = 12, Figure 2 (c1). In contrast, isolate #232 crude culture filtrate had limited antimicrobial activity against Gram-negative bacteria A. venetianus. However, #232 culture filtrate showed a -3.16 log fold change, (p < 0.001, n = 6) against Jm109 E. coli (data not shown).
While #232 culture filtrate yielded an initial growth reduction against H. effusa from day 1 to 7, the biocontrol activity seemed to be lost after day 8 (Figure 2 (d1). Interestingly, isolate #232 culture filtrate demonstrated effective antimicrobial activity for the fungal model organism H. resinae, (Figure 2e1) with an observed -6.58 log-fold change (p < 0.001, n = 18) compared to the control. However, culture filtrate from #232 had no antimicrobial activity against yeast Y. lipolytica (data not shown).
Biocontrol activity testing of isolate #133 crude culture filtrate resulted in complete growth inhibition of all tested Gram-positive bacteria including B. atrophaeus (Figure 2 (a2)) (-5.91 log reduction, p < 0.0001, n = 12), N. albus (Figure 2 (b2)) (-6.17 log-fold change, p < 0.0005, n = 6) and Gordonia sp. (Figure 2c2) (-6.57 log-fold change, p < 0.001, n = 9) by day 11. Similarly to #232, isolate #133 culture filtrate lacked biocontrol activity against Gram-negative bacteria Jm109 E. coli cells (data not shown), while a reduced growth of H. effusa was observed by day 11 with a -3.75 log-fold change (p < 0.0001, n = 12) (Figure 2 (d2)). In contrast, #133 culture filtrate was highly efficient at killing filamentous fungus H. resinae (Figure 2 (e2)) with a -4.48 log-fold change (p < 0.0005, n = 6) by day 11. However, #133 crude filtrate was not capable to inhibit other filamentous fungi, e.g., F. oxysporum (data not shown).
3.3. Antimicrobial Activity Screening of Bacillus subtilis #232 and Pseudomonas protegens #133 Purified Compounds in Liquid Culture
Besides testing crude culture filtrates, selected compounds contained within the biocontrol culture filtrate were further purified by ethyl-acetate lipid extraction and by column fractionation using acetonitrile/water gradient-based Semi-Preparative HPLC to further purify lipopeptides. The nitrogen dried products from purification steps were reconstituted prior to testing in liquid screening assay. Aliquots of the liquid cultures were taken over a time course of 11 days and plated for CFU counting to assess compound antimicrobial activity.
Testing of Isolate #232 ethyl acetate-derived lipid extracts in 96-well liquid assay resulted in a significant growth inhibition of yeast Y. lipolytica at 100 µg/mL on day 9 with a -1.23 log-fold change (p < 0.05, n = 3, Figure 3 (a)). Similarly, growth of filamentous fungus H. resinae did not drop below the 1 x log scale of the control on days 2-7 but a slight growth inhibition was observed at days 9-11 with a -1.35 log-fold change on day 11 (p = 0.08, n = 3, Figure 3 (b)). In contrast, #232 lipid extracts seemed to only partially reduce growth of Gordonia sp. with a -6.57 log-fold change (p < 0.01, n = 3, Figure 3 (c)), yet lacked complete growth inhibition.
To identify uniquely produced antimicrobial compounds in the #232 filtrates, ethyl acetate lipid extracts were further analyzed by LC-QTOF mass spectrometry (LC-MS/MS) at a concentration of 1 mg/mL. Of the 955 unique compounds identified by LC-MS/MS, gageostatin C (retention times (rt) at 16.305 and 18.806 min) and gageopeptin B (rt at 18.559 and 19.677 min) were the most abundant compounds with a library match identification score of 98.845 and 98.8, respectively, (Supplemental Figure S1 and Supplemental Data S1). In addition, lipid extracts derived from #232 culture filtrate also demonstrated high abundance of molecules from the macrolactin family including macrolactin B, W, F, 7-O-malonyl macrolactin, 7-O-succinylmacrolactin that were distributed over retention times between 1.385 and 3.522. Repetition of filtrate purification and analysis of different #232 culture filtrate batches showed a high compound variability for the macrolactin compound family, bacillaene, chloretetain, and gageostastin which caused difficulties in targeted single compound purification (data not shown). Therefore, the remainder of this study was focused on the #133 P. protegens strain.
Mass spectrometry analysis of #133 lipid extracts by LC-MS/MS detected over 177 unique compounds in the #133 ethyl acetate lipid extractions, including common molecules contained in the biofilm of other Pseudomonas sp. such as quorum-sensors N-3-Oxo-Dodecanoyl-L-Homoserine lactone (3-oxo-C12-HSL), Nonyl-4-Hydroxyquiniline-N-oxide (NQNO) and rhamnolipids Rha-C10:1-C8, Rha-C10-C10-CH3, Rha-Rha-C12-C10, Rha-C12:1-C10 and Rha Rha-Rha-C14-C14 (Supplemental Data S2). Interestingly, the compound trace for the siderophore pyochelin that is also produced in other Pseudomonas species such as P. aeruginosa [32], was highly abundant in the lipid extracts. In detail, ion extraction for pyochelin at 325.0675 Da, (M+H+), resulted in dual peaks representing potential isomeric forms at approximate retention times 1.89 and 2.3 min (Figure 4 (a)). The extracted ion chromatogram (EIC) for #133 pyochelin (Figure 4 (a), grey trace) matched the retention times of extracted ion peaks (Figure 4 (a), blue trace) for the commercially purchased pyochelin I/II standard (Santa Cruz Biotechnology, Santa Cruz, CA), and the extracted ion trace for pyochelin of P. aeruginosa strain PAO1 (Figure 4 (a), purple trace). Yet, commercial pyochelin (designated as synthetic, 96% pure, NMR tested) seemed to have some visible impurities between retention times 0.2- and 1.6 min. When overlaying the #133 ethyl acetate lipid extracts (133 EAA) base peak chromatogram (BPC, Figure 4 (b), red trace) with the EIC trace for pyochelin (Figure 4 (b), grey trace), there is an absolute match of the two peaks, providing a potential easy cleanup due to lack of other contaminating compounds at that retention time. The MS1 ion spectrum for the #133 pyochelin compound (Figure 4 (c)) indicates excellent matches with the predicted ion isotopes with existing H+, Na+ and K+ adducts. To confirm the potential antimicrobial action of #133 produced pyochelin, lipid extracts were further purified by collecting fractions at the expected 254 nm UV absorbance trace for pyochelin using a Semi-Preparative HPLC with a variable wavelength detector (Figure 4 (a), red trace). Following LC Q-TOF mass spectrometry analysis for quality control testing of pyochelin, the extracted compound fractions were used for testing in 96-well plate antimicrobial activity assay.
When testing the antimicrobial activity of #133 purified pyochelin in 96-well plates, there was a slight growth inhibitory effect on yeast Y. lipolytica, and filamentous fungus H. resinae with a -1.21 log reduction (n = 3) in the presence of 25 µg/mL at day 4, and a -1.51 log reduction (n = 3) in the presence of 50 µg/mL, respectively, compared to the controls (Figure 5 (a1) and (b1)). In contrast, no antibacterial activity of #133 purified pyochelin was observed against the test microbe Gordonia sp. (Figure 5 (c1)). In comparison, the commercial pyochelin standard was not effective on growth inhibition of Y. lipolytica at the tested doses of 25 µg/mL and 50 µg/mL (Figure 5 (a2)) while it exhibited a slight fungistatic effect against H. resinae with log-fold changes of -2.04 in the presence of 25 µg/mL (p < 0.04, n = 3 ), and -1.56 at 50 µg/mL (p < 0.01, n = 3) at day 4, respectively. Yet, at day 7, the inhibitory effect was limited to a log-fold change of -1.45 at a dose of 25 µg/mL (p < 0.052, n = 3) and -1.50 (p < 0.055, n = 3) at 50 µg/mL (Figure 5 (b2)). Interestingly, commercial pyochelin yielded a significant growth inhibition of Gordonia sp. at both doses starting at day 2 with a log-change of -3.24 at 25 µg/mL (p < 0.05, n = 3), and a log-change of -4.02 (p < 0.05l) at 50 µg/mL, compared to the control. By day 7, there was complete growth inhibition with a log-fold change of -6.57 (p < 0.04l, n = 3) for both concentrations compared to control (Figure 5 (c2)).
The liquid screening assay results from microbial isolates P. protegens #133, and B. subtilis #232 crude culture filtrates, fractions and commercial pyochelin are summarized in Table 2 below. The corresponding growth inhibition results of representing biocidal activity are displayed.
3.4. Antimicrobial Activity of P. protegens #133 Crude Culture Filtrate and Pure Pyochelin in Jet A Fuel Microbial Consortium Culture
To test the suitability of #133 crude culture filtrate and pyochelin as biocontrol agents in hydrocarbon environments, Jet A fuel consortium culture assays were established. Microbial consortia consisted of bacterial P. putida, Gordonia sp., yeast Y. lipolytica, and filamentous fungi H. resinae inoculated at a total final concentration of 1 x 10⁴ CFU/mL in 5 mL minimal medium (1:1 mixture of M9/YNB) overlaid with 20 mL of Jet A fuel (fuel phase). For antimicrobial activity testing, cultures were supplemented with antimicrobial Isolate #133 P. protegens crude culture filtrate at 100 µL (representing approximately 1.38 mg compound mixture dry weight), 1 mL, or 2.5 mL total volume or pyochelin standard at 20 µg/mL.
Antimicrobial testing using a dose of 100 µl of #133 crude culture filtrate had no visible effect on bacterial growth (Figure 6 (a)). A dose-increase of #133 filtrate to 1 mL resulted in a visible antibacterial effect until day 15 (-6.36 log-fold reduction compared to the control) that was followed by a steep increase in bacterial growth until the end of the study. A further dose-increase of #133 filtrate crude filtrate to 2.5 mL demonstrated a -7 log-fold reduction compared to the control resulting in a complete growth inhibition of bacteria at day 29. Pyochelin tested at 20 µg/mL showed a log-fold reduction of -2.39 on day 7, yet bacterial growth returned to control levels on day 29. In contrast, there was no fungal growth inhibition observed in the presence of either biocontrol, #133 crude culture filtrate or pyochelin at the administered doses (Figure 6 (b)).
3.5. Antimicrobial Cytotoxicity Effect of P. protegens #133 Culture Filtrate Against Gordonia sp. in Jet A Fuel Culture Using Live/Dead Flow Cytometry
According to the above observed antibacterial effect of isolate #133 crude culture filtrate in liquid and in Jet A fuel culture, functional fluorescent stains and flow cytometry was used to determine the mechanism of action, i.e., cell wall damage and cell death. Since Gordonia sp. appeared to be the most sensitive microbe to the antimicrobial actions of #133 culture filtrate, a corresponding single bacteria fuel culture assay was set up under similar conditions as the previous fuel consortium culture. Following the collection of the water phase after different time points, cells were stained with SYTO 9/ propidium iodide and analyzed by flow cytometry (FCM). To assess viable, dead cells and differentiate between viable non-culturable cells (VBNC) from dead cells by assuming the dead cells have the membrane damaged while VBNC and viable cells have an intact membrane, but not forming colonies on culture plates.
The FCM cell exclusion-assay uses the PI stain to detect cells with compromised/damaged bacterial membranes, in combination with SYTO 9 that can cross all bacterial cell membranes and allows determination of total cell counts. However, when stained with both dyes, live and dead cells can be counted based on the relative green and red fluorescence (Figure 7 (a)).To assess the antimicrobial potency and efficacy, FCM SYTO 9 cell viability determination was done under different doses of #133 culture filtrate, 100 µL (1.38 mg dry weight), 500 µL, 1 mL and 2.5 mL and dose-response curves for percent cell viability at different time intervals of 4 hours and 48 hours were established (Figure 7 (b)). According to the #133 culture filtrate dose-response data for 4 hours and 48 hours of exposure, a dose of 100 µL (1.38 mg dry weight) had no effect on cell viability as determined by PI/SYTO 9 green staining while increasing doses of 500 µL, 1 mL and 2.5 mL resulted in reduced cell viability. At the lowest effective dose of 500 µL (6.9 mg dry weight) viability was reduced to 51.26 ± 2.23% after 4 hours the percent viability dropped to 27.26 ± 3.81% after 48 hours. The highest dose of 2.5 mL (34.5 mg dry weight) resulted in the highest reductions in percent cell viability 26.69 ± 7.42% viable cells after 4 hours, and after 48 hours cell viability dropped to 4.91 ± 0.23 %. To determine the IC50, the concentration of antimicrobial where percent inhibition is equal to 50 percent, a non-linear regression theoretical curve fit was applied. Non-linear regression analysis demonstrated good curve fits with an IC50 dose of 1.031 mg/mL (R2 = 0.9984) at the 4-hour time point versus an even more effective IC50 dose of 0.8019 mg/mL (R2 = 0.9909) after 48 hours. In addition, differences in the dose-response curve determined Hill slopes at 4 hours (-1.352) to 48 hours (-1.378) support the potency and efficacy of the #133 P. protegens biocontrol agent to effectively decrease Gordonia sp. cell viability.
On day 7, flow cytometry could not detect a significant number of live or dead cells and there is compelling evidence that majority of the undetected cells are lysed. This was further confirmed by fluorescent microscopy. Shifting side- scatter (SSC), forward side- scatter (FSC), and changing florescent intensity indicates cell morphological changes, rupture of cell membranes, cell lysis and cell debris. Based on this observation, we estimated that a majority of the cells inoculated at day 0 were lysed (Table 3). Based on this observation we estimated that following 7 days exposure to #133 culture filtrate at doses of 500 µL, 1 mL and 2.5 mL led to cell lysis of over 94% of the inoculated cells. While day 7 exposure to #133 culture filtrate doses of 500 µL, 1mL and 2.5 mL resulted in a remaining SYTO 9 fluorescence of 4.11%, 2.73%, and 1.08% (n = 3) viable cells in FCM propidium iodide exclusion assay, none of the detected cells seemed to produce any viable colonies in following culture plating (depicted in Table 3 as VBNC).
4. Discussion
This study aimed to identify novel naturally produced antimicrobial compounds for control of biocontamination in hydrocarbon fuels. Initial antimicrobial activity testing of 493 microbial fuel isolates from our in-house repository by the commonly used agar plug screening method [17,33,34] resulted in several promising candidates. To exclude fuel isolates with false-positive antimicrobial activity resulting from cell-to cell interactions in the agar plug screening method, further testing included fluorescence and SEM microscopy. In addition, we carefully developed liquid assay for assurance of soluble biocontrol compounds. As a result, two fuel-isolate strains, P. protegens #133 and B. subtilis # 232 demonstrated promising biocontrol activity against bacteria, yeast, and filamentous fungi.
Antimicrobials from Bacillus species are well-known and have been proposed for use in agricultural applications and clinical settings including the production of biosurfactants [35,36,37,38]. According to the agar plug screening, the isolate #232 had the biggest inhibition cycles against other Gram-positive bacteria Gordonia sp. and B. atrophaeus; Gram-negative bacterium P. putida and H. effusa yeasts Y. lipolytica, M. guilliermondii, S. pombe, and filamentous fungi H. resinae, A. versicolor, and F. oxysporum. Liquid culture assay demonstrated similar #232 culture filtrate biocontrol efficiency for most of the above tested microbes, yet lacked agar plug testing observed efficacy against yeast Y. lipolytica, M. guilliermondii, and S. pombe, and filamentous fungi A. versicolor, and F. oxysporum. This can have several reasons, including stability of some of the compounds, and the lack of cell-to-cell interactions. For instance, some of the Bacillus may regulate the activation of cellular envelope-localized stress sensing receptors were demonstrated to be essential for initiation of production of different antimicrobials [39]. In addition, Bacillus is known to produce volatile organic compounds with antifungal properties [23,26,27] that can be retained in the agar test plate but might evaporate during liquid testing.
According to the mass spectrometry analysis of B. subtilis #232 lipid extracts, one of the detected antifungal compounds, i.e., the hyphae and spore lysing antifungal lipopeptide fengycin C [40,41] was abundantly present, yet chemical instability of fengycins has been previously observed by other investigators [42]. Also, mass spectrometry detected the lipopeptide biosurfactant surfactin that is known to cause osmotic pressure imbalance in fungi and bacteria [43,44]. When looking at potential active compounds that might be relevant for the observed inhibition of fungi and bacteria, gageostatin C was detected at high abundance [45] together with zoospore motility inhibitor gageopeptin B [21]. Mass spectrometry also detected a number of abundant compounds of the macrolactin family including 7-O-Malonyl macrolactin, macrolactin F, and macrolactin B that have been demonstrated to exhibit antimicrobial activity against Gram-positive and Gram-negative bacteria [46,47]. Unfortunately, our efforts of targeted compound purification from #232 culture filtrate yielded variable results although growth conditions and purification protocols were meticulously performed. The variable metabolic compound production of Bacillus has been observed by other investigators [48,49], and was previously discussed as a result of “bacterial cannibalism” or cross- feeding where a differentiated subpopulation harvests nutrients from their genetically identical siblings through intra- and interspecies metabolic exchange.
When focusing on the #133 P. protegens strain, it seemed to have much higher antimicrobial activity against Gram-positive and Gram-negative bacteria in agar plug testing with radius of inhibition zones starting above 20 mm for most of the tested bacteria. While #133 also demonstrated efficacy against all the tested fungi with radius of inhibition zones smaller than 20 mm. Compared to assays using the #232 isolate, liquid culture assays of #133 lacked antimicrobial activity against yeast Y. lipolytica, M. guilliermondii, and S. pombe and filamentous fungi A. versicolor, and F. oxysporum. Similar to Bacillus species, Pseudomonas species produce volatile organic compounds (VOG) [50], and phenolic compounds [51] with antimicrobial activity that might be inactive in liquid culture assays. In contrast to Bacillus, most of the antimicrobial compounds produced by P. protegens include small molecules and lipid compounds such as rhamnolipids and quorum sensing molecules including pyoverdine, pyocyanin, and phenzine [52]. Analysis of lipid extracts from #133 culture filtrate by mass spectrometry detected common molecules contained in the biofilm of other Pseudomonads such as quorum-sensors 3-oxo-C12-HSL (N-3-Oxo-Dodecanoyl-L-Homoserine Lactone), NQNO (Nonyl-4-Hydroxyquiniline-N-oxide) and rhamnolipids Rha-C10:1-C8, Rha-C10-C10-CH3, Rha-Rha-C12-C10, Rha-C12:1-C10 and Rha Rha-Rha-C14-C14. In addition, the siderophore pyochelin [28] was identified as one of the most abundant compounds in #133 lipid extracts.
The compound trace for #133 extracted pyochelin differed from that of P. aeruginosa PAO1 by displaying two unique peaks at retention times 1.89 and 2.3 min with practically no surrounding contaminating compounds while P. aeruginosa had much lower pyochelin compound abundance with several other surrounding compound ions present. While the pyochelin iron chelating and associated antimicrobial action through metal ion depletion has been well-characterized [28,32], pyochelin was also suggested to cause cell death by bacterial membrane disruption [53]. When testing the antimicrobial actions of #133 purified pyochelin, the tested dose had some partial fungistatic effects on the tested microbes Y. lipolytica, and H. resinae but lacked antimicrobial efficiency against Gordonia sp. In contrast, the purchased synthetic pyochelin standard lacked inhibition of Y. lipolytica but showed a similar fungistatic effect against H. resinae with a significant bactericidal effect on Gordonia sp. Potential issues with #133 pyochelin compound purity versus additional contaminants within the synthesized pyochelin product at a marketed 96% purity might affect the dose determinations explaining potential differences in compound activity.
For our Jet A fuel microbial inhibition assay, we developed a microbial consortia of major fuel contaminants, including, Gordonia sp., P. putida, Y. lipolytica, and H. resinae that are often found in a fuel tank environment. In contrast to liquid culture assays, Jet A fuel culture testing of same-dose commercial pyochelin standard (20 µg/mL) lacked effective inhibition of bacterial growth. The observed effect was similar to the lowest #133 culture filtrate dose of 100 µL; a dose that was only bacteriostatic. When the dose of #133 was increased to 1 mL, bacterial growth stalled for 10 days while it was completely eliminated at 2.5 mL. In contrast, fungal growth seemed to rise in the presence of bacterial inhibition. This observation suggests that the presence of bacteria in the consortium inherently exerts a growth inhibitory effect over the fungi, and when this effect is eliminated, fungal growth is enhanced. The equilibrium between growth-inhibitory and stimulatory effects of bacterial and fungal consortia is a phenomenon commonly observed in various co-culture scenarios [54,55].
While the Jet A fuel consortium culture was set up to test #133 culture filtrate efficiently against Gram-positive and Gram-negative bacteria, our observations conclude that #133 culture filtrate is highly efficient of killing Gordonia sp.. Several species of Gordonia have been identified in hydrocarbon fuels with ability to survive and proliferate in the toxic fuel environment by forming micelles [56,57,58,59]. Accordingly, the identified rhamnolipid compounds Rha-C10:1-C8, Rha-C10-C10-CH3, Rha-Rha-C12-C10, Rha-C12:1-C10 and Rha Rha-Rha-C14-C14 that are known surfactants might interfere with potential antimicrobial activity of other compounds contained in #133 culture filtrate in fuel by assisting micelle formation [5,60,61]. Yet, small molecules such as pyochelin and other compounds contained in #133 culture filtrate might act on destabilizing the cell membrane of these Gram-positive bacteria [62], and the mass spectrometry detected quorum-sensing molecules 3-oxo-C12-HSL [63], and NQNO might further assist in inhibiting bacterial growth [64]. It remains to be determined which compound in #133 culture filtrate is responsible for the observed antimicrobial action against Gram-positive bacteria.
To determine the antimicrobial mechanism of action of #133 culture filtrate on Gram-positive bacteria, pure culture of Gordonia sp. in Jet A fuel culture was further analyzed by flow-cytometry (FCM) in combination with CFU culture plating to assess viable, dead, viable none culturable cells (VBNC), and lysed bacterial cells. A major disadvantage of using plate count method for antimicrobial screening is its difficulty to identify whether bacteria are killed (bactericidal) or prevented from replicating (bacteriostatic). FCM in conjunction with functional fluorescent staining allows real-time assessment of cell viability by simultaneous counting live and dead cells. Through adjustment of light scattering parameters, an assessment can be made about the quantity of cellular debris from lysed cell bodies. The corresponding results from live/dead cell analysis confirmed that antimicrobial compounds contained in #133 culture filtrate exhibit a bactericidal effect against Gordonia sp. killing the cells through bacterial lysis and membrane damage. The biocontrol activity of #133 culture filtrate seems to be unique in its capability to lyse the thick peptidoglycan containing bacterial cell wall [65] of Gordonia sp., and even shows efficacy even in the presence of a hydrocarbon.
Investigating the antimicrobial mode of action is crucial because it provides deeper understanding of how the antimicrobials work against the targeted microorganisms and how they could be optimized to improve the antimicrobial activity for the development of suitable commercial biocides. Real-time monitoring of individual cell counts by FCM allows assessment of live and dead cells simultaneously [29,30,31]. Therefore, we established a rapid and simple assay to screen the crude extract of P. protegens #133 on fuel bio contaminants using flow cytometry. Using the live SYTO 9/dead PI cellular exclusion assay provides a straight-forward methods to identify cell membrane integrity and cell death [31,66,67]. In this study, FCM analysis demonstrated the time-dependent mode of antimicrobial action of #133 culture filtrate on Gordonia sp. cell viability when monitored at 4 hours and 48 hours after antimicrobial exposure. According to the decrease in IC50 from 1.031 mg/mL at 4 hours versus an IC50 of 0.8019 mg/mL after 48 hours, exposure time played an important role in the percent viability dose response assessment of Gordonia sp. While the effective dose of #133 culture filtrate is relatively high with an IC50 of 0.8 mg/mL, it needs to be considered that the culture filtrate is composed of a multitude of compounds that when purified might result in much lower IC50 for individual compounds. By modulating changes in detection in the according settings for forward/side scatter plots we were able to detect evidence of cell lysis as the antimicrobial mode of action and further confirmed by fluorescence microscopy.
5. Conclusion
In summary, this study recommends the use of P. protegens #133 as a potential biocontrol agent to mitigate Gram-positive bacterial contamination. Follow up studies should consider further purification and characterization of #133-derived compounds produce a more potent antimicrobial response and facilitate potential commercial applications.
Supplementary Materials
The following supporting information can be downloaded at the website of this paper posted on Preprints.org, Figure S1: Isolate #232 culture filtrate contained compounds purified by Lipid Extraction and Semi-prep fractionation and LC-QTOF analysis.; Figure S2: Bacillus subtilis specific compounds identified by LC-QTOF in fuel isolate #232.; Supplemental Data S1: Isolate #232 culture filtrate contained compounds purified by Lipid Extraction and Semi-prep fractionation and LC-QTOF analysis.; Supplemental Data S2: Isolate #133 culture filtrate contained compounds purified by Lipid Extraction and Semi-prep fractionation and LC-QTOF analysis.
Author Contributions
Conceptualization, Amanda Barry Schroeder, Osman Radwan, Oscar Ruiz, Thusitha Gunasekera and Andrea Hoffmann; Data curation, Amanda Barry Schroeder, Adam Reed, Osman Radwan, Loryn Bowen, Thusitha Gunasekera and Andrea Hoffmann; Formal analysis, Amanda Barry Schroeder, Adam Reed, Osman Radwan, Loryn Bowen, Thusitha Gunasekera and Andrea Hoffmann; Funding acquisition, Oscar Ruiz and Thusitha Gunasekera; Investigation, Amanda Barry Schroeder, Adam Reed, Loryn Bowen, Thusitha Gunasekera and Andrea Hoffmann; Methodology, Amanda Barry Schroeder, Adam Reed, Osman Radwan, Loryn Bowen, Thusitha Gunasekera and Andrea Hoffmann; Project administration, Oscar Ruiz, Thusitha Gunasekera and Andrea Hoffmann; Supervision, Thusitha Gunasekera and Andrea Hoffmann; Validation, Amanda Barry Schroeder, Adam Reed, Loryn Bowen, Thusitha Gunasekera and Andrea Hoffmann; Visualization, Amanda Barry Schroeder, Osman Radwan and Thusitha Gunasekera; Writing – original draft, Amanda Barry Schroeder, Thusitha Gunasekera and Andrea Hoffmann; Writing – review & editing, Amanda Barry Schroeder, Adam Reed, Oscar Ruiz, Thusitha Gunasekera and Andrea Hoffmann.
Funding
Research reported in this article was sponsored by AFRL/RQTF under agreement number FA8650-16-2-2605 and AFRL Sustainment Accelerator Fund (63199 AFRL STAF). The U.S. Government is authorized to reproduce and distribute reprints for Governmental purposes notwithstanding any copyright notation thereon. The views and conclusions contained herein are those of the authors and should not be interpreted as necessarily representing the official policies or endorsements, either expressed or implied, of Air Force Research Laboratory and U.S. Government. (Distribution Statement A: Approved for Public Release; Distribution is Unlimited. CLEARED on 13 November 2024; PA# AFRL-2024-6321).
Data Availability Statement
Data will be shared upon request.
Conflicts of Interest
The authors declare no conflicts of interest. The authors declare that they have no known competing financial interests or personal relationships that could have appeared to influence the work reported in this paper. The funders had no role in the design of the study; in the collection, analyses, or interpretation of data; in the writing of the manuscript; or in the decision to publish the results.
Abbreviations
| AMP | Antimicrobial Peptides |
| BPC | Base Peak Chromatograms |
| CFU | Colony Forming Unit |
| EIC | Extracted Ion Chromatogram |
| FCM | Flow Cytometry |
| FSC | Forward Side- Scatter |
| HPLC | High-Performance Liquid Chromatography |
| MIC | Minimum Inhibitory Concentration |
| M9 | M9 Culture Medium |
| PBS | Phosphate Buffered Saline |
| PDA | Potato Dextrose Agar |
| PDB | Potato Dextrose Broth |
| PI | Propidium Iodide |
| Q-TOF | Quadrupole Time-Of-Flight |
| RPM | Revolutions Per Minute |
| SMAP | Sheep Myeloid Antimicrobial Peptide |
| SEM | Scanning Electron Microscopy |
| SSC | Shifting Side- Scatter |
| TSA | Tryptic Soy Agar |
| TSB | Tryptic Soy Broth |
| VBNC | Viable But Non-Culturable |
| YNB | Yeast Nitrogen Base without Amino Acids |
| VOG | Volatile Organic Compounds |
| PI | Propidium Iodide |
References
- Beech, I.; Gaylarde, C. Recent advances in the study of biocorrosion - an overview. Revista de Microbiologia 1999, 30, 177-190. [CrossRef]
- Rauch, M. E.; Graef, H. W.; Rozenzhak, S. M.; Jones, S. E.; Bleckmann, C. A.; Kruger, R. L.; Naik, R. R.; Stone, M. O. Characterization of microbial contamination in United States Air Force aviation fuel tanks. J Ind Microbiol Biotechnol 2006, 33 (1), 29-36. [CrossRef]
- Wilkinson, S.; Nicklin, S.; Faull, J. L. Biodegradation of fuel oils and lubricants: Soil and water bioremediation options. Progress in Industrial Microbiology 2002, 36, 69-100. [CrossRef]
- Radwan, O.; Gunasekera, T. S.; Ruiz, O. N. Draft Genome Sequence of Byssochlamys sp. Isolate BYSS01, a Filamentous Fungus Adapted to the Fuel Environment. Genome Announc 2018, 6 (10). [CrossRef]
- Grady, S. L.; Malfatti, S. A.; Gunasekera, T. S.; Dalley, B. K.; Lyman, M. G.; Striebich, R. C.; Mayhew, M. B.; Zhou, C. L.; Ruiz, O. N.; Dugan, L. C. A comprehensive multi-omics approach uncovers adaptations for growth and survival of Pseudomonas aeruginosa on n-alkanes. BMC Genomics 2017, 18 (1), 334. [CrossRef]
- Passman, F. J. Microbial contamination and its control in fuels and fuel systems since 1980 – a review. International Biodeterioration & Biodegradation 2013, 81, 88-104. [CrossRef]
- Gunasekera, T. S.; Striebich, R. C.; Mueller, S. S.; Strobel, E. M.; Ruiz, O. N. Transcriptional profiling suggests that multiple metabolic adaptations are required for effective proliferation of Pseudomonas aeruginosa in jet fuel. Environ Sci Technol 2013, 47 (23), 13449-13458. [CrossRef]
- Gunasekera, T. S.; Bowen, L. L.; Zhou, C. E.; Howard-Byerly, S. C.; Foley, W. S.; Striebich, R. C.; Dugan, L. C.; Ruiz, O. N. Transcriptomic Analyses Elucidate Adaptive Differences of Closely Related Strains of Pseudomonas aeruginosa in Fuel. Appl Environ Microbiol 2017, 83 (10). [CrossRef]
- Gunasekera, T. S.; Bowen, L. L.; Radwan, O.; Striebich, R. C.; Ruiz, O. N. Genomic and transcriptomic characterization revealed key adaptive mechanisms of Marinobacter hydrocarbonoclasticus NI9 for proliferation and degradation of jet fuel. International Biodeterioration & Biodegradation. 2022, 175. [CrossRef]
- Li, Y.; Wilhelm, M. J.; Wu, T.; Hu, X.; Ruiz, O. N.; Dai, H. Quantifying bacterial efflux within subcellular domains of Pseudomonas aeruginosa. Applied and Environmental Microbiology 2024. [CrossRef]
- Ayon, N. J. High-Throughput Screening of Natural Product and Synthetic Molecule Libraries for Antibacterial Drug Discovery. Metabolites 2023, 13 (5). [CrossRef]
- Haney, E. F.; Mansour, S. C.; Hancock, R. E. Antimicrobial Peptides: An Introduction. Methods Mol Biol 2017, 1548, 3-22. [CrossRef]
- Roy, R.; Tiwari, M.; Donelli, G.; Tiwari, V. Strategies for combating bacterial biofilms: A focus on anti-biofilm agents and their mechanisms of action. Virulence 2018, 9 (1), 522-554. [CrossRef]
- Bordoloi, G. N.; Kumari, B.; Guha, A.; Bordoloi, M.; Yadav, R. N.; Roy, M. K.; Bora, T. C. Isolation and structure elucidation of a new antifungal and antibacterial antibiotic produced by Streptomyces sp. 201. Biosci Biotechnol Biochem 2001, 65 (8), 1856-1858. [CrossRef]
- Ilyas, H.; Kim, J.; Lee, D.; Malmsten, M.; Bhunia, A. Structural insights into the combinatorial effects of antimicrobial peptides reveal a role of aromatic-aromatic interactions in antibacterial synergism. J Biol Chem 2019, 294 (40), 14615-14633. [CrossRef]
- Barry Schroeder, A. L.; Radwan, O.; Gunasekera, T. S.; Ruiz, O. N.; Hoffmann, A. Use of Sheep Myeloid Antimicrobial Peptide (SMAP-18) and Siderophore Pyochelin for Mitigation of Aerospace Fuel-Degrading Microbes. International Biodeterioration & Biodegradation 2025, 196. [CrossRef]
- Balouiri, M.; Sadiki, M.; Koraichi Ibnsouda, S. Methods for in vitro evaluating antimicrobial activity: A review. Journal of Pharmaceutical Analysis 2016 2,71–79. [CrossRef]
- Ortlieb, N.; Klenk, E.; Kulik, A.; Niedermeyer, T. H. J. Development of an agar-plug cultivation system for bioactivity assays of actinomycete strain collections. PLoS One 2021, 16 (11), e0258934. [CrossRef]
- Li, Y.; Xia, M.; He, P.; Yang, Q.; Wu, Y.; He, P.; Ahmed, A.; Li, X.; Wang, Y.; Munir, S.; He, Y. Developing Penicillium digitatum Management Strategies on Post-Harvest Citrus Fruits with Metabolic Components and Colonization of Bacillus subtilis L1-21. J Fungi (Basel) 2022, 8 (1). [CrossRef]
- Wang, X. Q.; Zhao, D. L.; Shen, L. L.; Jing, C. L.; Zhang, C. S. Role of Rhizospheric Microbes in Soil; Springer, 2018.
- Tareq, F. S.; Hasan, C. M.; Lee, H. S.; Lee, Y. J.; Lee, J. S.; Surovy, M. Z.; Islam, M. T.; Shin, H. J. Gageopeptins A and B, new inhibitors of zoospore motility of the phytopathogen Phytophthora capsici from a marine-derived bacterium Bacillus sp. 109GGC020. Bioorg Med Chem Lett 2015, 25 (16), 3325-3329. [CrossRef]
- Fira, D.; Dimkic, I.; Beric, T.; Lozo, J.; Stankovic, S. Biological control of plant pathogens by Bacillus species. J Biotechnol 2018, 285, 44-55. [CrossRef]
- Al-Mutar, D. M. K.; Noman, M.; Alzawar, N. S. A.; Qasim, H. H.; Li, D.; Song, F. The Extracellular Lipopeptides and Volatile Organic Compounds of Bacillus subtilis DHA41 Display Broad-Spectrum Antifungal Activity against Soil-Borne Phytopathogenic Fungi. J Fungi (Basel) 2023, 9 (8). [CrossRef]
- Schneider, K.; Chen, X. H.; Vater, J.; Franke, P.; Nicholson, G.; Borriss, R.; Sussmuth, R. D. Macrolactin is the polyketide biosynthesis product of the pks2 cluster of Bacillus amyloliquefaciens FZB42. J Nat Prod 2007, 70 (9), 1417-1423. [CrossRef]
- Chen, K.; Tian, Z.; Luo, Y.; Cheng, Y.; Long, C. A. Antagonistic Activity and the Mechanism of Bacillus amyloliquefaciens DH-4 Against Citrus Green Mold. Phytopathology 2018, 108 (11), 1253-1262. [CrossRef]
- Jangir, M.; Sharma, S.; Sharma, S. Development of next-generation formulation against Fusarium oxysporum and unraveling bioactive antifungal metabolites of biocontrol agents. Sci Rep 2021, 11 (1), 22895. [CrossRef]
- Chen, X.; Wang, Y.; Gao, Y.; Gao, T.; Zhang, D. Inhibitory Abilities of Bacillus Isolates and Their Culture Filtrates against the Gray Mold Caused by Botrytis cinerea on Postharvest Fruit. Plant Pathol J 2019, 35 (5), 425-436. [CrossRef]
- Andrejevic, T. P.; Asanin, D. P.; Pantovic, B. V.; Stevanovic, N. L.; Markovic, V. R.; Djuran, M. I.; Glisic, B. D. Metal complexes with valuable biomolecules produced by Pseudomonas aeruginosa: a review of the coordination properties of pyocyanin, pyochelin and pyoverdines. Dalton Trans 2023, 52 (14), 4276-4289. [CrossRef]
- Attfield, P. V.; Gunasekera, T. S.; Boyd, A. R.; Deere, D.; Veal, D. Application of flow cytometry to microbiology of food and beverage industries. AusBiotech 1999, 9, 159–166.
- Poscente, V.; Di Gregorio, L.; Costanzo, M.; Bernini, R.; Bevivino, A. Flow cytometry: Unravelling the real antimicrobial and antibiofilm efficacy of natural bioactive compounds. J Microbiol Methods 2024, 222, 106956. [CrossRef]
- Garcia-Varela, R.; Garcia-Garcia, R. M.; Barba-Davila, B. A.; Fajardo-Ramirez, O. R.; Serna-Saldivar, S. O.; Cardineau, G. A. Antimicrobial Activity of Rhoeo discolor Phenolic Rich Extracts Determined by Flow Cytometry. Molecules 2015, 20 (10), 18685-18703. [CrossRef]
- Ankenbauer, R. G.; Cox, C. D. Isolation and characterization of Pseudomonas aeruginosa mutants requiring salicylic acid for pyochelin biosynthesis. J Bacteriol 1988, 170 (11), 5364-5367. [CrossRef]
- Hossain, T. J. Methods for screening and evaluation of antimicrobial activity: A review of protocols, advantages, and limitations. Eur J Microbiol Immunol (Bp) 2024, 14 (2), 97-115. [CrossRef]
- Rutten, A.; Kirchner, T.; Musiol-Kroll, E. M. Overview on Strategies and Assays for Antibiotic Discovery. Pharmaceuticals (Basel) 2022, 15 (10). [CrossRef]
- Caulier, S.; Nannan, C.; Gillis, A.; Licciardi, F.; Bragard, C.; Mahillon, J. Overview of the Antimicrobial Compounds Produced by Members of the Bacillus subtilis Group. Front Microbiol 2019, 10, 302. [CrossRef]
- Su, Y.; Liu, C.; Fang, H.; Zhang, D. Bacillus subtilis: a universal cell factory for industry, agriculture, biomaterials and medicine. Microb Cell Fact 2020, 19 (1), 173. [CrossRef]
- Liu, Y.; Li, J.; Du, G.; Chen, J.; Liu, L. Metabolic engineering of Bacillus subtilis fueled by systems biology: Recent advances and future directions. Biotechnol Adv 2017, 35 (1), 20-30. [CrossRef]
- Kaspar, F.; Neubauer, P.; Gimpel, M. Bioactive Secondary Metabolites from Bacillus subtilis: A Comprehensive Review. J Nat Prod 2019, 82 (7), 2038-2053. [CrossRef]
- Mascher, T.; Zimmer, S. L.; Smith, T. A.; Helmann, J. D. Antibiotic-inducible promoter regulated by the cell envelope stress-sensing two-component system LiaRS of Bacillus subtilis. Antimicrob Agents Chemother 2004, 48 (8), 2888-2896. [CrossRef]
- Wise, C.; Falardeau, J.; Hagberg, I.; Avis, T. J. Cellular Lipid Composition Affects Sensitivity of Plant Pathogens to Fengycin, an Antifungal Compound Produced by Bacillus subtilis Strain CU12. Phytopathology 2014, 104 (10), 1036-1041. [CrossRef]
- Roca-Couso, R.; Flores-Felix, J. D.; Rivas, R. Mechanisms of Action of Microbial Biocontrol Agents against Botrytis cinerea. J Fungi (Basel) 2021, 7 (12). [CrossRef]
- Gimenez, D.; Phelan, A.; Murphy, C. D.; Cobb, S. L. Fengycin A Analogues with Enhanced Chemical Stability and Antifungal Properties. Org Lett 2021, 23 (12), 4672-4676. [CrossRef]
- Chen, X.; Lu, Y.; Shan, M.; Zhao, H.; Lu, Z.; Lu, Y. A mini-review: mechanism of antimicrobial action and application of surfactin. World J Microbiol Biotechnol 2022, 38 (8), 143. [CrossRef]
- Liu, L.; Jin, X.; Lu, X.; Guo, L.; Lu, P.; Yu, H.; Lv, B. Mechanisms of Surfactin from Bacillus subtilis SF1 against Fusarium foetens: A Novel Pathogen Inducing Potato Wilt. J Fungi (Basel) 2023, 9 (3). [CrossRef]
- Tareq, F. S.; Lee, M. A.; Lee, H. S.; Lee, J. S.; Lee, Y. J.; Shin, H. J. Gageostatins A-C, antimicrobial linear lipopeptides from a marine Bacillus subtilis. Mar Drugs 2014, 12 (2), 871-885. [CrossRef]
- Wu, T.; Xiao, F.; Li, W. Macrolactins: biological activity and biosynthesis. Mar Life Sci Technol 2021, 3 (1), 62-68. [CrossRef]
- Charlie Tran, C.; Cock, I. E.; Chen, X.; Feng, Y. Antimicrobial Bacillus: Metabolites and Their Mode of Action. Antibiotics 2022, 11, 88. [CrossRef]
- Liu, W. T.; Yang, Y. L.; Xu, Y.; Lamsa, A.; Haste, N. M.; Yang, J. Y.; Ng, J.; Gonzalez, D.; Ellermeier, C. D.; Straight, P. D.; et al. Imaging mass spectrometry of intraspecies metabolic exchange revealed the cannibalistic factors of Bacillus subtilis. Proc Natl Acad Sci U S A 2010, 107 (37), 16286-16290. [CrossRef]
- Gonzalez-Pastor, J. E.; Hobbs, E. C.; Losick, R. Cannibalism by sporulating bacteria. Science 2003, 301 (5632), 510-513. [CrossRef]
- Xu, C.; Frigo-Vaz, B.; Goering, J.; Wang, P. Gas-phase degradation of VOCs using supported bacteria biofilms. Biotechnol Bioeng 2023, 120 (5), 1323-1333. [CrossRef]
- Sallam, N. M. A.; AbdElfatah, H. S.; Khalil Bagy, H. M. M.; Elfarash, A.; Abo-Elyousr, K. A. M.; Sikora, E. J.; Sallam, A. Exploring the mechanisms of endophytic bacteria for suppressing early blight disease in tomato (Solanum lycopersicum L.). Front Microbiol 2023, 14, 1184343. [CrossRef]
- Castaldi, S.; Masi, M.; Sautua, F.; Cimmino, A.; Isticato, R.; Carmona, M.; Tuzi, A.; Evidente, A. Pseudomonas fluorescens Showing Antifungal Activity against Macrophomina phaseolina, a Severe Pathogenic Fungus of Soybean, Produces Phenazine as the Main Active Metabolite. Biomolecules 2021, 11 (11). [CrossRef]
- Gun Lee, D.; Kim, P.; Park, Y.; Park, S. C.; Woo, E. R.; Hahm, K. S. Antifungal mechanism of SMAP-29 (1–18) isolated from sheep myeloid mRNA against Trichosporon beigelii. Biochem Biophys Res Commun 2002, 295 (3), 591-596. [CrossRef]
- Yang, L.; Guo, Y.; Yang, H.; Li, S.; Zhang, Y.; Gao, C.; Wei, T.; Hao, L. Distinct microbiota assembly and functional patterns in disease-resistant and susceptible varieties of tobacco. Front Microbiol 2024, 15, 1361883. [CrossRef]
- Briard, B.; Mislin, G. L. A.; Latge, J. P.; Beauvais, A. Interactions between Aspergillus fumigatus and Pulmonary Bacteria: Current State of the Field, New Data, and Future Perspective. J Fungi (Basel) 2019, 5 (2). [CrossRef]
- Kim, K. K.; Lee, C. S.; Kroppenstedt, R. M.; Stackebrandt, E.; Lee, S. T. Gordonia sihwensis sp. nov., a novel nitrate-reducing bacterium isolated from a wastewater-treatment bioreactor. Int J Syst Evol Microbiol 2003, 53 (Pt 5), 1427-1433. [CrossRef]
- Lin, T. C.; Young, C. C.; Ho, M. J.; Yeh, M. S.; Chou, C. L.; Wei, Y. H.; Chang, J. S. Characterization of floating activity of indigenous diesel-assimilating bacterial isolates. J Biosci Bioeng 2005, 99 (5), 466-472. [CrossRef]
- Sowani, H.; Kulkarni, M.; Zinjarde, S. Harnessing the catabolic versatility of Gordonia species for detoxifying pollutants. Biotechnol Adv 2019, 37 (3), 382-402. [CrossRef]
- Brown, L. M.; Gunasekera, T. S.; Striebich, R. C.; Ruiz, O. N. Draft Genome Sequence of Gordonia sihwensis Strain 9, a Branched Alkane-Degrading Bacterium. Genome Announc 2016, 4 (3). [CrossRef]
- Gonzalez-Valdez, A.; Hernandez-Pineda, J.; Soberon-Chavez, G. Detection and Quantification of Mono-Rhamnolipids and Di-Rhamnolipids Produced by Pseudomonas aeruginosa. J Vis Exp 2024, (205). [CrossRef]
- Chong, H.; Li, Q. Microbial production of rhamnolipids: opportunities, challenges and strategies. Microb Cell Fact 2017, 16 (1), 137. [CrossRef]
- Ong, K. S.; Cheow, Y. L.; Lee, S. M. The role of reactive oxygen species in the antimicrobial activity of pyochelin. J Adv Res 2017, 8 (4), 393-398. [CrossRef]
- Bandara, H.; Hewavitharana, A. K.; Shaw, P. N.; Smyth, H. D. C.; Samaranayake, L. P. A novel, quorum sensor-infused liposomal drug delivery system suppresses Candida albicans biofilms. Int J Pharm 2020, 578, 119096. [CrossRef]
- Heeb, S.; Fletcher, M. P.; Chhabra, S. R.; Diggle, S. P.; Williams, P.; Camara, M. Quinolones: from antibiotics to autoinducers. FEMS Microbiol Rev 2011, 35 (2), 247-274. [CrossRef]
- Pino-Rosa, S.; Medina-Pascual, M. J.; Carrasco, G.; Garrido, N.; Villalon, P.; Valiente, M.; Valdezate, S. Focusing on Gordonia Infections: Distribution, Antimicrobial Susceptibilities and Phylogeny. Antibiotics (Basel) 2023, 12 (11). [CrossRef]
- Gunasekera, T. S.; Veal, D. A.; Attfield, P. V. Potential for broad applications of flow cytometry and fluorescence techniques in microbiological and somatic cell analyses of milk. Int J Food Microbiol 2003, 85 (3), 269-279. [CrossRef]
- Gunasekera, T. S.; Sorensen, A.; Attfield, P. V.; Sorensen, S. J.; Veal, D. A. Inducible gene expression by nonculturable bacteria in milk after pasteurization. Appl Environ Microbiol 2002, 68 (4), 1988-1993. [CrossRef]
Figure 1.
Agar Plug Screening of Biocontrol Producing Microbes. (a) Agar plug screening of fuel isolate repository with selected target microbes P. putida, Gordonia sp., Y. lipolytica, and H. resinae. (b) Scanning Electron Microscopy (SEM) images show Hormoconis resinae fungal mycelium and spores. Images show shrinking fungal mycelium and spores from the inhibited fungal growth area (red dashed square) compared to intact fungal mycelium and spores from outside inhibition area (white dashed square). Red arrows point to ultrastructure damages in both fungal mycelium and spores while green arrows point to biocontrol Delftia sp. #329 bacteria.
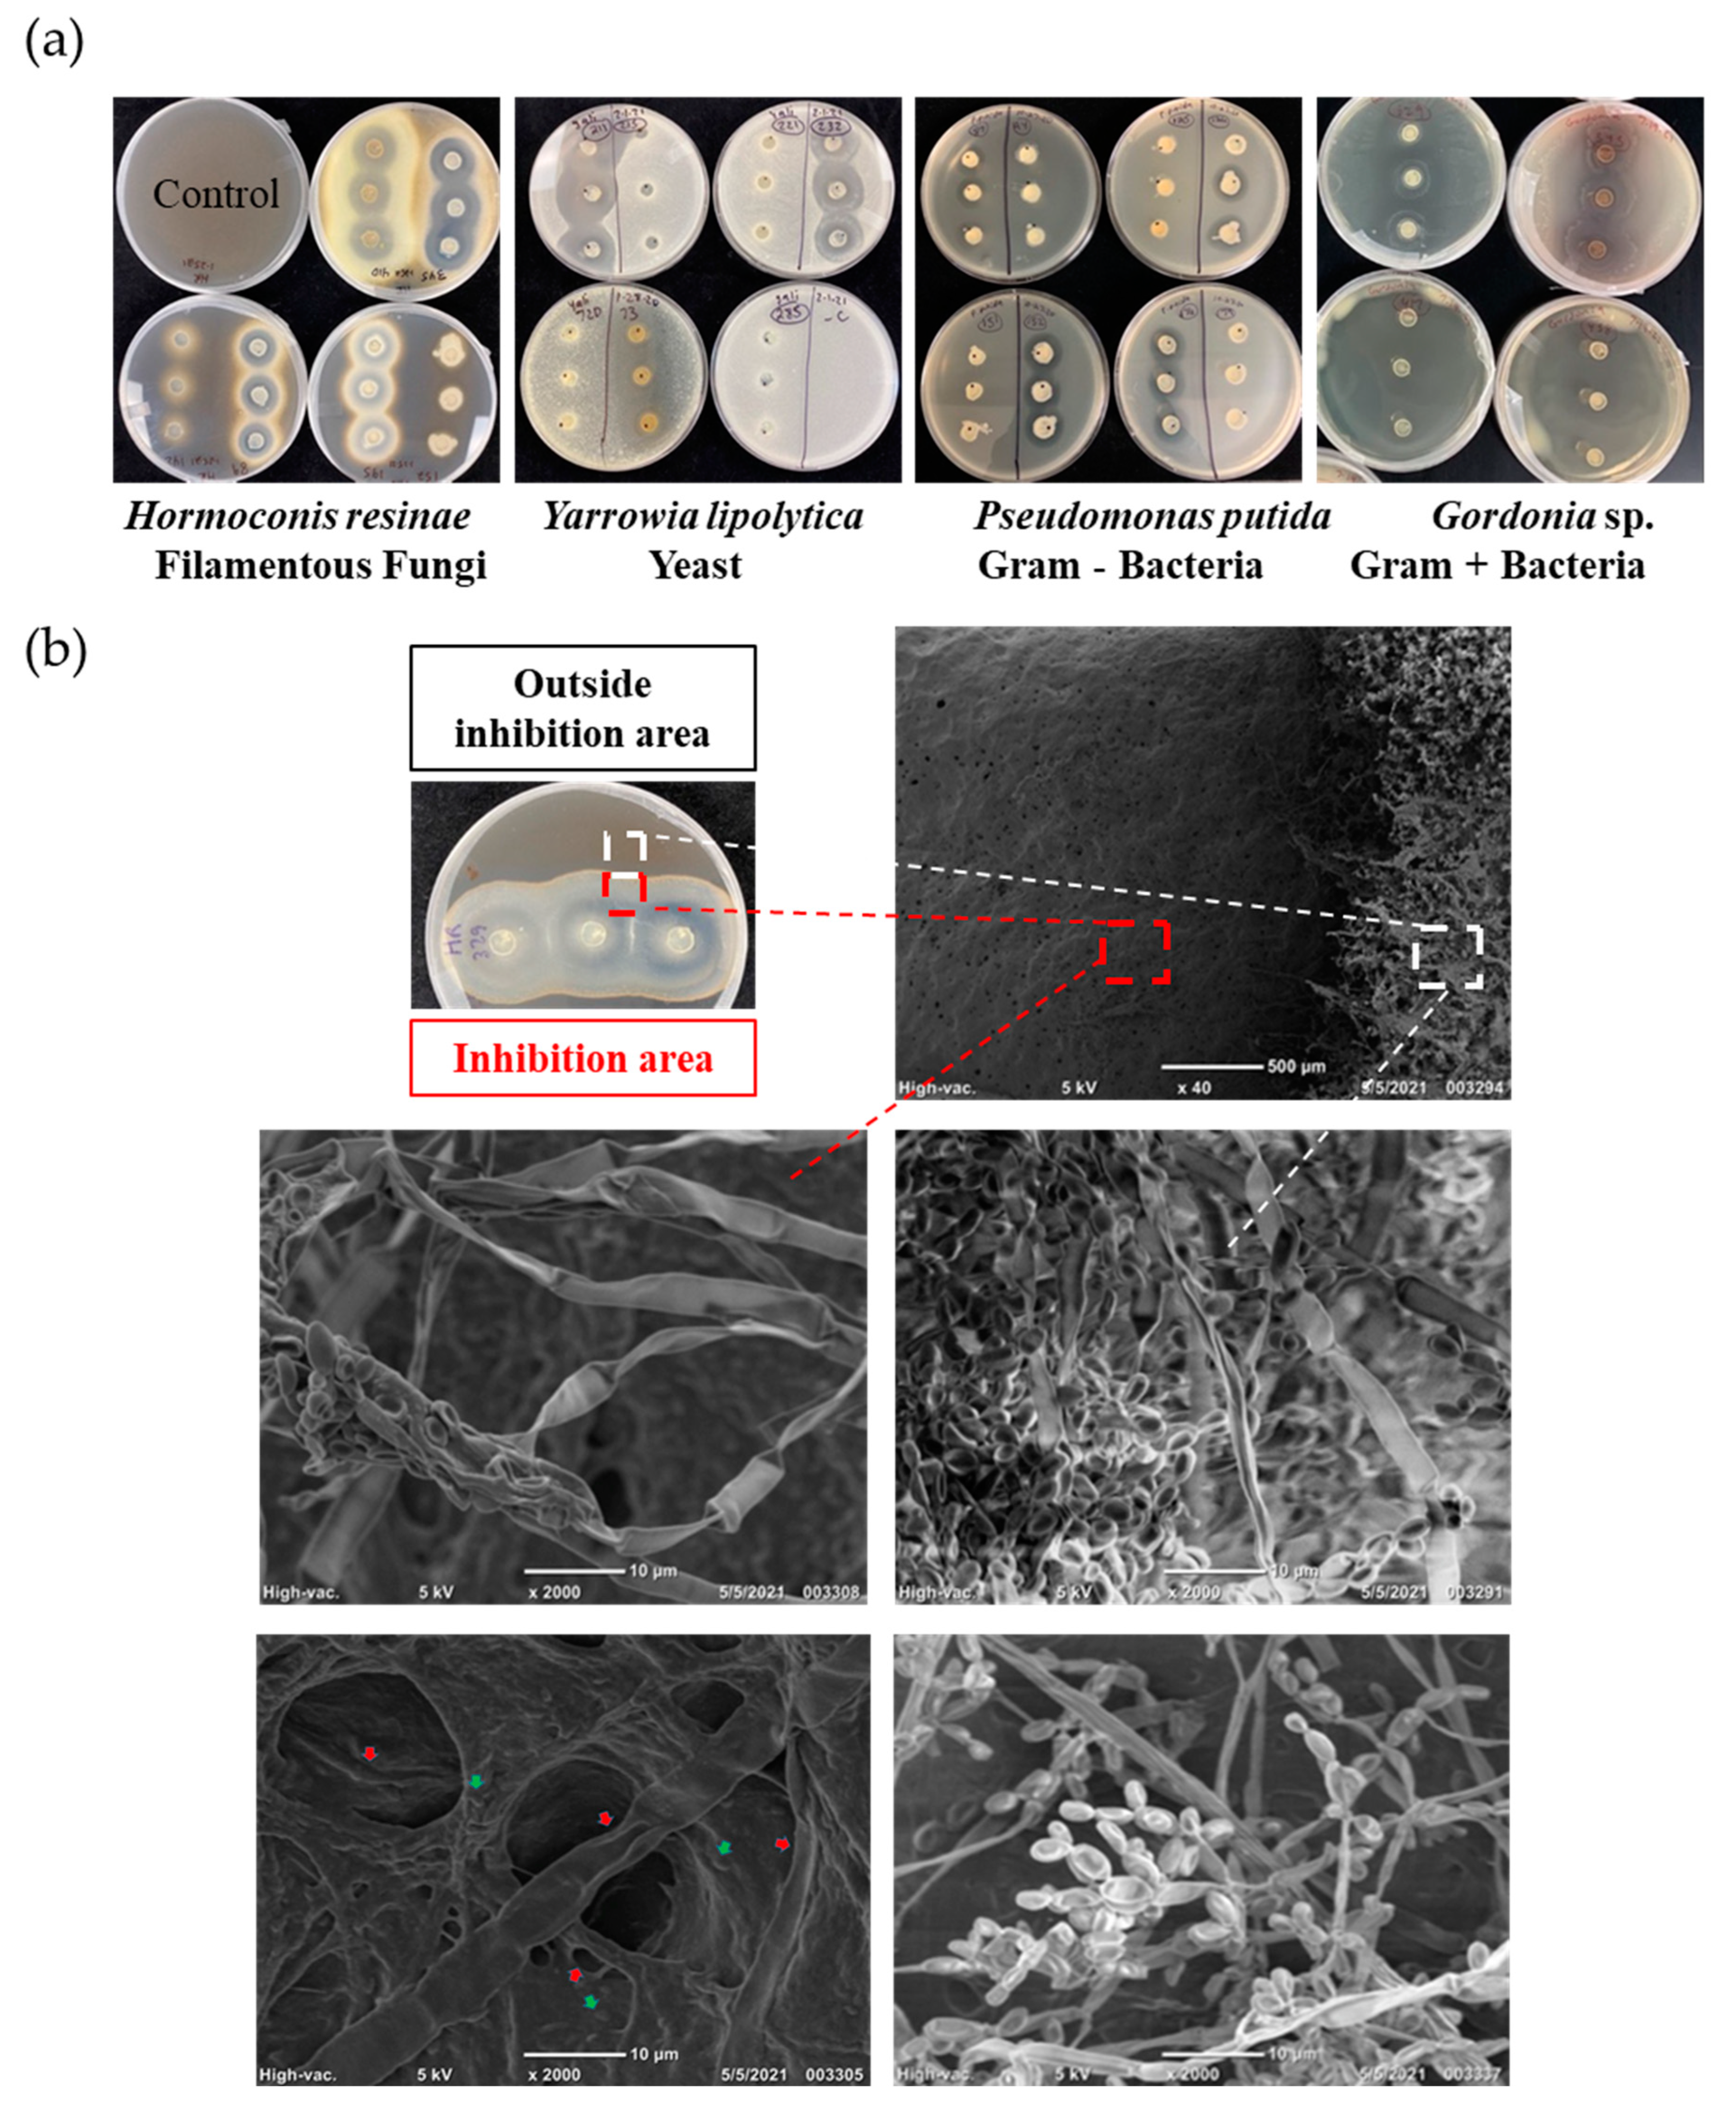
Figure 2.
Biocontrol Activity Screening of Isolate B. subtilis #232 and P. protegens #133 Crude Culture Filtrate in Liquid Culture. Biocontrol activity of crude culture filtrates from isolate B. subtilis #232 (1) and P. protegens #133 (2) was tested against (a) B. atrophaeus, (b) N. albus, (c) Gordonia sp., (d) H. effusa, and (e) H. resinae over 11 days using CFU evaluation. Control shown in circles, and test samples in square. Two-sample student’s t-test was applied by taking the averages of each condition and combining all the control data across experiments. Error bars represent standard error, sample size n = 6 and above.
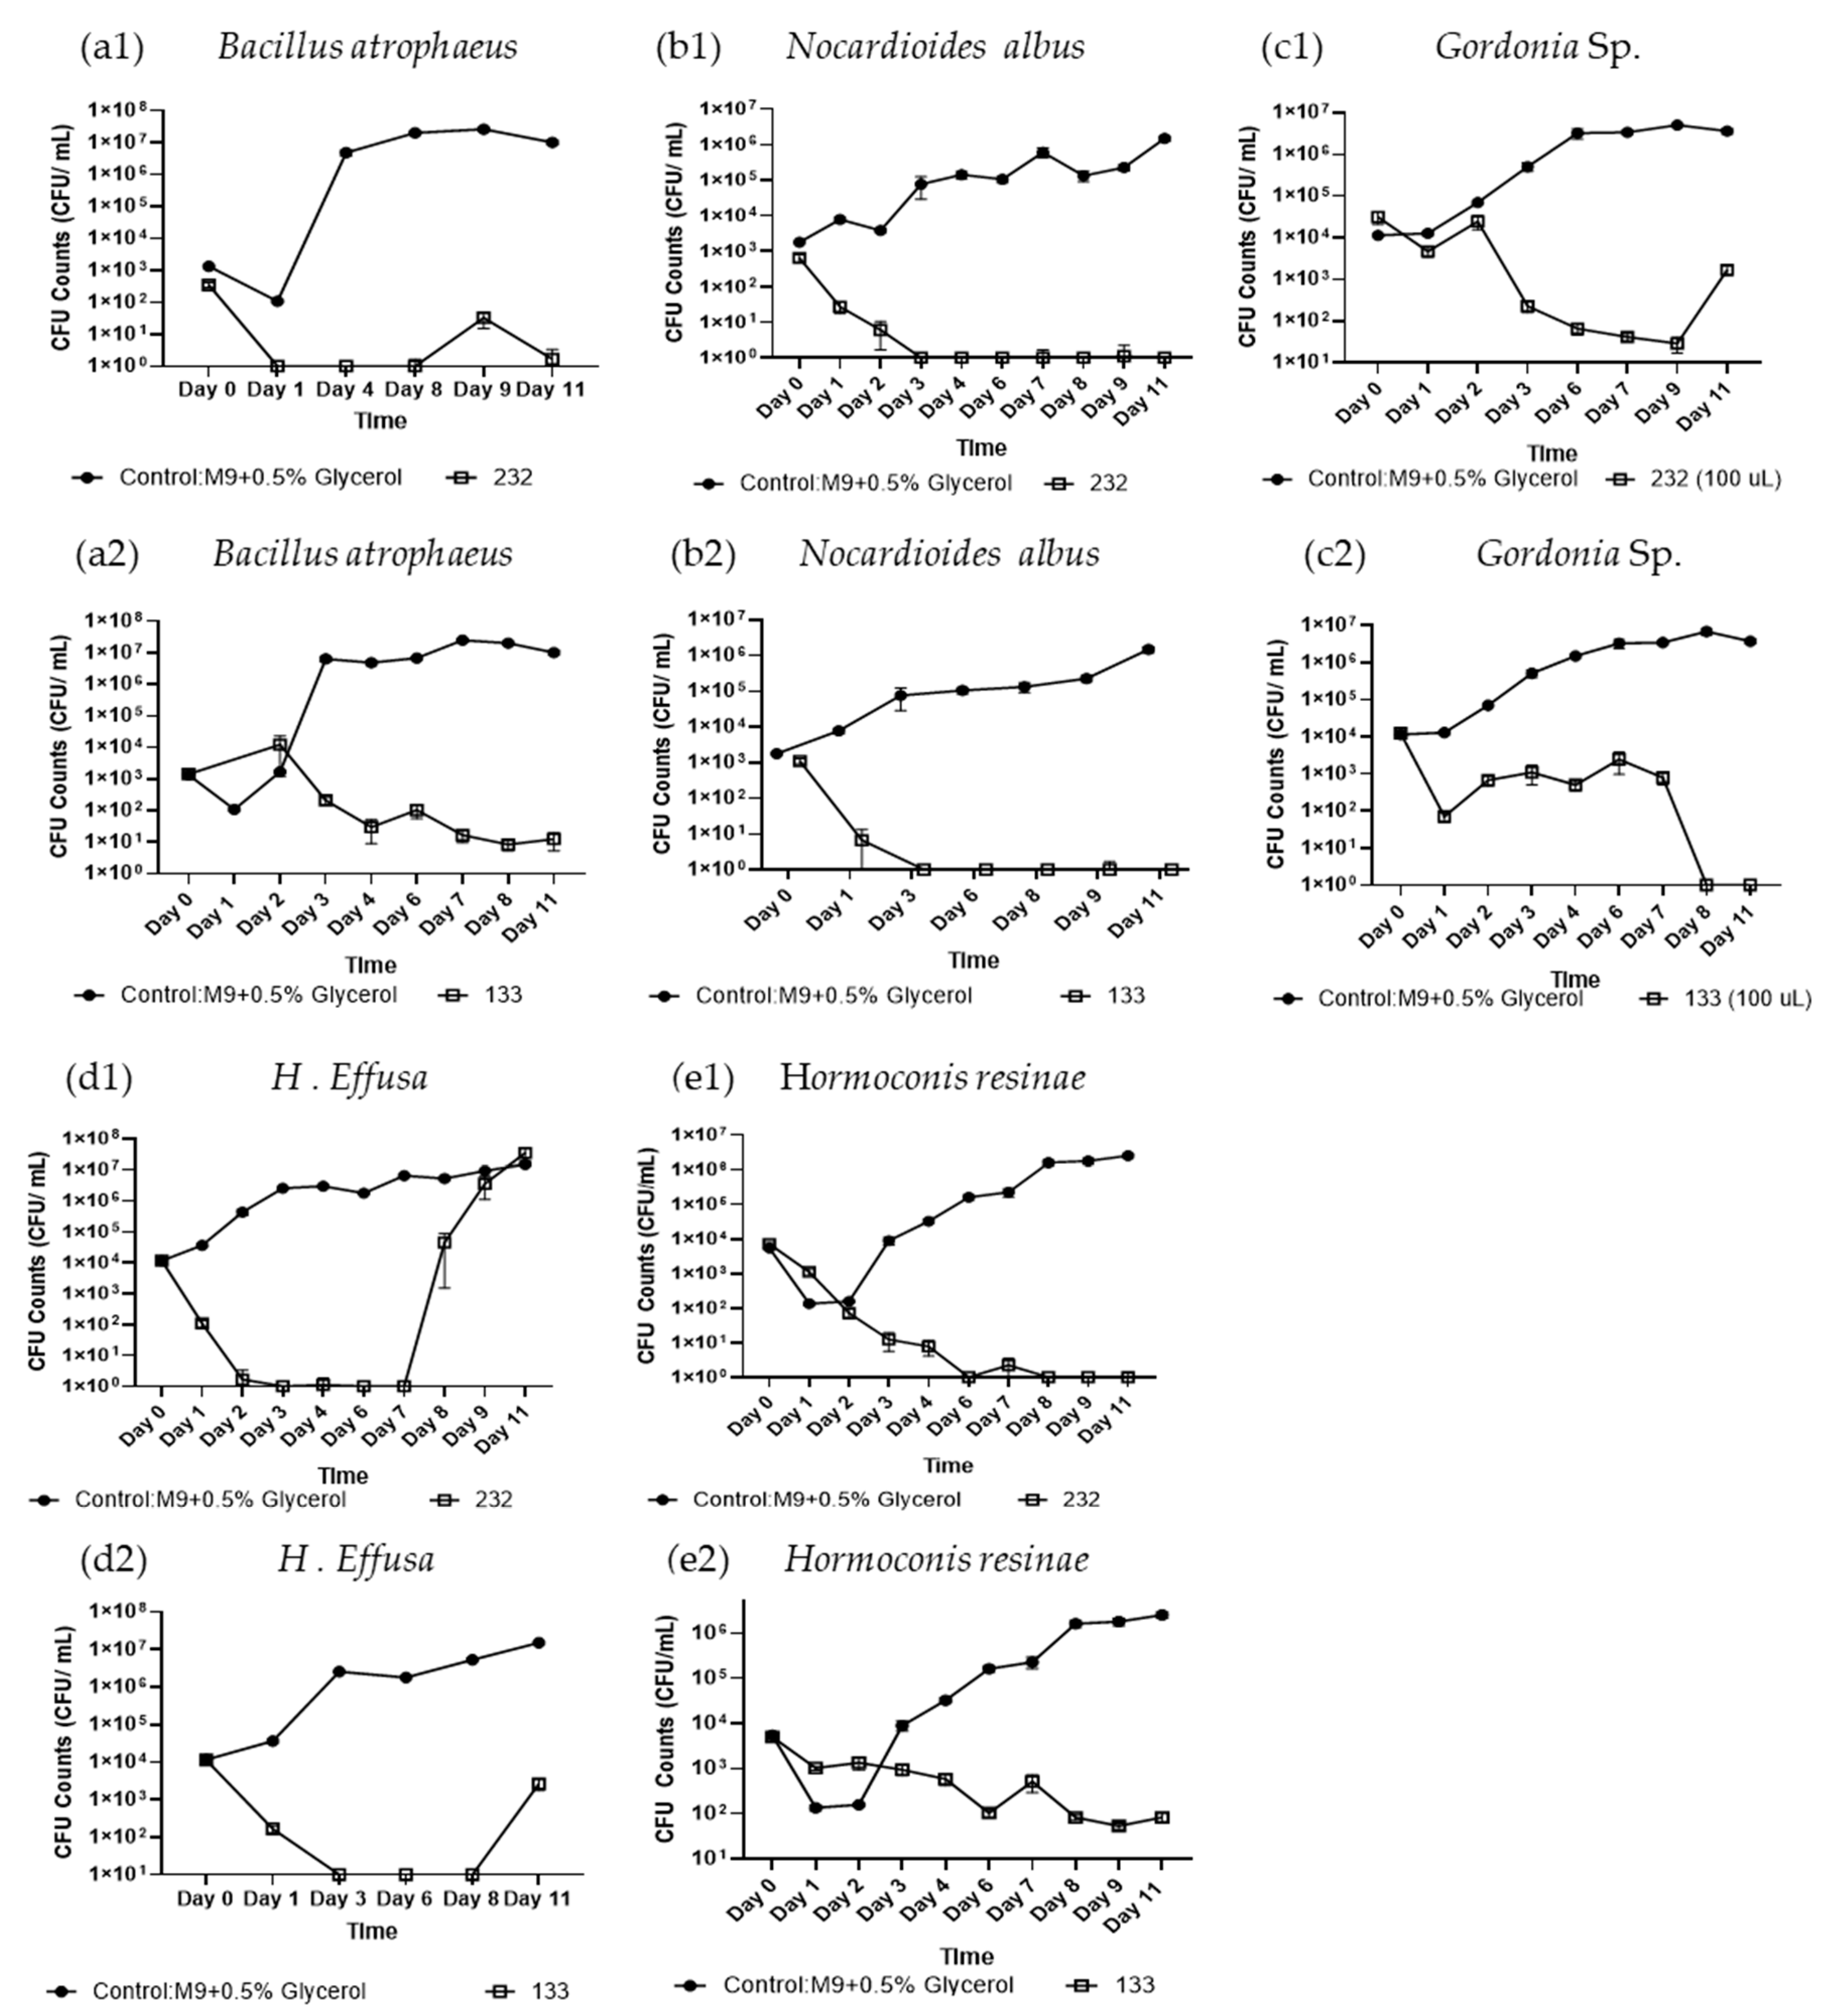
Figure 3.
Biocontrol Activity Screening of Isolate B. subtilis #232 Lipid Extracts in Liquid Culture. Biocontrol activity of Isolate #232 lipid extracts at a concentration of 100 µg/mL was tested on (a) Y. lipolytica, (b) H. resinae, and (c) Gordonia sp. for 11 days using CFU evaluation. Two-sample student’s t-test was applied by taking the averages of each condition and combining all the control data across experiments. Error bars represent standard error, sample size n = 3.
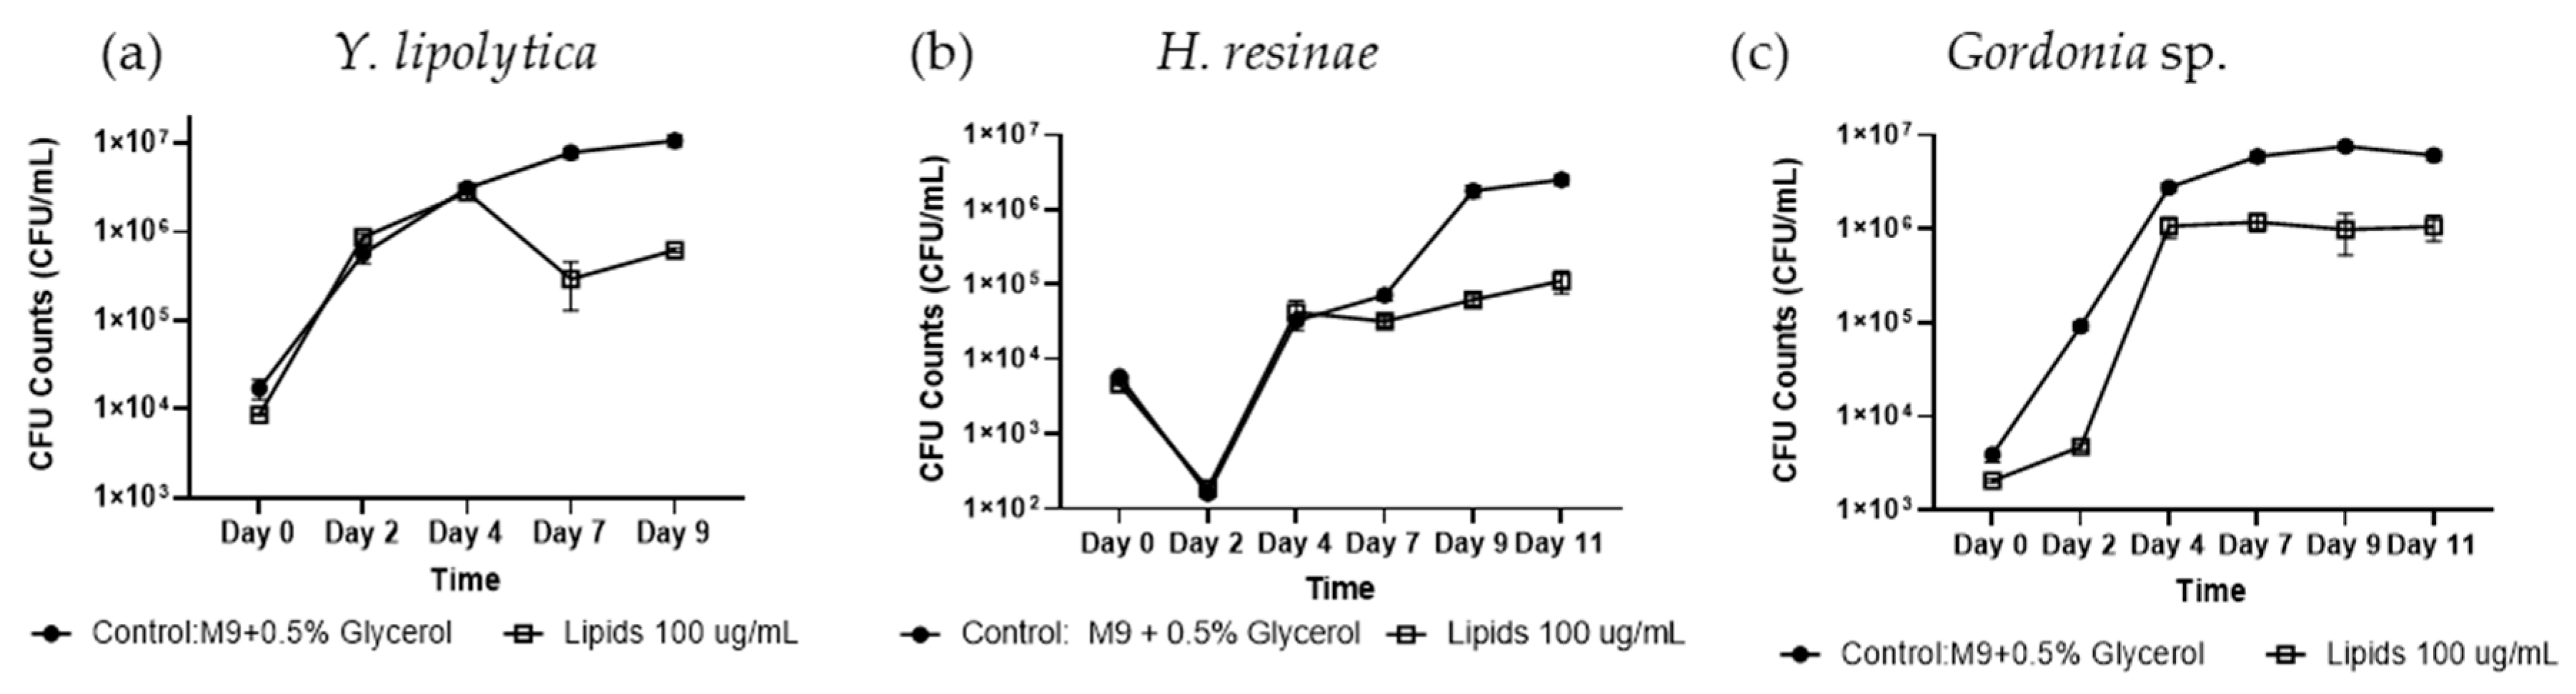
Figure 4.
Mass Spectrometry Analysis of Isolate #133 Culture Filtrate Contained Compounds Purified by Ethyl-Acetate Liquid Extraction and Semi-preparative HPLC Fractionation. (a) LC-QTOF Mass spectrometry analysis of #133 culture filtrate ethyl acetate lipid extracts (133 EAA, grey trace) and targeted pyochelin compound fractionation at 254 nm by semi-preparative HPLC (13 3EAA SP 254, red trace). For comparison, commercial pyochelin standard was analyzed by LC-QTOF (blue trace) together with ethyl acetate lipid extracts from culture filtrate of P. aeruginosa PAO1 (PAO1, purple trace) with known production of pyochelin. Base Peak Chromatograms (BPC) and extracted ion chromatogram (EIC) for pyochelin compound at a mass of 325.0625 Da are shown with isomeric form of pyochelin indicated by red lines at retention times of approximately 1.89 and 2.3 min. (b) BPC for isolate #133 EAA lipid extraction (red trace) overlaid with two extracted ion chromatogram isomeric peaks for pyochelin (grey trace). (c) Ion spectrum with predicted adducts and compound formulas EAA purified pyochelin.
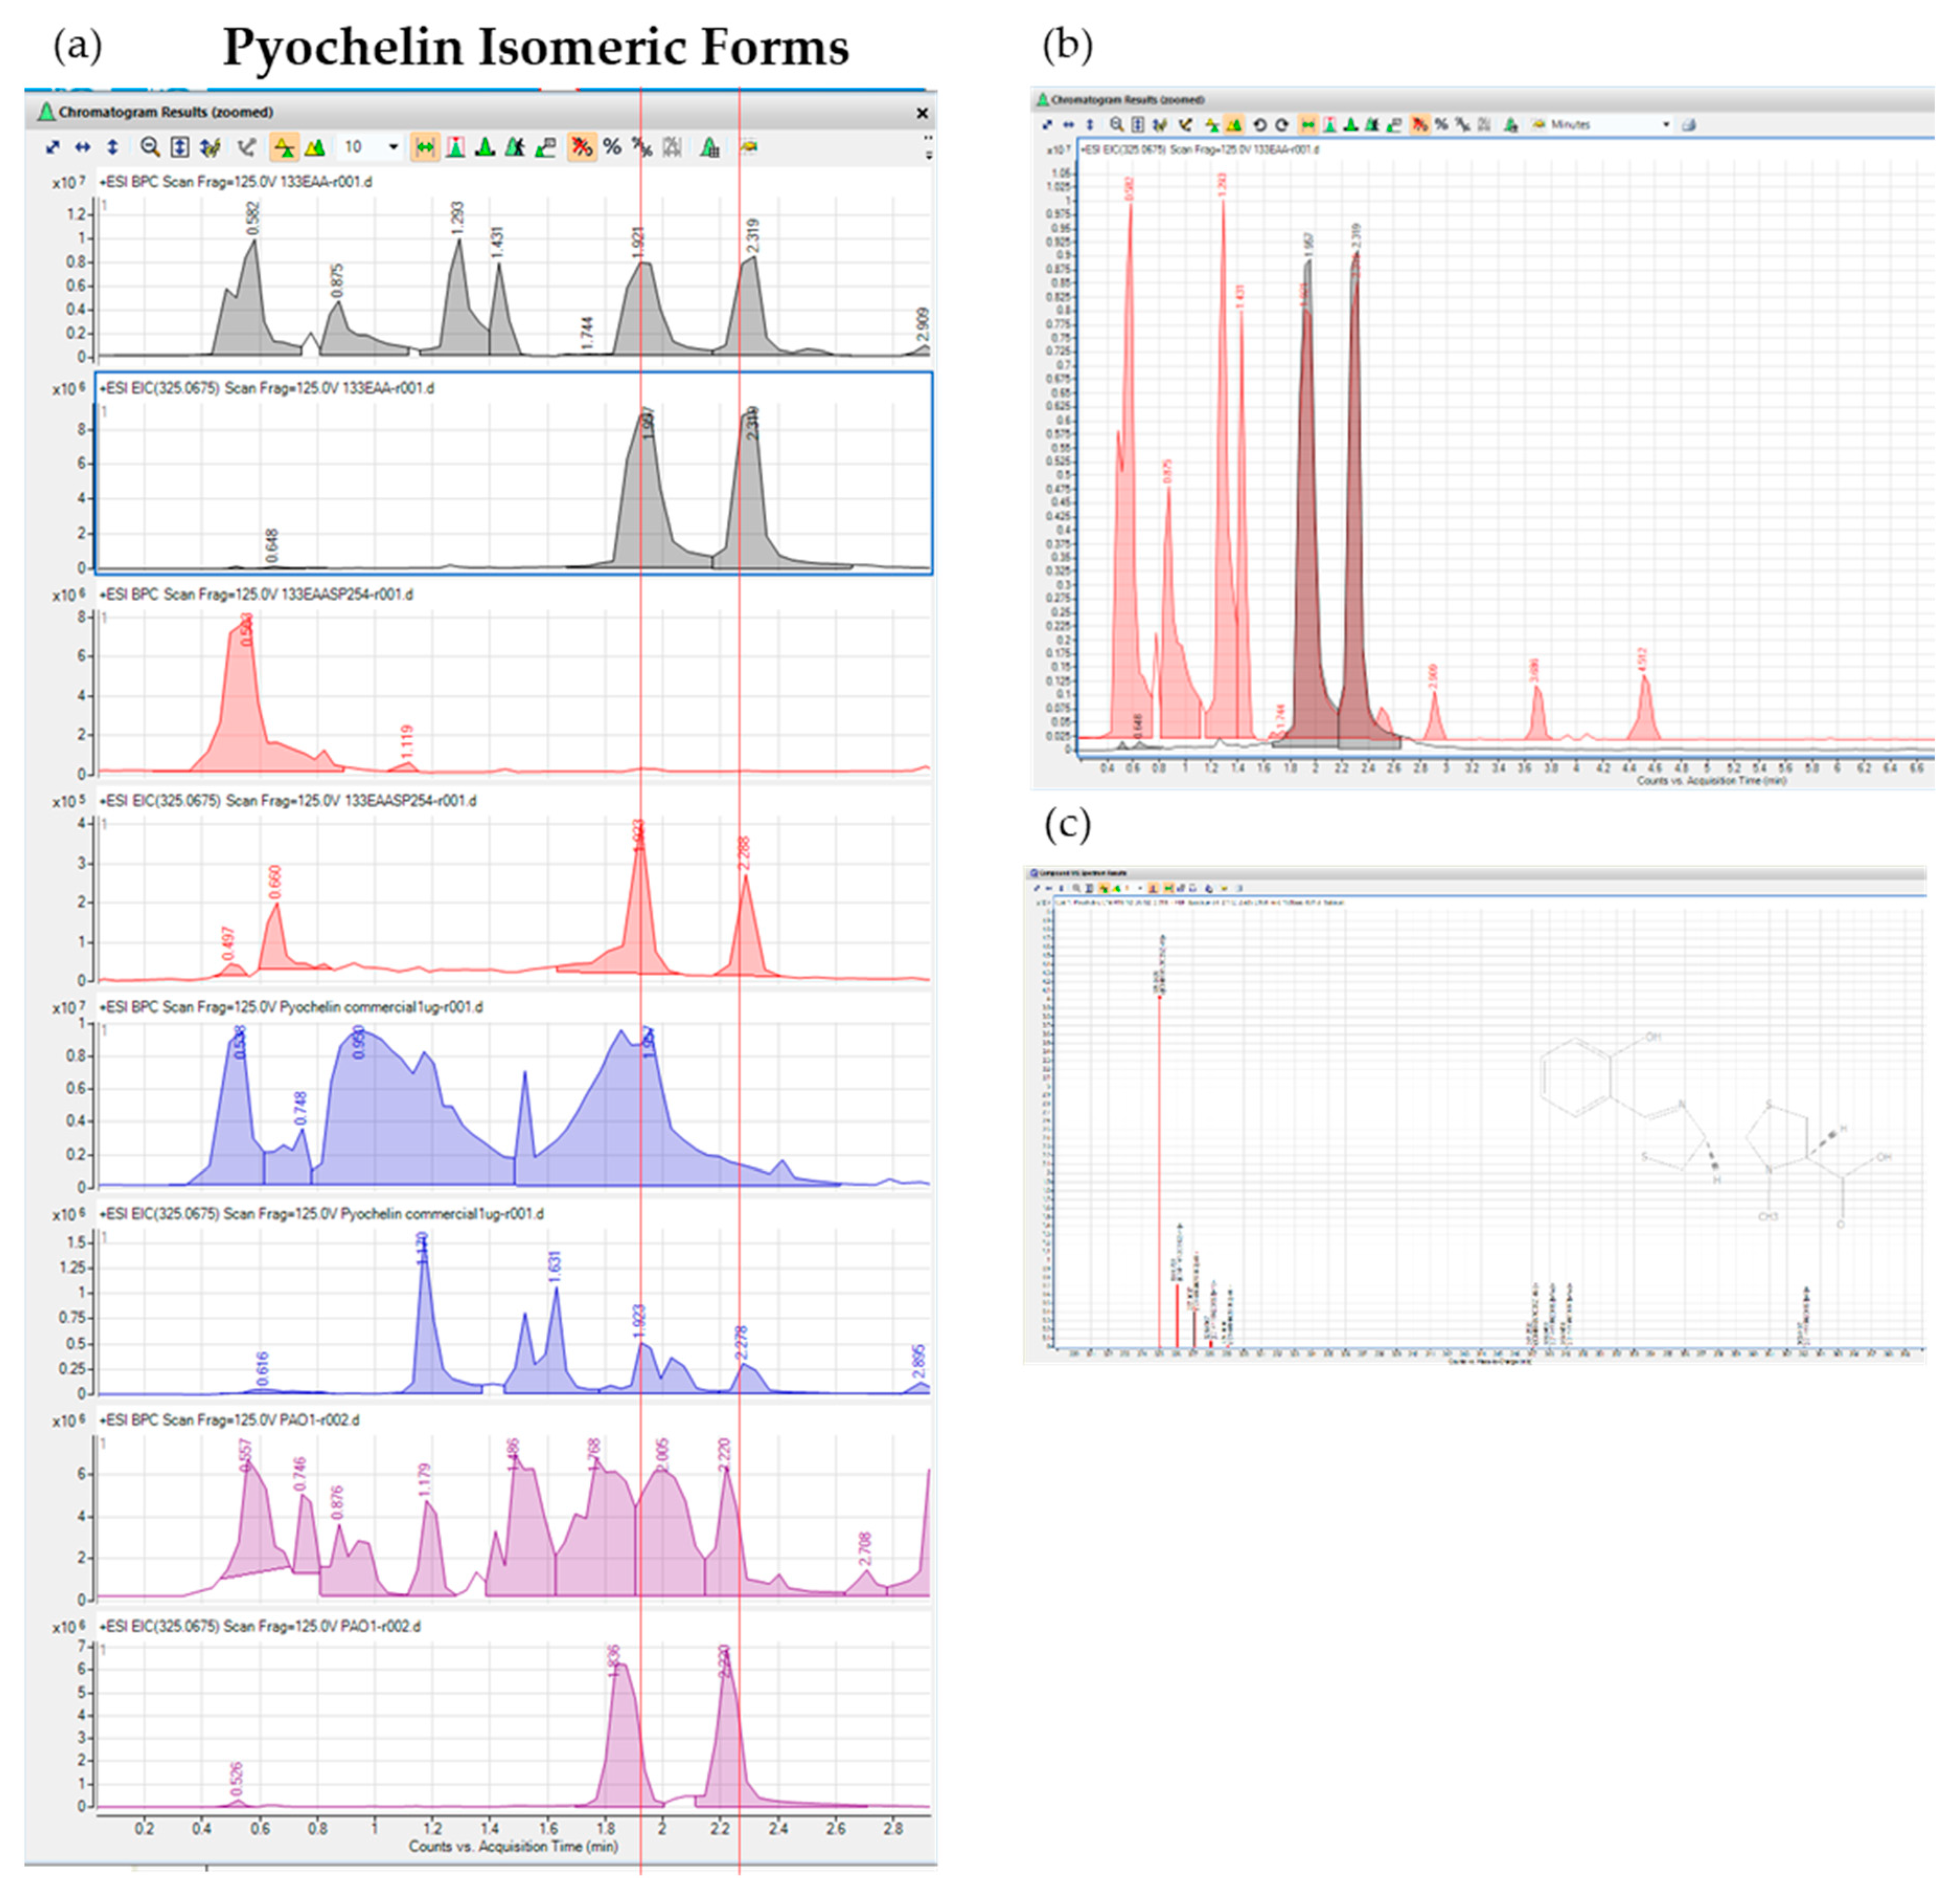
Figure 5.
Biocontrol Activity Screening of P. protegens #133 Pyochelin Extract in Liquid Culture. Biocontrol activity of Isolate #133 pyochelin extracts (1), and commercial pyochelin standard (2) at a concentration of 25 and 50 µg/mL was tested on (a) Y. lipolytica, (b) H. resinae, and (c) Gordonia sp. over 11 days using CFU evaluation. Two-sample student’s t-test was applied by taking the averages of each condition and combining all the control data across experiments. Error bars represent standard error, sample size n = 3.
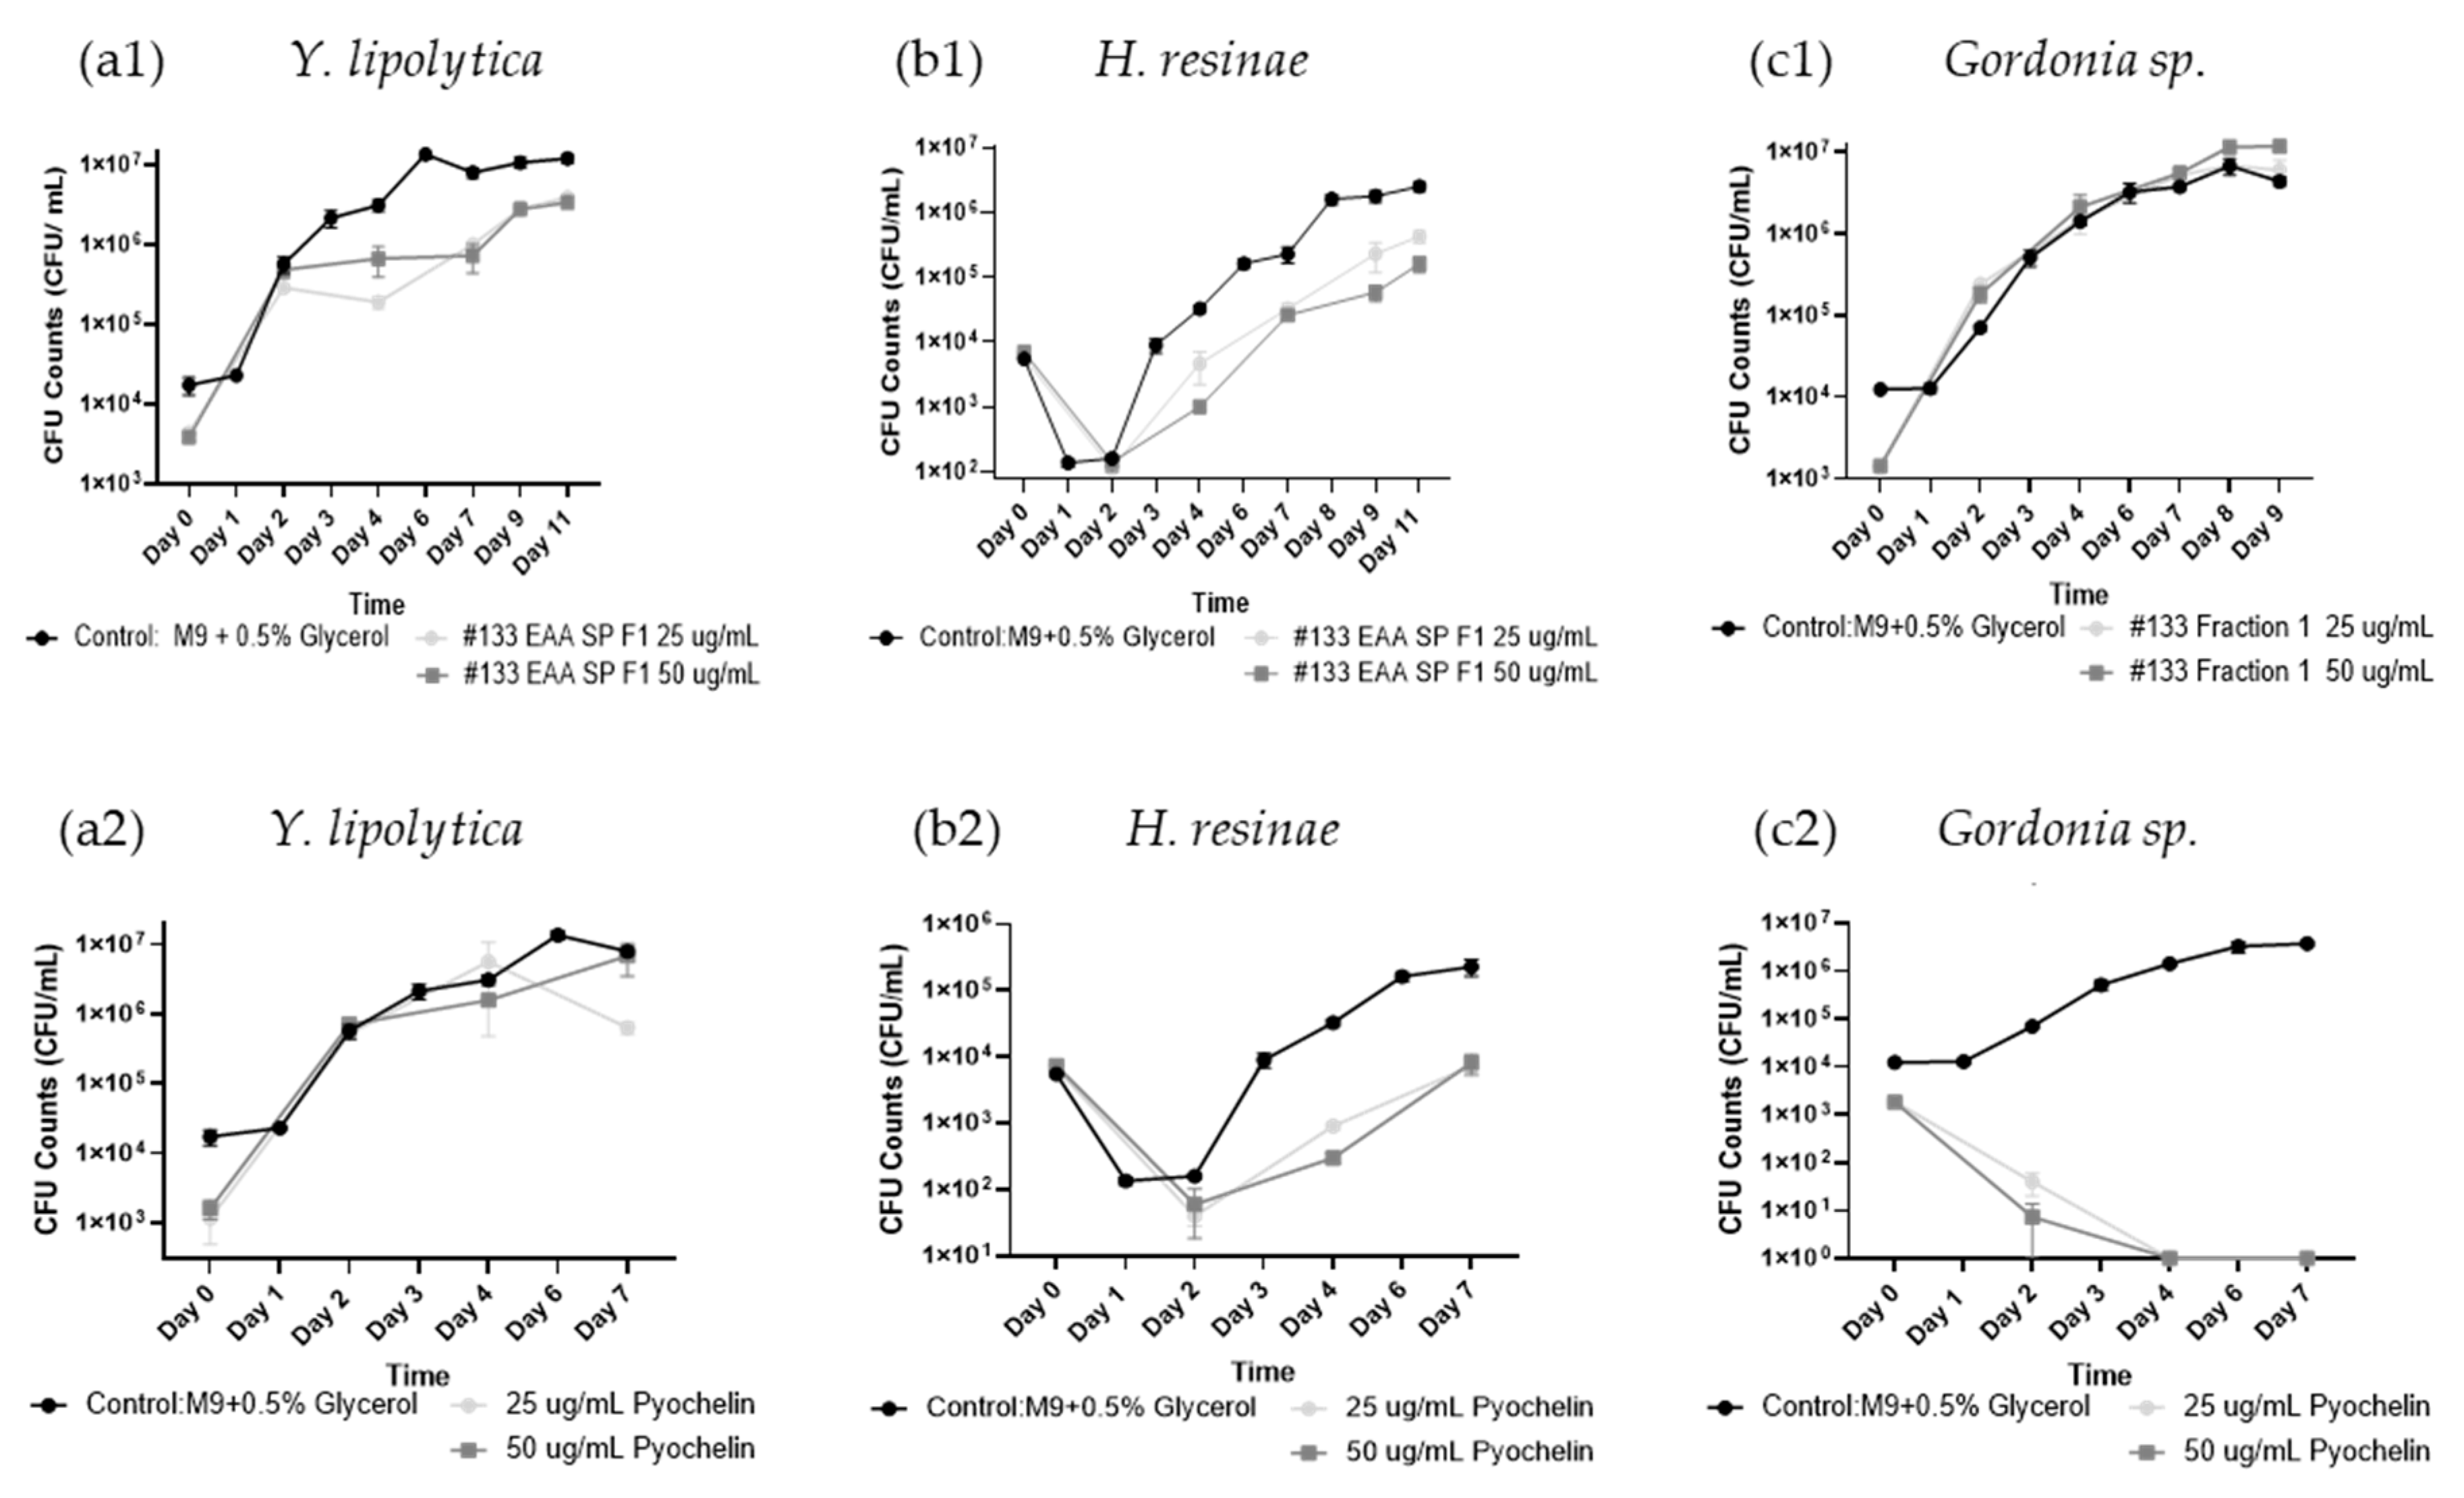
Figure 6.
Microbial Consortium Growth inhibition Dynamics after Treatment with Isolate P. protegens #133 Crude Culture Filtrate in Fuel Culture. Biocontrol activity of #133 crude culture filtrate (#133 crude) and pyochelin administered at different doses to fuel consortium cultures containing P. putida, Gordonia sp. Y. lipolytica and H resinae. Graphs display CFU/mL determined for (a) total bacteria (P. putida and Gordonia sp.); (b) total fungi (Y. lipolytica and H resinae); (c) total microbial load (bacteria plus fungi), across different time points (day 0 to day 29). Testing included triplicate CFU plating of each sample pictured. (d) Consortium growth over the course of 29 days. Control (inoculated microbial consortium without antimicrobial treatment), pyochelin (20 µg/mL), and isolate #133 crude culture filtrate supplemented at different doses of 100 µl, 1 mL and 2.5 mL. Red line indicates interphase between fuel phase and water bottom.
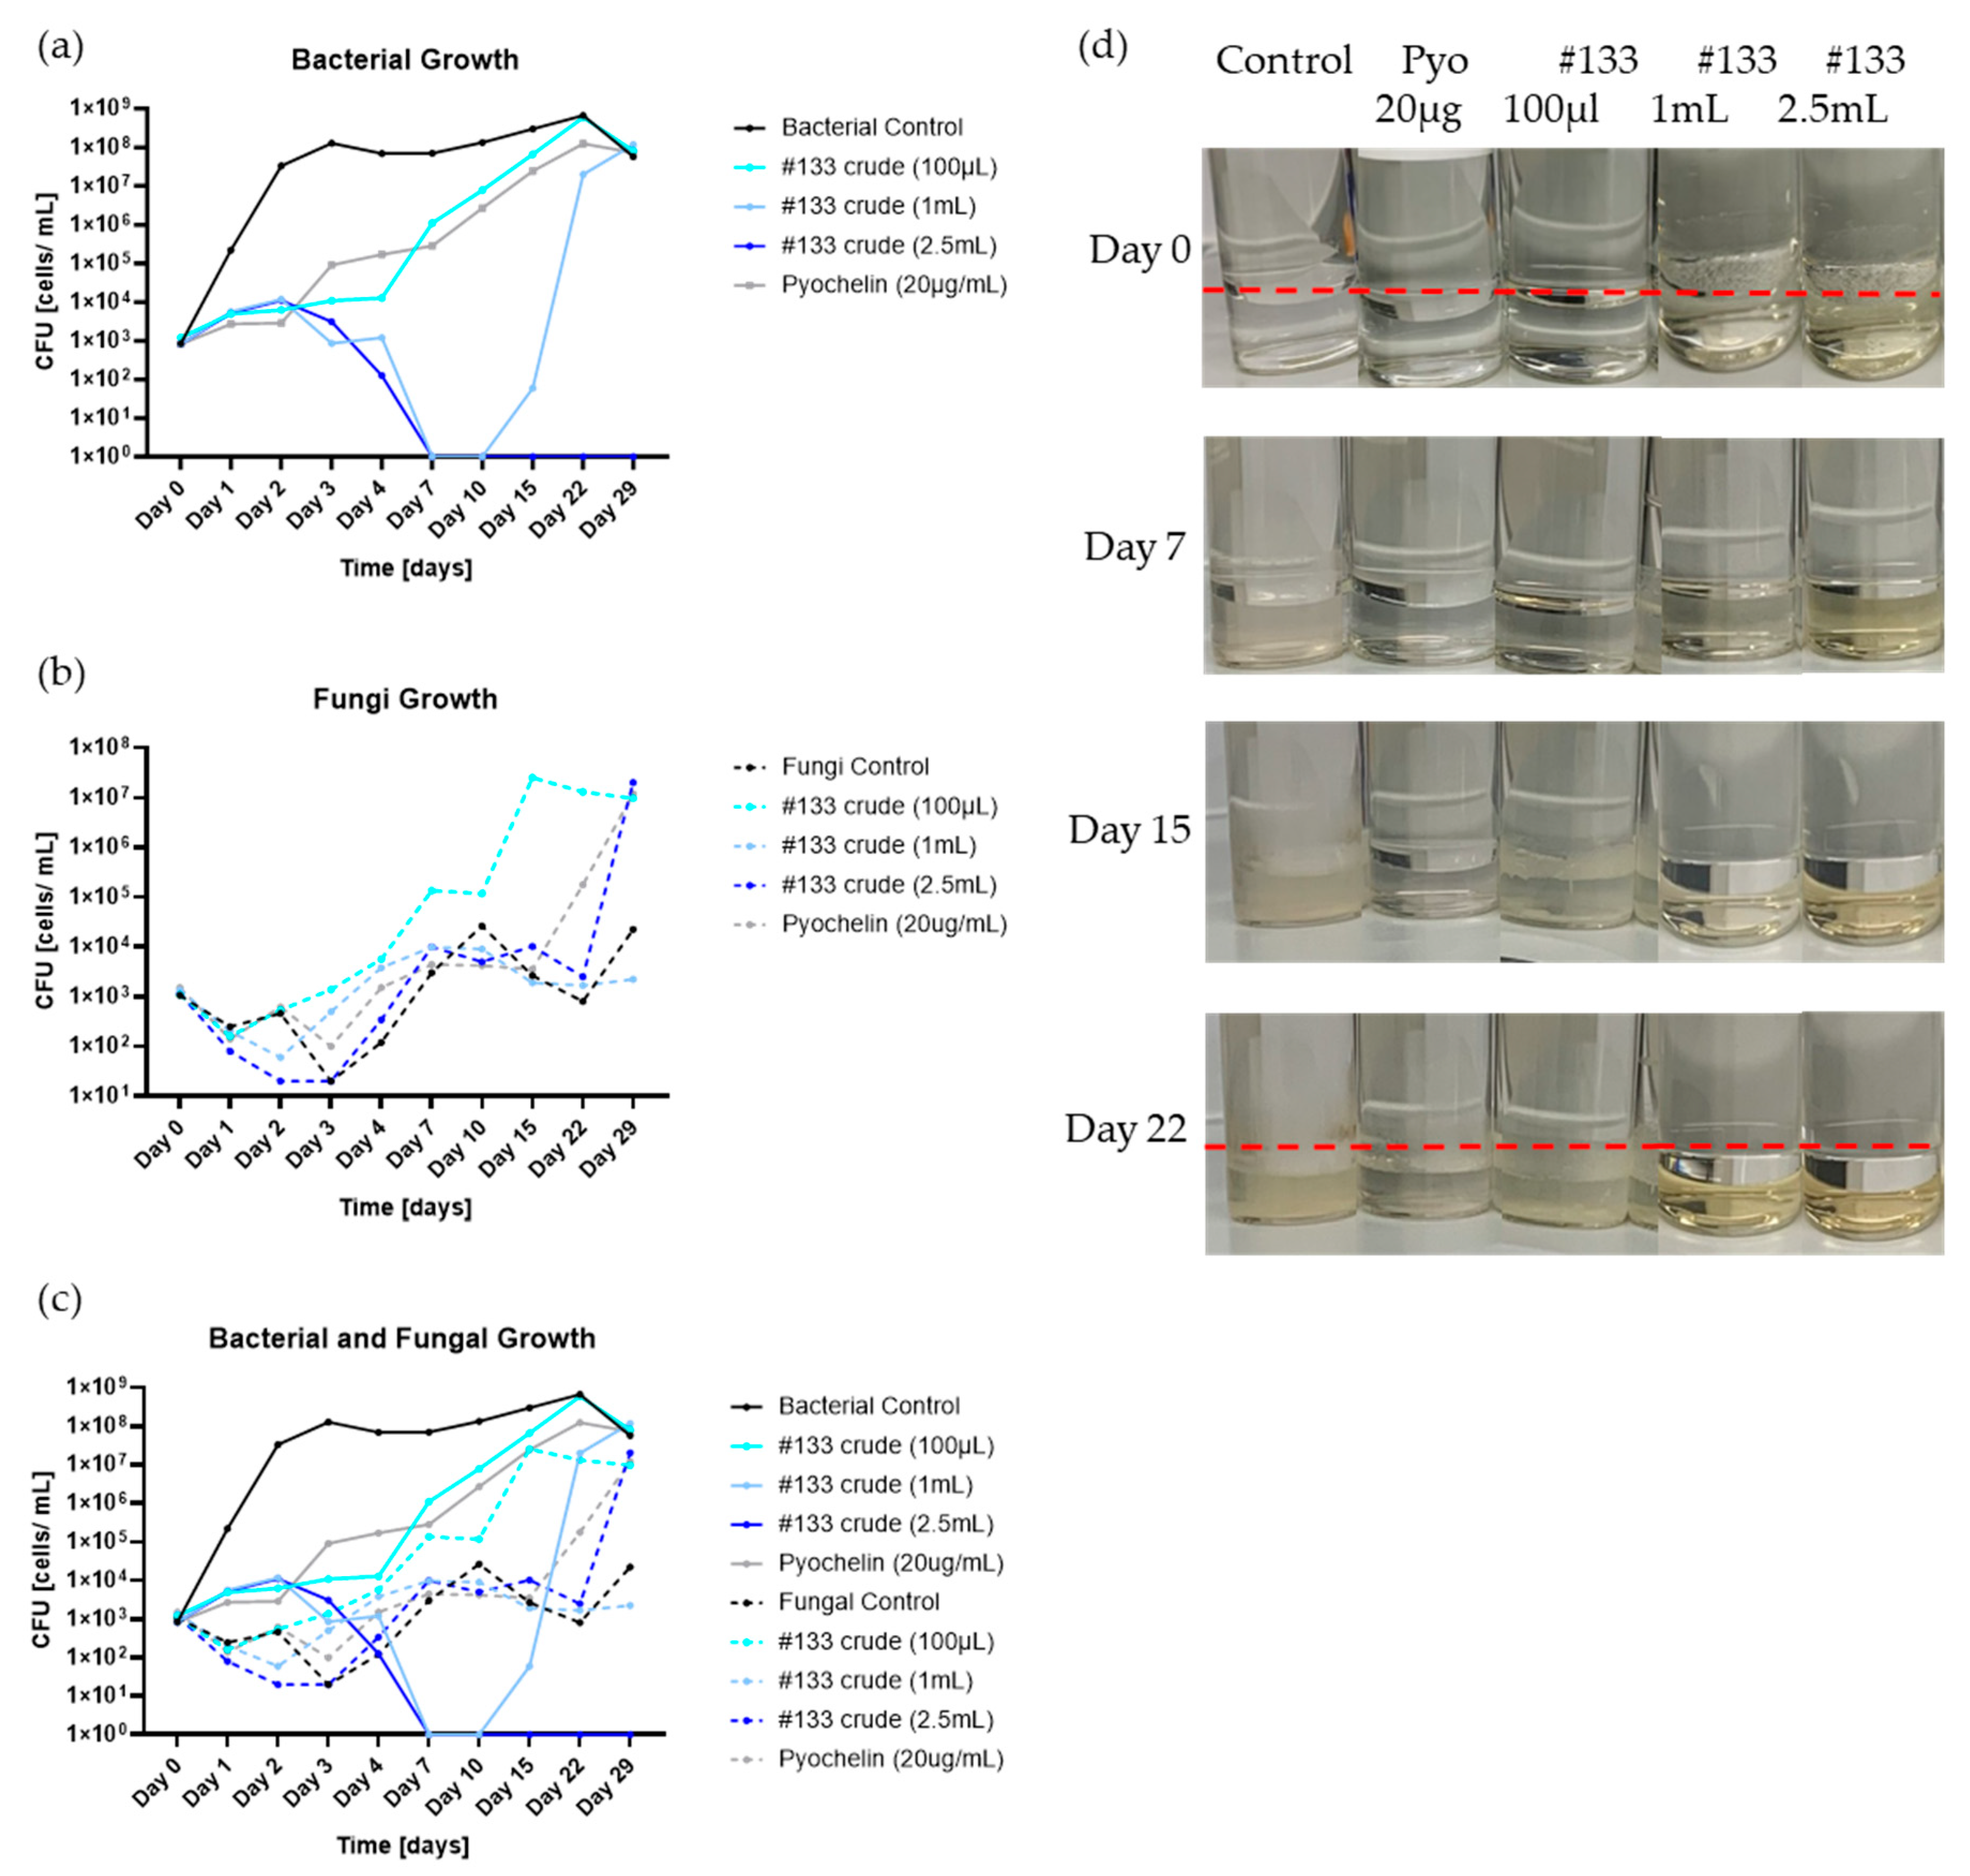
Figure 7.
Antimicrobial Cytotoxicity Effect of P. protegens #133 Culture Filtrate Against Gordonia sp. in Jet A Fuel Culture using Live/Dead Flow Cytometry. Gordonia sp. growth in the presence of different doses of biocontrol #133 culture filtrate in Jet A fuel cultures determined by Live/Dead Flow Cytometry over 7 days. Control (M9 minimal medium) and isolate #133 crude culture filtrate were tested at different doses of 100 µL (1.38 mg dry weight), 500 µL, 1000 µL, and 2500 µL. (a) Example of FCM live (SYTO 9, green)/dead (PI, red) cellular detection 48 hours after exposure to #133 culture filtrate at different calculated doses considering a total volume of 5 mL aqueous bottom: (a1) Control, 0 mg/mL (0 µL), (a2) 1.38 mg/mL (500 µL), (a3) 2.76 mg/mL (100 µL), and (a4) 6.9 mg/mL (2500 µL). Green= live; Red= dead. (b) Cell viability dose-response curve after 4 hours and 48 hours of exposure to different doses of #133 culture filtrate with calculated concentrations given in (mg/mL). Error bars represent standard error, sample size n = 3.
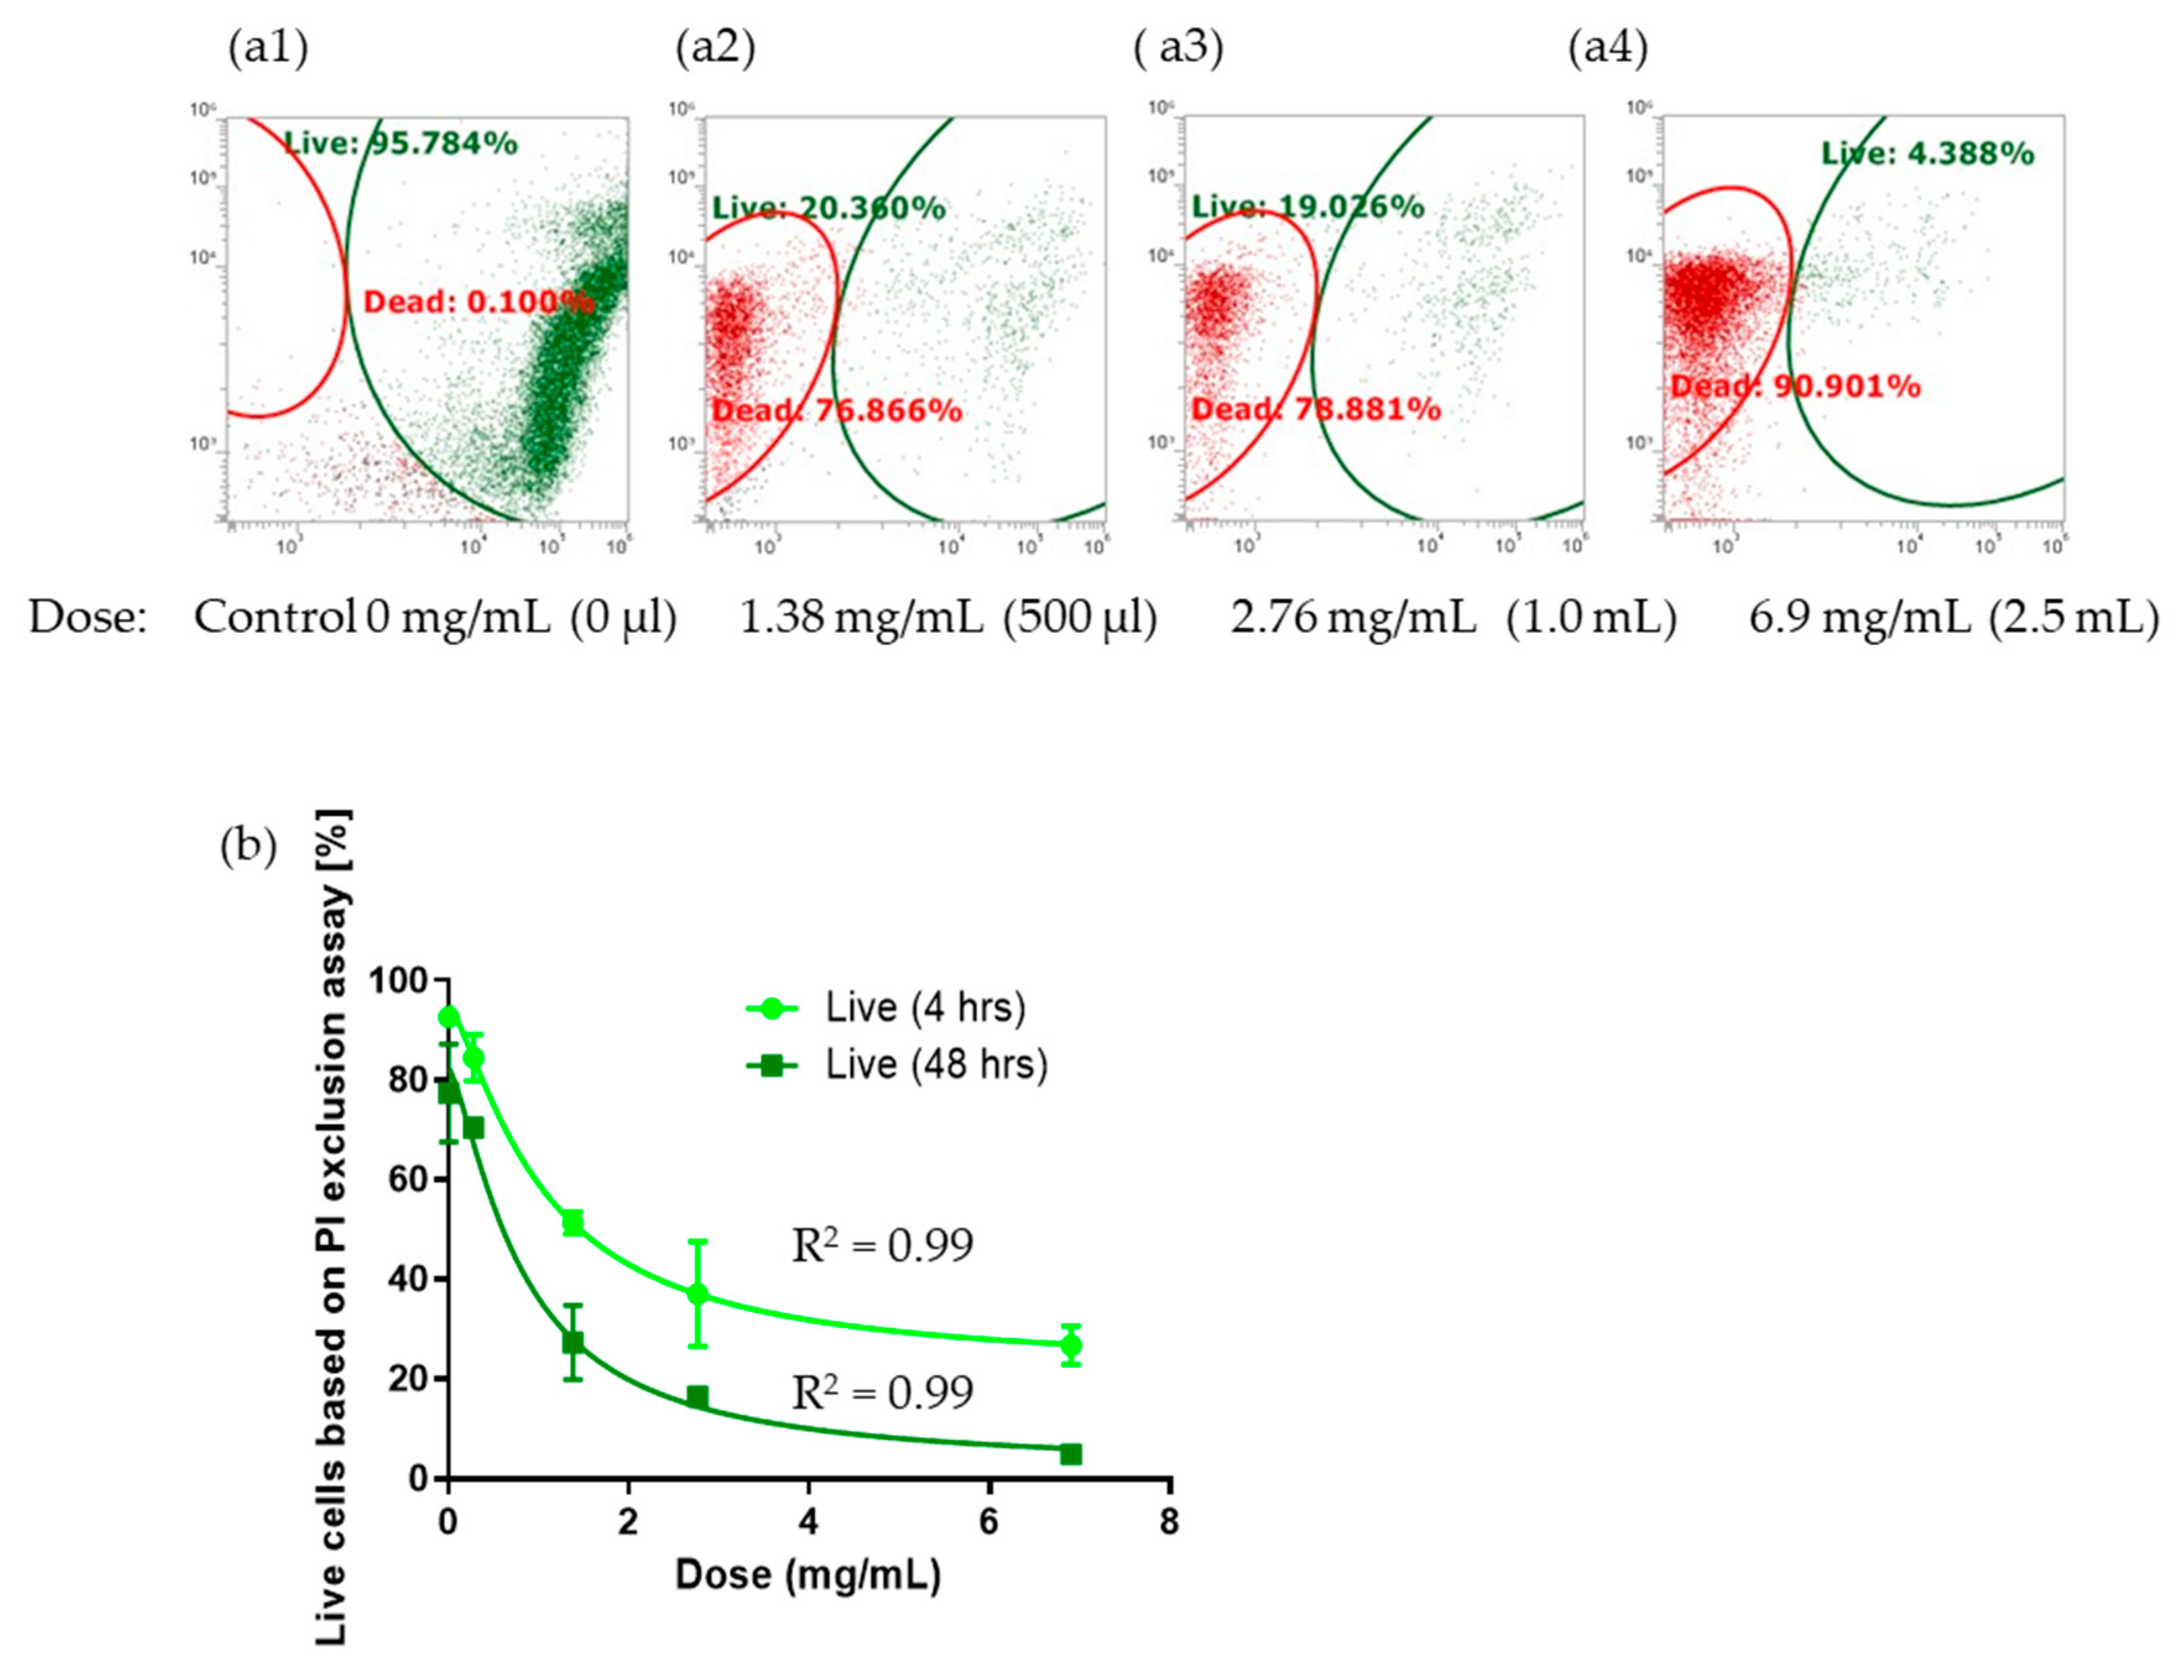

Table 1.
Agar Plug Screening of Selected High Efficiency Biocontrol Microbes Pseudomonas protegens #133 and Bacillus subtilis #232 against 16 target strains. Radius of inhibition zones in [mm]. Darker green color in gradient indicates largest inhibition zones observed in the presence of biocontrol isolates #133 or #232. Gram-negative bacteria included P. putida, A. venetianus, H. effusa, and Jm109 E. coli. Gram-positive bacteria included Gordonia sp., R. equi N. albus, and B. atrophaeus. Yeast included Y. lipolytica, M. guilliermondii and C. ethanolica. Filamentous fungi included H. resinae, A. versicolor and F. oxysporum. ± stands for standard deviation of listed sample size n. Days are listed where diffusion assay had the largest inhibition zone which was different due to high variability in growth behavior of tested bacteria, yeast, and fungal strains.
| Pseudomonas protegens #133 (Gram- Negative) |
Bacillus subtilis #232 (Gram- Positive) |
||||||
|---|---|---|---|---|---|---|---|
| Target Microbes | Classification | Inhibition Zone Radius [mm] | Time [days] | n = | Inhibition Zone Radius [mm] | Time [days] | n = |
| Pseudomonas putida | Gram-Negative | 30.17 ± 5.11 | 6 | 6 | 7.75 ± 14.31 | 7 | 12 |
| Acinetobacter venetianus | Gram-Negative | 20.61 ± 14.48 | 7 | 18 | 3.17 ± 3.99 | 1 | 18 |
| Hydrocarboniphaga effusa | Gram-Negative | 32.50 ± 4.51 | 7 | 6 | 3.83 ± 1.72 | 4 | 6 |
| Jm109 Escherichia coli | Gram-Negative | 23.67 ± 2.31 | 3 | 3 | 0.00 ± 0 | 5 | 3 |
| Gordonia sp. | Gram-Positive | 30.33 ± 3.88 | 6 | 6 | 7.50 ± 11.8 | 6 | 12 |
| Rhodococcus equi | Gram-Positive | 28.00 ± 2.00 | 3 | 3 | 2.67 ± 0.58 | 7 | 3 |
| Nocardioides albus | Gram-Positive | 32.00 ± 6.48 | 6 | 9 | 4.22 ± 3.46 | 6 | 9 |
| Bacillus atrophaeus | Gram-Positive | 16.83 ± 6.70 | 2 | 6 | 4.17 ± 2.79 | 1 | 6 |
| Yarrowia lipolytica | Yeast | 9.17 ± 5.92 | 4 | 12 | 20.50 ± 8.62 | 5 | 6 |
| Meyerozyma guilliermondii | Yeast | 17.33 ± 1.53 | 5 | 3 | 5.17 ± 1.80 | 3 | 12 |
| Candida ethanolica | Yeast | 3.61 ± 3.5 | 1 | 18 | 11.67 ± 5.16 | 3 | 18 |
| Hormoconis resinae | Fungus | 13.17 ± 5.14 | 4 | 24 | 26.33 ± 3.05 | 6 | 3 |
| Aspergillus Versicolor | Fungus | 10.89 ± 3.23 | 3 | 18 | 20.33 ± 9.23 | 2 | 21 |
| Fusarium oxysporum | Fungus | 11.56 ± 4.85 | 2 | 18 | 19.71 ± 4.29 | 2 | 21 |
Table 2.
Summary Table of Biocontrol Activity. Antimicrobial Activity of Crude Culture Filtrates #133 and #232, purified HPLC fractions #133 EAA SP F2 (#133 ethyl-acetate extractions then Semi-prep Fraction 2) and #232 SP F1 (#232 Semi-prep Fraction 1) and commercial pyochelin. Calculated concentrations from total volume of culture are given in mg/mL or µg/mL. Log-fold change on day 11, bold• represents day 9, and underlined represents day 7 as not all testing ended on day 11. Representative P values are displayed as* p < 0.05, ** p < 0.001 and *** p < 0.0001.
| Classification | Microbe | Growth Effect |
Log Fold Change on Day 11 (Efficient grown inhibition in blue) (Bold is Day 9 & Underline is Day 7) |
|||||
|
133 Crude (6.9 mg/mL) |
232 Crude (9.8 mg/mL) |
133 Crude (6.9 mg/mL) |
232 Crude (9.8 mg/mL) |
Commercial Pyochelin (50 µg/mL) |
133 EAA SP F1 (100 µg/mL) |
232 SP F2 (100 µg/mL) |
||
| Gram-Positive | Gordonia sp. | Kills | Kills | -6.57** | -3.34* | -6.57** | 0.07• | -0.05 |
| Gram-Positive | Rhodococcus equi | Reduces | No Effect | -2.09 | 0.95 | not tested | not tested | not tested |
| Gram-Positive | Nocardioides albus | Kills | Kills | -6.17** | -6.17*** | not tested | not tested | 0.33• |
| Gram-Positive | Bacillus Atrophaeus | Kills | Kills | -5.91*** | -6.78** | not tested | not tested | not tested |
| Gram-Negative | Pseudomonas putida | Enhances | No Effect | 0.39 | -0.25 | not tested | not tested | not tested |
| Gram-Negative | Acinetobacter venetianus | No Effect | Reduces | 0.13 | -1.02 | not tested | not tested | not tested |
| Gram-Negative | Hydrocarboniphaga effusa | Kills | No Effect | -3.75*** | 0.36 | not tested | not tested | not tested |
| Gram-Negative | Jm109 Escherichia coli | No Effect | Reduces | -0.54 | -3.16** | not tested | not tested | not tested |
| Fungus | Hormoconis resinae | Kills | Kills | -4.48** | -6.58** | -1.5 | -0.77 | -0.84 |
| Fungus | Aspergillus versicolor | No Effect | No Effect | -1.93• | -1.52 | not tested | not tested | not tested |
| Fungus | Fusarium oxysporum | No Effect | No Effect | -0.42 | -0.05 | not tested | not tested | not tested |
| Yeast | Meyerozyma guilliermondii | No Effect | No Effect | 0.14 | 0.03 | not tested | not tested | not tested |
| Yeast | Candida ethanolica | No Effect | Enhances | -0.32• | 2.48 | not tested | not tested | not tested |
| Yeast | Yarrowia lipolytica | No Effect | Reduces | -0.47 | -0.9 | -1.09 | -0.48 | -0.35 |
| Yeast | Candida albicans | No Effect | No Effect | -0.85 | 1.2 | not tested | not tested | not tested |
Table 3.
Day 7 Antimicrobial Cytotoxicity Effect of P. protegens #133 Culture Filtrate Against Gordonia sp. in Jet A Fuel Culture using Live/Dead Flow Cytometry. Gordonia sp. growth in the presence of different doses of biocontrol #133 culture filtrate in Jet A fuel cultures determined by Live (SYTO 9)/Dead (propidium iodide (PI)) Flow Cytometry over 7 days. Control (M9 minimal medium) and isolate #133 crude culture filtrate were tested different doses of 500 µL, 1000 µL and 2500 µL with calculated doses of culture filtrate given in mg/mL considering a total volume of 5 mL water bottom. Table displays CFU plate counts, percent dead cells as determined by PI staining versus lysed cells (side scatter determination) and percent viable but non-culturable (VBNC, SYTO 9 stained compared to CFU plated cells). Percentages were calculated based on day 0 inoculum. Error is given as standard error, sample size n = 3.
| Dose #133 Culture Filtrate |
% CFUs | % Dead (PI-stained cells) |
% Dead (Lysed cells) |
% VBNC (STYO9-stained cells) |
Total Percent |
|---|---|---|---|---|---|
| 500 µl (1.38 mg/mL) |
0 | 0.99 ± 0.27 | 94.90 ± 1.24 | 4.11 ± 0.97 | 100.00 |
| 1000 µl (2.76 mg/mL) |
0 | 1.12 ± 0.18 | 96.15 ± 1.14 | 2.73 ± 0.98 | 100.00 |
| 2500 µl (6.9 mg/mL) |
0 | 2.12 ± 0.35 | 96.80 ± 0.31 | 1.08 ± 0.12 | 100.00 |
Disclaimer/Publisher’s Note: The statements, opinions and data contained in all publications are solely those of the individual author(s) and contributor(s) and not of MDPI and/or the editor(s). MDPI and/or the editor(s) disclaim responsibility for any injury to people or property resulting from any ideas, methods, instructions or products referred to in the content. |
© 2024 by the authors. Licensee MDPI, Basel, Switzerland. This article is an open access article distributed under the terms and conditions of the Creative Commons Attribution (CC BY) license (http://creativecommons.org/licenses/by/4.0/).
Copyright: This open access article is published under a Creative Commons CC BY 4.0 license, which permit the free download, distribution, and reuse, provided that the author and preprint are cited in any reuse.


