
Submitted:
19 November 2024
Posted:
20 November 2024
You are already at the latest version
Abstract
The time period around the Noachian-Hesperian boundary, 3.7 million years ago, was an epoch when great geodynamical and environmental changes occurred on Mars. Currently available remote sensing data are crucial for understanding the Martian heat loss pattern and global thermal state in this transitional period. We here derive surface heat flows in specific locations based on estimations of the depth of five large thrust faults, in order to constrain both surface and mantle heat flows. Then, we use heat-producing elements (HPEs) abundances mapped from orbital measurements by the Gamma-Ray Spectrometer (GRS) onboard Mars Odyssey 2001 spacecraft, and geographical crustal thickness variations, to perform a global model for the surface heat flow. The heat loss contribution of large mantle plume beneath the Tharsis and Elysium magmatic provinces is also considered for our final model. We thus obtain a map of the heat flow variation across the Martian surface at the Noachian/Hesperian boundary. Our model also predicts an average heat flow between 32 and 50 mW m−2, which implies that the heat loss of Mars at that time was lower than the total radioactive heat production of the planet, which has profound implications for the thermal history of Mars.
Keywords:
Surface heat flow
; Heat loss
; Heat-Producing Elements
; GRS observations
; Crustal thickness
1. Introduction
Mars has recorded very interesting evolutionary, climatic, thermal and geological histories, with different periods characterized by different dynamic and environmental conditions [1,2,3,4]. In this sense, the time around the Noachian-Hesperian boundary was an epoch when substantial changes in Mars occurred: a substantial decrease in aqueous erosion and, therefore, an associated degradation of fluvial features [2,3,5]; a change from abundant phyllosilicate formation to abundant acidic and evaporitic mineralogy [6,7]; a change from olivine-rich volcanism to olivine-pyroxene volcanism [8,9]; a general change in the rock cycle and in the type of crustal rocks [10]; most of the deviation of the topography of the putative ocean paleo-shorelines [11]; a significant increasing of the strength and thickness of the lithosphere and a reduction of the surface heat flow [12]; and maybe the cessation of the Martian dynamo [13,14,15]. It is hard to think that these changes are coincidental, since they all happened at approximately at the same time. Therefore, the study of the dynamics of Mars at this particular time of its history (the Noachian-Hesperian boundary) is crucial to understand the global evolution of this planet. Because changes in the internal dynamics of Mars can produce modifications in the atmosphere and hydrosphere, and in general changes in the geological expression and external shape of the planet, investigating its thermal state is of great importance for analyzing the sustainability of habitability on Mars and in other terrestrial worlds [16].
A way of analyzing the internal dynamics of a planet for a given time is through its heat flow. Typically, estimates of heat flow for ancient Mars have been based mainly on two geophysical proxies: the effective elastic thickness of the lithosphere () [17,18,19,20,21,22], and the depth to the brittle–ductile transition (BDT) beneath large thrust faults [22,23,24,25,26,27,28,29].
Both approaches are based on the relation between the thermal state of lithospheric rocks and their mechanical strength and allow us to calculate the heat flows corresponding to the epoch in which the geological structures used as indicators were formed. Whereas modelling of both requires topographic and gravity data, the derivation of BDT depths from thrust faults only requires topography information, which is available from the orbital data [30,31]. Moreover, the landforms known as lobate scarps, which are the surface expression of large thrust faults, are usually located on terrains with an age close to the Noachian-Hesperian boundary [24,28,29,32,33,34,35], and therefore give us an opportunity to analyze the global heat flow pattern of Mars at that time.
The modeling of Martian surface heat flows must consider the radioactive heat production in the crust. It has been previously considered for some works calculating ancient local or regional heat flows [21,22,26,28,29,34], and even for deriving a global model for the present-day surface heat flow [36], but it has never been used in the building of a global model of ancient Mars. The crustal radioactive heat production, which is time-dependent, derives from heat-producing elements (HPEs), essentially potassium, thorium and uranium, which are incompatible elements with tendency to accumulate on the magmas and to be more abundant in the uppermost part of the crust. Surface K and Th element abundances were measured by the Gamma-Ray spectrometer on board the 2001 Mars Odyssey mission [37,38,39], whereas U abundances must be estimated from cosmochemical considerations [40].
In this work, we model the global heat flow pattern, as well as the average heat flow, at the Noachian/Hesperian boundary. We first use fault BDT depths of large thrust faults in the Thaumasia highlands, the circum-Argyre region and close to the dichotomy boundary [29,34,41,42], together with GRS-derived HPEs abundances [39,43], to calculate local heat flows related with the Noachian/Hesperian transition.
We then use the obtained local heat flows, HPEs abundances, a crustal thickness model derived from gravity and topography [44], the scaling method developed by [36], and estimates of plume contribution at Tharsis and Elysium volcanic provinces [45], in order to obtain a global heat flow model (and its associate average heat flow value) for Mars at the Noachian/Hesperian boundary. Finally, we analyze and discuss the implications of our results for the thermal state and evolution of the red planet.
2. Background
Heat flow estimates for the time around the Noachian-Hesperian boundary have been previously proposed for several regions from the BDT depth beneath large thrust falts. These heat flows calculations therefore correspond to the time when the lithosphere was. For example, [20] calculated heat flow from for Coracis Fossae, which that has a formation age of 3.5–3.9 Ga, and obtained 54–66 mW . Later on, [24] calculated the heat flow again in the southern Thaumasia highlands region (Warrego rise) from the mechanical modeling of two thrust faults, which are between 4.0 and 3.7 Ga old, obtaining between 24 and 46 mW . Such differences in heat flows values derived from closed regions and times may be due to the different magmatectonic and thermal environments: the heat flows derived from Coracis Fossae, a magmatically active rift structure, would be higher than the background heat flow values in magmatically inactive areas, as the southern Thaumasia highlands region [24]. These estimations of heat flow were performed without taking into account the radioactive heat production from the crust. The presence of radioactive heat sources in the crust is significant, and it should be similar, at least in the uppermost crust, to the amount measured on the Martian surface by Mars Odyssey Gamma Ray Spectrometer (GRS) data [38,43]. Considering the crustal heat production increases the heat flow obtained from lithosphere strength [22]. Taking into account crustal HPEs abundances, the derived heat flow is 26–44 mW , for Warrego thrust faults [22,26]. These values are similar but somewhat lower than those found by [24] for linear thermal gradients because these authors used faster strain rates and the friction coefficient rather than the stress dependent coefficient for compression [46]. The most recent estimation of heat flows of that region on Mars (including Phrixi Rupes) was made by [34], obtaining a range of heat flow between 24–54 mW using a 3D structural modeling on the Warrego faults and obtaining new shallower depths for the BDT.
Around Hellas Planitia, a giant impact 4.0–4.2 Ga old making the deepest depression on Mars [47], several lobate scarps were formed in a range of ages of a few hundred million years, including Late Noachian/Early Hesperian, probably related to the crustal thickening and lateral pressure variations following the formation of the basin [28]. The analysis of this set of lobate scarps in the circum-Hellas region has made possible the comparison between heat flows in a relatively close area, being the results fairly similar (25–39 mW ), but with the exception of Chalcoporos and Thyles Rupis which give higher values (38–70 mW ), which were considered to be less reliable because later topography modifications [28].
Similarly, at the terrains located in Aonia Terra at NW margin of Argyre impact basin and parallel to the edge of the Thaumasia Montes, [29] modeled the BTD depth of three Late Noachian/Early Hesperian lobate scarps, obtaining heat flows between 25 to 51 mW . The heat flows derived for Bosporos Rupes and Phrixi Rupes are similar to those usually found in the Thaumasia and circum-Hellas regions, the heat flow obtained for Ogygis Rupes is comparatively higher as a consequence of the lower BDT depth estimated for this lobate scarp. This also suggests that heat flow derived in the highlands was relatively similar in the Noachian-Hesperian boundary, and in general, heat flows in Late Noachian to Early Hesperian times are not very high.
The heat flow estimates derived from also give us information about the thermal state of Mars when the lithosphere was loaded [12,19,22,25,48]. The results for structures loaded in Late Noachian or Early Hesperian times show a wide dispersion of values, which results in a similarly wide (nut badly constrained) dispersion of heat flows values, which could range between ~10 and ~100 mW .
3. Thrust Faults Used for the Analysis
To obtain a rough vision of the heat flow at the Martian highlands at the Noachian/ Hesperian boundary, we the BDT depths for five selected lobate scarps associated with large thrust faults (see Figure 1 for locations) formed around the Noachian/Hesperian boundary.
These depths give an estimation of the BDT depth at the time of its formation [23,49], and hence we can use these depths to calculate the heat flow at the time of faulting. We are aware that the true time of faulting may not always be exactly coincident with the exact Noachian-Hesperian limit. However, the variations of radioactive heat production rates in time lapses of years (comparable to the uncertainty in age determinations for these thrust faults; [24,28,29] are relatively minor, and there is no evidence of large thermal events in this epoch that could have enhanced the heat flow (rather the opposed; [12]).
4. HPEs Abundances and Heat Production
Crustal radioactive heat production plays an important role in the elaboration of global models of the surface heat flow distribution on Mars [36]. HPEs are incompatible, which means that these elements tend to be enriched in the crust [50]. Consequently, the mantle should be depleted in these elements, which should be considered for the estimation of the radioactive production of the lithospheric mantle.
Remote sensing data acquired by the Gamma-Ray Spectrometer (GRS) instrument on board the Mars Odyssey spacecraft gave us an approximate understanding of the distribution of these elements and their abundances on Mars [37,38,43,51]. Thus, Mars Odyssey data have been used to determine the abundances of these elements that are representative in the upper tens of centimeters of the surface, from 10 cm to 1 m thick below the surface depending on the density of the underlying material [52]. Maps of the surface abundances of K, Th, and U are shown in Figure 2. Thorium and potassium abundances (Figure 2a and Figure 2b) were directly measured by the GRS instrument (most updating data comes from [39]) while we calculated uranium abundances from a Th/U ratio of 3.8 ratio based on Martian meteorite geochemical data [40,53] (converted to surface values in Figure 2c). GRS data are constrained in latitude (roughly to the ±60° latitudes) due to the high abundance of volatiles (especially water ice) below the surface of the high latitudes of Mars, which has a significant effect on the neutron distribution and alters their signal.
The total surface heat production of Mars is the sum of contributions from all HPEs. We calculate the heat production of each radioactive isotope from the standard decay constants in [54] as a function of age. Because the Martian crust is usually considered strongly mixed by cratering [43], we use the observed local HPEs abundances for calculating local crustal heat production. For 3.7 Ga we obtain that H varied between 1.0 × W to 2.5 × W across the planet, with an average value of 1.7 × W (Figure 3).
5. Crustal Model
The lateral variations in crustal thickness have a strong control over the crustal component of heat flow, and thereby over the thermal state of the entire lithosphere. Here we make use of a global uniform-density crustal thickness model of Mars developed by [44], constructed from gravity, topography, and seismic constraints. In particular, the model assumed a uniform crustal density of 2900 kg , mantle and core densities taken from the Khan2022 interior model, and the crustal thickness was constrained to be 39 km beneath the InSight lander site (see [44] for details). The crustal thickness model ranges from 6 to 117 km, and the average thickness of the crust is 56.7 km. Table 1 summarizes the local crustal thickness at the location of each lobate scarp.
6. Regional Heat Flows and Crustal HPEs Abundances at the Noachian-Hesperian Boundary
In this section, we present heat flow calculations based on the BDT depth estimates of the depth of the five large thrust faults listed in Table 1. We use the same set of thermal and mechanical parameters for all the cases here studied, and follow the methodology detailed by [22,28]. This methodology calculates the heat flow from the temperature at the BDT depth (). Because the ductile strength of the lithosphere depends on temperature, can be derived from equating the brittle and ductile strength at the BDT, and therefore
where Q is the activation energy of creep, n and A are laboratory-determined constants for creep deformation, R is the gas constant (8.3145 J ), is the pore fluid pressure, is the density, is a coefficient that depends on the stress regime (which takes a value of 3 in the case of thrust faulting; [46]), g is the acceleration due to the gravity (3.72 m for Mars), is the BDT depth, and ė is the strain rate. We take = 0.35 (valid for hydrostatic conditions), = 2900 kg (following previous geophysical global modeling of the Martian crust [55,56,57,58], creep parameters for the flow law of wet diabase of [59], appropriate for a mostly basaltic crust and a wet environment in Late Noachian/Early Hesperian times [60,61], and a strain rate of , which is in the upper limit considered reasonable for Mars [19,22], and therefore serves to obtain robust upper limits for the heat flow.
Assuming radioactive heat sources homogeneously distributed in the crust, the surface heat flow can be calculated from as
where k is the thermal conductivity of the crust, is the temperature at the surface, and H is the crustal volumetric heat production rate. We performed the calculations for a constant thermal conductivity of 2 , which is appropriated for intact, non-porous basaltic rocks [62], and we assume as the present mean surface temperature on Mars, 220 K [63]. Regarding the heat produced by radioactive sources, we have opted to use the local heat production for each lobate scarp location, trying to be as faithful as possible to the regional geochemistry of Mars. The local surface heat production values calculated at 3.7 Ga for each thrust fault location varies between 0.39 and 0.46 W (Table 1).
The obtained surface heat flows are summarized in Table 1. The obtained heat flow values are between 35 and 56 mW . These results also provide further information on the compositional stratification of the crust: if we accept that the crustal heat flow component, raised from crustal HPEs, and given by (where b is the crustal thickness), cannot be higher than the derived surface heat flow (otherwise the heat flow from the mantle, which includes convective heat flow and radiogenic heat production in the lithospheric mantle, would be negative), then the ratio informs us on physically unrealistic solutions. For most of the analyzed thrusts, the range of obtained is >1. For two thrusts the range for includes values <1 for this ratio, which would imply negative or very low mantle heat flows. If <1 then HPEs abundances cannot be the same in deeper layers than in shallower ones.
7. Building a Global Heat Flow Model for 3.7 Ga
7.1. Heat Flow Model Based on Thrust Fault Depths (Mars “Without Plumes”)
As a first step to propose a global heat flow model for Mars at 3.7 Ga, we construct a model, following the methodology of [36], which scales crustal thickness variations to heat flow variations through radioactive heat production. This first model still does not take into account the possible influence of plume activity related to Noachian volcanism. We assume local HPEs distributed in a HPEs-rich upper layer (denoted by ) and no HPEs in the lowermost crust. It can be seen that a of 0.8b is consistent with non-negative mantle heat flows in all the thrust fault locations considered in Table 1, as well as with previous studies [26,64,65,66]. Thus, we assume = 0.8b, and modify the scaling procedure by [36] to account for a differentiated crust and local heat production rates. Thus, the local heat flow is given by
where , and are reference values used for anchoring the model, and b and H are here, respectively, the local crustal thickness and heat production rate. The assumption of = 0.8b is conservative, since assuming substantially lower values could imply (if we use an enriched crust thinner than the local BDT depth) the necessity of calculating thermal structures more complicated than those described through Equation (2). Also, the ratio / could locally vary, but we fit it by necessity. We use = 56.7 km and = 0.49 W (which is equivalent to the mean radioactive heat production when considering a density of 2900 kg ) as mean values for Mars. For , we calculated a “mean” heat flow for Mars obtained from the
where is the mean mantle heat flow deduced from thrust faults (see Table 1). Using = – 0.8 and central values obtained from each trust fault, we obtain = 16.9 ± 9.0 mW . From Equation (4) this implies the F ref to be between 30 and 48 mW , with a mean value of 39.2 mW , value that we use for the heat flow model of Mars “without plumes”. This model (Figure 4a) shows a heat flow distribution greatly related to crustal thickness variations, with larger values (with a maximum of 62 mW ) in regions of the southern hemisphere, and lower ones (with a minimum of 19 mW ) at the northern plains and large impact basins as Hellas, Argyre or Isidis Planitiae.
7.2. Global Heat Flow Model with Large Plumes
Around the Noachian-Hesperian boundary, the greatest volcanic edifices were in formation [67], and the two large volcanic provinces such as Tharsis and Elysium were active. Without plate tectonics, the formation of this large volcanoes on Mars is related with partial melting above static mantle plumes [68,69,70,71,72,73]. In this section we construct a more complete global heat flow model for Mars at 3.7 Ga Martian by adding the contribution of large plumes to the thrust-based model described in the previous section. For a radial plume, the local plume contribution to the surface heat flow in the areas affected is given by [45].
where is the plume heat flow in the center of the plume, r is the distance to the plume center, and R is the radius of the affected area (Plume material spreads radially away from the center and cooling progressively towards the rim of the plume footprint; [45,74]). We place the center of the plume beneath Tharsis at 6°S, 95°W, corresponding with the center of the Tharsis demagnetized region as defined by [45], but with a radius of influence of 2,000 km, in order to unaffecting the heat flows in the location of the Warrego thrusts, which had similar heat flows to other highlands thrusts (see Table 1). Similarly, we set the center of the Elysium plume at 22.7°N, 145°E, with a 700 km radius for the plume footprint. We assume maximum central heat flows of 100 mW for both mantle plumes; this value corresponds to the maximum calculated by [45] for a representative plume for Noachian-Hesperian volcanism, and we are mainly interested in upper limits. Both areas affected by plumes are delineated in Figure 1. Figure 4b illustrates the heat flow model with the addition of the plume contribution to the first-step model described in the previous section. As expected, the heat flow rises at the points closest to the plume centers, reaching a maximum of 120 mW . However, it is remarkable that, despite the action of the plumes, the reference heat flow (equivalent to the planetary average) in this model is 40.8 mW , only increased by 1.6 mW with respect to the model without plumes. This is because the plume contribution rapidly vanished when separating from plume center. Note that our plume model does not account for small-scale hot spots related to individual volcanoes, which, in any case, would not significantly affect the calculated average heat flow of Mars.
8. Discussion
The proposed global model for the heat flow of Mars at the Noachian-Hesperian boundary provides one approach to estimating the geographical pattern of heat loss, as well as the average heat flow, around that time. Potentially, it also informs us on the structure of the crust. The necessity of avoiding negative mantle heat flows in our calculation of surface heat flows from large thrust faults, implies that the HPEs-rich crust must be thinner than the whole crust. For an 80% crust being HPEs-rich, the assumed average crustal thickness of 56.7 km (see Section 5), implies an equivalent radioactive producing crust of 45.4 km thickness. This is in accordance with previous works that reported a formation of the crust in several stages [64,65,66] , and with works calculating heat from lithosphere strength which found evidence for a heat-producing elements (HPE)-enriched upper crust. [21,26,28]. Taking into account the influence of two large mantle plumes below Tharsis and Elysium magmatic provinces, and the uncertainty in the mantle heat flow derived from the thrust faults, the average surface heat flows would be between 32 and 50 mW in the Late Noachian/Early Hesperian time. That suggests that the heat flow in the highlands was comparatively low around the Noachian-Hesperian boundary, what is compatible with heat flow calculations obtained by other works [12,22,28,29]. This result is largely independent of the presence of mantle plumes. Indeed, Figure 5a shows the influence of mantle plumes strength on the average planetary heat flow. For mantle plumes with central heat flows below 300 mW the contributions beneath Tharsis and Elysium were not enough to elevate the average surface heat flow near to the total heat production rate generated by the global amount of HPEs (after the composition models of [75]). As above indicate, mantle plumes with central heat flows above 100 mW are probably unrealistic [45]) A Mantle Urey Ratio can be defined as the ratio between the total mantle radioactive heat power and the total mantle heat loss, in order to constraint the heat budget of the Martian mantle
For < 1 the mantle as a whole is cooling-down or heating-up when > 1. The total mantle radioactive heat power is calculated from [75], and subtracting the crustal radioactive production for an average crust 56.7 km thick with HPEs only distributed in the upper 80% of its thickness. The total mantle heat loss is obtained from the average heat flow by subtracting the crustal heat flow component (note that mantle heat loss includes plume effects). Figure 5b shows this relation with increasing mantle plumes contributions and again is observed that this additional mantle heat loss is not enough to equate the heat loss with the total radioactive heat power (i.e., > 1) for reasonable central plume heat flows. This indicates that Mars, at the Noachian-Hesperian boundary, internally produced more heat by radioactivity than the heat loses through its surface. Our results therefore support a certain heating-up of the Martian interior at this period of time. This is consistent with a limited cooling through the Martian history deduced from lithosphere strength [12,22], and with deductions on the thermal state of the mantle obtained by the Insight mission [76,77,78]. However, the heat flow was significantly higher in pre-Late Noachian times [12], and therefore, the low global heat flow at the Noachian-Hesperian boundary suggests that Mars experienced a major change in thermal and geodynamic regime around this time. This change could be related to a reduction in the efficiency of mantle convection, maybe related to inefficient water recycling in the stagnant-lid regime [79,80].
9. Conclusions
The heat flow model of Mars at the Noachian-Hesperian boundary obtained by scaling from local heat flows derived from thrust faults, and adding the influence of large mantle plume provide one approach to estimating the average heat flow, and the heat loss pattern, around that time. Our results find average heat flows between 32 and 50 mW for realistic plume strengths. These values are lower than the total radioactive heat production of the planet, but consistent with estimates from lithosphere strength or deductions from interior state from Insight. Because the plume contribution to the whole heat loss of the planets is not enough for changing it for realistic scenarios, the conclusion is that the heat flow at 3.7 Ga was low, maybe implying interior heating up or subchondritic heat sources. Because the heat flow was significantly higher in previous Noachian times, the heat flow pattern at the Noachian-Hesperian boundary suggests that Mars experienced a major change in thermal regime around this time, probably related to a lower efficiency of mantle convection.
10. Acknowledgments, Samples, and Data
This research has received funding from the projects PID2022-140686NB-I00 (MARVEN), funded by the Spanish Ministry of Science (MICINN), and PR3/23-30839, funded by the Universidad Complutense de madrid. L.M.P. contribution was supported CIAPOS/2022/066 postdoctoral grant (European Social Fund and Generalitat Valenciana). Several figures were generated using the Generic Mapping Tools (GMT) package [81].
References
- Solomon, S.C. et al. New perspectives on ancient Mars. Science 2005, 307, 1214-1220.
- Carr, M.H. & Head, J.W. Geologic history of Mars. Earth Planet. Sci. Lett. 2010, 294, 185-203.
- Fassett, C. I. & Head, J. W. Sequence and timing of conditions on early Mars. The timing of martian valley network activity: constraints from buffered crater counting. Icarus 2011, 211, 1204-1214.
- Ramirez, R. M. & Craddock, R. A. The geological and climatological case for a warmer and wetter early Mars. Nature Geoscience 2018, 11, 230-237.
- Mangold, N., Adeli, S., Conway, S., Ansan, V. & Langlais, B. A chronology of early Mars climatic evolution from impact crater degradation. J. Geophys. Res. 2012, 117, E04003.
- Bibring, J. P. et al. Global mineralogical and aqueous Mars history derived from OMEGA/Mars express data. Science 2006, 312, 400–404.
- Ehlmann, B. L. et al. Subsurface water and clay mineral formation during the early history of Mars. Nature 2011, 479, 53–60.
- Baratoux, D., Toplis, M. J., Monnereau, M. & Sautter, V. The petrological expression of early Mars volcanism. J. Geophys. Res. 2013, 118, 59–64.
- Wilson, J. H. & Mustard, J. F. Exposures of olivine-rich rocks in the vicinity of Ares Vallis: implications for Noachian and Hesperian volcanism. J. Geophys. Res. 2013, 118, 916–929.
- McSween, H. Y. Petrology on Mars. American Mineralogist 2015, 100, 2380-2395.
- Citron, R. I., Manga, M., & Hemingway, D. J. Timing of oceans on Mars from shoreline deformation. Nature 2018, 555, 643-646.
- Ruiz, J. The early heat loss evolution of Mars and their implications for internal and environmental history. Sci. Rep. 2014, 4, 4338.
- Milbury, C., Schubert, G., Raymond, C. A., Smrekar, S. E. & Langlais, B. The history of Mars’ dynamo as revealed by modelling magnetic anomalies near Tyrrhenus Mons and Syrtis Major. J. Geophys. Res. 2012, 117, E10007.
- Langlais, B., The´bault, E. Y., Quesnel, Y. & Mangold, N. A. Late Martian Dynamo Cessation Time 3.77 Gy Ago. Lunar Planet. Sci. Conf. 2012, 43, 1231.
- Steele, S.C., Fu, R.R., Muxworthy, A.R., Volk, M.W.R., Collins, G.S., North, T.L., Davison, T.M. Taleomagnetic evidence for a long-lived, potentially reversing martian dynamo at 3.9 Ga. Sci. Adv. 2023, 9, eade9071.
- Ehlmann, B. L., et al. The sustainability of habitability on terrestrial planets: Insights, questions, and needed measurements from Mars for understanding the evolution of Earth-like worlds, J. Geophys. Res. Planets 2016, 121, 1927–1961.
- Solomon, S. C. & Head, J. W. Heterogeneities in the thickness of the elastic lithosphere of Mars: Constraints on heat flow and internal dynamics. J. Geophys. Res. 1990, 95, 11073–11083.
- Anderson, S. & Grimm, R.E. Rift processes at the Valles Marineris, Mars: Constraints from gravity on necking and rate-depending strength evolution. J. Geophys. Res. 1998, 103, 11113–11124.
- McGovern, P. J. et al. Correction to Localized gravity/topography admittance and correlation spectra on Mars: implications for regional and global evolution. J. Geophys. Res. 2004, 109, E07007.
- Grott, M., Hauber, E., Werner, S. C., Kronberg, P. & Neukum, G. High heat flux on ancient Mars: Evidence from rift flank uplift at Coracis Fossae. Geophys. Res. Lett. 2005, 32, L21201.
- Ruiz, J., McGovern, P. J. & Tejero, R. The early thermal and magnetic state of the cratered highlands of Mars. Earth Planet. Sci. Lett. 2006, 241, 2–10.
- Ruiz, J. et al. The thermal evolution of Mars as constrained by paleo-heat flows. Icarus 2011, 15, 508–517.
- Schultz, R. A. & Watters, T. R. Forward mechanical modeling of the Amenthes Rupes thrust fault on Mars. Geophys. Res. Lett. 2001, 28, 4659–4662.
- Grott, M., Hauber, E., Werner, S.C., Kronberg, P., Neukum, G. Mechanical mod- eling of thrust faults in the Thaumasia region, Mars, and implications for the Noachian heat flux. Icarus 2007, 186, 517–526.
- Ruiz, J. et al. Ancient heat flow, crustal thickness, and lithospheric mantle rheology in the Amenthes region, Mars. Earth and Planetary Science Letters 2008, 270, 1–12.
- Ruiz, J. et al. Ancient heat flows and crustal thickness at Warrego rise, Thaumasia Highlands, Mars: Implications for a stratified crust. Icarus 2009, 203, 47–57.
- Mueller, K., Vida, A., Robbins, S., Golombek, M., & West, C. Fault and fold growth of the Amenthes uplift: implications for Late Noachian crustal rheology and heat flow on Mars. Earth Planet. Sci. Lett. 2014, 408, 100–109.
- Egea-González, I., Jiménez-Díaz, A., Parro, L.M., Lopez, V., Williams, J.P., & Ruiz, J. Thrust fault modeling and Late-Noachian lithospheric structure of the circum-Hellas region, Mars. Icarus 2017, 288, 53–68.
- Herrero-Gil, A., Egea-González, I., Ruiz, J., & Romeo, I. Structural modeling of lobate scarps in the NW margin of Argyre impact basin, Mars. Icarus 2019, 319, 367-380.
- Smith, D. et al. Mars Orbiter Laser Altimeter: Experiment summary after the first year of global mapping of Mars. J. Geophys. Res. 2001, 106, 23,689-23,722.
- Gwinner, K., Scholten, F., Preusker, F., Elgner, S., Roatsch, T., Spiegel, M., Schmidt, R., Oberst, J., Jaumann, R., Heipke, C. Topography of Mars from global mapping by HRSC high-resolution digital terrain models and orthoimages: Characteristics and performance. Earth Planet. Sci. Lett. 2010, 294, 506-519.
- Watters, T.R., & Robinson, M.S. Lobate scarps and the Martian crustal dichotomy. J. Geophys. Res. 1999, 104, 18981–18990.
- Tanaka, K.L., et al. The digital global geologic map of Mars: Chronostratigraphic ages, topographic and crater morphologic characteristics, and updated resurfacing history. Planet. Space Sci. 2014, 95, 11–24.
- Herrero-Gil, A., I. Egea-González, A. Jiménez-Díaz, S. Rivas-Dorado, L.M. Parro, C. Fernández, J. Ruiz, I. Romeo. Lithospheric contraction concentric to Tharsis: structural modeling of large thrust faults between Thaumasia highlands and Aonia Terra, Mars. Journal of Structural Geology 2023, 177, 104983, 1-15.
- Atkins, R. M., Byrne, P. L., & Wegmann, K. W. Morphometry and timing of major crustal shortening structures on Mars, Lunar Planet. Sci. 2019, 50, Abstract 2132.
- Parro, L. M., Jiménez-Díaz, A., Mansilla, F., & Ruiz, J. Present-day heat flow model of Mars. Nature Scientific Reports 2017, 7(1), 45629.
- Boynton, W.V., et al. Concentration of H, Si, Cl, K, Fe, and Th in the low and mid latitude regions of Mars. J. Geophys. Res. 2007, 112, E12S99.
- Hahn, B. C., McLennan, S. M., & Klein, E. C. Martian surface heat production and crustal heat flow from Mars Odyssey gamma-ray spectrometry. Geophysical Research Letters 2011, 38, L14203.
- Rani, A., Basu Sarbadhikari, A., Hood, D. R., Gasnault, O., Nambiar, S., & Karunatillake, S. Consolidated chemical provinces on Mars: Implications for geologic interpretations. Geophysical Research Letters 2022, 49, e2022GL099235.
- Meyer, C. Mars Meteorite Compendium. Lyndon B. Johnson Space Cent. 2003, NASA, Houston, Tex.
- Herrero-Gil, A., Ruiz, J., Romeo, I. 3D modeling of planetary lobate scarps: the case of Ogygis Rupes, Mars. Earth Planet Sci. Lett. 2020a, 532, 116004.
- Herrero-Gil, A., Ruiz, J., Romeo, I. Lithospheric contraction on Mars: a 3D model of the Amenthes thrust fault system. J. Geophys. Res.: Planets 2020b, 125, e2019JE006201.
- Taylor, G.J., et al. Bulk composition and early differ- entiation of Mars. J. Geophys. Res. 2006, 111, E03S10.
- Wieczorek, M. A., Broquet, A., McLennan, S. M., Rivoldini, A., Golombek, M., Antonangeli, D., et al. InSight constraints on the global character of the Martian crust. Journal of Geophysical Research: Planets 2022, 127, e2022JE007298.
- Jellinek, A. M., Johnson, C. L., & Schubert, G. Constraints on the elastic thickness, heat flow, and melt production at early Tharsis from topography and magnetic field observations. J. Geophys. Res. 2008, 113, E09004.
- Ranalli, G. Rheology of the lithosphere in space and time. Geol. Soc. Spec. Pub. 1997, 121, 19–37.
- Frey, H.V. Impact constraints on, and a chronology for, major events in early Mars history. J. Geophys. Res. 2006, 111, E08S91.
- Broquet, A., & Wieczorek, M. A. The gravitational signature of Martian volcanoes. Journal of Geophysical Research: Planets 2019, 124, 2054–2086.
- Watters, T. R., Schultz, R. A., Robinson, M. S., & Cook, A. C. The mechanical and thermal structure of Mercury’s early lithosphere. Geophys. Res. Lett. 2002, 29, 37-1.
- Taylor, S.R., McLennan, S.M. Planetary Crusts: Their Composition, Origin and Evolution. Cambridge Univ. Press 2009.
- Rani, A., Basu Sarbadhikari, A., Hood, D.R., Gasnault, O., Nambiar, S., Karunatillake, S. Consolidated chemical provinces on Mars: Implications for geologic interpretations. Geophysical Research Letters 2021, 49, e2022GL099235.
- Boynton, W.V., et al. Concentration of H, Si, Cl, K, Fe, and Th in the low and mid latitude regions of Mars. J. Geophys. Res. 2007, 112, E12S99.
- McLennan, S.M. Large-ion lithophile element fractionation during the early differentiation of Mars and the composition of the Martian primitive mantle. Meteor. Planet. Sci. 2003, 38, 895-904.
- Van Schmus, W. R. Natural radioactivity of the crust and mantle. In: Ahrens, T.J. (Ed.), Global Earth Physics: A Handbook of Physical constants. AGU Reference Shelf 1. American Geophysical Union, Washington, DC 1995, 283–291.
- Zuber, M.T., et al. nternal structure and early thermal evolution of Mars from Mars Global Surveyor. Science 2000, 287, 1788-1793.
- Neumann, G.A., Zuber, M.T., Wieczorek, M.A., McGovern, P.J., Lemoine, F.G. & Smith, D.E. The crustal structure of Mars from gravity and topography. J. Geophys. Res. 2004, 109, E08002.
- Genova, A., Goossens, S., Lemoine, F.G., Mazarico, E., Neumann, G.A., Smith, D.E., & Zuber, M.T. Seasonal and static gravity field of Mars from MGS, Mars Odyssey and MRO radio science. Icarus 2016, 272, 228-245.
- Wieczorek, M. A., Beuthe, M., Rivoldini, A., & Van Hoolst, T. Hydrostatic interfaces in bodies with nonhydrostatic lithospheres. Journal of Geophysical Research: Planets 2019, 124.
- Caristan, Y. he transition from high temperature creep to fracture in Mary- land diabase. J. Geophys. Res. 1982, 87, 6781–6790.
- Parmentier, E. M., & Zuber, M. T. Early evolution of Mars with mantle compositional stratification or hydrothermal crustal cooling, J. Geophys. Res. 2007, 112, E02007.
- Andrews-Hanna, J. C., Phillips R. J., & Zuber, M. T. Meridiani Planum and the global hydrology of Mars. Nature 2007, 446, 163–165.
- Beardsmore, G.R., & Cull, J.P. Crustal Heat Flow: A Guide to Measurement and Modelling. Cambridge University Press 2001, 324.
- Kieffer, H.H., et al. Thermal and albedo mapping of Mars during the Viking primary mission. J. Geophys. Res. 1977, 82, 4249–4291.
- Norman, M.D. The composition and thickness of the crust of Mars estimated from rare Earth elements and neodymium-isotopic compositions of martian meteorites. Meteor. Planet. Sci. 1999, 34, 439–449.
- Norman, M. D. hickness and composition of the martian crust revisited: Implications of an ultradepleted mantle with Nd isotopic composition like that of QUE94201. Lunar Planet. Sci. 2002, 33, Abstract 1175.
- Grott, M. Late crustal growth on Mars: Evidence from lithospheric extension. Geophys. Res. Lett. 2005, 32, L23201.
- Werner, S. C. The global martian volcanic evolutionary history. Icarus 2009, 201, 44–68.
- Carr, M. H. Volcanism on Mars. J. Geophys. Res. 1973, 78, 4049 – 4062.
- McKenzie, D., Barnett, D. & Yuan, D.-N. The relationship between martian gravity and topography. Earth Planet. Sci. Lett. 2002, 195, 1–16.
- Wenzel, M. J., Manga, M., & Jellinek, M. Tharsis as a consequence of Mars’ dichotomy and layered mantle. Geophys. Res. Lett. 2004, 31, L04702.
- Belleguic, V., Lognonne, P. & Wieczorek, M. Constraints on the martian lithosphere from gravity and topography data. J. Geophys. Res. 2005, 110, E11005.
- Cohen, B. E. et al. Taking the pulse of Mars via dating of a plume-fed volcano. Nat. Commun. 2017, 8, 640.
- Day, J. M. D., et al. Martian magmatism from plume metasomatized mantle. Nat. Commun. 2018, 9, 4799.
- Grott, M., & Breuer, D. On the spatial variability of the martian elastic lithosphere thickness: evidence for mantle plumes? J. Geophys. Res. 2008, 115, E03005.
- Wänke, H., Dreibus, G. Chemical composition and accretion history of terrestrial planets. Philos. Trans. R. Soc. Lond. 1988, A 325, 545–557.
- Drilleau, M., Samuel, H., Garcia, R.F., Rivoldini, A., Perrin, C., Michaut, C., et al. Marsquake locations and 1-D seismic models for Mars from InSight data. J. Geophys. Res. Planets 2022, 127, e2021JE007067.
- Samuel., H., et al. Geophysical evidence for an enriched molten silicate layer above Mars’s core. Nature 2023, 622, 717-718.
- Khan, A., Huang, D., Durán, C., Sossi, P.A., Giardini, D., & Murakami M. Evidence for a liquid silicate layer atop the Martian core. Nature 2023, 622, 718-723.
- McGovern, P.J., Schubert, G. Thermal evolution of the Earth: effects of volatile exchange between atmosphere and interior. Earth Planet. Sci. Lett. 1989, 96, 27-37.
- Sandu, C., Kiefer, W.S. Degassing history of Mars and the lifespan of its magnetic dynamo. Geophys. Res. Lett. 2012, 39, L03201.
- Wessel, P., Luis, J. F., Uieda, L., Scharroo, R., Wobbe, F., Smith, W. H. F., & Tian, D. The Generic Mapping Tools version 6. Geochemistry, Geophysics, Geosystems 2019, 20, 5556–5564.
- Watters, T.R., & Robinson, M.S. Lobate scarps and the Martian crustal dichotomy. J. Geophys. Res. 1999, 104, 18981–18990.
Figure 1.
Location of large thrust faults used in this work (white dots), as well as the rims of the Tharsis and Elysium plume footprints, over a Mars Orbiter Laser Altimeter topographic map in Hammer projection. Central meridian is the 0º longitude.
Figure 1.
Location of large thrust faults used in this work (white dots), as well as the rims of the Tharsis and Elysium plume footprints, over a Mars Orbiter Laser Altimeter topographic map in Hammer projection. Central meridian is the 0º longitude.
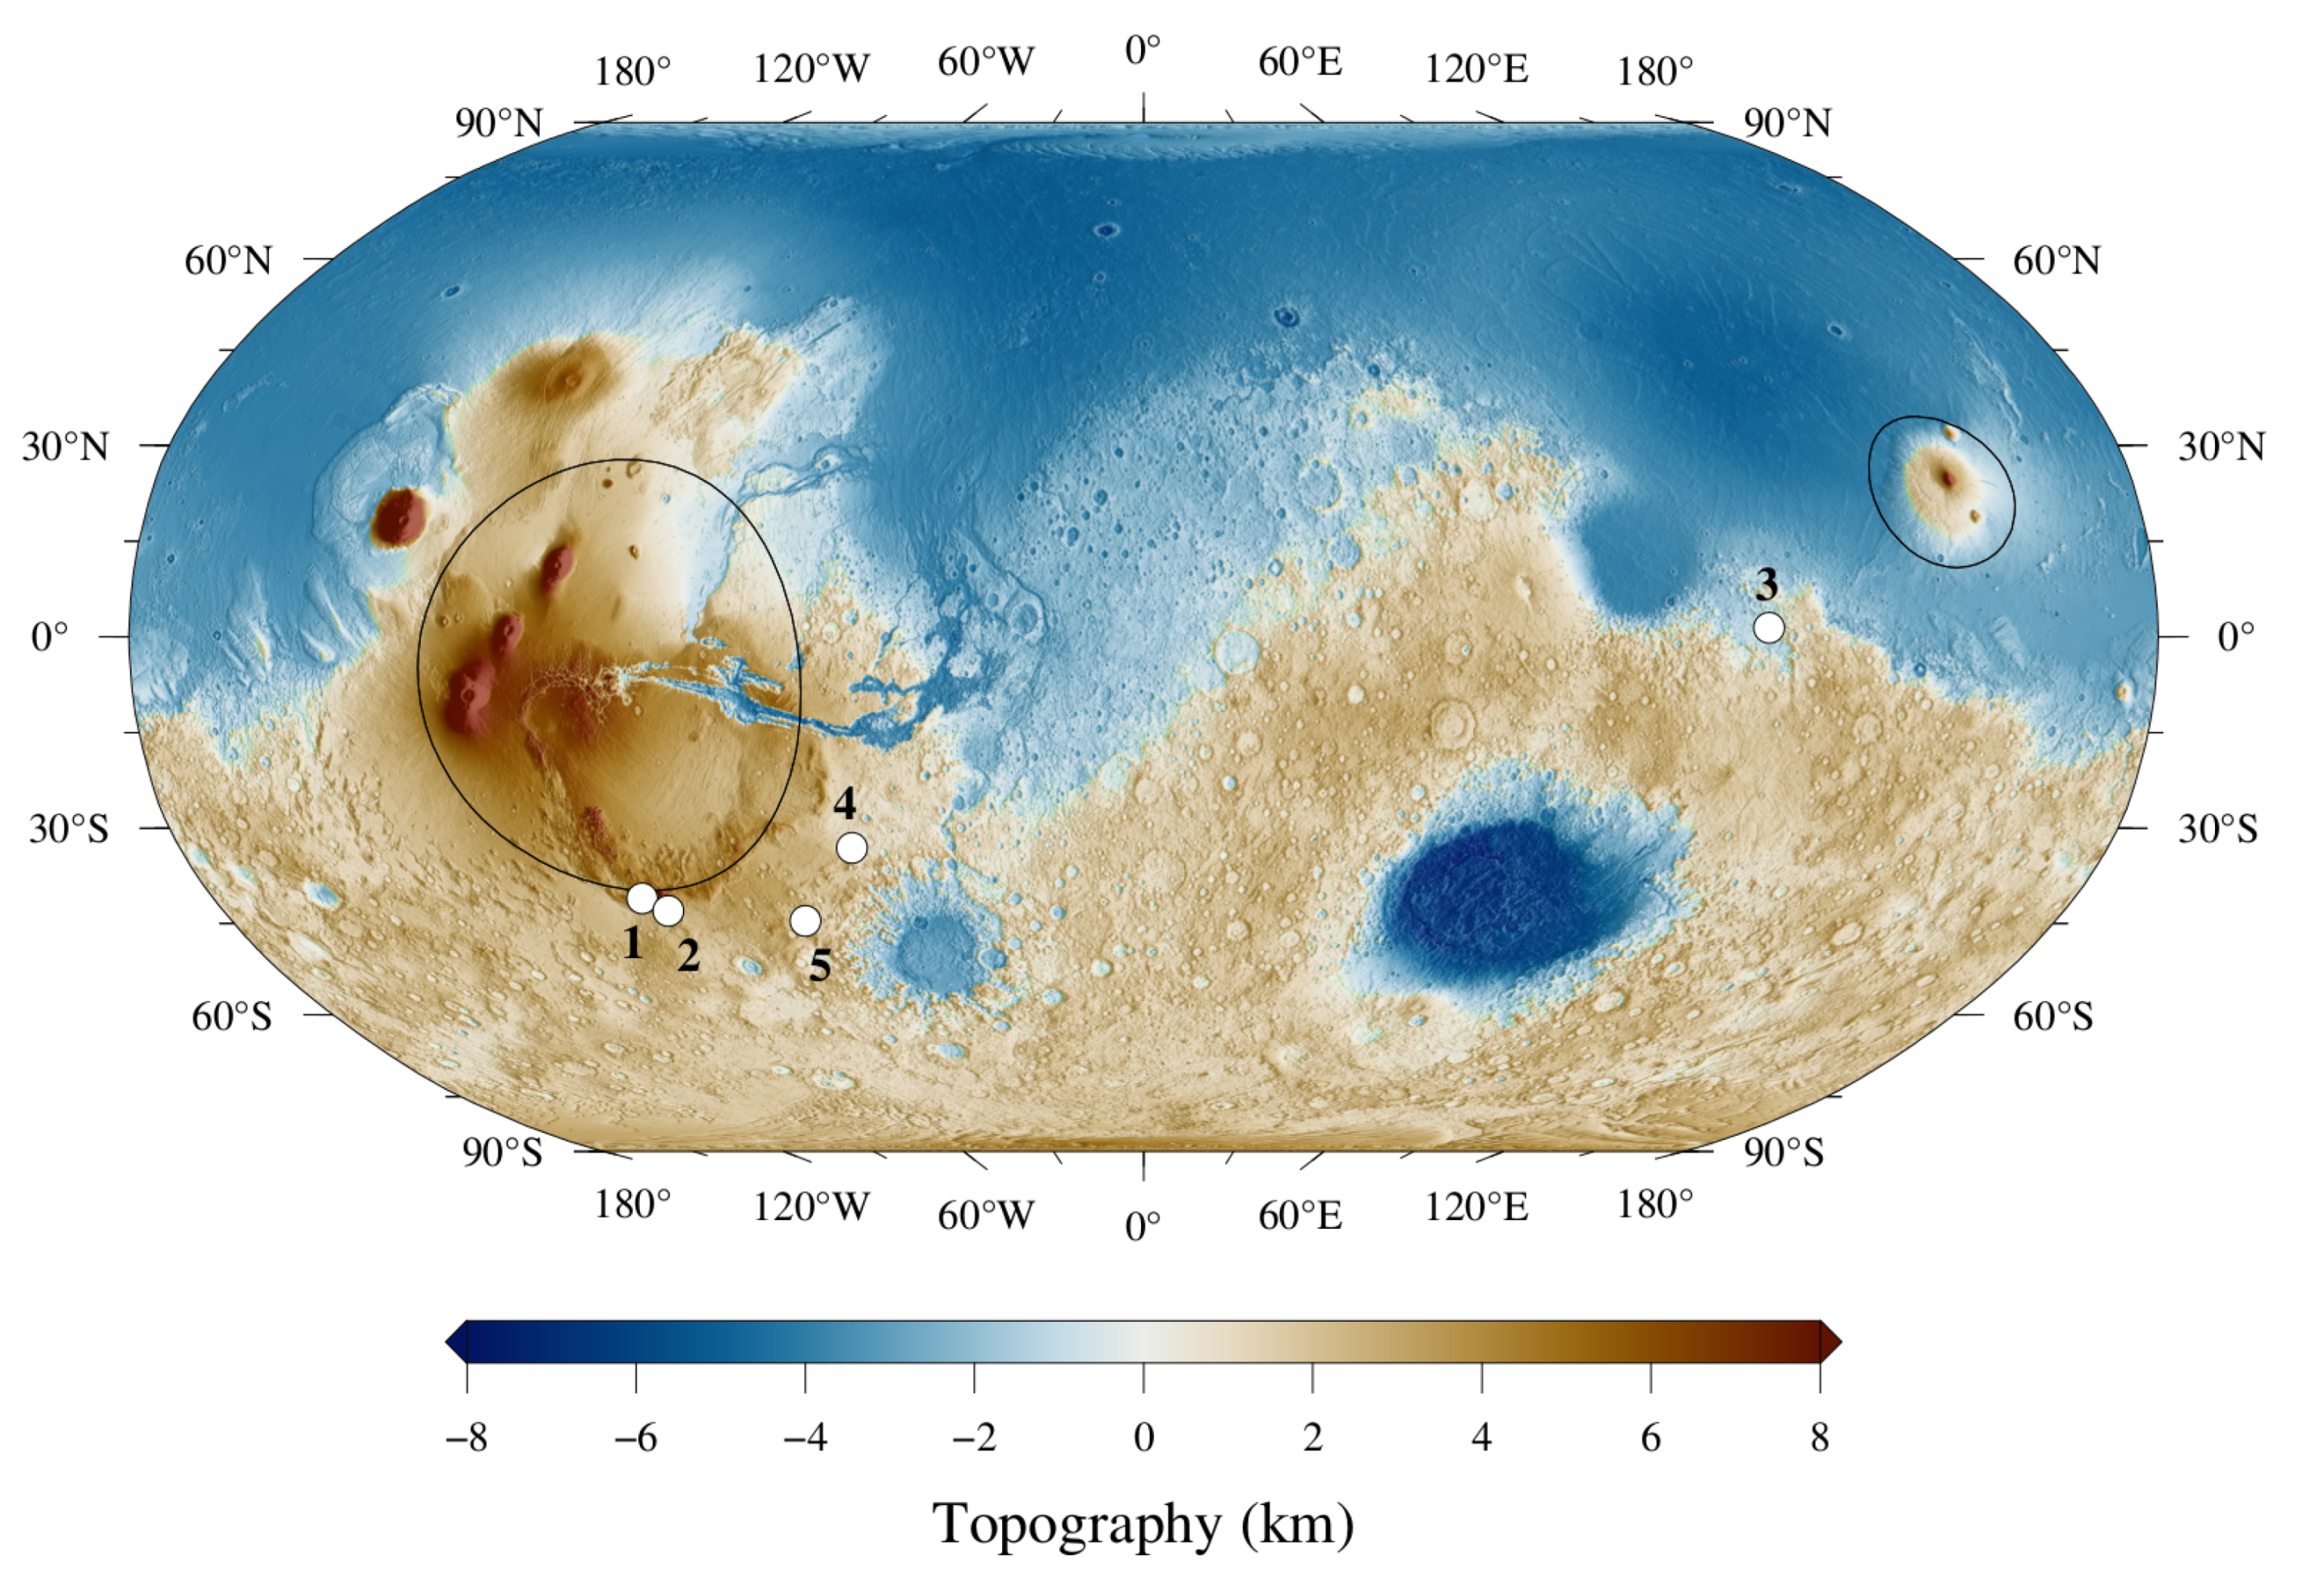
Figure 2.
Global smoothed distribution maps of HPEs abundances (K, Th and U) on Mars illustrated with 5° × 5° per pixel resolution. Base data of K and Th abundances from Rani et al. [51], and U abundance calculated from a Th/U ratio of 3.8 [40,53].
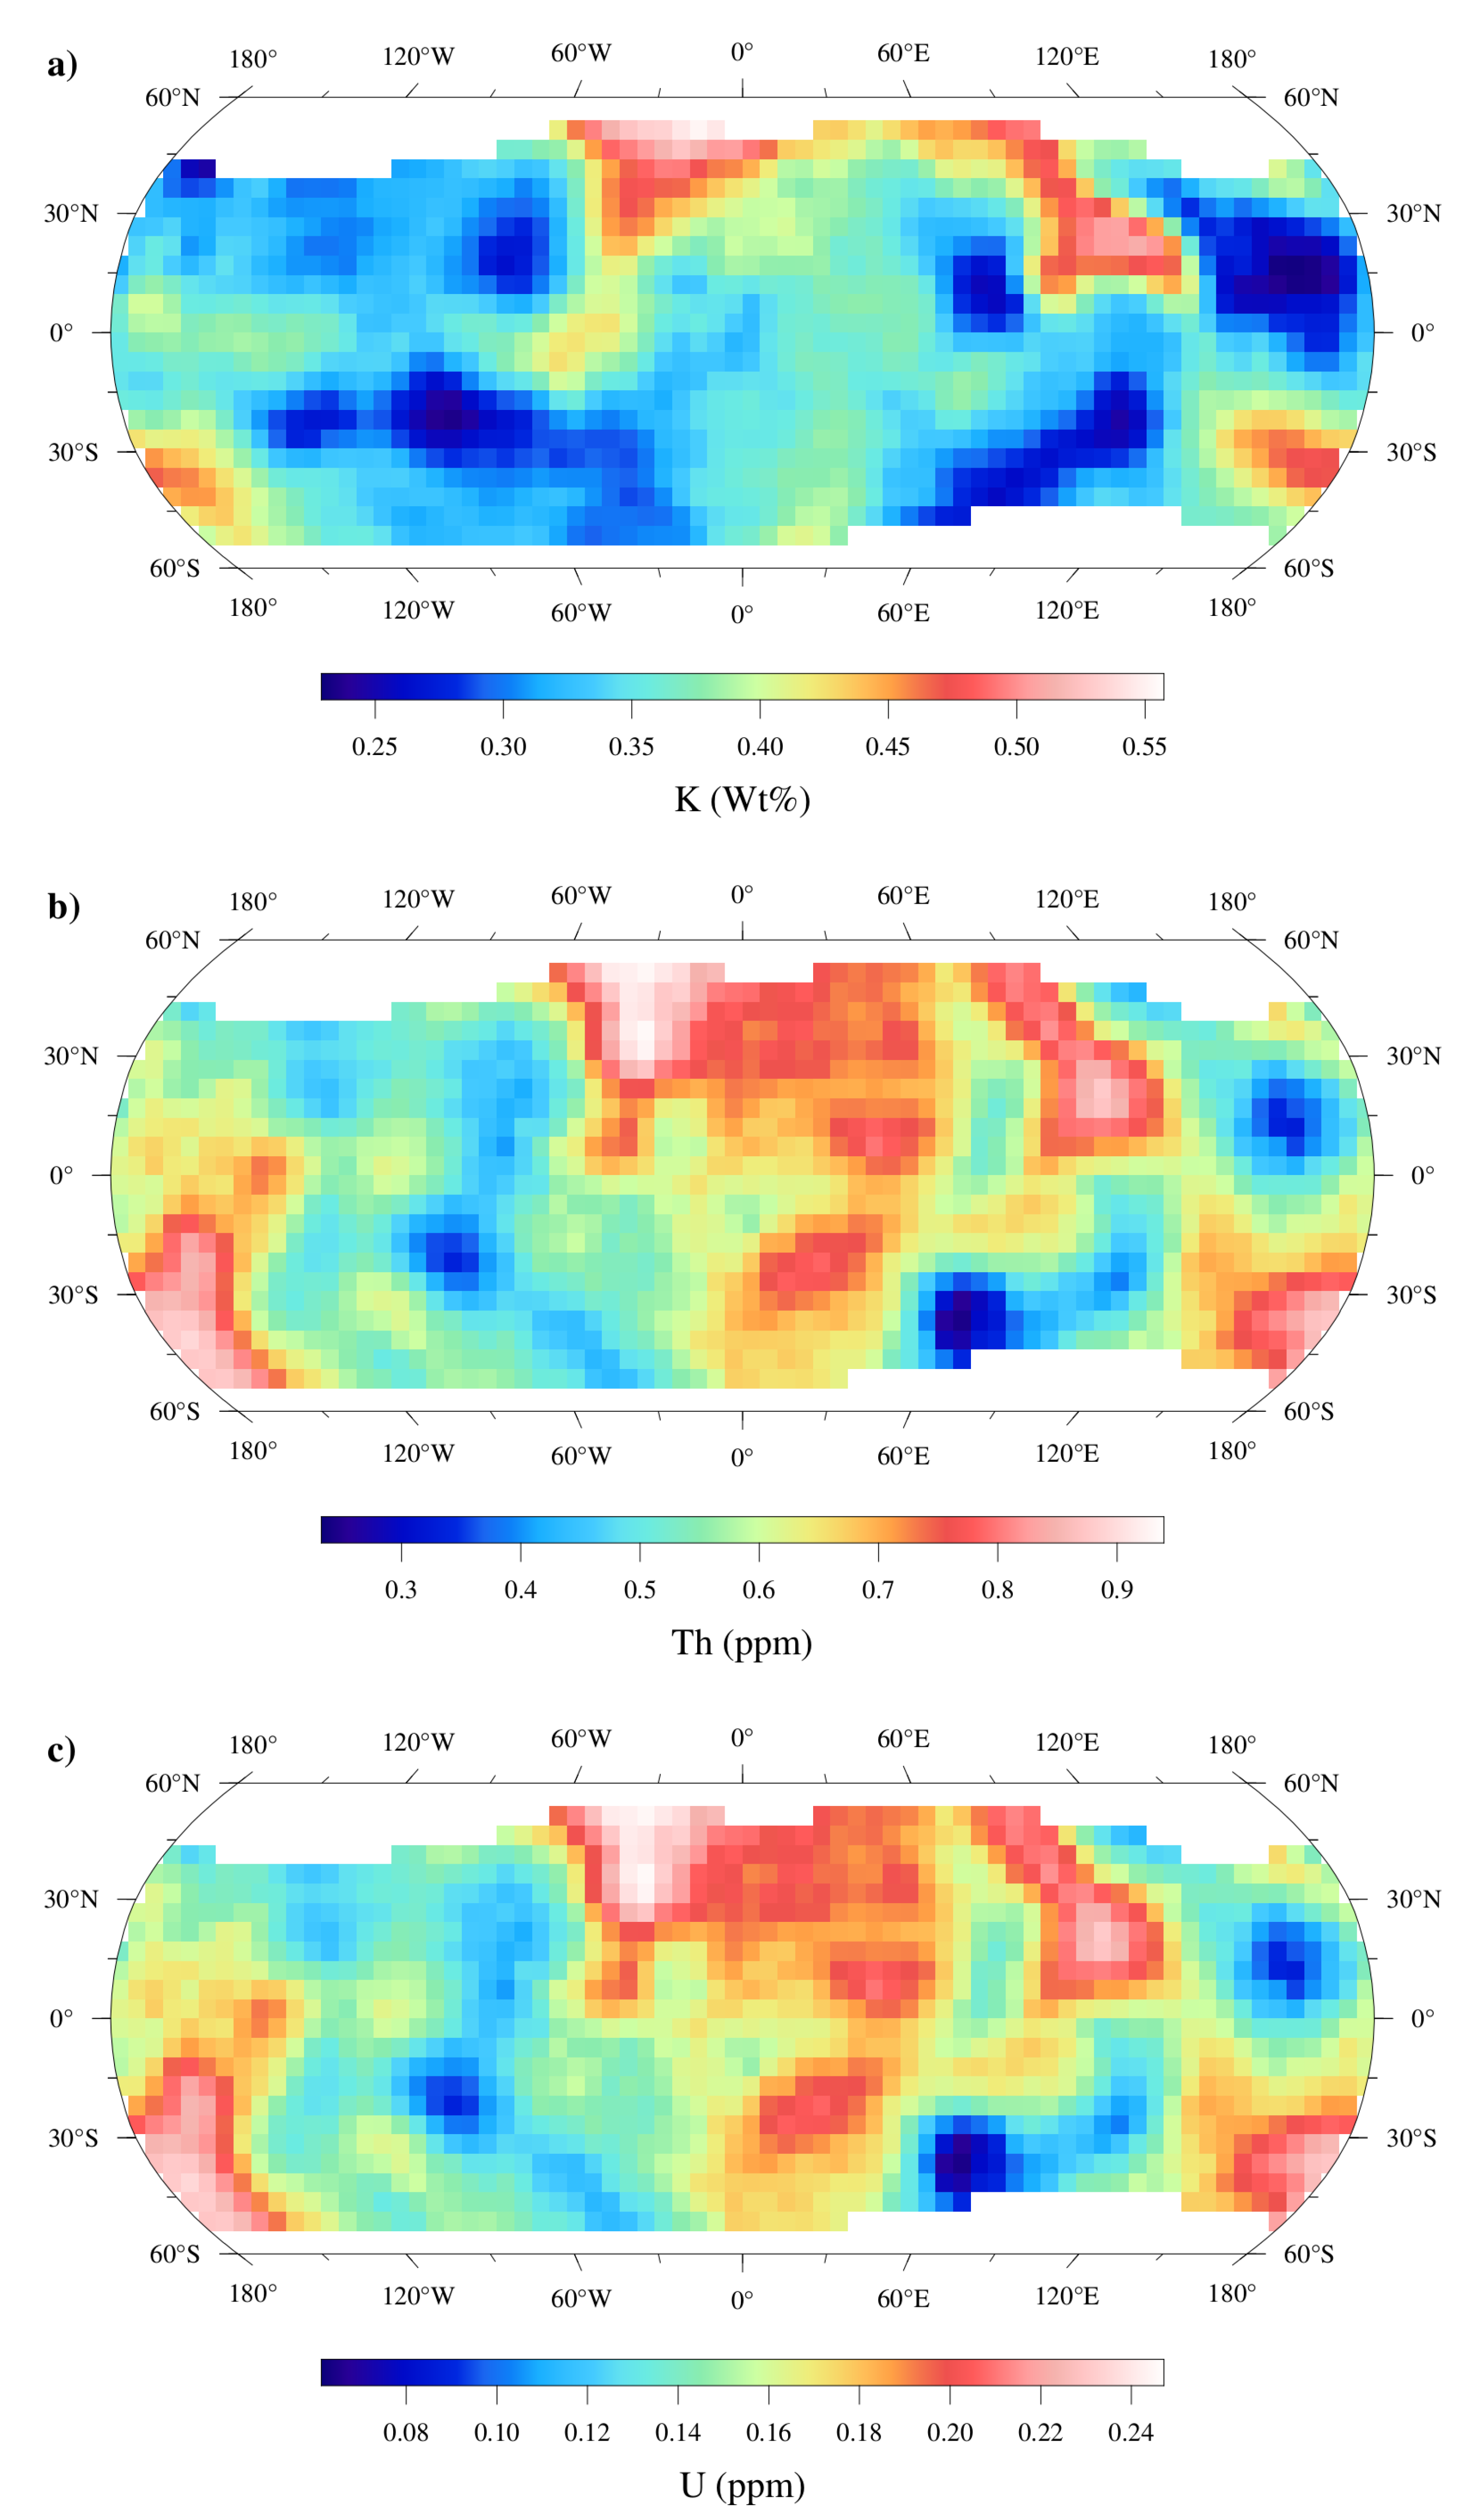
Figure 3.
Surface volumetric heat production (H), corresponds to the sum of the HPEs contributions (K, Th, U) measured by GRS (Mars Odyssey) on Mars, calculated for 3.7 Ga. Data grid is plotted in Hammer projection above the shaded relief of the MOLA topography.
Figure 3.
Surface volumetric heat production (H), corresponds to the sum of the HPEs contributions (K, Th, U) measured by GRS (Mars Odyssey) on Mars, calculated for 3.7 Ga. Data grid is plotted in Hammer projection above the shaded relief of the MOLA topography.
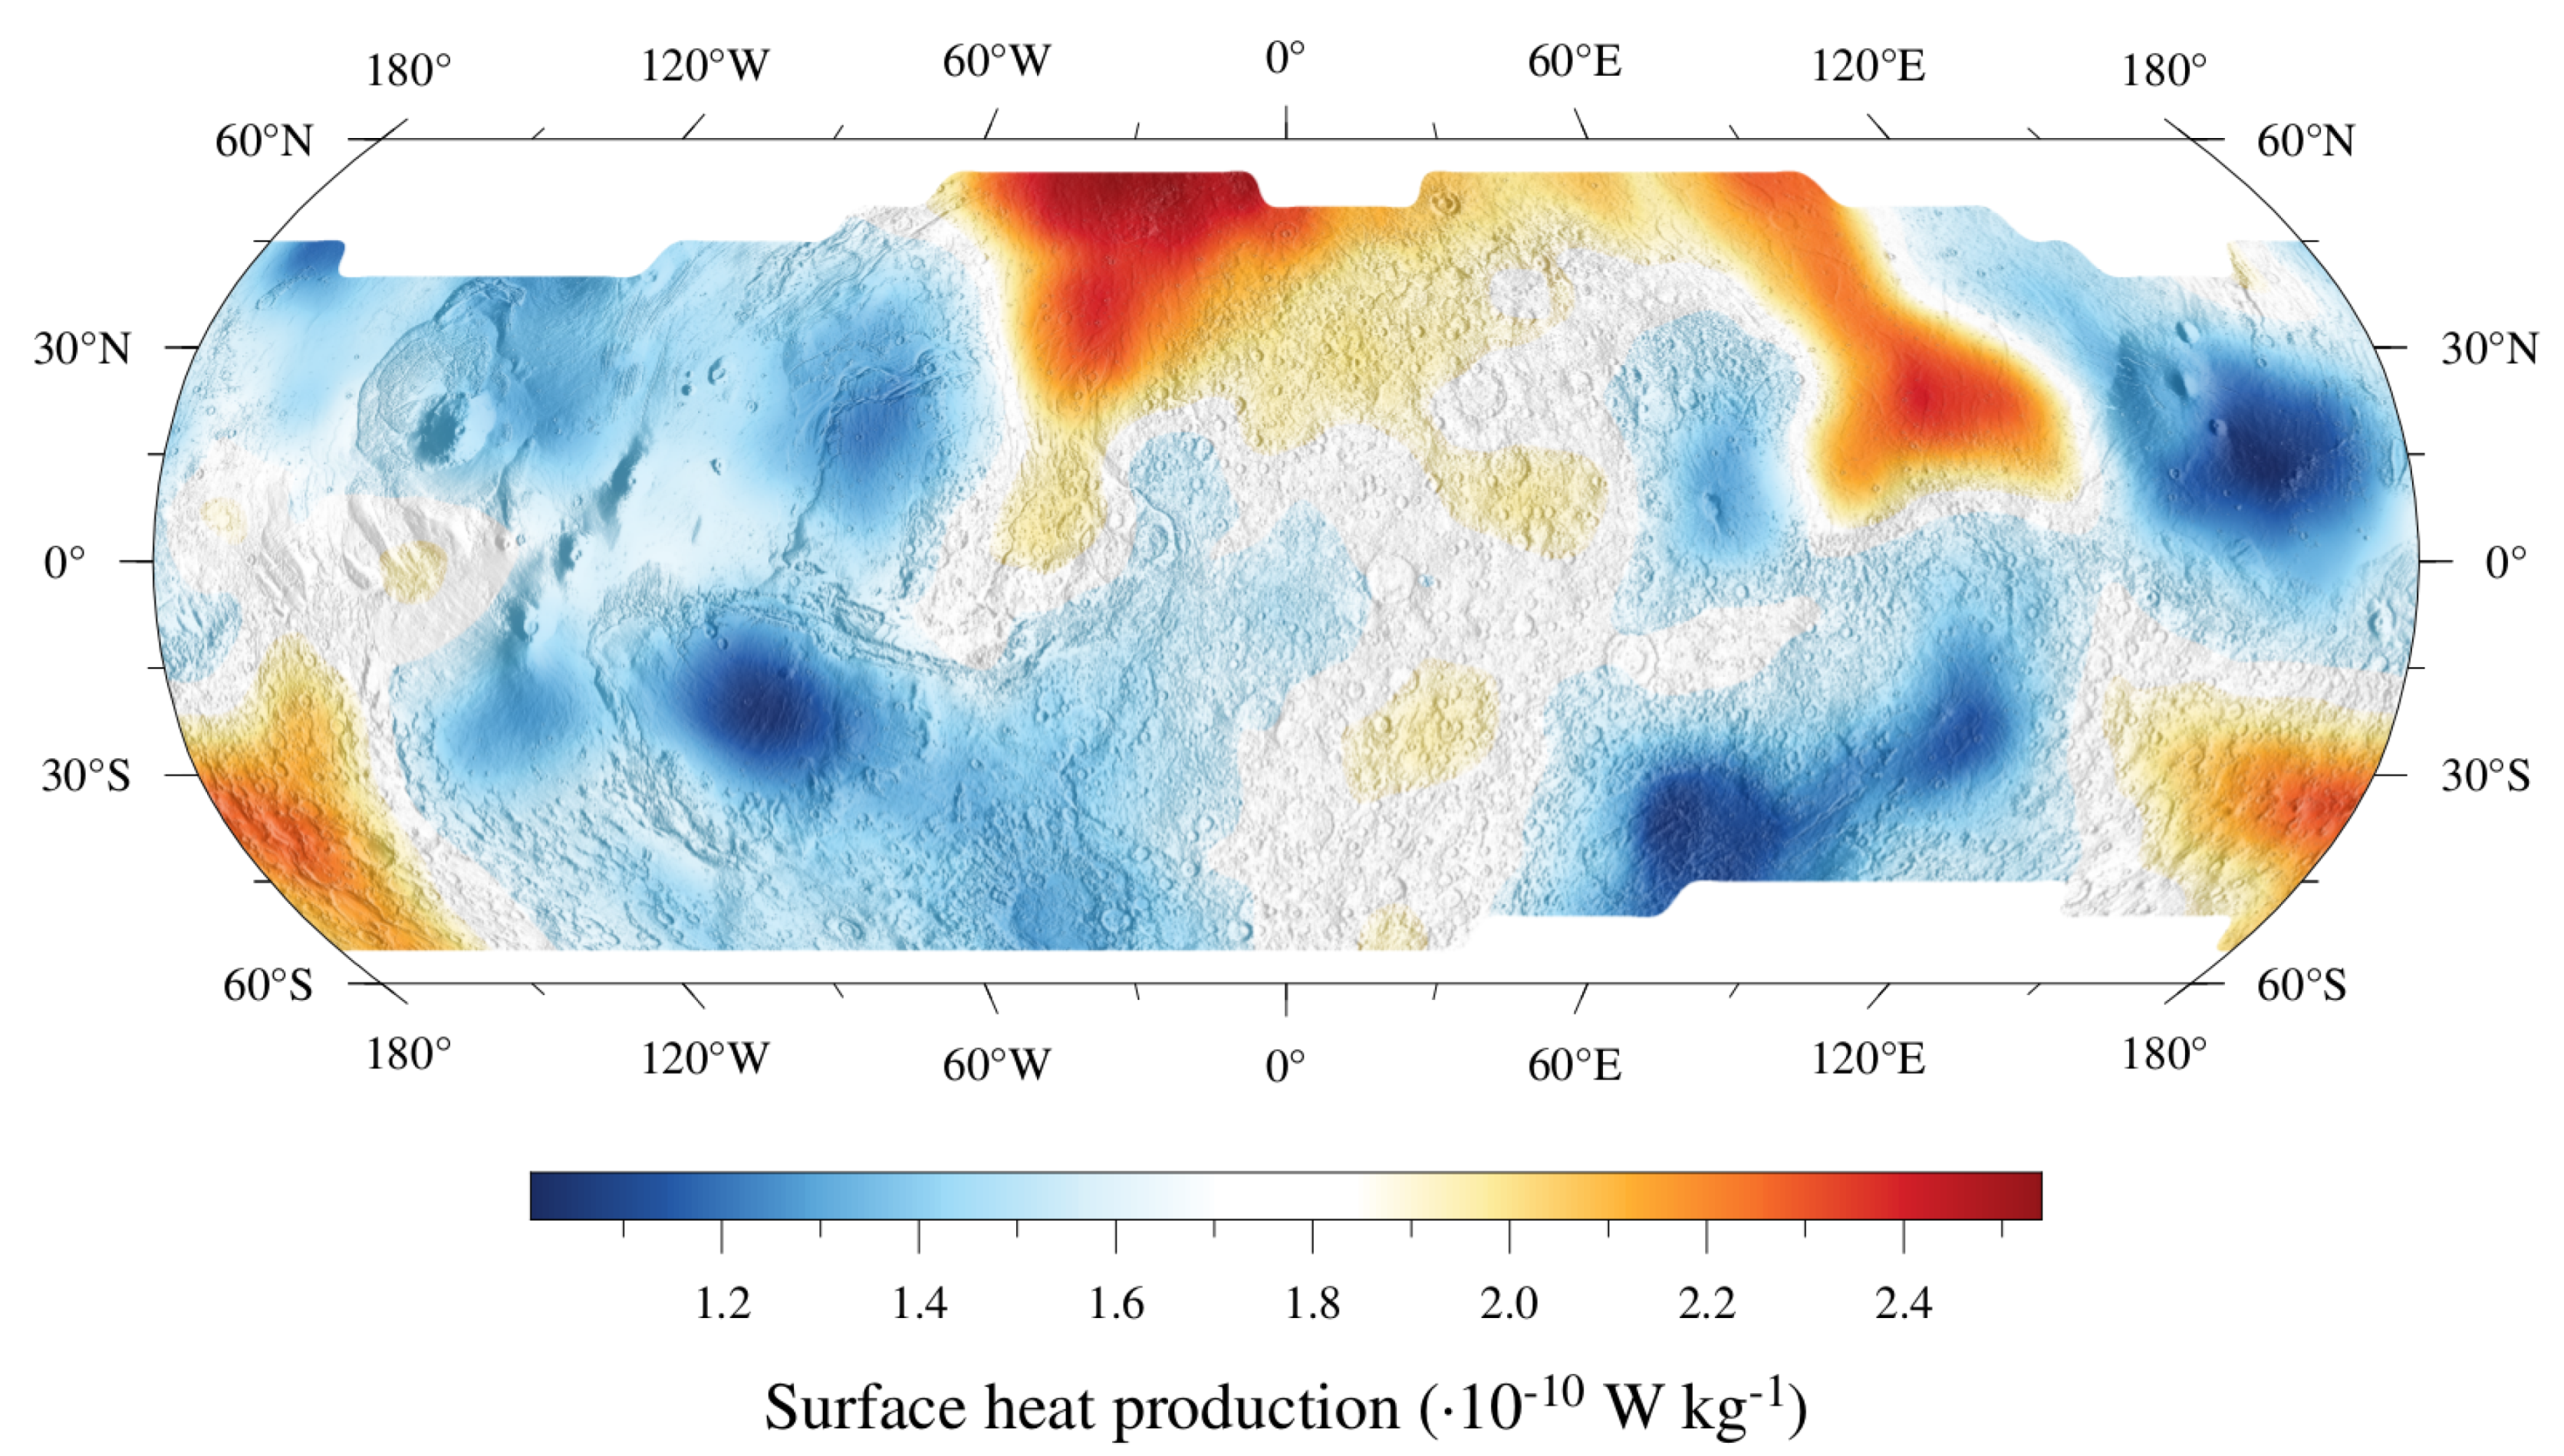
Figure 4.
a) Nominal surface heat flow model at 3.7 Ga for Mars in Hammer projection overlaid shaded relief map of MOLA topography. (b) The same heat flow model but taking into account two large plumes beneath Tharsis and Elysium that add an extra mantle heat flow contribution respect to the model of Figure 4a. Plume contributions have been calculated assuming a central heat flow of 100 mW and areas delineated in Figure 1.
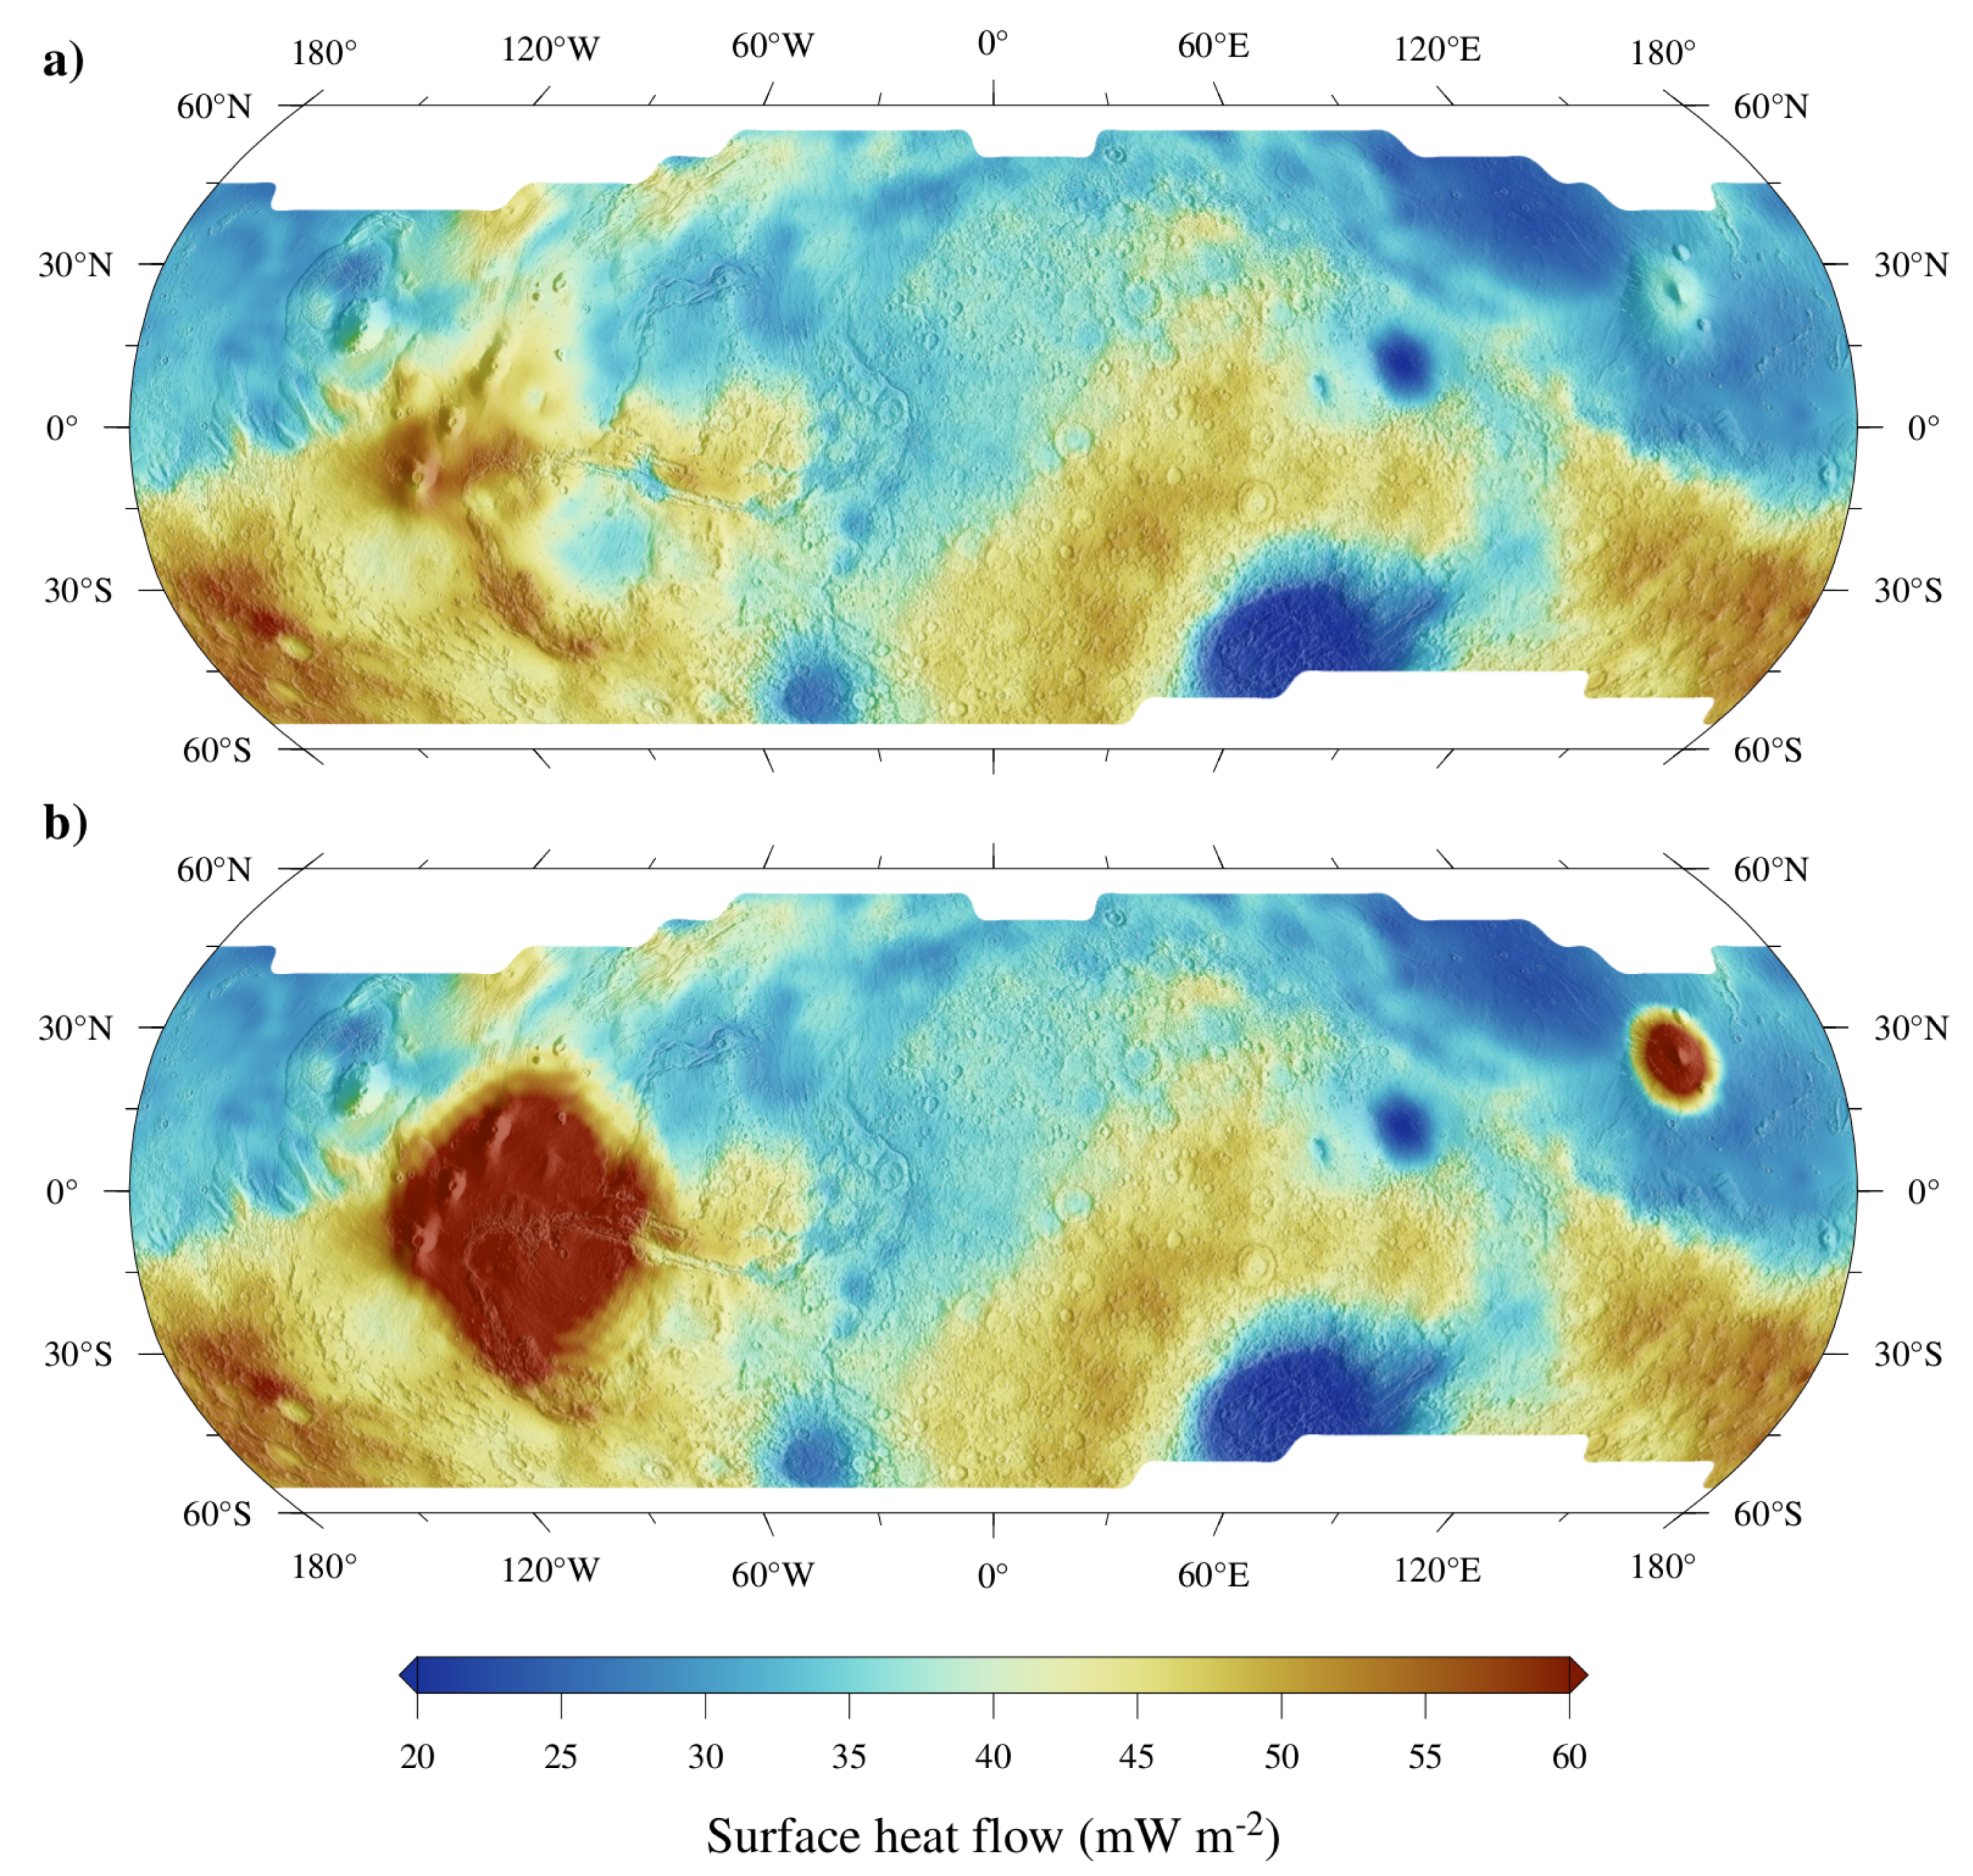
Figure 5.
Variations of average surface heat flow (a) and mantle Urey Ratio (b) as a function of the mantle plumes contribution. In both figures the Nominal model corresponds to the average heat flow value of our reference model (40.8 mW ), whereas the lower and upper limits cover the uncertainty range (between 32 and 50 mW ). The gray line corresponds to the equivalent radioactive component.
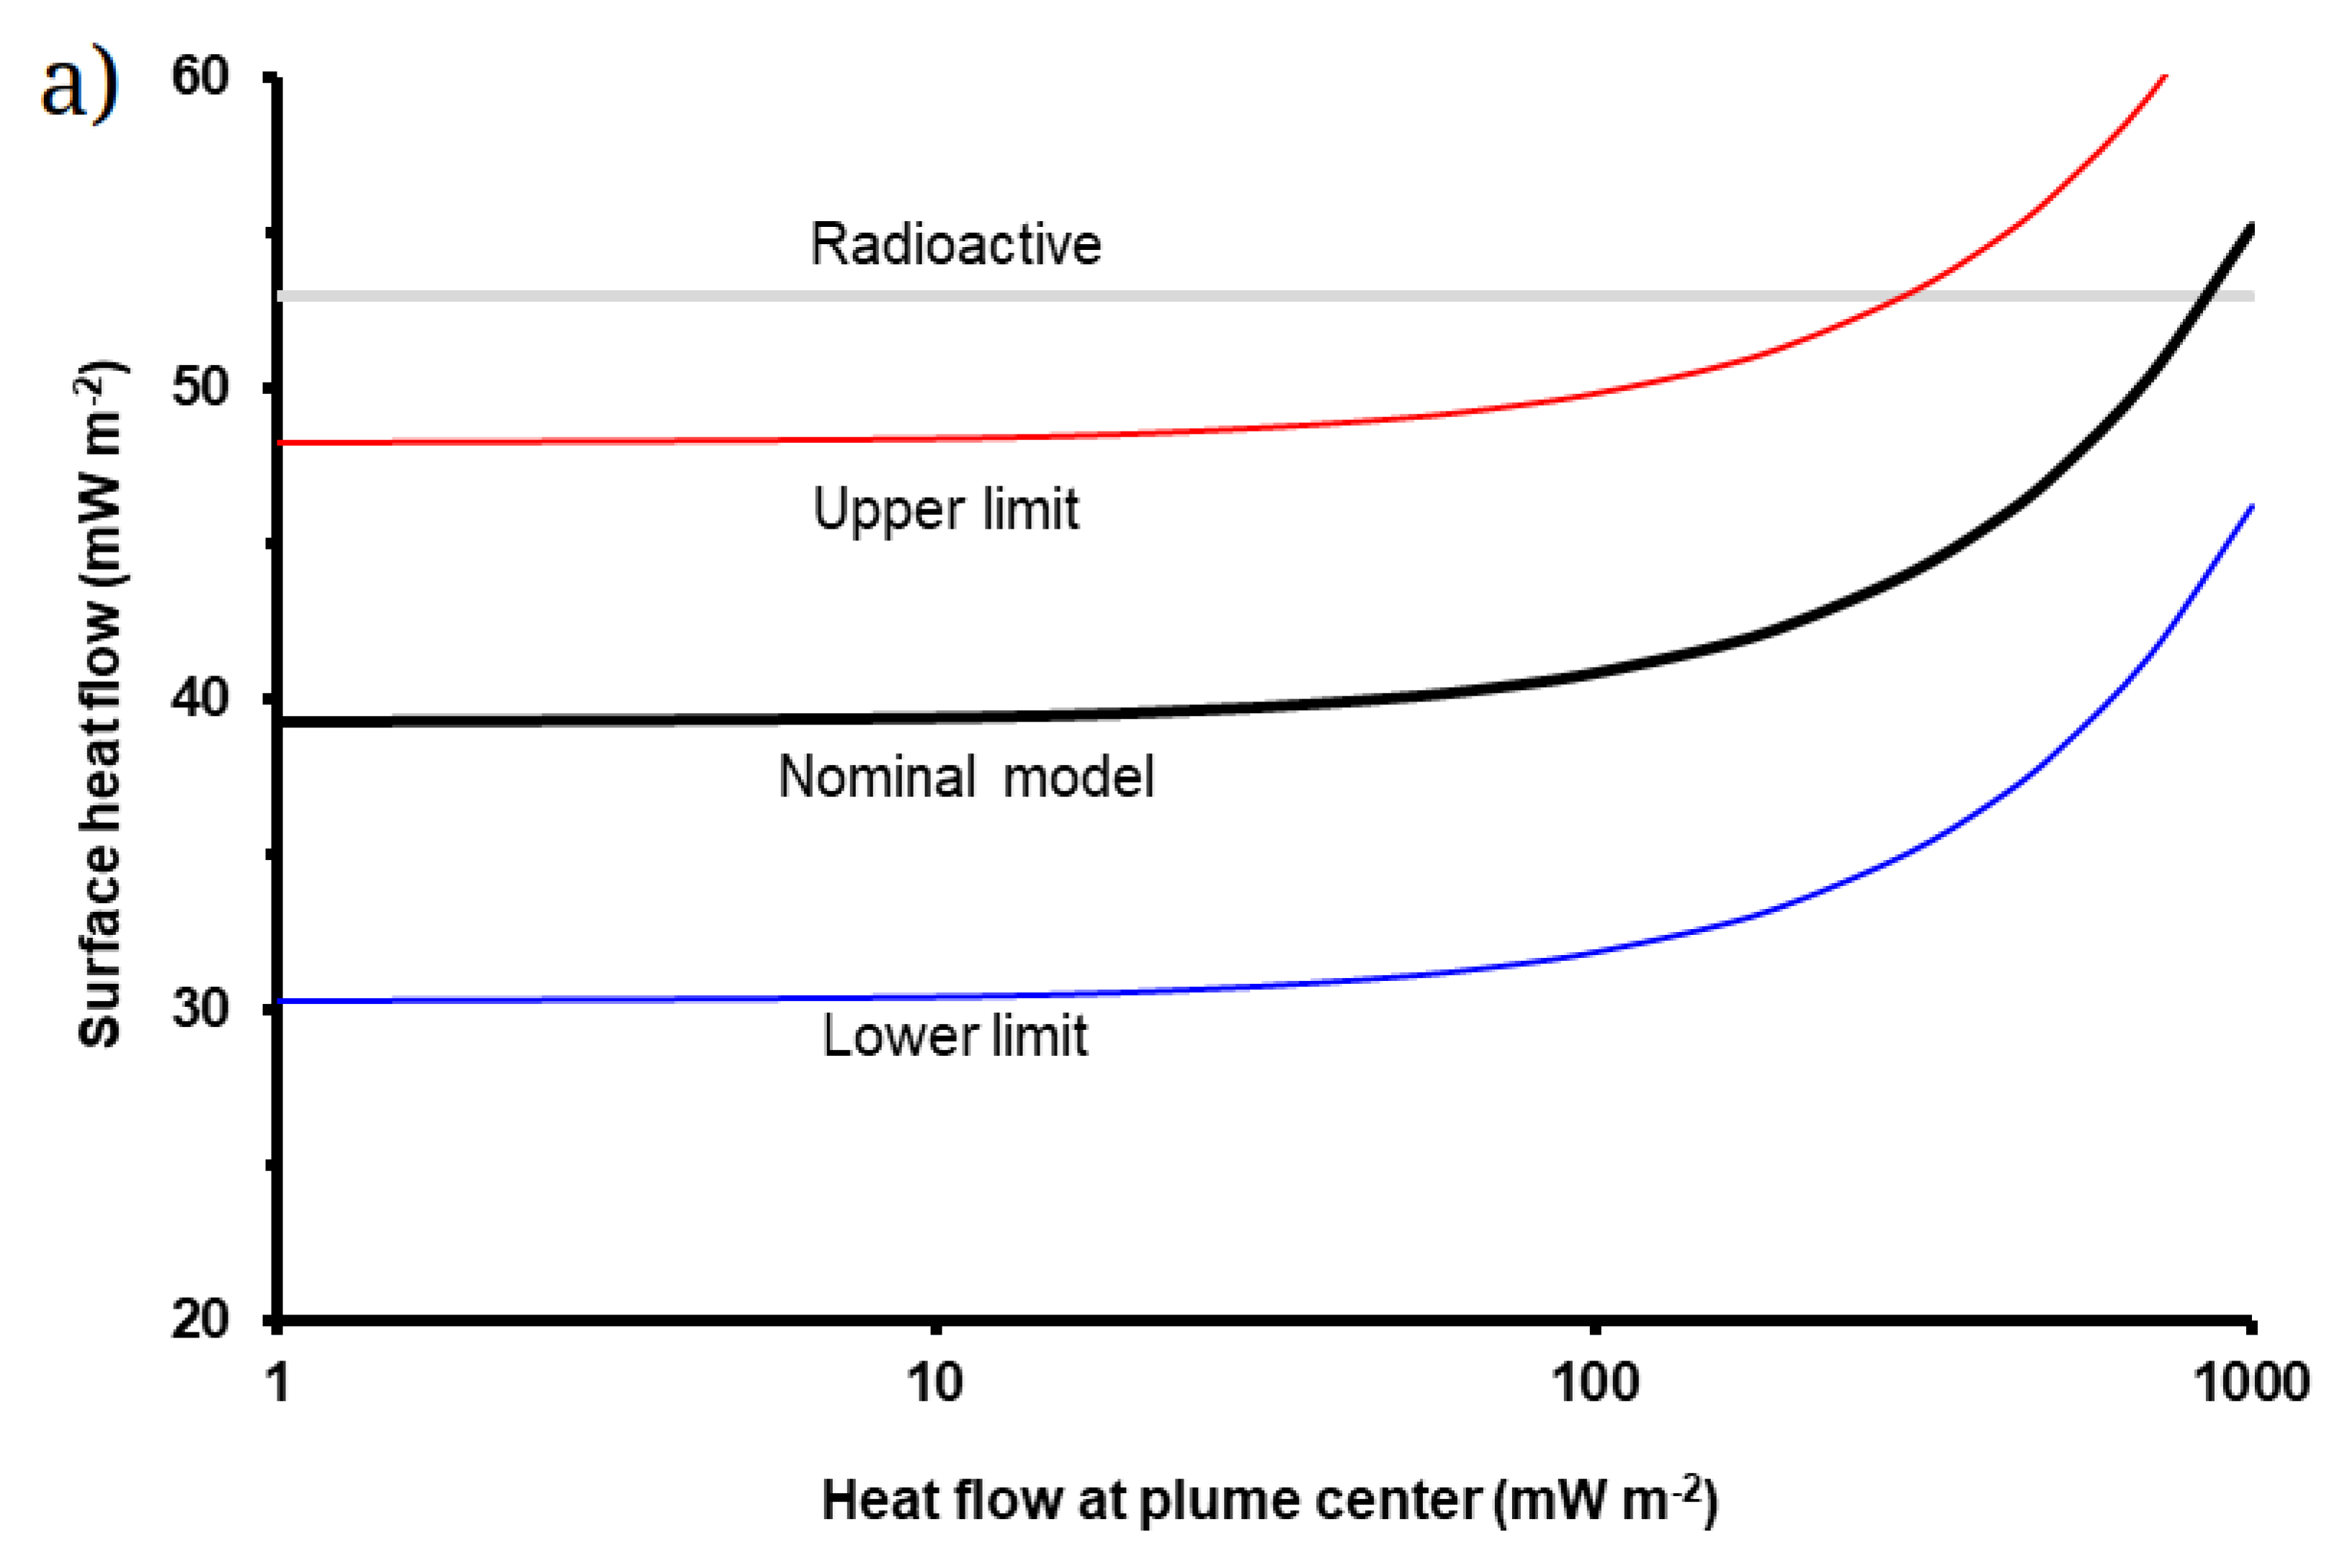
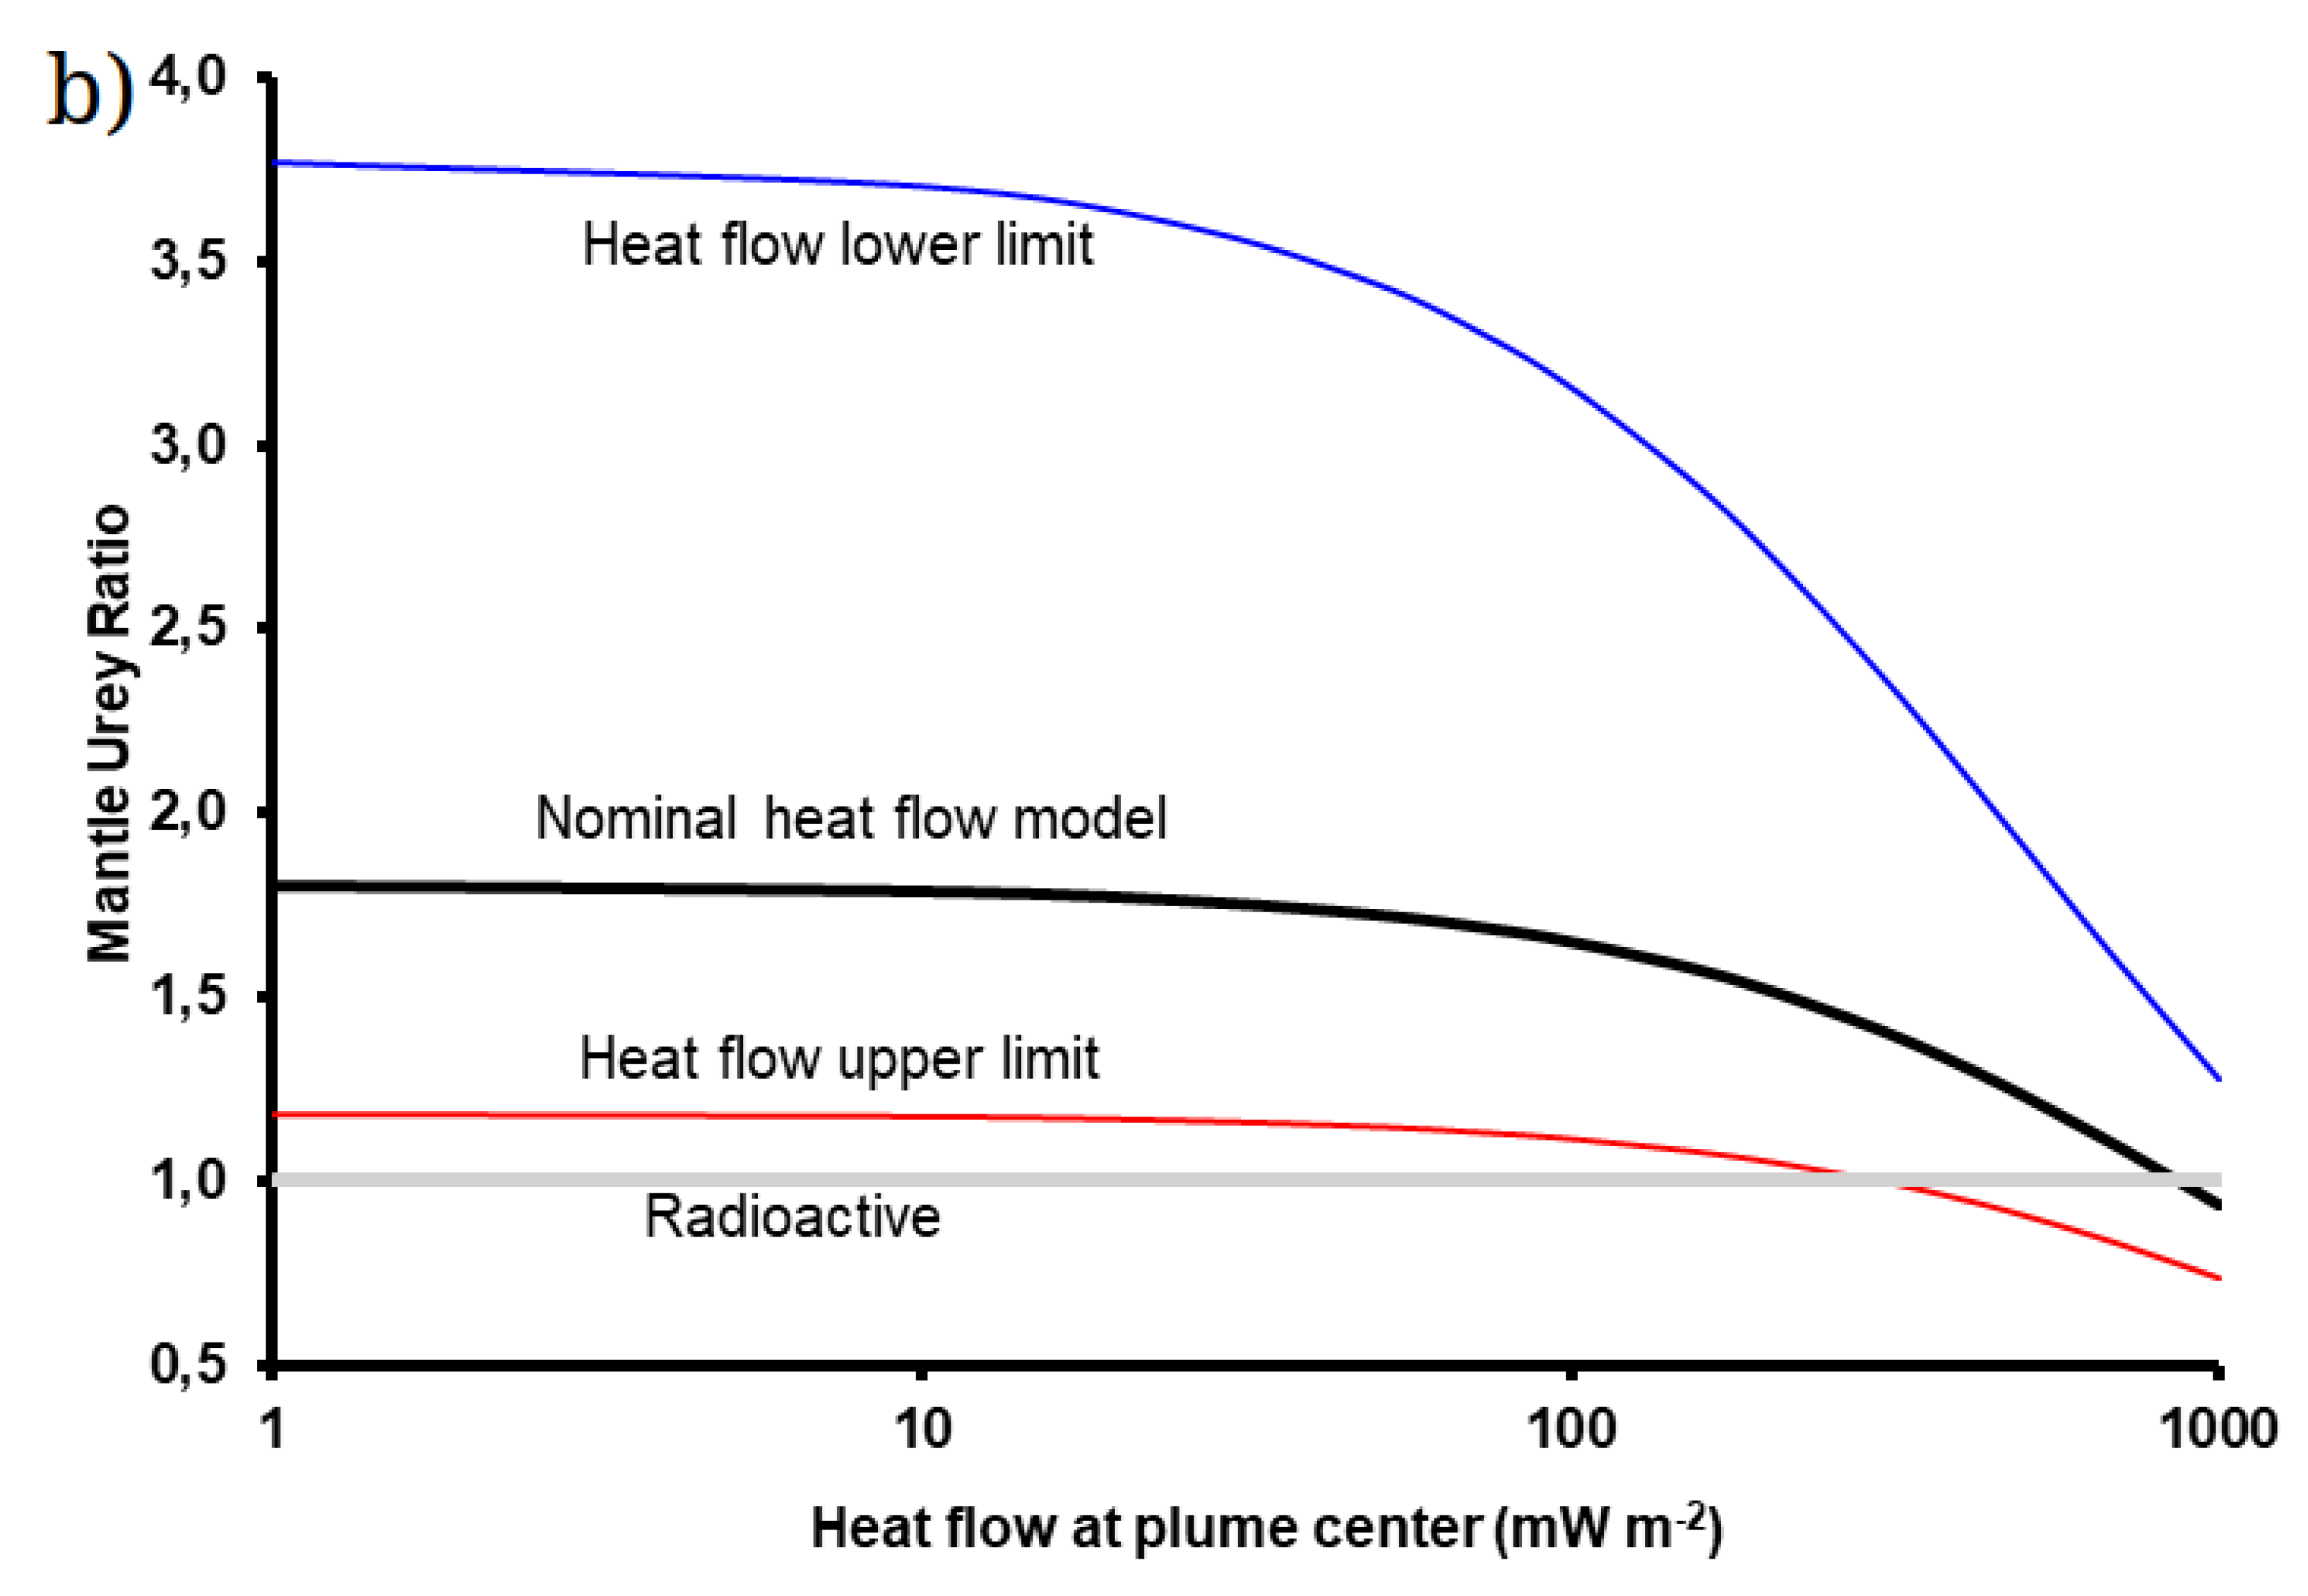

Table 1.
Fault parameters, local heat production, surface heat flow intervals and average calculations at 3.7 Ga.
Table 1.
Fault parameters, local heat production, surface heat flow intervals and average calculations at 3.7 Ga.
| Thrust | BDT depth (km)a | H (W )b | F (mW ) | b (km)c | |
|---|---|---|---|---|---|
| 1. Warrego W | 17-21 | 0.46 | 53.1-43.9 | 98.78 | 1.18-0.98 |
| 2. Warrego E | 21-27 | 0.45 | 43.8-35.8 | 94.56 | 1.04-0.85 |
| 3. Amenthes Rupes | 20-24 | 0.45 | 45.8-35.2 | 58.03 | 1.76-1.35 |
| 4. Ogygis Rupes | 17-18 | 0.39 | 52.6-49.8 | 73.48 | 1.82-1.72 |
| 5. Phrixi Rupes | 16-19 | 0.43 | 56.0-47.7 | 78.58 | 1.67-1.42 |
Disclaimer/Publisher’s Note: The statements, opinions and data contained in all publications are solely those of the individual author(s) and contributor(s) and not of MDPI and/or the editor(s). MDPI and/or the editor(s) disclaim responsibility for any injury to people or property resulting from any ideas, methods, instructions or products referred to in the content. |
© 2024 by the authors. Licensee MDPI, Basel, Switzerland. This article is an open access article distributed under the terms and conditions of the Creative Commons Attribution (CC BY) license (http://creativecommons.org/licenses/by/4.0/).
Copyright: This open access article is published under a Creative Commons CC BY 4.0 license, which permit the free download, distribution, and reuse, provided that the author and preprint are cited in any reuse.


