Submitted:
19 November 2024
Posted:
20 November 2024
You are already at the latest version
Abstract
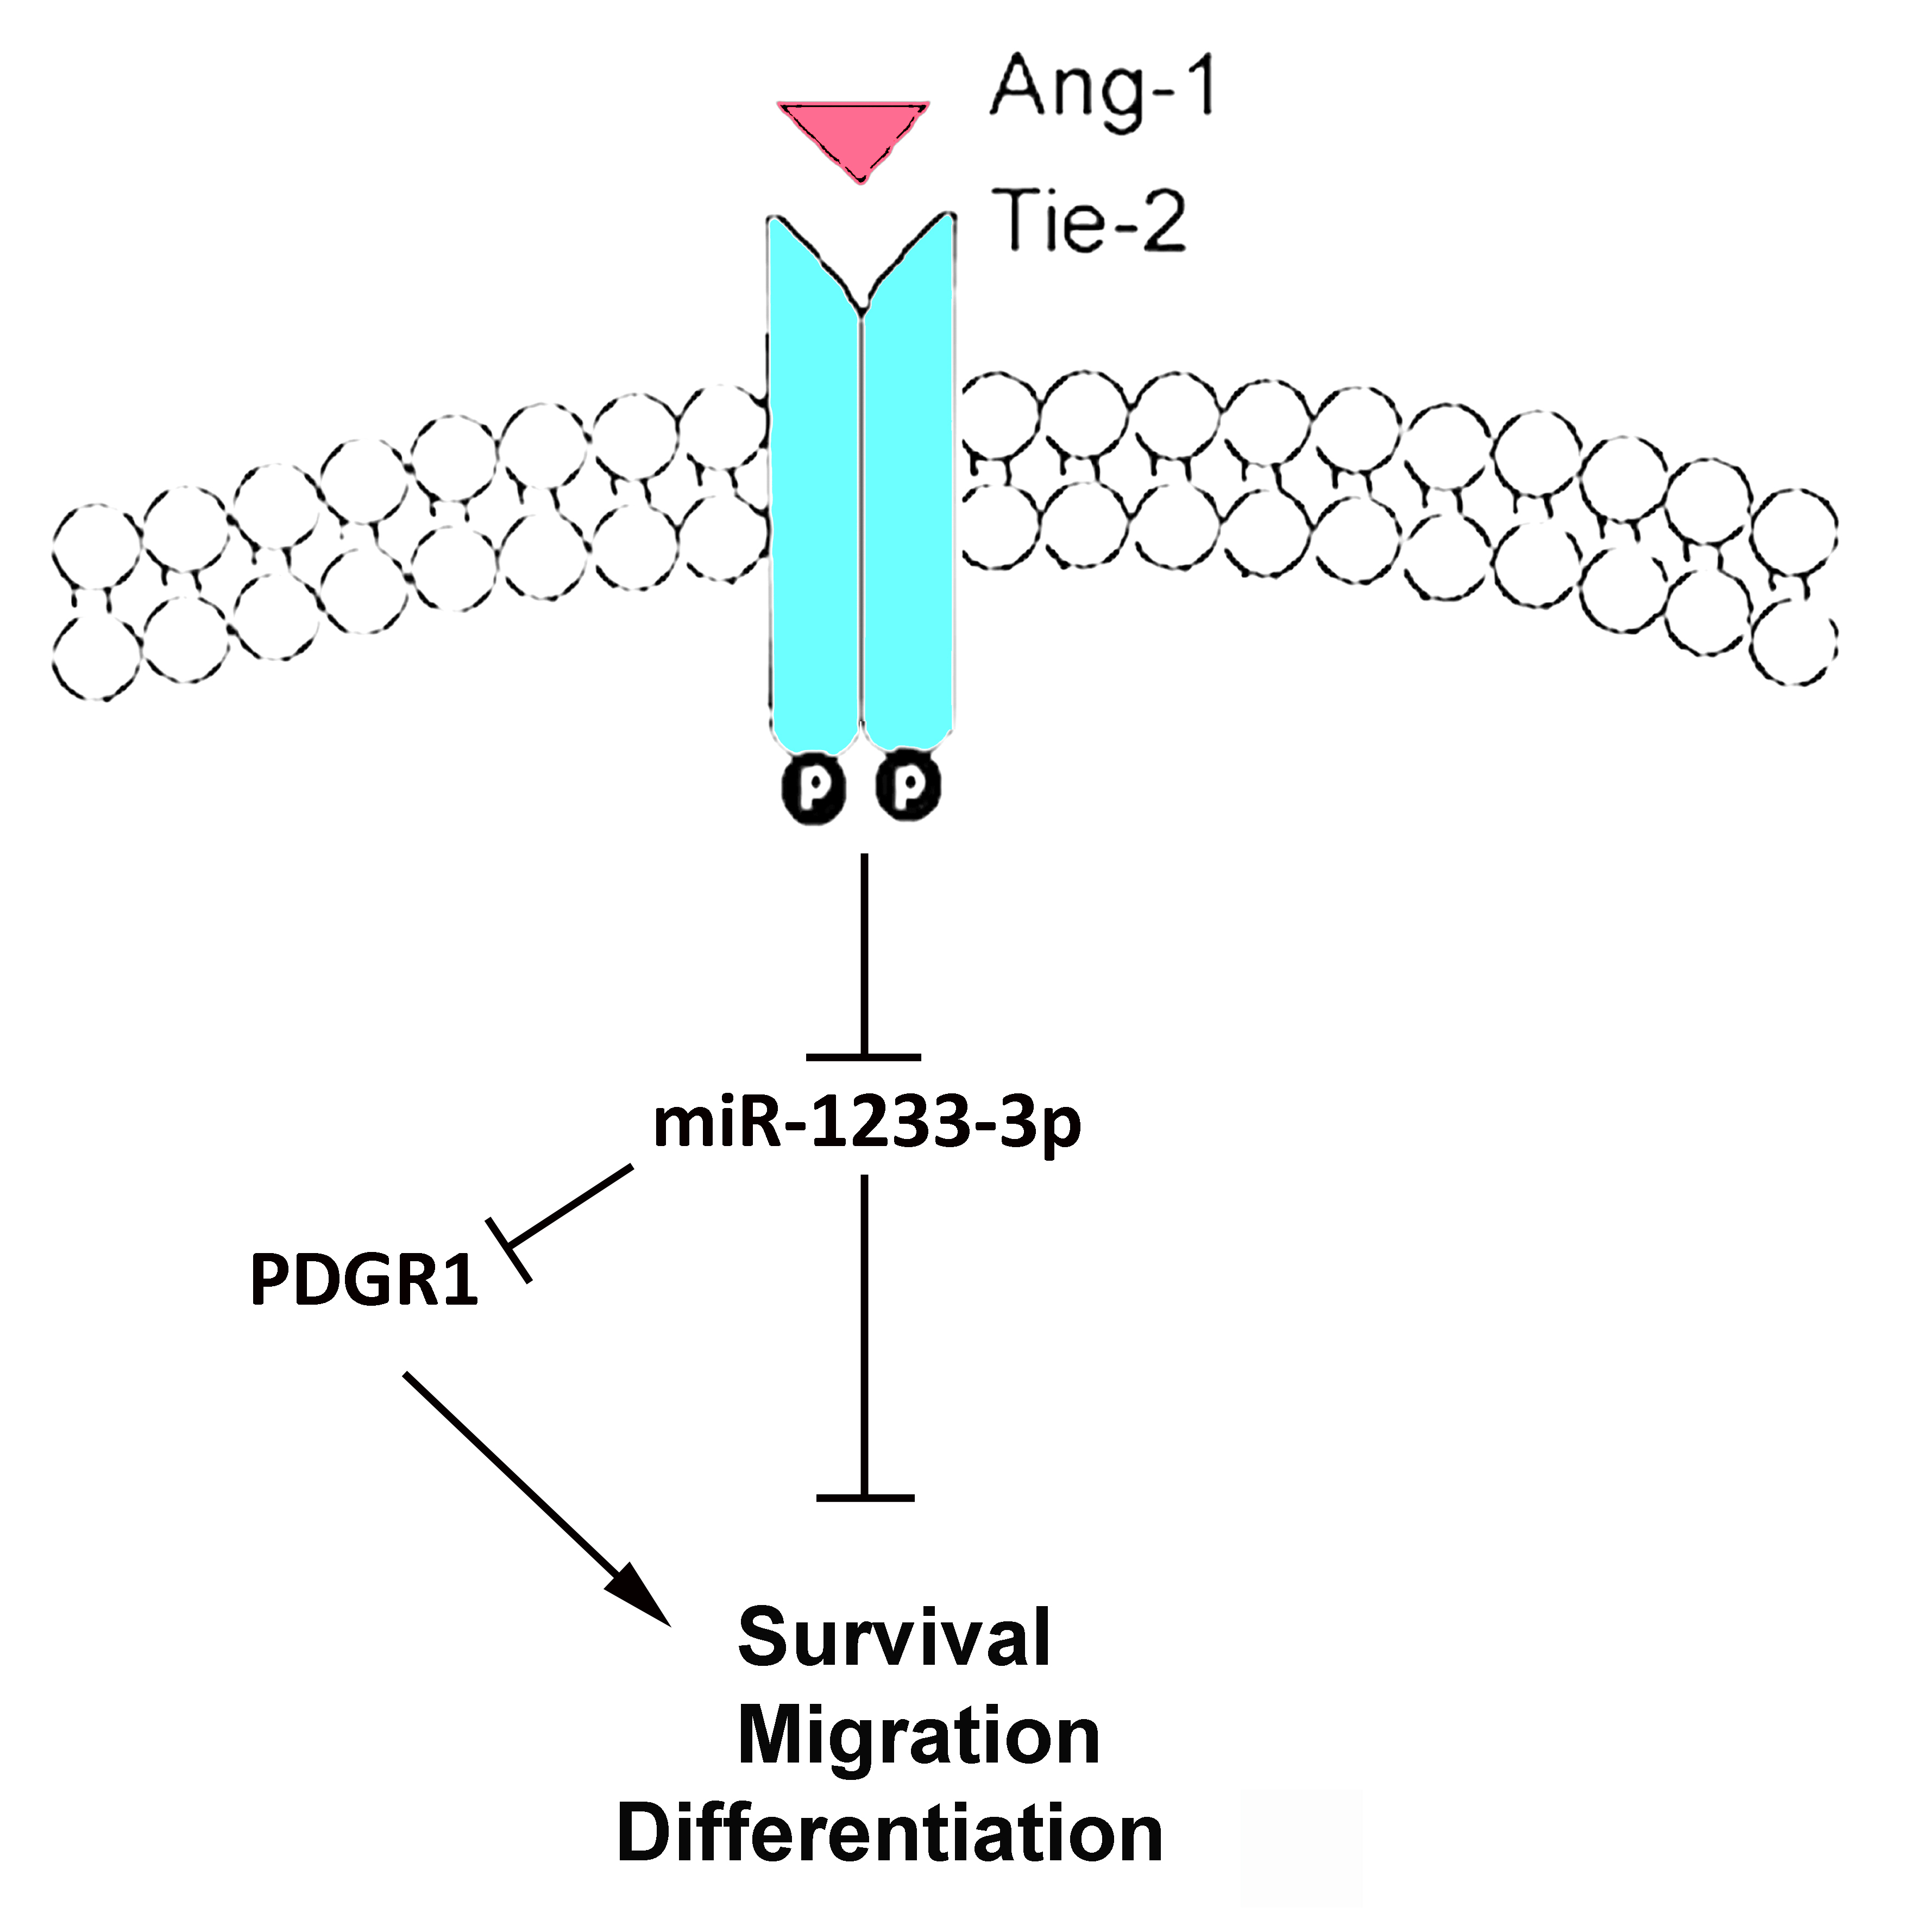
Angiopoietin-1 (Ang-1) and its receptor Tie-2 promote vascular integrity and angiogenesis. microRNAs (miRNAs) are involved in the regulation of many cellular functions, including endothelial cell (EC) survival, proliferation and differentiation. Several reports indicate that these effects of miRNAs on EC functions are mediated through modulation of angiogenesis factor signaling including that of vascular endothelial growth factor (VEGF). To date, very little is known about the roles played by miRNAs in the signaling and angiogenesis promoted by the Ang-1/Tie-2 receptor axis. Our high throughput screening of miRNAs regulated by Ang-1 exposure in human umbilical vein endothelial cells (HUVECs) has identified miR-1233-3p as a mature miRNA whose cellular levels are significantly downregulated in response to Ang-1 exposure. Expression of miR-1233-3p in these cells is also downregulated by other angiogenesis factors including VEGF, fibroblast growth factor 2 (FGF-2), transforming growth factor (TGF) and angiopoietin-2 (Ang-2). Overexpression of miR-1233-3p in HUVECs using specific mimics significantly attenuated cell survival, migration and capillary-like tube formation and promoted apoptosis. Moreover, miR-1233-3p over-expression resulted in reversal of the anti-apoptotic, the pro-migration and pro-differentiation effects of Ang-1. Biotinylated miRNA pull-down assays that p53 and DNA damage regulated 1 (PDRG1) is a direct target of miR-1233-3p in HUVECs. Exposure of HUVECs to Ang-1, angiopoietin-2 (Ang-2), fibroblast growth factor 2 (FGF2), vascular endothelial growth factor (VEGF) or transforming growth factor β (TGF) triggers regulation of PDRG1 expression. This study highlights that miR-1233-3p plays important roles in regulating Ang-1/Tie-2 signaling and angiogenesis in ECs.
Keywords:
Angiogenesis
; Endothelial Cells
; Angiopoietins
; Growth Factors
; microRNAs
; Cell Migration
; Cell Survival
1. Introduction
Vascular development is a complex multi-step process controlled by a number of secreted vascular growth factors, such as the family of angiopoietins [1]. The angiopoietins, of which angiopoietin-1 (Ang-1) and angiopoietin-2 (Ang-2) are best characterized, signal through the receptor tyrosine kinase, Tie-2. Ang-1 is the primary stimulatory ligand of Tie-2 receptors which upon ligation triggers autophosphorylation of these receptors and recruitment and activation of the phosphatidylinositol-3-kinase (PI3K) and the mitogen activated protein kinase (MAPK) pathways [2,3]. During embryonic development, Ang-1 promotes vascular development. Indeed, Ang1-/-mice exhibit embryonic lethality after E9.5 and display decreased branching, increased dilation, reduced vascular complexity and loss of heart trabeculation [5,6,7]. In adult vasculature, Ang-1 enhances endothelial cell (EC) integrity and survival [4] and is required for correct organization and maturation of new vessels. It also promotes quiescence and structural integrity through inhibition of apoptosis and vascular leakage [8].
Endothelial cell (EC) dysfunction contributes to various pathologies, including atherosclerosis, hypertension, and diabetes. Cardiovascular diseases remain a leading cause of morbidity and mortality despite significant advances in treatment [9].
Previously dismissed as "transcriptional noise," non-coding RNAs (ncRNAs) now represent approximately 98% of the mammalian transcriptome and are recognized as crucial players in disease development [10,11]. Among them, microRNAs (miRNAs)- a small class of endogenous ncRNAs- have emerged as key regulators of fundamental vascular processes, including angiogenesis. miRNAs are transcribed from the genome as a primary transcript (pri-miRNA), which is processed by a micro-processing complex into a ~70-nucleotide hairpin structure known as the precursor miRNA (pre-miRNA) [12,13]. The pre-miRNA is then exported to the cytoplasm, where it undergoes further cleavage near the hairpin loop, producing a ~22-base-pair double-stranded molecule called the mature miRNA. This mature miRNA is loaded into one of the Argonaute proteins to form the RNA-induced silencing complex (RISC) [14,15]. Within the RISC, the miRNA duplex is unwound into two single-stranded molecules: the guide strand and the passenger strand. The passenger strand is typically degraded, while the guide strand binds to target mRNA, inhibiting its translation and regulating gene expression.
Numerous studies have highlighted significant alterations in miRNA expression profiles associated with various vascular diseases [16,17]. Gain- and loss-of-function studies have revealed crucial roles for specific miRNAs in regulating angiogenic processes such as endothelial cell (EC) survival, extracellular matrix production, and responses to hypoxia [18,19,20]. However, the roles of miRNAs in Angiopoietin-1 (Ang-1)-induced angiogenesis remain largely unexplored.
We hypothesized that the Ang-1/Tie-2 signaling axis promotes angiogenesis by upregulating a specific set of pro-angiogenic miRNAs while downregulating anti-angiogenic miRNAs. In this study, we focused on the regulation of miR-1233-3p by Ang-1 and its impact on angiogenesis. Our preliminary findings, derived from high-throughput screening of miRNA expression in human umbilical vein endothelial cells (HUVECs) exposed to Ang-1 for 12 to 48 hours, revealed that miR-1233-3p expression is significantly decreased by Ang-1. Furthermore, overexpression of miR-1233-3p was found to inhibit Ang-1-induced EC survival, migration, and capillary-like tube formation.
2. Materials and Methods
All experiments were done at least in triplicates.
2.1. Materials
Recombinant human Ang-1 and Ang-2 were purchased from R&D Systems (Minneapolis, MN). Vascular endothelial growth factor (VEGF), fibroblast growth factor 2 (FGF-2) and transforming growth factor beta (TGFβ) were purchased from Bioshop (Ontario, Canada). Antibodies for PDRG1 (cat# SAB4503242), β-ACTIN, and β-TUBULIN were purchased from Sigma-Aldrich (St. Louis, MO). HUVECs were purchased from Lonza (Basel, Switzerland). PDRG1 expression vector was purchased from Origene (MD, USA. RC203661). Control and miR-1233-3p mimics (mirVana® miRNA mimics 4464066) and inhibitors (mirVana® miRNA inhibitors 4464084) were purchased from Ambion (Austin, TX).
2.2. Cell Culture
HUVECs were grown in MCDB131 medium (Life Technologies, Rockville, MD) supplemented with 20% fetal bovine serum (FBS), EC growth supplement, 2 mM glutamine, heparin, and gentamicin sulfate (Invitrogen, Carlsbad, CA). This medium was designated as complete medium. Cells were incubated at 37°C and 5% CO2.
2.3. Growth Factor Treatment
HUVECs were seeded (30,000 cells per cm2) in complete medium. The medium was then changed to MCDB131 medium without supplements, FBS or antibiotics (basic medium). After 6 hours, 2%FBS and aliquots of phosphate buffered saline (PBS, control condition), Ang-1 (300 ng/ml), Ang-2 (300 ng/ml), FGF-2 (10 ng/ml), VEGF (40 ng/ml) or TGF-β (2 ng/ml) were added to the culture medium and cells were collected at different time points.
2.4. miRNA Abundance Studies
HUVECs were lysed and tRNA extracted using Qiagen miRNA extraction kit. Reverse transcription (RT) was done using AB TaqMan® miRNA RT kit specific to miR-1233-3p and miR-126-5p. Droplet digital PCR was done using QuantaStudio3D with 1µl of cDNA and analyzed using QuantStudio™ 3D AnalysisSuite™ Software.
2.5. miRNA Extraction and Quantitative Real-Time PCR
Cell were lysed with Quiazol® to extract total RNA. miRNeasy Mini Kit was used according to manufacturer’s protocols to purify miRNAs. RT was done using NCode™ miRNA amplification system (Invitrogen, California, USA). Real-time PCR was performed with specific primers (supplementary table 1), Platinum SYBR® (Invitrogen), and a 7500 Real-Time PCR System. Detection of Pri-miR-1233 was done with TaqMan® assays (Applied Biosystem, CA). All experiments were performed at least in triplicates. miRNA expression was determined by the CT method, where CT values of individual miRNA data were normalized to CT values of U6 snRNA as previously described [21]. miRNA-specific amplification was confirmed by a single peak in the melting-curve analysis.
2.6. mRNA Extraction and Quantitative Real-Time PCR
Total RNA was extracted using Ambion PureLink RNA mini kit according to manufacturer’s protocol. Gene expression was detected using specific primers (supplementary table 1), Power SYBR ® (Invitrogen), and a 7500 Real-Time PCR System (Applied Biosystems, CA). β-ACTIN was used as a housekeeping gene. All experiments were performed at least in triplicates. Relative mRNA expression was determined using the comparative threshold (CT) method as previously described [21]. For miRNA pull-down assays, GAPDH was used as housekeeping gene.
2.7. Tie-2 Blocking Assays
HUVECs were seeded (30,000 cells per cm2) and were pre-treated for 1 hour with 50 μg/ml of neutralizing Tie-2 IgG or control IgG antibodies. The cells were then incubated in basic culture medium supplemented with 2% FBS and aliquots of PBS or Ang-1 (300ng/ml). Cells were collected 24 hours later.
2.8. Exosomes Extraction
HUVECs were seeded (30,000 cells per cm2), and were maintained in basic medium without FBS for 6 hours. Cells were then maintained for 24 hours in basic medium containing aliquots of PBS or Ang-1 (300ng/ml). The medium was then collected and used to extract Exosomes according to manufacturer’s instructions (miRCURY™ Exosome Isolation Kit, Exiqon, Vedbaek, Denmark). miRNAs from isolated exosomes were then extracted as described above.
2.9. Transfection miRNA Mimics and Inhibitors
HUVECs where transfected at a confluence of 50-70% using 25 nM of control mimic, miR-1233-3p mimic (mirVana®, 4464066), 50 nM of control inhibitor or miR-1233-3p inhibitor (mirVana®, 4464084). Mimics and inhibitors were transfected using Lipofectamine™ RNAiMAX (Invitrogen) according to the manufacturers’ instructions. PDRG1 expression plasmid was transfected into HUVECs (10 μg of plasmid per 2 million cells) using jetPRIME™ Polyplus transfection reagent (Illkirch, FRANCE) according to manufacturer’s protocol. Experiments were performed 48 hours post-transfection.
2.10. Cell Counting
miRNA mimic- or inhibitor-transfected HUVECs were seeded (30,000 cells per cm2) and maintained in complete medium, basic medium, or basic medium containing Ang-1 (300 ng/ml). Cells were counted 24 hours later using a hemocytometer.
2.11. Caspase-3 Activity
miRNA mimic- or inhibitor-transfected cells were plated in 12-well plates and maintained in complete, basic, or basic MCDB131 medium containing Ang-1 (300 ng/ml). Caspase-3 activity was measured 24 hours later using an EnzChek® Caspase-3 Assay Kit with Z-DEVD-AMC as a substrate (Molecular Probes, Eugene, OR).
2.12. Cell Migration
A scratch (wound) healing assay was used to assess cell migration. In brief, HUVEC monolayers were wounded using a 200 μl pipette tip and maintained for 8 hours in basic MCDB131 medium containing 2% FBS and aliquots of PBS (control) or Ang-1 (300 ng/ml). Wounded areas were visualized using an Olympus inverted microscope, quantified using Image-Pro Plus™ software (Media Cybernetics, Bethesda, MD), and reported using the following formula: % wound healing = [1 – (wound area at t8 h/wound area at t0)] x 100, where t0 is the time immediately following wounding.
2.13. Capillary-Like Tube Formation
miRNA mimic- or inhibitor-transfected cells were seeded onto 96-well plates pre-coated with growth factor-reduced Matrigel® (12,500 cells per well) and maintained for 24 hours in Lonza EGM™-2 medium (minus VEGF) containing aliquots of PBS (control) or Ang-1 (300 ng/ml). Whole-well images were captured using an Olympus inverted microscope. Angiogenic tube formation was determined by measuring total tube length and average tube length using the Angiogenesis Analyzer macro for Fiji/ImageJ [22].
2.14. Proliferation
miRNA mimic- or inhibitor-transfected cells were plated in 96-well plates at 7,000 cells per well and maintained in complete Lonza EGM™ medium (minus VEGF). One hour after plating, a bromodeoxyuridine (BrdU) (Millipore, Etobicoke, ON) assay was performed according to the manufacturer’s instructions. BrdU absorbance was measured 24 hours later.
2.15. Immunoblotting
Cells were lysed using RIPA buffer (Sancta Cruz Biotechnology, TX). Denatured proteins were separated on SDS-polyacrylamide gel electrophoresis (PAGE) and electro-transferred onto polyvinylidene difluoride (PVDF) membranes (Bio-Rad Laboratories, CA). Membranes were blocked with 5% (w/v) low-fat milk for 1h at room temperature and probed with the primary antibody at 4°C overnight. After washing, membranes were incubated for 1h at room temperature with horseradish-peroxidase-conjugated secondary antibodies (Jackson ImmunoResearch, Newmarket, UK) or Alexa Fluor® Plus conjugated secondary antibodies (Thermo fisher Scientific, CA). Proteins were detected by enhanced chemiluminescence reagents (Pierce, CA) in the case of horseradish-peroxidase antibodies. Bands intensities were quantified using ImageJ software.
2.16. Biotin-Labeled Pull-Down Assays
Biotin-labeled miR-1233-3p mimic was designed according to Wang et al., and Cloonan et al., and ordered from IDT (Skokie, IL) [23,24]. Pull-down with target mRNAs was performed as described earlier with some modifications [24,25]. Briefly, HUVECs were transfected with 50 nM of biotinylated-control mimic or biotinylated-miR-1233-3p mimic. After 48 hours, cells were lysed with a hypotonic lysis buffer ((100 mM KCl, 5 mM MgCl2, 20 mM Tris-Cl pH 7.5, 5 mM DTT, 0.3% NP-40, 60U/mL RNase OUT (Invitrogen, CA) and 1X Complete Mini protease inhibitor (Roche, Basel, Switzerland)). Simultaneously, magnetic streptavidin beads (Dynabeads M-280 Streptavidin, #11205D, Invitrogen) were coated with 1 μg/μl bovine serum albumin and 1 μg/μl yeast tRNA (Invitrogen), and incubated with the supernatants while rotating at 4°C for 2 hours. Cell debris was cleared by centrifugation (≥10,000 g at 4°C for 15 minutes) and cleared lysates were then incubated with the pre-coated beads rotating overnight at 4°C. Beads were then washed with hypotonic lysis buffer and RNA was then released by adding 750 µl if TRIzol (Invitrogen) and 250 µl of RNase-free water. RNA was then precipitated using standard chloroform-isopropanol method and was then subjected to reverse transcription and qPCR for detection of specific transcripts.
2.17. Statistical Analysis
Statistical analyses were performed using Graph Pad Prism 5.0 software (GraphPad® Software Inc., San Diego, CA). In experiments were more than two groups were compared, Two-way ANOVA followed by Bonferroni post-hoc analysis was utilized. For experiments where only two groups were compared, a paired student’s T-test was employed. Differences were considered statistically significant at P<0.05.
3. Results
3.1. Regulation of miR-1233-3p by Ang-1
Figure 1 illustrates the time course of miR-1233-3p expression in HUVECs in response to Ang-1 exposure. Ang-1 increased miR-1233-3p expression after 4 hours of exposure, however, the expression of this miRNA decreased significantly after 6, 24, 48 and 72 hours of exposure to Ang-1 (Figure 1A& B). Unlike the effect on mature miR-1233-3p levels, Ang-1 exposure had no effect on the expression of pri- and pre-miR-1233 levels (supplementary figure 1A-D). Interestingly, the expression of miR-1233-5p, the sister arm of miR-1233-3p, was also significantly decreased in response to 24 and 72 hours of Ang-1 exposure (supplementary figure 1E-F). These data suggest the Ang-1 regulates the expression of both mature forms of miR-1233; however, Ang-1 had no effect on the levels of the precursor or the primary transcripts of miR-1233. mirR-1233 is an intronic miRNA located within GOLGA8A and GOLGA8B, two highly similar genes from the same family. To further test the possibility of Ang-1 regulated miR-1233-3p through transcriptional activation of GOLGA8A, the expression of the GOLGA8A mRNA was measured after stimulation with Ang-1 (300ng/ml). Ang-1 exposure had no effect on GOLGA8A mRNA levels as compared to PBS (Figure 1C).
Exosomes contain a variety of molecules including miRNAs and exosomal miRNA levels have been reported to be significantly altered under various physiological conditions [26,27,28]. To evaluate whether downregulation of mature miR-1233-3p levels in response to Ang-1 exposure was due to its increased secretion in exosomes, expression was measured in exosomes isolated from HUVECs exposed to Ang-1 for 24, 48 and 72 hours. Figure 1D shows that miR-1233-3p exosomal levels were not altered in response to Ang-1 exposure.
The importance of Tie-2 receptors in the inhibitory effect of Ang-1 on miR-1233-3p expression was assessed by using a selective blocking Tie-2 antibody. Exposure to Ang-1 for 24 hours significantly decreased miR-1233-3p expression in the presence of control antibody but not in the presence of blocking Tie-2 antibody confirming that Ang-1 exposure decreases miR-1233-3p levels through Tie-2 receptor signaling (Figure 1E).
To determine the effects of other angiogenic factors on the expression of miR-1233-3p, HUVEC were exposed to Ang-2, FGF-2, VEGF, or TGFβ for 24 hours. TGFβ and FGF-2 significantly increased while VEGF and Ang-2 significantly decreased miR-1233-3p expression (Figure 1F).
To evaluate the abundance of miR-1233-3p in ECs, we used droplet digital PCR. In HUVECs, the most abundantly expressed vascular miRNA is miR-126-5p with ~6500 copies/µl. By comparison, miR-1233-3p only had an average of ~85 copies/µl suggesting that this miRNA is not abundantly expressed in ECs (supplementary figure 2). We also found miR-1233-3p is expressed in several other cell types including human microvascular endothelial cells (HMEC-1), airway epithelial cells baring mutation in the CF2 gene, monocytes (THP1), B-lymphocytes (Ramos), lung epithelial cells (Ramos) (supplementary figure 3).
3.2. Regulation of EC Survival by miR-1233-3p
Ang-1 promotes survival, migration, differentiation and inhibits apoptosis in ECs [4]. To assess the role of miR-1233-3p in Ang-1-induced angiogenic processes, HUVECs were transfected mimics or inhibitors and exposed to Ang-1 (300ng/ml) or PBS. The effects of miR-1233-3p mimics and the inhibitors were verified after transfection by measuring the levels of HOXB3, a direct target of miR1233-3p (supplementary figure 4 and 5). Cells transfected with control or miR-1233-3p miRNA mimics were maintained for 24 hours in complete medium, basic medium (0% FBS), or basic medium containing an aliquot of Ang-1 (300 ng/ml). With the control mimic, cell number decreased under serum deprivation conditions (basic medium) (Figure 2A). The addition of Ang-1 to basic medium resulted in an increase in cell number relative to that which was observed with basic medium alone (Figure 2A). With miR-1233-3p mimic, cell number decreased significantly when maintained in complete medium compared to those transfected with control mimic (Figure 2A). Increases in cell number were also observed in miR-1233-3p mimic-transfected cells exposed to Ang-1; however, absolute cell number remained significantly lower than with control mimic and exposed to Ang-1 (Figure 2A). To investigate whether proportional changes in the number of apoptotic cells relate to the ameliorative effects of mimics on total cell number, caspase-3 activity was measured. With the control mimic, caspase-3 activity increased under serum deprivation. The addition of Ang-1 attenuated this increase, thereby confirming that Ang-1 exerts an anti-apoptotic effect on ECs (Figure 2B). With miR-1233-3p mimic, caspase-3 activity increased under serum deprivation to levels higher than those observed with the control mimic. Caspase-3 activity did not decrease under serum deprivation when Ang-1 was added to miR-1233-3p mimic-transfected cells (Figure 2B).
Effects of endogenous miR-1233-3p on EC survival were assessed by transfecting HUVECs with miR-1233-3p inhibitor. With the control inhibitor, cell number decreased, and caspase-3 activity increased under serum deprivation (Figure 2C&D). With miR-1233-3p inhibitor, cell number in complete medium increased significantly as compared to control inhibitor (Figure 2C). In addition, with miR-1233-3p inhibitor, cell number decreased under serum deprivation, as compared to complete medium, but was higher than it was with the control inhibitor (Figure 2C). With the control inhibitor, caspase-3 activity increased under serum deprivation, as compared to complete medium and the presence of Ang-1 attenuated this response (Figure 2D). With miR-1233-3p inhibitor, caspase-3 activity under serum deprivation increased as compared to complete medium and the presence of Ang-1 attenuated this increase (Figure 2D). With miR-1233-3 inhibitor, caspase-3 activities measured with complete medium, basic medium and basic medium+Ang-1 were significantly lower than those measured in the same conditions in cells transfected with control inhibitor (Figure 2D). These results indicate that endogenous levels of miR-1233-3p exert inhibitory effects on EC survival and stimulatory effects on caspase-3 activity.
3.3. Regulation of EC Migration by miR-1233-3p
With miR-1233-3p mimic-transfected HUVECs in basic medium containing PBS, basal cell migration decreased as compared to that observed with the control mimic (Figure 2E). Exposure to Ang-1 increased cell migration in control mimic-transfected HUVECs but not in those transfected with miR-1233-3p mimic (Figure 2E). To evaluate whether endogenous miR-1233-3p levels regulate EC migration, a wound healing assay was used to measure cell migration in control and inhibitor-transfected cells. miR-1233-3p inhibitor increased migration in basal medium containing PBS or Ang-1, suggesting that endogenous levels of this miRNA exert a negative influence on cell migration (Figure 2F).
3.4. Regulation of EC Differentiation by miR-1233-3p
Capillary-like tube formation assays were used to evaluate the functional regulatory roles of miR-1233-3p on EC differentiation in cells exposed to PBS (control) or Ang-1. Relative to PBS exposure, average tube length increased by ~1.5 fold in control mimic-transfected cells exposed to Ang-1 (Figure 3A). In miR-1233-3p mimic-transfected cells, average tube length measured in the presence of PBS increased significantly as compared to cells transfected with control mimic (Figure 3A). In miR-1233-3p mimic-transfected cells, Ang-1 failed to increase average tube length when compared to PBS (Figure 3A).
To evaluate whether endogenous miR-1233-3p levels regulate EC differentiation, tube formation was measured in control and miR-1233-3p inhibitor-transfected cells exposed to PBS (control) or Ang-1. Relative to PBS exposure, average and total tube lengths increased significantly in control mimic-transfected cells exposed to Ang-1 (Figure 3B&C). In miR-1233-3p inhibitor-transfected cells, total tube length measured in the presence of PBS increased significantly as compared to cells transfected with control inhibitor (Figure 3B&C). In miR-1233-3p inhibitor-transfected cells, Ang-1 failed to increase average and total tube lengths as compared to PBS (Figure 3B&C).
3.5. Regulation of EC Proliferation by miR-1233-3p
The effects of Ang-1 in proliferation is debatable as it has been described as having a positive effect, a negative effect and no effect [4]. Therefore we tested the effect of miR-1233-3p on EC proliferation in the absence of Ang-1. We found that overexpression of miR-1233-3p with mimics had no major effects on BrdU incorporation. By comparison, inhibition of miR-1233-3p in HUVECs using a selective inhibitor triggered significant increase in BrdU incorporation suggesting that endogenous miR-1233-3p levels exert inhibitory effect on EC proliferation (Figure 3D&E).
3.6. PDRG1 Is a Direct Target miR-1233-3p
miRNAs regulate gene expression by destabilizing mRNA and by inhibiting mRNA translation. To identify mRNAs targeted by miR-1233-3p in ECs, we used three algorithms such as DIANA, TargetScan, and miRDB which predicted that PDRG1 is a possible direct target of miR-1233-3p (Figure 4A). To confirm this prediction, HUVECs were transfected with miR-1233-3p mimics or inhibitor and the expression of PDRG1 was measured. Overexpression of miR-1233-3p significantly reduced PDRG1 mRNA expression while transfection with miR-1233-3p inhibitor increased PDRG mRNA expression (Figure 4B). Similarly, PDRG1 protein level significantly decreased in miR-1233-3p mimic-transfected cells and increased in miR-1233-3 inhibitor-transfected cells (Figure 4C-F). According to DIANA database, 3’UTR region of PDRGG1 mRNA contains two conserved miR-1233-3p binding sites, (nucleotides 816-823 and 209-215)(Figure 5A). To confirm direct binding of miR-1233-3p to PDRG1 mRNA, HUVECs were transfected with biotinylated control or miR-1233-3p mimics and then biotin-labeled Pull-down Assays were performed as described in the method section. Total RNA was harvested from the pull-down and input materials, and PDRG1 mRNA levels were measured using qPCR. The efficiency of miRNA-1233p3p overexpression using biotinylated mimic was confirmed (Figure 5B&C). We found that PDRG1 mRNA levels were significantly enriched in the pull-down material of cell transfected with biotinylated miR-1233-3p as compared to cells transfected with control mimic (Figure 5D). The mRNA levels of centromere protein B (CENPB), another predicted target of miR-1233-3p, were also enriched in the pull-down materials whereas those of zinc finer protein 91 (ZFP01), not a predicted target of miR-1233-3p, were not enriched in the pull-down material (Figure 5D&E).
Previous studies have revealed that intronic miRNAs may regulate the expression of its own gene. For instance, it has been reported that miR-26b which is transcribed from an intron of CTDSP2 directly targets and regulates the expression of CTDSP2 and that this regulation is important for neuronal differentiation during development [29]. In this study, we report that GOLGA8A mRNA expression is not affected by miR-1233-3p overexpression suggesting that this miRNA doesn’t regulate the expression of GOLGA8A (Supplementary figure 6).
3.7. Regulation of PDRG1 Expression by Ang-1
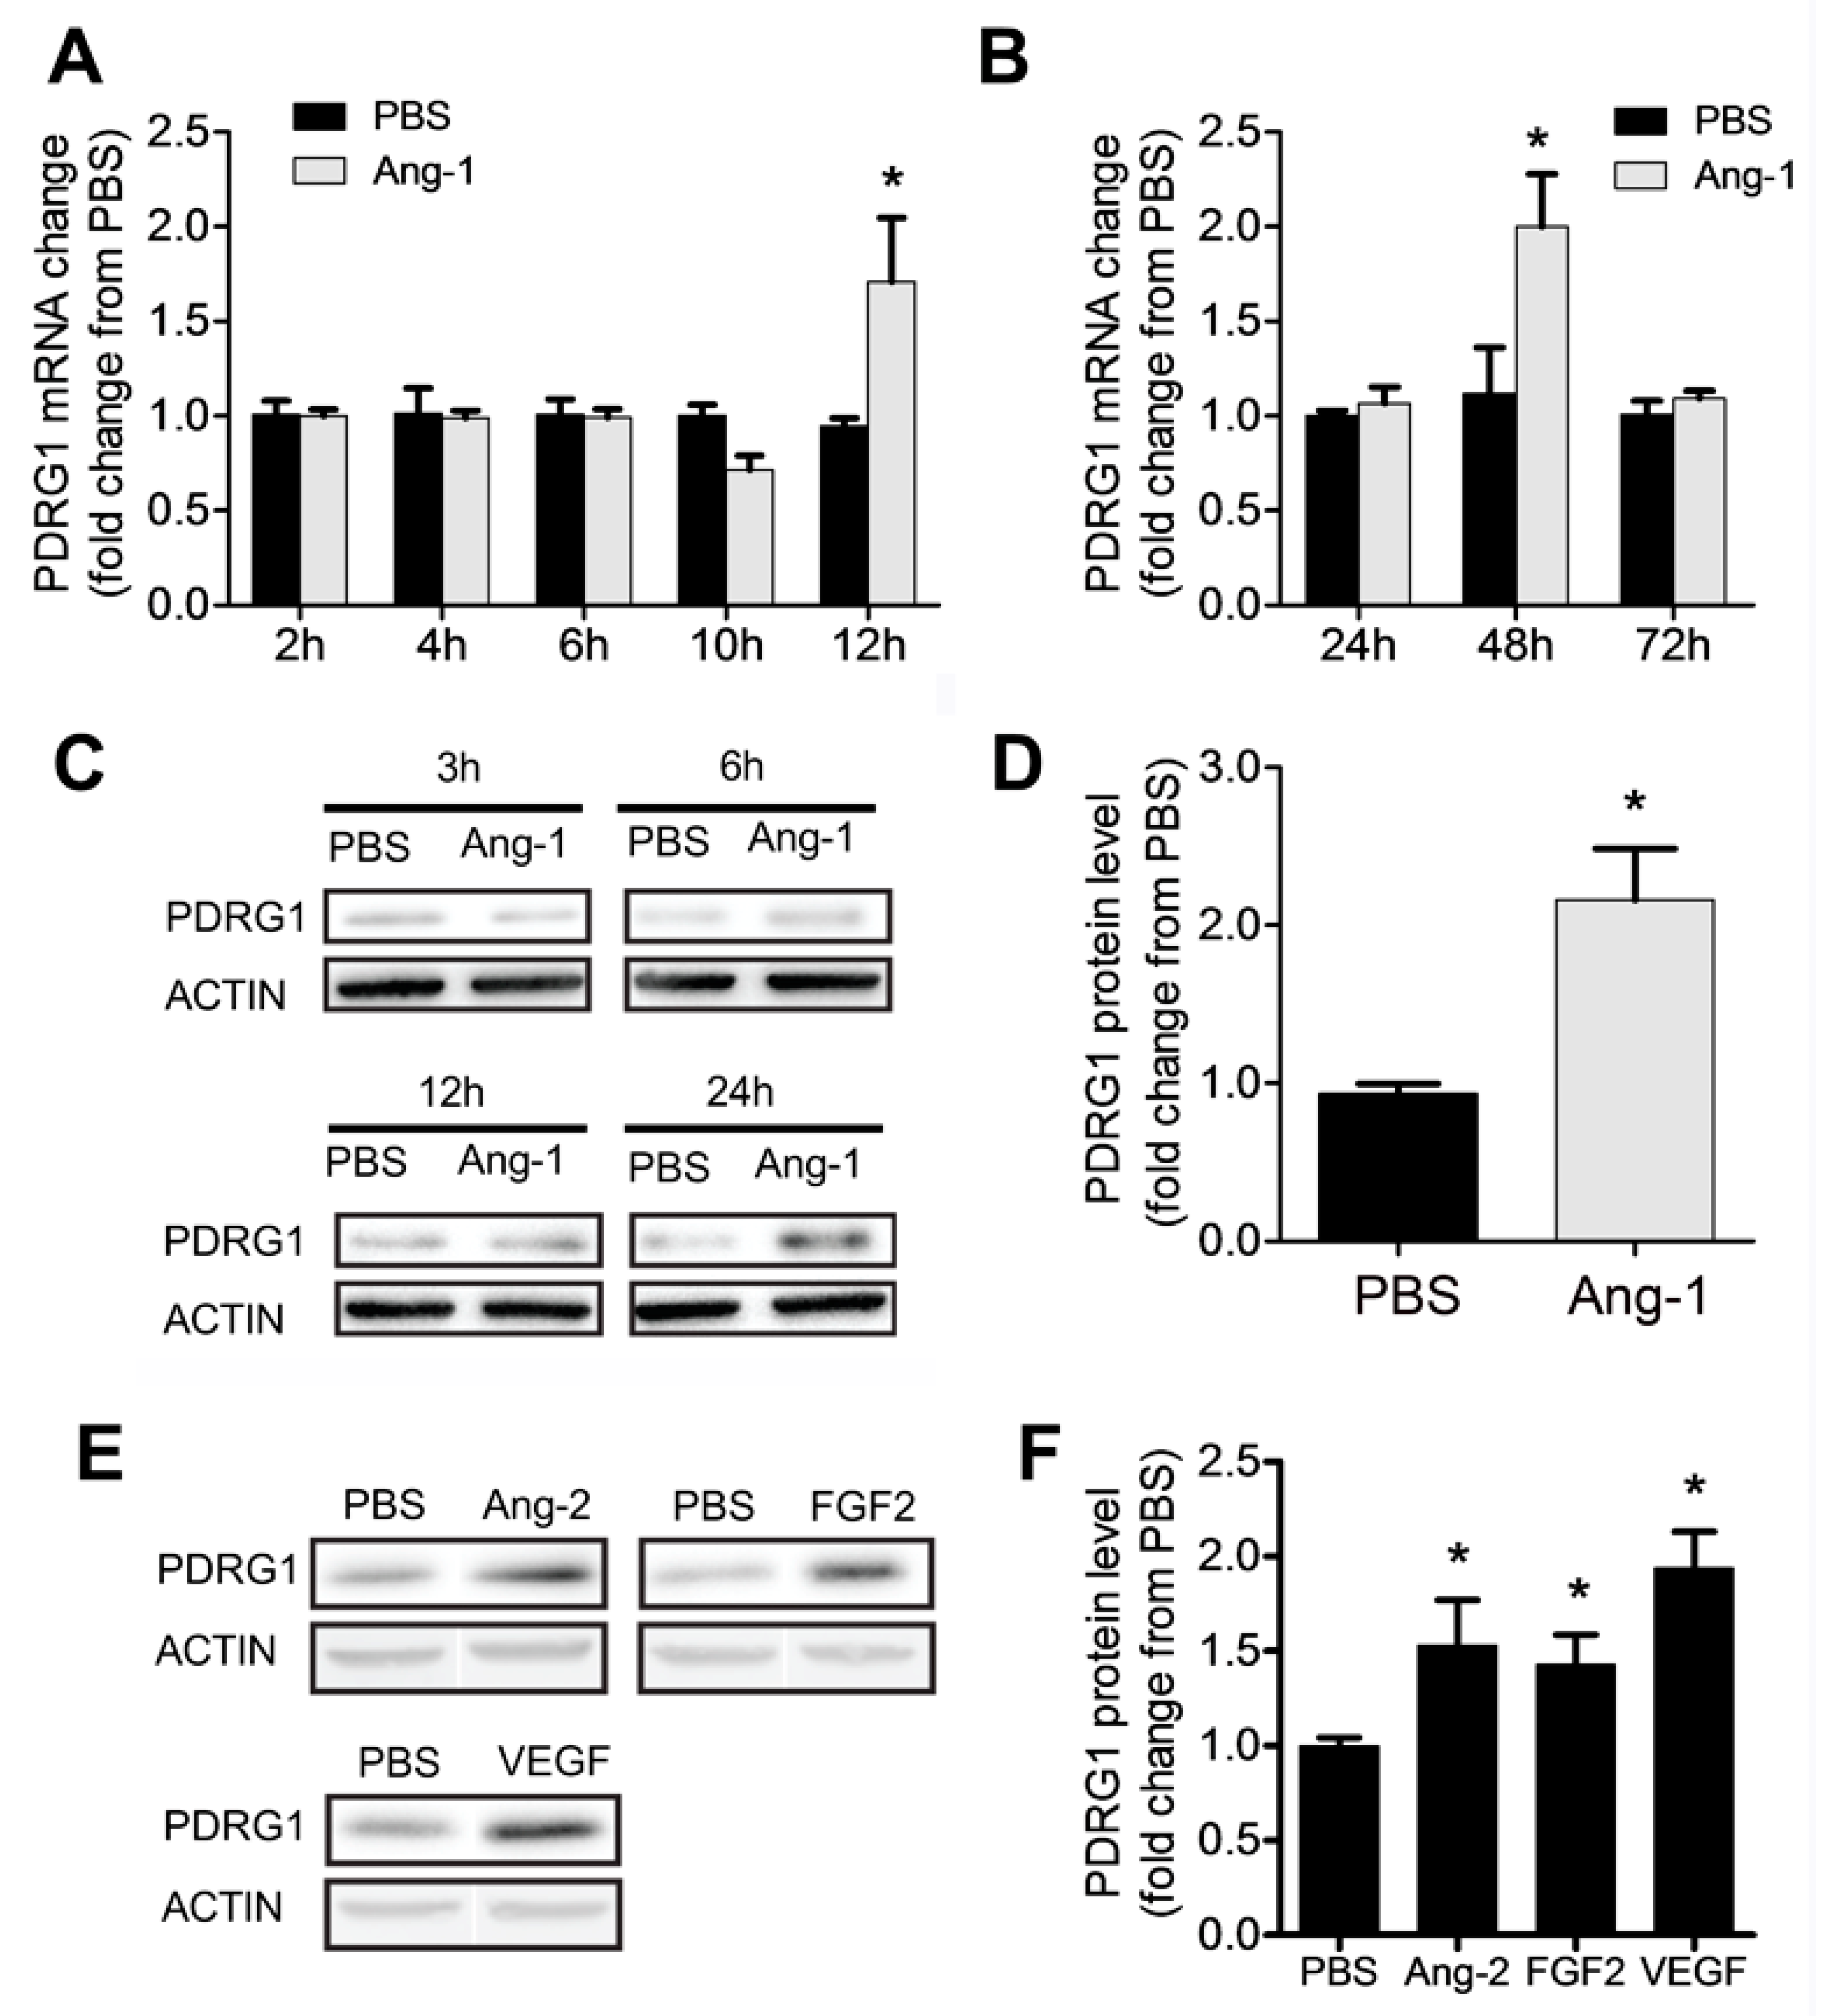
Our results indicate that Ang-1 exposure triggers significant downregulation of miR-1233-3p in ECs and that this miRNA directly targets PDRG1. To assess whether PDRG1 expression is regulated by the Ang-1/Tie-2 axis, we measured PDRG1 mRNA and protein levels in HUVECs exposed to Ang-1 for 2 to 72 hours. Ang-1 exposure triggered significant increase in PDRG1 mRNA after 12 and 48 hours and PDRG1 protein levels after 24 hours (Figure 6A-D). We also observed that other growth factors including Ang-2, FGF-2, and VEGF upregulated the expression of PDRG1 protein levels in HUVECs (Figure 6E&F). These results suggest that the Ang-1/Tie-2 axis downregulates miR-1233-3p express so as to enhance PDRG1 expression by removing the inhibitory effect of miR-1233-3p on PDRG1 mRNA. These effects on miR-1233-3p and PDRG1 expression are not selective to the Ang-1/Tie-2 axis since similar results were observed in response to Ang-2 and VEGF exposure (Figure 1 and Figure 6).
4. Discussion
The main findings of this study are the following: 1) The Ang-1/Tie-2 axis decreases the expression of miR-1233-3p levels in ECs; 2) Overexpression of miR-1233-3p is associated with significant inhibition of Ang-1-induced migration, proliferation, and survival of ECs; 3) Endogenous miR-1233-3p levels exert negative effects on EC survival, migration, capillary-like tube formation, and proliferation; 4) PDRG1 mRNA is a direct target of miR-1233-3p; and 5) Ang-1 upregulates PDRG1 at the mRNA and protein levels.
It has been well established that pro- and anti-angiogenic stimuli regulate angiogenesis through modulation of miRNA levels. Perhaps the most well pro-angiogenic stimulus is VEGF which has been found to induce, in a time-dependent manner, the expression of several angiogenic miRNAs including: miR-191, -17-5p, -18a and miR-20a in HUVECs [30]. Treatment with epidermal growth factor (EGF) and VEGF increased the expression of miR-296a brain ECs [31]. Moreover, VEGF-induced angiogenesis has been shown to be mediated in part through downregulation of miR-101 expression which leads to enhanced expression of histone-methyltransferase EZH2 [32]. The role of miRNAs in Ang-1-induced angiogenesis remains largely unexplored. Recently, our group reported that miR-146-5p expression is upregulated by Ang-1 in ECs and that transfection of miR-146b-5p mimics in HUVECs significantly attenuates toll-like receptor 4 signaling through selective targeting of IRAK1 and TRAF6 protein expressions. [33] In the current study, we describe for the first time the importance of miR-1233-3p in the regulation of angiogenesis. We found that the expression of this poorly characterized miRNA is significantly downregulated by Ang-1 in ECs and that this response is independent of the expression of the genes where miR-1233-3p resides since GOLGA8A and GOLGA8B expressions remained unchanged in response to Ang-1 exposure. We also found that the decrease in cellular levels of miR-1233-3p mediated by the Ang-1/Tie-2 axis is not the result of increased exosomal export. However, we do not exclude the possibility of miR-1233-3p being exported by other secretory mechanisms like microparticles or lipoproteins known to be intercellular miRNA carriers [34,35,36].
Our study indicates that overexpression of miR-1233-3p using mimic leads to an increase in basal caspase-3 activity and significant decrease in EC cell survival, migration and proliferation. These results in ECs are in agreement with those derived from trophoblasts cells by Zhong et al., who reported that overexpressing miR-1233-3p significantly decreased proliferation and invasion abilities of trophoblast cells [37]. These authors also described that the expression of miR-1233-3p is significantly elevated in placental tissue of hypertensive disorder complicated pregnancies. Another study reported that a significant correlation exists between elevated serum miR-1233-3p levels and the development of pre-eclampsia [38]. In an another study, significant elevation of miR-1233-3p levels in tissues of patients with renal cell carcinoma (RCC) [39].
Out of numerous predicted targets of miR-1233-3p, only HOXB3 has been validated using a luciferase construct containing the 3’ UTR of this mRNA [37]. HOXB3 is a member of the mammalian HOX genes located on one of the four homologous HOX loci (HOXA, B, C, D). Several reports suggest that HOX genes play a role in promoting or inhibiting angiogenesis [40,41,42,43,44]. For example, constant expression of HOXD10 inhibit angiogenesis [43]. HOXB3, in particular, is upregulated during EC differentiation as documented in a human bone marrow-derived mesenchymal stem cell (hMSC) model [45]. Other studies have demonstrated that HOXB3 promotes cancer cell migration and progression when upregulated [46,47].
To identify miR-1233-3p targets, we utilized pull-down assays of biotinylated miR-1233-3p miRNA mimic and identified direct interaction between PDRG1 mRNA and miR-1233-3 in HUVECs. Just like miR-1233-3p, PDRG1 is not well characterized protein. It consists of 133 amino acids with a molecular mass of 15511 Da. There is a relatively high homology between human and mouse PDRG1 protein sequences [48]. PDRG1 bears a helix-turn-helix-like motif at the C-terminal end and this motif is likely to mediate protein-protein and protein-DNA interactions. PDRG1 also has a β-prefoldin-like domain. Luo et al., showed PDRG1 is expressed predominantly in the cytoplasm [48]. Mass spectrometry analyses have identified the R2TP/Prefoldin-like complex composed of prefoldin and prefoldin-like proteins URI, art-27, PFD2, PFD6 and PDRG1 [49]. Together with HSP90 the R2TP/prefoldin-like complex is responsible for the assembly of RNA polymerase II complex (pol II) in the cytoplasm of eukaryotic cells [49]. In addition one member of this complex, URI, is involved in stabilizing PDRG1. Mass spectrometry analysis and immunoprecipitation studies described a specific interaction between PDRG1and URI in the nucleus in prostate cells [50]. It is also hypothesized that all the prefoldin and prefoldin-like proteins in this complex such as URI, art-27, PFD2, PFD6 and PDRG1 interact with each other through the β strands of the prefoldin-like domain [50].
In the present study, we found that the mRNA and the protein levels of PDRG1 were elevated upon treatment with Ang-1. Other growth factors had similar effects as well. PDRG1 expressions have been shown to be elevated in several tumors including colon, rectum, ovary, lung, stomach and uterus [51]. A recent study by Sun et al. reported that PDRG1 promotes proliferation and migration of glioblastoma multiforme both in vivo and in vitro and that these effects are mediated by the mitogen-activated protein kinase kinase (MEK)/extracellular regulated protein kinase (ERK)/CD44 pathway [52]. Similarly, silencing of PDRG1 in colorectal cancer cells decreased vitality, invasion, and migration, induced cell apoptosis and G0/G1 phase arrest [53]. PDRG1 knockdown also decreased tumor growth and metastasis and enhanced apoptosis-related protein expression [53]. While recent progress has been made in understanding the functional roles of PDRG1 in cancer cell biology, no studies to date have investigated its expression and role in regulating endothelial cell (EC) functions. Further research is needed to clarify the importance of PDRG1 in mediating the pro-angiogenic effects of Ang-1 in ECs.
Author Contributions
V.S. was involved in designing experimental approaches, conducting experiments, data analyses and writing the manuscript. S.H. and D.M. were involved in data analyses, and designing experimental approaches. A.K.S. was involved in writing and editing the manuscript. S.N.H. was responsible for data presentation, analyses, and editing the manuscript. All authors have read and agreed to the published version of the manuscript.
Funding
This research was funded by the Canadian Institutes of Health Research grant number MOP-111074. It was also funded by a grant from Natural Sciences and Engineering Research Council of Canada.
Acknowledgments
The authors are grateful to Ms A. Gatensby for editing the manuscript.
Conflicts of Interest
The authors declare no conflict of interests.
References
- Ferrara, N. & Kerbel, R. S. Angiogenesis as a therapeutic target. Nature 438, 967-974, (2005).
- Brkovic, A., Pelletier, M., Girard, D. & Sirois, M. G. Angiopoietin chemotactic activities on neutrophils are regulated by PI-3K activation. J. Leuk. Biol. 81, 1093-1101 (2007).
- Harfouche, R. et al. Angiopoietin-1 activates both anti- and proapoptotic mitogen-activated protein kinases. Faseb J. 17, 1523- (2003).
- Brindle, N. P., Saharinen, P. & Alitalo, K. Signaling and functions of angiopoietin-1 in vascular protection. Circ Res 98, 1014-1023 (2006).
- Suri, C. et al. Requisite role of Angiopoietin-1, a ligand for the TIE2 receptor, during embryonic angiogenesis. Cell 87, 1171-1180 (1996).
- Partanen, J. & Dumont, D. J. Functions of Tie1 and Tie2 receptor tyrosine kinases in vascular development. Vascular Growth Factors and Angiogenesis 237, 159-172 (1999).
- Tachibana, K., Jones, N., Dumont, D. J., Puri, M. C. & Bernstein, A. Selective role of a distinct tyrosine residue on Tie2 in heart development and early hematopoiesis. Mol. Cell. Biol. 25, 4693-4702 (2005).
- Thurston, G. et al. Angiopoietin-1 protects the adult vasculature against plasma leakage. Nature Medicine 6, 460-463 (2000).
- Balakumar, P., Koladiya, R. U., Ramasamy, S., Rathinavel, A. & Singh, M. Pharmacological interventions to prevent vascular endothelial dysfunction: Future directions. J. Health Sci. 54, 1-16 (2008).
- Mattick, J. S. & Makunin, I. V. Non-coding RNA. Human Molecular Genetics 15, R17-R29 (2006).
- Wang, J. et al. Mouse transcriptome: Neutral evolution of 'non-coding' complementary DNAs. Nature 431, 7010 (2004).
- Denli, A. M., Tops, B. B. J., Plasterk, R. H. A., Ketting, R. F. & Hannon, G. J. Processing of primary microRNAs by the Microprocessor complex. Nature 432, 231-235 (2004).
- Gregory, R. I. et al. The Microprocessor complex mediates the genesis of microRNAs. Nature 432, 235-240 (2004).
- Bohnsack, M. T., Czaplinski, K. & Gorlich, D. Exportin 5 is a RanGTP-dependent dsRNA-binding protein that mediates nuclear export of pre-miRNAs. Rna-a Publication of the Rna Society 10, 185-191 (2004).
- Chendrimada, T. P. et al. TRBP recruits the Dicer complex to Ago2 for microRNA processing and gene silencing. Nature 436, 740-744 (2005).
- Zampetaki, A. & Mayr, M. MicroRNAs in Vascular and Metabolic Disease. Circulation Research 110, 508-522 (2012).
- Bonauer, A., Boon, R. A. & Dimmeler, S. Vascular microRNAs. Current Drug Targets 11, 943-949 (2010).
- Moszynska A. et al. The hypoxia-induced changes in miRNA-mRNA in RNA-induced silencing complexc and HIF-2 induced miRNA in human endothelial cells. FASEB J 36(7), e22412 (2022).
- van Rooij, E. et al. Dysregulation of microRNAs after myocardial infarction reveals a role of miR-29 in cardiac fibrosis. Proc. Nat. Acad. Sci. USA 105, 13027-13032 (2008).
- Mutharasan, R. K. et al. microRNA-210 is upregulated in hypoxic cardiomyocytes through Akt- and p53-dependent pathways and exerts cytoprotective effects. Am. J. Physiol. Heart and Circ. Physiol. 301, H1519-H1530 (2011).
- Qureshi, R. & Sacan, A. A novel method for the normalization of microRNA RT-PCR data. Bmc Medical Genomics 6, Suppl 1:S14 (2013).
- Carpentier G, M. M., Courty J, Cascone I. in 4th ImageJ User and Developer Conference proceedings. 198-201.
- Wang, Y. L. et al. Structure of an argonaute silencing complex with a seed-containing guide DNA and target RNA duplex. Nature 456 (7224), 921-926 (2008).
- Cloonan, N. et al. MicroRNAs and their isomiRs function cooperatively to target common biological pathways. Genome Biology 12c(12):R126 (2011).
- Orom, U. A. & Lund, A. H. Isolation of microRNA targets using biotinylated synthetic microRNAs. Methods 43, 162-165 (2007).
- Guduric-Fuchs, J. et al. Selective extracellular vesicle-mediated export of an overlapping set of microRNAs from multiple cell types. Bmc Genomics 13, 357 (2012).
- Taylor, D. D. & Gercel-Taylor, C. MicroRNA signatures of tumor-derived exosomes as diagnostic biomarkers of ovarian cancer. Gynecologic Oncology 110, 13-21 (2008).
- Silva, J. et al. Vesicle-related microRNAs in plasma of nonsmall cell lung cancer patients and correlation with survival. Europ. Resp. J. l 37, 617-623 (2011).
- Dill, H., Linder, B., Fehr, A. & Fischer, U. Intronic miR-26b controls neuronal differentiation by repressing its host transcript, ctdsp2. Genes & Development 26, 25-30 (2012).
- Suarez, Y. et al. Dicer-dependent endothelial microRNAs are necessary for postnatal angiogenesis. Proc. Nat. Acad. Sci. USA 105, 14082-14087 (2008).
- Wuerdinger, T. et al. miR-296 Regulates Growth Factor Receptor Overexpression in Angiogenic Endothelial Cells. Cancer Cell 14, 382-393 (2008).
- Smits, M. et al. Down-Regulation of miR-101 in Endothelial Cells Promotes Blood Vessel Formation through Reduced Repression of EZH2. Plos One 6 (1), e16282 (2011).
- Echavarria, R. et al. Angiopoietin-1 inhibits toll-like receptor 4 signalling in cultured endothelial cells: role of miR-146b-5p. Cardiovasc Res 106, 465-477 (2015).
- Vickers, K. C., Palmisano, B. T., Shoucri, B. M., Shamburek, R. D. & Remaley, A. T. MicroRNAs are transported in plasma and delivered to recipient cells by high-density lipoproteins. Nature Cell Biology 13, 423-433 (2011).
- Thery, C., Zitvogel, L. & Amigorena, S. Exosomes: Composition, biogenesis and function. Nature Reviews Immunology 2, 569-579 (2002).
- Mause, S. F. & Weber, C. Microparticles Protagonists of a Novel Communication Network for Intercellular Information Exchange. Cir. Res. 107, 1047-1057 (2010).
- Zhong, W. Y. et al. Expression of miRNA-1233 in placenta from patients with hypertensive disorder complicating pregnancy and its role in disease pathogenesis. Internat. J. Clin. Exp. Med. 8, 9121-9127 (2015).
- Munaut, C. et al. Dysregulated circulating miRNAs in preeclampsia. Biomed. Reports 5, 686-692 (2016).
- Wulfken, L. M. et al. MicroRNAs in Renal Cell Carcinoma: Diagnostic Implications of Serum miR-1233 Levels. Plos One 6 (9):e25787 (2011).
- Boudreau, N. J. & Varner, J. A. The homeobox transcription factor Hox D3 promotes integrin alpha(5)beta(1) expression and function during angiogenesis. J. Biol. Chem. 279, 4862-4868 (2004).
- Mace, K. A., Hansen, S. L., Myers, C., Young, D. M. & Boudreau, N. HOXA3 induces cell migration in endothelial and epithelial cells promoting angiogenesis and wound repair. J. Cell Sci. 118, 2567-2577 (2005).
- Myers, C., Charboneau, A. & Boudreau, N. Homeobox B3 promotes capillary morphogenesis and angiogenesis. J. Cell Biol. 148, 343-351 (2000).
- Myers, C., Charboneau, A., Cheung, I., Hanks, D. & Boudreau, N. Sustained expression of homeobox D10 inhibits angiogenesis. Am. J. Path. 161, 2099-2109 (2002).
- Raman, V. et al. Compromised HOXA5 function can limit p53 expression in human breast tumours. Nature 405, 974-978 (2000).
- Chung, N. et al. HOX gene analysis of endothelial cell differentiation in human bone marrow-derived mesenchymal stem cells. Mol. Biol. Reports 36, 227-235 (2009).
- Chen, J. et al. HoxB3 promotes prostate cancer cell progression by transactivating CDCA3. Cancer Letters 330, 217-224 (2013).
- Yang, D. J. et al. Deregulation of MicroRNA-375 inhibits cancer proliferation migration and chemosensitivity in pancreatic cancer through the association of HOXB3. Am. J. Trans. Res. 8, 1551-1559 (2016).
- Luo, X. Q., Huang, Y. & Sheikh, M. S. Cloning and characterization of a novel gene PDRG that is differentially regulated by p53 and ultraviolet radiation. Oncogene 22, 7247-7257 (2003).
- Boulon, S. et al. HSP90 and Its R2TP/Prefoldin-like Cochaperone Are Involved in the Cytoplasmic Assembly of RNA Polymerase II. Molecular Cell 39, 912-924 (2010).
- Mita, P. et al. Analysis of URI Nuclear Interaction with RPB5 and Components of the R2TP/Prefoldin-Like Complex. Plos One 8 (5):e63879 (2013).
- Jiang L.Y. et al. PDRG1, a novel tumor marker for multiple malignancies that is selectively regulated by genotoxic stress. Cancer Biol. Therap. 11:567-573 (2011).
- Sun J.M. et al. PDRG1 promotes the proliferation and migration of GBM cells by MEK/ERK/CD44 pathway. Cancer Sci. 113(2):500-516 (2022).
- Xu YX. et al. PDRG1 predicts poor prognosis and facilitates the proliferation and metastatsis of colorectal cancer. Exp. Cell. Res. 409(2):112924, 2021.
Figure 1.
Ang-1 regulates miR-1233-3p expression in HUVECs. A &B: miR-1233-3p levels measured in HUVECs exposed for 2, 4, 6, 10, 24 , 48 and 72 hours to PBS or Ang-1 (300ng/ml). C: Expression of GOLGA8A mRNA in HUVECs exposed for with for 2, 4, 6, and 10 hours to PBS or Ang-1. D: Levels of miR-1233-3p in HUVEC exosomes after 24 hours of PBS or Ang-1 (300ng/ml) treatment. E: Expression levels of miR-1233-3p in HUVECs treated with control or Tie-2 blocking antibodies and incubated with PBS or Ang-1 (300ng/ml) for 24 hours. F: Expression of miR-1233-3p in HUVECs treated PBS or growth factors (TGFβ, Ang-2, VEGF and FGF-2) for 24 hours. Values are expressed as means± SEM and are expressed as fold change from PBS. *P<0.05, compared with PBS.
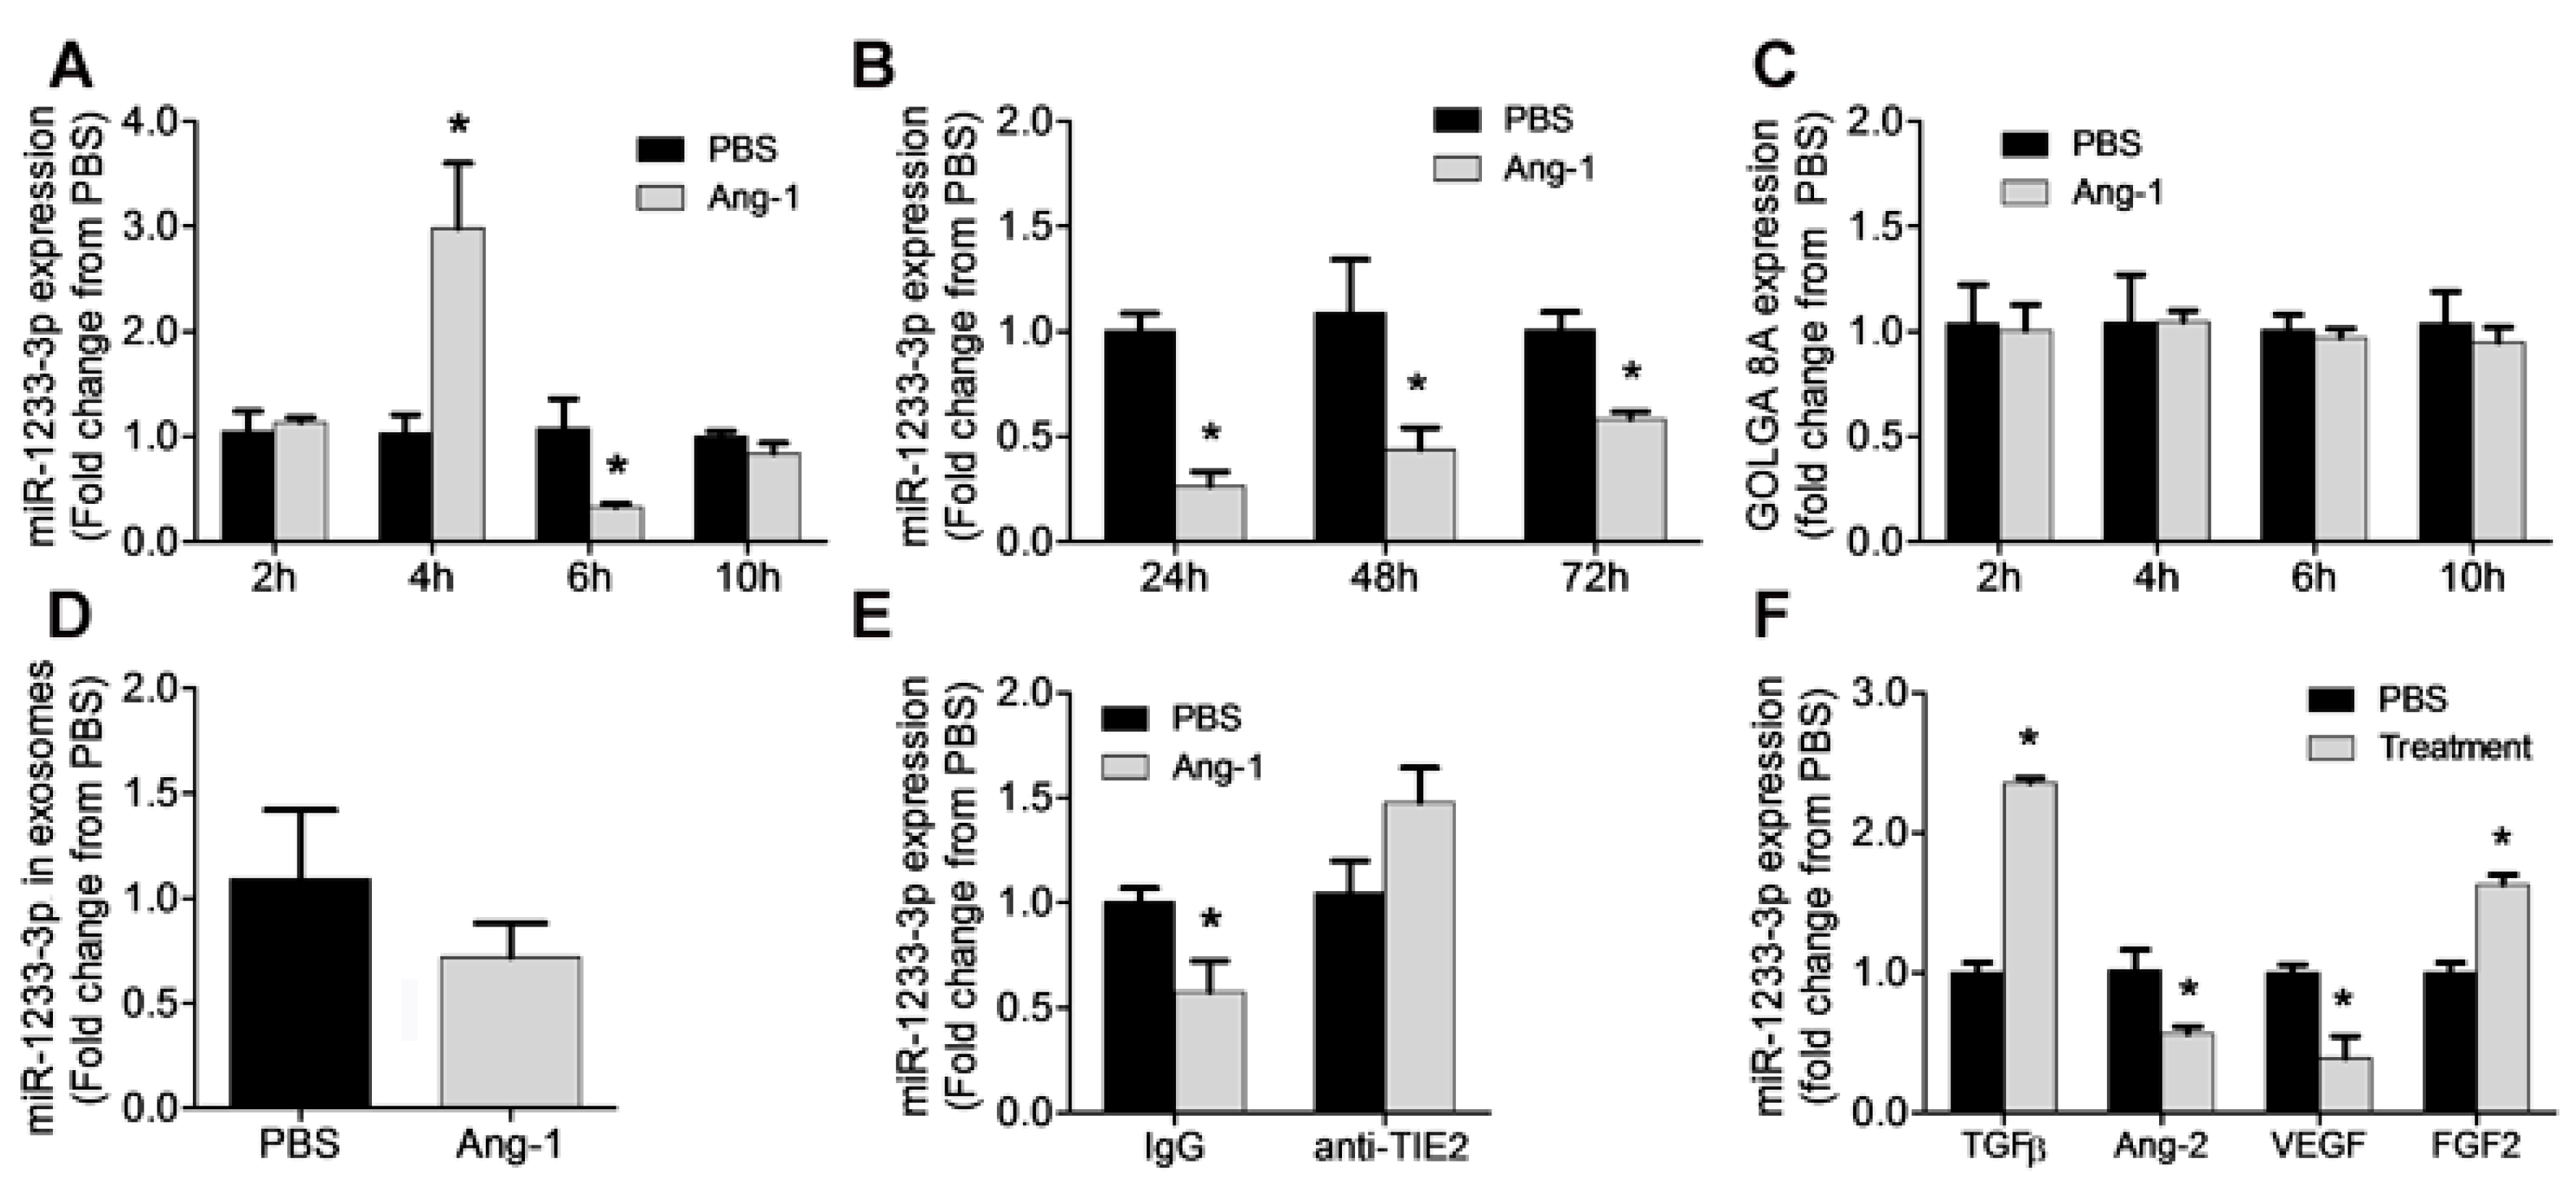
Figure 2.
Regulation of EC survival and migration by miR-1233-3p. A & B: HUVECs were transfected with control or miR-1233-3p mimics. After 48 hours of recovery, equal numbers of cells were maintained in complete medium, basal medium or basal medium+Ang-1 (300ng/ml). Cell counts and Caspase-3 activities were measured 24 hours later. C&D: HUVECs were transfected with control or miR-1233-3p inhibitors. After 48 hours of recovery, equal number of cells were maintained in complete medium, basal medium or basal medium+Ang-1 (300ng/ml). Cell counts and Caspase-3 activities were measured 24 hours later. E: Percent would healing of HUVECs transfected with control or miR-1233-3p mimics and were treated with PBS or Ang-1 (300ng/ml) for 8 hours. F: Percent would healing of HUVECs transfected with control or miR-1233-3p inhibitors and were treated with PBS or Ang-1 (300ng/ml) for 8 hours. Values are means± SEM. *P<0.05, compared to PBS alone. #P<0.05, compared to basal medium. φ P<0.05, compared to cells transfected with control mimic or control inhibitor.
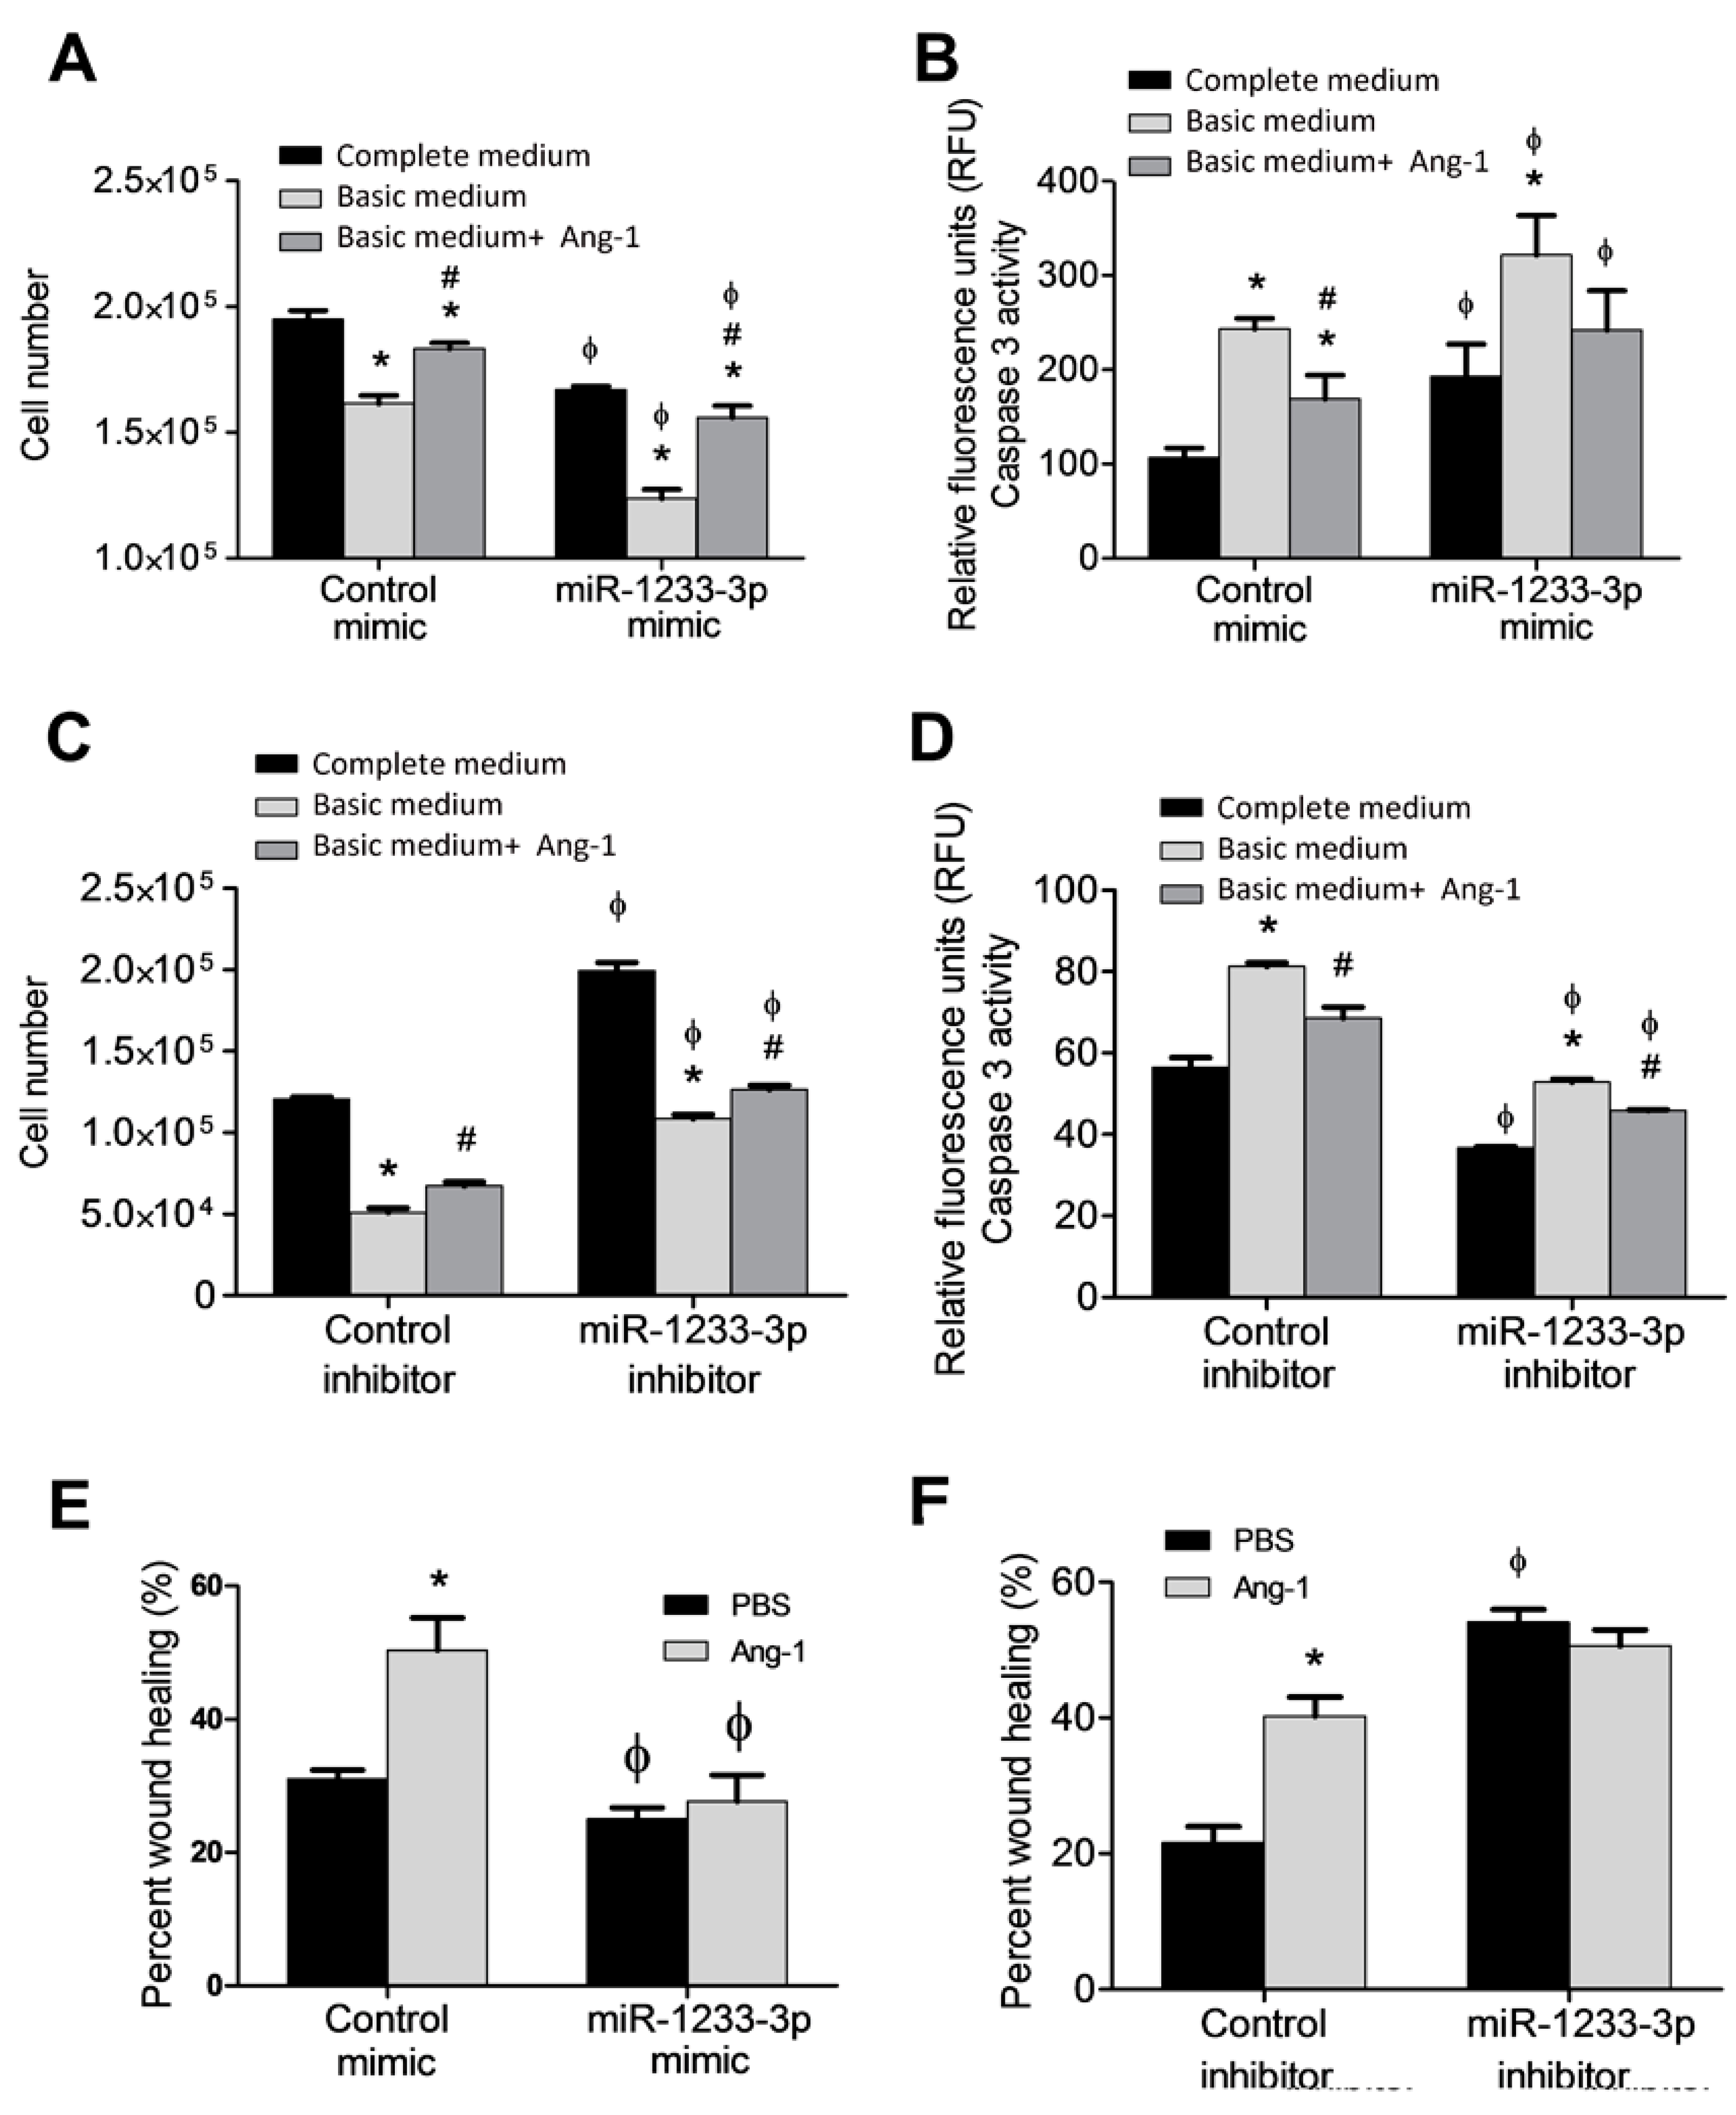
Figure 3.
Regulation of EC differentiation and proliferation by miR-1233-3p. A-C: Average and total tube lengths of HUVECs transfected with control and miR-1233-3p mimics or inhibitors and maintained for 24 hours in Lonza EGM™-2 medium (minus VEGF) containing PBS or Ang-1. Values are means ± SEM. D&E: HUVECs were transfected with control and miR-1233-3p mimics or inhibitors and maintained for 24 hours in Lonza EGM™-2 medium (minus VEGF) containing PBS or Ang-1. One hour after plating, BrdU was added. BrdU absorbance was measured 24 hours later. Values are means± SEM. *P<0.05, compared to PBS alone. φ P<0.05, compared to cells transfected with control mimic or control inhibitor.
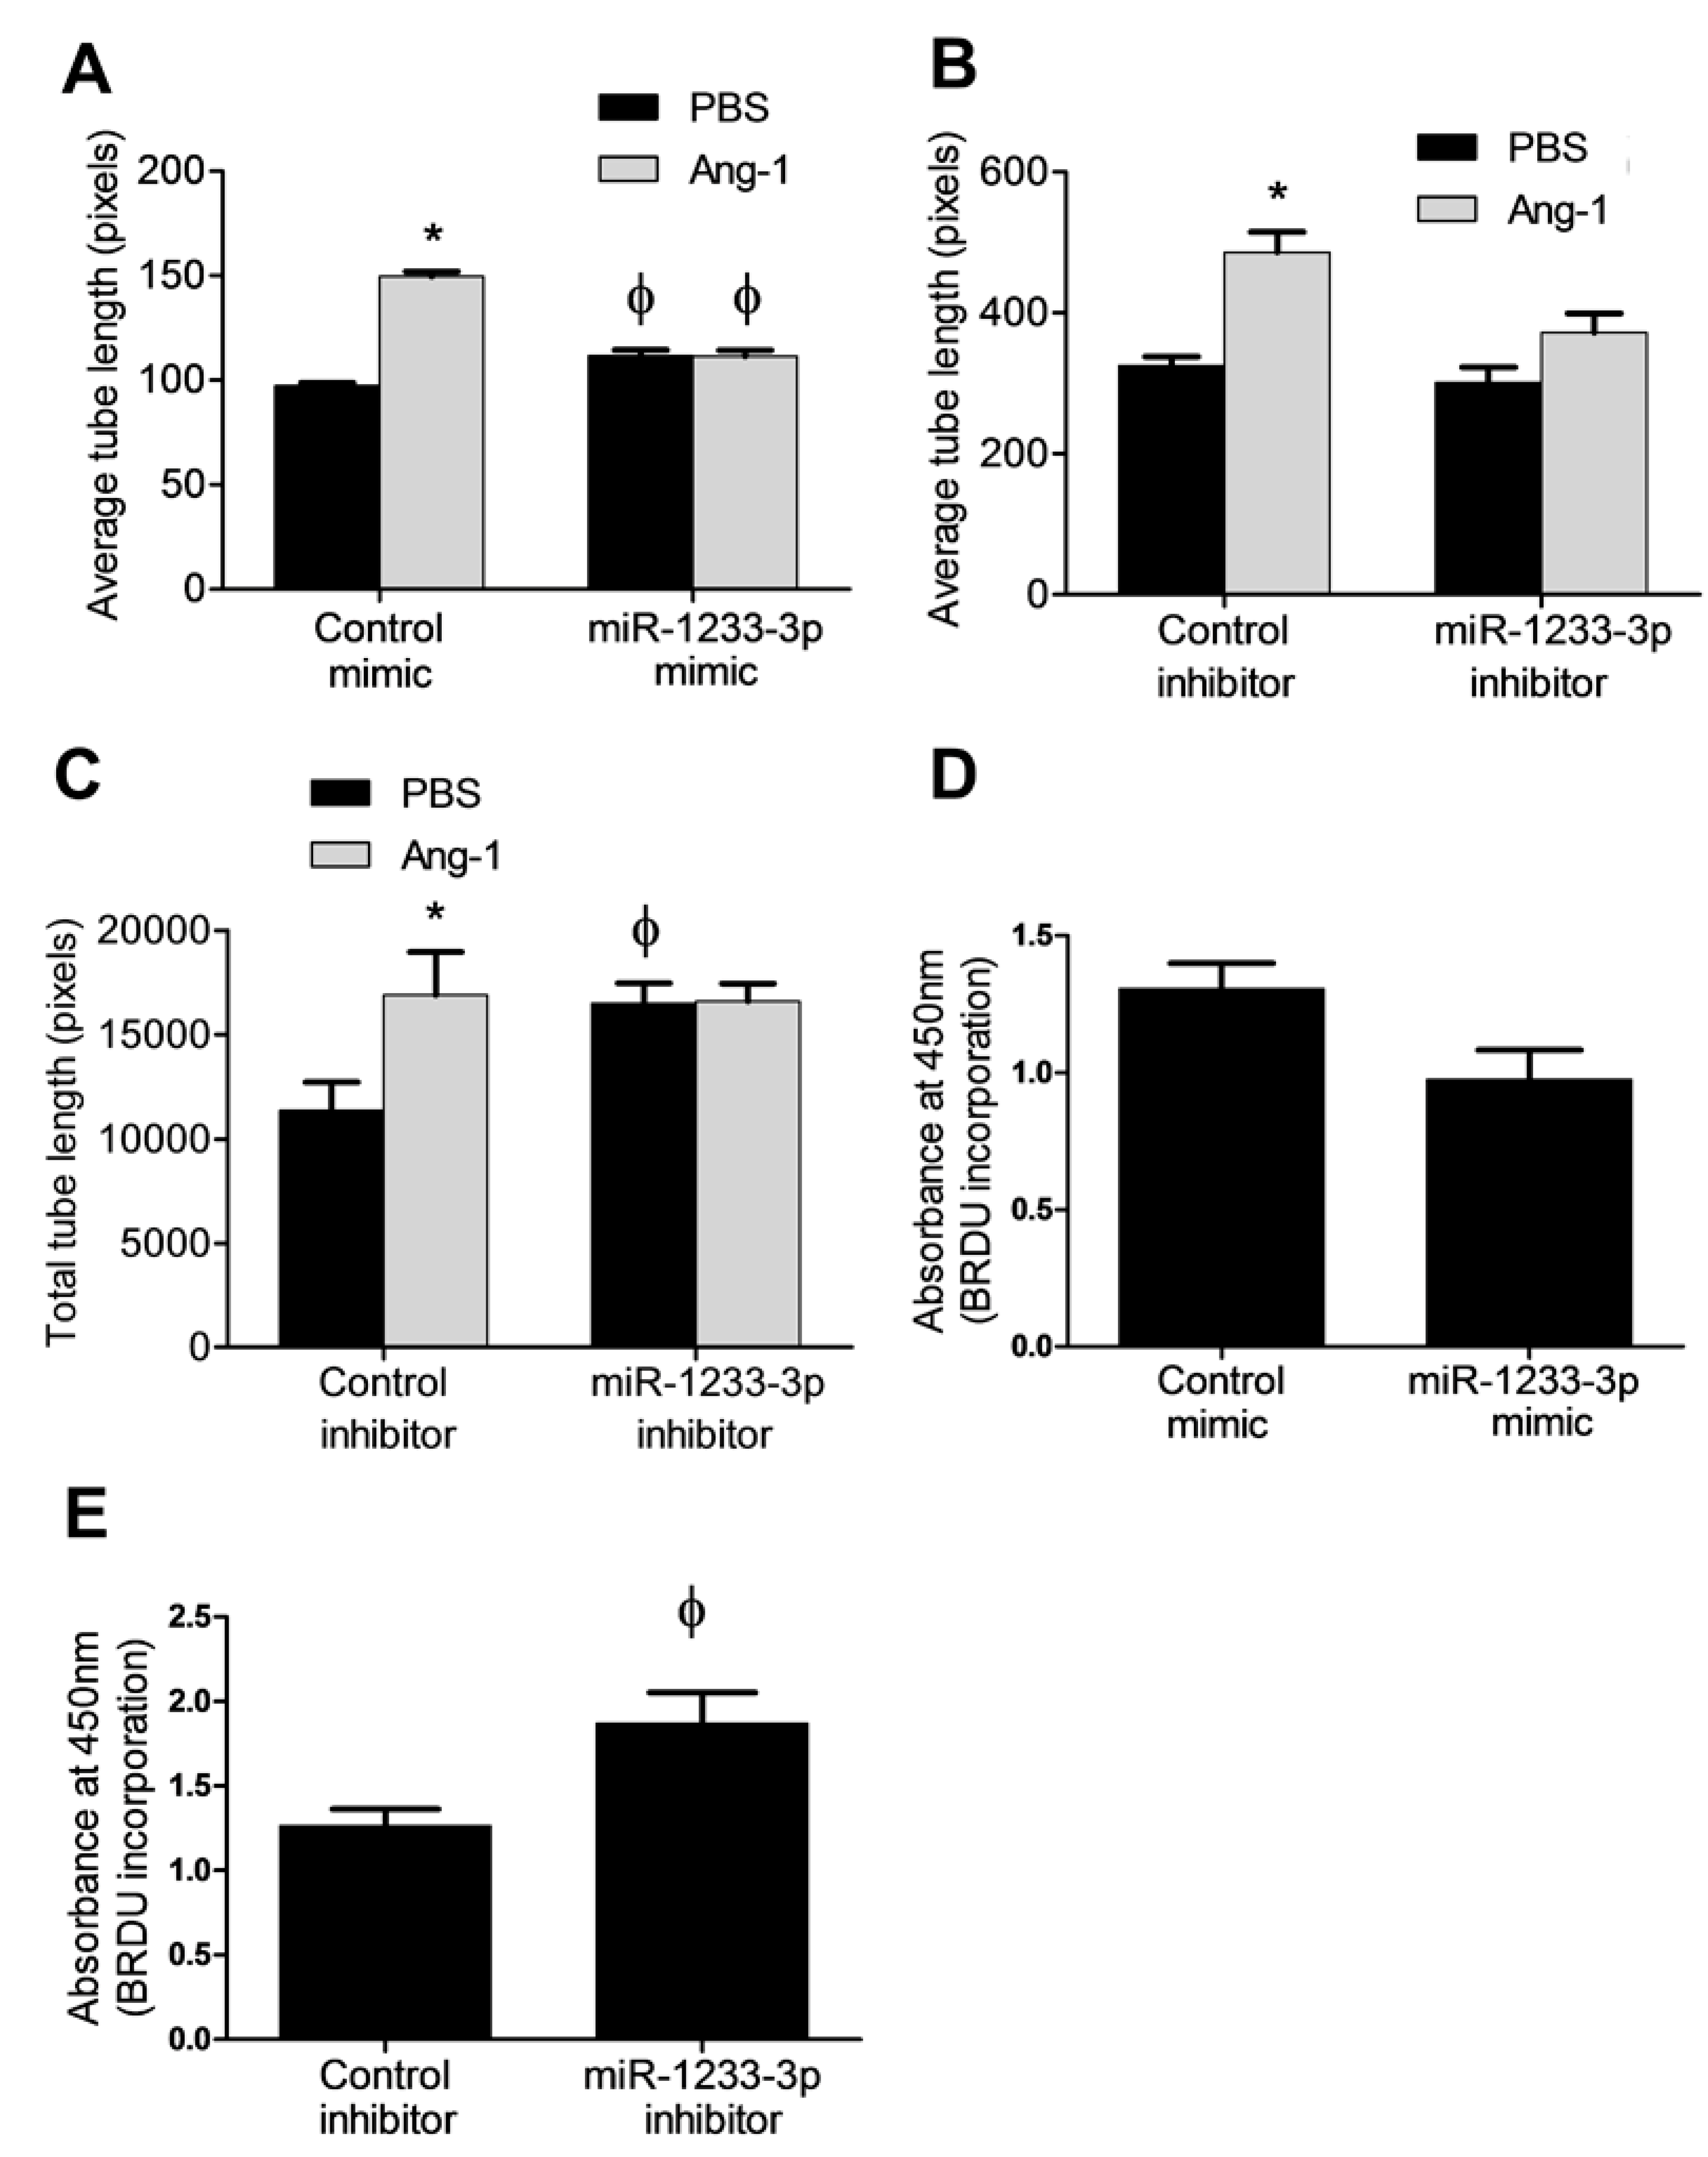
Figure 4.
Identification of PDRG1 as miR-1233-3p target. A: Venn diagram displaying in-silico predicted targets of miR1233-3p as computed by DIANA, TargetScan and miRDB algorithms. B: PDRG1 mRNA expression in HUVECs transfected with miR-1233-3p mimic or inhibitor and their respective controls (denoted by dotted line). Values are expressed fold change from control mimic and inhibitor. C& D: Representative immunoblots of PDRG1 and β-ACTIN proteins and quantification of PDRG1 protein levels in HUVECs transfected with control or miR-1233-3p mimics. Values are means± SEM and are expressed as fold change from control mimic. E& F: Representative immunoblots of PDRG1 and β-ACTIN proteins and quantification of PDRG1 protein levels in HUVECs transfected with control or miR-1233-3p inhibitors. Values are means± SEM and are expressed as fold change from control inhibitor. *p<0.05, compared to control mimic or inhibitor.
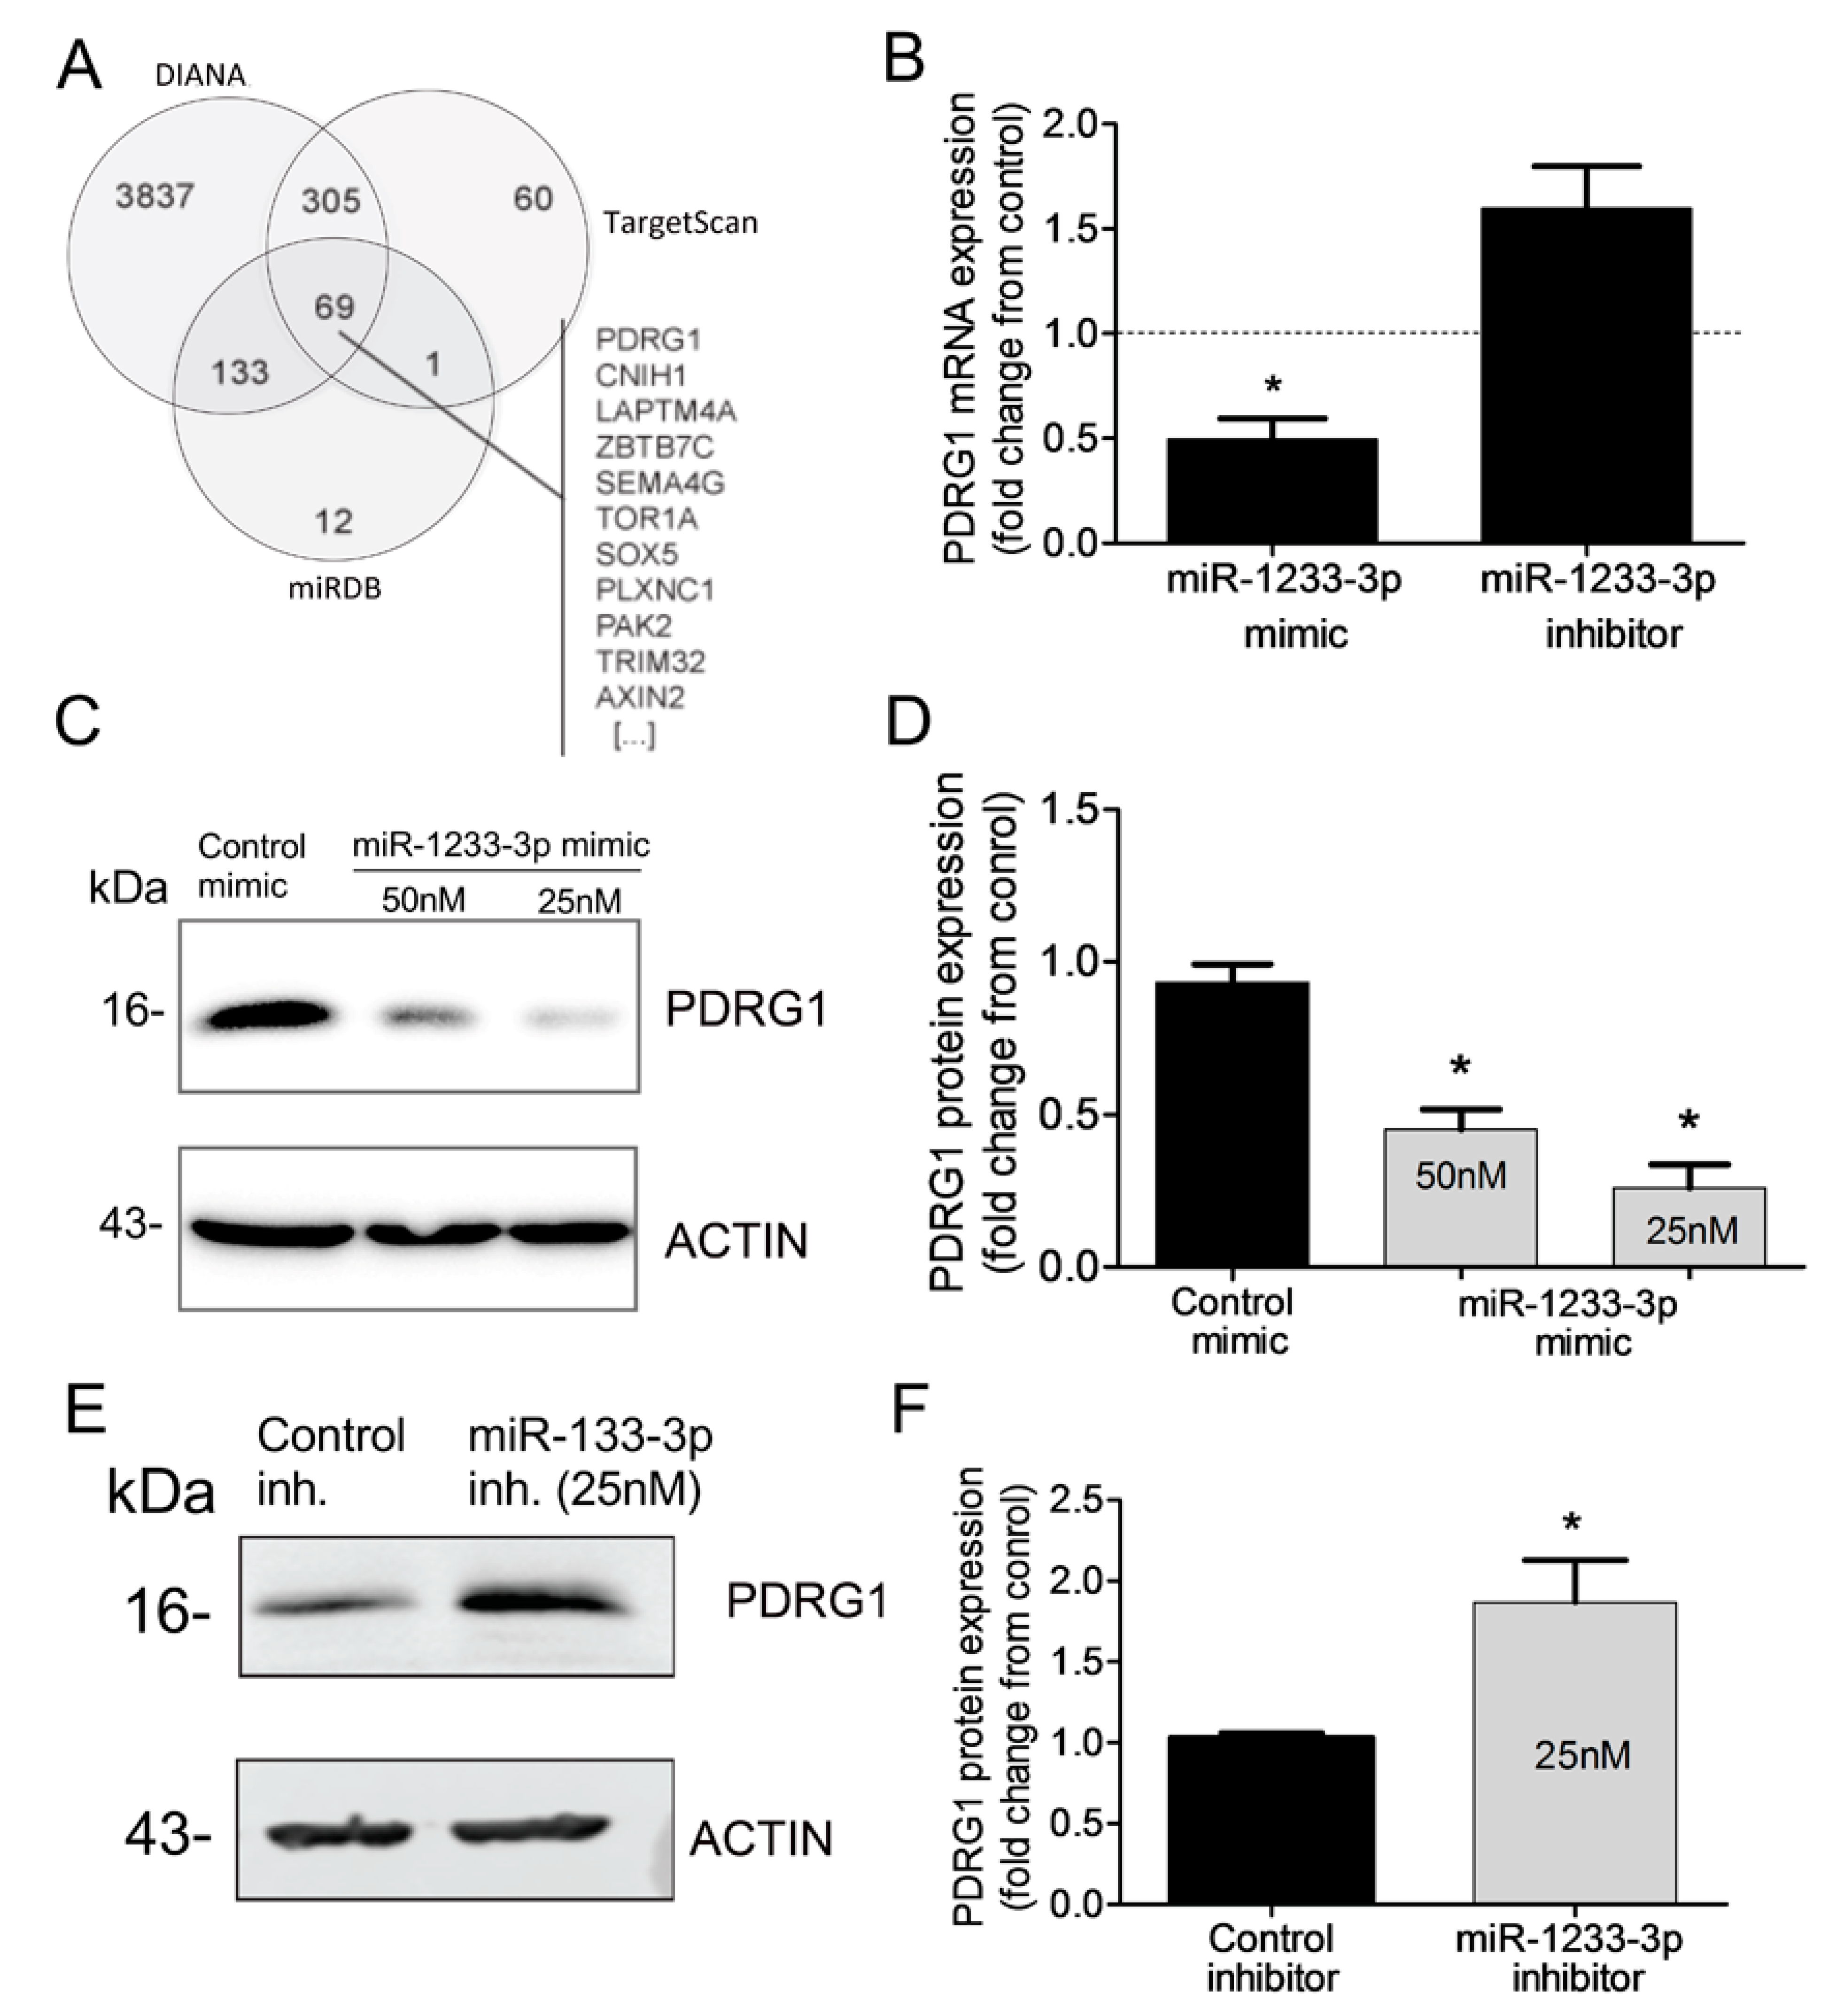
Figure 5.
PDRG1 is a direct target of miR-1233-3p. A: Schematic representation of the sequence alignment of miR-1233-3p and the predicted binding sites according to DIANA algorithm on the 3’ UTR of PDRG1 mRNA. Numbers between brackets indicate nucleotide number of 3”UTR of PDRG1. B-D: Biotinylated miR-1233-3p pull-down assays. Panels B& C illustrate the levels of miR-1233-3p and U6 RNA after transfection of 50nM biotinylated control or miR-mimics in HUVECs. Values are expressed as fold change from control mimic. Panel D shows mRNA levels of PDRG1, HOXB3, and ZFP91 detected with qPCR in the pull-down materials isolated from HUVECs transfected with biotinylated control or miR-1233 mimics. Values are expressed as fold change from control mimic. E: Levels of PDRG1, HOXB3 and ZFP91 mRNA in total input mRNAs measured by qPCR. Enrichment was calculated as follows: X= miR pull-down/control pull-down. Y= miR input/control input. Fold binding= X/Y. Values are expressed as means± SEM. *P<0.05, compared to biotinylated control mimic.
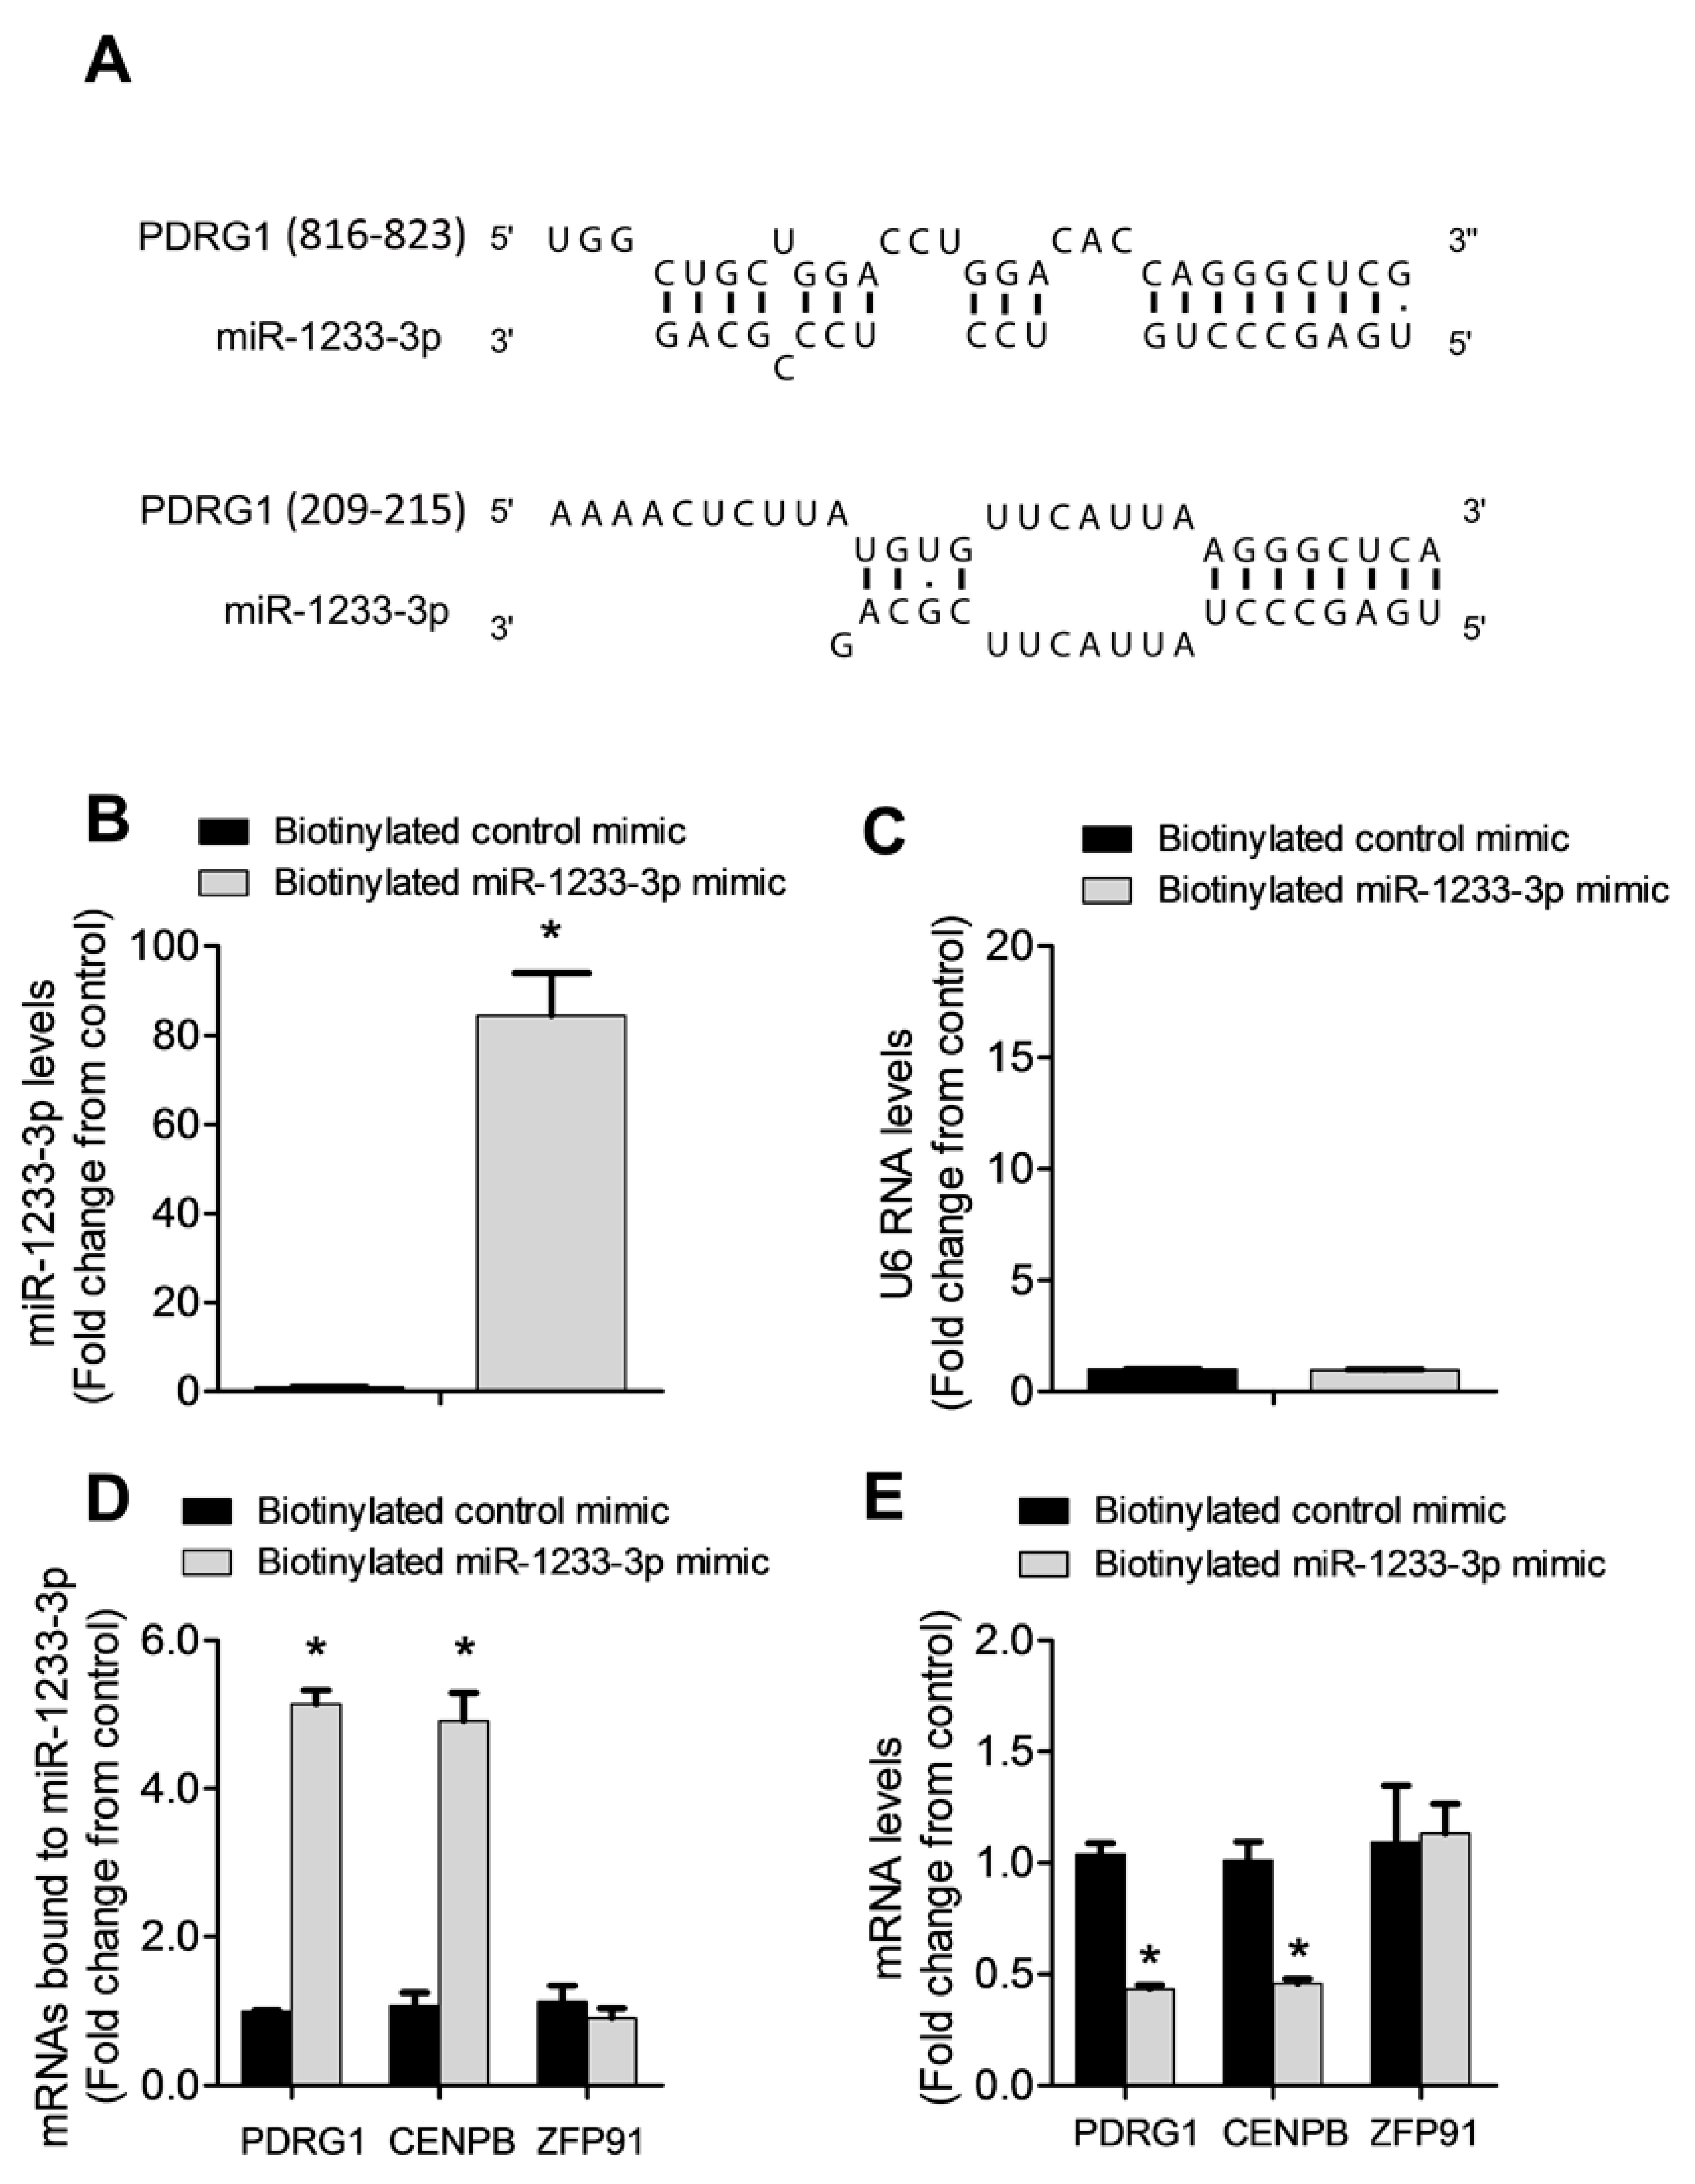
Figure 6.
Ang-1 regulates PDRG1 expression in ECs. A&B: PDRG1 mRNA levels in HUVECs treated with PBS or Ang-1 (300ng/ml) for 2, 4, 6, 10, 12, 24, 48 and 72 hours. C: Representative immunoblots of PDRG1 protein in HUVECs exposed to PBS or Ang-1 for 3, 6, 12 and 24 hours. D: Mean values of PDRG1 protein levels in HUVECs exposed to PBS or Ang-1 for 24 hours. E &F: Representative immunoblots of PDRG1 and β-ACTIN proteins and mean values of PDRG1 protein levels in HUVECs exposed for 24 hours to PBS, Ang-2 (300ng/ml), FGF-2 (10ng/ml) or VEGF (40ng/ml). Values are expressed as means± SEM and are expressed as fold change from PBS. *p<0.05, compared to PBS.
Disclaimer/Publisher’s Note: The statements, opinions and data contained in all publications are solely those of the individual author(s) and contributor(s) and not of MDPI and/or the editor(s). MDPI and/or the editor(s) disclaim responsibility for any injury to people or property resulting from any ideas, methods, instructions or products referred to in the content. |
© 2024 by the authors. Licensee MDPI, Basel, Switzerland. This article is an open access article distributed under the terms and conditions of the Creative Commons Attribution (CC BY) license (http://creativecommons.org/licenses/by/4.0/).
Copyright: This open access article is published under a Creative Commons CC BY 4.0 license, which permit the free download, distribution, and reuse, provided that the author and preprint are cited in any reuse.


