
Submitted:
18 November 2024
Posted:
19 November 2024
You are already at the latest version
Abstract
Resurrection plants are incredibly tolerant to drought. When dried out, they temporarily halt photosynthesis and respiration while protecting cellular structures. Upon rehydration, they rapidly resume normal function, allowing their cells and tissues to become re-energized. Nucle-otides play a crucial role as energy and information carriers in all living organisms. However, the dynamics and functioning of these vital compounds in resurrection plants have not been exten-sively studied. Nucleotide, nucleoside, and nucleobase extraction and analysis are technically challenging, so improved methods are of continued interest, especially techniques that can dis-tinguish the nucleotides’ degree of phosphorylation. Here, we describe an accurate mass, high-resolution hydrophilic interaction chromatography (HILIC-LC-hrMS/MS)- based method for quantitative profiling of nucleotides and their phosphate forms in the resurrection plant Haberlea rhodopensis Friv. The proposed ion-pair free method, exploiting a gradient of both organic com-ponent and buffer salt concentrations, was applied on tissue samples from leaves and roots of H. rhodopensis exposed to dehydration and subsequent rehydration. In the proposed method, 20 analyses (nucleosides and nucleotides) were separated by HILIC. This preliminary study identified remarkable features in nucleotide phosphate content and dynamics during desiccation and sub-sequent rehydration suggesting alternative energy metabolism pathways in drought tolerance of resurrection plants.
Keywords:
Haberlea rhodopensis
; resurrection plant
; nucleotide metabolism
; drought stress
1. Introduction
Haberlea rhodopensis Friv. is a plant native to the Balkans and is a relic species from the Palaeolithic period. It belongs to the Gesneriaceae family [1]. This plant is known as a homoiochlorophyllous resurrection plant because it can endure extreme dehydration in its vegetative tissues while retaining most of its chlorophyll content [2]. When experiencing extreme dehydration (up to 95% water loss), the cells and tissues of resurrection plants must withstand significant challenges to their structure and metabolite content to minimize damage during the process [3]. Stress places increased energy demands on organisms [4]. To survive, they must have enough energy to maintain various stress responses, which are often energy-consuming, such as synthesising osmoprotective metabolites and antioxidants, and enhanced DNA and protein repair functions [5]. How resurrection plants address this energy deficit remains unclear, although some aspects have been elucidated in recent years [4,5,6]. Historically, we confirmed that resurrection plants such as H. rhodopensis Friv. and Ramonda serbica Panc. can maintain their energy supply during severe dehydration, reaching a state of hibernation while keeping higher levels of total phosphorus and nucleotide phosphates compounds. The process of respiration in these plants during desiccation is closely linked to energy metabolism. It maintains the level of nucleotide triphosphates, primarily synthesized during cellular respiration and photosynthesis by ATP synthase [7,8,9]. Furthermore, we have shown the mitochondrial and chloroplast genomes of the H. rhodopensis Friv. play a vital role in these processes [10,11].
Nucleobases, nucleosides, and nucleotides are essential metabolites in living organisms, playing roles in various metabolic and biological processes [12]. Nucleotides are vital for growth and development. They are involved in DNA and RNA synthesis, signal transduction pathways, act as coenzymes in biosynthetic processes, and function as energy reservoirs in biological systems [13,14,15,16,17]. Nucleotide mono-, di- and triphosphates are strongly regulated and contribute to cellular signaling [14]. In plants, purine nucleotides are precursors for synthesizing sucrose, polysaccharides, phospholipids, and purine alkaloids [12]. Quantifying adenylate (ATP, ADP, AMP) levels, has wide-ranging applications in physiological, metabolic, and energetic studies [13,14] and can be used to assess oxidative stress [15]. Cells have sophisticated systems to regulate the balance of these metabolites, including a negative feedback system of nucleotide biosynthesis [16] and the selective production of deoxyribonucleotides by ribonucleotide reductase (RNR) [17].
Improved analysis methods for these compounds are continuously sought after, especially techniques that can differentiate among the nucleotides based on their phosphorylation levels. Various methods have been employed to measure ATP and its related compounds, such as nuclear magnetic resonance spectroscopy (NMR) [18], capillary electrophoresis (CE) [19], radioimmunoassay [20], thin-layer chromatography (TLC) [21], and enzymatic assays [22]. Several methods have been reported for simultaneous quantifying endogenous deoxynucleoside triphosphates (dNTPs) using liquid chromatography-tandem mass spectrometry (LC-MS/MS). For instance, Chen et al. [23] developed a simultaneous quantification method for GTP, CTP, UTP, dATP, dCTP, and dTTP, but this method could not separate ATP and dGTP. Methods for simultaneously quantifying eight NTPs, including ATP and dGTP, have also been reported [24,25]. Still, the chromatography process is slow, and difficulties are faced in resolving all analytes, or at least isobaric ones.
Here, we propose an amid Hydrophilic Interaction Liquid Chromatography Accurate Mass (HILIC) LC-MS/MS method to perform quantitative profiling of nucleosides and nucleotide mono-, di, and triphosphates in H. rhodopensis Friv, capable of separating also nucleobases upon need. The method was applied to samples from leaves and roots exposed to dehydration and subsequent rehydration. The results identified specific changes in macroergic nucleotides during severe drought stress and subsequent rehydration of the model resurrection plant H. rhodopensis. This preliminary study can aid in understanding the molecular mechanisms by which plants solve the problems of stress-related energy deficit.
2. Materials and Methods
2.1. Chemicals and Reagents
Thermo Scientific™ dNTP Mix (10mM each) and individual NTPs (100mM each) from Thermo Scientific™ were used for calibration. HPLC quality standards adenosine, guanosine, cytidine, adenosine monophosphate (AMP), adenosine diphosphate (ADP), guanosine monophosphate (GMP), guanosine diphosphate (GDP), cytidine monophosphate (CMP), cytidine diphosphate (CDP), were purchased from Sigma-Aldrich, Ultra-pure 18MOhms water was prepared by a Elga PureLab ultra high purity water system, Acetonitrile (CAN) and Methanol (MeOH) Optima LC–MS grade were purchased from Thermo Fisher Schientific, Acetic acid, and Ammonium acetate were LC–MS grade, purchased from Merck (Darmstadt, Germany). 0,22 um syringe filters were used for sample filtration before run.
2.2. Plant Material and Water Stress
In vitro plants of H. rhodopensis Friv. were grown at conditions described in [26]. 15 four-month-old in vitro seedlings were transferred to acid soil in a growth chamber at 16 h of light and 8 h of darkness, day/night temperature 22°C, and 60% RH for two months. The dry weight and Relative Water Content (RWC) of leaf and root samples were determined at each sampling point. Samples were collected from 5 individuals – the fresh (hydrated) plant group (90% RWC). The remaining plants were subjected to dehydration by withholding water until they reached a fully desiccated state (8% RWC), at which point five plants were sampled as the fully dehydrated plant group The remaining 5 plants were rewatered, and tissue material was collected at 75% RWC (rehydration). The samples were frozen in liquid nitrogen and stored at -80°C for further analysis. Six samples were used for analysis - leaf samples from plants grown under regular watering (L1), dehydrated plants (L2), and rehydrated plants (L3), and corresponding root samples (R1, R2, and R3).
2.3. Chromatographic Conditions for HILIC Separation and MS Detection
An Accela quaternary HPLC pump with Accela autosampler, and HRMS Q-Exative detector (Thermo Fisher Scientific, Waltham, MA, USA) with H-ESI electrospray were used in the experiments. Chromatographic separation was performed on a BEH XBridge AMID 150 x 2.1 mm 2.5 µm column (Waters Inc, UK).
0,45 micron filtered mobile phases were used consisting of A (90% ACN / 10% Water/Ammonium Acetate 5mM) and B (40% ACN/60% Water / Ammonium Acetate 30mM) for HILIC chromatography. 10 µl sample solution was injected, and the gradient elution program is given in Table 1. Samples were kept at 4oC in a precooled autosampler tray, and the column was kept at 50oC. Samples were introduced into the column in 90%ACN/Water solution.
A 250°C H-ESI vaporizer temperature, spray voltage of 4kV in positive mode, ion transfer tube temperature of 360°C, sheath gas pressure 55psi, auxiliary gas flow 15 (arbitrary units); top 5 “Full MS/data dependent MS2” was performed for additional structural confirmation with the following settings: 70000 FWHM resolution in Full MS from 220 to 550m/z, AGC target was set to 1e6, and the Max IT value was 250msec for Full MS scans, as for fragment spectra scan MS/MS, 17500 FWHM resolution with 1.6m/z quadrupole isolation window of precursor ion, 120ms maximal trap filling time and 35 units (13eV) HCD stepped collision energy with 50% step (6-19 eV) were used for MS detection of plant samples. A 0,2% underfill ratio and 10s dynamic exclusion were set. Quantitation was done in tSIM mode for the lowest concentrations. Accurate mass calibration and tuning were performed with the original calibration solution supplied by Thermo Fisher Scientific every 48 h of operation, and the room temperature was maintained within 22–26°C during operation. Chromatographic peaks were extracted from the full scan chromatograms using Xcalibur 4.4 software (Thermo Fisher Scientific, Waltham, MA, USA).
2.4. Metabolite Extraction
Leaves and roots of six individual plants (biological replicates) in each time point (desiccation state) were gently separated, washed under a shower of UHP water, and processed independently. Plant tissues were immediately frozen in liquid nitrogen, ground in a mortar with liquid nitrogen, and kept at -80oC until analysis. 100 mg pre-weighed sample tissue was extracted with 2.0 ml 18Mohm UHP water boiling for 7 min with occasional vortexing. Samples were centrifuged, evaporated in a vacuum centrifuge, and reconstituted to a final volume with 90% CAN in water before injection. Equal portions from all samples within each sample type (fresh, dry, and rehydrated) were pooled, and 1g of it was accurately weighed and dried in an oven at 110oC until constant weight to obtain the ratio of fresh weight to dry weight of the plant material from each pool. The results for the analyzed samples were then recalculated and expressed as mass concentration per dry weight of plant material.
2.5. Method Validation
The proposed method was validated for linearity, limits of detection and quantification, precision, and recovery. Supplementary Figure S1 shows the calibration graphs for the analytes, and Table 1 gives the slopes for all analytes. Table 2 and Table 3 represent reproducibility and recovery data.
Calibration - Stock solutions of 10 mmol/l were prepared for the analytes by either dissolving the substance in water or diluting commercial standard mixes. Working solutions of 0,1 - 50 µmol/ml of each substance were prepared by diluting the stock solution with the mobile phase. Five-point calibration curves covering the working range of analytes in samples were built before analysis, and an external standard calibration was exploited for quantitation.
Limit of detection (LOD) and limit of quantification (LOQ) - Abundances for all measured compounds were determined by integrating the peak area from their extracted ion chromatograms and ing thcomparem across samples. The LOD for each metabolite was determined based on serial dilutions of an authentic standard until a signal-to-noise ratio of 3:1 compared to baseline noise was reached. Limits of detection were determined with instrumental conditions described in Materials and methods. Targeted single reaction monitoring (tSIM) was also used for LOQ and LOD determination as the most sensitive mode of the instrument with a predefined window of ± 1.6m/z of the targeted molecular ion. tSIM limits are given in brackets in supplementary Table S1.
Precision - One pooled plant sample was extracted 5 times and analysed to determine the method's precision. The same sample was analysed on the same day (intra-day) and on 4 consecutive days for inter-day precision. An intra-day precision of less than 10% (average 7%) and inter-day of less than 20% (average 17%) was achieved for the whole analytical procedure.
The repeatability and reproducibility of the compounds were estimated by calculating the respective relative standard deviation (RSD) values of the concentrations determined and given in Supplementary Table S2.
Relative recovery of the extraction of the analytes was checked by spiking an actual sample with a standard mix of the analytes AMP, ADP, ATP, GTP, CTP, UTP, and TTP before extraction. One sample was analysed in triplicate before spiking and after spiking. Differences between NTPs concentrations after and before the addition of the standard mix were used to calculate the recovery of the procedure. Results are presented in Supplementary Table S3. A recovery of 69 to 90% was achieved.
2.6. Quantification of Metabolites
The amount of metabolites in plant samples was calculated using external standard calibration. The concentration of the analytes in the experimental solutions was then recalculated for the plant material used, taking into account the average recovery for each analyte, dilution of plant extract, and the dry weight of the sample. The results represent the analytes in mass concertation per dry plant tissue.
2.7. Calculation of Metabolites’ Concentration
To determine the concentration of analytes per unit dry mass of the sample, we first determined the mass concentration of the analyte in the sample solution/extract, which was analyzed using the corresponding calibration curve. Then, we calculated the mass concentration per unit dry sample weight using the expression:
C analyte [ug/g dry tissue] = (C solution [ug/ml] × Dilution Factor)/(aliquot of FW [g]) × (FW [g]) /(DW [g])× V extract [ml]); where: C analyte is the concertation of the analyte in the plant sample expressed as mass concentration per dry weight; C solution is the concertation measured in sample solution using the calibration curve; The dilution factor is a coefficient to correct the dilution of the sample extract solution after extraction; Aliquot of FW is the measured mass of plant tissue/sample for extraction and analysis on the analytical balance; The ratio (FW [g])/(DW [g]) is a coefficient to convert the measured weight of the sample to dry weight. It is obtained by clcmeasulating the whole sample of fresh ground plant material (FW) after taking an aliquot for extraction and weighing the same material (DW) after drying; V extract is the volume of the plant extract before dilution.
2.8. Statistical Analysis
All statistical calculations were done in MS Excel.
3. Results
3.1. HILIC-LC-hrMS/MS-Based Method for Quantitative Profiling of Nucleotides
A novel HILIC approach was used to separate nucleobases, nucleosides, nucleotides and deoxy-nucleotides. Based on amid HILIC stationary phase, we developed a simple, ion-pair-free method exploiting the gradient of both organic component and buffer salt concentrations. A HILIC-BEH XBridge Amide column was used in our work for the good results of other researchers and our preliminary experience. Here, we provide another alternative to MS-compatible HILIC separation of nucleotides with vast application possibilities and simple sample preparation to complement the oh opalternations for nucleotides' HILIC analysis. The method can analyse all nucleobases, nucleosides, and nucleotides in one run, is MS compatible, and could be integrated into an LC-MS metabolomics workflow after minor optimization.
3.1.1. Extraction of Nucleotides
The extraction of nucleotides is a key element of the analysis. A standard metabolomics extraction procedure using Water and/or Methanol did not extract the nucleotide phosphates in our samples, which made this approach inappropriate. The extraction with high concentrations of strolid acids like trichloroacetic did not fit our aim to exploit sample preparation and chromatographic conditions that could be easily integrated into a metabolomics workflow, with minimal manipulations to samples, mildest conditions and maximal analyte coverage as well as MS compatibility. For this reason, we preferred to include in our procedure another approach of heating the samples during extraction for 5-15 (7 minutes, 80°C) minutes [27], which turned out to be effective, based on the obtained recoveries between 70 and 90 % for the different nucleotide phosphates (Table S3). The boiling step could be easily combined with the broad extraction procedures in metabolomics, and the combined extract could be further mixed and analyzed in one run. The details of the extraction procedure are described in Materials and Methods. Not least, this sample preparation approach expands the range of possibilities for analyzing nucleotide phosphates in plant samples.
3.1.2. Chromatography and Mass Spectral Detection
We aimed to develop a chromatographic method capable of separating all detectable nucleosides and nucleotides in Haberlea plant samples. We started the optimization of the gradient with Adenine, Adenosine, AMP, ADP, ATP, GTP, CTP, UTP, TTP and their corresponding deoxy triphosphates. When we optimized the chromatographic conditions for satisfactory separation of these analytes, we continued the work of screening pooled in Haberlea rhodopensis plant samples (in ddMS2 mode). Based on the exceptional selectivity of the high-resolution MS detector using the exact masses and MS/MS experiments, we located mono-, di- and triphosphates of Adenosine, Guanosine, and Cytidine in our real plant samples. These compounds were further supplied as analytical standards for quantitative analysis, and the chromatography gradient was optimized to resolve them. Among deoxy ribonucleotide phosphates only dATP and dGTP were detected close to the limit of detection of the method in fresh leaves and roots.
According to the previous analysis of Arabidopsis thaliana [28], ribonucleotide phosphates were expected in concentrations above 10 nmol/g in fresh plant leaves, and deoxy nucleotide phosphates were expected to be found in much lower concentrations than ribonucleotide phosphates (less than 0,1 nmol/l). Our detection limits were not low enough to cover this concentration range (LOQ for plant tissue 1-4 nmol/g with tSIM mode) for quantitating deoxy nucleotides, but the fact that we still detected dATP and dGTP is indicative that they might be elevated in Haberlea compared to other plant species. Figure 1 shows the selected ion monitoring (tSIM) traces for the analytes injected as 10 µL of a standard solution containing all the analytes (in 90%CAN/10%H2O). The separation of the analytes was achieved in a total time of less than 16 min.
The elution of nucleotide phosphates demanded a higher concentration of ammonium acetate as they were firmly retained on the column. At the same time, nucleosides and nucleobases were better separated with lower buffer concentrations, for which we used a gradient of the ammonium acetate to best resolve all the compounds. The detection of the analytes was done in targeted SIM mode (the most sensitive mode of detection of the Q-Exactive detector) with MS/MS confirmation. This detection mode is; however, less sensitive than last generation triple quadrupoles in MRM mode, and some of the nucleotides were below the LOD. The use of a triple quadrupole as well as a pre-concentration step [28] might permit the detection of more analytes (mainly deoxyribonucleotides) within the same sample preparation and chromatography step. Retention times, exact masses, and characteristic MS/MS ions for the detected analytes are shown in Supplementary Table S4 and quantitative results in Table 2 and Table 3. Supplementary Figure S1 presents calibration graphs for the analytes measured. Supplementary Table S1 gives the limits of detection and quantification. Supplementary Tables S2 and S3 present the method's reproducibility and recovery data.
3.2. Ribonucleotide Phosphate and Nucleoside Dynamics During Dehydration and Rehydration of the Model Resurrection Plant H. rhodopensis
In this work, the levels of ribonucleotide and deoxyribonucleotide and their mono-, di-, and tri-phosphate forms were determined in leaf and root extracts of Haberlea rhodopensis. The results suggest intriguing prospects for further research and analysis (Table 2 and Table 3, Figure 2).
To assess relative ribonucleotide phosphate levels, we calculated the proportions of Guanine, Cytosine, and Uracil ribonucleotide phosphate pools (each pool is calculated as the sum [NMP]+[NDP]+[NTP]) and expressed them as a percentage of the Adenine pool. The results are presented in Supplementary Table S5. The adenine nucleotide pool is critical for energy metabolism and the energy state of all living cells. We examined three important ratios for evaluating the bioenergetic characteristics of cells and tissues: the ATP/AMP ratio, the ATP/ADP ratio, and the adenylate energy charge (AEC). Adenylate energy charge, originally defined by Atkinson [29,30] is calculated as the ratio of ([ATP]+0,5[ADP])/ ([ATP]+[ADP]+[AMP]). The ratios for control, desiccated and rehydrated samples are presented in Table 4.
4. Discussion
4.1. Advantages and Disadvantages of the Method for Nucleotide Separation
As nucleotide phosphates and related metabolites are a crucial player in many biological processes in living systems, several scientific articles increasingly discuss a variety of analytical strategies for their analysis in recent years, combining different approaches for sample preparation [31], capillary electrophoretic [19,32] or chromatographic separation [13,14,15,16, HH-HHH] modes and detection. Methods exploiting reversed phase with ion pairing [33], ion exchange [34,35], and mixed mode [36] to different HILIC variants [28,34] and porous graphite carbon [37] columns are available in the literature, discussing different applications and specific analytical purposes. UV accomplishes the detection of analytes [33], fluorescent [35], and other mass spectral detectors, including triple quadrupole [28], Q-Trap [38], or Q-TOF [37]. Most of the chromatographic options, however, include phosphate buffers as mobile phases or other MS, not compatible modifiers, which makes them difficult to couple to the electrospray MS. Some of the papers exploiting mass spectrometry use direct infusion [38], which provide helpful mass spectral parameters and spectral information but are challenging to apply for samples with highly complex matrix as plant extracts and metabolomics samples are.
An optimized method for analysis of NTPs and dNTPs by Mateos-Vivas et al. [15] was published recently, using ion pairing and providing possibly the best separation and analytical parameters for these extremely hydrophilic and difficult-to-separate compounds on a HILIC stationary phase. Although practical, ion-pairing reagents do not permit the incorporation of the method in a universal LC-MS metabolomics workflow, bringing additional difficulties to the optimization process. On the other hand, these metabolites are interesting to be monitored with other metabolites to understand molecular mechanisms in living systems better. In our work, we aimed to use a universal MS-compatible buffer only and manage separation through a gradient of the ionic strength of the mobile phase. For this reason, ammonium acetate buffer ranged from 5 mM up to 30 mM concentration in the mobile phase. With the XBridge Amide column and the most commonly used HILIC low buffer concentration of 5-10 mM in the mobile phase, nucleotide phosphates (especially di- and tri) are retained by the column and hardly elute from it. A gradient of both the organic component of the mobile phase and the buffer salt resulted in a comparatively good separation of nucleotides. Combined with high-resolution MS and/or MS/MS all analytes were resolved. The critical isobaric ATP and dGTP were chromatographically resolved, as well as CTP, UTP, and TTP, which differ in one mass unit, and their isotopic peaks may interfere when analysed with low-resolution MS detection. Further improvement of the detection limits is possible with pre-concentration of samples and/or triple quadrupole MRM detection with even faster chromatography.
4.2. Dynamics of Nucleotide Phosphates During Desiccation and Rehydration
Although resurrection plants' extreme drought stress tolerance is explained by various genetic, epigenetic, and metabolic adaptations [5,6,7,8,9,39,40,41,42,43], their nucleotide phosphate metabolism during biosis-anabiosis and back transitions remains poorly understood. The isolation and analysis of ribonucleotide mono-, di-, and triphosphates and nucleosides using the novel separation method described here yields new information that may point to previously unknown stress responses in the resurrection species H. rhodopensis. Some of the most intriguing findings are described below.
4.2.1. High Adenosine Levels
High adenosine levels are most evident in our results (Table 2 and Table 3 and Figure 2). Adenosine is the most abundant nucleotide compound in most extracts; moreover, it exceeds the control levels 2 to 4 times in rehydrated samples. The explanation for this phenomenon is unclear, especially given the scarce literature on plant adenosine levels. Oliver et al. report elevated levels of adenosine and other related compounds in the resurrection plant Sporobolus stapfianus compared to its drought-sensitive sister species S. pyramidalis but doesn’t propose an explanation or hypothesis [44]. One possibility is that the excess of adenosine in our data for H. rhodopensis is related to the activation of RNA degradation and nucleoside salvage pathways during the recovery after desiccation. Another more intriguing possibility is that adenosine excess is related to a still unknown signaling process in resurrection plants. Adenosine signaling and adenosine receptors are not known to exist in plants so far, although in animals’ adenosine is an essential endogenous stress signal in the nervous and immune systems [45,46]. These observations are intriguing and need further investigation.
4.2.2. Nucleotide Stability During Dehydration
During desiccation, Haberlea tissues lose most of their water content (5-8% RWC) Levels of almost all NPs and nucleosides fall significantly in desiccated compared to control samples (Table 2 and Table 3). In general, purine (A and G) mono- and diphosphate levels in all leaf samples are more stable than the corresponding triphosphate levels. ATP levels in dehydrated plant leaves drop to 1% of those in fresh control leaves, while AMP drops only to 38% and ADP to 15% of control levels. The corresponding variations in guanine nucleotide phosphates follow a similar trend (Figure 2, Table 3). All pyrimidine pools in H. rhodopensis drop substantially during desiccation, with one notable exception: CMP, is remarkably stable, retaining over 90% of its initial content in desiccated roots (Table 3). The reason for this observation is still unclear.
4.2.3. Nucleotide Recovery After Rehydration
Remarkably, all detected nucleosides in leaves, as well as adenosine and cytidine in roots, show 2 to 4-fold increase in rehydrated compared to control samples (Table 2 and Table 3). The reason for this accumulation is unclear.
During the rehydration process, all nucleotide mono-, di- and triphosphate levels regenerate to varying degrees. In leaf samples, ATP and GTP regenerate to 58% and 33% of their control levels, respectively. In comparison, AMP regenerates at 113% and GMP at 159% of control levels, or these molecules are even more abundant in rehydrated than in control leaves (Figure 2, Table 3). The situation is similar with purine diphosphates.
Because ATP and GTP are the main energy-supplying molecules, their significant depletion in leaves could be attributed to the energy demand for urgent structural modifications and adaptations in the cellular and molecular structures of the resurrection plant to survive the severe drought (5-8% RWC), and subsequent reversal of these events during rehydration when recovered plant tissues engage in intensive biosynthetic processes. These biotic-anabiotic and back transitions demand a lot of energy, which could be reflected in our results as less effective ATP and GTP regeneration or as ATP and GTP depletion.
Another surprise comes again from the cytosine pool, where CDP level in rehydrated roots increases twice representing nearly 218% of the CDP level in control plants. Below we speculate about the reason for this observation.
4.2.4. Unusual Relative Pyrimidine Nucleotide Levels
According to the literature, in the majority of plants, the adenine nucleotide pool is the largest, followed by the uracil nucleotide pool, the guanine nucleotide pool (which is typically 10–25 percent of the adenylate nucleotide pool), and the cytosine nucleotide pool is the smallest [12,28,47, chapter 1]. In H. rhodopensis samples, we find that the adenine nucleotide pool is the largest (Supplementary Table S5), consistent with literature data [12]. The guanine pool in our control and rehydrated samples, is the second largest, confirmed in the literature [12,28]. However, relative amounts of pyrimidine nucleotides differ significantly in H. rhodopensis compared to non-resurrection species. In our data, cytosine levels exceed uracil in all samples and stages (Table 2 and Table 3 and Figure 2). More precisely, the cytosine levels in H. rhodopensis are close to the literature data, but uridine ones are significantly decreased (Table S5). The reason for this is not apparent, but some speculations could be made.
CTP and CDP are particularly important for lipid metabolism and membrane integrity in stress conditions. CDP-diacylglycerol is a critical precursor for the synthesis of essential components of cellular membranes, and recent studies have highlighted its importance in maintaining lipid homeostasis and membrane integrity in plant cells [48] The enzyme CTP synthase (CTPS) catalyzes the conversion of UTP to CTP, a key regulatory step in maintaining the balance of nucleotide pools within the cell, and some of CTPS isoforms are upregulated in stress conditions in other plants [49]. When cellular demands for CTP increase, as under stress conditions, CTPS can polymerise into dynamic filamentous structures known as cytoophidia, which help to modulate the availability of CTP, and play essential roles in cellular stress responses and metabolic regulation. [50]. The elevated cytidine levels and reduced uridine levels in our data could be explained in part by the assumption that CTPS in H. rhodopensis might be more active than in non-resurrection plant species which might cause temporary depletion of its substrate UTP and the precursors UMP and UDP. This assumption could be tested through CTPS activity assays and/or fluorescence microscopy visualisations of cytoophidia growth and degradation during desiccation and rehydration of H. rhodopensis tissue samples. This speculation is supported also by the observed increased stability during desiccation and recovery after rehydration of cytozine, CMP, and CDP in Haberlea roots (see above).
4.2.5. The Energy Status of a Resurrection Plant’s Cells
Three important ratios used to evaluate the bioenergetic properties of cells and tissues are often used to assess cells’ energy status: ATP/AMP ratio, ATP/ADP ratio, and adenilate energy charge (AEC) [29,30]. We compared these ratios calculated from our research data for H.rhodopensis leaf samples subjected to desiccation and rehydration (Table 4) to the same ratios from the literature for leaf samples from other non-resurrection higher plants: cereal leaves [12], Arabidopsis thaliana, Nicotiana tabacum, Lycopersicon esculentum and Camelia sinensis [47] (Supplementary Table S6). The adenylate energy charge and adenylate ratios in H.rhodopensis control and rehydrated samples are similar to those of other non-resurrection plant species, especially the tea plant, Camelia sinensis, with remarkably high ATP/AMP and AEC values.
In the tea plant Camelia sinensis, up to 21 miRNA families, targeting mainly transcription factors, have significantly altered expression during drought stress [51]. In H. rhodopensis, miRNAs also participate in drought stress response. It was found recently by members of our research group that spcifcertaic miRNAs from the miR399 family are down-regulated in the desiccated tissue of H. rhodopensis Friv. and up-regulated upon re-hydration [52]. In other non-resurrection species, miR399 family members modulate drought, salinity and ABA stress responses in Arabidopsis [53], and nutrient starvation stress in rise [54]. We propose that in H. rhodopensis under severe drought stress, repression of miR399 may counteract phosphate uptake and phosphate allocation from root to leaf, which helps to reduce photosynthesis and photo-oxidative damage in desiccated leaves. In turn, the induction of miR399 during the rehydration could result in fast de-repression of phosphate uptake and its allocation to leaves, stimulating photosynthesis and growth [52].
Some features of H. rhodopensis chloroplast genome indicate the accelerated evolution of several protein subunits related to energy metabolism. The relaxed selection pressure on psaI and psbI, which encode integral thylakoid membrane proteins, could reflect recent adaptations of the photosynthetic apparatus to recurrent desiccation and rehydration. Also, the relaxed selection for the ATP synthase subunit atpE as well as the existence of positively selected sites in its sequence may be associated to recent desiccation stress adaptations [10]. Possibly, these proposed evolutionary adaptations could also affect the nucleotide metabolism, but the exact relationships need further investigation and understanding.
5. Conclusions
Here we propose an alternative HILIC separation within a LC-hrMS(MS) method for quantitation of nucleosides, nucleotides, and deoxynucleotides in plant tissue. This method enables the separation and analysis of these metabolites within a single run in a high throughput manner. The method was applied to track the dynamics of H. rhodopensis nucleotide metabolism during the transition from biosis to anabiosis and back. The analysis revealed unusually high adenosine levels, increased accumulation of certain nucleosides and nucleotides after rehydration, significant variations in relative nucleotide phosphate levels compared to non-resurrection species, and the relatively high energy status of H. rhodopensis tissues. These findings suggest that the nucleotide metabolism of the resurrection plant H. rhodopensis might exhibit unique traits and adaptations that will require further investigation.
Supplementary Materials
The following supporting information can be downloaded at the website of this paper posted on Preprints.org, Figure S1. Calibration graphs for Nucleotide mono- di- tri- phosphates; Table S1. Analytical figures of merit. Limits of detection are presented for Full Scan mode, SIM mode (in brackets) and for dMS2; Table S2. Inerday and Intra-day precision data expressed in relative standard deviation. One sample analysed 5 times in the same daya and on 5 consecutive days; Table S3. Relative recovery of NPs; Table S4. Chromatographic and mass spectral identification data for 17 detected compounds; Table S5. The sum of the concentrations in µg/g dry weight of ribonucleotide mono-, di-, and triphosphate pools ([NTP]+[NDP]+[NMP]) in H. rhodopensis. The gray columns represent the G, C, and U percentage ratios relative to the A pool; Table S6. Important adenylate ratios.
Author Contributions
Conceptualization, K.B. and I.M; methodology, K.B.; validation, K.B; investigation, K.B., E.A., and E.D.; resources, E.D; supervision, I.M., and G.Y.; project administration, I.M.; writing—original draft preparation, K. B., E.D., and E.A.; funding acquisition, G.Z. and E.A; writing—review and editing, G.Z., I. M., E.D. and G.Y. All authors have read and agreed to the published version of the manuscript.”
Funding
At the University of Plovdiv, this study is financed by the European Union-NextGenerationEU, through the National Recovery and Resilience Plan of the Republic of Bulgaria, project BG-RRP-2.004-0001-C01. At CPSBB and IMBB, this research work was supported by the European Union’s Horizon 2020 research and innovation program, project PlantaSYST (SGA-CSA No. 739582 under FPA No. 664620), and by the European Regional Development Fund through the Bulgarian “Science and Education for Smart Growth” Operational Program (project BG05M2OP001-1.003-0001 C4).
Institutional Review Board Statement
Not applicable.
Informed Consent Statement
Not applicable.
Data Availability Statement
Not applicable.
Acknowledgments
The authors are grateful to Elena Kadiiska, FOT Ltd, Bulgaria for providing the analytical column used in this research work.
Conflicts of Interest
The authors declare no conflicts of interest.
References
- Committee for Conservation of Nature at the Ministry of Bulgaria Red Book of Bulgaria, vol. 1 – Plants”, Publisher: BAS, Sofia, 1984, p.349.
- Ganchev, I. Anabiotic desiccation resistance and other biological traits of Haberlea rhodopensis Friv. Rep. Inst. Bot. Bulg. Acad. Sci. 1950, 1, 191–214. [Google Scholar]
- Rascio, N., Rocca, N.L. Resurrection plants: the puzzle of surviving extreme vegetative desiccation. Crit. rev. plant sci. 2005 May 1;24(3),209-25. [CrossRef]
- Dragičević, V. Thermodynamics of abiotic stress and stress tolerance of cultivated plants. Recent Advances in Thermo and Fluid Dynamics. Gorji-Bandpy M.(eds.), INTECH, Rijeka, Croatia. 2015 Dec 21, 195-221.
- Asami, P., Mundree, S., Williams, B. Saving for a rainy day: control of energy needs in resurrection plants. Plant sci. 2018 Jun 1;271, 62-66. [CrossRef]
- Gechev, T., Lyall, R., Petrov, V., Bartels, D. Systems biology of resurrection plants. Cell and Mol Life Sci. 2021 Oct;78(19-20), 6365-94. [CrossRef]
- Minkov, I., Kimenov, G., Kalucheva, I. Structural characteristics of the chloroplaste of Haberlea rhodopensis Friv. upon drying and restoration. Compt. Rend. Bulg. Acad. Sci., 1977 30(6), 897-900.
- Kimenov GP, Markovska YK, Tsonev TD. Photosynthesis and transpiration of Haberlea rhodopensis FRIV. in dependence on water deficit. Photosynthetica. 1989 Jan 1;23, 368-371.
- Markovska, Y.K., Tsonev, T.D., Kimenov, G.P., Tutekova, A.A. Physiological changes in higher poikilohydric plants Haberlea rhodopensis Friv. and Ramonda serbica Panc. during drought and rewatering at different light regimes. J. plant phys. 1994, 144, 100–108. [CrossRef]
- Ivanova, Z., Sablok, G., Daskalova, E., Zahmanova, G., Apostolova, E., Yahubyan, G., Baev, V. Chloroplast genome analysis of resurrection tertiary relict Haberlea rhodopensis highlights genes important for desiccation stress response. Front. Plant Sci. 2017 Feb 20;8, 204. [CrossRef]
- Baev, V., Ivanova, Z., Yahubyan, G., Toneva, V., Apostolova, E., Minkov, G., Minkov, I. Analysis of the complete mitochondrial genome sequence of the resurrection plant Haberlea rhodopensis. Acta Biochimica Polonica. 2021 May 12;68(2), 277-86. [CrossRef]
- Stasolla, C., Katahira, R., Thorpe, T. A., Ashihara, H., Purine and pyrimidine nucleotide metabolism in higher plants. J. plant phys. 2003, 160, 1271–1295. [CrossRef] [PubMed]
- Studzińska, S. Studzińska, S., Buszewski, B., Effect of mobile phase pH on the retention of nucleotides on different stationary phases for high-performance liquid chromatography. Anal. bioanal chem. 2013, 405, 1663–1672. [Google Scholar] [CrossRef] [PubMed]
- Yeung, P., Ding, L., Casley, W. L., HPLC assay with UV detection for determination of RBC purine nucleotide concentrations and application for biomarker study in vivo. J. pharm. biomed. anal. 2008, 47, 377–382. [CrossRef] [PubMed]
- Mateos-Vivas, M., Rodríguez-Gonzalo, E., García-Gómez, D., Carabias-Martínez, R., Hydrophilic interaction chromatography coupled to tandem mass spectrometry in the presence of hydrophilic ion-pairing reagents for the separation of nucleosides and nucleotide mono-, di- and triphosphates. J. Chromatogr. A 2015, 1414, 129–137. [CrossRef]
- Sebestik, J., Hlavacek, J., Stibor, I., Molecular recognition of cyclic-nucleotides and current sensors for their detection. Curr Protein and Peptide Sci. 2005, 6, 133–142. [CrossRef] [PubMed]
- Ataullakhanov, F. I., Vitvitsky, V. M., What determines the intracellular ATP concentration. Biosci. rep. 2002, 22, 501–511. [CrossRef] [PubMed]
- Gariod, L., Binzoni, T., Ferretti, G., Le Bas, J. F., Reutenauer, H., Cerretelli, P., Standardisation of 31 phosphorus-nuclear magnetic resonance spectroscopy determinations of high energy phosphates in humans. Eur. J. app. &occup. Phys. 1994, 68, 107–110. [CrossRef]
- Nguyen, A. L., Luong, J. H., Masson, C., Determination of nucleotides in fish tissues using capillary electrophoresis. Anal. chem. 1990, 62, 2490–2493. [CrossRef] [PubMed]
- Roberts, B., Morris, B. A., Clifford, M. N., Comparison of radioimmunoassay and spectrophotometric analysis for the quantitation of hypoxanthine in fish muscle. Food chem. 1991, 42, 1–17. [CrossRef]
- Dingle, J. R., Hines, J. A., Fraser, D. I., Post-mortem degradation of adenine nucleotides in muscle of the lobster, Homarus americanus. J Food Sci. 1968, 33, 100–103. [CrossRef]
- Luong, J. H. T., Male, K. N., Development of a new biosensor system for the determination of the hypoxanthine ratio, an indicator of fish freshenss. Enz Microb Tech. 1992, 14, 125–130. [CrossRef]
- Chen, P., Liu, Z., Liu, S., Xie, Z., Aimiuwu, J., Pang, J., et al., A LC-MS/MS method for the analysis of intracellular nucleoside triphosphate levels, Pharm res, 2009. 26, 1504-1515. [CrossRef]
- Zhang, W., Tan, S., Paintsil, E., Dutschman, G. E., Gullen, E. A., Chu, E., Cheng, Y. C., Analysis of deoxyribonucleotide pools in human cancer cell lines using a liquid chromatography coupled with tandem mass spectrometry technique. Biochem pharmacol. 2011, 82, 411–417. [CrossRef] [PubMed]
- Kamčeva, T., Bjånes, T., Svardal, A., Riedel, B., Schjøtt, J., Eide, T., Liquid chromatography/tandem mass spectrometry method for simultaneous quantification of eight endogenous nucleotides and the intracellular gemcitabine metabolite dFdCTP in human peripheral blood mononuclear cells. J. Chromatogr. B 2015, 1001, 212–220. [CrossRef]
- Daskalova, E., Dontcheva, S., Yahoubian, G., Minkov, I., Toneva, V., A strategy for conservation and investigation of the protected resurrection plant Haberlea rhodopensis Friv. BioRisk 2011, 6, 41–60. [CrossRef]
- Strehler B.L.. Adenosine-5′-triphosphate and creatine phosphate: determination with luciferase. In: Methods of enzymatic analysis, Academic Press, 1965, 559-572.
- Straube H, Niehaus M, Zwittian S, Witte C.P., Herde M. Enhanced nucleotide analysis enables the quantification of deoxynucleotides in plants and algae revealing connections between nucleoside and deoxynucleoside metabolism. Plant Cell. 2021, 33, 270–289. [CrossRef] [PubMed]
- Atkinson, D. E. In: Cellular Energy Metabolism and Its Regulation, Publisher: Academic Press, New York, USA, 1977.
- Atkinson D.E., Chapman A.G.. The adenylate energy charge in the study of enzymes in vitro. In: Methods in Enzymology. Publisher: Academic Press, New York, USA. Vol. 55, 1979, 229-235.
- Straube, H., Witte, C.P., Herde, M. Analysis of nucleosides and nucleotides in plants: an update on sample preparation and LC–MS techniques. Cells. 2021 Mar 20;10(3), 689. [CrossRef]
- Haas, T.M., Qiu, D., Häner, M., Angebauer, L., Ripp, A., Singh, J., Koch, H.G., Jessen-Trefzer, C., Jessen, H.J. Four phosphates at one blow: access to pentaphosphorylated magic spot nucleotides and their analysis by capillary electrophoresis, J. Org. Chem. 2020 Jun 5;85(22), 14496-506. [CrossRef]
- Kutsumanchi, P., Rogers R.. Separation and Analysis of Mono-Di- And Tri- Phosphate Nucleotides from Cell Extract Using Reversed Phase HPLC, J Chromatogr Sep Tech., 2019, Vol.12 Iss.9.451.
- Gautam, N., Alamoudi, J.A., Kumar, S. Alnouti, Y. Direct and indirect quantification of phosphate metabolites of nucleoside analogs in biological samples. J pharm biomed anal. 2020, 178, 112902. [CrossRef]
- Sawada, S., Ono, R., Sato, T., Suzuki, S., Arakawa, O. Kasai, M. Determination of sugar phosphates and nucleotides related to photosynthetic metabolism by high-performance anion-exchange liquid chromatography with fluorometric and ultraviolet detection. Anal biochem. 2003, 314, 63–69. [CrossRef] [PubMed]
- Rahm, M., Kwast, H., Wessels, H.J., Noga, M.J., Lefeber, D.J. Mixed-phase weak anion-exchange/reversed-phase LC–MS/MS for analysis of nucleotide sugars in human fibroblasts. Anal bioanal chem, 2024, Apr.27, 1-10. [CrossRef]
- Pabst, M., Grass, J., Fischl, R., Leonard, R., Jin, C., Hinterkorner, G., Borth, N., Altmann, F., Nucleotide and nucleotide sugar analysis by liquid chromatography-electrospray ionization-mass spectrometry on surface-conditioned porous graphitic carbon. Anal chem, 2010, 82(23), 9782-9788. [CrossRef]
- Strzelecka, D., Chmielinski, S., Bednarek, S., Jemielity, J., Kowalska, J. Analysis of mononucleotides by tandem mass spectrometry: investigation of fragmentation pathways for phosphate-and ribose-modified nucleotide analogues. Sci Rep. 2017, 7(1), 8931. [CrossRef]
- Farrant, J. M., Brandt, W., Lindsey, G.G., An overview of mechanisms of desiccation tolerance in selected angiosperm resurrection plants, Plant Stress, 2007, 1 (1), 72–84.
- Dinakar, C., Bartels, D. Desiccation tolerance in resurrection plants: new insights from transcriptome, proteome and metabolome analysis. Front Plant Sci. 2013 Nov 28 (4), 482. [CrossRef]
- Xu, X., Legay, S., Sergeant, K., Zorzan, S., Leclercq, C.C., Charton, S., Giarola, V., Liu, X., Challabathula, D., Renaut, J., Hausman, J.F. Molecular insights into plant desiccation tolerance: Transcriptomics, proteomics and targeted metabolite profiling in Craterostigma plantagineum. The Plant J. 2021 Jul;107(2), 377-98.
- Georgieva, K., Dagnon, S., Gesheva, E., Bojilov, D., Mihailova, G., Doncheva, S. Antioxidant defense during desiccation of the resurrection plant Haberlea rhodopensis. Plant Phys. Biochem. 2017, May 1;114, 51-9. [CrossRef]
- Oliver, M.J., Farrant, J.M., Hilhorst, H.W., Mundree, S., Williams, B., Bewley, J.D. Desiccation tolerance: avoiding cellular damage during drying and rehydration. Ann Rev Plant Biol. 2020 Apr 29;71, 435-60. [CrossRef]
- Oliver, M.J., Guo, L., Alexander, D.C., Ryals, J.A., Wone, B.W., Cushman, J.C. A sister group contrast using untargeted global metabolomic analysis delineates the biochemical regulation underlying desiccation tolerance in Sporobolus stapfianus. The Plant Cell. 2011 Apr 1;23(4), 1231-48. [CrossRef]
- Fredholm, B.B. Adenosine, an endogenous distress signal, modulates tissue damage and repair. Cell Death & Differ. 2007, Jul;14(7),1315-23. [CrossRef]
- Liu, H., Xia, Y. Beneficial and detrimental role of adenosine signaling in diseases and therapy. J Appl Physiol. 2015 Nov 15;119(10), 1173-82. [CrossRef]
- Ashihara, H., Crozier, A., Ludwig, I.A. Plant nucleotide metabolism: Biosynthesis, degradation, and alkaloid formation. John Wiley & Sons; 2020, 15-35.
- Kobayashi, M., Kouzu, N., Inami, A., Toyooka, K., Konishi, Y., Matsuoka, K., & Matoh, T. Characterization of Arabidopsis CTP: 3-deoxy-D-manno-2-octulosonate cytidylyltransferase (CMP-KDO synthetase), the enzyme that activates KDO during rhamnogalacturonan II biosynthesis. Plant & Cell Physiol, 2011, 52(10), 1832-1843.
- Krämer, M., Dörfer, E., Hickl, D., Bellin, L., Scherer, V., Möhlmann, T. Cytidine triphosphate synthase four from Arabidopsis thaliana attenuates drought stress effects. Front Plant Sci, 2022, 13, 842156. [CrossRef]
- Yin, Y., Yu, H., Wang, X., Hu, Q., Liu, Z., Luo, D., & Yang, X. Cytoophidia: a conserved yet promising mode of enzyme regulation in nucleotide metabolism. Mol Biol Rep, 2024, 51(1), 245. [CrossRef]
- Guo, Y., Zhao, S., Zhu, C., Chang, X., Yue, C., Wang, Z., Lin Y., Lai, Z. Identification of drought-responsive miRNAs and physiological characterization of tea plant (Camellia sinensis L.) under drought stress. BMC Plant Biol, 2017, Dec, 17, 1-20. [CrossRef]
- Apostolova, E., Gozmanova, M., Nacheva, L., Ivanova, Z., Toneva, V., Minkov, I., Baev, V. and Yahubyan, G. MicroRNA profiling the resurrection plant Haberlea rhodopensis unveils essential regulators of survival under severe drought. Biologia plantarum, 2020, 64(1). [CrossRef]
- Baek, D., Chun, H.J., Kang, S., Shin, G., Park, S.J., Hong, H., Kim, C., Kim, D.H., Lee, S.Y., Kim, M.C., Yun, D.J. A role for Arabidopsis miR399f in salt, drought, and ABA signaling. Molecules and Cells. 2016, Feb 1;39(2), 111-8. [CrossRef]
- Hu, B., Wang, W., Deng, K., Li, H., Zhang, Z., Zhang, L., Chu, C.. MicroRNA399 is involved in multiple nutrient starvation responses in rice. Front Plant Sci. 2015, Mar 24;6,188. [CrossRef]
Figure 1.
Representative chromatogram of nucleotides. Individual accurate mass traces are presented for each analyte according to the corresponding molecular ion extracting mass ±0,001m/z. Deoxynucleotide phosphates are given with a dotted line. a) 1 – adenine; 2 – adenosine; 3 - cytidine; 4 - guanosine; 5 - adenosine monophosphate; 6 - cytidine monophosphate; 7 –guanosine monophosphate; 8 - adenosine diphosphate; 9 - cytidine diphosphate; 10 - guanosine diphosphate; 11 - thymine triphosphate; 12 - adenosine triphosphate; 13 - cytidine triphosphate; 14 - uridine triphosphate; 15 – guanosine triphosphate; Nucleotides and nucleobases: 3ug/ml; Nucleotide phosphates: 10ug/ml; b) Isobaric pair adenosine monophosphate / deoxyguanosine monophosphate with tSIM (up) and tMS2 (down) modes of detection; c) 16 - deoxythymidine triphosphate; 17 - deoxyadenosine triphosphate; 18 - deoxycytidine triphosphate; 19 - deoxyuridine triphosphate; 20 - deoxyguanosine triphosphate;.
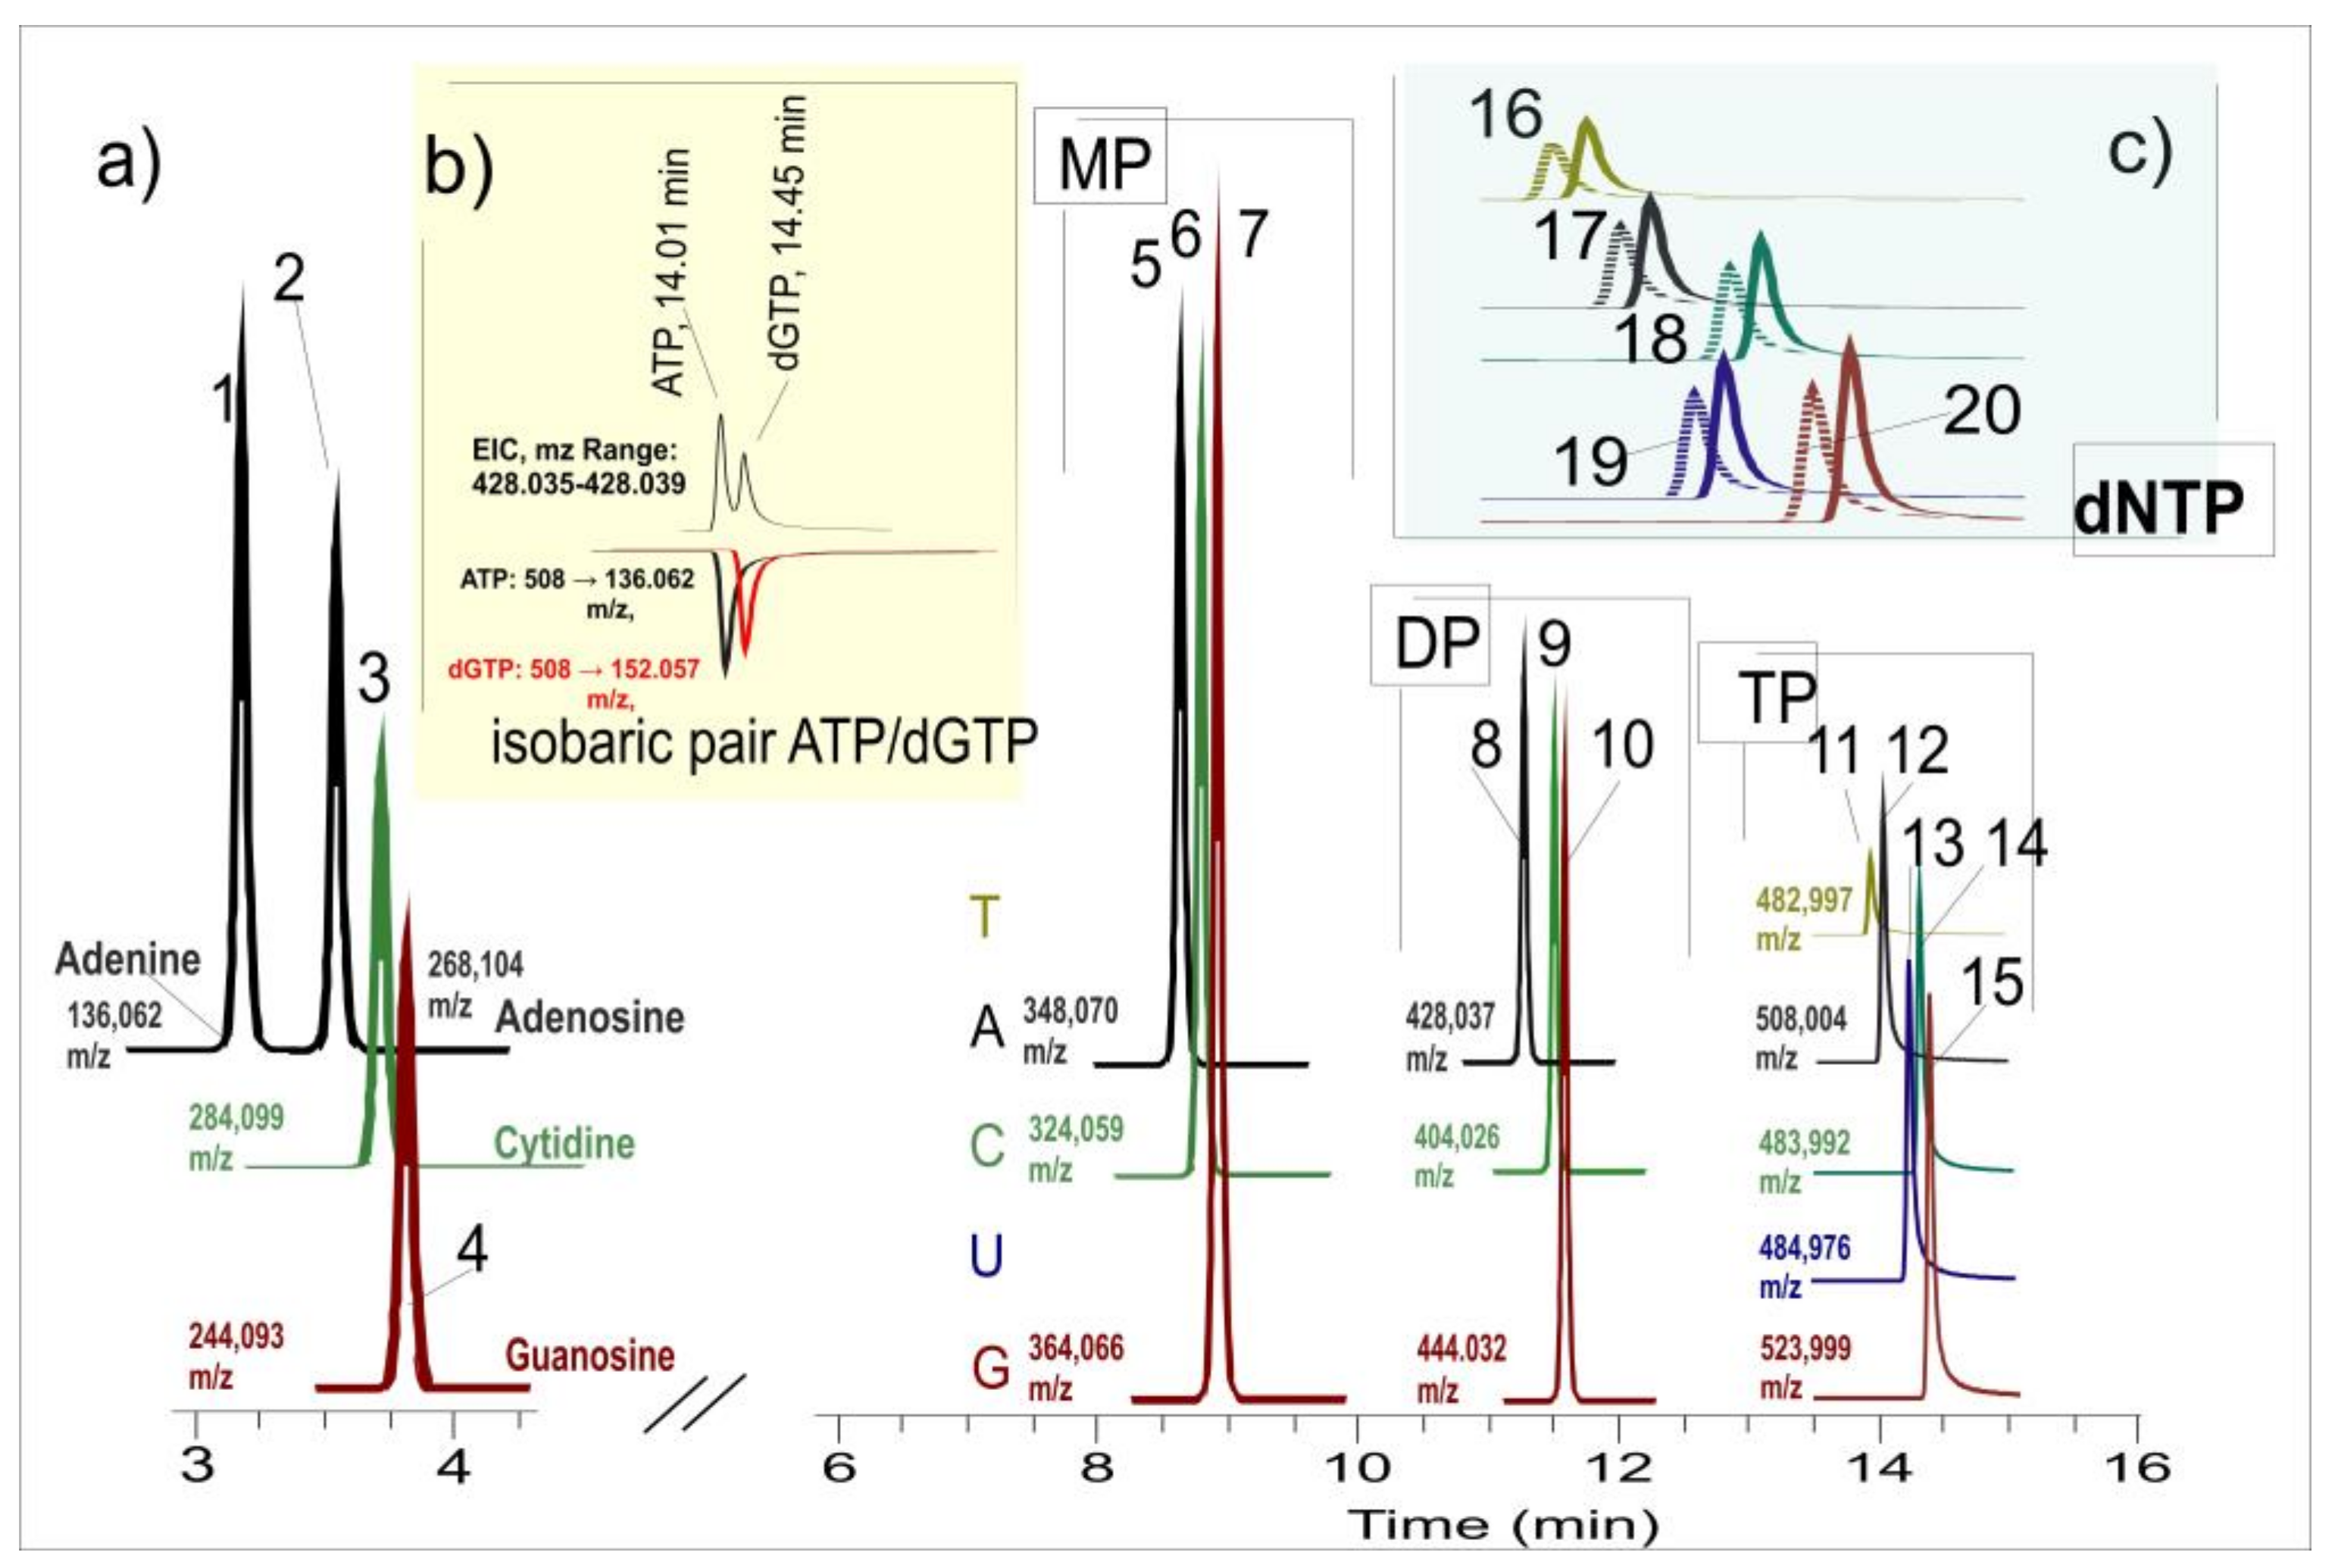
Figure 2.
Levels of ribonucleotide mono-, di- and tri-phosphates and nucleosides detected in leaf and root extracts of H. rhodopensis.
Figure 2.
Levels of ribonucleotide mono-, di- and tri-phosphates and nucleosides detected in leaf and root extracts of H. rhodopensis.
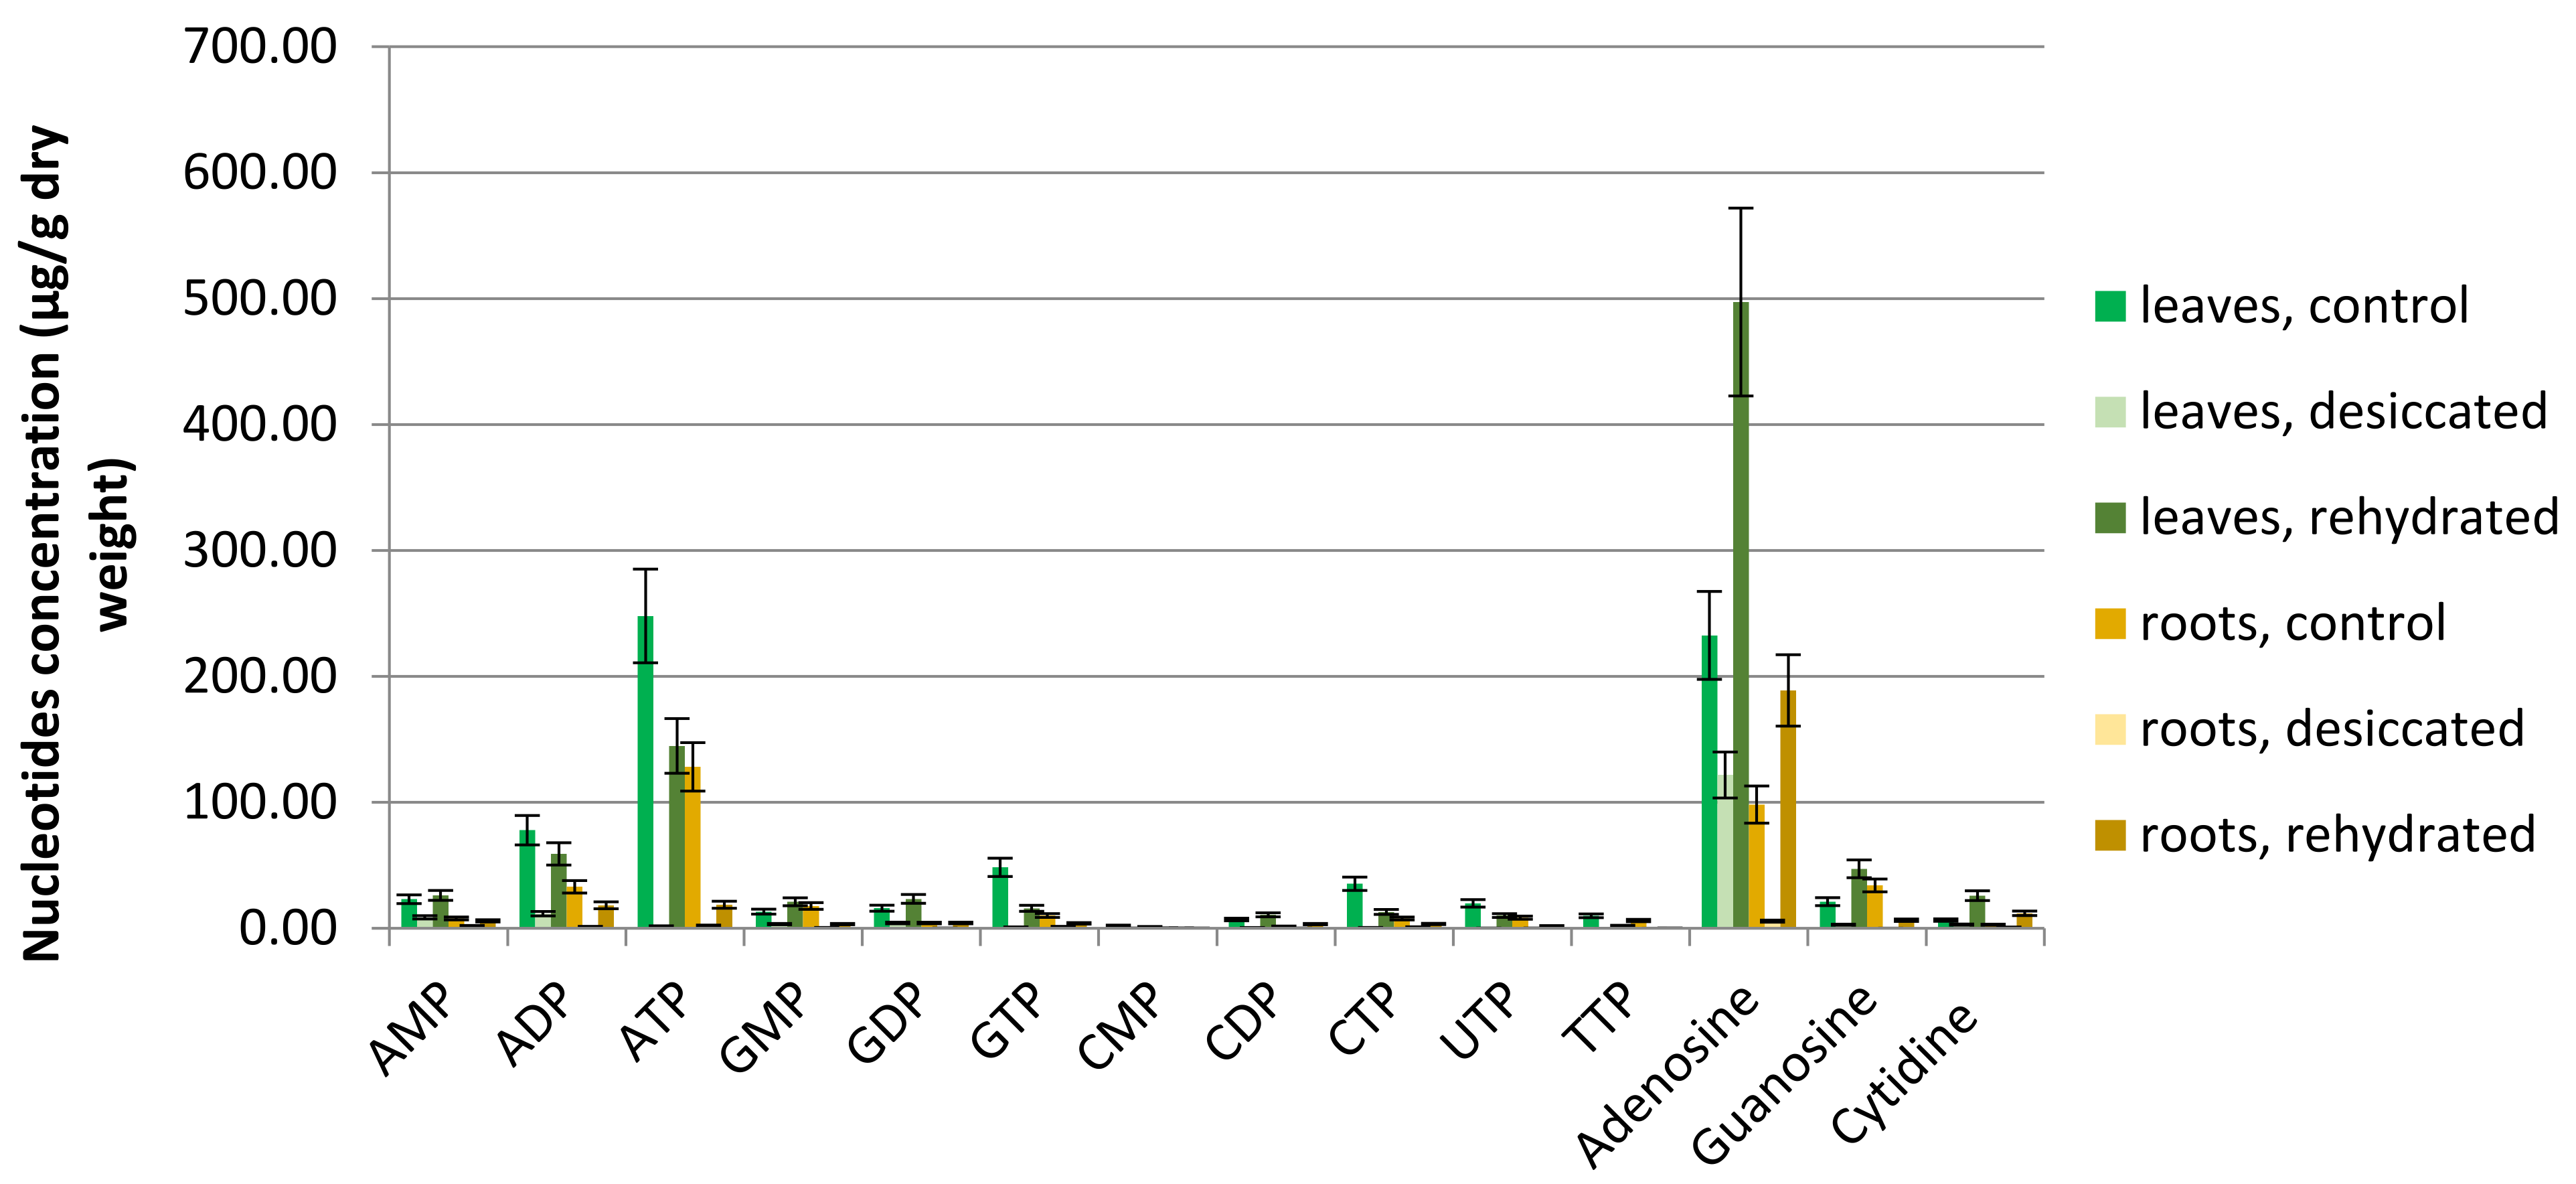

Table 1.
Optimized gradient program for HILIC separation.
| Time [min] | Mobile phase A% | Mobile phase B% | Flow rate [μl/min] |
| 0,00 | 100 | 0 | 850 |
| 0,50 | 100 | 0 | 850 |
| 4,00 | 85 | 15 | 850 |
| 16,00 | 45 | 55 | 850 |
| 18,00 | 0 | 100 | 850 |
| 20,00 | 0 | 100 | 850 |
Table 2.
Ribonucleotide mono-, di- and tri-phosphates and nucleosides were detected in H. rhodopensis, samples from control (grown under regular watering, L1), dehydrated (L2) and rehydrated (L3) leaves.
Table 2.
Ribonucleotide mono-, di- and tri-phosphates and nucleosides were detected in H. rhodopensis, samples from control (grown under regular watering, L1), dehydrated (L2) and rehydrated (L3) leaves.
| Compound | Concentration (µg/g dry weight) | Percentage ratios | |||
|---|---|---|---|---|---|
| Control (L1) |
desiccated (L2) |
rehydrated (L3) |
Desiccated/control (L2/L1)*100 |
Rehydrated/ control (L3/L1)*100 |
|
| AMP | 23,09 ± 3,4 | 8,69 ± 1,3 | 26,12 ± 3,9 | 37,6 % | 113,1 % |
| ADP | 77,88 ± 11,7 | 11,59 ± 1,7 | 59,08 ± 8,9 | 14,9 % | 75,9 % |
| ATP | 247,99 ± 37,2 | 1,7 ± 0,3 | 144,79 ± 21,7 | 0,7 % | 58,4 % |
| GMP | 13,22 ± 1,9 | 3,35 ± 0,5 | 21,03 ± 3,2 | 25,3 % | 159,1 % |
| GDP | 15,95 ± 2,4 | 4,23 ± 0,6 | 23,33 ± 3,5 | 26,5 % | 146,3 % |
| GTP | 48,38 ± 7,3 | 0,97 ± 0,2 | 15,85 ± 2,4 | 2,0 % | 32,8 % |
| CMP | 2,18 ± 0,3 | 0,2 ± 0,03 | 1,24 ± 0,2 | 9,2 % | 56,9 % |
| CDP | 6,96 ± 1,0 | 0,55 ± 0,8 | 10,66 ± 1,6 | 7,9 % | 153,2 % |
| CTP | 35,33 ± 5,3 | 0,58 ± 0,1 | 12,97 ± 1,9 | 1,6% | 36,7 % |
| UTP | 19,81 ± 3,0 | 0,17 ± 0,03 | 10,1 ± 1,5 | 0,9 % | 51,0 % |
| TTP | 9,9 ± 1,5 | 0,05 ± 0,01 | 2,08 ± 0,3 | 0,5 % | 21,0 % |
| Adenosine | 232,55 ± 34,9 | 121,72 ± 18,3 | 497,25 ±74,6 | 52,3 % | 213,8 % |
| Guanosine | 21,13 ± 3,2 | 2,84 ± 0,4 | 47,2 ± 7,1 | 13,4 % | 223,4 % |
| Cytidine | 6,52 ± 1,0 | 2,92 ± 0,4 | 25,9 ± 3,9 | 44,8 % | 397,2 % |
Table 3.
Ribonucleotide mono-, di- and tri-phosphates and nucleosides were detected in H. rhodopensis, samples from control (grown under regular watering, R1), dehydrated (R2), and rehydrated (R3) roots.
Table 3.
Ribonucleotide mono-, di- and tri-phosphates and nucleosides were detected in H. rhodopensis, samples from control (grown under regular watering, R1), dehydrated (R2), and rehydrated (R3) roots.
| Compound | Concentration (µg/g dry weight) | Percentage ratios | |||
| control (R1) | desiccated (R2) | rehydrated (R3) | (R2/R1)*100 | (R3/R1)*100 | |
| AMP | 7,82 ± 1,2 | 1,96 ± 0,3 | 5,88 ± 0,9 | 25,1 % | 75,2 % |
| ADP | 32,95 ± 4,9 | 1,36 ± 0,2 | 18,24 ± 2,7 | 4,1 % | 55,4 % |
| ATP | 128,2 ± 19,2 | 2,23 ± 0,3 | 18,68 ± 2,8 | 1,7 % | 14,6 % |
| GMP | 17,71 ± 2,7 | 0,58 ± 0,1 | 3,35 ± 0,5 | 3,3 % | 18,9 % |
| GDP | 4,2 ± 0,6 | 0,21 ± 0,03 | 4,22 ± 0,6 | 5,0 % | 100,5 % |
| GTP | 10,14 ± 1,5 | 1,33 ± 0,2 | 3,91 ± 0,6 | 13,1 % | 38,6 % |
| CMP | 0,31 ± 0,05 | 0,28 ± 0,04 | 0,2 ± 0,03 | 90,3 % | 64,5 % |
| CDP | 1,53 ± 0,2 | 0,18 ± 0,03 | 3,33 ± 0,05 | 11,8 % | 217,6 % |
| CTP | 7,76 ± 1,2 | 1,02 ± 0,2 | 3,42 ± 0,05 | 13,1 % | 44,1 % |
| UTP | 8,45 ± 1,3 | 0,2 ± 0,03 | 1,86 ± 0,3 | 2,4 % | 22,0 % |
| TTP | 6,15 ± 0,9 | 0,07± 0,01 | 0,24 ± 0,04 | 1,1 % | 3,9 % |
| Adenosine | 98,23 ± 14,7 | 5,65 ± 0,8 | 188,88 ± 28,3 | 5,8 % | 192.3 % |
| Guanosine | 34,01 ± 5,1 | 0,1 ± 0,02 | 6,42 ± 1,0 | 0,3 % | 18,9 % |
| Cytidine | 2,85 ± 0,4 | 0,89 ± 0,1 | 11,9 ± 1,8 | 31,2 % | 417,5 % |
Table 4.
Adenylate ratios for control, desiccated and rehydrated leave samples, and corresponding root samples from Haberlea rhodopensis.
Table 4.
Adenylate ratios for control, desiccated and rehydrated leave samples, and corresponding root samples from Haberlea rhodopensis.
| Sample | Ratio | ||
| ATP/AMP | ATP/ADP | AEC | |
| Leaves, control (L1) | 10,74 | 3,18 | 0,82 |
| Leaves, desiccated (L2) | 0,2 | 0,15 | 0,34 |
| Leaves, rehydrated (L3) | 5,54 | 2,45 | 0,76 |
| Roots, control (R1) | 16,39 | 3,89 | 0,86 |
| Roots, desiccated (R2) | 1,14 | 1,64 | 0,52 |
| Roots, rehydrated (R3) | 3,18 | 1,02 | 0,65 |
Disclaimer/Publisher’s Note: The statements, opinions and data contained in all publications are solely those of the individual author(s) and contributor(s) and not of MDPI and/or the editor(s). MDPI and/or the editor(s) disclaim responsibility for any injury to people or property resulting from any ideas, methods, instructions or products referred to in the content. |
© 2024 by the authors. Licensee MDPI, Basel, Switzerland. This article is an open access article distributed under the terms and conditions of the Creative Commons Attribution (CC BY) license (http://creativecommons.org/licenses/by/4.0/).
Copyright: This open access article is published under a Creative Commons CC BY 4.0 license, which permit the free download, distribution, and reuse, provided that the author and preprint are cited in any reuse.


