
Submitted:
15 November 2024
Posted:
18 November 2024
You are already at the latest version
Abstract
Naked barley (Hordeum vulgare var. nudum) is a staple food crop contributing significantly to the global food security. Understanding genetic diversity will facilitate its effective conservation and utilization. To determine genetic diversity and its distribution within and among varieties, we characterized 30 naked barley varieties representing the traditional, modern, and germplasm-resources-bank gene-pools from Tibet, using the SSR molecular fingerprints. Results demonstrate abundant genetic diversity in Tibetan naked barley varieties, particularly those in the traditional gene-pool that holds much more private alleles. Principal coordinates and STRUCTURE analyses indicate substantial deviation of the modern varieties from the traditional and germplasm-resources-bank varieties. A considerable amount of seed mixture is detected in the modern varieties, suggesting the practices of using mixed seeds in modern-variety cultivation. Cluster analyses indicate the narrow genetic background of the modern varieties because of a few traditional/germplasm-resources-bank varieties used in breeding. Relationships between variation of genetic diversity and increases in sample sizes within naked barley varieties suggest effective sampling strategies for field collections. Knowledge generated from this study has important implications for the sustainable utilization and effective conservation of different types of naked barley germplasm in Tibet and in other regions of the world.
Keywords:
cluster analysis
; gene pool
; genetic variation
; germplasm preservation
; hulless barley
; molecular fingerprint
; population structure
; Tibet
1. Introduction
The world food security relies essentially on the sufficient production of food crops, of which genetic resources (also known as germplasm) play critical roles by sustained genetic improvement of these crops [1,2,3]. Therefore, effective conservation and utilization of crop genetic resources will guarantee the sustainable crop production and global food security [4,5,6]. Naked barley, also referred to as hulless barley, (Hordeum vulgare L. var. nudum Hook. f.) is an important food crop widely distributed in the world [7]. Naked barley is the same species but a unique type of cultivated barley (Hordeum vulgare L.) [7]. The reason why this crop is referred to as naked barley is simply because the inner and outer glumes on spikes can easily be separated from caryopsis at the ripen stage, so that naked barley’s grains (commonly known as seeds) are naked or hulless [8], like the grains of common wheat. Naked barley is very important for people living in the marginal and mountainous agroecosystems at relatively high elevations, such as on the North African Plateau, the Andes Plateau in South America, in Caucasus Mountain areas in Russia, and on the Qinghai-Tibet Plateau in China [9,10]. As a unique and valuable crop, naked barley therefore makes up an important component for the global food security, particularly for people living the marginal areas.
In China, naked barley has a cultivation history for more than 3,000 years, although this crop has been cultivated mainly in mountainous areas with relatively harsh environmental conditions and high elevations, such as in Tibet Autonomous Region, Qinghai, Gansu, Sichuan, Yunnan, and Guizhou provinces [11]. Importantly, naked barley not only serves as the main human food and livestock’s feed, but also used as the raw materials for manufacturing beers, medicines, and various health-care products [12,13,14]. As the only staple food crop that can ripe, or mature, and produce seeds normally at the high altitudes, naked barley can be cultivated on the alpine Qinghai-Tibet Plateau with elevation at >4500 meters above the sea level. Therefore, naked barley also possesses great economic values with extremely important roles for people living those areas [15].
In addition, during the long-term domestication and evolution under harsh natural and artificial selection, naked barley has accumulated abundant genetic variation to adapt to different environmental conditions facing rapid changes [7,11,14,16]. Such changeable environmental conditions, include different altitudes (1000~5000), soil types, ultraviolet radiations, etc., allowing naked barley to develop a wide range of adaptabilities under the extreme conditions on the Tibet Plateau [10,11,17,18]. Apart from the adaptation to these harsh environmental conditions, naked barley has also developed the important agronomic trait for relatively short growth period (early mature), which makes the naked barley varieties suitable for cultivating in barren and cold areas with relatively inadequate accumulative temperatures [7,19]. Consequently, this crop has established many ecological types with rich phenotypic variation [20,21] and genetic diversity [10,11,18,22,23] through adaptive evolution. Obviously, it is urgent to determine such genetic diversity categorized in different naked barley gene-pools harbored by the traditional, modern, and germplasm-resources-bank stored germplasm or genetic resources.
However, limited studies have been carried out to address genetic diversity of naked barley varieties, even though this crop is so unique and valuable because of such characteristics. Therefore, it is very important to investigate genetic diversity of the naked barley varieties both as a staple food crop and valuable genetic resources in different gene-pools. Better understanding of genetic diversity harbored by the naked barley varieties will facilitate the effective utilization and efficient conservation of the naked barley varieties by providing appropriate sampling strategies not only in Tibet, but also other regions in the world. Particularly, under future’s unpredictable scenarios caused by the global climate change [16,24,25], the efficient conservation, evaluation, and utilization of the naked barley genetic resources in a timely manner become even more important. This is because genetic diversity in naked barley accumulated by long-term domestication and human uses may rapidly be reduced and even lost under the extreme changing environment and disturbances by human activities in particular [26,27].
To determine genetic diversity within and among naked barley varieties categorized in different gene-pools, we studied 30 randomly collected naked barley varieties, representing the gene-pools of traditional, modern, and germplasm-resources-bank stored materials, respectively, from the Tibetan Plateau. We applied the high put-through simple sequence repeat (SSR) molecular fingerprinting technology to characterize genetic diversity of these naked barley varieties. The primary objectives of this study were to address the following questions: (i) Is genetic diversity harbored in the naked barley germplasm evenly distributed in the three-representative gene-pools of the Tibetan varieties? (ii) What are the genetic structures and relationships of the three-representative gene-pools of the Tibetan naked barley varieties? (iii) How does the variation pattern change with increases in sample size of a variety in the three representative Tibetan naked barley gene-pool? Answers to these questions will facilitate the effective conservation and utilization of naked barley germplasm for future genetic improvement in the Tibetan Plateau and other regions.
2. Materials and Methods
2.1. Plant Materials
To characterize genetic diversity in different gene-pools, we included three sets of six-rowed naked barley samples, representing the three gene-pools: (i) the traditional (T), (ii) modern (M), and (iii) germplasm-resources-bank stored (G) varieties. Each set (gene-pool) of the samples included 10 varieties and each variety included 30 individuals/plants. Therefore, a total of 900 plants representing the three naked barley gene-pools were used in this study. The 10 traditional and 10 modern naked barley varieties were collected in the field in Tibet (Table 1), whereas the 10 germplasm-resources-bank varieties were obtained from the Germplasm Resources Bank (GRB) in the Tibet Academy of Agriculture and Animal Husbandry Sciences (Table 1).
The traditional naked barley varieties were cultivated by the farmers in the hilly areas of Tibet with considerable phenotypic differences among the varieties. The modern naked barley varieties were bred by the Tibet Academy of Agriculture and Animal Husbandry Sciences and currently cultivated by Tibetan farmers mainly in the basins of the Yarlung Zangbo, Lhasa, and Nyangqu rivers in Tibet. The germplasm-resources-bank stored naked barley varieties were essentially sampled from the traditional varieties that were collected and stored in GRB for about 35 years.
2.2. DNA Extraction, Amplification, and Genotyping
All DNA samples were extracted from the three-leaf-stage seedlings grown from seeds of different naked barley varieties. Seeds were germinated in an illuminated incubator (Percival Scientific, Perry, IA, USA) with alternating light/dark (16/8h) at 25±3℃. Total genomic DNA was extracted following the modified CTAB protocol [28].
Thirty-one SSR primer pairs were selected from cultivated barley (H. vulgare) genome based on the reports in previous studies [29,30,31,32,33,34,35,36,37,38,39,40] with a high level of polymorphisms, to study genetic diversity of naked barley varieties (Table 2). All the forward primers of the selected SSR primer pairs were labeled with one of the following fluorescent dyes: FAM (blue), HEX (green), ROX (red), and TAMRA (black), respectively [41]. The primer pairs and fluorescent sequences were synthesized by the Sangon Biotech Co., Ltd. (Shanghai) (Table 2), and all reagents required for PCR amplifications were produced by the Sangon Biotech Co., Ltd.
The total volume of PCR reaction was 10 μL: including Mg2+10× PCR buffer 1 μL, 25 mmol ·L-1 dNTP 0.8 μL, 10 mmol·L-1 forward primer 0.04 μL, 10 mmol·L-1 reverse primer 0.2 μL, 10 mmol·L-1 forward primer fluorescence 0.16 μL, ddH2O 5.7 μL, template DNA 2 μL, 5 U·μL-1 Taq DNA Polymerase 0.1 μL. The forward primers were fluorescently labeled to visualize the PCR products by FAM (blue), ROX (red), or HEX (green). The PCR reaction was performed on an ABI 2720 thermal cycler.
Reaction program was designed as follows: initial denaturation at 94℃ for 5 min; Denaturation at 94℃ for 30s, annealing at 55℃ for 30s, extension at 72℃ for 30s, 30 cycles; Final extension at 72℃ for 7 min; Storage at 4℃. The PCR products were separated and analyzed on a capillary electrophoresis.
2.3. Data Analyses
Genetic Diversity: The following genetic diversity parameters were calculated, including the number of observed alleles per locus (Na), number of effective alleles per locus (Ne), Shannon information index (I), observed heterozygosity (Ho), expected heterozygosity (Nei’s genetic diversity, He), percentage of polymorphic loci (P), fixation index (Fst) [42], and the estimated gene flow (Nm). These genetic diversity parameters were calculated using the software GenAlEx 6.5 [43]. The analysis of molecular variance (AMOVA) was also carried out to estimate the partition of genetic diversity within and among naked barley varieties, at a level of p < 0.001 and 9999 permutations [44].
Genetic Structure: The genetic structure of naked barley varieties was analyzed in the Bayesian clustering algorithm-based the program STRUCTURE ver. 2.3.4 [45] to visualize the genetic components of the varieties in different gene-pools, based on the SSR genotypic data matrix. The running parameters were set as 100,000 burn-in period, and 100,000 replicates. The admixture model was selected to analyze the genetic components with the correlated allele frequencies. The number of clusters (K-value) was set from 2 to 10 and each K value was repeated 10 times, respectively. The Evanno method was used to detect the number of K groups that best-fit the dataset by the STRUCTURE HARVESTER online program [46]. The software CLUMPP ver. 1.1.2 was used to determine the optimal alignment of the 10 replicates with the ‘Greedy’ algorithm (GREEDY_OPTION = 2, REPEATS = 10,000). The alignment results were visualized using the software DISTRUCT ver. 1.1 [47].
Principal Coordinates Analysis (PCoA): PCoA was undertaken to estimate the genetic differentiation (dissimilarity) of individuals in different naked barley varieties categorized in the three gene-pools (T, M, and G). The scatter plot was generated based on the coefficients of the first two principal coordinates to visualize the relationships of naked barley individuals in the traditional (T), modern (M), and germplasm-resources-bank stored (G) varieties using the software GenAlEx ver. 6.5 [43].
Cluster Analyses: The cluster analysis was conducted based on the Nei’ s genetic similarity coefficient [48], and the unweighted pair-group method with arithmetic (UPGMA) mean was adopted to construct the similarity output. The UPGMA cluster analysis was conducted with the use of NTSYS-pc software ver. 2.2 [49], based on which the cluster diagram was drawn.
Sampling Strategies and Genetic Diversity: To determine the correlation between the level of genetic diversity and increases in sample sizes within a naked barley variety [51,52], random sampling was conducted to form 5 groups each with 5, 10, 15, 20, 25, to 30 individuals from a barley variety. The average values of genetic diversity parameters (He, I, P) for each group were calculated based on the random draw of each set of samples from a variety for 10 times, using the GenAlEx software ver. 6.5 [43]. The regression of sample sizes (number of individuals) for each group with the average values of genetic diversity was calculated using the SPSS statistics software ver. 28.0.1.0 [50] to generate the best fitting curves based on the regression fitting formula: Ln(Y)=b0+(B-1/t), where b0, B-1 was the fitting parameter, t was the sample sizes, and Y was the percentages of the genetic parameters.
3. Results
3.1. Genetic Diversity of the Tibetan Naked Barley Varieties Included in the Traditional, Modern, and Germplasm-Resources-Bank Stored Gene-Pools
A total of 248 alleles based on the 31 selected simple sequence repeat (SSR) loci were detected in the 900 plants/individuals representing the three naked barley gene-pools in
The traditional (T-1~10), modern (M-1~10), and germplasm-resources-bank stored (G-1~10) varieties from Tibet, China (Table 3). Genetic diversity was estimated based on 30 plants representing one of the 10 varieties from each of the naked barley gene-pools. In general, the estimated level of genetic diversity was relatively high for the strictly inbreeding naked barley varieties, although with considerable variations among varieties in the three respective gene-pools (Table 3). Interestingly, the level of genetic diversity (estimated by I=1.17±0.09, He=0.58±0.03) in the traditional naked barley varieties (T gene-pool) was greater than that (I=0.97±0.07, He=0.50±0.04) in the modern naked barley varieties (M gene-pool). However, the level of genetic diversity (I=1.15±0.09, He=0.57±0.04) in the germplasm-resources-bank stored naked barley varieties (G gene-pool) was comparable with that in the varieties of the T gene-pool (Table 3). Therefore, the richness order of genetic diversity in the studied naked barley germplasm was estimated as follows: traditional (T) > germplasm-resources-bank stored (G) > modern (M) varieties in the three gene-pools. Furthermore, much lower observed heterozygosity was detected in the modern varieties compared with the that in the traditional and germplasm-resources-bank stored varieties, suggesting a very lower frequency of outcrossing within the modern varieties.
In addition to the estimated richness of genetic diversity, the calculated number of frequent (≥5%) private alleles (denoting the specific/unique alleles in a particular group) was also largely variable among the Tibetan naked barley varieties in the three gene-pools (Table 4). Results obtained from the analysis further indicated that a much greater number of private alleles (15 alleles at 7 loci) was detected in the six traditional varieties (T gene-pool) than that in three modern varieties (M gene-pool) that only showed four private alleles at four loci (Table 4). Noticeably, all alleles detected in the modern varieties were completely different from those in the traditional varieties, although a few alleles were similar with those in the germplasm-resources-bank stored varieties (Table 4). The germplasm-resources-bank stored naked barley varieties (G gene-pool) showed a comparable number of private alleles although with a slightly reduced number (Table 4).
Interestingly, the level of fixation index, as indicated by the Fst values, was considerably greater in the gene-pools of traditional (Fst=0.61) and germplasm-resources-bank stored varieties (Fst=0.59) than that (Fst=0.39) in the modern varieties, suggesting much greater genetic differentiation among the traditional and germplasm-resources-bank stored naked barley varieties. The much lower level of gene flow (Nm=0.19~0.27) also supported the observation that greater genetic differentiation was formed among the traditional, as well as the germplasm-resources-bank stored naked barley varieties. In contrast, a substantially greater level of gene flow (Nm=0.85) was detected among the modern naked barley varieties resulting in their much minor genetic differentiation. Given that barley is an autogamous species and that the modern naked barley showed extremely low level of observed heterozygosity (Ho=0.01), the detected gene flow is most likely the consequence of seed-mediated gene flow, like observed in weedy rice [61]. Altogether, these results further indicated that the traditional naked barley varieties contained abundant genetic diversity with valuable unique alleles, either in the present agroecosystems or in the germplasm-resources-bank storages.
3.2. Genetic Structure and Relationships of the Tibetan Naked Barley Varieties Included in the Traditional, Modern, and Germplasm-Resources-Bank Stored Gene-Pools
The AMOVA results indicated that a slightly greater portion (~60%) of genetic variation existed among the Tibetan naked barley varieties, including ~7% of genetic variation among the three gene-pools, based on the analysis of all 900 samples (Table 5). Consequently, a smaller portion (~40%) of genetic variation was detected within the naked barley varieties (Table 5). However, results based on the analysis of the varieties in each of the three gene-pools (T, M, and G) indicated somehow different AMOVA patterns between the traditional/germplasm-resources-bank and modern varieties (Table 5). Noticeably, for the modern naked barley varieties, a slightly greater proportion (~56%) of within-variety genetic variation was detected, resulting a smaller proportion (~44%) of among-variety genetic variation (Table 5). This finding evidently indicated that considerable genetic variation presented among the samples or individual plants within a modern naked barley.
To estimate the genetic components of naked barley varieties in the three gene-pools (T-1~10, M-1~10, and G-1~10), we conducted the STRUCTURE analysis using the admixture model, based on generated the data matrices of the SSR molecular fingerprints. Results from the STRUCTURE analysis demonstrated similar genetic components of the traditional and germplasm-resources-bank stored naked barley varieties in the T and G gene-pools, at the most optimal K value (K=7, mainly represented by the orange, yellow, green, and blue colors) and their neighboring K values (K=6, K=8) (Figure 1). However, the genetic components (mainly represented by the pink and red colors) in the modern naked barley varieties (M gene-pool) was considerably different from that in the T and G gene-pools (Figure 1). In addition, nearly all naked barley varieties in the T, M, and G gene-pools showed the strong admixture of the genetic components, only with a very few exceptions in the T and G gene-pools, suggesting pollen-mediated gene flow among varieties. All these results clearly indicated that the genetic structure of the traditional and germplasm-resources-bank stored naked barley varieties was relatively similar, but substantially differentiated from the modern naked barley varieties. Noticeably, samples with considerably different genetic components were found within some modern varieties, confirming AMOVA’s results of considerable genetic variation among individual plants within a modern variety.
To understand the overall relationships of the 900 naked barley samples (individuals) represented by the three gene-pools in the traditional (T), modern (M), and germplasm-resources-bank stored (G) varieties collected from Tibet of China, we conducted the principal coordinate analysis (PCoA) based on the SSR molecular fingerprints. The PCoA results demonstrated evident genetic variation of the 900 naked barley samples, although with considerable overlaps of the samples among the three gene-pools (Figure 2). Obviously, the naked barley samples in the T and G gene-pools that were mainly scattered across the positive loads of the first principal coordinate showed a relatively high degree of overlaps, compared with those in the M gene-pool that were mainly scattered across the negative loads of the first principal coordinate (Figure 2). Consequently, these results revealed a generally closer genetic relationship of the samples that were included in the traditional and germplasm-resources-bank stored naked barley varieties (T and G gene-pools). However, the samples included in the modern naked barley varieties (M gene-pool) were somehow genetically deviated from those included in the varieties of T and G gene-pools.
To estimate the overall genetic relationships of the 30 naked barley varieties included in the T, M, and G gene-pools from Tibet, we conducted the cluster analysis of these varieties, based on the SSR molecular fingerprints. Results generated from the UPGMA cluster analysis indicated that the traditional (T-1~T-9) and germplasm-resources-bank stored (G-1~G-9) varieties were relatively closely linked to each other, although with significant variation as estimated by their genetic similarities (Figure 3). The naked barley varieties in the two (T and G) gene-pools presented an obvious intermixed pattern in in four groups. However, the modern naked barley varieties (M-1~M-10) were clustered in three groups that were relatively independently separated from most of the varieties in the T and G gene-pools. Noticeably, all the modern naked barley varieties were only clustered closely with two traditional (T-8 and T-9) and one germplasm-resources-bank (G-5) varieties (shaded area in Figure 3), suggesting the possible breeding pedigrees of these modern varieties. Altogether, these results confirmed that the Tibetan naked barley varieties included in the T and G gene-pools shared relative closer genetic relationships than the varieties included in the M gene-pools.
3.3. Relationship Between Variation in Genetic Diversity and Increases in Sample Sizes of Naked Barley Varieties from Different Gene-Pools
To determine the most effective sampling strategy for naked barley conservation, we estimated the variation pattern of genetic diversity against the increases in sample sizes (5, 10, 15, 20, 25, and 30 individuals) within varieties from different (T, M, and G) gene-pools, using the computer simulation random sampling method. In general, results from the regression analysis showed that genetic diversity within the included naked barley varieties increased quickly with the increases of sample sizes at first two to three intervals, namely, from 5 to 10 or to 15 individuals (Figure 4). After that, the increases in genetic diversity slowed down, even though the sample sizes continued to increase (Figure 4). Detailed analyses indicated that the average levels (regression fitting curves) of genetic diversity, as measured by the Nei’s genetic diversity (He) and Shannon information index (I), increased rapidly to ~80% of the total levels for all the varieties from the three (T, M, and G) gene-pools, when only 5 individuals were sampled in the analysis (Figure 4). The average genetic diversity (He and I) rapidly reached the maximum levels when 15 individuals were sampled for different varieties in the three gene-pools. However, the average percentage of polymorphic loci (P), gradually increased to about 80% of the total levels of genetic diversity when 10 individuals were sampled in the analysis, although with some variation in the G gene-pool (Figure 4). The average percentage of polymorphic loci (P) slowly reached the maximum levels when more than 20 individuals were sampled from varieties in the three gene-pools. These results demonstrated that abundant genetic diversity was harbored by the Tibetan naked barley varieties among individuals both within a variety and among varieties. The generated knowledge could be useful for the design of effective sampling strategies for Tibetan naked barley varieties.
4. Discussion
4.1. Abundant Genetic Diversity Harbored in Traditional Tibetan Naked Barley Varieties
Our results obtained from the analysis of 900 individuals demonstrate a relatively high level of genetic diversity in the Tibetan naked barley varieties, based on the simple sequence repeat (SSR) molecular fingerprints. As a strictly inbreeding or self-pollinating plant species with the clistogamy characteristics [9,10,51,52], the overall level of genetic diversity, as represented by the Shannon information index (I=1.26±0.09), Nei’s genetic diversity (expected heterozygosity, He=0.60±0.03), and the percentage of polymorphic loci (P=100%), is comparable with many other strictly inbreeding crop species or varieties/lines, such as soybean [52,53], pea [54], emmer and einkorn wheat lines [55], and cultivated barley varieties [9,10,56]. Given that naked barley varieties serve as an essential food crop for the people living the high elevation zones, the obtained knowledge generally indicates that the Tibetan naked barley varieties with abundant genetic diversity are extremely valuable to support the sustainable agriculture and food security programs in the marginal areas by offering diversified staple food sources under variable and changing environmental conditions.
In addition, the relatively high level of genetic diversity detected in the Tibetan naked barley varieties, particularly the abundant genetic diversity in the gene-pool of traditional varieties (overall I=1.17±0.09; He=0.58±0.03) provides extremely valuable germplasm or genetic resources for the continued conservation and utilization in future breeding programs. This is because the abundant within- and among-variety genetic diversity can be easily utilized in breeding and genetic improvement, not only for naked barley, but also generally for all types of barley varieties [9,10,11,18,57]. In fact, many studies indicate that naked barley varieties have played a critical role as genetic resources in barley breeding by donating important genes for the tolerances of biotic and abiotic stresses, such as extreme temperature, drought, plant diseases, and insect pests [9,10,15,16,21,22,58,59,60]. These studies provide excellent examples to justify the important roles of effective conserving and utilizing generic resources in crop breeding and genetic improvement. Given that the Tibetan naked barley varieties contain abundant genetic diversity, the effective exploration and utilization of the valuable genetic resources harbored by these naked barley varieties can contribute significantly to the future genetic improvement of barley varieties, not only in Tibet and in tis neighboring regions, but also in other regions of the world.
Detailed analyses of the distribution of genetic diversity in the Tibetan naked barley varieties indicate that the estimated genetic diversity parameters, such as the effective number of alleles, Shannon information index, and Nei’s genetic diversity, are slightly greater in the traditional and germplasm-resources-bank stored varieties than those in the modern varieties. In addition, the level of observed heterozygosity (Ho), denoting the outcrossing frequency among plants or individuals [61], is one-fold greater in the traditional and germplasm-resources-bank stored varieties than that in the modern varieties. These results suggest that the traditional naked barley varieties have comparatively greater level of pollen-mediated gene flow through outcrossing, which allows the long-term accumulation of genetic variation and recombination within the varieties to happen. As such, the traditional naked barley varieties have great values for future barley breeding.
Coincidentally, the detected fixation indexes or Fst values (0.61±0.03 and 0.59±0.03) among the traditional or germplasm-resources-bank stored naked barley varieties (in T and G gene-pools) are much greater than those (Fst=0.39±0.03) among the modern varieties (in M gene-pool). These results suggest considerably greater genetic differentiation among varieties in the traditional and germplasm-resources-bank gene-pools than that in the modern gene-pool. Furthermore, the allelic analyses also indicate that there are much more private alleles with relatively high frequencies (≥0.05) in the traditional and germplasm-resources-bank stored Tibetan naked barley varieties (in T and G gene-pools) than those detected in the varieties of modern varieties (M gene-pool). The abundant and unique genetic variation detected in the traditional and germplasm-resources-bank stored Tibetan naked barley varieties suggests their potential values as particular genetic resources in future barley breeding.
Altogether, these results demonstrate that abundant genetic diversity is harbored by the traditional Tibetan naked barley varieties and the germplasm-resources-bank stored germplasm, even though only ten traditional or germplasm-resources-bank stored varieties were included in this study. We therefore propose that further extensive exploration and collection of traditional naked barley varieties should be undertaken in Tibet under the proper guidance for the effective utilization of the unique genetic resources in future barley breeding programs. Furthermore, given the fact that abundant genetic diversity still exists in naked barley varieties stored the Tibetan Germplasm Resources Bank, we also propose that more attentions should be paid to these stored materials for more intensive and accurate assessments to explore valuable characteristics for their efficient utilization in (naked) barley breeding programs.
4.2. Genetic Structure and Relationships of Tibetan Naked Barley Varieties in Different Gene-Pools
Better understanding of the distribution and structure of genetic diversity can play important roles in the strategic designs of the efficient conservation and utilization of genetic resources [6,11,17,18,21,25,56,60]. Such knowledge on genetic diversity is fundamental to guide the proper design of effective sampling strategy for a particular crop species [23,27,51,52]. Our results in this study evidently indicate the uneven distribution of genetic diversity among the traditional, modern, and germplasm-resources-bank stored Tibetan naked barley varieties. The AMOVA results generally indicate that the major proportion of the genetic variation presented among different naked barley varieties, although the AMOVA patterns are different between the traditional/germplasm-resources-bank varieties and the modern varieties. These results demonstrate the significance of field sampling procedures from different naked barley varieties across a particular region, as a part of the effective conservation strategies. Such sampling procedures for different varieties can ensure the capture of optimal genetic diversity in the collected naked barley materials. In addition, the AMOVA results also indicate that about 40% of the genetic variation exists within a traditional variety, suggesting that adequate individuals/plants should be collected within a naked barley variety in the field to capture the maximum genetic variation in the conserved genetic resources, as the within-variety sampling strategy. Such a within-variety sampling strategy has been proposed in many other studies of different plant species [51,52]. Noticeably, the exceptionally high proportion of within-variety genetic variation is detected in the modern naked barley varieties. This is most possibly caused by the seed mixture of different varieties/sources by the small-household farmers who are used to exchange modern variety seeds from their neighbors and relatives within a village and between different villages [63]. The frequent exchange of seeds between small-household’s farmers is also reported in the remote rice ecosystems in China [64]. The unusually high level of migrations (Nm) or seed-mediated gene flow among the modern naked barley varieties can also explain the remarkably high proportion of seed mixture in the modern varieties as detected in this study (Table 3 and Figure 1) for such a strictly inbreeding crop species.
Our results based on the STRUCTURE analysis indicate relatively different genetic components among naked barley varieties included in the traditional and germplasm-resources-bank gene-pools, at the most optimal K value (K=7) and the neighboring K values. Both traditional and germplasm-resources-bank stored varieties showed an evident admixture pattern of the genetic structures. These results suggest that abundant genetic diversity exists in different traditional and germplasm-resources-bank stored naked barley varieties. Consequently, these varieties are indeed very important for serving as genetic resources for the sustainable uses in barley genetic improvement, apart from their great values as food sources. It is also evident that the traditional and germplasm-resources-bank stored naked barley varieties share similar genetic components. This finding suggests that the germplasm-resources-bank stored naked barley varieties were collected essentially based on the traditional naked barley varieties, although there are some differences in their genetic components after static storage in germplasm-resources-bank for about 30 years. Probably, the continued evolution of the traditional barley varieties in situ has caused such changes between the two gene pools, as found in other crop species [65,66]. Therefore, it is very important to carry out more detailed pair-wise comparison between field collected and germplasm-resources-bank stored naked barley varieties from the same locations to identify the changes of their genetic components using molecular fingerprinting methods. The knowledge generated as such will provide deep insights for understanding the roles of adaptive evolution of naked barley in the changing agroecosystems, which will help us to design effective in situ or on-farm conservation of naked barley germplasm, particularly in the mountainous Tibet.
Yet, the modern naked barley varieties demonstrate a somewhat deviated genetic structure with different components from the traditional and germplasm-resources-bank stored naked barley varieties, although these varieties still share some degrees of genetic identity. These results indicate that the modern naked barley varieties are selected and produced most likely only from a limited number of traditional naked barley varieties in the breeding programs. Noticeably, quite different genetic components were detected among some the samples/individuals in the modern naked barley varieties, suggesting evidently the mixture of individuals with different genetic background in the varieties. This finding is highly agreeable with that indicated by the genetic diversity and AMOVA patterns of modern varieties, in which a high proportion of within-variety variation (56%) and among-variety gene flow (Nm=0.85) are detected. Such an unexpected pattern for a strictly inbreeding plant species can only be reasonably explained by the accidental mixture of seeds between different naked barley varieties through farmers’ seed exchange, as proposed previously in this study. In the field practices, the Tibetan farmers often complain the degradation of naked barley varieties after cultivation for a few years (authors’ field observations). Therefore, an appropriate cultivation protocol or procedure should be established and used as a guide for the farmers in field practices to avoid the rapid degradation of their newly bred modern naked barley varieties.
In this study, our PCoA and cluster analyses strongly support the above conclusions that modern naked barley varieties are somehow deviated from the traditional and germplasm-resources-bank stored naked barley varieties. It is evident that the modern varieties only cover a small fraction of genetic diversity contained in the traditional and germplasm-resources-bank stored varieties. Particularly, our results from the cluster analysis clearly indicate that only two traditional and one germplasm-resources-bank stored naked barley varieties (Figure 3) have an intimate linkage with all the modern varieties. Most likely, the modern naked barley varieties were produced by only including a very small portion of genetic variation in traditional varieties and having a considerably narrow genetic background, which usually poses great challenges for these modern varieties in present and the future. For example, limited genetic diversity may lead to the reduced resistance to diseases and insect pests, reduced sustainability for the long-term utilization, and lower adaptability to environmental changes. In fact, we have observed in the field expeditions that some of the modern varieties cannot produce seeds normally at the elevation higher than 4500m in the Shigatse District of Tibet, simply because of the poor adaptation to the insufficient cumulative temperature. In contrast, the traditional naked barley varieties grown in the same locations can produce seeds normally with guaranteed the yield for these varieties. Therefore, we propose to broaden the genetic background of the modern naked barley varieties in breeding programs, which is essential for the sustainable production and development of these varieties in the regions characterized by the considerably variable environmental conditions.
4.3. Implications of the Generated Knowledge in Sampling Strategy for Naked-Barley Germplasm Conservation and Breeding Programs
The effective conservation of genetic resources or germplasm of various crop species is essential for human beings to sustainably utilize and develop crop varieties of these species in the diversified agroecosystems [1,2,3,6,26,27]. Likewise, the effective conservation of genetic resources of such a unique crop as naked barley in Tibet—a particular agroecosystem with great geographical and biological diversity, is also extremely important for people living in these marginal areas. To achieve this goal, it is necessary to design strategies to effectively conserve the naked barley varieties using efficient sampling methods in the field across the agroecosystems. Knowledge generated from this study have important implications to guide the conservation of naked barley germplasm with proper sampling strategies, as well as in the breeding programs for this crop [9,10,15,17,18,19,21,27].
First, our findings based on the obtained results from this study indicated that it is greatly valuable to collect, evaluate, and utilize genetic resources continually in the Tibetan naked barley varieties, particularly those categorized in the traditional gene-pool. In general, our results showed a considerably greater level of genetic diversity as estimated by the overall genetic parameters. Particularly, the traditional naked barley varieties contain far greater numbers of private or unique alleles than the modern varieties, which will contribute more significantly in further genetic improvement of modern varieties. Continued collection of more varieties in the traditional gene-pool, regardless of whether these varieties or names are represented in the germplasm-resources-bank storage, should be the prioritized tasks for the conservation of naked barley in Tibet. Second, given that the distribution of genetic diversity is mainly among different traditional naked barley varieties, the collection of germplasm samples should consider to include more varieties across a given region, instead of concentrating on only one variety or a few varieties in a particular region. Such a collecting strategy can capture the most possible genetic diversity harbored in the traditional naked barley varieties.
In addition, results of our correlation analyses demonstrate the relationship between the increases in genetic diversity (0~100%) and the sizes of samples/individuals (5~30) drawn randomly from each of the traditional, modern, and germplasm-resources-bank stored naked barley varieties. The obtained patterns of the correlations provide a valuable guidance for germplasm sampling of naked barley varieties in the field. The sampling size or the number of plants/individuals to be sampled from a naked barley field can be determined following the correlation curves revealed in this study. Generally, the correlation patterns suggest that the sampling of five plants/individuals in a naked barley field, either in the traditional or modern gene-pool, about 80% of total genetic diversity (as represented by He and I) can be captured. In addition, close to 100% of total genetic diversity can be captured in a naked barley field, if the sample size increased to about ten plants/individuals (Figure 4). Therefore, we propose based on the findings from this study that the proper sample size of about 5~10 plants/individuals from a variety should be considered when collecting in a naked barley field. Such a field practice will ensure to capture the optimal genetic diversity for the effective conservation of naked barley germplasm. Furthermore, our correlation curves also indicate that a greater sample size should be considered in the field collection, if more polymorphic loci are attempted to be sampled in naked barley varieties (Figure 4). Obviously, the detailed study of genetic diversity including its richness, distribution, and structure can provide an important guidance for the effective conservation of naked barley genetic resources, in addition to efficient utilization in future breeding.
5. Conclusions
Our results clearly demonstrate that abundant genetic diversity is harbored by the Tibetan naked barley varieties, although genetic diversity is not evenly distributed in traditional, modern, and germplasm-resources-bank stored varieties. Both the principal coordinates and STRUCTURE analyses indicate substantial deviation of the modern varieties from the traditional and germplasm-resources-bank stored varieties. The cluster analysis suggests the relatively narrow genetic background of modern varieties, possibly caused by the use of a limited number of traditional and germplasm-resources-bank varieties in the modern breeding programs. Correlations between the average levels of genetic diversity and increases in sample sizes (number of samples) within varieties propose the effective sampling strategies for collection of naked barley genetic resources in the field. The generated knowledge from this study has important implications not only for the sustainable utilization of naked barley as food sources, but also for their effective conservation as germplasm in barley breeding in Tibet and other regions in the world.
Author Contributions
Conceptualization, L.Q., and B.-R.L.; methodology, N.C., Y.W., Z.W., X.X.C., L.N., and D.D.; software, N.C., Z.W., and B.-R.L.; investigation, N.C., Z.W., and B.-R.L.; writing—original draft preparation, N.C., and B.-R.L.; writing—review and editing, L.Q., B.-R.L., N.C., Y.W, L.N., and D.D.; project administration, L.Q. and B.-R.L.; funding acquisition, L.Q. All authors have read and agreed to the published version of the manuscript.
Funding
This work was supported by the A first-class discipline construction project in ecology of Tibet University (00060906-01,00060835/001,00060785).
Institutional Review Board Statement
Not applicable.
Informed Consent Statement
Not applicable.
Data Availability Statement
All the data was shown in the article.
Conflicts of Interest
The authors declare no conflicts of interest.
References
- Ronald, P. Plant genetics, sustainable agriculture and global food security. Genetics. 2011, 188, 11–20. [Google Scholar] [CrossRef] [PubMed]
- Lu, B.R.; Ellstrand, N. World food security and the tribe triticeae (poaceae): genetic resources of cultivated, wild, and weedy taxa for crop improvement. 2014, J. Syst. Evol. 52, 661-666.
- Toledo, Á.; Burlingame, B. Biodiversity and nutrition: a common path toward global food security and sustainable development. J. Food. Compos. Anal. 2006, 19, 477–483. [Google Scholar] [CrossRef]
- Harlan, J.R. Our vanishing genetic resources. Science. 1975, 188, 617–621. [Google Scholar] [CrossRef]
- Plucknett, D.L.; Smith, N.J.; Williams, J.T.; Anishetty, N.M. Crop germplasm conservation and developing countries. Science. 1983, 220, 163–169. [Google Scholar] [CrossRef] [PubMed]
- Lu, B.R. Diversity of rice genetic resources and its utilization and conservation (in Chinese). Chinese Biodiversity. 1998, 6, 63–72. [Google Scholar]
- Russe, J.; Mascher, M.; Dawson, I.K.; Kyriakidis, S.; Calixto, C.; Freund, F.; Bayer, M.; Milne, I.; Marshall-Griffiths, T.; Heinen, S.; et al. Exome sequencing of geographically diverse barley landraces and wild relatives gives insights into environmental adaptation. Nat. Genet. 2016, 48, 1024–1030. [Google Scholar] [CrossRef] [PubMed]
- Taketa, S.; Amano, S.; Tsujino, Y.; Sato, T.; Saisho, D.; Kakeda, K.; Nomura, M.; Suzuki, T.; Matsumoto, T.; Sato, K.; et al. Barley grain with adhering hulls is controlled by an ERF family transcription factor gene regulating a lipid biosynthesis pathway. Proc. Natl. Acad. Sci. USA. 2008, 105, 4062–4067. [Google Scholar] [CrossRef] [PubMed]
- Jones, H.; Leigh, F.J.; Mackay, I.; Bower, M.A.; Smith, L.M.; Charles, M.P.; Jones, G.; Jones, M.K.; Brown, T.B.; Powell, W. Population-based resequencing reveals that the flowering time adaptation of cultivated barley originated east of the fertile crescent. Mol. Biol. Evol. 2008, 25, 2211–2219. [Google Scholar] [CrossRef]
- Zeng, X.Q; Guo, Y.; Xu, Q.J.; Mascher, M.; Guo, G.G.; Li, S.C.; Mao, L.K.; Liu, Q.F.; Xia, Z.F.; Zhou, J.H.; et al. Origin and evolution of qingke barley in Tibet. Nat. Commun. 2018, 9, 5433. [Google Scholar] [CrossRef] [PubMed]
- Yang, P.; Liu, X.J.; Liu, X.C.; Yang, W.Y.; Feng, Z.Y. Diversity analysis of the developed qingke (hulless barley) cultivars representing different growing regions of the qinghai-tibet plateau in china using sequencerelated amplified polymorphism (srap) markers. Afr. J. Biotechnol. 2010, 9, 8530–8538. [Google Scholar]
- Zhou, X.J.; Li, L.; Zheng, J.; Wu, J.H.; Wen, L.; Huang, M.; Ao, F.; Luo, W.L.; Li, M.; Wang, H.; et al. Quantitative analysis of key components in Qingke beer brewing process by multispectral analysis combined with chemometrics. Food Chem. 2024, 436, 137739. [Google Scholar] [CrossRef] [PubMed]
- Goudar, G.; Sharma, P.; Janghu, S.; Longvah, T. Effect of processing on barley β-glucan content, its molecular weight and extractability. Int. J. Biol. Macromol. 2020, 162, 1204–1216. [Google Scholar] [CrossRef]
- Ge, X.Z. Jing, L.Z.; Zhao, K.; Su, C.Y.; Zhang, B.; Zhang, Q.; Han, L.H.; Yu, X.Z.; Li, W.H. The phenolic compounds profile, quantitative analysis and antioxidant activity of four naked barley grains with different color. Food Chem. 2021, 335, 127655. [Google Scholar] [CrossRef]
- Qiang, X.L.; BaSang, Y.Z.; Tang, Y.W.; QiMei, W.M. Development history and achievements of naked barley breeding in Tibet (in Chinese). Tibet. Agr. Sci. 2011, 1, 24–27. [Google Scholar]
- Dawson, I.K.; Russell, J.; Powell, W.; Steffenson, B.; Thomas, W.T.B.; Waugh, R. Barley: a translational model for adaptation to climate change. New. Phytol. 2015, 206, 913–931. [Google Scholar] [CrossRef]
- Zeng, X.Q.; Long, H.; Wang, Z.; Zhao, S.C.; Tang, Y.W.; Huang, Z.Y.; Wang, Y.L.; Xu, Q.J.; Mao, L.K.; Deng, G.B.; et al. The draft genome of Tibetan hulless barley reveals adaptive patterns to the high stressful Tibetan Plateau. Proc. Natl. Acad. Sci. USA. 2015, 112, 1095–1100. [Google Scholar] [CrossRef] [PubMed]
- Dawa, D.D.; Yang, Y.; Xu, D.D.; Lhundrup, N.G.; Wang, Z.H.; Shen, X.; Tsechoe, D.J.; Nyima, K.; Lhakpa, D.M.; Gao, L.Y.; et al. Genome diversity and highland-adaptative variation in Tibet barley landrace population of China. Front. Plant. Sci. 2023, 14, 1189642. [Google Scholar]
- Ahmed, I.M.; Cao, F.B.; Zhang, M.; Chen, X.H.; Zhang, G.P.; Wu, F.B. Difference in yield and physiological features in response to drought and salinity combined stress during anthesis in tibetan wild and cultivated barleys. PLoS ONE. 2013, 8, e77869. [Google Scholar] [CrossRef] [PubMed]
- Scheiner, S.M; Lyman, R.F. The genetics of phenotypic plasticity I. Heritability. J. Evol. Biol. 1989, 2, 95–107. [Google Scholar] [CrossRef]
- Al-Tabbal, J.A.; Ahmad, A.F. Genetic variation, heritability, phenotypic and genotypic correlation studies for yield and yield components in promising barley genotypes. J. Agr. Sci. 2012, 4, 193–210. [Google Scholar] [CrossRef]
- Muoz-Amatriaín, M.; Alfonso, C.M.; Hayes, P.M.; Muehlbauer, G.J. Barley genetic variation: implications for crop improvement. Brief. Funct. Genomics. 2014, 13, 341–350. [Google Scholar] [CrossRef]
- Varshney, R.K.; Baum, M.; Guo, P.G.; Grando, S.; Ceccarelli, S.; Graner, A. Features of SNP and SSR diversity in a set of ICARDA barley germplasm collection. Mol. Breeding. 2010, 26, 229–242. [Google Scholar] [CrossRef]
- Alemayehu, F.R.; Frenck, G.; Linden, L.; Mikkelsen, T.N.; Jørgensen, R.B. Can barley (Hordeum vulgare L. s.l.) adapt to fast climate changes? A controlled selection experiment. Genet. Resour. Crop. Ev. 2014, 61, 151–161. [Google Scholar] [CrossRef]
- Lu, B.R. Diversity and conservation of the Triticeae genetic resources (in Chinese). Chinese Biodiversity. 1995, 3, 63–68. [Google Scholar]
- Khoury, C.K.; Brush, S.; Costich, D.E.; Curry, H.A.; Haan, S.D.; Engels, J.M.M.; Guarino, L.; Hoban, S.; Mercer, K.L.; Miller, A.J.; et al. Crop genetic erosion: understanding and responding to loss of crop diversity. New Phytologist. 2022, 233, 84–118. [Google Scholar] [CrossRef] [PubMed]
- van de Wouw, M.; Kik, C.; van Hintum, T.; van Treuren, R.; Visser, B. Genetic erosion in crops: concept, research results and challenges. Plant Genet. Resour. 2010, 8, 1–15. [Google Scholar] [CrossRef]
- Doyle, J.J.; Doyle, J.L. Isolation of plant DNA from fresh tissue. Focus. 1990, 12, 13–15. [Google Scholar]
- Macaulay, M.; Ramsay, L.; Powell, W.; Waugh, R. A representative, highly informative ‘genotyping set’ of barley SSRs. Theor. Appl. Genet. 2001, 102, 801–809. [Google Scholar] [CrossRef]
- Gu, Q.J.; Zhu, J.H.; Wang, J.M.; Yang, J.M. Genetic diversity of Zhejiang Barley Landraces with Different Levels of Fusarium Head Blight Resistance. J. Plant. Genet. Resour. 2013, 14, 472–478. [Google Scholar]
- Ferreira, J.R.; Pereira, J.F.; Turchetto, C.; Minella, E.; Consoli, L.; Delatorre, C.A. Assessment of genetic diversity in Brazilian barley using SSR markers. Genet. Mol. Biol. 2016, 39, 86–96. [Google Scholar] [CrossRef] [PubMed]
- Jilal, A.; Grando, S.; Henry, R.J.; Lee, L.S.; Rice, N.; Hill, H.; Baum, M.; Ceccarelli, S. Genetic diversity of ICARDA’s worldwide barley landrace collection. Genetic. Resour. Crop. Ev. 2008, 55, 1221–1230. [Google Scholar] [CrossRef]
- Kumar, P.; Banjarey, P.; Malik, R.; Tikle, A.N.; Verma, R.P.S. Population structure and diversity assessment of barley (Hordeum vulgare L.) introduction from ICARDA. J. Genet. 2020, 99, 2–9. [Google Scholar] [CrossRef]
- Ramsay, L.; Macaulay, M.; Ivanissevich, S.D.; MacLean, K.; Cardle, L.; Fuller, J.; Edwards, K.J.; Tuvesson, S.; Morgante, M.; Massari, A.; et al. A Simple Sequence Repeat-Based Linkage Map of Barley. Genet. 2000, 156, 1997–2005. [Google Scholar] [CrossRef]
- Jo, W.S.; Kim, H.Y.; Kim, K.M. Development and characterization of polymorphic EST based SSR markers in barley (Hordeum vulgare). Biotech 2017, 7, 265. [Google Scholar] [CrossRef]
- Varshney, R.K.; Marcel, T.C.; Ramsay, L.; Russell, J.; Röder, M.S.; Stein, N.; Waugh, R.; Langridge, P.; Niks, R.E.; Graner, A. A high density barley microsatellite consensus map with 775 SSR loci. Theor. Appl. Genet. 2007, 114, 1091–1103. [Google Scholar] [CrossRef]
- Feng, Z.Y.; Zhang, L.L.; Zhang, Y.Z.; Ling, H.Q. Genetic diversity and geographical differentiation of cultivated six-rowed naked barley landraces from the Qinghai-Tibet plateau of China detected by SSR analysis. Genet. Mol. Biol. 2006, 29, 330–338. [Google Scholar] [CrossRef]
- Lü, R.H.; Xu, Y.H.; Boyd, R.; Zhang, X.Q.; Broughton, S.; Jones, M.; Li, C.D.; Chen, Y.F. Barley and Wheat Share the Same Gene Controlling the Short Basic Vegetative Period. J. Integr. Agr. 2013, 12, 1703–1711. [Google Scholar] [CrossRef]
- Mohammadi, S.A.; Sisi, N.A.; Sadeghzadeh, B. The influence of breeding history, origin and growth type on population structure of barley as revealed by SSR markers. Sci. Rep. 2020, 10, 19165. [Google Scholar] [CrossRef] [PubMed]
- Elakhdar, A.; Kumamaru, T.; Qualset, C.O.; Brueggeman, R.S.; Amer, K.; Capo-chichi, L. Assessment of genetic diversity in Egyptian barley (Hordeum vulgare L.) genotypes using SSR and SNP markers. Genet. Resour. Crop. Ev. 2018, 65, 1937–1951. [Google Scholar] [CrossRef]
- Livak, K.J.; Flood, S.J.; Marmaro, J.; Giusti, W.; Deetz, K. Oligonucleotides with fluorescent dyes at opposite ends provide a quenched probe system useful for detecting pcr product and nucleic acid hybridization. Pcr Methods Appl. 1995, 4, 357–362. [Google Scholar] [CrossRef] [PubMed]
- Wright, S. The genetical structure of populations. Ann. Eugen. 1951, 15, 323–354. [Google Scholar] [CrossRef]
- Peakall, R.; Smouse, P.E. GenAlEx 6.5: Genetic analysis in Excel. Population genetic software for teaching and research: An update. Bioinformatics. 2012, 28, 2537–2539. [Google Scholar] [CrossRef]
- Excoffier, L.; Smouse, P.E.; Quattro, J.M. Analysis of molecular variance inferred from metric distances among DNA haplotypes: Application to human mitochondrial DNA restriction data. Genetics. 1992, 131, 479–491. [Google Scholar] [CrossRef] [PubMed]
- Pritchard, J.K.; Stephens, M.; Donnelly, P. Inference of population structure using multilocus genotype data. Genetics. 2000, 155, 945–959. [Google Scholar] [CrossRef] [PubMed]
- Earl, D.A.; Vonholdt, B.M. Structure harvester: a website and program for visualizing Structure output and implementing the Evanno method. Conserv. Genet. Resour. 2012, 4, 359–361. [Google Scholar] [CrossRef]
- Jakobsson, M.; Rosenberg, N.A. CLUMPP: A cluster matching and permutation program for dealing with label switching and multimodality in analysis of population structure. Bioinformatics. 2007, 23, 1801–1806. [Google Scholar] [CrossRef] [PubMed]
- Nei, M. Estimation of average heterozygosity and genetic distance from a small number of individuals. Genetics. 1978, 89, 583–590. [Google Scholar] [CrossRef] [PubMed]
- Rohlf, F.J. Department of Ecology and Evolution State University of New York Stony Brook. NTSYS-pc: Numerical Taxonomy and Multivariate Analysis System, Version 2.2: NY 11794-5245. New York: Applied Biostatistics Inc. 1988.
- IBM Corp. IBM SPSS statistics for Macintosh, version 28.0.1.0. Armonk, NY: IBM Corp. 2021.
- Jin, Y.; Lu, B.R. Sampling Strategy for genetic diversity (in Chinese). Biodiversity Science. 2003, 11, 155–161. [Google Scholar]
- Zhao, R.; Cheng, Z.; Lu, W.F.; Lu, B.R. Estimation of genetic diversity in wild soybean populations based on molecular markers Sampling Strategy (in Chinese). Science Bulletin. 2006, 9, 1042–1048. [Google Scholar]
- Andrijanic, Z.; Nazzicari, N.; Sarcevic, H.; Sudarić, A.; Annicchiarico, P.; Pejić, I. Genetic diversity and population structure of european soybean germplasm revealed by single nucleotide polymorphism. Plants. 2023, 12, 1837. [Google Scholar] [CrossRef]
- Haliloglu, K.; Turkoglu, A.; Tan, M.; Poczai, P. SSR-Based Molecular identification and population structure analysis for forage pea (Pisum sativum var. arvense L.) landraces. Genes 2022, 13, 1086. [Google Scholar] [CrossRef] [PubMed]
- Demirel, S.; Demirel, F. Molecular identifcation and population structure of emmer and einkorn wheat lines with diferent ploidy levels using SSR markers. Genetic Resources and Crop Evolution. 2024, 71, 363–372. [Google Scholar] [CrossRef]
- EI-Esawi, M.A.; Alaraidh, I.A.; Alsahli, A.A; Ali, H.M.; Alayafi, A.A.; Witczak, J.; Ahmad, M. Molecules genetic variation and alleviation of salinity stress in barley (Hordeum vulgare L.). Molecules. 2018, 23, 2488. [Google Scholar] [CrossRef]
- Orabi, J.; Jahoor, A.; Backes, G. Genetic diversity and population structure of wild and cultivated barley from west Asia and north Africa. Plant Breeding. 2010, 128, 606–614. [Google Scholar] [CrossRef]
- Guo, P.G.; Baum, M.; Grando, S.; Ceccarelli, S.; Bai, G.; Li, R.H.; Korff, M.V.; Varshney, R.K.; Graner, A.; Valkoun, J. Differentially expressed genes between drought-tolerant and drought-sensitive barley genotypes in response to drought stress during the reproductive stage. J. Exp. Bot. 2009, 60, 3531–3544. [Google Scholar] [CrossRef] [PubMed]
- Singh, D.P.; Babu, K.S.; Mann, S.K.; Meeta, M.; Karwasra, S.S.; Kalappanavar, I.K.; Singh, R.N.; Singh, A.K.; Singh, S.P. Integrated pest management in barley (Hordeum vulgare). Indian. J. Agr. Sci. 2010, 80, 437–442. [Google Scholar]
- Dinh, H.X.; Singh, D.; Periyannan, S.; Park, R.F.; Pourkheirandish, M. Molecular genetics of leaf rust resistance in wheat and barley. Theor. Appl. Genet. 2020, 133, 2035–2050. [Google Scholar] [CrossRef] [PubMed]
- He, Z.X.; Jiang, X.Q.; Ratnasekera, D.; Grassi, F.; Perera, U.; Lu, B.R. Seed-mediated gene flow promotes genetic diversity of weedy rice within populations: implications for weed management. PLoS One. 2014, 9, e112778. [Google Scholar] [CrossRef] [PubMed]
- Ming, F.; Liu, Q.K.; Shi, J.L.; Wang, W.; Lu, B.R. Strategic conservation of orchard germplasm based on indigenous knowledge and genetic diversity: a case study of sour orange populations in China. J Integr Plant Biol. 2009, 51, 100–106. [Google Scholar] [CrossRef] [PubMed]
- Liu, B.; Ma, G.H.; Bussmann, R.W.; Bai, K.Y.; Li, J.Q.; Cao, W.; Long, C.L. Determining factors for the diversity of hulless barley agroecosystem in the himalaya region-A case study from northwest Yunnan, China. Glob. Ecol. Conserv. 2019, 18, e00600. [Google Scholar] [CrossRef]
- Gao, D.; Xia-Gong; He, X.G.; Zhu, Y.Y. Changes of rice landraces diversity and rules of seed exchange in yuanyang of Yunnan (in Chinese). J. Plant. Genet. Resour. 2011, 12, 311–313. [Google Scholar]
- McLean-Rodríguez, F.D.; Costich, D.E.; Camacho-Villa, T.C.; Pè, M.E.; Dell’Acqua, M. Genetic diversity and selection signatures in maize landraces compared across 50 years of in situ and ex situ conservation. Heredity. 2021, 126, 913–928. [Google Scholar] [CrossRef] [PubMed]
- Negri, V.; Tiranti, B. Effectiveness of in situ and ex situ conservation of crop diversity. What a Phaseolus vulgaris L. landrace case study can tell us. Genetica. 2010, 138, 985–998. [Google Scholar] [CrossRef] [PubMed]
Figure 1.
Bar plots indicating genetic components of the 900 samples representing 10 each of the traditional (T-1~10), modern (M-1~10), and germplasm-resources-bank stored (G-1~10) naked barley varieties, based on the STRUCTURE analysis of the SSR molecular fingerprints at the most optimal K value (K=7) and their neighboring K values. Each sample is represented by a single vertical bar (line), proportional to different genetic components. Many naked barley samples showed the admixture genetic components in different varieties.
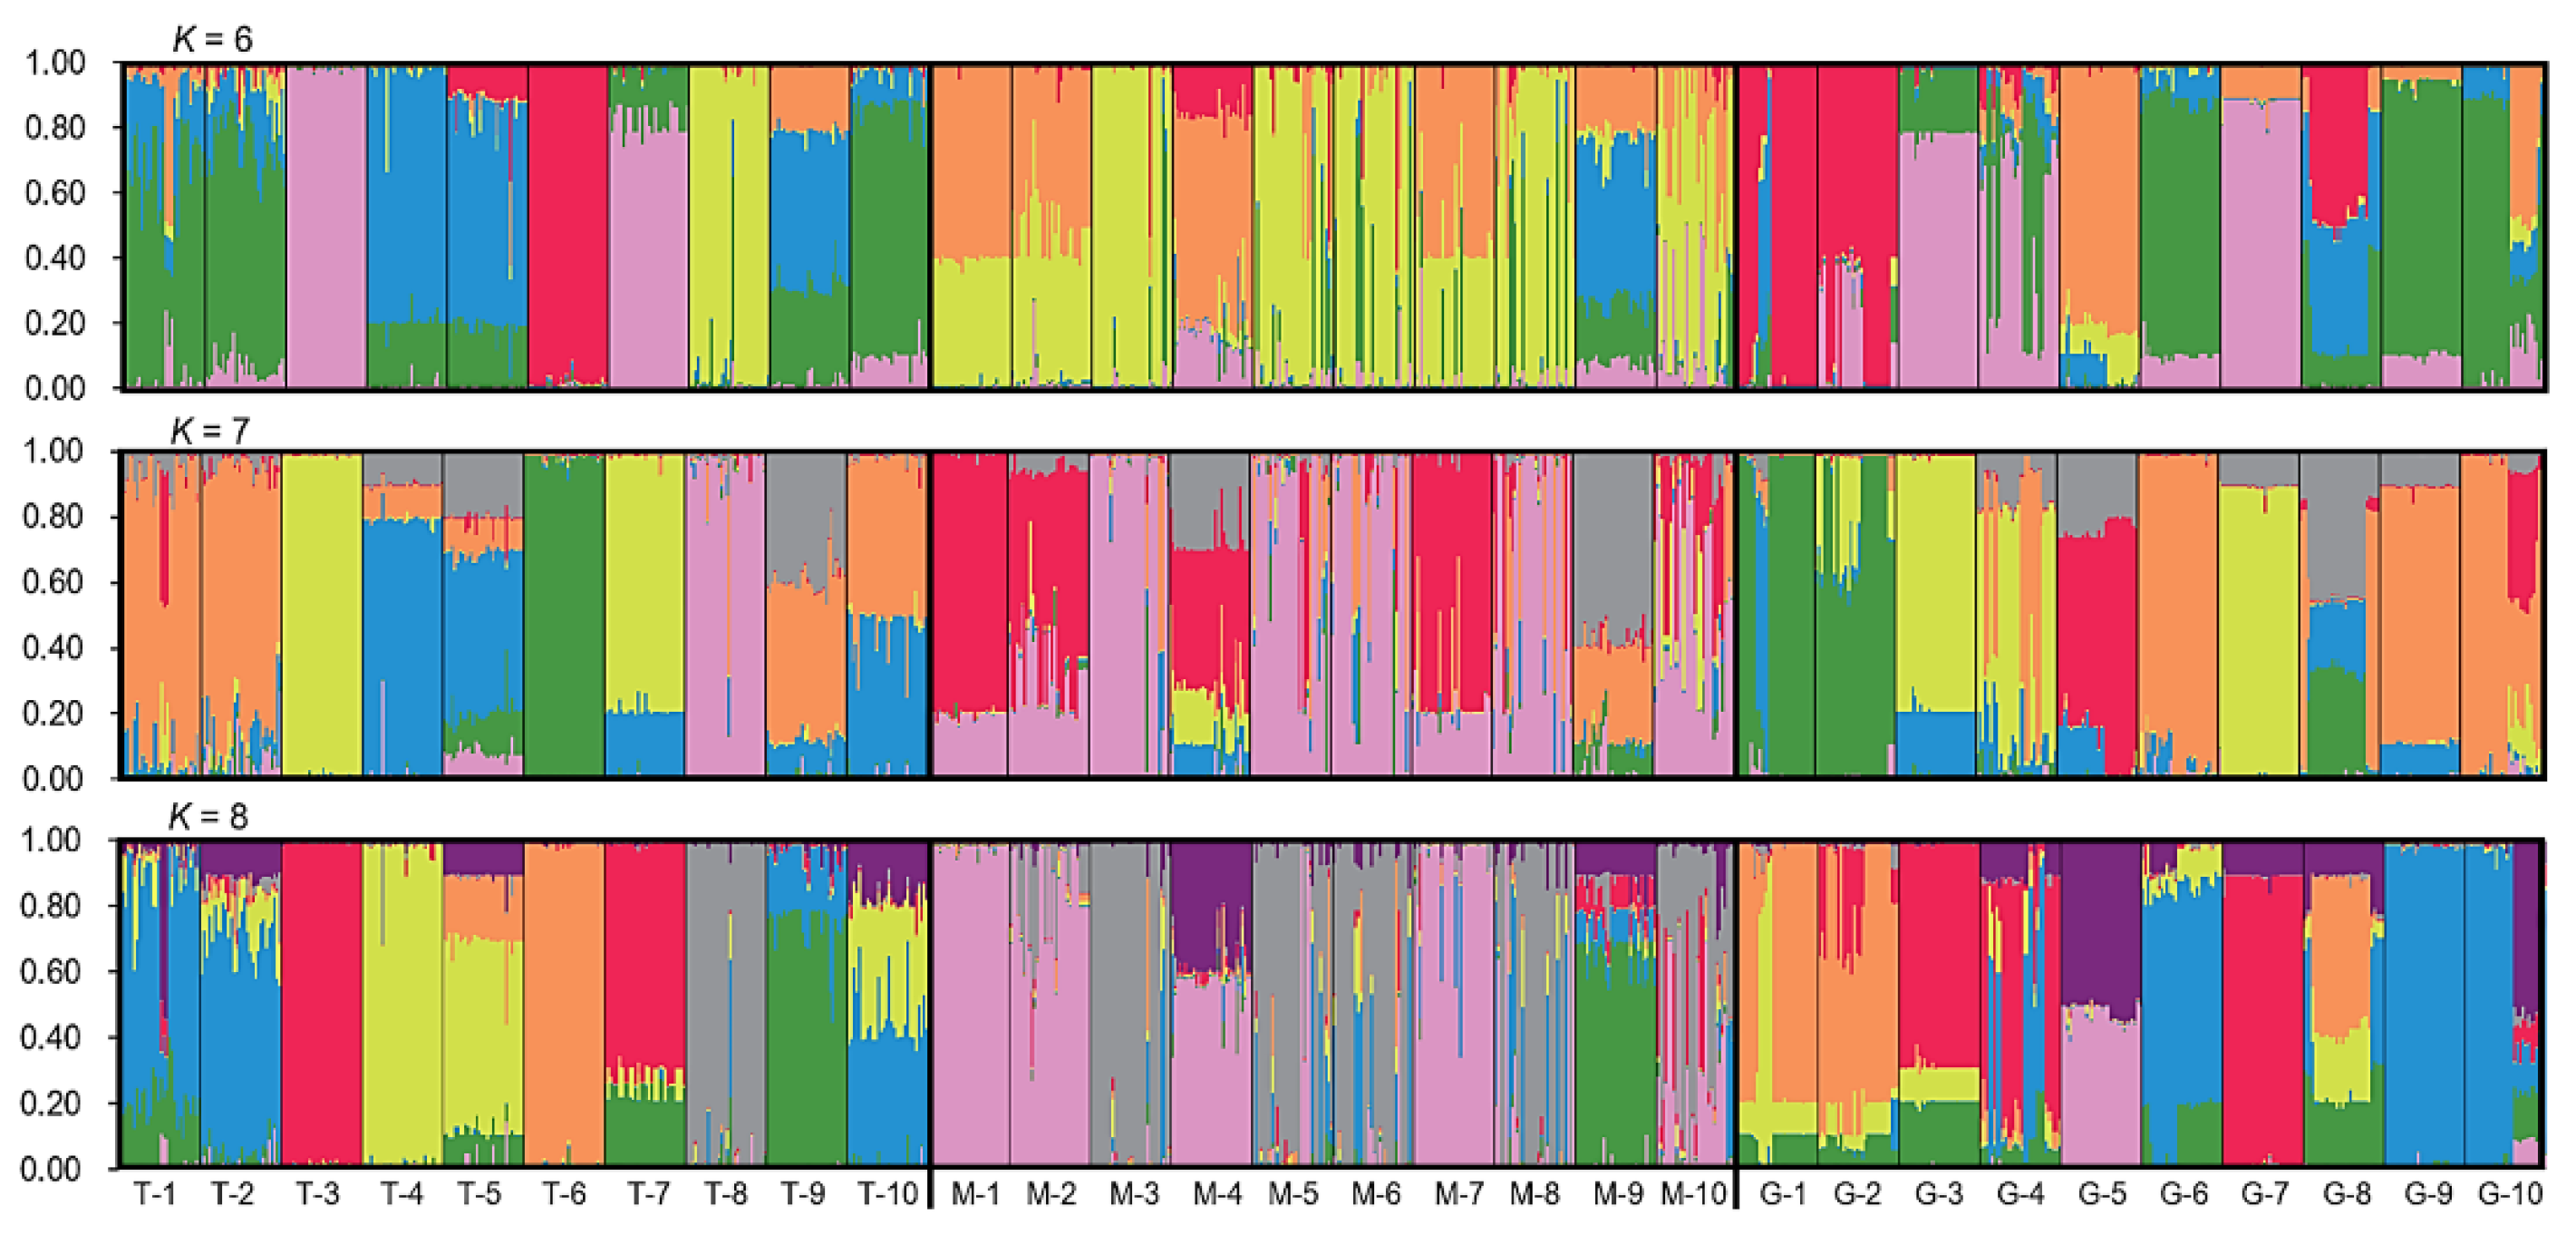
Figure 2.
The scatterplot demonstrating the overall genetic relationships of the 900 samples represented by the three gene-pools of the traditional (T, red triangles), modern (M, blue dots), and germplasm-resources-bank stored (G, green squares) naked barley varieties from Tibet of China, based on the principal coordinate analysis of the SSR molecular fingerprints.
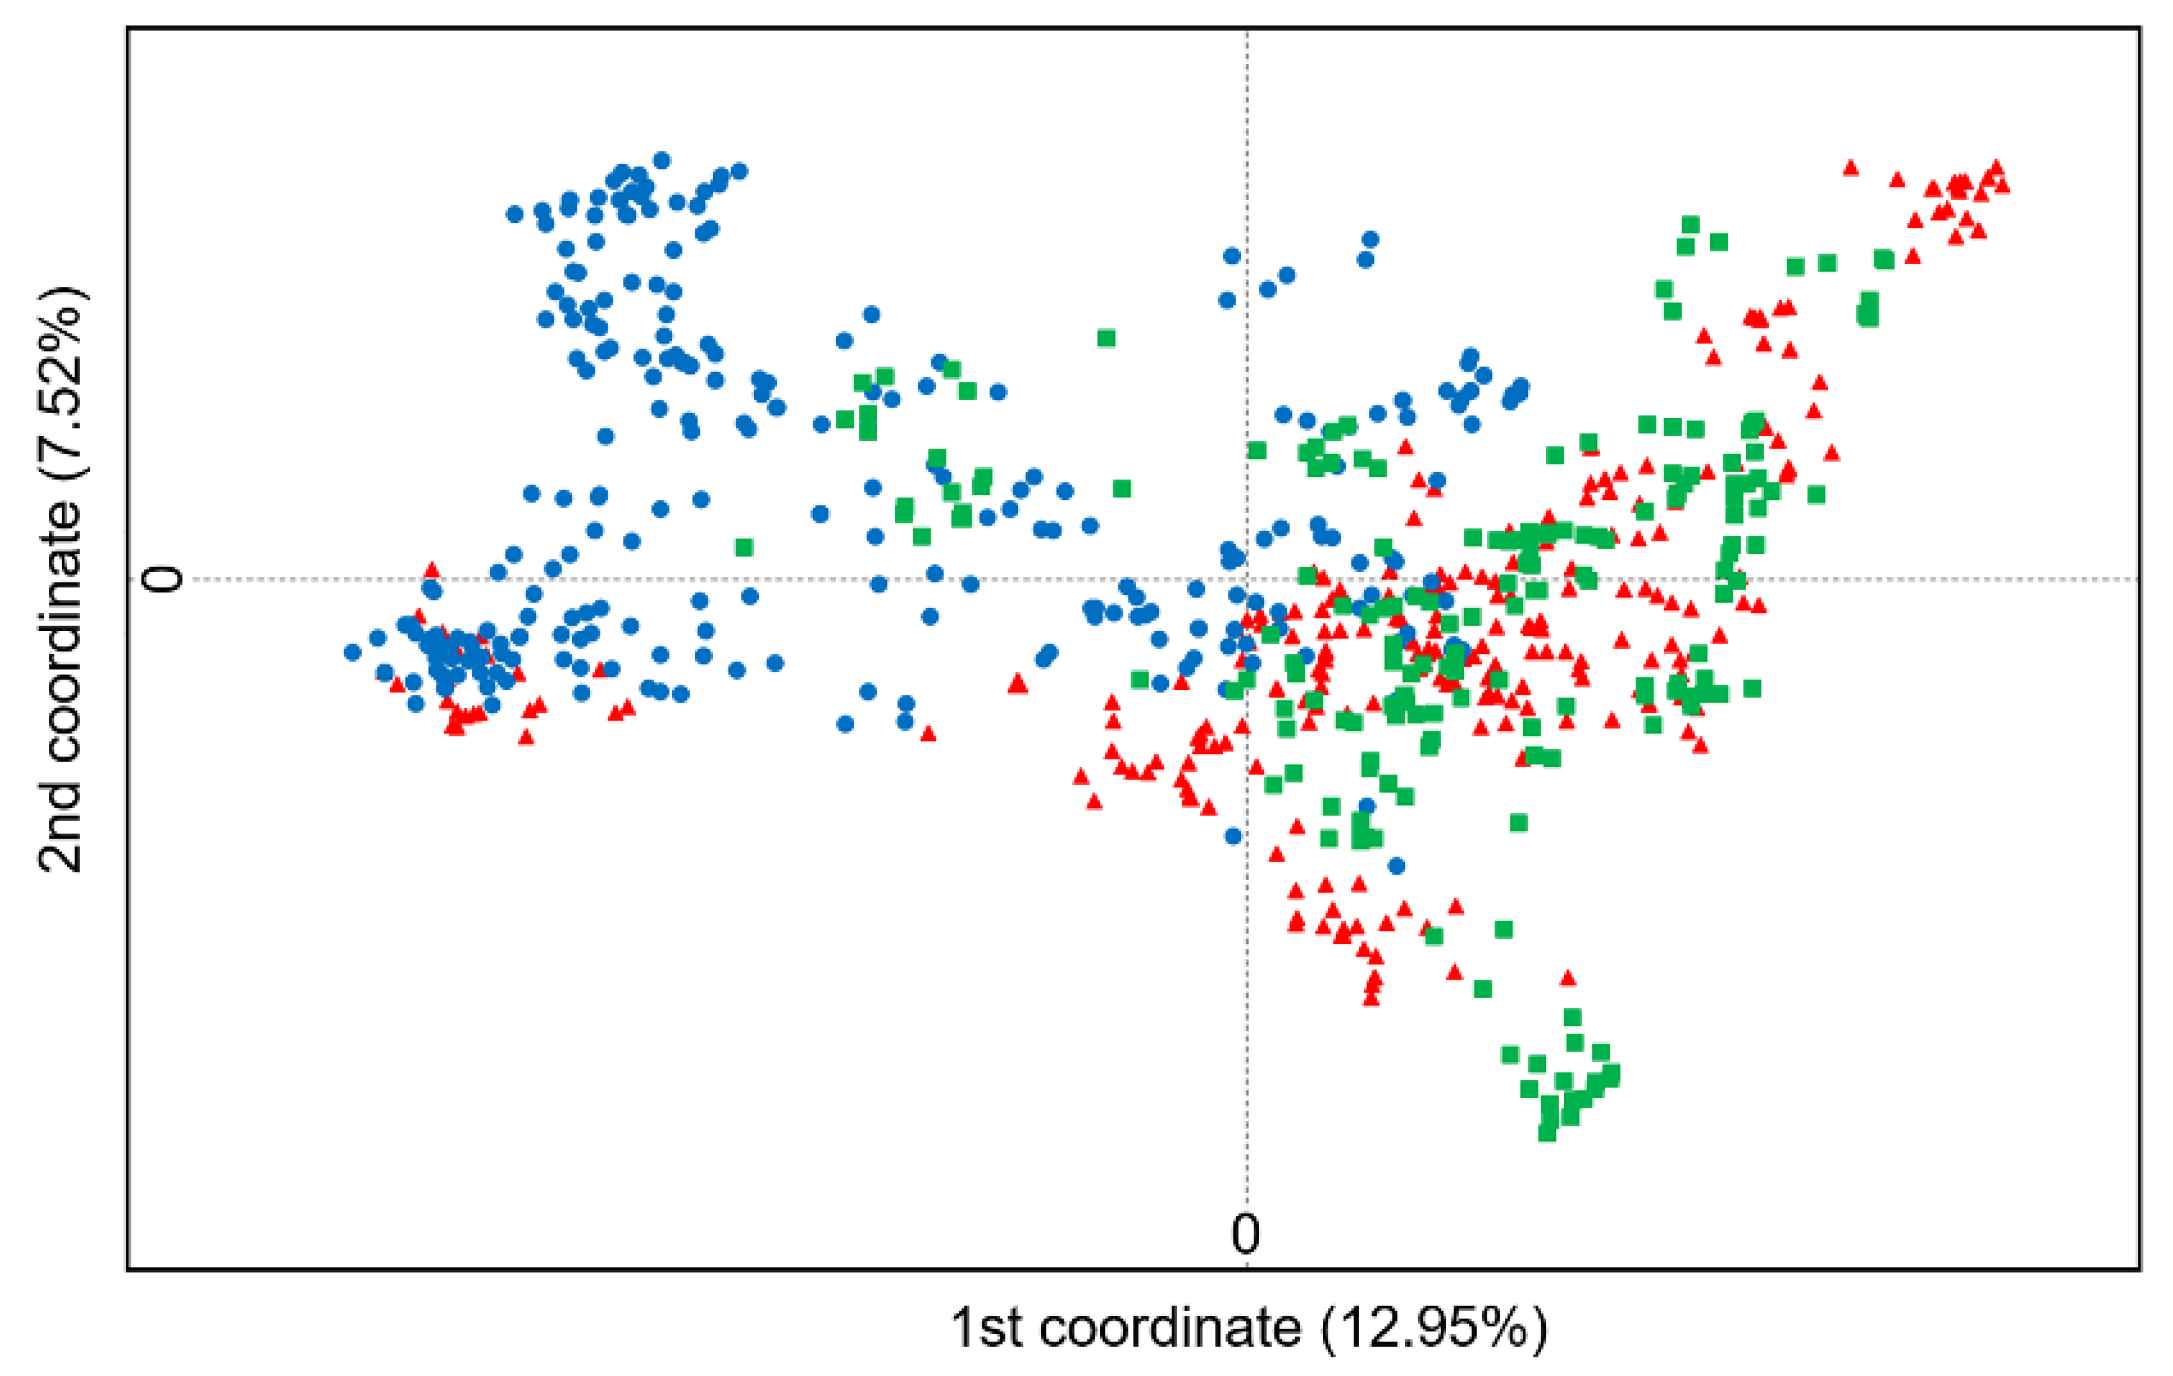
Figure 3.
The UPGMA dendrogram illustrating the genetic relationships of traditional (T), modern (M), and germplasm-resources-bank stored (G) naked barley varieties (1-10) from Tibet of China, based on the analysis of the pairwise Nei’s genetic similarity of the SSR molecular fingerprints. The shaded clusters indicate all the modern naked barley varieties (M-1~M10) that are somehow related to only two traditional (T-8 and T-9) and one germplasm-resources-bank stored varieties.
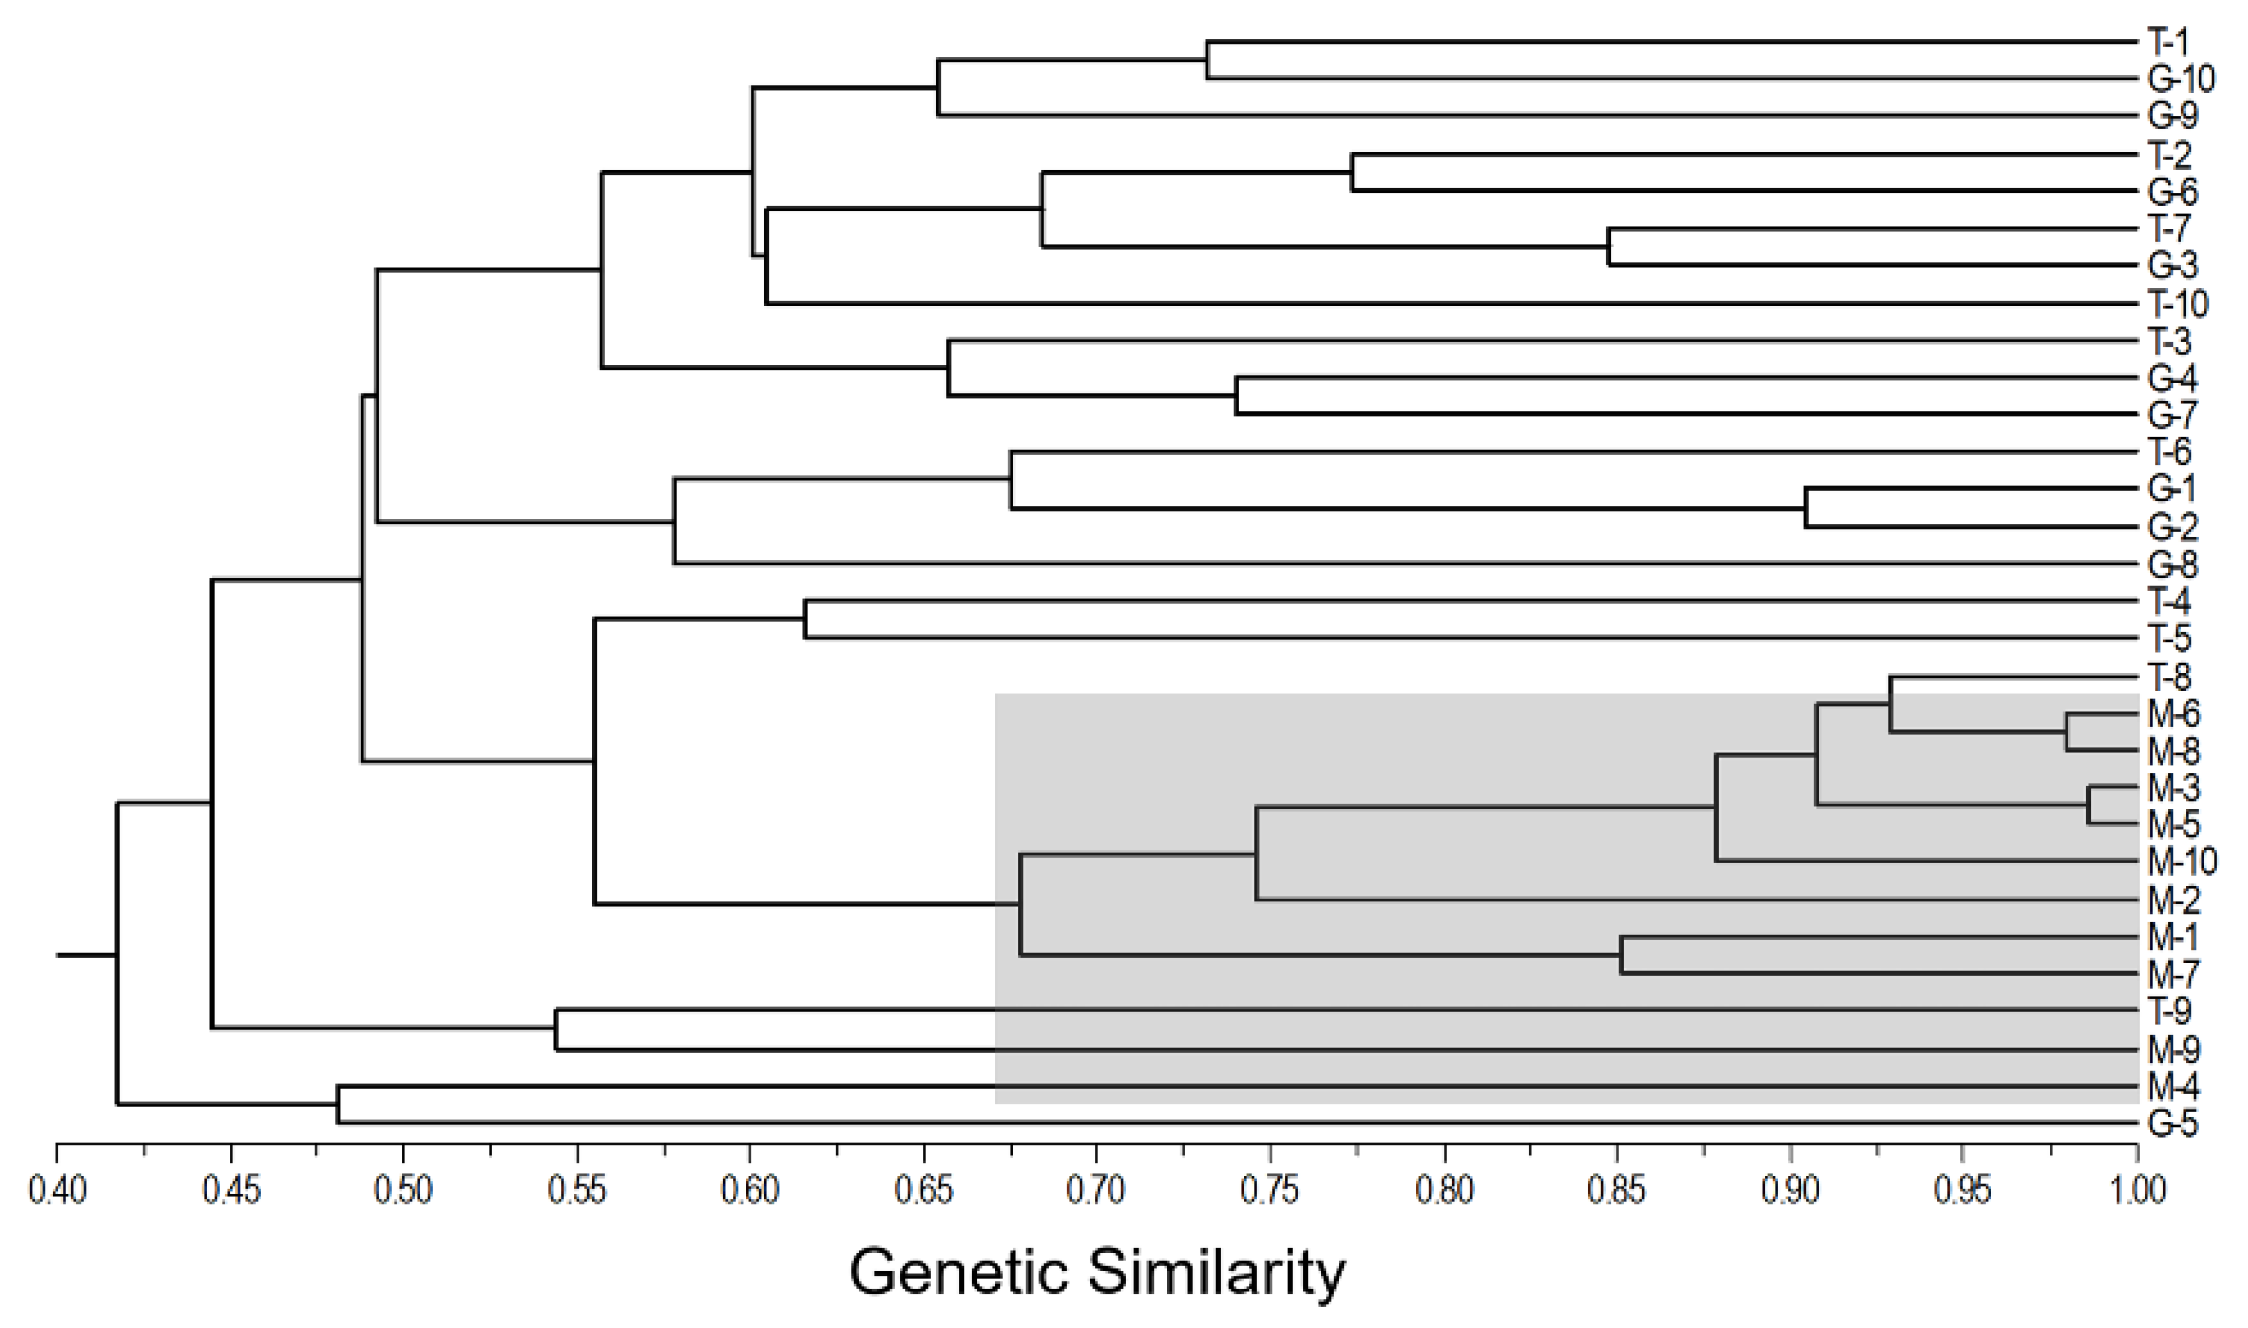
Figure 4.
The charts generated based on the regression analysis illustrating increases in genetic diversity (0~100%) with the increased number of samples/individuals from 5~30 intervals in the traditional (T), modern (M), and germplasm-resources-bank stored (G) naked barley varieties. Genetic diversity was represented by the parameters of the Nei’s genetic diversity (He), Shannon information index (I), and the percentage of polymorphic loci (P). The lines indicate the regression fitting curves; the rings represent the average values calculated from each of the 10 varieties in the T, M, and G gene-pools.
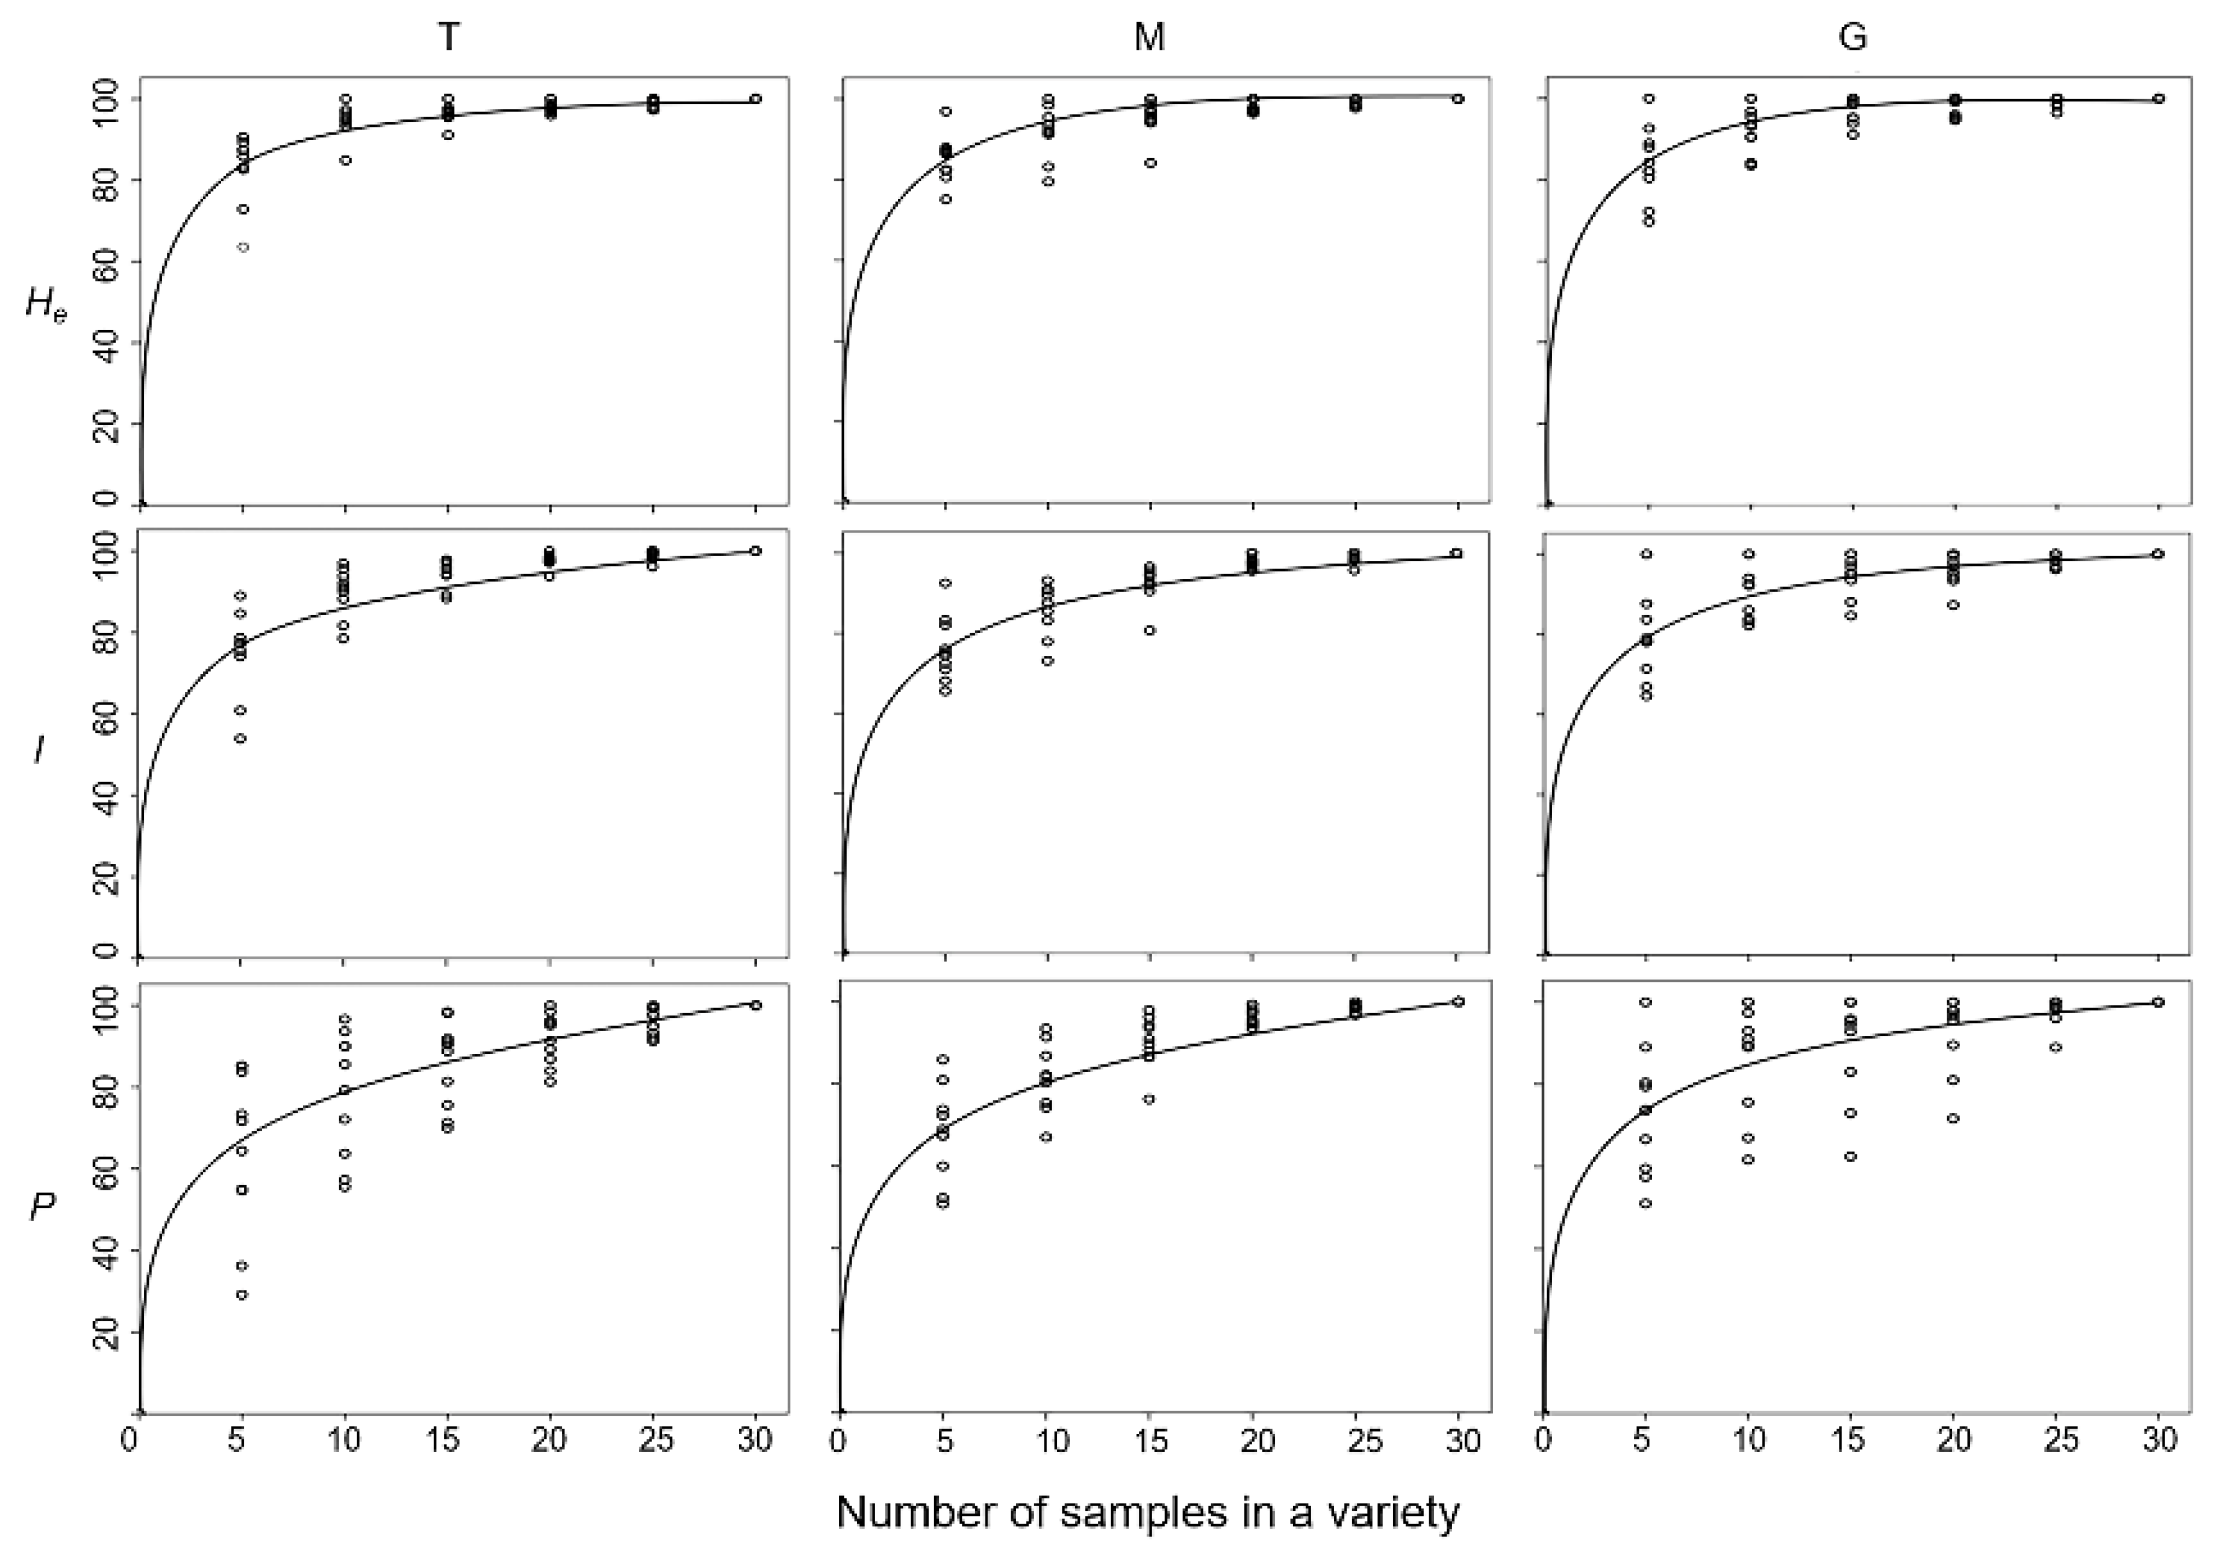

Table 1.
Names of the naked barley germplasm from the three gene pools of the traditional (T-1~10), modern (M-1~10), and germplasm-resources-bank stored (G-1~10) varieties used in this study with information on their collecting sites and locations (longitude, latitude, and altitude) in Tibet, China.
| Variety name | Variety type | Variety code | Collection site | Longitude (N) | Latitude (E) | Altitude (m) |
|---|---|---|---|---|---|---|
| Chanima | Traditional | T-10 | Medro Gongkar, Lhasa | 29°33′ | 92°20′ | 3989 |
| Chujuma | Traditional | T-1 | Khangmar, Shigatse | 28°27′ | 89°40′ | 4434 |
| Gamuguoduo | Traditional | T-9 | Rutok, Ngari | 33°42′ | 79°65′ | 4263 |
| Gamuguori | Traditional | T-8 | Samdruptse, Shigatse | 29°10′ | 90°43′ | 3881 |
| Jiaqiong | Traditional | T-3 | Chosum, Lhoka | 29°07′ | 92°19′ | 3830 |
| Niegachatong | Traditional | T-5 | Dayak, Chamdo | 29°85′ | 96°70′ | 3659 |
| Niegenguoluo | Traditional | T-7 | Medro Gongkar, Lhasa | 29°74′ | 91°97′ | 3843 |
| Nienachareng | Traditional | T-6 | Lhodak, Lhoka | 28°39′ | 90°79′ | 3917 |
| Nienachatong | Traditional | T-4 | Lhodak, Lhoka | 27°99′ | 91°94′ | 3853 |
| Wodun | Traditional | T-2 | Gampa, Shigatse | 28°46′ | 88°63′ | 4574 |
| 5171 | Modern | M-8 | Panam, Shigatse | 29°22′ | 90°46′ | 3539 |
| Shandong 18 | Modern | M-4 | Nyingri, Nyingtri | 29°51′ | 94°64′ | 3037 |
| Shanqing 9 | Modern | M-2 | Nedong, Lhoka | 29°21′ | 91°83′ | 3556 |
| Sulaqing 2 | Modern | M-6 | Taktse, Lhasa | 29°42′ | 91°26′ | 3692 |
| Xila 22 | Modern | M-1 | Chushur, Lhasa | 29°23′ | 90°51′ | 3431 |
| Xila 23 | Modern | M-9 | Panam, Shigatse | 28°76′ | 89°14′ | 4120 |
| Zangqing 17 | Modern | M-10 | Chushur, Lhasa | 29°38′ | 90°90′ | 3598 |
| Zangqing 2000 | Modern | M-5 | Nedong, Lhoka | 29°04′ | 91°86′ | 3763 |
| Zangqing 320 | Modern | M-3 | Nyemo, Lhasa | 29°29′ | 90°16′ | 3915 |
| Zangqing 85 | Modern | M-7 | Nyemo, Lhasa | 29°26′ | 90°10′ | 3815 |
| Chanima | Germplasm-bank | G-4 | ZDM06468 | 29°83′ | 91°73′ | 3823 |
| Chujuma | Germplasm-bank | G-10 | ZDM06775 | 29°65′ | 94°36′ | 2941 |
| Gamuguoduo | Germplasm-bank | G-8 | ZDM06088 | 30°30′ | 81°17′ | 3900 |
| Jiaqiong | Germplasm-bank | G-7 | ZDM06615 | 29°07′ | 92°20′ | 3985 |
| Niegachareng | Germplasm-bank | G-6 | ZDM07653 | 29°26′ | 88°88′ | 3842 |
| Niegachatong | Germplasm-bank | G-5 | ZDM05516 | 29°67′ | 97°84′ | 3806 |
| Niegenguoluo | Germplasm-bank | G-3 | ZDM06261 | 29°27′ | 92°02′ | 3687 |
| Nienachareng | Germplasm-bank | G-1 | ZDM07183 | 29°03′ | 91°68′ | 3896 |
| Nienachareng | Germplasm-bank | G-2 | ZDM05547 | 28°38′ | 90°87′ | 3842 |
| Wodun | Germplasm-bank | G-9 | ZDM06907 | 28°28′ | 88°52′ | 4375 |
Table 2.
The Hordeum vulgare SSR loci and their primer-pair sequences, motifs, and locations on the chromosomes used in this study.
Table 2.
The Hordeum vulgare SSR loci and their primer-pair sequences, motifs, and locations on the chromosomes used in this study.
| SSR locus [References] | Primer-pair sequence (5′-3′) | Motif (no. of repeats) | No. chromosome (L=long arm, S=short arm) |
|
| Forward Primer (5′) | Reverse Primer (3′) | |||
| Bmac0032 [29] | CCATCAAAGTCCGGCTAG | GTCGGGCCTCATACTGAC | AC (7) T(CA) (15) AT (9) | 1HL |
| Bmac0064 [30] | CTGCAGGTTTCAGGAAGG | AGATGCCCGCAAAGAGTT | CA (8) | 7HL |
| Bmac0090 [30] | CCGCACATAGTGGTTACATC | ACATCAACCCTCCTGCTC | AC (20) | 1HL |
| Bmac0096 [30] | GCTATGGCGTACTATGTATGGTTG | TCACGATGAGGTATGATCAAAGA | AT (6) AC (18) | 5HS |
| Bmac0163 [33] | TTTCCAACAGAGGGTATTTACG | GCAAAGCCCATGATACATACA | AC (6) GC (3) AC (17) | 5HS |
| Bmac0316 [29] | ATGGTAGAGGTCCCAACTG | ATCACTGCTGTGCCTAGC | AC (19) | 6HS |
| Bmac0389 [34] | TATGATTGCACGTCCGTTGT | AGGTTTTGATGCCTTGTTGG | TATC (5) | 1HS |
| Bmag0009 [29] | AAGTGAAGCAAGCAAACAAACA | ATCCTTCCATATTTTGATTAGGCA | AG (13) | 6HL |
| Bmag0011 [30] | ACAAAAACACCGCAAAGAAGA | GCTAGTACCTAGATGACCCCC | AG (13) AG (10) GA (7) | 7HL |
| Bmag0120 [32] | ATTTCATCCCAAAGGAGAC | GTCACATAGACAGTTGTCTTCC | AG (15) | 7HL |
| Bmag0211 [29] | ATTCATCGATCTTGTATTAGTCC | ACATCATGTCGATCAAAGC | CT (16) | 1HS |
| Bmag0223 [29] | TTAGTCACCCTCAACGGT | CCCCTAACTGCTGTGATG | AG (16) | 5HL |
| Bmag0225 [29] | AACACACCAAAAATATTACATCA | CGAGTAGTTCCCACGTGAC | AG (26) | 7HL |
| Bmag0323 [35] | TGACAAACAAATAATCACAGG | TTTGTGACATCTCAAGAACAC | CT (24) | 5HL |
| Bmag0337 [35] | ACAAAGAGGGAGTAGTACGC | GACCCATGATATATGAAGATCA | AG (22) | 5HL |
| Bmag0558 [36] | TCAAATTCAGTTGCTGCTGG | CTCCTACCTATCTCGGCGTG | ACAT (8) | 3HS |
| Bmag0603 [30] | ATACCATGATACATCACATCG | GGGGGTATGTACGACTAACTA | AG (24) | 3HL |
| Bmag0693 [34] | AGTTGAGTTATCTGGGAGCA | AAACCCTAGGGCACCGACCT | TA (5) | 2HL |
| Bmag0759 [34] | CTCCATGACGATGAGGAGAAG | AAGAACACCATATGATCCAAC | GA (12) | 6HL |
| Bmag0835 [34] | CTTATGTCCGGGGACTTCCT | TGTTGCTGGAGCAAGAAGAA | GA (20) | 5HS |
| Bmag0870 [30] | AACCATAGGATTTGTACTAGTTTC | TCATGACATCTCAAGAACG | TC (8) CT (8) CT (6) | 6HL |
| GBM1215 [36] | ATGACCAGAAAACGCCTGTC | GGATTCTGCACACACGAGAA | AC (10) | 6HS |
| GMS0027 [32] | CTTTTTCTTTGACGATGCACC | TGAGTTTGTGAGAACTGGATGG | GT (5) CT (2) GT (27) | 5HL |
| HVM20 [31] | CTCCACGAATCTCTGCACAA | CACCGCCTCCTCTTTCAC | GA (19) | 1HL |
| HVM36 [29] | TCCAGCCGAACAATTTCTTG | AGTACTCCGACACCACGTCC | GA (13) | 2HS |
| HVM43 [37] | GGATTTTCTCAAGAACACTT | GCGTGAGTGCATAACATT | CA (9) | 1HS |
| SCSSR02748 [38] | GGTGCATTTGGAAGTCTAGG | ATAGCAAGTGCCAAGTGAGC | CT (11) | 1HL |
| SCSSR05599 [39] | TTCCATCATAACAGCAATGG | TTCGTCGAAGGCTATGTAGG | ACA (8) | 6HL |
| SCSSR07970 [40] | TGCATTGGGAGTGCTAGG | TGCAAGAAGCCAAGAATACC | TGC (5) | 7HS |
| SCSSR09398 [39] | AGAGCGCAAGTTACCAAGC | GTGCACCTCAGCGAAAGG | GAA (10) | 6HS |
| SCSSR10148 [29] | AAGCAGCAAAGCAAAGTACC | TCATCAGCATCTGATCATCC | GT (10) | 5HL |
Table 3.
Genetic diversity parameters in the three gene pools of the traditional (T1~10), modern (M-1~10), and germplasm-resources-bank stored (G-1~10) naked barley varieties collected in Tibet, China.
Table 3.
Genetic diversity parameters in the three gene pools of the traditional (T1~10), modern (M-1~10), and germplasm-resources-bank stored (G-1~10) naked barley varieties collected in Tibet, China.
| Variety code | N* | Na | Ne | I | Ho | He | P | Fst | Nm |
| T-1 | 30 | 3.26±0.32 | 2.02±0.15 | 0.76±0.08 | 0.02±0.02 | 0.42±0.04 | 87.10% | ||
| T-2 | 30 | 3.19±0.29 | 2.08±0.19 | 0.74±0.09 | 0.02±0.02 | 0.41±0.04 | 87.10% | ||
| T-3 | 30 | 1.52±0.17 | 1.20±0.07 | 0.18±0.06 | 0.02±0.02 | 0.10±0.03 | 29.03% | ||
| T-4 | 30 | 1.71±0.15 | 1.15±0.05 | 0.18±0.04 | 0.03±0.03 | 0.10±0.03 | 51.61% | ||
| T-5 | 30 | 1.87±0.20 | 1.23±0.08 | 0.22±0.06 | 0.03±0.03 | 0.12±0.04 | 48.39% | ||
| T-6 | 30 | 1.61±0.16 | 1.23±0.09 | 0.20±0.06 | 0.03±0.02 | 0.12±0.04 | 45.16% | ||
| T-7 | 30 | 1.81±0.19 | 1.48±0.11 | 0.34±0.07 | 0.02±0.02 | 0.22±0.05 | 51.61% | ||
| T-8 | 30 | 2.26±0.19 | 1.27±0.08 | 0.29±0.05 | 0.02±0.02 | 0.16±0.03 | 80.65% | ||
| T-9 | 30 | 2.90±0.26 | 1.85±0.14 | 0.64±0.08 | 0.02±0.02 | 0.37±0.04 | 93.55% | ||
| T-10 | 30 | 2.39±0.19 | 1.50±0.10 | 0.46±0.06 | 0.02±0.02 | 0.27±0.04 | 80.65% | ||
| T-average | 30 | 2.25±0.21 | 1.50±0.11 | 0.40±0.07 | 0.02±0.02 | 0.23±0.04 | 65.49% | ||
| T-Overall | 300 | 6.32±0.68 | 2.99±0.28 | 1.17±0.09 | 0.02±0.02 | 0.58±0.03 | 100% | 0.61±0.03 | 0.19±0.03 |
| M-1 | 30 | 1.81±0.17 | 1.34±0.08 | 0.30±0.06 | 0.01±0.01 | 0.19±0.04 | 54.84% | ||
| M-2 | 30 | 2.52±0.19 | 1.58±0.11 | 0.50±0.06 | 0.01±0.01 | 0.30±0.40 | 87.10% | ||
| M-3 | 30 | 2.55±0.19 | 1.40±0.08 | 0.42±0.05 | 0.004±0.004 | 0.24±0.03 | 87.10% | ||
| M-4 | 30 | 2.45±0.22 | 1.59±0.12 | 0.50±0.07 | 0.01±0.01 | 0.29±0.04 | 90.32% | ||
| M-5 | 30 | 3.42±0.24 | 1.66±0.10 | 0.65±0.06 | 0.01±0.01 | 0.34±0.03 | 93.55% | ||
| M-6 | 30 | 2.97±0.22 | 1.51±0.10 | 0.52±0.06 | 0.005±0.004 | 0.28±0.04 | 90.32% | ||
| M-7 | 30 | 2.39±0.20 | 1.29±0.06 | 0.35±0.05 | 0.001±0.001 | 0.19±0.03 | 83.87% | ||
| M-8 | 30 | 2.90±0.23 | 1.70±0.11 | 0.61±0.07 | 0.000±0.000 | 0.34±0.04 | 90.32% | ||
| M-9 | 30 | 2.00±0.15 | 1.47±0.10 | 0.41±0.07 | 0.000±0.000 | 0.24±0.04 | 70.97% | ||
| M-10 | 30 | 3.13±0.21 | 2.01±0.11 | 0.77±0.06 | 0.001±0.001 | 0.45±0.03 | 93.55% | ||
| M-average | 30 | 2.61±020 | 1.34±0.10 | 0.50±0.06 | 0.01±0.01 | 0.29±0.07 | 84.19% | ||
| M-Overall | 300 | 5.55±0.41 | 2.28±0.15 | 0.97±0.07 | 0.005±0.004 | 0.50±0.04 | 100% | 0.39±0.03 | 0.85±0.27 |
| G-1 | 30 | 2.07±0.15 | 1.39±0.07 | 0.40±0.06 | 0.01±0.01 | 0.23±0.03 | 70.97% | ||
| G-2 | 30 | 1.87±0.15 | 1.55±0.09 | 0.42±0.06 | 0.01±0.004 | 0.28±0.04 | 64.52% | ||
| G-3 | 30 | 1.42±0.13 | 1.15±0.07 | 0.13±0.05 | 0.02±0.02 | 0.08±0.03 | 32.26% | ||
| G-4 | 30 | 2.26±0.20 | 1.72±0.12 | 0.56±0.07 | 0.01±0.01 | 0.34±0.04 | 74.19% | ||
| G-5 | 30 | 2.30±0.20 | 1.69±0.12 | 0.50±0.08 | 0.01±0.01 | 0.31±0.05 | 67.74% | ||
| G-6 | 30 | 2.45±0.26 | 1.49±0.13 | 0.43±0.07 | 0.02±0.02 | 0.24±0.04 | 74.19% | ||
| G-7 | 30 | 1.52±0.14 | 1.19±0.07 | 0.18±0.05 | 0.02±0.02 | 0.10±0.03 | 38.71% | ||
| G-8 | 30 | 2.16±0.16 | 1.60±0.09 | 0.51±0.07 | 0.02±0.02 | 0.31±0.04 | 77.42% | ||
| G-9 | 30 | 1.61±0.18 | 1.23±0.07 | 0.21±0.06 | 0.02±0.02 | 0.12±0.04 | 38.71% | ||
| G-10 | 30 | 2.36±0.15 | 1.78±0.09 | 0.61±0.06 | 0.02±0.02 | 0.38±0.04 | 87.10% | ||
| G-average | 30 | 2.00±0.17 | 1.48±0.09 | 0.40±0.06 | 0.02±0.02 | 0.24±0.04 | 62.58% | ||
| G-Overall | 300 | 5.55±0.43 | 3.06±0.31 | 1.15±0.09 | 0.02±0.02 | 0.57±0.04 | 100% | 0.59±0.03 | 0.27±0.08 |
| Overall | 900 | 8.00±0.70 | 3.13±0.28 | 1.26±0.09 | 0.02±0.01 | 0.60±0.03 | 100% | 0.59±0.02 | 0.20±0.02 |
* N, number of samples; Na, number of alleles per locus; Ne, number of effective alleles per locus; I, Shannon-Wiener index; Ho, observed heterozygosity; He, Nei’s genetic diversity (expected heterozygosity) (Nei, 1978); P, percentage of polymorphism loci; Fst, fixation index (Wright, 1951); Nm, number of migrations (gene flow) per generation.
Table 4.
Private alleles (with frequency ≥0.05) detected in the traditional (T), modern (G), and germplasm-resources-bank stored (G) naked-barley varieties from Tibet, China.
Table 4.
Private alleles (with frequency ≥0.05) detected in the traditional (T), modern (G), and germplasm-resources-bank stored (G) naked-barley varieties from Tibet, China.
| Variety code | SSR locus | Allele | Frequency | Variety code | SSR locus | Allele | Frequency | Variety code | SSR locus | Allele | Frequency |
| T-7 | Bmag0639 | 314 | 0.57 | M-4 | Bmag0759 | 205 | 0.97 | G-5 | Bmag0835 | 253 | 0.50 |
| T-1 | Bmac0032 | 279 | 0.20 | M-4 | Bmag0011 | 192 | 0.37 | G-8 | Bmac0032 | 247 | 0.70 |
| T-6 | Bmac0032 | 271 | 0.60 | M-10 | Bmag0009 | 180 | 0.07 | G-8 | Bmag0693 | 239 | 0.27 |
| T-9 | Bmac0032 | 265 | 0.17 | M-2 | HVM36 | 131 | 0.07 | G-8 | Bmag0211 | 211 | 0.70 |
| T-9 | Bmac0032 | 263 | 0.37 | G-6 | Bmag0759 | 201 | 0.17 | ||||
| T-9 | Bmac0090 | 240 | 0.07 | G-6 | Bmac0096 | 185 | 0.07 | ||||
| T-6 | SCSSR09398 | 232 | 0.92 | G-2 | Bmag0323 | 169 | 0.07 | ||||
| T-2 | SCSSR09398 | 228 | 0.05 | G-5 | Bmag0011 | 158 | 0.33 | ||||
| T-9 | Bmac0389 | 217 | 0.10 | G-8 | Bmag0603 | 140 | 0.10 | ||||
| T-3 | SCSSR09398 | 192 | 0.60 | G-6 | Bmag0223 | 137 | 0.27 | ||||
| T-3 | SCSSR09398 | 190 | 0.35 | G-9 | Bmag0870 | 129 | 0.80 | ||||
| T-9 | Bmag0870 | 153 | 0.07 | ||||||||
| T-1 | Bmag0337 | 152 | 0.10 | ||||||||
| T-9 | Bmag0603 | 138 | 0.20 | ||||||||
| T-9 | Bmag0603 | 136 | 0.37 |
Table 5.
Analysis of molecular variance (AMOVA) of 30 naked barley varieties in the traditional (T), modern (M), and germplasm-resources-bank stored (G) gene pools showing the partition of genetic diversity within and among gene pools. P-value (<0.01) estimates are based on 99999 permutations.
Table 5.
Analysis of molecular variance (AMOVA) of 30 naked barley varieties in the traditional (T), modern (M), and germplasm-resources-bank stored (G) gene pools showing the partition of genetic diversity within and among gene pools. P-value (<0.01) estimates are based on 99999 permutations.
| Source | d.f.* | SS | MS | Est. var. | % |
| Within varieties | 290 | 4017.70 | 13.85 | 13.85 | 37 |
| Among varieties | 9 | 6592.89 | 732.54 | 23.96 | 63 |
| Subtotal (T-gene pool) | 299 | 10610.59 | - | 37.81 | 100 |
| Within varieties | 290 | 5257.90 | 18.13 | 18.13 | 56 |
| Among varieties | 9 | 3989.74 | 443.30 | 14.17 | 44 |
| Subtotal (M-gene pool) | 299 | 9247.64 | - | 32.30 | 100 |
| Within varieties | 290 | 4298.67 | 14.82 | 14.82 | 40 |
| Among varieties | 9 | 6211.86 | 690.21 | 22.51 | 60 |
| Subtotal (G-gene pool) | 299 | 10510.52 | - | 37.34 | 100 |
| Within varieties | 870 | 13570.60 | 15.60 | 15.60 | 40 |
| Among varieties | 27 | 16795.88 | 622.07 | 20.22 | 53 |
| Among gene pools | 2 | 2856.53 | 1428.26 | 2.69 | 7 |
| Total | 899 | 33223.01 | 2065.93 | 38.50 | 100 |
* d.f., degree of freedom; SS, sum of squared deviations; MS, mean of squared deviations; Est. var., variance component estimates; %, total percentage of total variation.
Disclaimer/Publisher’s Note: The statements, opinions and data contained in all publications are solely those of the individual author(s) and contributor(s) and not of MDPI and/or the editor(s). MDPI and/or the editor(s) disclaim responsibility for any injury to people or property resulting from any ideas, methods, instructions or products referred to in the content. |
© 2024 by the authors. Licensee MDPI, Basel, Switzerland. This article is an open access article distributed under the terms and conditions of the Creative Commons Attribution (CC BY) license (http://creativecommons.org/licenses/by/4.0/).
Copyright: This open access article is published under a Creative Commons CC BY 4.0 license, which permit the free download, distribution, and reuse, provided that the author and preprint are cited in any reuse.


