
Submitted:
15 November 2024
Posted:
18 November 2024
You are already at the latest version
Abstract
This study aimed to 3D print a patient-specific chest phantom simulating multiple lung nodules to optimise low-dose CT protocols for lung cancer screening. The chest phantom, which was developed from a selected patient’s chest CT images was fabricated using a variety of materials, including PLA, Glow-PLA, ABS, and polyurethane resin. The phantom was scanned under different low-dose (LDCT) and ultra-low-dose CT (ULDCT) protocols by varying the kVp and mAs. Subjective image quality was evaluated by three radiologists using a 5-point Likert scale, while objective image quality was assessed using signal-to-noise ratio (SNR) and contrast-to-noise ratio (CNR). The phantom's lung tissue, lung nodules, and diaphragm demonstrated radiation attenuation comparable to patient tissue, as measured in Hounsfield Units (HU). However, significant variations in HU were observed for the skin, subcutaneous fat, muscle, bone, heart, lung vessels, and blood vessels compared to patient tissues, with values ranging from 93.9 HU to -196 HU (p < 0.05). Both SNR and CNR decreased as the effective dose was reduced, with a strong positive linear correlation (r = 0.92 and r = 0.93, respectively, p < 0.001). The median subjective image quality score from radiologists was 4, indicating good diagnostic confidence across all CT protocols (κ=-0.398, 95% CI [-0.644 to -0152], p < .002.). An optimal protocol of 80 kVp and 30 mAs was identified for lung nodule detection, delivering a dose of only 0.23 mSv, which represents a 96% reduction compared to standard CT protocols. These findings highlight the potential for significant dose reductions in lung cancer screening programs. Further studies are recommended to improve the phantom by selecting more tissue-equivalent materials.
Keywords:
3D-print
; chest model
; low-dose CT
; ultra-low dose CT
; lung cancer screening
; lung nodules
; pulmonary nodules
1. Introduction
Lung cancer is the leading cause of cancer-related deaths worldwide [1]. Its notoriety can be attributed to the delayed presentation of symptoms, with early manifestations of lung nodules being undetected [2]. Lung cancer screening trials have revealed that annual low-dose CT (LDCT) can improve early detection rates and hence survival from lung cancer by 20–30% compared to planar chest X-rays in high-risk individuals [2,3,4]. However, some countries are hesitant to adopt national lung cancer screening programs using LDCT due to the risks associated with repetitive exposure to higher levels of ionising radiation in a screening forum [5]. Although LDCT delivers approximately 1.5 mSv per examination, which is lower than the 8 mSv range of regular CT scans, the cumulative dose from annual screenings may equate to or even exceed typical CT radiation levels, elevating the risk of carcinogenic effects [6].
With the recent advancements in CT technology [7], studies have explored the potential to reduce dose to levels comparable to that of conventional chest X-rays, in the range of 0.06–0.10 mSv [8], whilst maintaining adequate image quality for the detection of lung nodules [5,8,9,10,11,12,13,14,15,16,17,18]. These submillisievert scans are termed “ultra-low-dose-CT” (ULDCT). For example, Burgard et al., [5] utilised a porcine phantom with artificial lung nodules to investigate low-dose and ULDCT protocols. They reduced tube voltage by capitalising on using advanced-modelled iterative reconstruction (ADMIRE), an algorithm which retrospectively modifies data to supress noise. Additionally, tin filtering was used to shape high energy spectra for an efficient, lower-dose beam. Consequently, they suggested that an ULDCT protocol is feasible for lung nodule detection by applying 100 kVp with tin filtering, delivering a mere 0.1 mSv effective dose. Similarly, Huber et al., [11] used iterative reconstruction (IRIS, Siemens, Healthineers, Germany) on a commercial N1-LUNGMAN phantom and concluded that 80 kVp with 6 mAs was adequate for nodule visualisation. Likewise, by manipulating tube voltage and current, Leitão et al. (2021) [13] concluded that an ULDCT protocol of 80 kVp and 30 mAs in a commercial Alderson Rando phantom was viable for nodule detection, giving an effective dose of 0.072 mSv.
The indication that lung nodule detection is possible with radiation exposures equivalent to chest X-rays justifies the potential benefits of participating in LDCT screening programs, where the advantages may outweigh the risks. However, these studies predominantly investigated low-dose protocols using commercial phantoms or simplistic block slabs, which have been criticised for being unrealistic, too generic, not patient-specific, and exorbitantly expensive, costing in the range of $30 000–$40 000 [19,20]. Furthermore, their homogeneous composition of lung parenchyma, without inclusion of lung vessels, creates enhanced contrast that makes lung nodules easier to visualise compared to what would be their appearance within realistic, heterogeneous, multi-cellular human anatomy. Therefore, a more realistic representation of a human chest is warranted to more reliably study low-dose protocols for lung nodule detection.
Three-dimensional (3D) printed phantoms are increasingly utilised as more realistic alternatives for representing human anatomy [21], with many researchers creating chest phantoms for radiological applications [22]. In their study, Cavlarie et al. [19] 3D printed a thoracic model using fused-deposition modelling (FDM), whereby thermoplastic filament is melted through a heated nozzle and deposited layer-by-layer on a printing bed. Despite replicating the human lungs, nodules, vessels, bones, muscle, and fat; their model was not radiation equivalent. Currently, Hong et al. [23] has produced the most comprehensive radiation equivalent and geometrically accurate 3D printed patient-specific chest phantom, incorporating bone, heart, skin, fat, muscle and silicone casted lung parenchyma and nodules [22]. However, their phantom merely represents an axial slice rather than an entire torso and does not incorporate lung vessels. Others have developed radiation equivalent chest phantoms for a range of purposes including to optimise low-dose CT pulmonary angiography (CTPA) protocols for the detection of pulmonary embolism [24] and for optimising CT surveillance scans post thoracic endovascular aortic repair (TEVAR) [25,26]. Nonetheless, no study thus far has 3D printed a thoracic model with the simulation of lung nodules to study low-dose protocols for lung cancer screening [22]. Additionally, most studies 3D print discreet thoracic organs, with limited phantoms representing holistic thoracic structures [22].
Thus, the aim of this study was to 3D print a realistic and radiologically tissue equivalent patient-specific CT derived chest phantom that comprehensively incorporates the full gamut of thoracic structures as well as lung nodules in order to optimise LDCT protocols for lung nodule detection. It was hypothesized that through the use of the 3D-printed phantom, optimal LDCT protocols can be identified by reducing voltage and current, despite the associated increase in noise. Furthermore, it is anticipated that there will be a threshold at which the voltage and current can no longer be reduced further due to overpowering noise that would interfere with diagnostic capability.
2. Materials and Methods
This study was approved by Curtin Human Research Ethics (HRE) Committee, Australia (approval number: HRE2024-0391).
2.1. Selection of Sample Case and Image Segmentation
The anonymised chest CT dataset in the format of Digital Imaging and Communications in Medicine (DICOM) of a 40-year-old male patient, from a previous study [25] (HRE2018-0087), was selected as the sample case for the 3D printed model due to the presence of multiple lung nodules (31 nodules). The patient had as weight of 64 kg and a height of 170 cm. The CT scan was performed on a 640-slice CT scanner (uCT 960+ CT, United Imaging Healthcare, China) using 120 kVp, 125 mAs and 1.0 mm slice thickness.
The CT dataset was imported into 3D Slicer (Version 5.6.1, Massachusetts, USA) and segmented using manual techniques by harnessing thresholding for the skin, subcutaneous fat, muscle, diaphragm, lung nodules and pulmonary arteries. TotalSegmentator [27], a 3D slicer extension tool, was used to automatically segment the lungs, heart, vessels, trachea, oesophagus, thyroid, bones, stomach, spleen, pancreas, and liver. Furthermore, the lungs, oesophagus and stomach were manually hollowed using SegmentEditorExtraEffects [28]. The 3D volume rendered (VR) model (Figure 1) was then converted into a stereolithography (STL) file. From this, the individual organs were 3D printed using a fused deposition modelling (FDM) printer (Raise 3D N2 Plus, Raise 3D Technologies, USA) and an LCD-based stereolithography (SLA) resin printer (Photon S, AnyCubic, Hong Kong). Printing parameters are listed in Table 1.
2.2. Selection of 3D Printing Materials
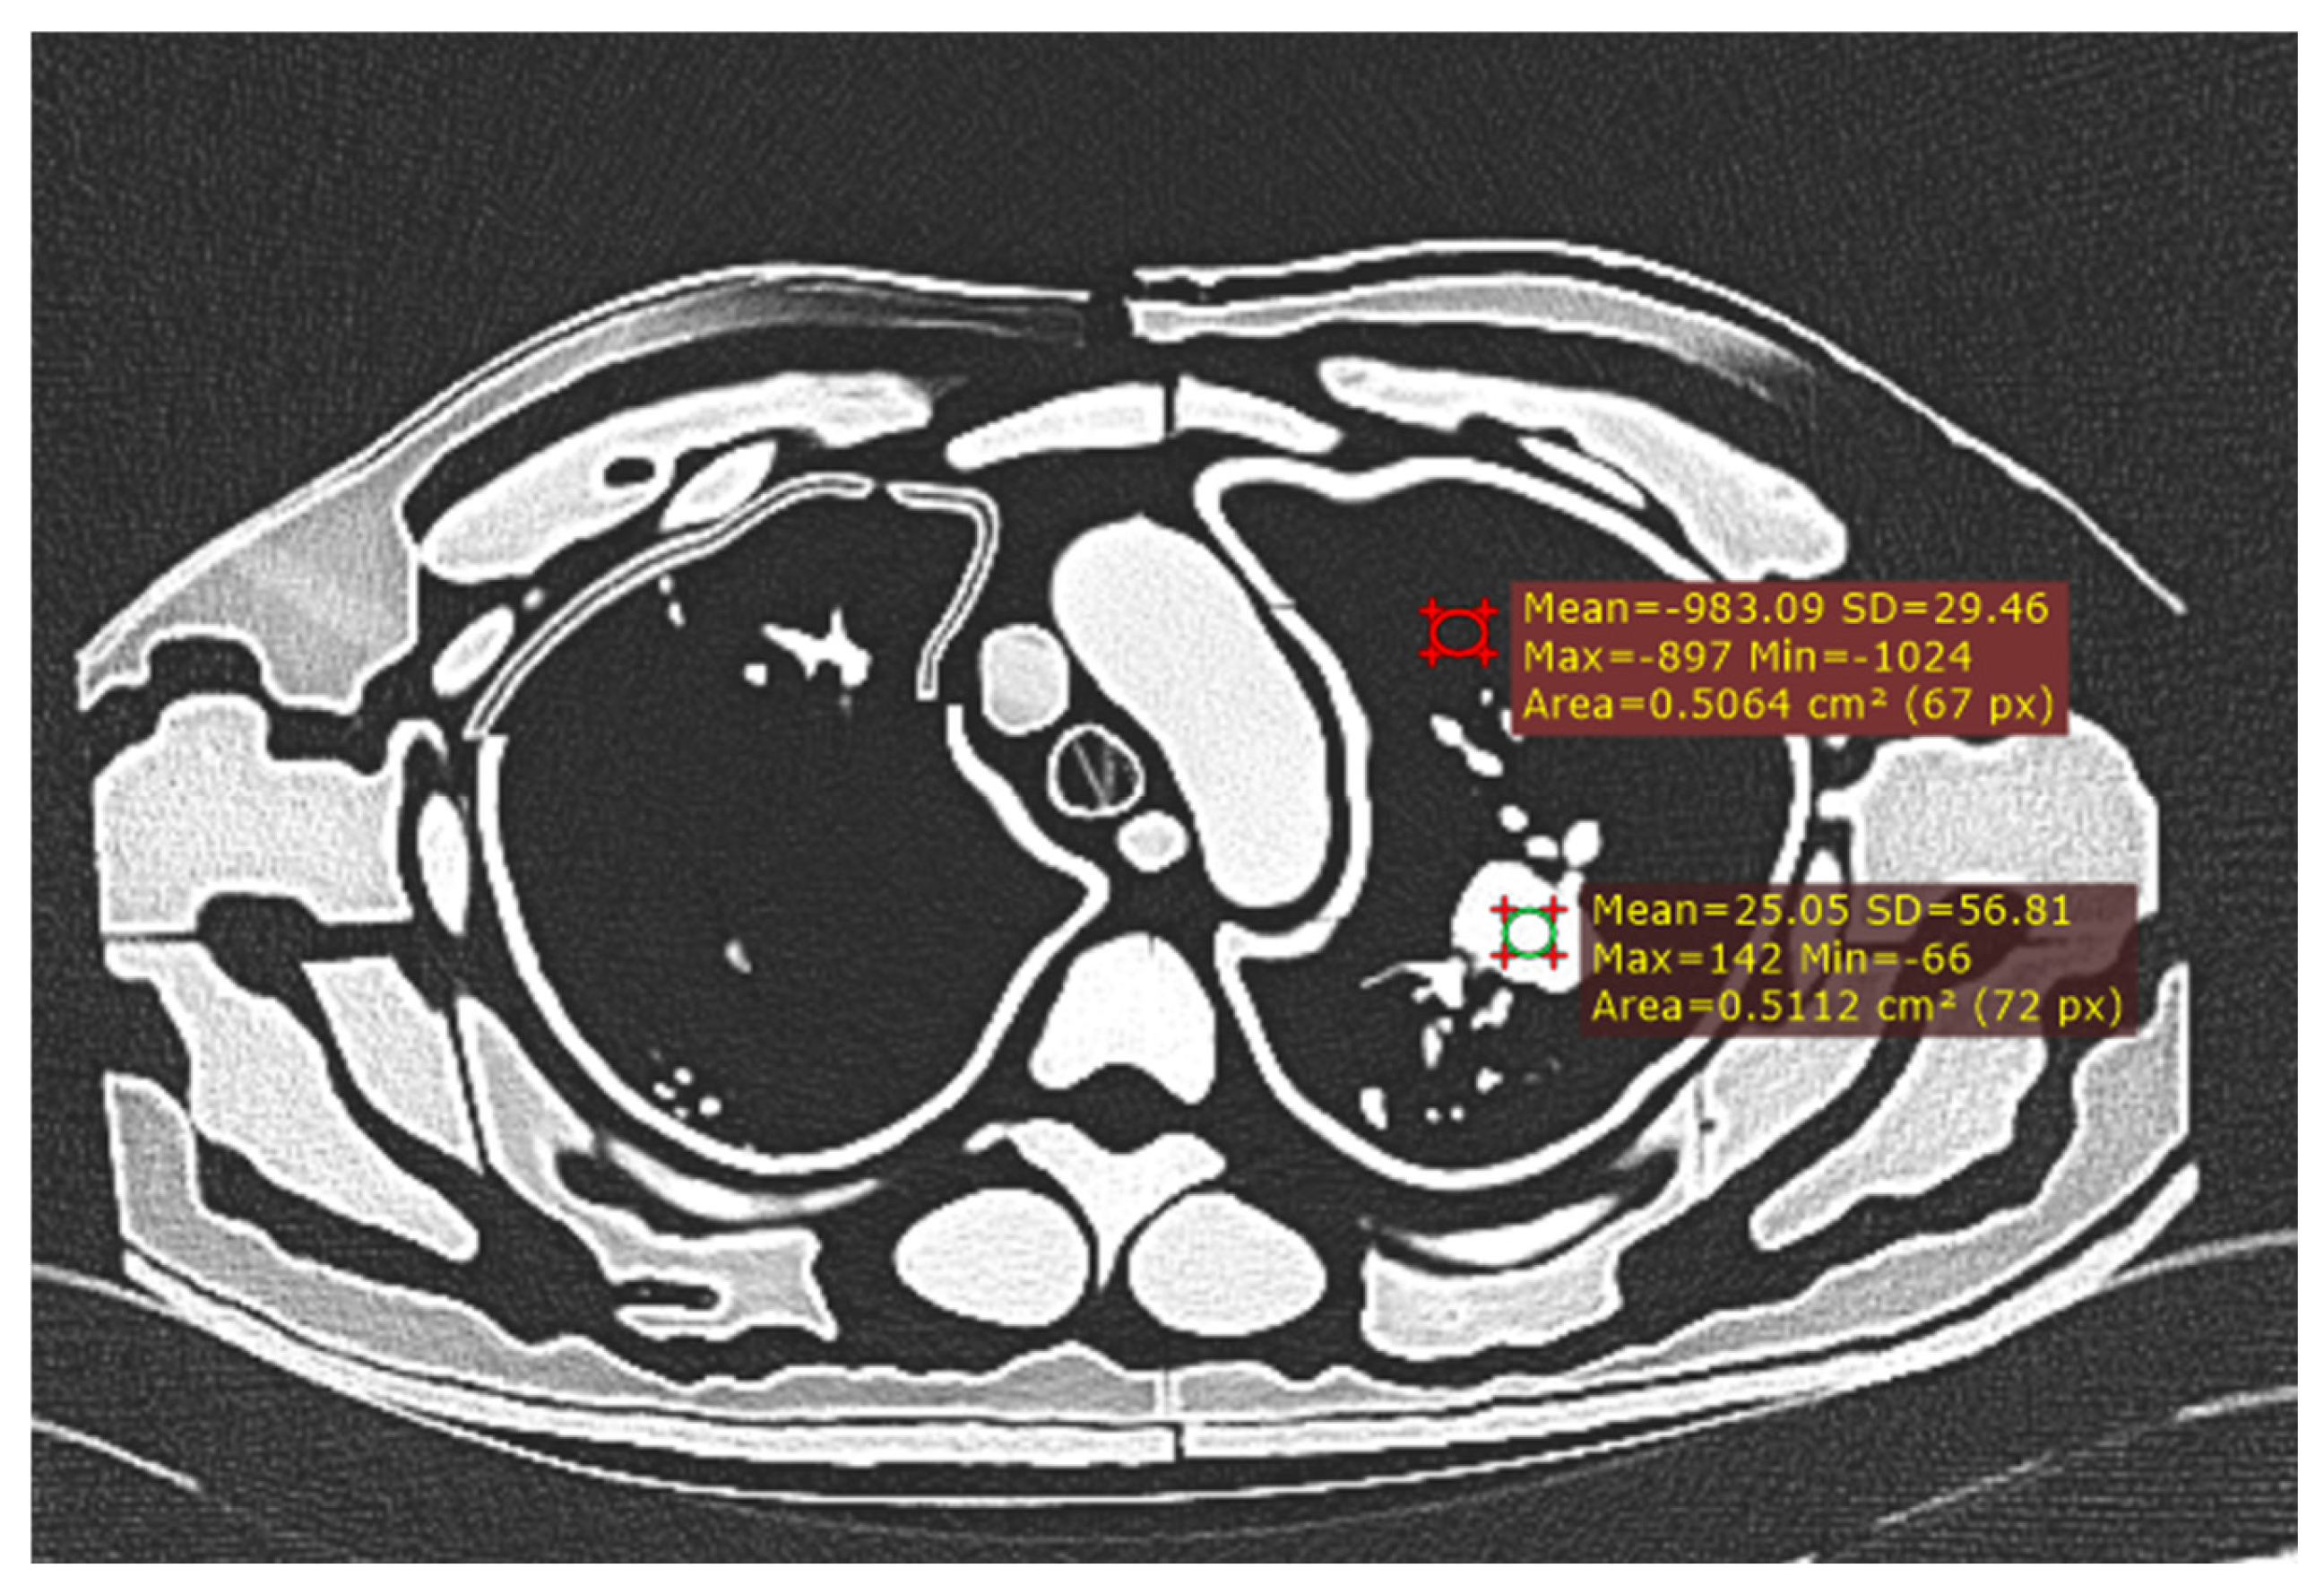
Radiant DICOM Viewer (version 2023.1) was used to calculate the Hounsfield Units (HU) of the patient dataset by drawing a circular region of interest in the centre of each lung nodule and in a selection of all other tissue types as performed previously [29,30] (Supplementary Tables 1 and 2). The selection of 3D printing materials aimed to match the HU of the patient tissue and to be within the expected range of normal tissue.
Preliminary investigations into the attenuating properties of common FDM printing materials; Polylactic acid (PLA) and Acrylonitrile Butadiene Styrene (ABS), was conducted, in order to tailor the material and infill percentages according to the patient’s tissue types. Sample blocks (2 cm3) made of PLA and ABS of varying infill percentages (25%, 50%, 75% and 100%), were scanned using a 128-slice multi-detector CT scanner (SOMATOM Definition, Siemens AG-Healthcare, Germany) with 120 kVp and 50 mAs. The radiodensities (HU) were recorded. A linear relationship was established between infill percentage and HU according to material type (Figure 2). The material and infill percentage required for the different tissues of the patient-specific chest phantom was subsequently determined by linearly interpolating according to the HUs measured from the patient’s CT. Furthermore, Glow-PLA was used to replicate bone [31]. Polyurethane resin (Fabbxible Rubber Like UV photosensitive resin) was used to 3D print the pulmonary vessels due to the superior resolution SLA provides over FDM required for the small pulmonary vessels [32]. Printed parts were assembled manually using all-purpose glue (Tarzan’s Grip General Purpose Super Glue) after manually removing the support materials.

Table 2.
Materials used for printing phantom tissues.
| Model | Material | Infill | Printer Type |
|---|---|---|---|
| Lung nodules, lung, left atrial appendage | PLA | 100% | FDM |
| Pulmonary venous system | PLA | 95% | FDM |
| Skin, deep back muscles, inferior vena cava, aorta, brachiocephalic veins, common carotid arteries, subclavian arteries. | ABS | 100% | FDM |
| Oesophagus, stomach, liver, spleen, thyroid | PLA | 87% | FDM |
| Muscle, pancreas | PLA | 88% | FDM |
| Trachea | PLA | 15% | FDM |
| Heart, diaphragm | ABS | 95% | FDM |
| Brachiocephalic trunk, subcutaneous fat | PLA | 73% | FDM |
| Pulmonary vessels | Polyurethane resin (Fabbxible Rubber Like UV photosensitive resin) | 100% | LCD Resin printer |
| Bone | PLA-Glow | 100% | FDM |
2.3. Scanning Protocols
The 3D-printed phantom was scanned on a 3rd generation dual-source 192-slice CT scanner (SOMATOM Force, Siemens Healthineers, Germany). A standard chest CT protocol was used to acquire high-resolution data as the reference images: 100 kVp, 352 mAs with dose length product 390 mGy.cm [33]. Low-dose and ultra-low-dose CT scans were additionally performed:
Low-dose CT: 100 kVp with 180, 150, 120, 100, 80, 50 and 30 mAs
Ultra-low-dose CT: 80 kVp with 180, 150, 120, 100, 80, 50 and 30 mAs
Scans were acquired with 1.0 mm slice thickness, 0.5 mm reconstruction interval and reconstructed with advanced modelled iterative reconstruction (ADMIRE) algorithm using the kernel 3 strength.
The phantom was also scanned using the same protocols as the original patient (120 kVp, 125 mAs) to measure HU and assess radiation equivalence.
2.4. Qualitative Assessment of Image Quality
Three radiologists (each with more than 5 years of experience in reporting chest CT images) were blinded to the protocols and were presented with the 15 CT scans in randomised order. They independently scored each CT scan for nodule detectability according to a 5-point Likert Scale: 1 = non-diagnostic image quality, strong artifacts, unsuitable for diagnosis. 2 = limited diagnostic confidence, severe blurring creates uncertainty in assessment. 3 = moderate diagnostic confidence: moderate blurring causes restricted assessment. 4 = good diagnostic confidence, slight blurring but evaluation is unrestricted. 5 = excellent diagnostic confidence, clear images, artifact free for a confident diagnosis.
The optimum protocol was determined to be the protocol that delivers the lowest effective dose, given that it achieves a subjective image quality score of at least 3.
2.5. Quantitative Assessment of Image Quality
Signal-to-noise ratio (SNR) and contrast-to-noise ratio (CNR) were calculated for each scan using the following procedures:
Mean HU and noise were measured using Radiant DICOM viewer (version 2023.1) by drawing a circular 0.5 cm2 region of interest (ROI) in the biggest lung nodule. Standard deviation of the measured HU represents the image noise [17].
The mean HU was measured in the biggest nodule compared to the background lung tissue, taking care to avoid surrounding vessels. Image noise was calculated as the standard deviation from a 0.5 cm2 ROI in the lung tissue [34].
Figure 3.
Measurement of CNR with ROI in largest nodule and background lung tissue.
2.6. Radiation Dose
Volume CT Dose Index (CTDIvol) and Dose Length Product (DLP) were recorded from the dose report of each CT scan. Effective dose (ED) was calculated by multiplying DLP with the coefficient k = 0.014 mSv/mGy.cm.
2.7. Statistical Analysis
Accuracy of the phantom’s tissue equivalence was determined by comparing its tissue attenuations (HU) with the attenuations measured in the patient’s CT scan using a statistical software (Jamovi, version 2.3.28) to conduct Student’s unpaired-sample t-tests (with 0.05 as the alpha value). Prior to using Student’s t-test, the Shapiro-Wilk test was conducted to ensure normality of the data and Levine’s test to confirm homogeneity of variances. If either of these tests were violated, the non-parametric equivalent (Mann-Whitney U test) was performed. Results are reported with a 95% confidence interval (CI) and expressed as Mean ± SD (standard deviation) and Median ± IQR (interquartile range) for parametric and non-parametric data, respectively.
The impact of different scan protocols on the SNR and CNR in relation to the effective doses delivered was determined using regression analysis in Excel. Inter-observer agreement between the three radiologists was determined by Fleiss’s Multirater kappa using SPSS Statistics (version 30).
3. Results
Figure 4 and Figure 5 showcase the 3D-printed chest phantom, while Figure 6 presents a comparative CT slice of the phantom alongside that of the patient. Table 3 presents HU measured for each of the printed thoracic tissues compared to those of the patient. The complete phantom weighed 22 kg.
3.1. Radiation Equivalence
Radiation equivalence was achieved for the lung tissue (-987 ± 124 HU), lung nodules (36 ± 53 HU), and diaphragm (-65.7 ± 93.6 HU), with no statistically significant median differences of -116 HU (95% CI [-143, 35.9], p > 0.05) for lung tissue and -4.59 HU (95% CI [-13.5, 19.8], p >0.05) for lung nodules. No significant mean differences were observed for the diaphragm (-111 HU, 95% CI [-232, 9.96], p > 0.05).
However, statistically significant differences in HU between their patient counterparts were measured for bone (-196 HU, p<0.001, 95% CI [-283,-110]), heart (-116 HU, p<0.001, 95% CI [-131, -102]), muscle (-166 HU, p<0.05, 95% CI [114, 196]), airways (77.7 HU, p<0.05, 95% CI [6.44, 149]), large blood vessels (-69.7 HU ± 110, p<0.05, 95% CI [-168, -12.7]), pulmonary vessels (93.9 HU, p<0.001, 95% CI [64.6, 123], skin (-58.5 HU, p<0.05, 95% CI [-95.2, -17] and subcutaneous fat (-176 HU, p<0.05, 95% CI [24.4, 303]). Phantom tissues exhibited on average, lower attenuations and larger variation in their HU compared to corresponding patient tissues (Figure 7).
3.2. CT Protocol Dose Optimisation
A reduction in kVp and mAs led to a corresponding decrease in effective dose (Table 4, Figure 8). The lowest dose protocol (80kVp and 30mAs with resultant 0.23 mSv) delivered a 96% lower effective dose compared to the standard protocol (100 kVp and 352 mAs with 5.8 mSv). However, this reduction was accompanied by a 72% decrease in SNR and a 69% reduction in CNR (Table 4). Additionally, 81% of the reduction in SNR was explained by the decrease in effective dose, with results demonstrating a significantly strong positive linear correlation between SNR and effective dose (r = 0.92, R2 = 0.81, p<0.001) (Figure 9). Likewise, 87% of the reduction in CNR was explained by the reduction in effective dose, with a significantly strong positive linear correlation (r = 0.93, R2 = 0.87, p<0.001) (Figure 10). Regardless of this diminishing objective assessment of image quality, the subjective image quality scores did not differ between these scans, scoring on average 4/5 representing good diagnostic confidence (κ=-0.398 (95% CI, -0.644 to -0152), p < .002) (Table 4).
Mann-Whitney U tests performed for muscle, fat, lung, blood vessels, skin, and lung nodules, with corresponding averages expressed as Medians ± IQR. Student’s t-test performed for pulmonary vessels, airways, heart, diaphragm and bone, corresponding averages expressed as Means ± SD. p<0.05 indicates statistically significant difference between mean or median values, p>0.05 indicates statistically significant radiation equivalence.
4. Discussion
In this study we have developed a 3D-printed chest phantom based on a patient’s CT images with multiple lung nodules for the purpose of optimising low dose CT protocols for lung cancer screening. The main advantage of our study over others is that we printed the comprehensive gamut of thoracic tissues, including skin, muscle, bone, subcutaneous fat, lung, vessels, airway, and nodules [22]. Beyond this, the inclusion of abdominal organs of the liver, spleen, pancreas, and stomach, adds to the complexity and realness of the phantom, whilst providing a replicable tissue environment surrounding the lung nodules for accurate and realistic HU measurements and diagnostic assessment. We evaluated various low- to ultra-low-dose CT protocols ranging from 80-100 kVp with 30-180 mAs to assess the detectability of lung nodules. All scans demonstrated good diagnostic confidence, indicating that ultra-low-dose CT (ULDCT) using 0.23 mSv (80 kVp and 30 mAs) is a viable protocol for lung cancer screening, while delivering the least effective dose (0.23 mSv).
4.1. Phantom Equivalence
The lung tissue, nodules, and diaphragm in this study achieved radiodensities equivalent to those of the patient. Other studies have often struggled to replicate the attenuation properties of air-filled lung tissue in their phantoms due to the challenge of creating a tissue scaffold to support lung structures and for structural integrity [19,22]. However, this study addressed this issue by developing a lung shell containing air and pulmonary vessels, allowing for attenuation values of aerated lung tissue comparable to those of the patient. Despite this advancement, the design limited the flexibility of placing lung nodules within the airspace, as they had to be attached to either the vessels or lung walls. This constraint reduced the replicability of nodule positioning compared to the actual patient anatomy.
In contrast, the skin, subcutaneous fat, muscle, heart, blood vessels and bone had lower radiodensities, with 82%, 157%, 328%, 331%, 237% and 71% differences in HU compared to their patient counterparts, respectively. Whilst the pulmonary vessels and airway achieved 154% and 8% higher relative radiodensities. This represents a maximum HU error of -196 HU. Similarly, Cavalarie et al. [19] 3D printed a chest phantom using PLA at varied infill densities to replicate bone (100% infill), fat (40%), muscle (55% infill), lung (10% infill), vessels (70% infill), and nodules (50-60%), achieving marked differences in attenuations between the patient, with a maximum error of up to 505HU. In contrast, in their chest phantom, Kunnert et al. [43] utilised ABS to accurately replicate adipose tissue, and PLA for muscle (95% infill) and lung (30% infill), with tissue equivalent radiodensities. Villani et al. [44] corroborated these findings, supporting the application of PLA for mimicking water or soft tissue equivalent materials and ABS for lower density tissues such as fat.
A potential reason for such discrepancies is because these materials originate from different manufacturers who may incorporate different ingredients, additives and colours creating products with different properties [45]. Alternatively, this may be due to the methodological error and inaccuracies of the preliminary material investigations and selection of suitable infill percentages. For example, a noted limitation of this study is the assessment of material properties using different CT scanner and exposure parameters to that used in the study itself. Since material attenuation coefficients vary according to energy of the incident beam [44], this may explain the lack of tissue equivalence observed in this study. Moreover, one of the major barriers limiting the applications of 3D printing in medical imaging phantoms is the lack of tissue equivalence of thermoplastic filaments across the full spectrum of CT energies. For example, a material may exhibit tissue equivalence at a specific kVp and mAs but may not at another set of parameters/energies [44]. This may be attributed to the filaments having a lower effective atomic number (Zeff) compared to real soft tissue. As higher Zeff increases photoelectric absorption, the attenuation and HU increases with lower energies, or in the case of soft tissue composed primarily of water, remains constant [46]. However, the lower Zeff of thermoplastic materials causes the opposite effect, such that reduced kVp leads to reduced HU [47]. Thus, future investigations should aim to keep the scanner and parameters consistent within their studies. Moreover, a larger variety of thermoplastic filaments with different higher atomic additives or more similar molecular composition, need also be researched to better mimic the energy dependence of tissue attenuations [47,48,49].
Furthermore, simple block materials may present with different attenuations due to lack of external attenuating material as would normally surround anatomy within the human body. Thus, photons incident on the sample blocks likely exhibit different X-ray energies due to reduced beam hardening and attenuation that would occur from the beam interacting with surrounding tissue. Future studies are encouraged to improve this methodology by incorporating the sample blocks into simulating tissue environment such as a water bath, for example, which may deliver more reliable and transferrable HU measurements [47]. Additionally, thickness of a material influences the attenuation of a beam [50], however the sample blocks did not have the same size and thickness of the tissues it represents. Thus, sample material thickness should additionally be controlled for improved selection of tissue equivalent materials.
Manipulating infill percentages is a useful method that researchers employ to control HU in FDM printing due to the linear relationship between infill percentage and HU (Figure 2) [45,51]. However, this method has been criticised for creating unrealistic texture materials with microscopic or macroscopic voids that leads to high deviations in attenuations, which may underlie the variations in HU reported for the same 3D printing filaments between publications [47]. Consequently, the air gaps present may contribute to the low Hounsfield Units achieved for some of the tissues measured in this study and the large variations of HU relative to the patient (Figure 7) [48]. Modifying infill percentages also creates solid shell artifacts visible at boundaries of materials [50], which possibly enhanced contrast and visibility of the lung nodules in this study (Figure 6).
The struggle to replicate the high attenuations of bone is well reported throughout the literature [22]. Although this study employed Glow-PLA to replicate bone, similar to Laidlow et al.’s [31] phantom experiment, the HU was too low at 77HU, compared to in their study. This can be attributed to the lower infill percentage used. Alternatively, higher density additives such as PLA doped with 50% iron (Fe-PLA) [52] or granite-PLA [44] has shown to produce HU in the higher ranges (~700–2000 HU), due to the increased occurrence of the photo-electric effect [53].
4.2. Optimising CT Protocols for Lung Nodule Detection
This study reveals that a low dose CT protocol of 80 kVp, 30 mAs with ADMIRE 3 (0.23 mSv effective dose), is a potentially viable option for good diagnostic ability of lung nodules on CT scans. These findings are in agreement with Leitão et al.’s study that concluded that 80 kVp, 30 mAs (0.072 mSv) provides sufficient diagnostic capability for detection of lung nodules in an Alderson Rando phantom [13]. However, our study provides more weight to these findings due to the incorporation of pulmonary vessels that are absent from commercial phantoms. Nevertheless, the relatively high contrast of nodules to lung background is still considered a limitation of this study due to the inability to reproduce the smaller peripheral lung vessels (Figure 6). Thus, there appears less “anatomical noise” within the constructed phantom compared to the patient. The small branched peripheral vessels were not able to be printed due to limitations of the resin material. The flexible and flimsy material could not withstand the pressures of the printing process and forces involved from removing the support material. Future studies can use more robust material or alternatively, use traditional moulding techniques to create the lung vessels.
Despite the increase in SNR and CNR associated with the reduced effective dose (Figure 9 and Figure 10), this did not affect the subjective visual perception of lung nodules by the radiologists. This affirms the ability and responsibility of radiographers to reduce radiation exposures in order to limit dose to patients, regardless of degradation to image quality, as long as the diagnostic capacity is maintained [54]. Lowering radiation dose is feasible for lung cancer screening due to the high intrinsic contrast between air and pulmonary structures [15]. Iranmakani et al. [55] suggests that clinicians may be hesitant to reduce exposure parameters to ultra-low levels, despite feasibility of producing acceptable image quality with such low radiation levels. Future studies should explore further reductions in kVp and mAs to establish the threshold where noise begins to interfere with diagnostic ability.
Our findings suggest that it is feasible to achieve accurate lung nodule detection using radiation doses lower than those currently applied in national lung cancer screening programs [56]. For instance, the American National Lung Cancer Screening Program uses 120-140 kVp with 40-80 mAs, delivering approximately 1.5 mSv per scan. [57], which is 85% higher than the dose proposed in this phantom study. As Australia plans to implement its own lung cancer screening program in 2025 [58], these results, along with similar research, could provide valuable guidance in selecting optimal CT protocols for lung nodule detection.
This study has several limitations. First, the alveoli and lung parenchyma were not replicated. Currently, no material exists in the literature that can accurately mimic the delicate structure of lung parenchyma whilst maintaining low HU for aerated lung [22]. Secondly, large air gaps were present between phantom tissue layers, resulting from poor adhesion of the superglue. However, replicating the extensive connective tissue network that binds human tissues at the cellular level would be a significant challenge. Additionally, discrepancies in the size of printed anatomical parts were evident. For instance, the ribs were too short to connect to adjacent structures, and the skin was undersized, leaving large gaps between sections. These issues stem from the inherent limitations of FDM printing, such as material shrinkage and warping after cooling [22]. To address these shortcomings, future studies could explore printing with more flexible materials, allowing for better moulding to the anatomy.
Another challenge was the labour-intensive manual removal of support materials and assembly of individual parts, which may have introduced slight positional variations that accumulated during each attachment. Printing larger anatomical components in a single print may help reduce these inconsistencies. However, in certain instances, dividing the printed objects into smaller constituents is necessary in order to integrate different tissues together. For example, the scapulae were excluded from the phantom due to difficulties inserting their complicated shapes within the surrounding muscle layers. Had they been printed in multiple parts, compilation with the muscle layer may have been possible. Alternatively, multi-nozzle, multi-material printers can integrate heterogeneous material layers in a single print, albeit at a significant cost [59]. Furthermore, we acknowledge the limited external validity of the proposed optimum protocols, as they are primarily applicable to patients with similar body weight and habitus to the one used in developing the phantom. Finally, as a phantom-based study, this model could not replicate the intricate complexities of a living human subject. For example, the functional dynamics of a beating heart or the respiratory motion of the diaphragm and lungs were not simulated. In a clinical setting, motion blur from such physiological activities can reduce detection capabilities, particularly in low-dose protocols for nodule detection [31]. Future research would benefit from incorporating these physiological movements to mirror real-life clinical scenarios more closely.
5. Conclusions
A morphologically realistic chest phantom, incorporating a comprehensive range of thoracic tissue types, was developed using FDM and SLA 3D printing technologies. While most thoracic tissues did not achieve radiation attenuation equivalence to the patient, the lungs and lung nodules closely matched. An ULDCT protocol of 80 kVp and 30 mAs (0.23 mSv) was identified as optimal, showing the potential to reduce patient radiation exposure while maintaining effective lung nodule detection for lung cancer screening.
Supplementary Materials
The following supporting information can be downloaded at the website of this paper posted on Preprints.org.
Author Contributions
Data acquisition, data analysis, manuscript draft and editing (J.S)., CT image processing segmentation, and phantom assembly (S.T)., Preliminary material testing, calculations and determination of selected materials, printing 3D model parts (Y.H)., Project coordination and supervision (C.Y),. Project supervision, conceptualization, review, and editing ( Z.S). All authors have read and agreed to the published version of the manuscript.
Funding
This research received no external funding.
Institutional Review Board Statement
The study was conducted in accordance with the Declaration of Helsinki, and approved by the Institutional Review Board (or Ethics Committee) of Curtin Human Research Ethics (HRE) Committee, Australia (approval number: HRE2024-0391, 16-Jul-2024).
Informed Consent Statement
Not applicable due to phantom experiments.
Data Availability Statement
Data is not available due to ethics restrictions.
Acknowledgments
We would like to thank Tom Tiang for assisting with CT scanning phantom. Rebecca Imrie for assisting with preliminary CT scanning of lung nodules, Ashu Gupta and Flip Otto and Menge Kuria for assisting assessment of nodule detectability (subjective image analysis). We also thank Sharon Chen for providing statistical analysis.
Conflicts of Interest
The authors declare no conflicts of interest.
References
- International Agency for Research on Cancer. Global Cancer Observatory. Available online: https://gco.iarc.who.int/media/globocan/factsheets/cancers/39-all-cancers-fact-sheet.pdf (accessed on 9 October 2024).
- de Koning, H.J.; van der Aalst, C.M.; de Jong, P.A.; Scholten, E.T.; Nackaerts, K.; Heuvelmans, M.A.; Lammers, J.-W.J.; Weenink, C.; Yousaf-Khan, U.; Horeweg, N.; et al. Reduced Lung-Cancer Mortality with Volume CT Screening in a Randomized Trial. N. Engl. J. Med. 2020, 382, 503-513. [CrossRef]
- National Lung Screening Trial Research Team. The national lung screening trial: overview and study design. Radiology. 2011, 258, 243-253. [CrossRef]
- National Lung Screening Trial Research Team. Lung Cancer Incidence and Mortality with Extended Follow-up in the National Lung Screening Trial. J. Thorac. Oncol. 2019, 14, 1732-1742. [CrossRef]
- Burgard, C.A.; Gaass, T.; Bonert, M.; Bondesson, D.; Thaens, N.; Reiser, M.F.; Dinkel, J. Detection of artificial pulmonary lung nodules in ultralow-dose CT using an ex vivo lung phantom. PLoS One. 2018, 13. [CrossRef]
- Bach, P.B.; Mirkin, J.N.; Oliver, T.K.; Azzoli, C.G.; Berry, D.A.; Brawley, O.W.; Byers, T.; Colditz, G.A.; Gould, M.K.; Jett, J.R.; et al. Benefits and Harms of CT Screening for Lung Cancer: A Systematic Review. JAMA. 2012, 307, 2418-2429. [CrossRef]
- Hsieh, J.; Flohr, T. Computed tomography recent history and future perspectives. J. Med. Imaging (Bellingham). 2021, 8, 052109. [CrossRef]
- Miller, A.R.; Jackson, D.; Hui, C.; Deshpande, S.; Kuo, E.; Hamilton, G.S.; Lau, K.K. Lung nodules are reliably detectable on ultra-low-dose CT utilising model-based iterative reconstruction with radiation equivalent to plain radiography. Clin. Radiol. 2019, 74, 409.e417-409.e422. [CrossRef]
- Christe, A.; Leidolt, L.; Huber, A.; Steiger, P.; Szucs-Farkas, Z.; Roos, J.E.; Heverhagen, J.T.; Ebner, L. Lung cancer screening with CT: Evaluation of radiologists and different computer assisted detection software (CAD) as first and second readers for lung nodule detection at different dose levels. Eur. J. Radiol. 2013, 82, e873-e878. [CrossRef]
- Gordic, S.; Morsbach, F.; Schmidt, B.; Allmendinger, T.; Flohr, T.; Husarik, D.; Baumueller, S.; Raupach, R.; Stolzmann, P.; Leschka, S.; et al. Ultralow-Dose Chest Computed Tomography for Pulmonary Nodule Detection: First Performance Evaluation of Single Energy Scanning With Spectral Shaping. Invest. Radiol. 2014, 49, 465-473. [CrossRef]
- Huber, A.; Landau, J.; Ebner, L.; Bütikofer, Y.; Leidolt, L.; Brela, B.; May, M.; Heverhagen, J.; Christe, A. Performance of ultralow-dose CT with iterative reconstruction in lung cancer screening: limiting radiation exposure to the equivalent of conventional chest X-ray imaging. Eur. Radiol. 2016, 26, 3643-3652. [CrossRef]
- Jungblut, L.; Blüthgen, C.; Polacin, M.; Messerli, M.; Schmidt, B.; Euler, A.; Alkadhi, H.; Frauenfelder, T.; Martini, K. First Performance Evaluation of an Artificial Intelligence-Based Computer-Aided Detection System for Pulmonary Nodule Evaluation in Dual-Source Photon-Counting Detector CT at Different Low-Dose Levels. Invest. Radiol. 2022, 57, 108-114. [CrossRef]
- Leitão, C.A.; Salvador, G.L.d.O.; Tazoniero, P.; Warszawiak, D.; Saievicz, C.; Jakubiak, R.R.; Escuissato, D.L. Dosimetry and comparison between different CT protocols (low dose, ultralow dose, and conventional CT) for lung nodules’ detection in a phantom. Radiol. Res. Pract. 2021, 2021. [CrossRef]
- Martini, K.; Higashigaito, K.; Barth, B.K.; Baumueller, S.; Alkadhi, H.; Frauenfelder, T. Ultralow-dose CT with tin filtration for detection of solid and sub solid pulmonary nodules: A phantom study. Br. J. Radiol. 2015, 88, 20150389-20150389. [CrossRef]
- Milanese, G.; Silva, M.; Frauenfelder, T.; Eberhard, M.; Sabia, F.; Martini, C.; Marchianò, A.; Prokop, M.; Sverzellati, N.; Pastorino, U. Comparison of ultra-low dose chest CT scanning protocols for the detection of pulmonary nodules: a phantom study. Tumori. 2019, 105, 394-403. [CrossRef]
- Wielpütz, M.O.; Wroblewski, J.; Lederlin, M.; Dinkel, J.; Eichinger, M.; Koenigkam-Santos, M.; Biederer, J.; Kauczor, H.-U.; Puderbach, M.U.; Jobst, B.J. Computer-aided detection of artificial pulmonary nodules using an ex vivo lung phantom: Influence of exposure parameters and iterative reconstruction. Eur. J. Radiol. 2015, 84, 1005-1011. [CrossRef]
- Kerpel, A.; Marom, E.M.; Green, M.; Eifer, M.; Konen, E.; Mayer, A.; Betancourt Cuellar, S.L. Ultra-low dose chest CT with denoising for lung nodule detection. Isr. Med. Assoc. J. 2021, 23, 550-555.
- Messerli, M.; Kluckert, T.; Knitel, M.; Wälti, S.; Desbiolles, L.; Rengier, F.; Warschkow, R.; Bauer, R.W.; Alkadhi, H.; Leschka, S.; et al. Ultralow dose CT for pulmonary nodule detection with chest x-ray equivalent dose—a prospective intra-individual comparative study. Eur. Radiol. 2017, 27, 3290-3299. [CrossRef]
- Cavaliere, C.; Baldi, D.; Brancato, V.; Aiello, M.; Salvatore, M. A customized anthropomorphic 3D-printed phantom to reproducibility assessment in computed tomography: an oncological case study. Front. Oncol. 2023, 13, 1123796. [CrossRef]
- Koyotokagaku. Product Data: Multipurpose Chest Phantom N1 “LUNGMAN”. Available online: https://www.kyotokagaku.com/en/products_data/ph-1_01/ (accessed on 2nd July 2024).
- Sun, Z.; Wong, Y.H.; Yeong, C.H. Patient-Specific 3D-Printed Low-Cost Models in Medical Education and Clinical Practice. Micromachines. 2023, 14. [CrossRef]
- Silberstein, J.; Sun, Z. Advances and Applications of Three-Dimensional-Printed Patient-Specific Chest Phantoms in Radiology: A Systematic Review. Appl. Sci. 2024, 14, 5467.
- Hong, D.; Moon, S.; Seo, J.B.; Kim, N. Development of a patient-specific chest computed tomography imaging phantom with realistic lung lesions using silicone casting and three-dimensional printing. Sci. Rep. 2023, 13, 3941. [CrossRef]
- Aldosari, S.; Jansen, S.; Sun, Z. Patient-specific 3D printed pulmonary artery model with simulation of peripheral pulmonary embolism for developing optimal computed tomography pulmonary angiography protocols. Quant. Imaging. Med. Surg. 2019, 9, 75-85. [CrossRef]
- Wu, C.A.; Squelch, A.; Sun, Z. Investigation of three-dimensional printing materials for printing aorta model replicating type B aortic dissection. Curr. Med. Imaging. 2021, 17, 843-849. [CrossRef]
- Wu, C.A.; Squelch, A.; Jansen, S.; Sun, Z. Optimization of computed tomography angiography protocols for follow-up type b aortic dissection patients by using 3d printed model. Appl. Sci. 2021, 11, 6844. [CrossRef]
- Wasserthal J., Manfred M., Hanns-Christian Breit H.C., Cyriac J., Shan Y., Segeroth, M. TotalSegmentator: robust segmentation of 104 anatomical structures in CT images version 2.3.0. Available online: https://arxiv.org/abs/2208.05868 (accessed on 25 August 2024).
- Lasso, A.; MacNeil, K.; Fedorov, A. SegmentEditorExtraEffects. Last Updated 20/7/2024. Available online: https://github.com/lassoan/SlicerSegmentEditorExtraEffects.git (accessed on 25 August 2024).
- Okkalidis, N. A novel 3D printing method for accurate anatomy replication in patient-specific phantoms. Med .Phys. 2018, 45, 4600-4606. [CrossRef]
- Yang, S.; Kim, J.; Choi, S.J.; Lee, K.W. Determining Average Linear Dimension and Volume of Korean Lungs for Lung Phantom Construction. Health. Phys. 2021, 120, 487-494. [CrossRef]
- Laidlaw, J.; Earl, N.; Shavdia, N.; Davis, R.; Mayer, S.; Karaman, D.; Richtsmeier, D.; Rodesch, P.A.; Bazalova-Carter, M. Design and CT imaging of casper, an anthropomorphic breathing thorax phantom. Biomed. Phys. Eng. Express. 2023, 9. [CrossRef]
- Joo, H.; Cho, S. Comparative Studies on Polyurethane Composites Filled with Polyaniline and Graphene for DLP-Type 3D Printing. Polymers. 2020, 12, 67. [CrossRef]
- ARPANSA. Current Australian national diagnostic reference levels for multi detector computed tomography. Available online: https://www.arpansa.gov.au/research-and-expertise/surveys/national-diagnostic-reference-level-service/current-australian-drls/mdct (accessed on 21 September 2024).
- Symons, R.; Pourmorteza, A.; Sandfort, V.; Ahlman, M.A.; Cropper, T.; Mallek, M.; Kappler, S.; Ulzheimer, S.; Mahesh, M.; Jones, E.C.; et al. Feasibility of Dose-reduced Chest CT with Photon-counting Detectors: Initial Results in Humans. Radiology. 2017, 285, 980-989. [CrossRef]
- Chougule, V.; Mulay, A.; Ahuja, B. Clinical Case Study: Spine Modeling for Minimum Invasive Spine Surgeries (MISS) using Rapid Prototyping. In Proceedings of 10th International Conference on Precision, Meso, Micro and Nano Engineering (COPEN 10), Indian Institute of Technology Madras, India, 7-9 December 2017.
- Hariyanto, A.; Christianti, K.; Rubiyanto, A.; Nasori, N.; Haekal, M.; Endarko, E. The Effect of Pattern and Infill Percentage in 3D Printer for Phantom Radiation Applications. Jurnal ILMU DASAR 2022, 23, 87. [CrossRef]
- Amini, I.; Akhlaghi, P. Evaluation of CT calibration curves from stoichiometric and tissue substitute methods according to tissue characteristics. Radioprotection. 2019, 54, 117-123. [CrossRef]
- Washko, G.R.; Dransfield, M.T.; Estépar, R.S.; Diaz, A.; Matsuoka, S.; Yamashiro, T.; Hatabu, H.; Silverman, E.K.; Bailey, W.C.; Reilly, J.J. Airway wall attenuation: a biomarker of airway disease in subjects with COPD. J. Appl. Physiol (1985). 2009, 107, 185-191. [CrossRef]
- Jung, H. Basic Physical Principles and Clinical Applications of Computed Tomography. Prog. Med. Phys. 2021, 32, 1-17. [CrossRef]
- Abadi, E.; Sanders, J.; Samei, E. Patient-specific quantification of image quality: An automated technique for measuring the distribution of organ Hounsfield units in clinical chest CT images. Med. Phys. 2017, 44, 4736-4746. [CrossRef]
- Donovan, A.A.; Johnston, G.; Moore, M.; Jensen, D.; Benedetti, A.; Coxson, H.O.; Gottfried, S.B.; Petrof, B.J.; Bourbeau, J.; Smith, B.M. Diaphragm morphology assessed by computed tomography in chronic obstructive pulmonary disease. Ann. Am. Thorac. Soc. 2021, 18, 955-962.
- Swensen, S.J.; Viggiano, R.W.; Weaver, A.L.; Midthun, D.E.; MÜLler, N.L.; Sherrick, A.; Yamashita, K.; Naidich, D.P.; Patz, E.F.; Hartman, T.E.; et al. Lung nodule enhancement at CT: Multicenter study. Radiology. 2000, 214, 73-80. [CrossRef]
- Kunert, P.; Schlattl, H.; Trinkl, S.; Giussani, A.; Klein, L.; Janich, M.; Reichert, D.; Brix, G. Reproduction of a conventional anthropomorphic female chest phantom by 3D-printing: Comparison of image contrasts and absorbed doses in CT. Med. Phys. 2023, 50, 4734-4743. [CrossRef]
- Villani, D.; Rodrigues, O.; Campos, L.L. Dosimetric characterization of 3D printed phantoms at different infill percentages for diagnostic X-ray energy range. Radiat Phys Chem Oxf Engl 1993 2020, 172, 108728. [CrossRef]
- Savi, M.; Andrade, M.A.B.; Potiens, M.P.A. Commercial filament testing for use in 3D printed phantoms. Radiat. Phys. Chem. Oxf. Engl. 1993 2020, 174, 108906. [CrossRef]
- Omoumi, P.; Becce, F.; Racine, D.; Ott, J.; Andreisek, G.; Verdun, F. Dual-Energy CT: Basic Principles, Technical Approaches, and Applications in Musculoskeletal Imaging (Part 1). Semin. Musculoskelet. Radiol. 2015, 19. [CrossRef]
- Ma, X.; Buschmann, M.; Unger, E.; Homolka, P. Classification of X-ray attenuation properties of additive manufacturing and 3D printing materials using computed tomography from 70 to 140 kVp. Front. Bioeng. Biotechnol. 2021, 9, 763960. [CrossRef]
- Ahmed, A.M.; Buschmann, M.; Breyer, L.; Kuntner, C.; Homolka, P. Tailoring the Mass Density of 3D Printing Materials for Accurate X-ray Imaging Simulation by Controlled Underfilling for Radiographic Phantoms. Polymers. 2024, 16. [CrossRef]
- Tong, H.; Pegues, H.; Samei, E.; Lo, J.Y.; Wiley, B.J. Controlling the attenuation of 3D-printed physical phantoms for computed tomography with a single material. Med. Phys. 2022, 49, 2582-2589. [CrossRef]
- Kanno, I.; Yamashita, Y.; Kimura, M.; Inoue, F. Effective atomic number measurement with energy-resolved X-ray computed tomography. Nucl. Instrum. Methods. Phys. Res. A. 2015, 787, 121-124. [CrossRef]
- Hong, D.; Lee, S.; Kim, G.B.; Lee, S.M.; Kim, N.; Seo, J.B. Development of a CT imaging phantom of anthromorphic lung using fused deposition modeling 3D printing. Medicine (Baltimore). 2020, 99, e18617. [CrossRef]
- Mille, M.M.; Griffin, K.T.; Maass-Moreno, R.; Lee, C. Fabrication of a pediatric torso phantom with multiple tissues represented using a dual nozzle thermoplastic 3D printer. J. Appl. Clin. Med. Phys. 2020, 21, 226-236. [CrossRef]
- Madison, K.; Weygand, J.; Andreozzi, J.M.; Hunt, D.; Perez, B.A.; Graham, J.A.; Gage, R. Methodology for computed tomography characterization of commercially available 3D printing materials for use in radiology/radiation oncology. J. Appl. Clin. Med. Phys. 2023, 24. [CrossRef]
- Tompe, A.; Sargar, K. X-Ray Image Quality Assurance; StatPearls Publishing, Treasure Island Florida, USA, 2022. https://www.ncbi.nlm.nih.gov/books/NBK564362/.
- Iranmakani, S.; Jahanshahi, A.R.; Mehnati, P.; Mortezazadeh, T.; Khezerloo, D. Image Quality and Pulmonary Nodule Detectability at Low-dose Computed Tomography (low kVp and mAs): A phantom study. J. Med. Signals. Sens. 2022, 12. [CrossRef]
- Vonder, M.; Dorrius, M.D.; Vliegenthart, R. Latest CT technologies in lung cancer screening: protocols and radiation dose reduction. Transl. Lung. Cancer. Res. 2021, 10, 1154-1164. [CrossRef]
- Aberle, D.R.; Berg, C.D.; Black, W.C.; Church, T.R.; Fagerstrom, R.M.; Galen, B.; Gareen, I.F.; Gatsonis, C.; Goldin, J.; Gohagan, J.K.; et al. The National Lung Screening Trial: overview and study design. Radiology. 2011, 258, 243-253. [CrossRef]
- Australian Government. National Lung Cancer Screening Program. Available online: https://www.health.gov.au/our-work/nlcsp (accessed on 7 October 2024).
- Zhu, C.; Gemeda, H.B.; Duoss, E.B.; Spadaccini, C.M. Toward Multiscale, Multimaterial 3D Printing. Advanced Materials 2024, 2314204. [CrossRef]
Figure 1.
3D Volume-rendered model created by segmenting the patient’s CT images using 3D Slicer. Front view (A) and side view (B) of the model with skin, subcutaneous fat, muscle, and thoracic bones removed. C: Lungs removed to display the lung vessels and lung nodules. D: front view of the outer skin layer.
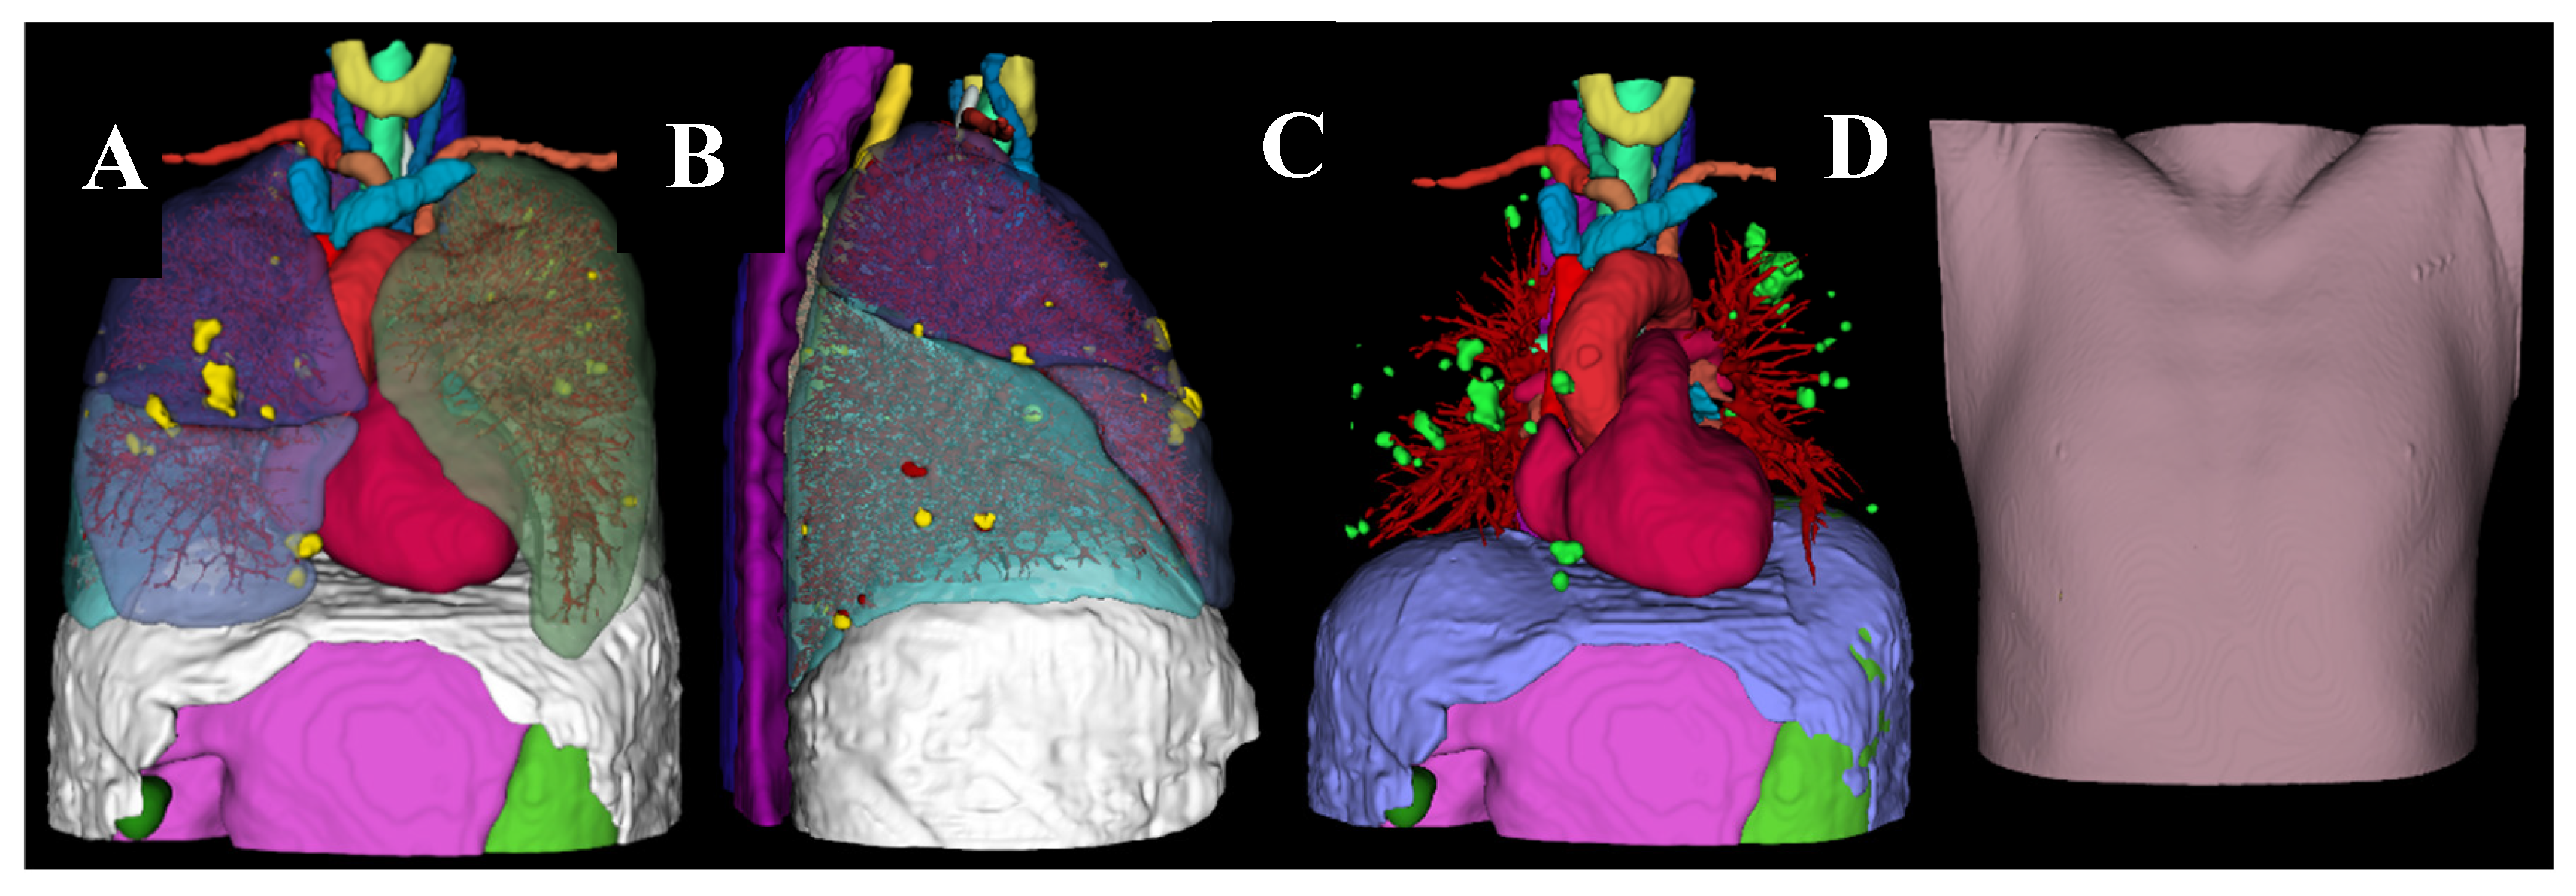
Figure 2.
Radiodensities of ABS and PLA materials at different infill percentages.
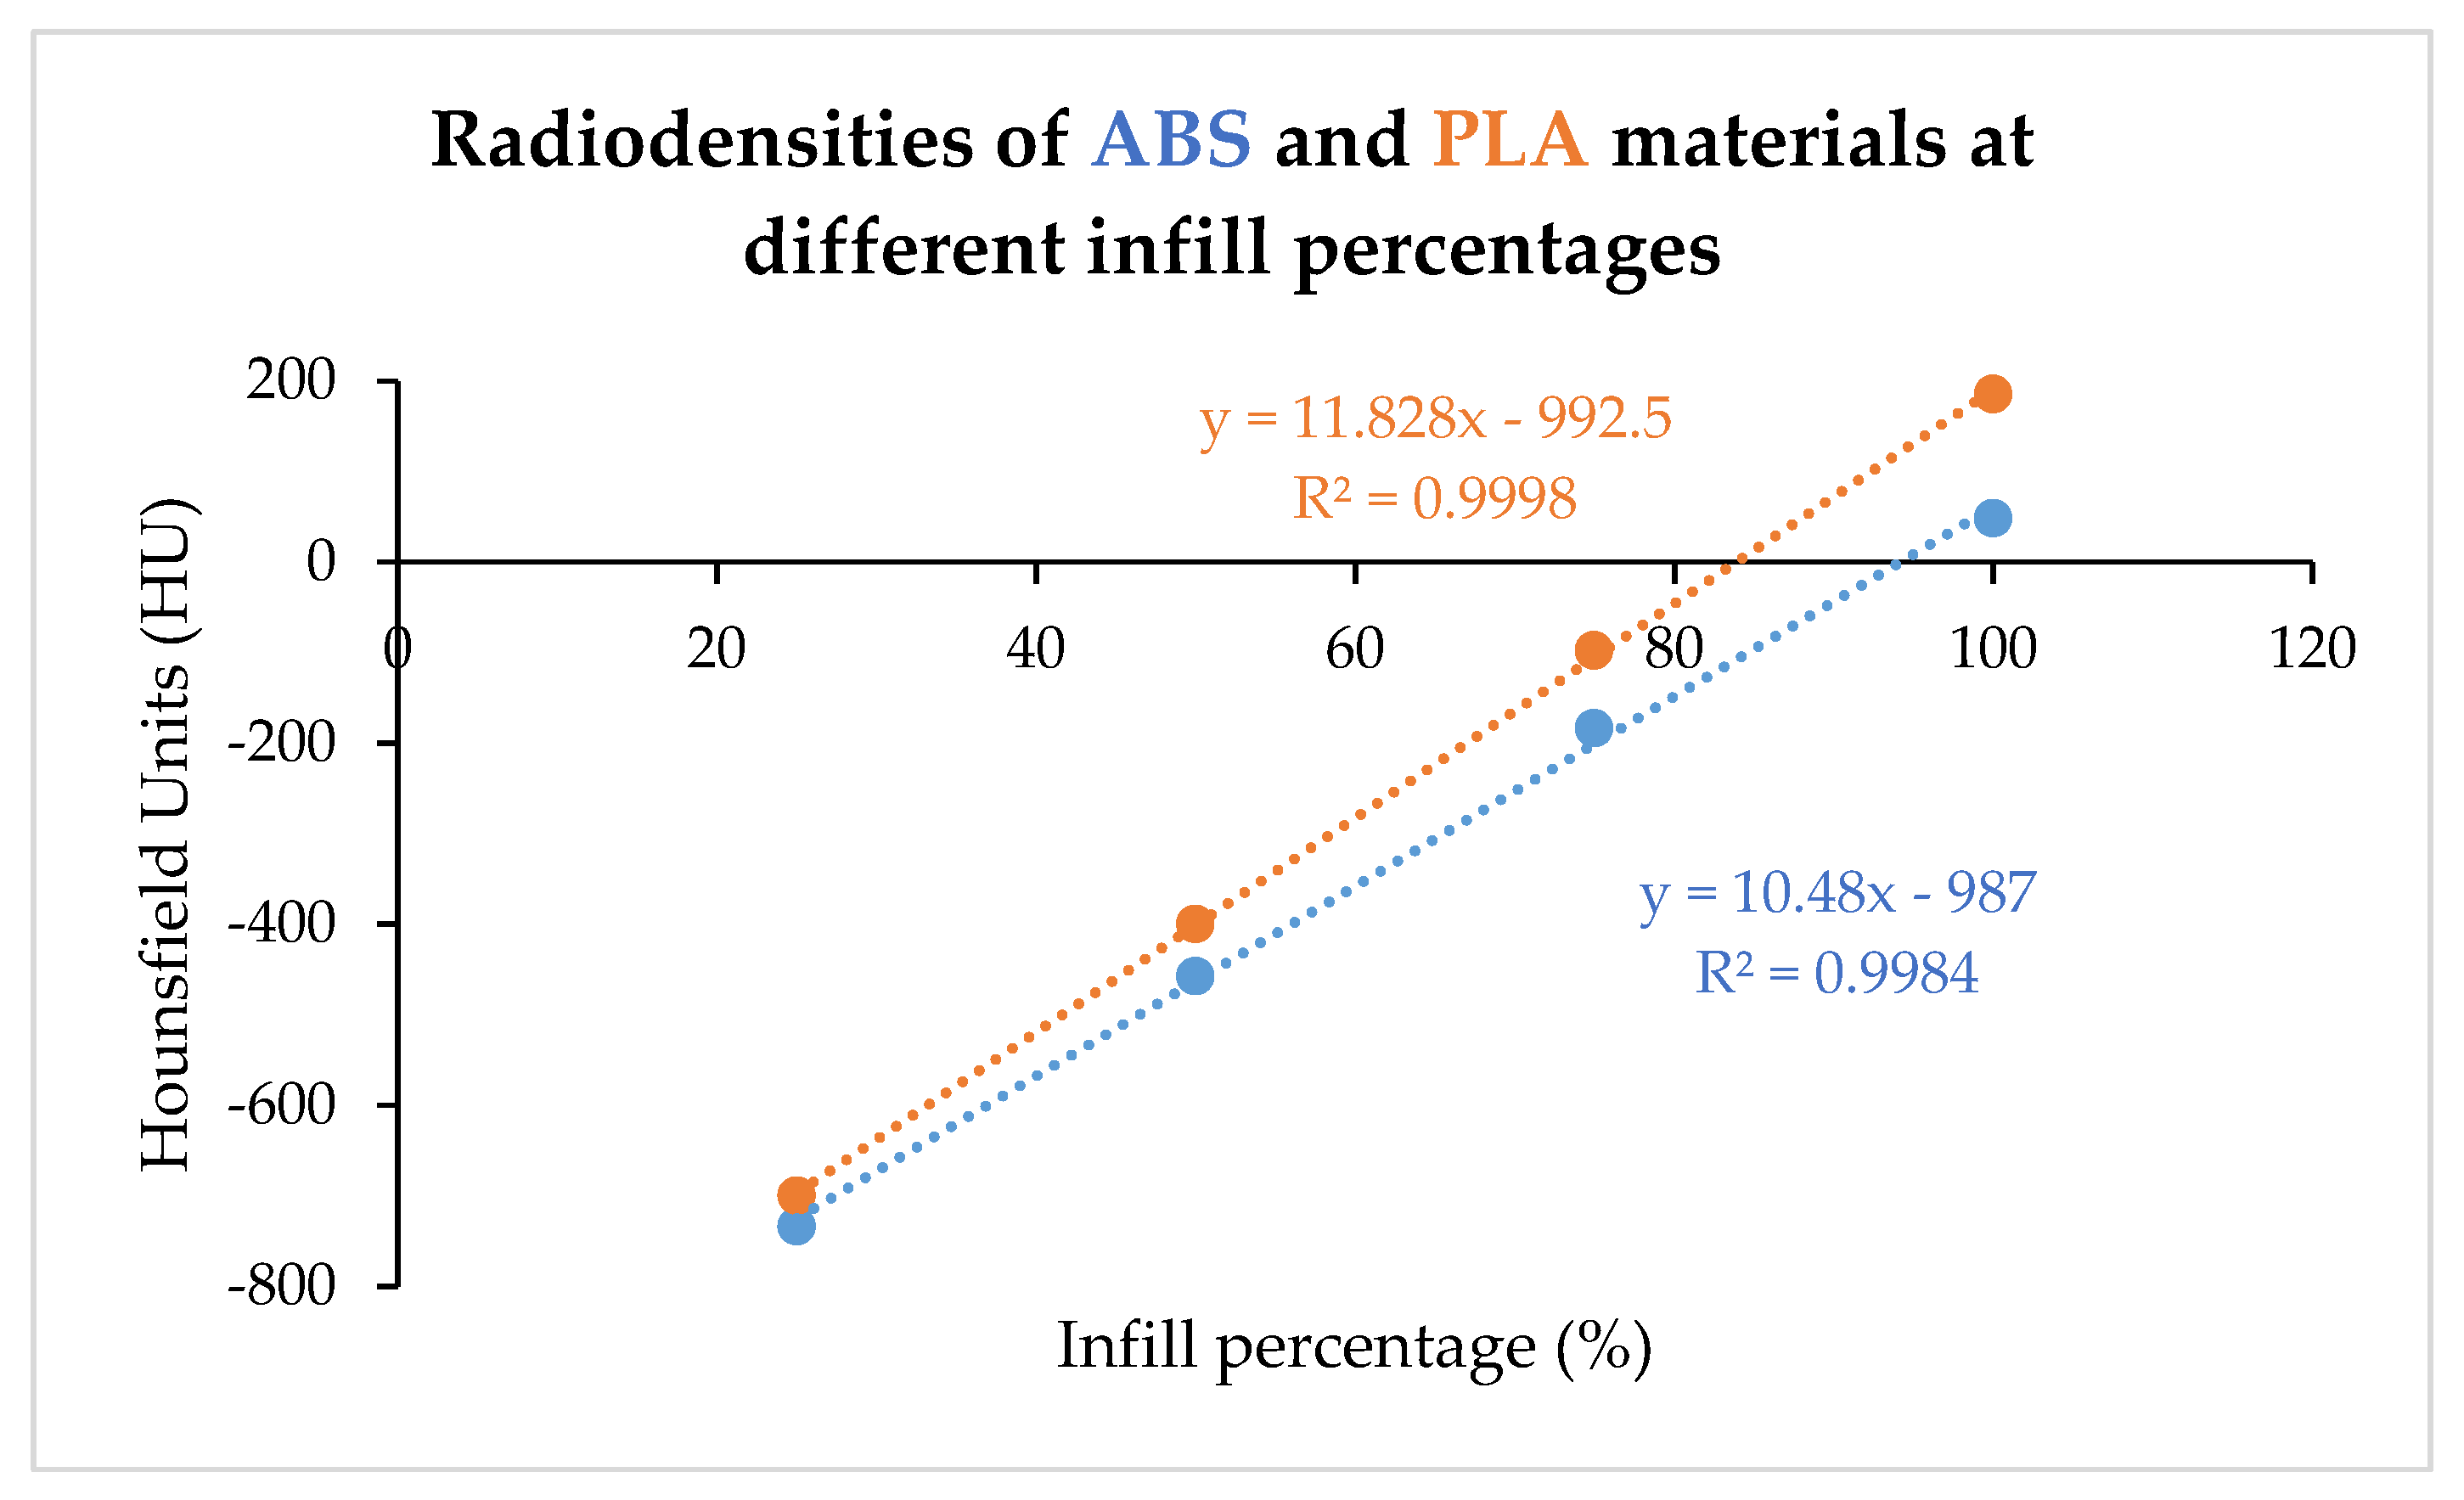
Figure 4.
3D printed chest phantom. A: frontal view of the 3D printed model with ribs and muscle exterior visible. B: Interior of 3D printed model, consisting of heart, neck vessels, trachea, hollowed posterior lung compartments, pulmonary vessels, lung nodules, diaphragm, liver, and stomach. C: Superior view of complete phantom in CT scanner, with skin exterior visible. D: Lateral view of complete phantom within CT scanner.
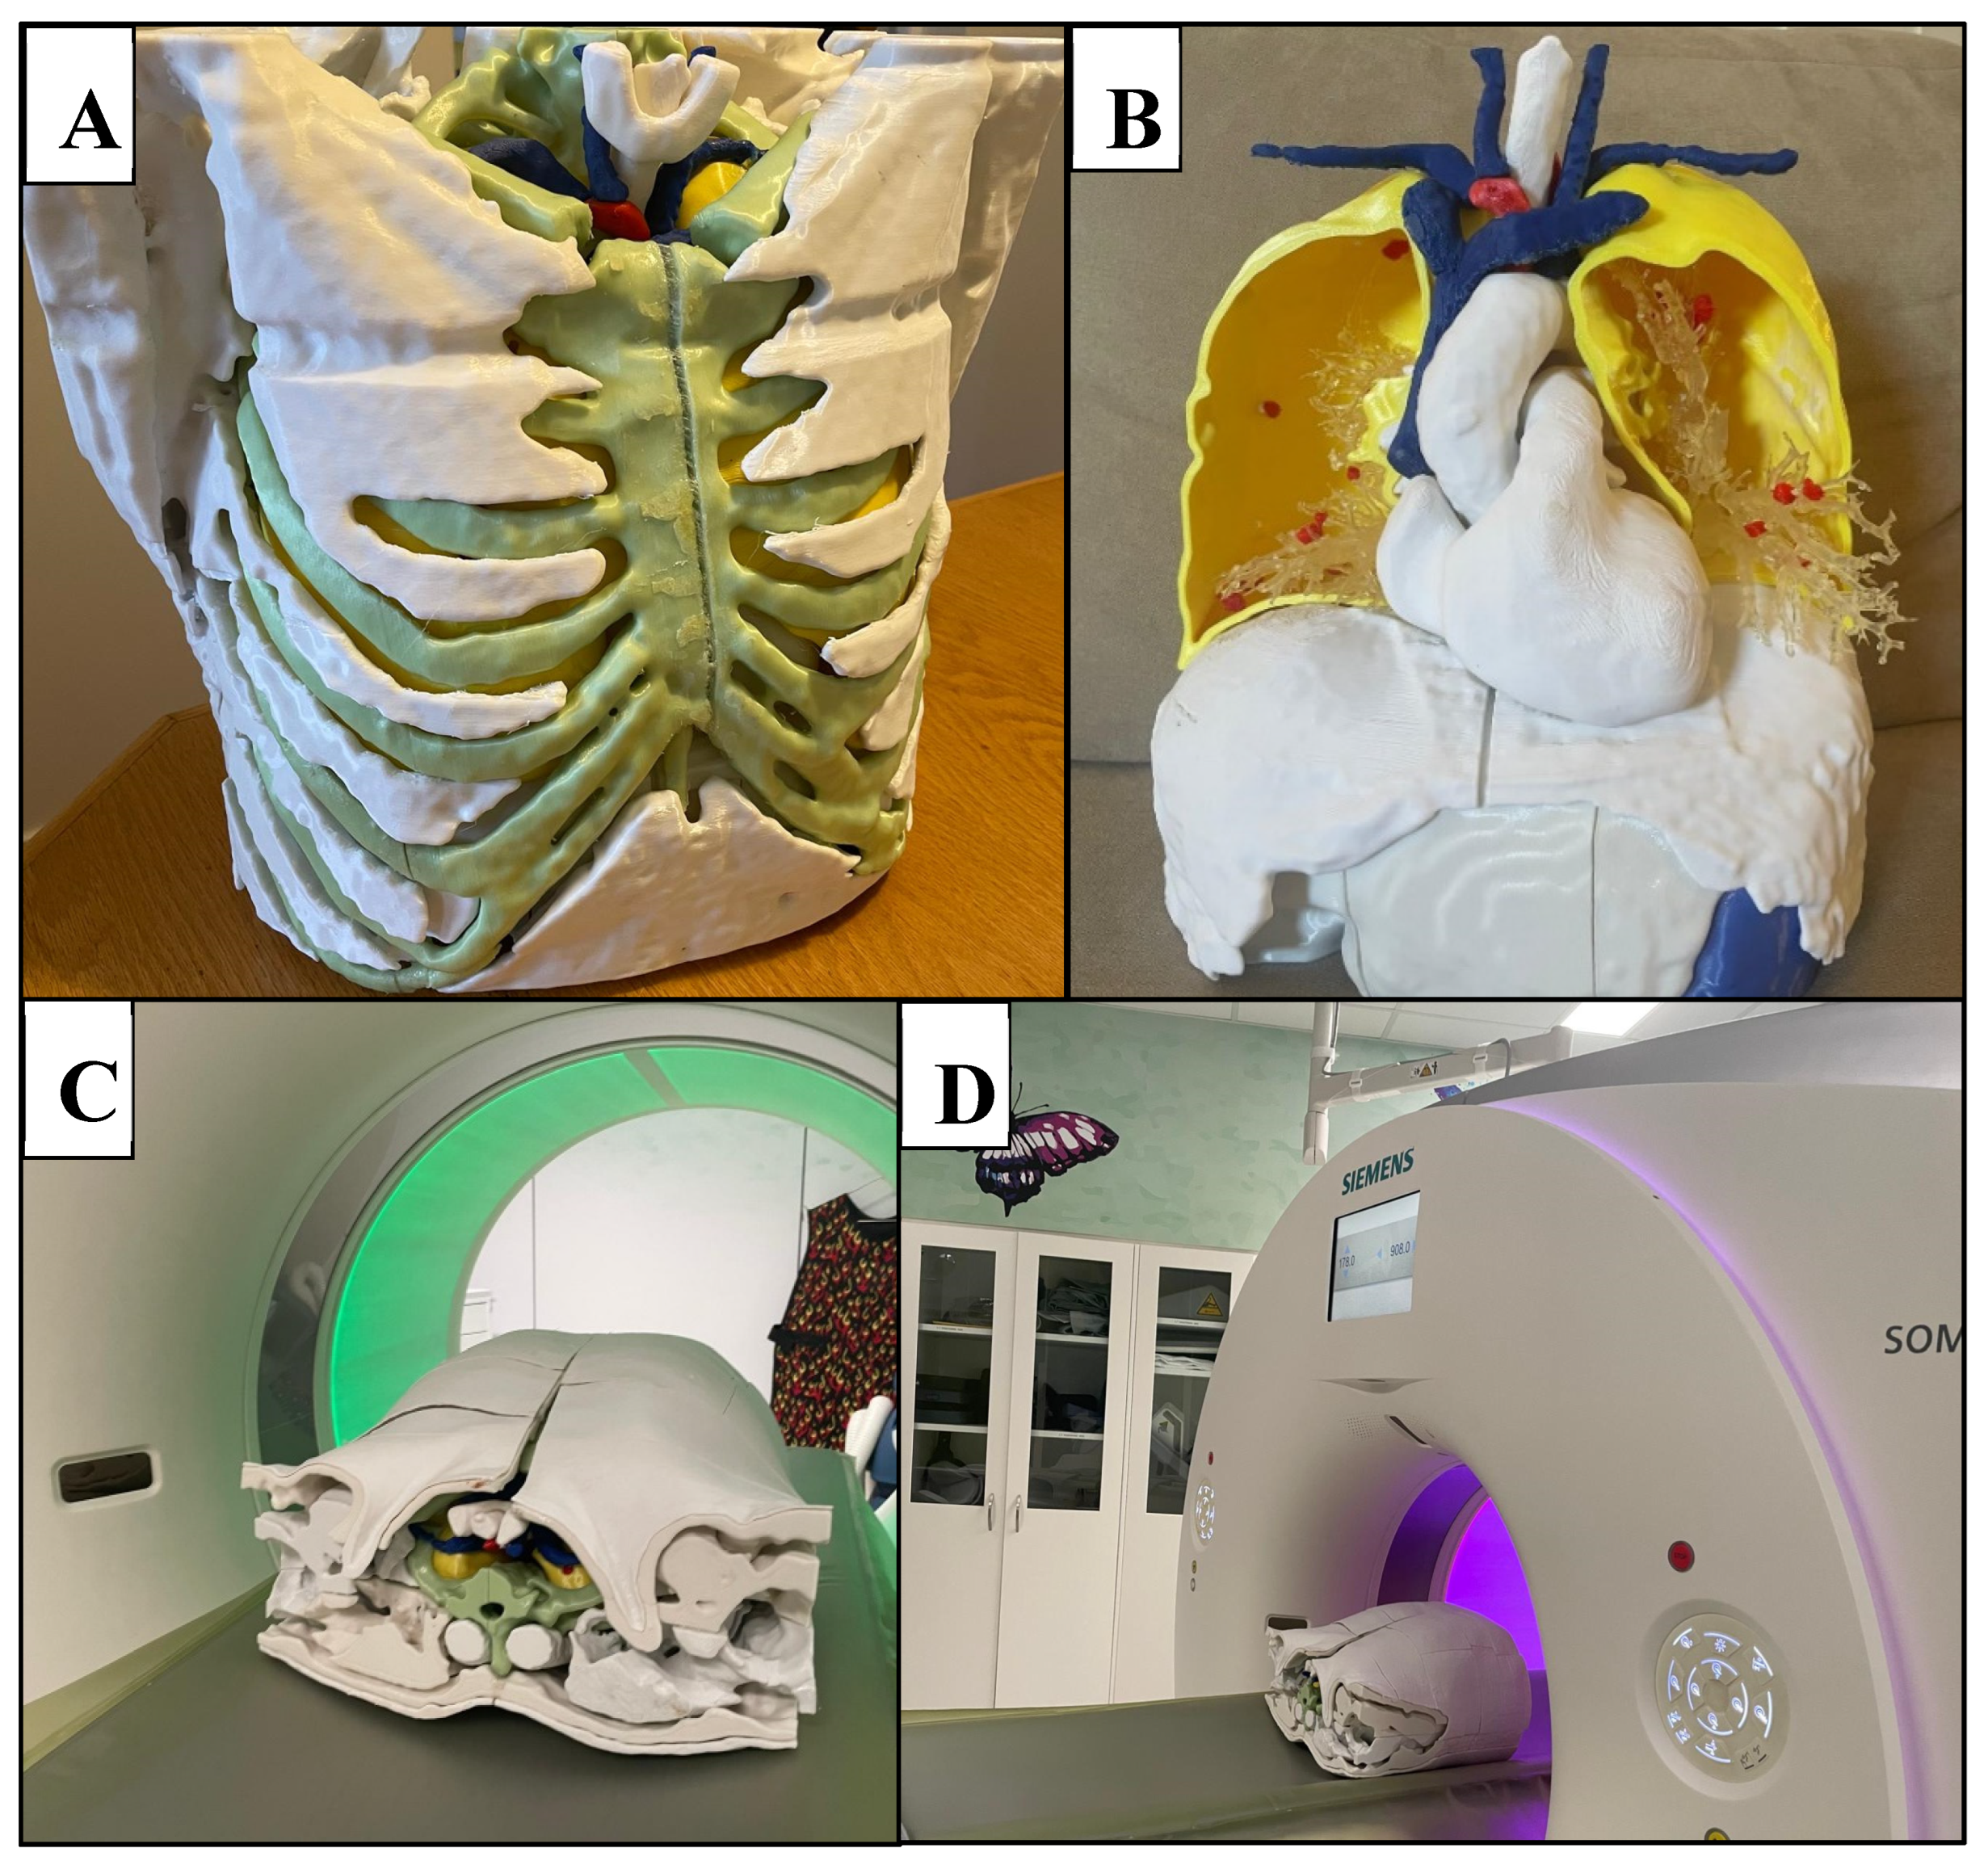
Figure 5.
Lung shell. A: Successive layering of PLA during FDM printing of the lung. B: right anterior lung compartment with lung vessels (polyurethane resin) and nodules (red PLA) in situ.
Figure 5.
Lung shell. A: Successive layering of PLA during FDM printing of the lung. B: right anterior lung compartment with lung vessels (polyurethane resin) and nodules (red PLA) in situ.
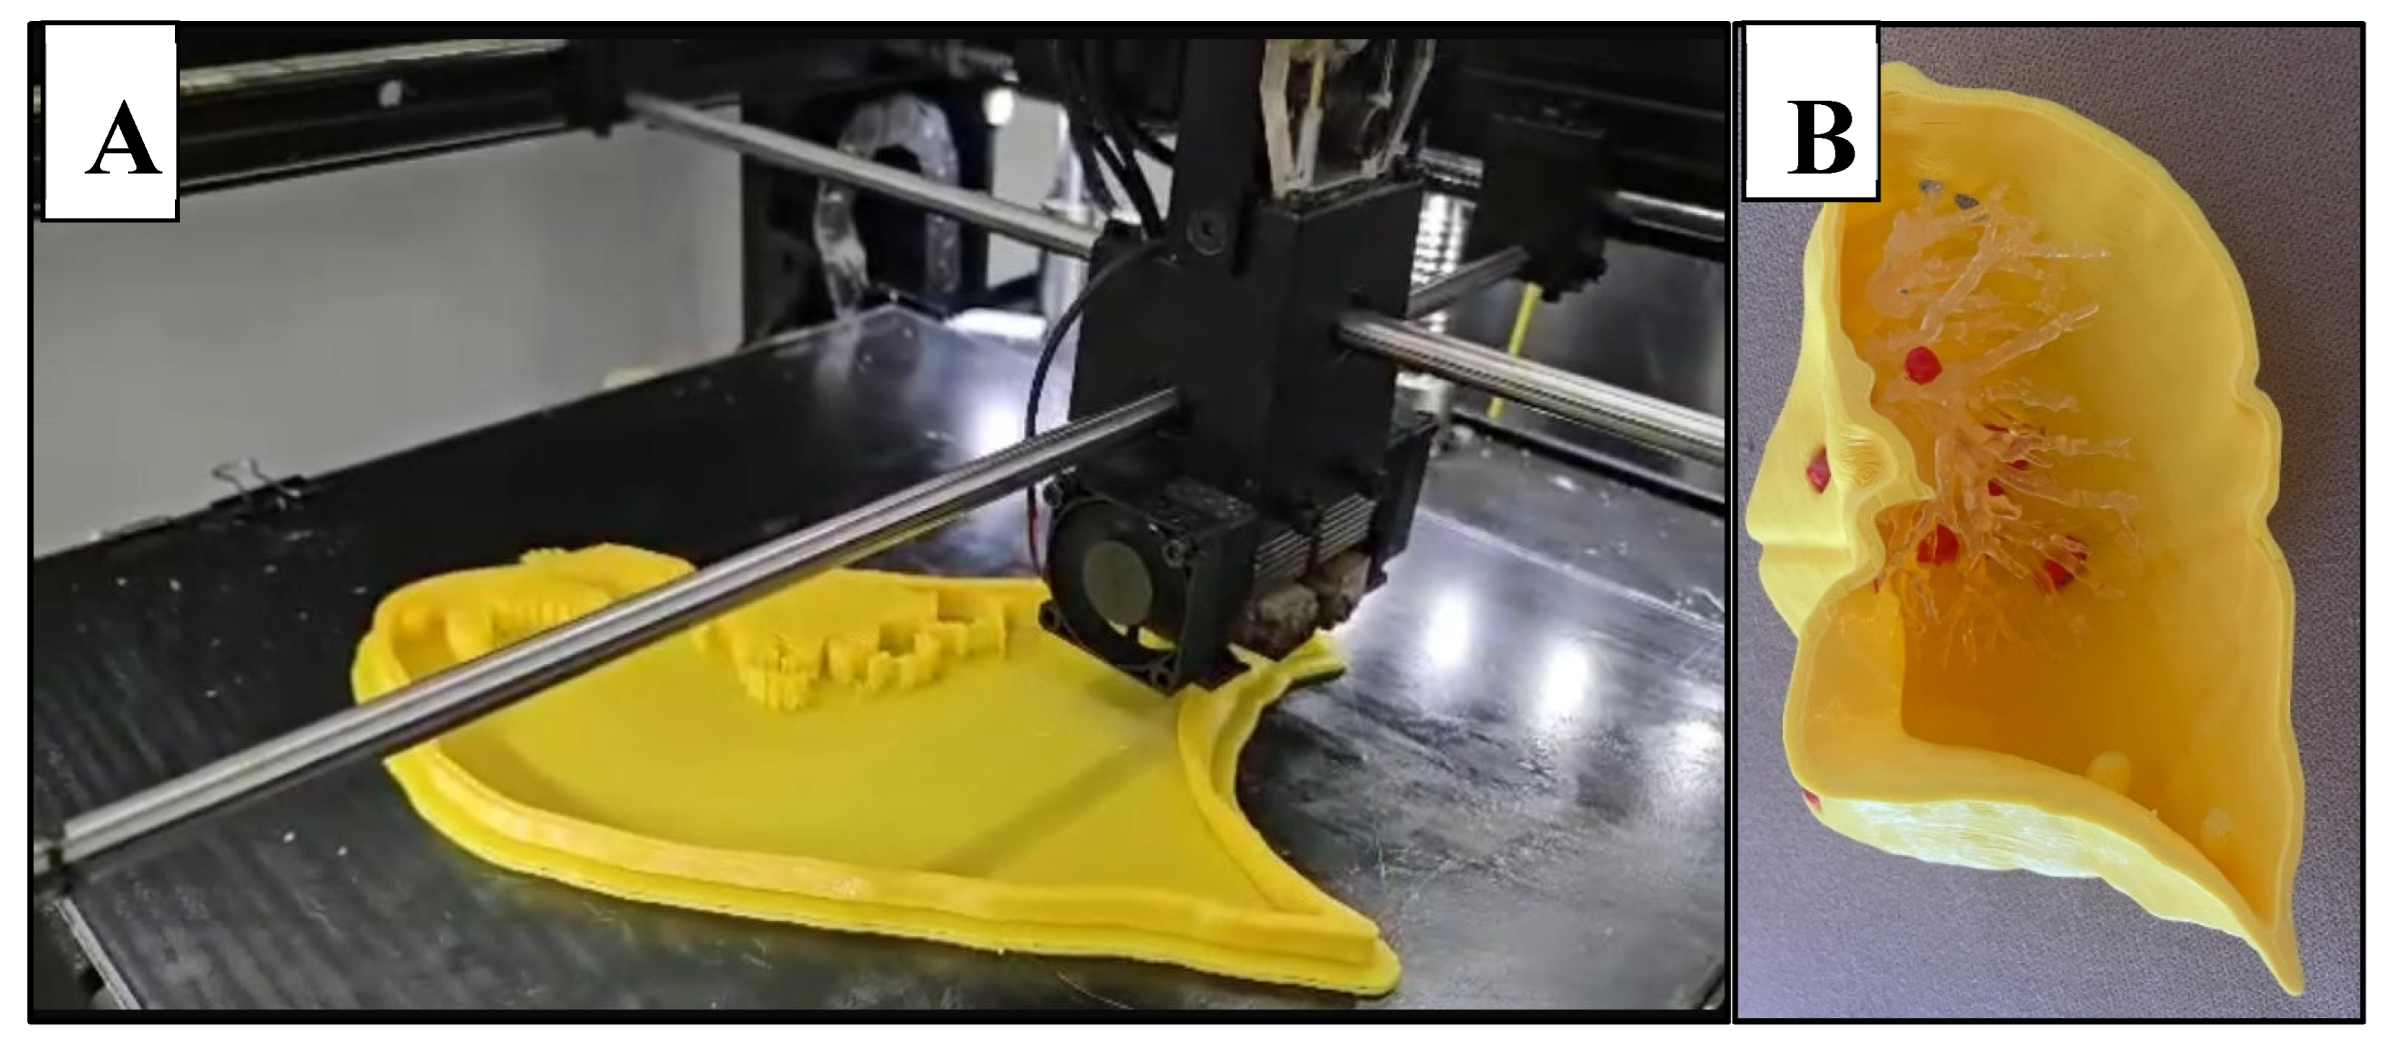
Figure 6.
CT slice of original patient image (A) compared to the phantom image (B). Similar morphological appearance of phantom and patient scans is evident. However, in the phantom, the smaller pulmonary vessels and lung interstitium are absent and air gaps exist between tissue layers. Edge enhancement surrounding structures is also evident within the phantom scan.
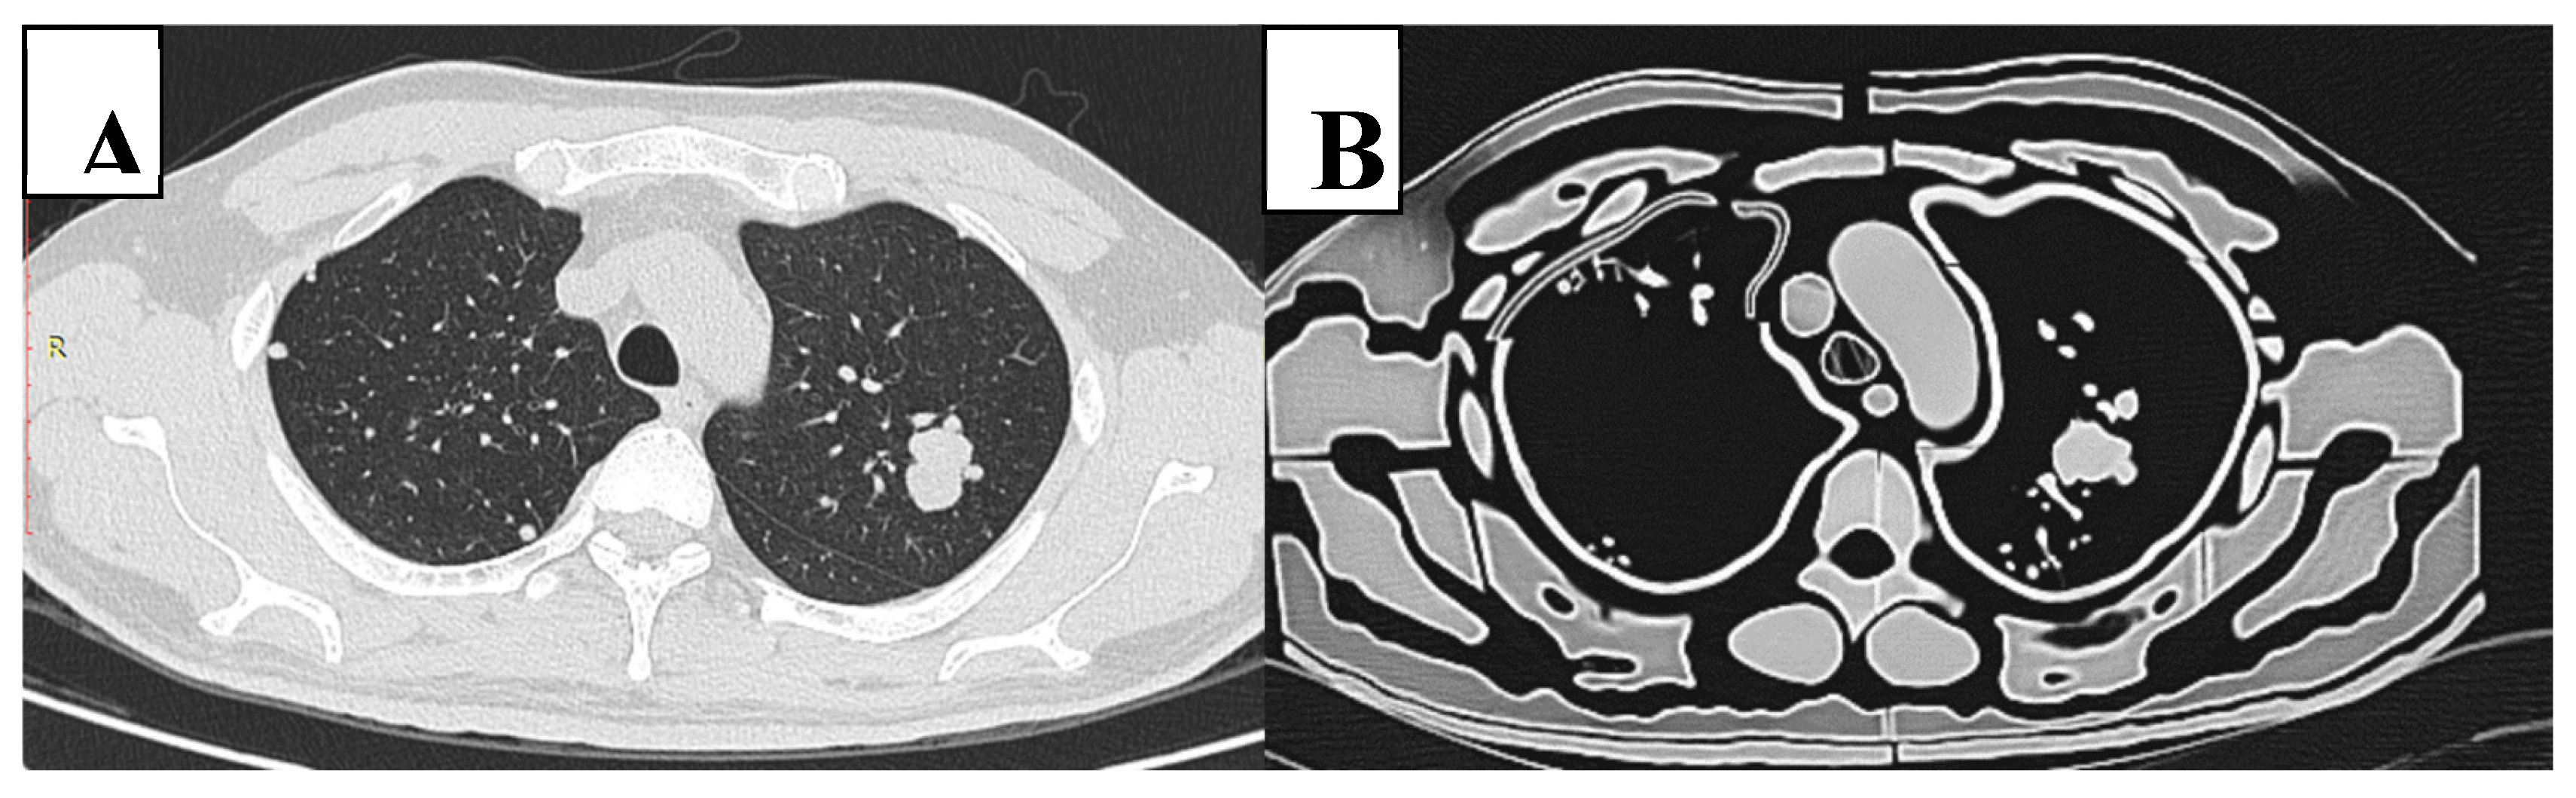
Figure 7.
Box plot comparing the Hounsfield Units (HU) of phantom and patient tissues. The cross represents the mean, and the horizontal line represents the median. Lung nodules, diaphragm, and lung tissue have similar HU values. In contrast, phantom muscle, fat, heart, skin, blood vessels and bone have significantly lower HU compared to the patient, whilst pulmonary vessels and airway have significantly higher HU. Phantom tissues tend to exhibit larger variations in attenuation.
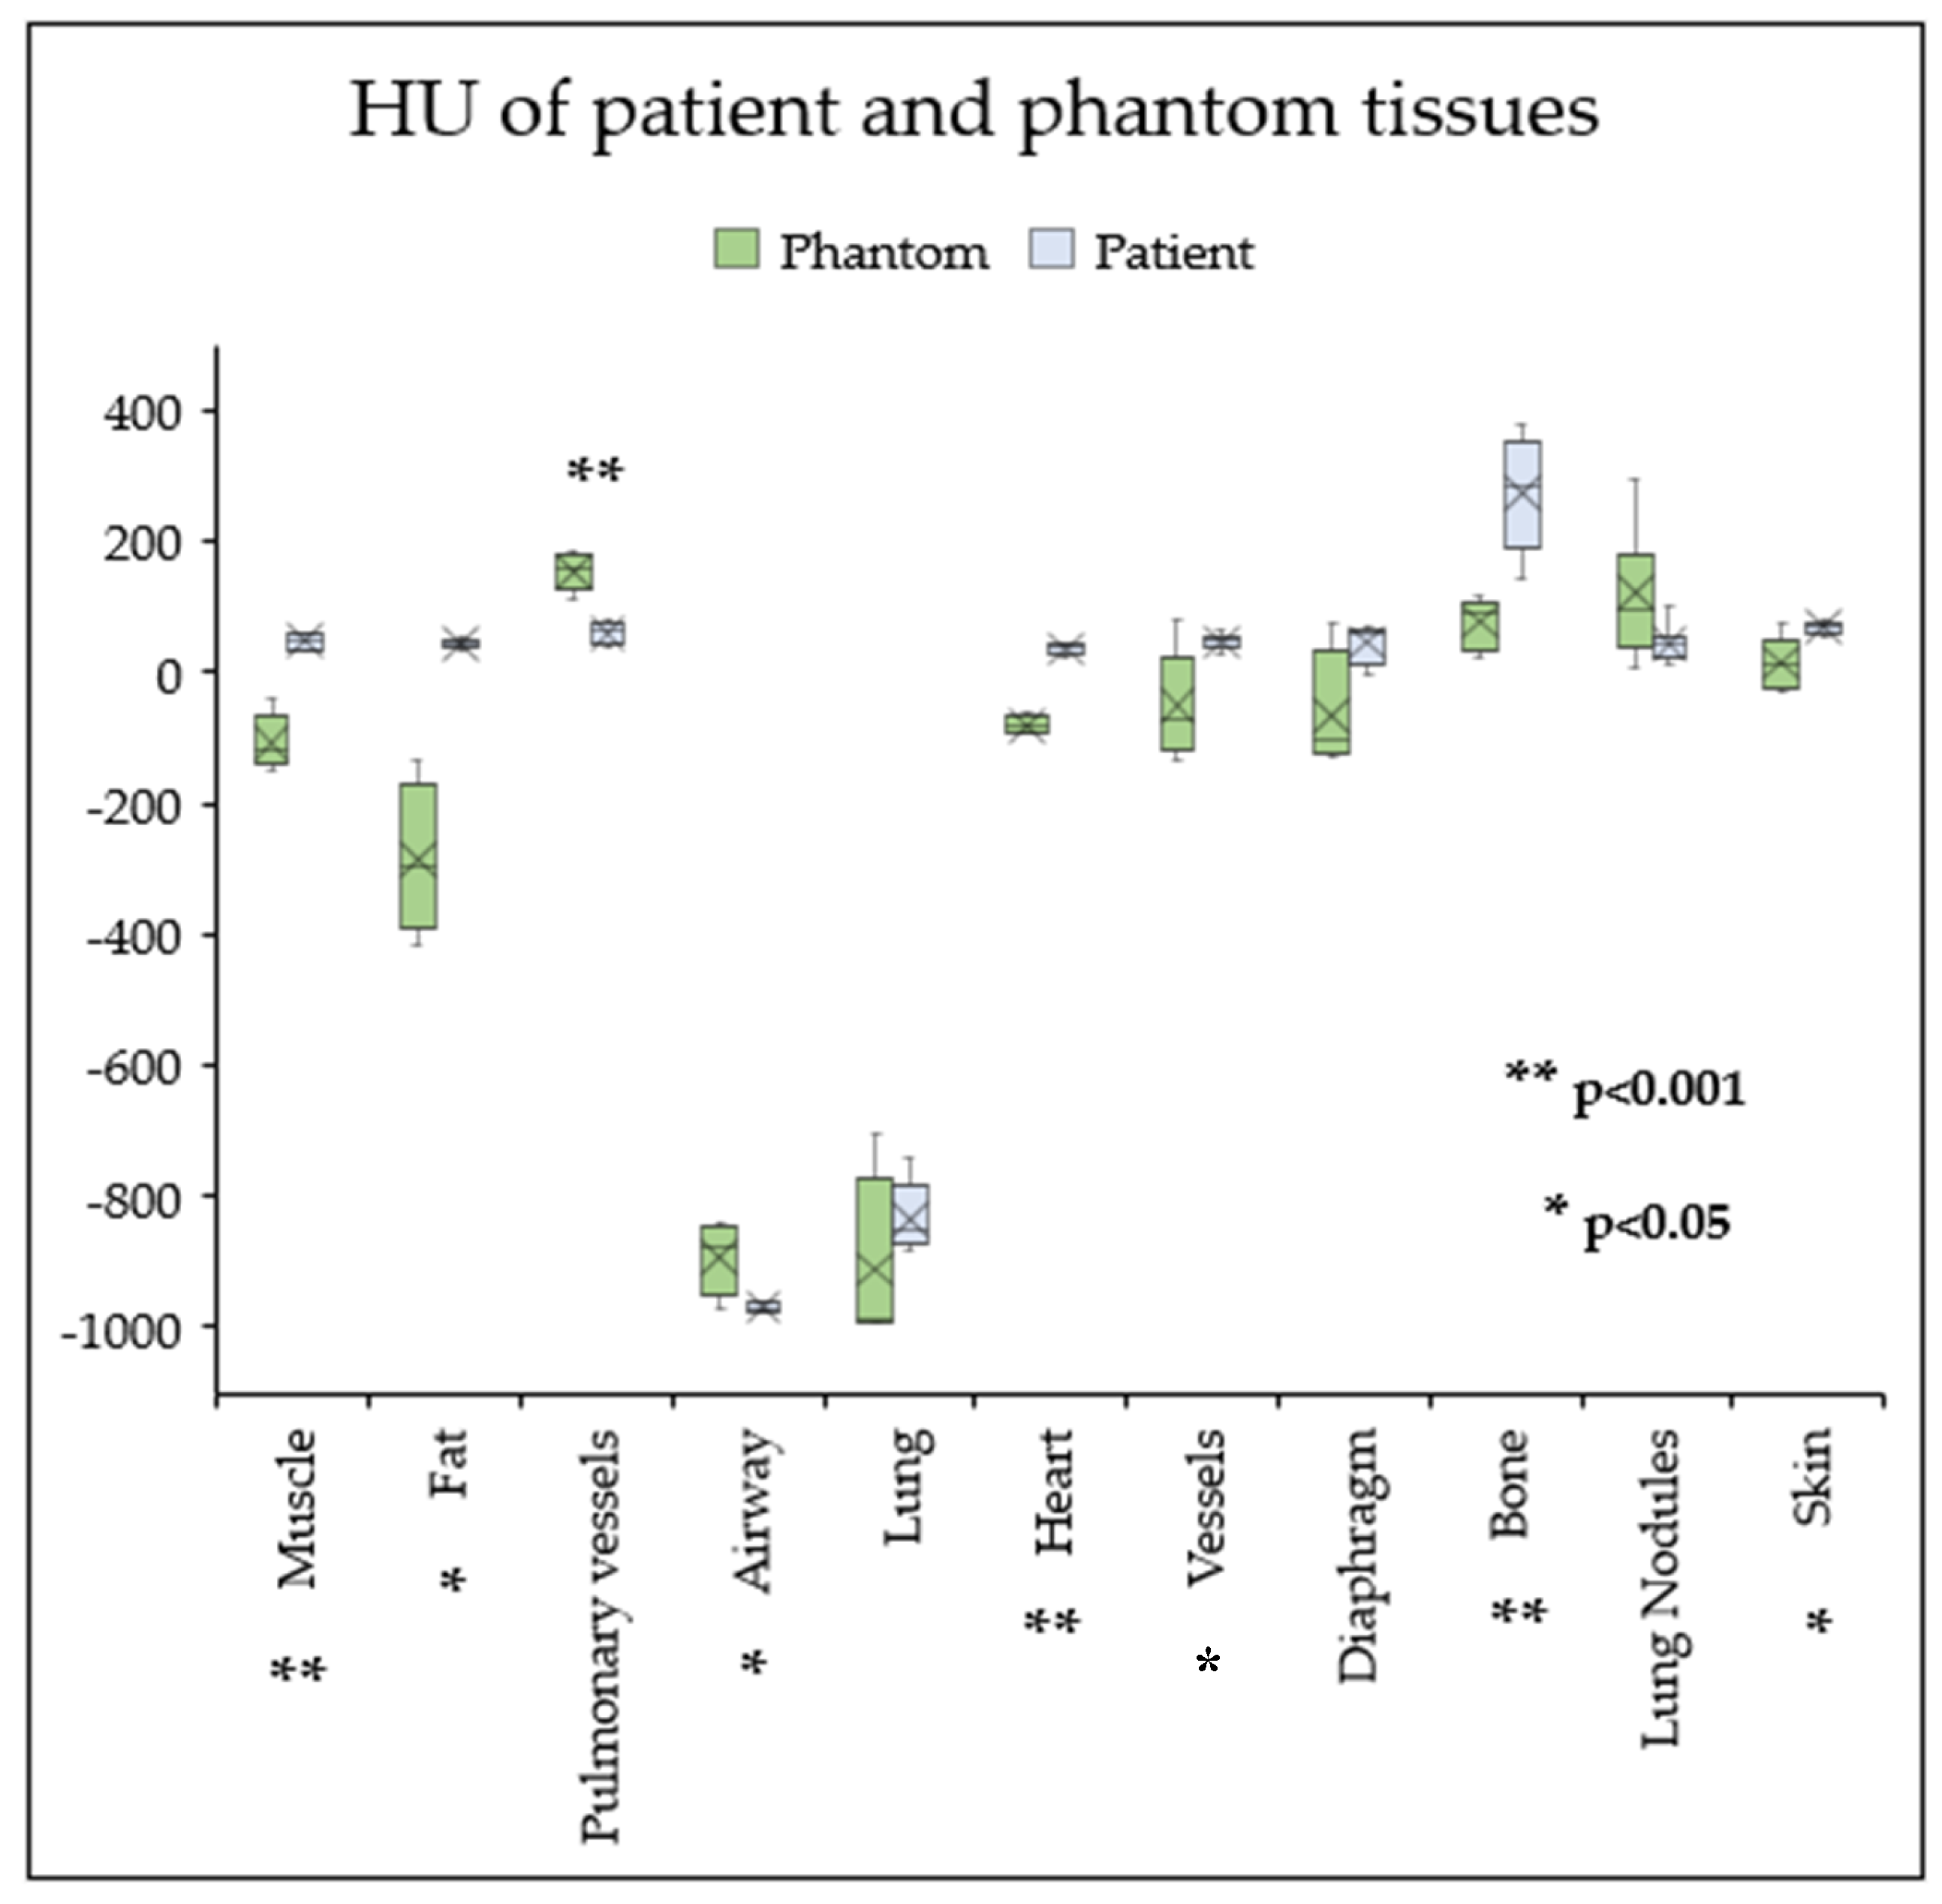
Figure 8.
Bar graph demonstrating that a reduction in kVp and mAs results in a reduced effective dose.
Figure 8.
Bar graph demonstrating that a reduction in kVp and mAs results in a reduced effective dose.
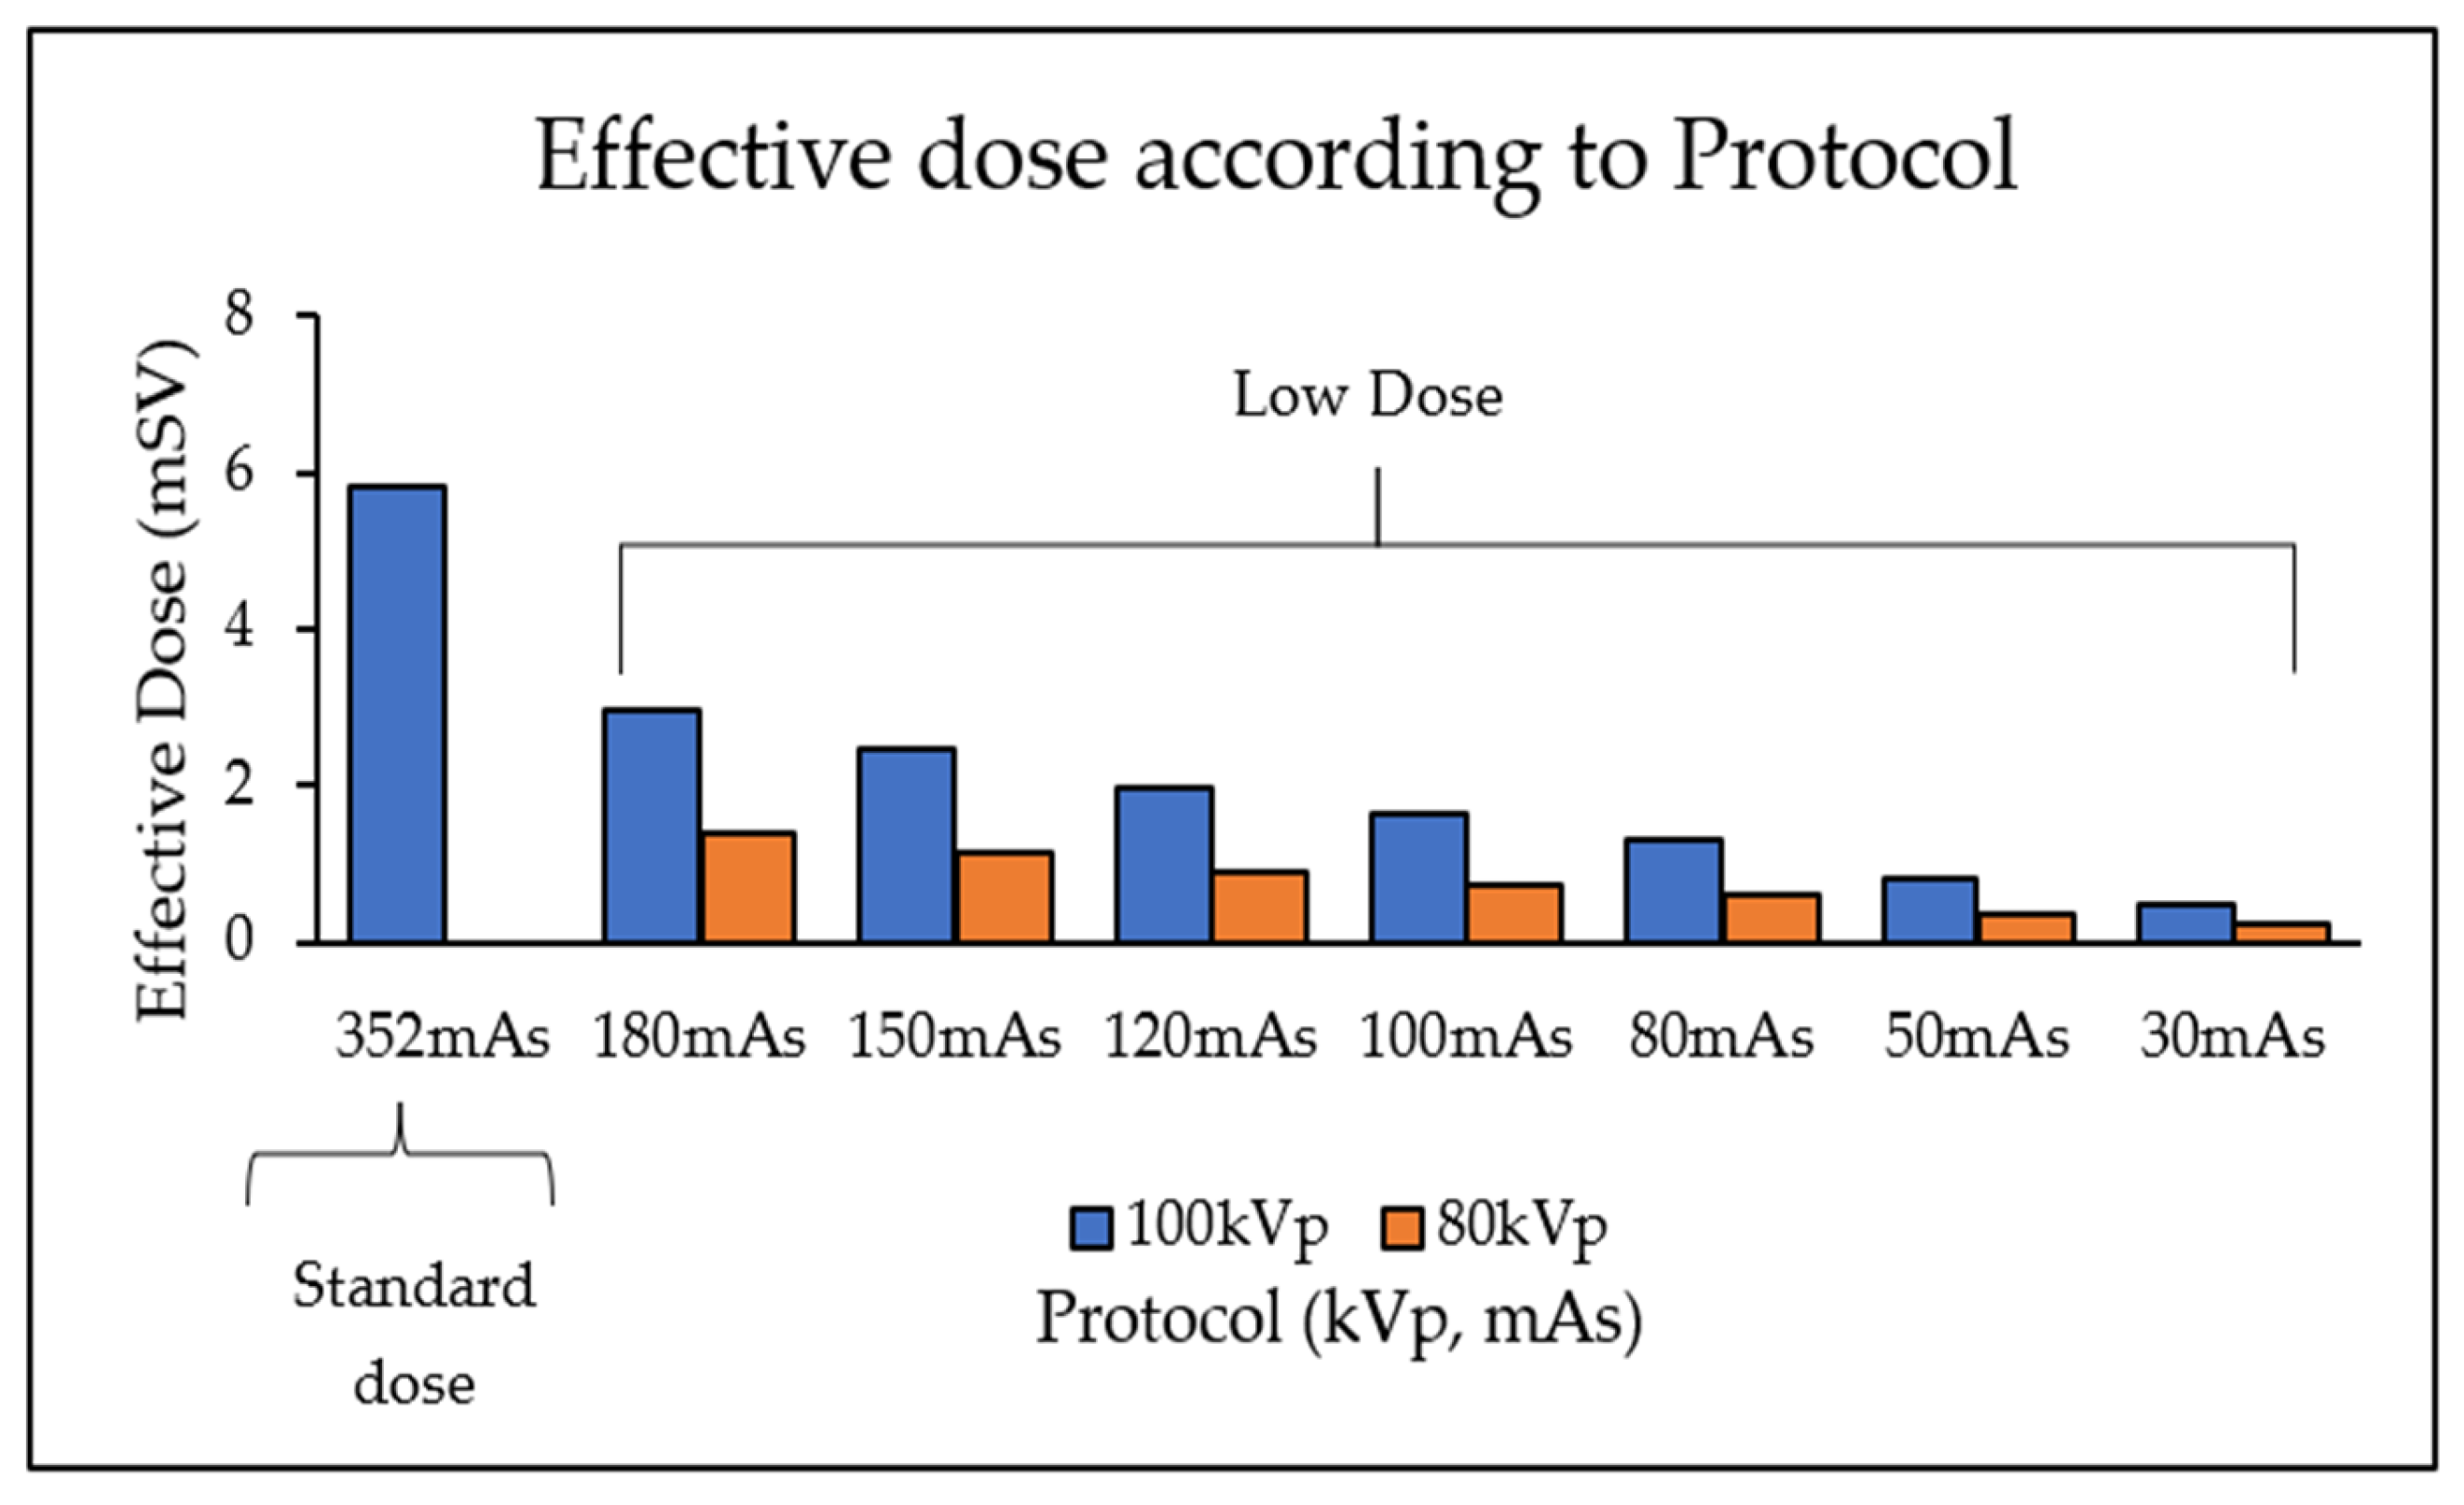
Figure 9.
Strong positive correlation and linear regression between SNR and effective dose.
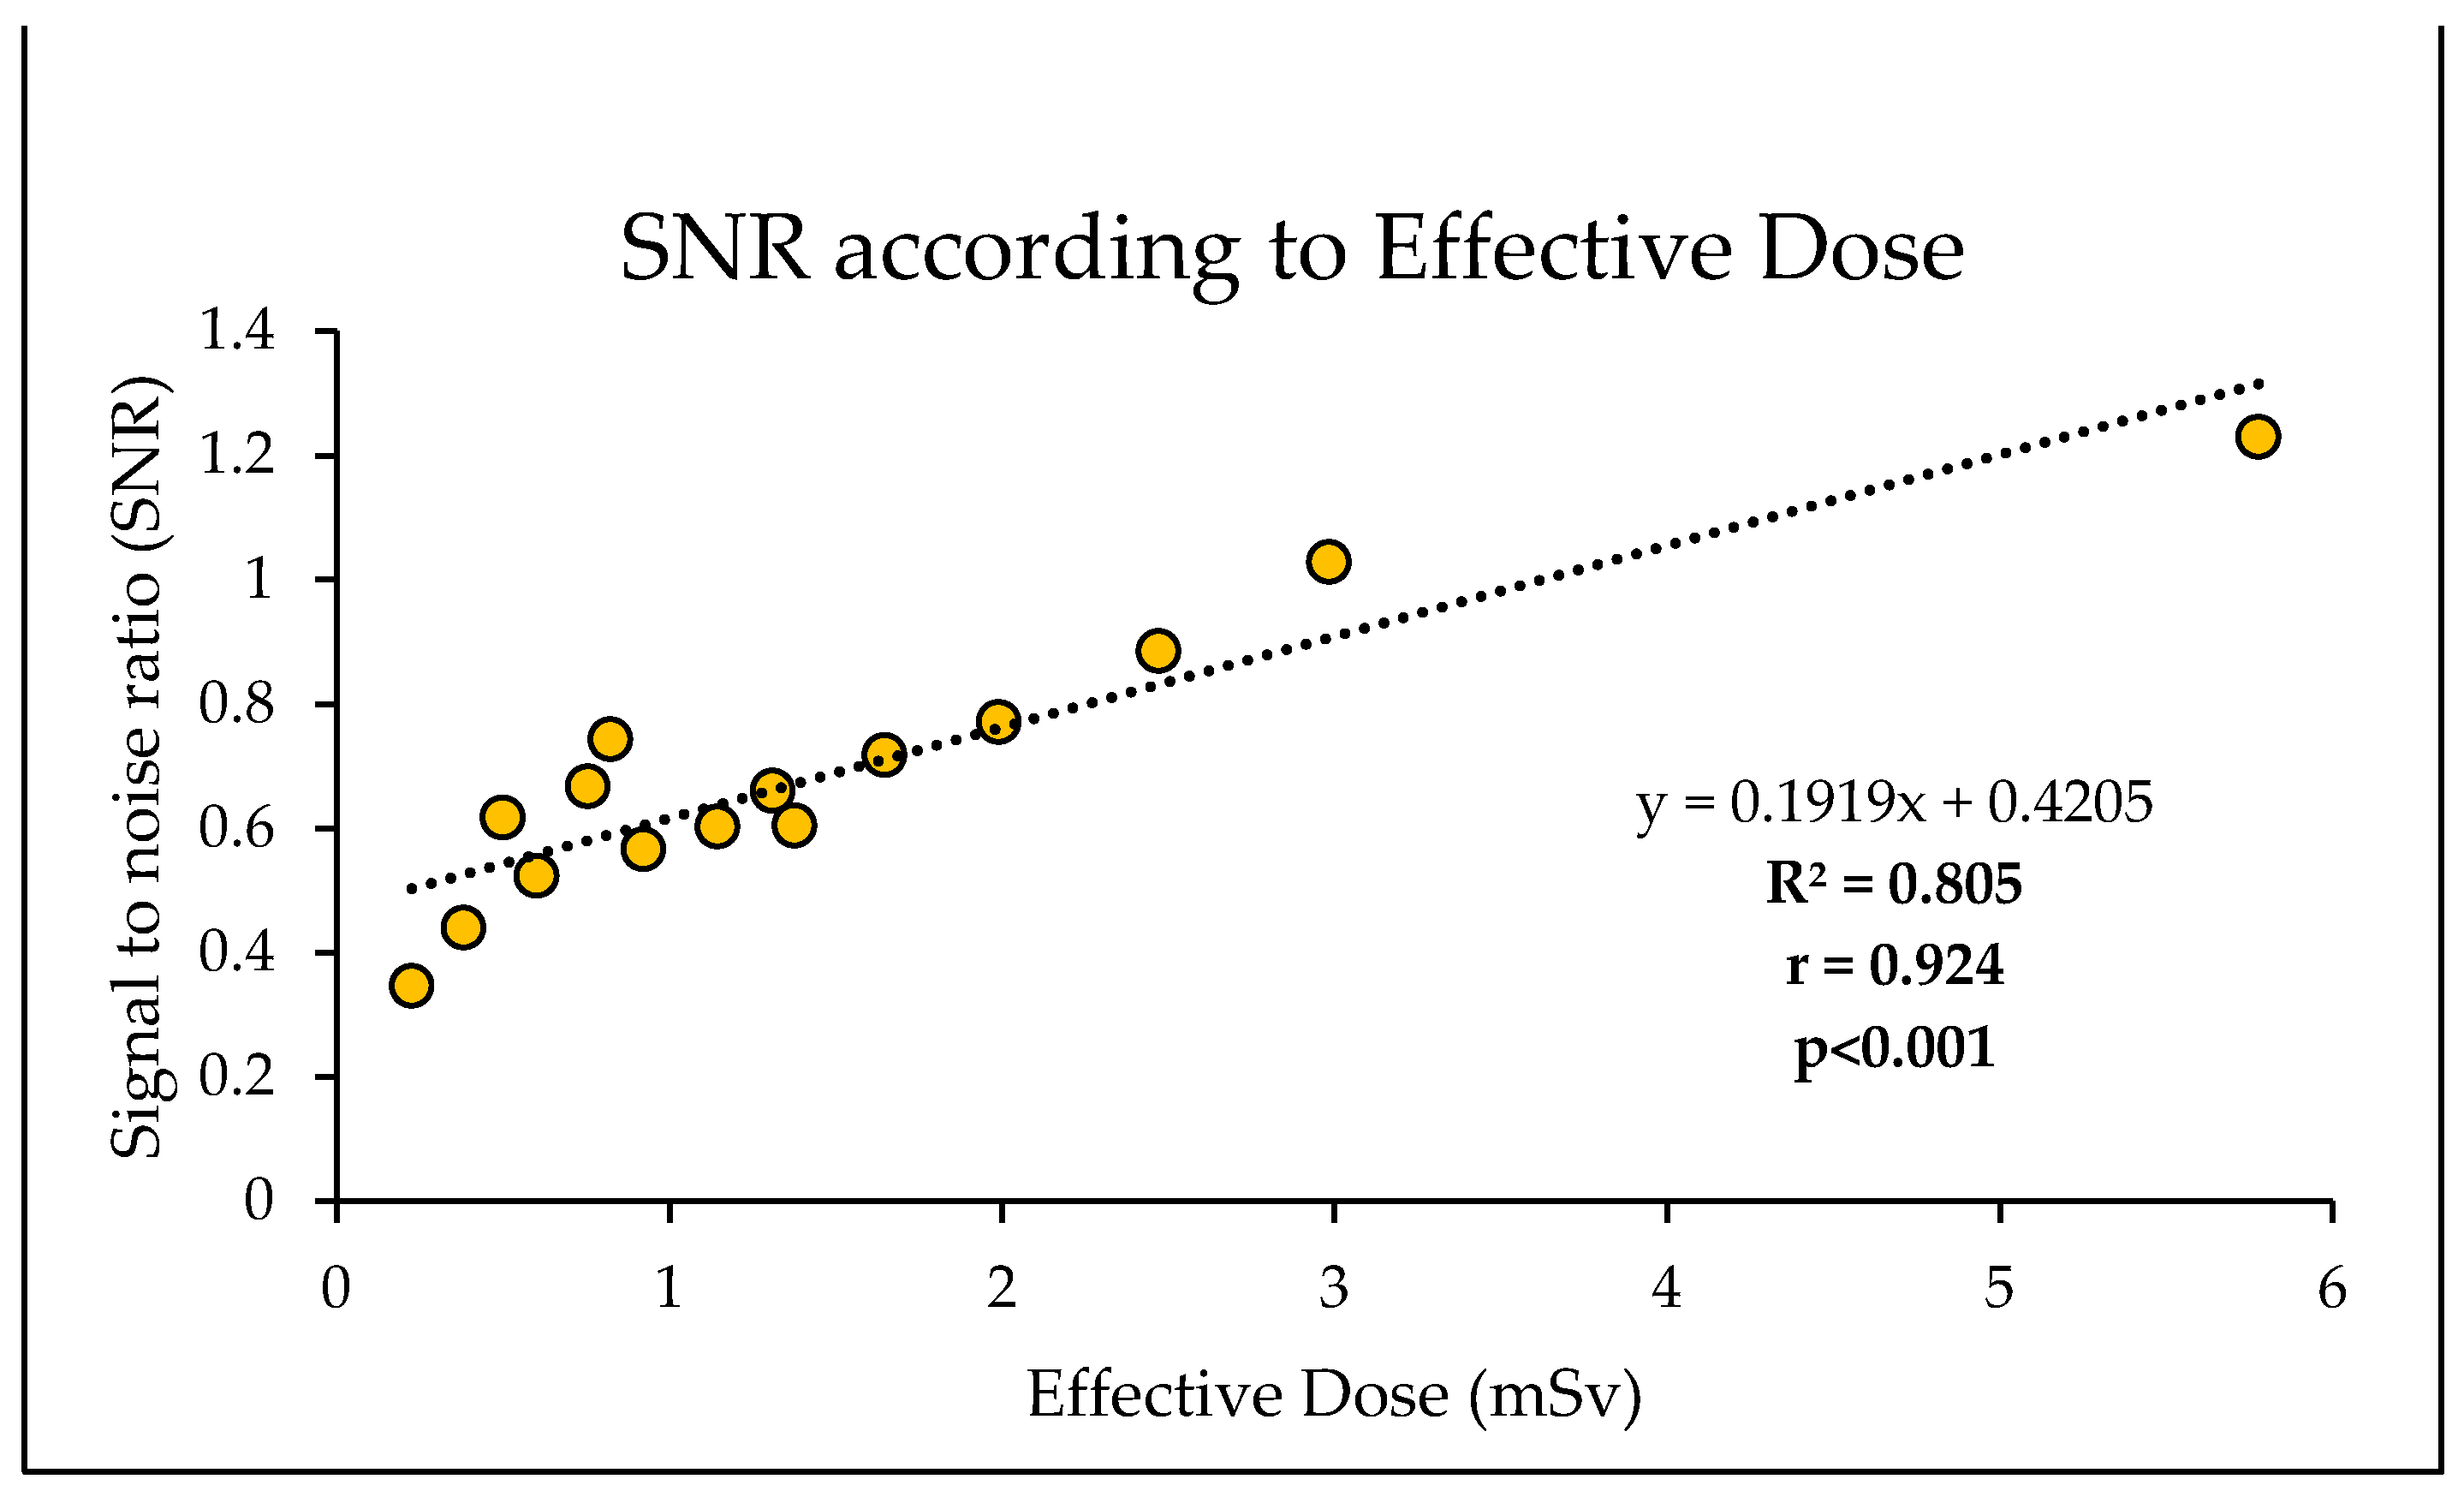
Figure 10.
Strong positive correlation and linear regression between CNR and effective dose.
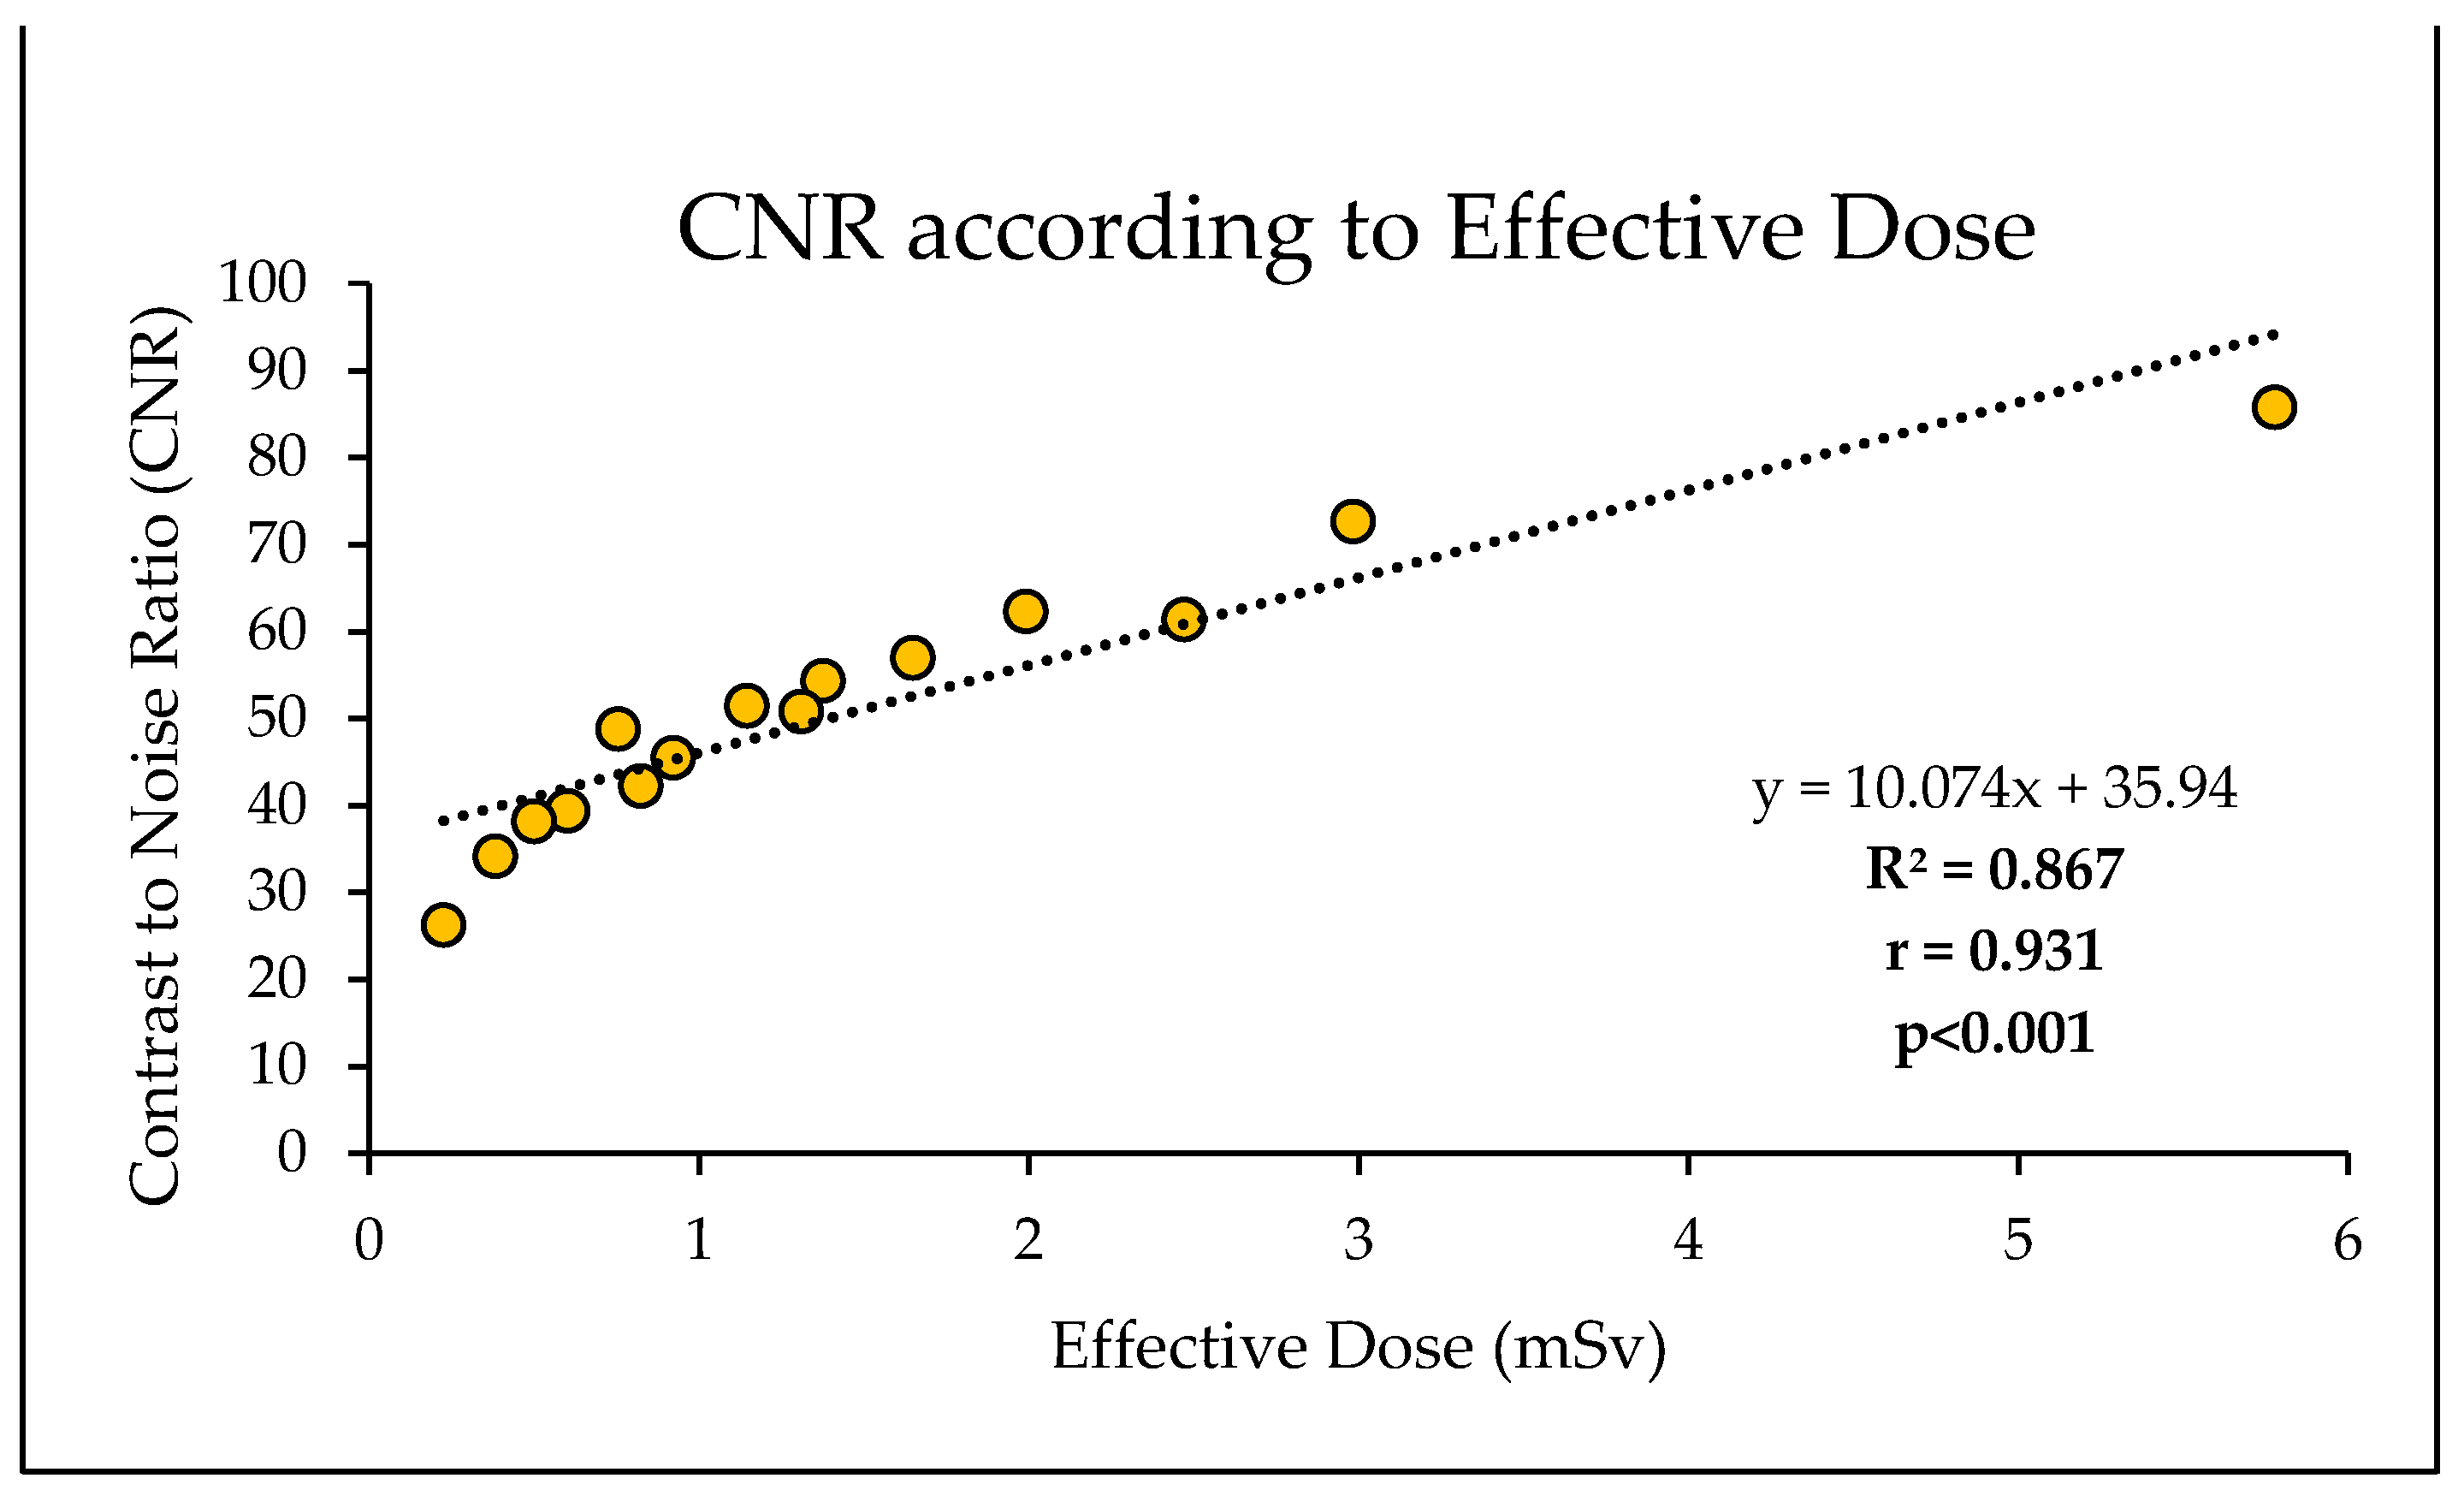
Figure 11.
Sample CT slices of phantom. Top row images depict largest nodule. Bottom row images depict smallest lung nodule. A: The lowest dose protocol of 80 kVp, 30 mAs, with slight mottle evident. B: Highest dose protocol of 100 kVp, 352 mAs. Despite increase in noise and hence reduced SNR and CNR, radiologists deemed these images to be diagnostic for detection of lung nodules.
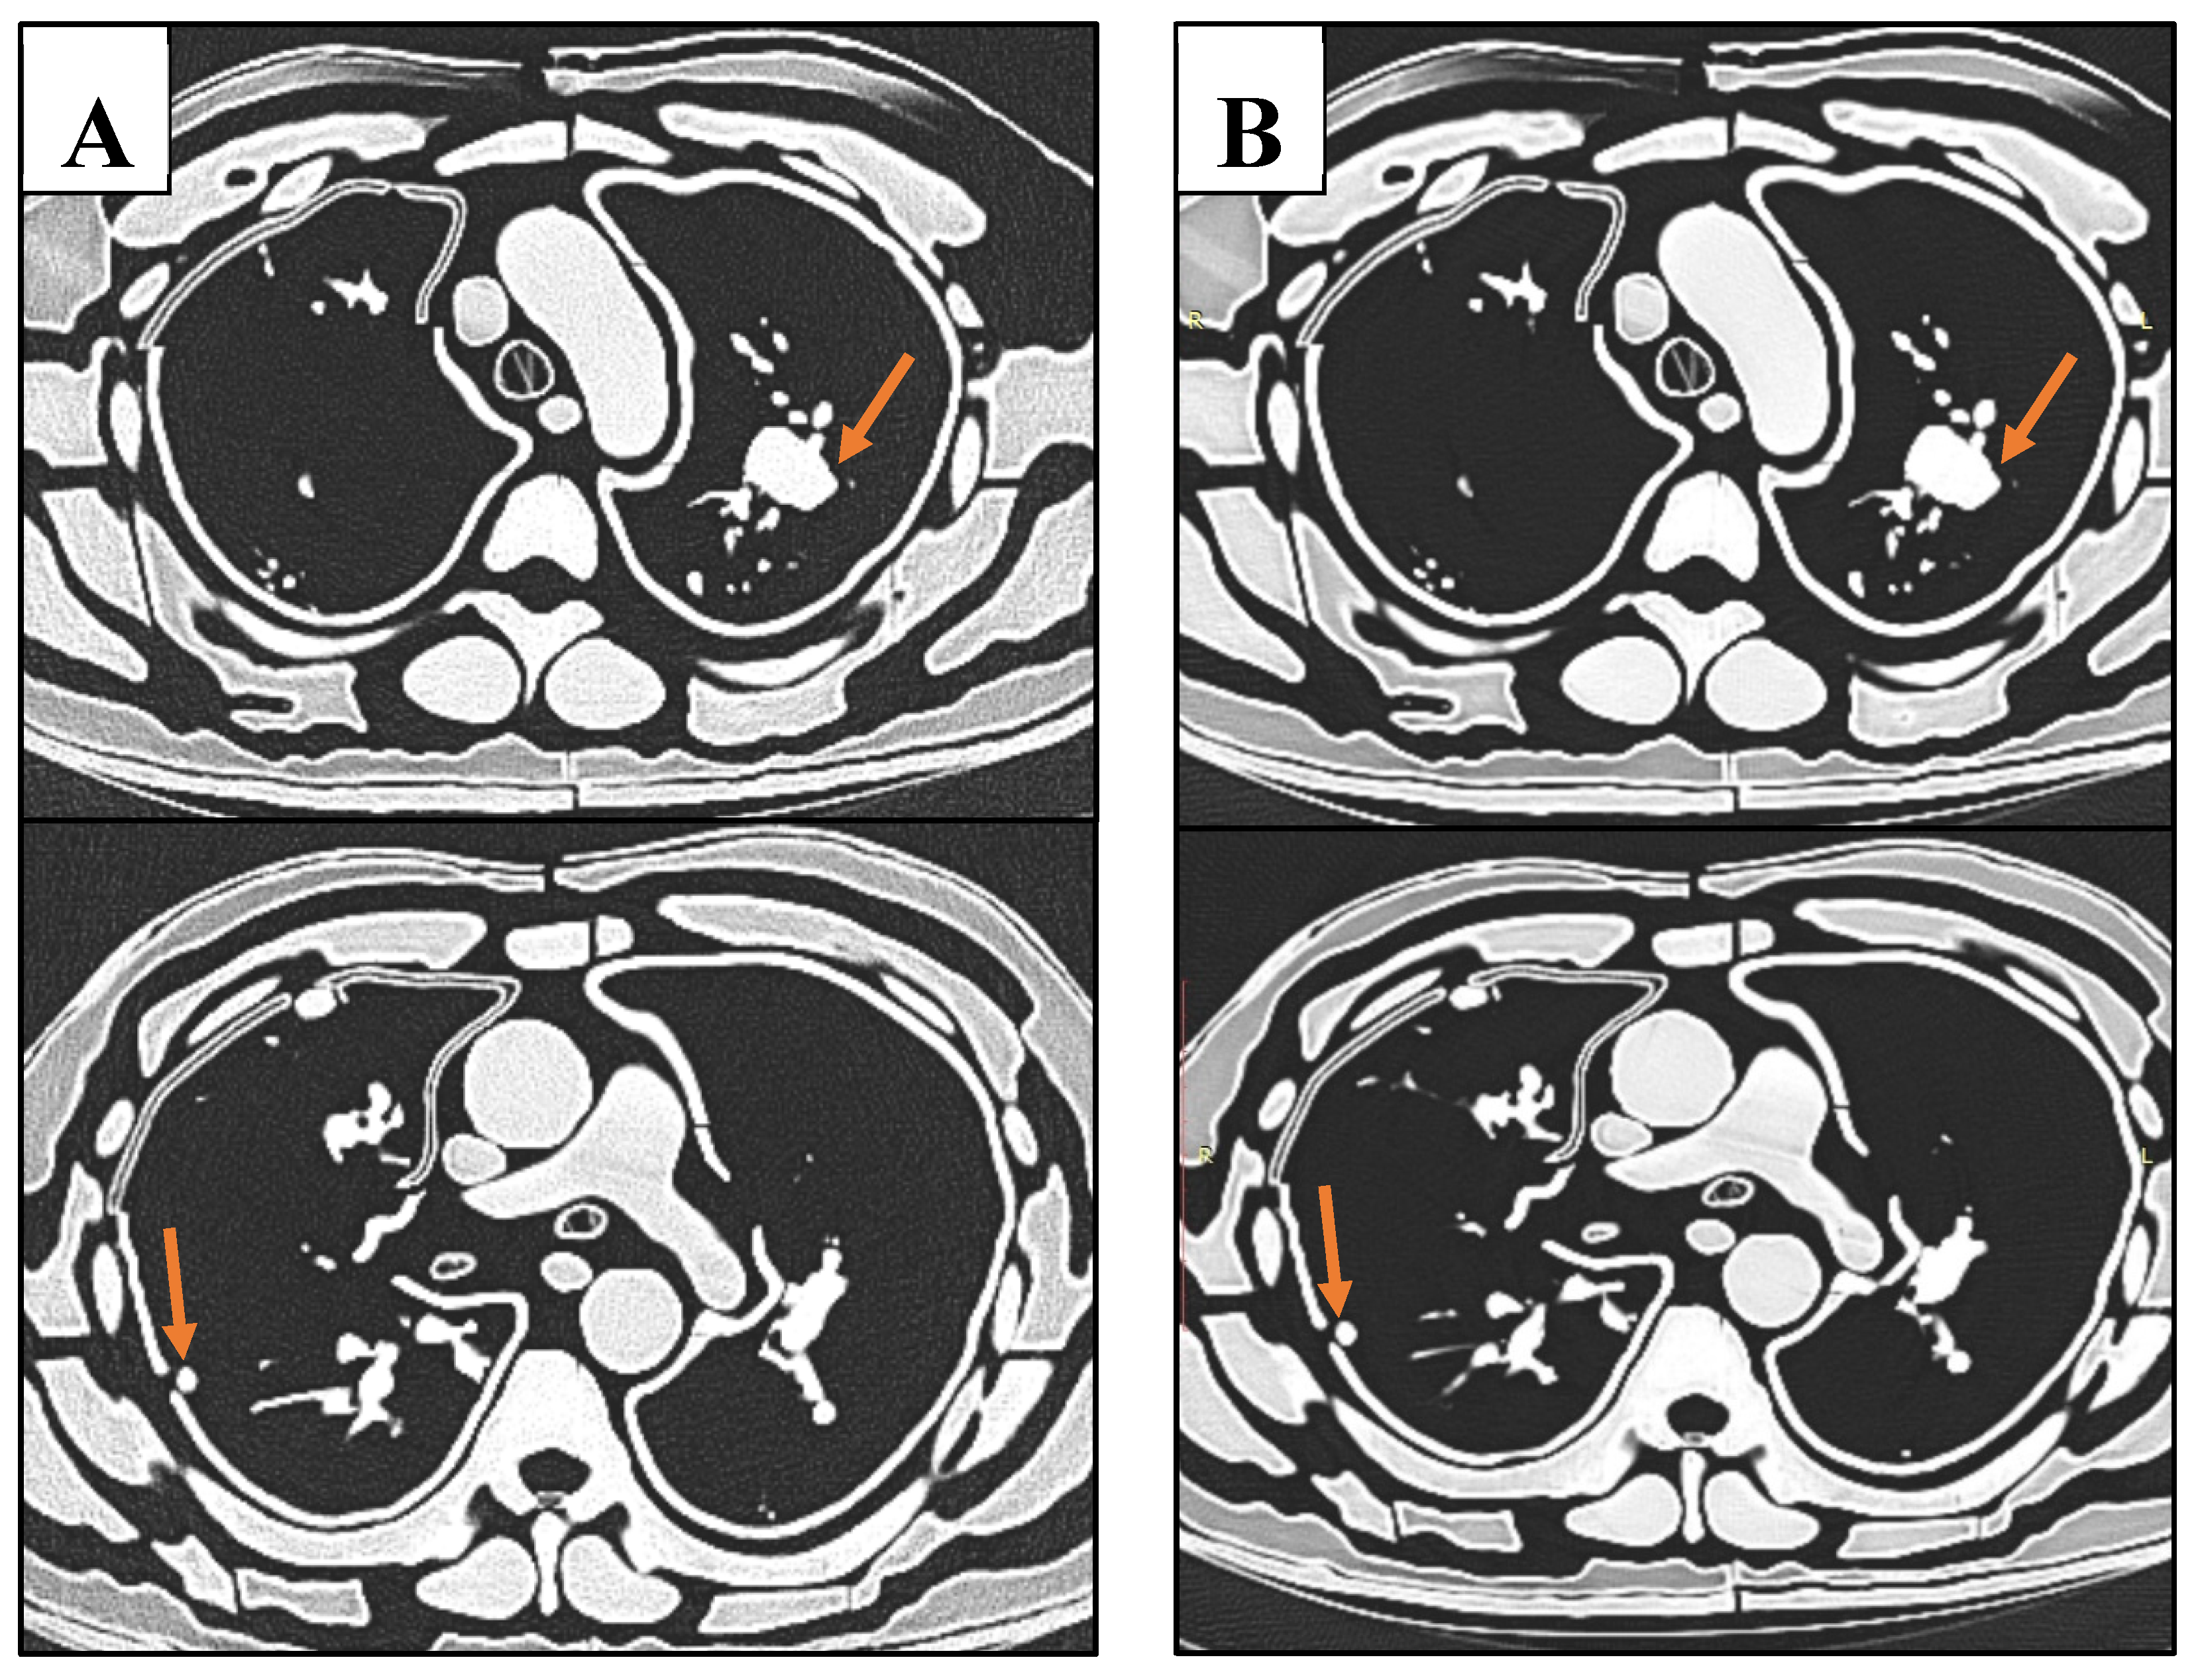
Table 1.
Printing parameters and cost of phantom.
| Model | Nozzle Temperature |
Bed Temperature |
Printing Time (Hours) | Weight (g) | Printing Cost ($AUD) |
| (°C) | (°C) | ||||
| Lung Blood Vessels | - | - | 20 | - | 183.6 |
| Bone | 215 | 60 | 220 | 1680 | 57.1 |
| Lung Nodules | 215 | 60 | 3.5 | 22 | 0.6 |
| Pulmonary Venous System | 215 | 60 | 3 | 26 | 0.7 |
| Skin | 235 | 90 | 98 | 552 | 15 |
| Oesophagus | 215 | 60 | 2.5 | 32 | 0.9 |
| Stomach | 215 | 60 | 12 | 280 | 7.6 |
| Trachea | 215 | 60 | 1.5 | 22 | 0.6 |
| Heart | 235 | 90 | 22 | 440 | 12 |
| Left Deep Back Muscle | 235 | 90 | 23 | 263 | 7.2 |
| Right Deep Back Muscle | 235 | 90 | 21.5 | 243 | 6.6 |
| Lung | 215 | 60 | 95 | 1105 | 30.1 |
| Thyroid | 215 | 60 | 1 | 15 | 0.4 |
| Stomach | 215 | 60 | 34.5 | 806 | 21.9 |
| Spleen | 215 | 60 | 24 | 530 | 14.4 |
| Pancreas | 215 | 60 | 3 | 50 | 1.4 |
| Liver | 215 | 60 | 80 | 1300 | 35.4 |
| Left Atrial Appendage | 215 | 60 | 0.5 | 8 | 0.2 |
| Diaphragm | 235 | 90 | 48 | 530 | 14.4 |
| Brachiocephalic Trunk | 215 | 60 | 1 | 5.2 | 0.1 |
| Aorta | 235 | 90 | 11.5 | 230 | 6.3 |
| Inferior Vena Cava | 235 | 90 | 4.5 | 42 | 1.1 |
| Left Brachiocephalic Vein | 235 | 90 | 1.5 | 10 | 0.3 |
| Left Common Carotid Artery | 235 | 90 | 2 | 5.3 | 0.1 |
| Left Subclavian Artery | 235 | 90 | 1.5 | 8 | 0.2 |
| Right Brachiocephalic Vein | 235 | 90 | 1 | 6.4 | 0.2 |
| Right Common Carotid Artery | 235 | 90 | 1 | 3.4 | 0.1 |
| Right Subclavian Artery | 235 | 90 | 1 | 7.3 | 0.2 |
| Superior Vena Cava | 235 | 90 | 2.5 | 16.7 | 0.5 |
| Subcutaneous Fat | 215 | 60 | 191 | 1840 | 50 |
| Muscle | 215 | 60 | 247 | 2124 | 57.8 |
| TOTAL | 1178.5hrs | ||||
| 49 days and 2.5 hrs | $527 | ||||
Table 3.
Hounsfield Units (HU) measured in different tissue types for both patient and phantom CT scans.
Table 3.
Hounsfield Units (HU) measured in different tissue types for both patient and phantom CT scans.
| Tissue | Mean/Median HU in patient | Standard HU reported in the literature | Mean/Median HU in phantom | Mean difference between phantom and patient | P value [95% CI] |
|---|---|---|---|---|---|
| Muscle | 50.6 ± 16.2 | -5 to 135 [35] | -120 ± 48.5 | -166 | p<0.001 [114, 196] |
| Fat | -112 ± 4.87 | -200 to -20 [36] | -287 ± 28.3 | -176 | 0.008 [24.4, 303] |
| Pulmonary vessels | 61.1 ± 16.5 | ~blood: 52.19 [37] | 155 ± 27.6 | 93.9 | p<0.001 [64.6, 123] |
| Airway | -970 ± 8.07 | -1000 [38] | -892 ± 57.7 | 77.7 | 0.037 [6.44, 149] |
| Lung | -853 ± 54.6 | -550 to -950 [36] | -987 ± 124 | -116 | 0.105 [-143, 35.9] |
| Heart | 35 ± 8.24 | 20-50 [39] | -81.3 ± 14.1 | -116 | p<0.001 [-131, -102] |
| Blood Vessels | 48.1 ± 9.94 | 26.52 ± 12.52 [40] | -69.7 ± 110 | -114 | 0.024 [-168, -12.7] |
| Diaphragm | 45.6 ± 32.4 | 30 to 150 [41] | -65.7 ± 93.6 | -111 | 0.066 [-232, 9.96] |
| Bone | 273 ± 87.3 | 226-3071 [35] | 77.1 ± 38.5 | -196 | p<0.001 [-283, -110] |
| Lung Nodules | 41.9 ± 28.9 | -20 to 165 [42] | 36 ± 53 | -4.59 | 0.557 [-13.5, 19.8] |
| Skin | 71 ± 14.9 | 70 | 12.5 ± 67.6 | -58.5 | 0.006 [-95.2, -17] |
Table 4.
Dose, quantitative and qualitative measurements of image quality for each protocol.
| Protocol | CTDIvol (mGy) | DLP (mGy *cm) | ED (mSv) | SNR | CNR | Radiologist Scores (1-5) | ||||
|---|---|---|---|---|---|---|---|---|---|---|
| kVp | mAs | Reader 1 | Reader 2 | Reader 3 | Median | |||||
| 100 | 352 | 11.9 | 412.7 | 5.8 | 1.23 | 85.8 | 4 | 3 | 5 | 4 |
| 180 | 6.09 | 213.1 | 2.98 | 1.03 | 72.6 | 4 | 4 | 5 | 4 | |
| 150 | 5.09 | 176.5 | 2.47 | 0.885 | 61.3 | 4 | 4 | 5 | 4 | |
| 120 | 4.10 | 142.2 | 1.99 | 0.771 | 62.3 | 4 | 4 | 5 | 4 | |
| 100 | 3.33 | 117.7 | 1.65 | 0.718 | 57.0 | 4 | 4 | 5 | 4 | |
| 80 | 2.74 | 93.6 | 1.31 | 0.661 | 50.8 | 4 | 4 | 5 | 4 | |
| 50 | 1.72 | 58.8 | 0.82 | 0.743 | 42.2 | 4 | 4 | 5 | 4 | |
| 30 | 1.04 | 35.7 | 0.50 | 0.618 | 38.2 | 4 | 3 | 5 | 4 | |
| 80 | 180 | 2.8 | 98.3 | 1.38 | 0.604 | 54.3 | 4 | 4 | 5 | 4 |
| 150 | 2.36 | 81.8 | 1.15 | 0.602 | 51.5 | 4 | 3 | 5 | 4 | |
| 120 | 1.89 | 65.9 | 0.92 | 0.567 | 45.5 | 4 | 4 | 5 | 4 | |
| 100 | 1.58 | 53.9 | 0.75 | 0.668 | 48.75 | 4 | 4 | 5 | 4 | |
| 80 | 1.26 | 42.9 | 0.60 | 0.524 | 39.4 | 4 | 4 | 5 | 4 | |
| 50 | 0.80 | 27.3 | 0.38 | 0.440 | 34.15 | 4 | 4 | 5 | 4 | |
| 30 | 0.47 | 16.1 | 0.23 | 0.347 | 26.2 | 4 | 4 | 5 | 4 | |
Disclaimer/Publisher’s Note: The statements, opinions and data contained in all publications are solely those of the individual author(s) and contributor(s) and not of MDPI and/or the editor(s). MDPI and/or the editor(s) disclaim responsibility for any injury to people or property resulting from any ideas, methods, instructions or products referred to in the content. |
© 2024 by the authors. Licensee MDPI, Basel, Switzerland. This article is an open access article distributed under the terms and conditions of the Creative Commons Attribution (CC BY) license (http://creativecommons.org/licenses/by/4.0/).
Copyright: This open access article is published under a Creative Commons CC BY 4.0 license, which permit the free download, distribution, and reuse, provided that the author and preprint are cited in any reuse.


