Submitted:
15 November 2024
Posted:
18 November 2024
You are already at the latest version
Abstract
In Bayesian statistics, prior specification has an important role in determining the quality of posterior estimates. We use expert judgment to quantify uncertain quantities and produce appropriate prior distribution. The aim of this study is to quantify the uncertainty of life insurance claims, especially on the insurer’s age, as it is the main factor determining the insurance premium. A one-day workshop was conducted to elicit expert judgment from those who have experience in accepting claims. Four experts from different insurance companies were involved in the workshop. The elicitation protocol used in this study was The Sheffield Elicitation Framework (SHELF), which produces four different statistical distributions for each expert. A linear pooling method was used to aggregate the distributions to obtain the consensus distribution among experts. The consensus distribution suggested that the majority of insurers will make a claim at the age of 54 years old.
Keywords:
Expert Judgment
; Elicitation
; Statistical Distribution
; Prior Distribution
; Life Insurance
1. Introduction
Indonesia is the fourth largest country in the world with population over 284 million, after India, China and the United States. As a developing country, Indonesia keeps improving the social welfare and reducing poverty through various effort planned by the government. One indicator of that the program works is the life expectancy and the economic growth.
According to Indonesian Statistics or Badan Pusat Statistik (BPS), in 2023 the life expectancy in Indonesia for male is 70.17 while for female is 74.18 years old respectively. The life expectancy increased 0.34% for male and 0.47% for female compared to the ones in 2022 which is a good progress. The rise of life expectancy has contributed to economic growth as people are healthier and have more workforce [1,2,3,4]. The theory is supported by the fact that as life expectancy rises economic growth second Quarter of 2024 is 5.05% higher than in the second quarter of 2023 [5]. In addition, the rise of life expectancy can also affect human capital, health investment, education, and population dynamic [6,7,8].
One element that may negatively affect life expectancy is the mortality rate. A low death rate will increase the percentage of people in their working ages, which will raise per capita income, improve life quality and enhance health [9]. Mortality is also one of main issues and trends in global health. Maternal and child mortality are in the attention of world health organisation. According to UNICEF, the maternal mortality in Indonesia is 173 per 100,000 live births which is quite low while the Under-five mortality rate is 21.3 deaths per 1,000 live births. Furthermore, the Noncommunicable Disease (NCD) is the leading cause of death worldwide, accounting for 41 million deaths annually, or 74% of all deaths worldwide (WHO, 2024). NCDs primarily consist of cardiovascular illnesses (e.g heart attacks and stroke), cancers, chronic respiratory illnesses (e.g asthma and chronic obstructive lung disease) and diabetes.
People can opt to protect their lives from such causes of death by purchasing life insurance. Due to the uncertainty of life, people are aware that, illnesses, accidents and other unanticipated causes of death could happen at any time, of which they need to be protected. The model of uncertain lifetime was pioneered by[10] and reviewed by[11]. The main goal of purchasing life insurance is to guard against the financial difficulties that could arise from the insured's untimely passing[12]. Among some factors influence life insurance premium, age is one of the most determining elements. Life insurance companies will look at the age of the prospective insurance participants to decide the insurance rate. Nevertheless, due to the uncertainty of lifetime, lifespan and other mortality risk, it is not guaranteed that younger insurance participants will submit claims within a long period of time, while older participants will submit claims more quickly. Therefore, the age of life insurance participant when making claim is uncertain.
This study aims to investigate the uncertainty of age when claiming life insurance by employing expert judgment. Expert judgment is used in this study as exact information about the claim age is limited and highly depends on the history of claim, but the future claim in unknown.
The involvement of expert in quantifying uncertainty was proposed by[13] and is crucial in decision-making when data is limited or unavailable. To obtain information, opinion, or judgment from experts about uncertain quantities can be named as elicitation. This type of collecting information has also been studied in the field of psychology. A practical guide on elicitation was primarily provided by[14] . The method of elicitation such as general-elicitation and application-specific was studied[15,16]. Furthermore, the elicited information of expert is expressed in the form of statistical distributions[17]. The general protocol of elicitation and some types of elicitation are discussed in[18,19]. In its development, there are some protocols that can be used in elicitation process. As mentioned in[20] there are at least three different protocols: Classical model [13,21], SHELF protocol[22,23], and IDEA protocol[24]. A review of these methods can be found in[25] and the strategy of applying the protocol is presented in[26].
The process of eliciting expert judgment on claim age are adapted with the mortality phenomena in Indonesia. The mortality rate is used as a basis of constructing questions in the elicitation workshop.
In connection with insurance industry in Indonesia, it is essential to study the mortality rate to investigate the potential claim that might be proposed by insured. According to the Long Form Population Census 2020 (Long Form SP2020) conducted by Statistics Indonesia (BPS) in the period 2010 to 2020, the mortality rate in Indonesia is 6.4 indicating there would be 6 – 7 deaths among 1000 individuals. This rate is moderate compared to other developing countries. When the mortality rate is classified by age group - children, adults, and the elderly - the distribution is shown in Figure 1.
As shown in the figure, the death rates for age group 0 – 14 years is 1.71 meaning that there would be 1 – 2 deaths in 1,000 individuals under 15 years old. The death rate for the second group (15 - 59) is 2.64 which indicates 2 – 3 would die in the range of productive ages. Lastly, the death rate for people aged 60 or more rises around 10 times to 26.1 compared to the prior age-groups. The number represents the mortality of elderly people is 26 – 27 among 1,000 individuals.
In addition to the age-specific death rate, it is interesting to investigate the cause of the death obtained from the similar census. According to Figure 2, non-infectious disease is the major cause of death in Indonesia which is 87.15%. The second cause is accident which is quite small in percentage of 2.82%. Infectious disease is the rare cause of mortality since the percentage is only 0.89%.
Furthermore, we are interested in the probability of death in the interval of ages which can be used to quantify age when an insured makes a claim. Based on Indonesian mortality table, the probability of death can be seen in Figure 3.
Figure 3 illustrates the probability of death across ages 20 to 80, with separate lines representing the mortality risks for males (blue line) and females (orange line). The data reveals several key patterns that reflect the differences in life expectancy and mortality rates between genders over this age range. Both the male and female probability-of-death lines exhibit a gradual increase with age, indicating that the risk of death rises as individuals get older. However, the overall probability of death for males is consistently higher than that for females across all age intervals. This aligns with general population trends where men, on average, have shorter life expectancies than women.
In the younger age ranges, the probability of death for both males and females remain relatively low and increases slowly. For males, the probability reaches 0.05 (5%) around the age of 48, while for females, it takes a slightly longer time, reaching the same probability at age 52. This suggests that, in early adulthood, the mortality risk is low for both genders, but men face a slightly higher risk than women during these years. After this point, the probability of death for both genders begin to rise more rapidly, reflecting the increasing mortality risk as people age. For men, the probability jumps to 0.25 (25%) by the age of 73, while for women, it reaches the same level at age 77. This exponential rise in death probability is typical of aging populations, where the risk of death accelerates significantly as individuals approach advanced age. The gender gap remains consistent, with men facing a higher mortality risk at every age point.
Life insurance claim will be made when an insurer passes away. Due to the uncertainty of the insurer’s death, the insurance company must be prepared whenever an insurer makes claim. This is because the uncertainty of insurer’s death leads to the uncertainty of claim time, which relates to money value based on time. As a result, insurance companies need to comprehend the probability of insurer’s mortality.
There are some ways in determining the probability of death: using the mortality table, which is the tabulation of age and some basic function the number of individual survived, the number of individuals who die in the specific age interval, and the probability of death. Some countries issue mortality table such as United States of America with its Commissioners Standard Ordinary (CSO) Mortality Table, China with its Life Insurance Mortality Table, and United Kingdom with its English Life Tables (ELT). Indonesia also released some mortality tables, such as Indonesian mortality table (IMT) I in 1993, IMT II in 1999, IMT III in 2011, and IMT IV in 2019.
Alternatively, the determination of the probability of death can also use a distributional approach. In this case, survival function based on mortality laws can be employed. Some notable mortality lawa are introduced by De-Moivre in 1729 (1-parameter formula), Gompertz in 1825 and Weibull in 1939 (2-parameter formula), and Makeham in 1860 (three-parameter and four-parameter formula). Recent studies on the use mortality distribution for life insurance based on mortality laws are conducted by [27] and [28].
Both approaches, mortality tables and mortality distribution, rely on historical data. Mortality tables utilize past data tabulated to represent the desired population mortality state, whereas mortality laws require aligned historical population data to estimate distribution parameters. In this study, the quantification of claim age uncertainty is not based on historical data as it may not be appropriate to depict the overall claim age distribution in the future. Instead, we employ expert opinions based on their experience and insight into current distribution trends which can also be used for prior distribution in the future.
2. Materials and Methods
Data was obtained through an Elicitation workshop which held on July 2024. The workshop was attended by four experts from four different insurance companies in Indonesia. The representatives of four experts are expected to represent insurance companies in Indonesia. Unfortunately, the names of the company are kept anonymously due to the request from the experts. The workshop aims at quantifying the age mean proportion of the insurer. In addition, the percentage of claim numbers based on insurer’s age was also collected.
In this study, we use elicitation method to handle subjective expert opinion. Elicitation is defined as the process of expressing expert knowledge for an uncertain quantity in the form of a probability distribution[29]. Elicitation can also be interpreted as an opportunity to express subjective opinion on a true but uncertain quantity through a probability distribution. Accordingly, the objective of elicitation is to create probability distributions that appropriately represent expert knowledge[18]. The distribution obtained from elicitation typically subjective based on expert belief, hence different experts might provide different probability distributions based on their own judgment and experience. Therefore, elicitation protocol is required to guarantee that distributions produced are scientifically valid. We utilize Sheffield Elicitation Framework (SHELF) protocol to elicit expert judgement on uncertainty in insurance claim age.
Let us suppose that there is a true but uncertain quantity (claim age). Experts will be asked for their judgment on some values to the best of their understanding and experience about . Firstly, experts need to determine the range of the uncertainty of by judging the minimum and the maximum value . It is expected that likely to happen inside the range of and unlikely to happen outside this range. Secondly, experts are requested to determine other values: lower value (L), middle value (M), and upper value (U) which are corresponding to the cumulative probabilities , dan [20]. Values need to fulfill the following probabilities:
In this case, are 25%, 50%, and 75% respectively. Next, the Cumulative Distribution Function of each quantiles will form a full CDF of . We can also derive the probability distribution function (pdf) for and estimate the parameter distribution. Let us suppose that the expert distribution have parameter , then the CDF for the first value, second value and the third value provided by expert are , respectively. The function of combining the three CDFs is as follows
The estimate of parameter is obtained by minimizing as following
The minimization process of the function is carried out numerically using the Nelder-Mead optimization method to obtain the best estimate[20]. The steps for Nelder-Mead optimisation are:
- Determine the objective function ; where , and is the number of parameter.
- Evaluate the vertex , for . The collection of is called simplex ().
- Sort the vertices obtained from Step 2 in ascending order, .
- Compute the centroid of the simplex, , by excluding vertex
- Compute the new vertex, , by considering the centroid and a reflection factor as follows
- Replace the worst vertex with the new vertex .
- Repeat the process until the standard deviation of < tolerance value.
- Statistical Distribution for quantifying expert judgment
Quantifying expert judgment in elicitation often involves fitting statistical distributions that capture the uncertainty and subjective opinions expressed by experts. Some of statistical distribution that can be used to quantifiy expert opinions are Beta distribution, Gamma Distribution, and Normal distribution.
- Beta distribution
Beta distribution is ideal for modeling probabilities or proportions, as it is defined on the interval [0, 1]. It can take various shapes (e.g., uniform, skewed, U-shaped), making it versatile for representing expert beliefs about probabilities. The distribution has two parameters, α dan β, which are scale and shape parameters respectively. The probability density function of the Beta distribution is
and zero elsewhere. is the gamma function which can written as
or in the factorial form . The use of Beta Distribution in eliciting expert opinions had been assessed by [30] and how to asses with this distribution is discussed in [31].
- 2.
- Gamma distribution
The Gamma distribution is particularly well-suited for modelling insurance claims due to its flexibility in representing positively skewed data. This characteristic is essential in the insurance field, where claim amounts often display significant variability and skewness. The pdf of Gamma distribution is expressed as
and zero for elsewhere, where is the shape parameter and is the rate parameter.
The ability of the Gamma distribution to capture a wide range of shapes—from exponential-like for to more bell-shaped as increases—allows it to align with expert opinions that express various degrees of uncertainty about potential claim age.
Sometimes it is possible that the distribution of expert is the mirror of Gamma distributions, meaning that the shape of the distribution is on the opposite shape. Technically, if , then has a mirror Gamma with pdf
- 3.
- Normal distribution
In certain situations, where the claim judgment is reasonably symmetrical and devoid of notable skewness or heavy tails, the normal distribution may be appropriate for fitting insurance claims.
If is the age where an insurer made claim with mean and varians , the pdf of normal distribution can be expressed as
and zero elsewhere.
In the case, where the ideal simmetry of X does not fullfill, the skew normal distribution can be used as an alternative. The skew normal distribution serves as an effective model to capture the asymmetry typically observed in claim amounts, where a higher frequency of smaller claims is accompanied by a gradual tail of larger, less common claims. The pdf for a skew normal distribution is given by:
where is the location parameter, is the scale parameter, and is the shape parameter. Here, represents the probability densty function of the standard normal distribution, while denotes its cumulative distribution function.
- Linear Pooling: A Synthesis of Expert Judgments
Linear pooling is a method used to aggregate the judgments or probability distributions of multiple experts, and it is widely applied in decision analysis, risk assessment, and expert elicitation. A foundational critique and overview of various methods for combining probability distributions, including linear pooling can be found in[32]. They argue that linear pooling, in its simplest form, involves the weighted average of the probability density functions (PDFs) provided by different experts. In addition, linear pooling is still superior compare with other method[33].
The idea is to combine these individual distributions in a manner that reflects the collective judgment while acknowledging the differences in expert opinions. The method assumes that each expert’s judgment represents a valid piece of information and that a consensus distribution can be constructed by averaging these individual assessments.
In contrast, provide a more statistical perspective on linear pooling, particularly in the context of elicitation is provided[17]. The emphasize is that linear pooling is not just an averaging technique but also a way to propagate uncertainty through the aggregation process. By combining expert opinions via linear pooling, the resulting distribution serves as a coherent summary of the experts’ beliefs about a particular uncertain quantity, integrating both the central tendencies and uncertainties reflected in the individual distributions. The authors note that the pooled distribution can be particularly valuable in situations where individual data may be sparse or unreliable, but expert judgment provides crucial information to guide decision-making.
Assume we have experts providing probability distributions over the same domain . The combined distribution using the linear pooling is defined as
where is the probability distribution function given by the th expert and is the weight allocate to the th expert.
3. Results
The quantification of age distribution when claiming life insurance was performed through an elicitation workshop. The elicitation protocol used in the workshop was Sheffield Elicitation Framework (SHELF). A one-day elicitation workshop was conducted on July 13, 2024, bringing together four experts from various insurance companies in Indonesia. The experts involved in the workshop can be a manager or a data analyst who have great experiences in handling life insurance claims. The objective of the workshop was to collect expert belief regarding to ages when insured persons in their company make claim due to any causes. To quantify the expert’s belief, they are asked to express their level of uncertainty in the form of probability. Due to the sensitive nature of the information provided by experts, the identities of both the experts and their respective insurance companies are made anonymous. Therefore, in the rest of the paper we will call the four experts as Expert A, B, C, and D.
Four experts A, B, C, and D are required to give their judgment based on their experiences on the average age the insured making claim in the cumulative percentages. As mentioned in methodology section, three quantiles are recorded from the judgment of experts. Previously, experts are asked to provide the minimum and the maximum ages of insured person in their companies as the lower and upper values as the range of age uncertainty. The elicited values of claim age in the form of quantiles are then fitted to a statistical distribution. Each expert will have their own statistical distribution that is best fitted to their judgment. The cumulative distribution function and the probability density function of each expert are presented in Figure 4 and Figure 5 respectively.
Figure 4 shows the cumulative distribution function (CDF) of the expert judgment on average age of insured when making insurance claim. The CDF produced from Expert A’s judgment is quite steep. The CDF indicates that 25% of claims are expected to occur by the age of 45, 50% of claims will be made by age 50, and 75% of claims will be made by age 52. In addition, the range of insured ages in company A are between 0 to 90 years old. From this judgment, we infer that the average age when claims are made by insures in Expert A company are quite narrow in its interval which is between 45 and 52 years old even though the insured’s ages interval are wide.
Meanwhile, the CDF of Expert B is more sloping than Expert A. Expert B states, 25% of claims are anticipated to happen by the age of 40, 50% of claims will be made by the age of 50, and 75% of claims will be made by the age of 60. Additionally, the range of insured age in Company B is between 1 to 80 years. Based on this CDF, we infer that the average age of claim begins when someone reach the age of 40 and will increase in the number when reaching 50 years old. Many insured making claim when the age of 60, which is relevant to the mortality rate in Indonesia.
Given the experience of expert C, the CDF shows that 25% of claims are made when insured age reach 47 years old. Furthermore, 50% of claims will be made when the insured age is 58, and 75% of claims will be made by the age of 65. In addition, the CDF shows that the youngest insured is newborn babies, and the oldest insured is 78 years old. These age claim trends are quite longer compared to Company B, by the quantiles move around 5 to 8 years older.
Finally, the CDF for expert D illustrates that 25% of claims are expected to occur when insured in company D reach 35.5 years old. 50% of claims would be made by the age of 43.5 years old, and 75% of claims will be made by 53.5 years old. The age of insured in Company D are between 1 to 70 years old. The feature of this claims is relatively similar with Company B, even though it is 3.5 year older.
From the CDFs in Figure 4, we can obtain the probability density function for each expert to know what type of statistical distribution fitted to each expert. Although there are some possible distributions that can be fitted, we present the best fit model for each expert.
Figure 5 describes the probability density function of the average age of insured when claiming their insurances for four different experts. According to Figure 5, the distribution fitted for judgment given by Expert A is a Skew Normal distribution with mode 55 years old. It means that the majority of insured in company A will make claims at the age of 55 years old. The 95% confidence interval of the distribution is [42, 55], which implies that the insured will make a claim in the interval between the 42 to 55 years old. In addition, it is unlikely that the insured will make a claim before 25 years old or after 60 years old.
The distribution for Expert B is normal with mean 50 and standard deviation 14.8, indicating the average claim of the insured in Company B is when they are 50-year-old. Expert B beliefs with 95% degree of confidence that insured will make claim on the age of 32 – 68 years old. On the other hand, the distribution elicited for Expert C is Mirror Gamma (26.7, 0.115) with mode 64 years old, indicating that the majority of claim will be taken on that age. Moreover, Expert C has a 95% confidence that claims will be proposed by insured when their ages are between 36 and 70 years old. Lastly, Expert D has the similar distribution with Expert A but with different parameters and opposite skewness. The distribution for Expert D is right skew while Expert A is left skew, meaning that Expert D belief that the probability of claim will be proposed mostly by younger ages. As we can see in Figure 2, most claim is believed to be taken by people aged 38 years old. Furthermore, with 95% confidence, Expert D beliefs that claim will be proposed by insured on age between 30 and 64 years old.
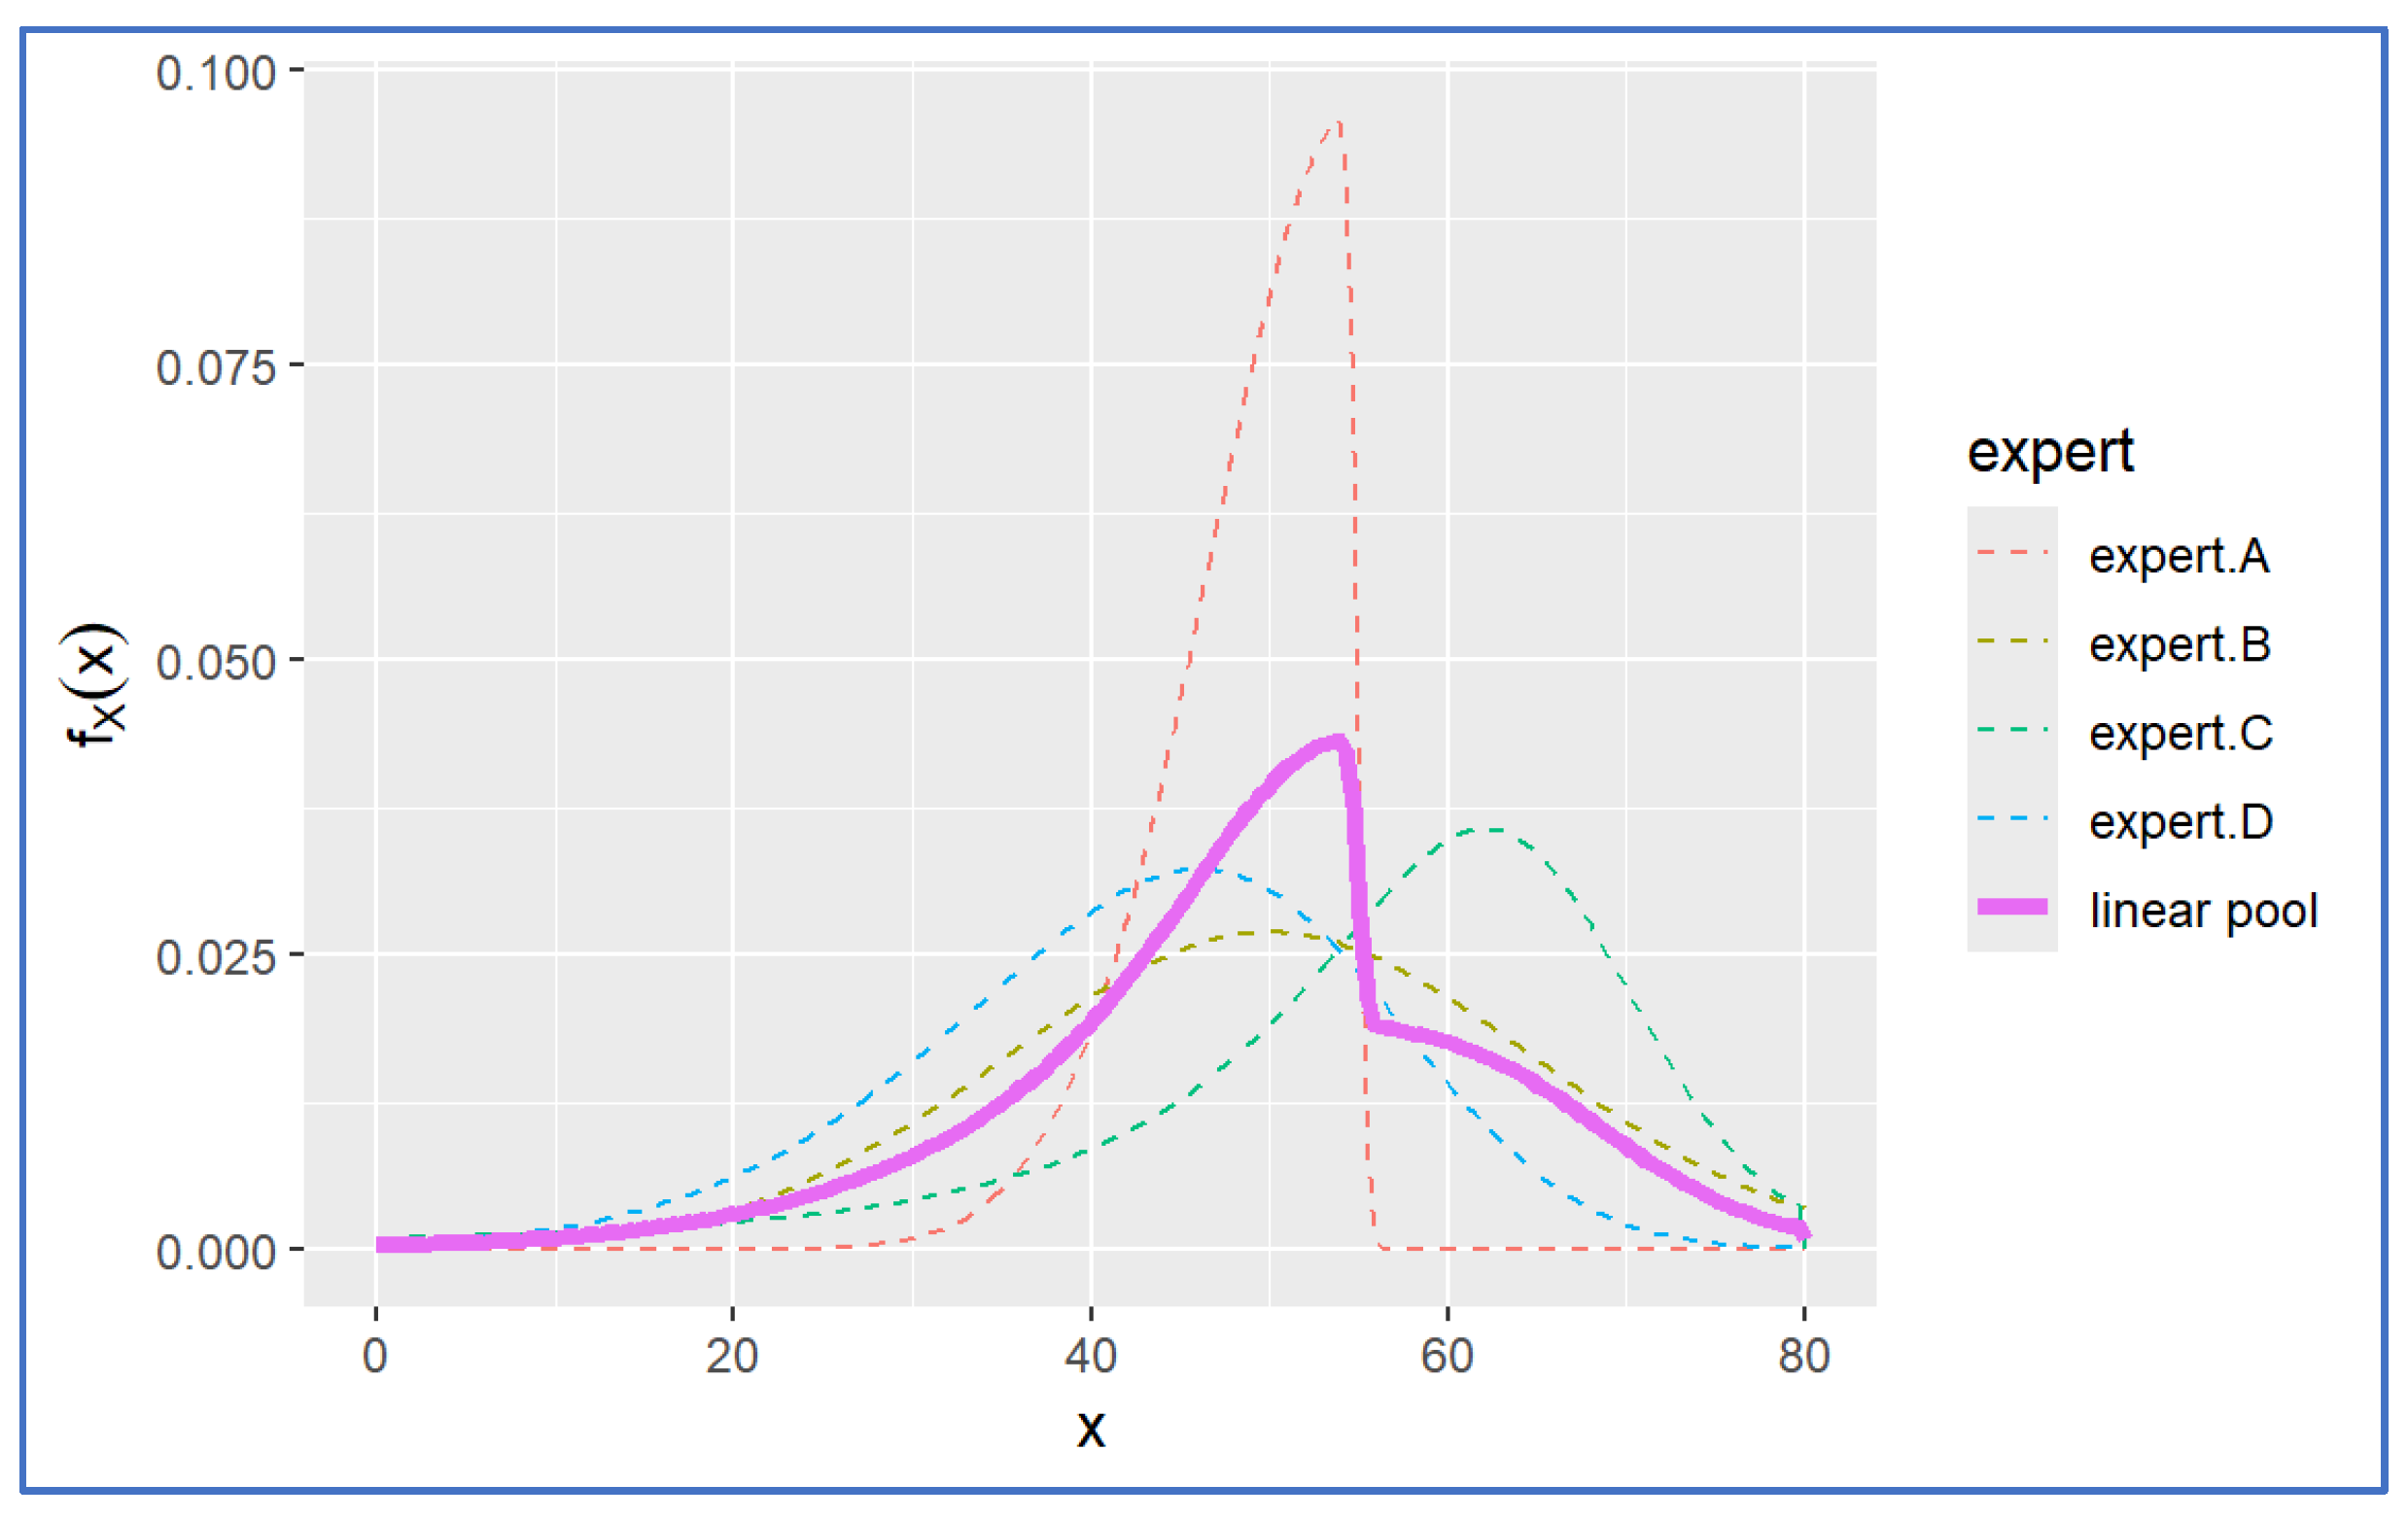
The difference distribution between experts is normal since their experiences on handling life insurance claim are differ between insurance companies which is really depends on the behaviour of insured when making claims. To handle the differences of expert distribution, we employ linear pooling to achieve consensus among distributions. The consensus distribution obtained by linear pooling is presented in Figure 6.
Figure 6 shows consensus distribution of aggregating four distinct expert distributions using linear pooling. The peak of the distribution is on average the age of 54 years old with the density value 0.0438. This means that by consensus of four experts, the life insurance claim in Indonesia will be conducted mostly by people which age 54 years old. The consensus distribution is likely to be much influenced by the distribution of Expert A as it tends to have left skew and sharp top shape. The density of 0.025 is reached when insured aged 42 and 55 years old, indicating these ages have high density.
4. Discussion
This study investigate uncertainty on average age of people claiming their insurance using expert judgment. This average age of claim is connected to the mortality rate in Indonesia. The consensus distribution indicates that insured people will make claim mostly on age 54 years old. It is relevant to the probability of Indonesian people aged 54 will die is around 0.05. Even though this probability is small compare with aged 60 or more, the consensus distribution suggests that people with aged 54 have higher risk in mortality due to their activities which might be vulnerable to suffer from disease or accident. People with age 60 or more may claim their insurance but less in probability compared to age 54. Younger people certainly have less probability in claiming their insurance until their age of 35. These results are valuable especially for insurance companies in Indonesia to create policy and prepare strategy in life insurance regarding to the average age of insured claims.
Author Contributions
All authors contributed to concept, research questions, methodology, data collection via elicitation workshop, and writing of the paper. All authors read and approved the final manuscript.
Funding
This research was funded by UNIVERSITAS PADJADJARAN, grant number 1693/UN6.3.1/PT.00/2024 and The APC was funded by UNIVERSITAS PADJADJARAN.
Data Availability Statement
The data supporting the findings of this study are available from the corresponding author upon reasonable request.
Acknowledgments
The author expresses gratitude to all researchers who worked on this project, as well as to the experts involved in the Elicitation Wotkshop who were coming from Indonesian insurance firms, and to Universitas Padjadjaran for providing the Senior Lecturer Acceleration Grant or Riset Percepatan Lektor Kepala (RPLK) grant.
Conflicts of Interest
The authors declare no conflicts of interest.
References
- Acemoglu, D.; Johnson, S. Disease and Development: The Effect of Life Expectancy on Economic Growth. Journal of Political Economy 2007, 115, 925–985. [Google Scholar] [CrossRef]
- Bloom, D. E.; Canning, D.; Sevilla, J. The Effect of Health on Economic Growth: A Production Function Approach. World Development 2004, 32, 1–13. [Google Scholar] [CrossRef]
- Cervellati, M.; Sunde, U. Life Expectancy and Economic Growth: The Role of the Demographic Transition. Journal of Economic Growth 2011, 16, 99–133. [Google Scholar] [CrossRef]
- Zhang, J.; Zhang, J. The Effect of Life Expectancy on Fertility, Saving, Schooling and Economic Growth: Theory and Evidence. The Scandinavian Journal of Economics 2005, 107, 45–66. [Google Scholar] [CrossRef]
- BPS, B. Indonesia Economic Growth Q3-2024; 82/11/Th. XXVII, 5 November 2024; Indonesian Statistics (BPS): Jakarta, 2024. [Google Scholar]
- Cervellati, M.; Sunde, U. The Effect of Life Expectancy on Education and Population Dynamics. Empirical Economics 2015, 48, 1445–1478. [Google Scholar] [CrossRef]
- Hansen, C. W. Life Expectancy and Human Capital: Evidence from the International Epidemiological Transition. Journal of Health Economics 2013, 32, 1142–1152. [Google Scholar] [CrossRef]
- Oster, E.; Shoulson, I.; Dorsey, E. R. Limited Life Expectancy, Human Capital and Health Investments. American Economic Review 2013, 103, 1977–2002. [Google Scholar] [CrossRef]
- Bloom, D. E.; Canning, D. The Health and Wealth of Nations. Science 2000, 287, 1207–1209. [Google Scholar] [CrossRef]
- Yaari, M. E. Uncertain Lifetime, Life Insurance, and the Theory of the Consumer. The Review of Economic Studies 1965, 32, 137. [Google Scholar] [CrossRef]
- Leung, S. F. Uncertain Lifetime, The Theory of the Consumer, and the Life Cycle Hypothesis. Econometrica 1994, 62, 1233–1239. [Google Scholar]
- Charupat, N.; Huang, H.; Milevsky, M. A. Strategic Financial Planning over the Lifecycle: A Conceptual Approach to Personal Risk Management, 1st ed.; Cambridge University Press, 2012. [CrossRef]
- Cooke, R. Experts in Uncertainty: Opinion and Subjective Probability in Science; Oxford University Press, USA, 1991.
- Meyer, M. A.; Booker, J. M. Eliciting and Analyzing Expert Judgment: A Practical Guide. 1987. [CrossRef]
- O’Hagan, A. Eliciting Expert Beliefs in Substantial Practical Applications. The Statistician 1998, 47, 21–35. [Google Scholar] [CrossRef]
- Kadane, J. B.; Wolfson, L. J. Experiences in Elicitation. The Statistician 1998, 47, 3–19. [Google Scholar] [CrossRef]
- Garthwaite, P. H.; Kadane, J. B.; O’Hagan, A. Statistical Methods for Eliciting Probability Distributions. Journal of the American Statistical Association 2005, 100, 680–700. [Google Scholar] [CrossRef]
- O’Hagan, A.; Buck, C. E.; Daneshkhah, A.; Eiser, J. R.; Garthwaite, P. H.; Jenkinson, D. J.; Oakley, J. E.; Rakow, T. Uncertain Judgements: Eliciting Experts’ Probabilities. 2006. [CrossRef]
- Ayyub, B. M. Elicitation of Expert Opinions for Uncertainty and Risks; CRC Press LCC: Washington DC, 2001. [Google Scholar]
- Handoko, B. Sensitivity Analysis and Its Role in Expert Judgment, The University of Sheffield, Sheffield, 2022. https://etheses.whiterose.ac.uk/31329/.
- Hanea, A. M.; Nane, G. F. An In-Depth Perspective on the Classical Model. Expert Judgement in Risk and Decision Analysis 2021, 225–256. [Google Scholar]
- Gosling, J. P. SHELF: The Sheffield Elicitation Framework. Elicitation: The science and art of structuring judgement.
- Oakley, J.; O’Hagan, A. SHELF: The Sheffield Elicitation Framework (Version 2.0). Sheffield, UK: School of Mathematics and Statistics, University of Sheffield.
- Hemming, V.; Burgman, M. A.; Hanea, A. M.; McBride, M. F.; Wintle, B. C. A Practical Guide to Structured Expert Elicitation Using the IDEA Protocol. Methods in Ecology and Evolution 2018, 9, 169–180. [Google Scholar] [CrossRef]
- Falconer, J. R.; Frank, E.; Polaschek, D. L. L.; Joshi, C. Methods for Eliciting Informative Prior Distributions: A Critical Review. Decision Analysis 2022, 19, 189–204. [Google Scholar] [CrossRef]
- Catenacci, M.; Bosetti, V.; Fiorese, G.; Veredolini, E. Innovation under Uncertainty: The Future of Carbon-Free Energy Technologies; Edward Elgar Publishing, 2015. [CrossRef]
- Muzaki, T. R.; Siswanah, E.; Miasary, S. D. Calculation of Tabarru Funds Using Makeham’s Mortalita Law and Gompertz’s Mortalita Law Using the Cost Of Insurance Method. J. Nat. Scien. & Math. Res. 2020, 6, 38–42. [Google Scholar] [CrossRef]
- Prionggo, E. A.; Pratama, M. N.; Nl, A.; Indrayatna, F. Estimation of Prospective Benefit Reserve Based on Gross Premium Valuation Method Using Indonesian Mortality Table IV and De-Moivre Assumptions. ENTHUSIASTIC 2022, 56–67. [Google Scholar] [CrossRef]
- O’Hagan, A. Expert Knowledge Elicitation: Subjective but Scientific. The American Statistician 2019, 73 (Suppl. S1), 69–81. [Google Scholar] [CrossRef]
- Chaloner, K. M.; Duncan, G. T. Assessment of a Beta Prior Distribution: PM Elicitation. The Statistician 1983, 32, 174. [Google Scholar] [CrossRef]
- Moala, F. A.; Penha, D. L. Elicitation Methods for Beta Prior Distribution. 2016, 34, 49–62. [Google Scholar]
- Genest, C.; Zidek, J. V. Combining Probability Distributions: A Critique and an Annotated Bibliography. Statistical Science 1986, 1, 114–135. [Google Scholar] [CrossRef]
- Bolger, D.; Houlding, B. Deriving the Probability of a Linear Opinion Pooling Method Being Superior to a Set of Alternatives. Reliability Engineering & System Safety 2017, 158, 41–49. [Google Scholar] [CrossRef]
Figure 1.
Age-Specific Death Rate in Indonesia.
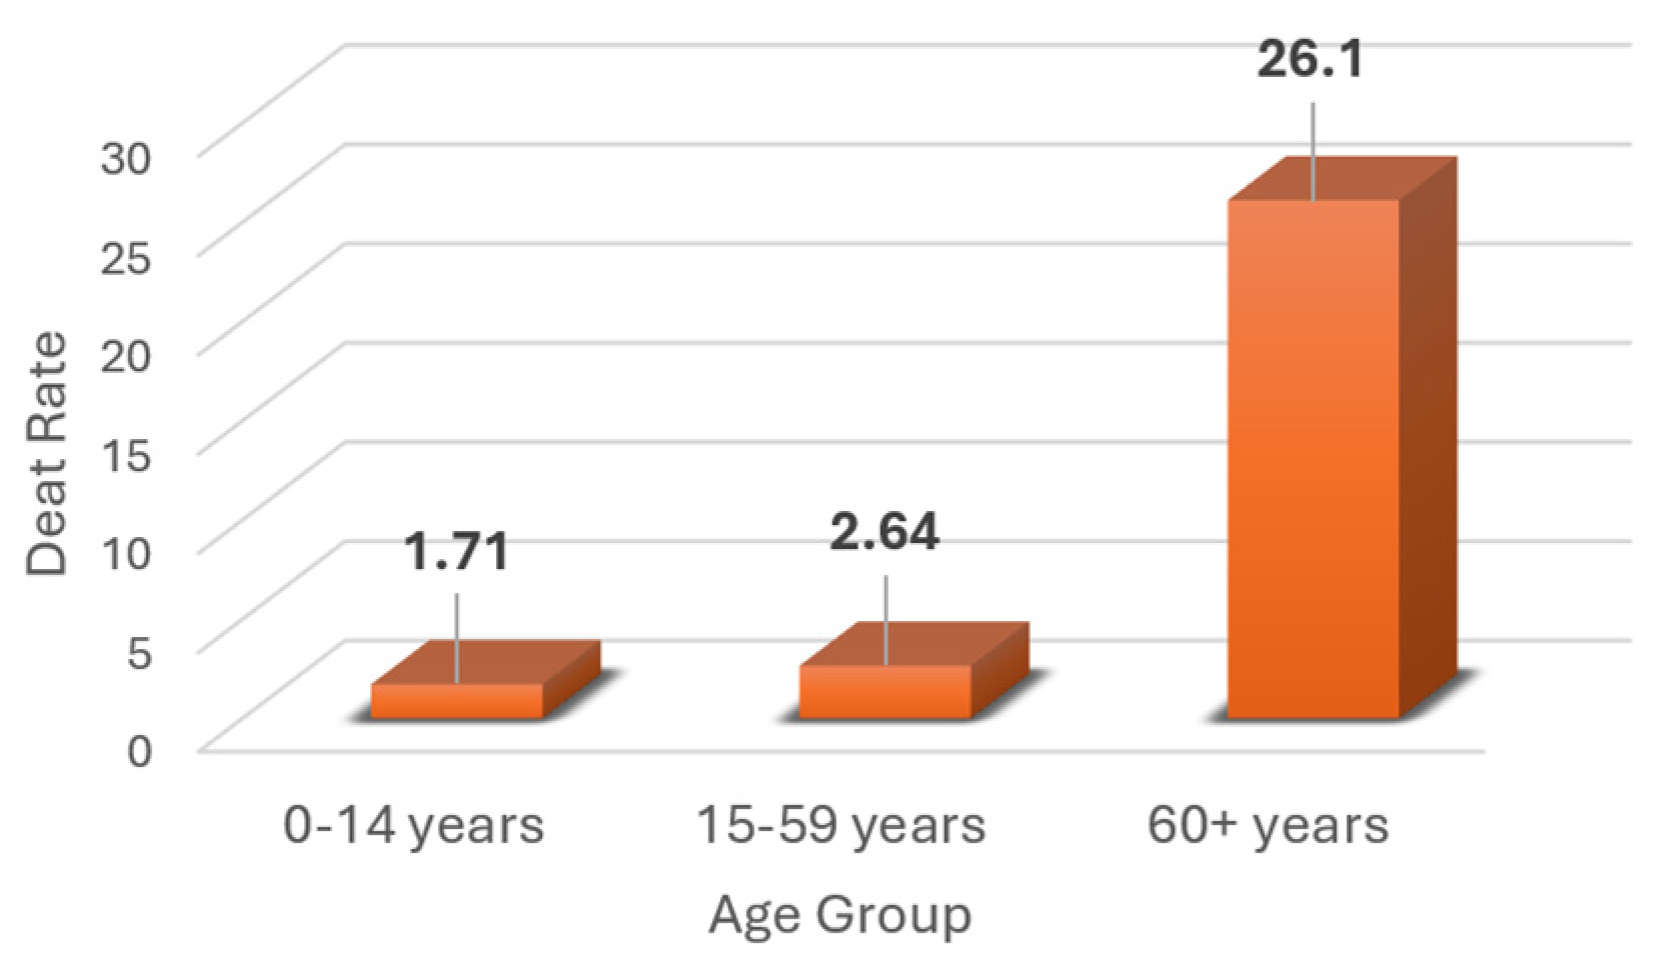
Figure 2.
The cause of death for Indonesian people from 2010 to 2020.
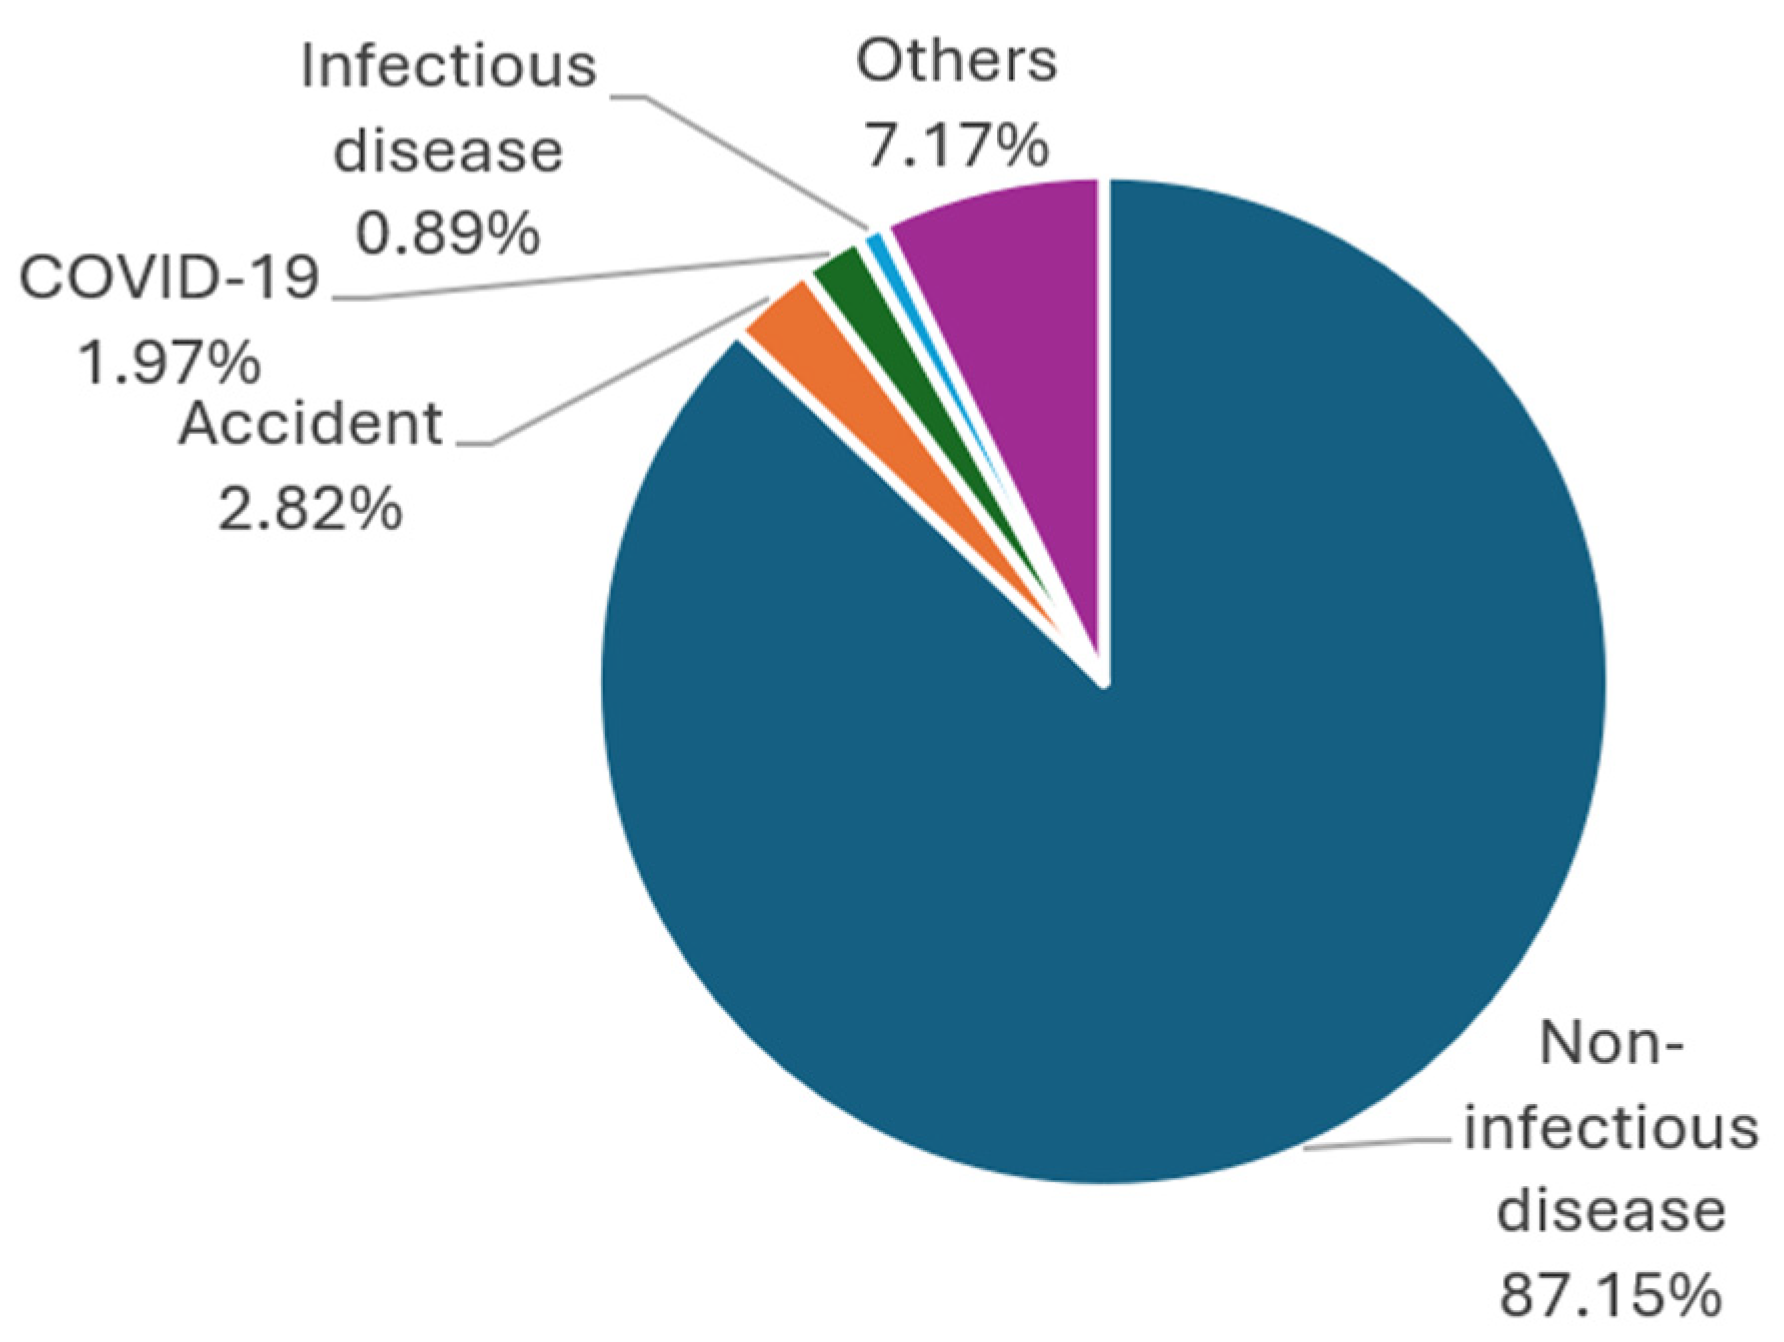
Figure 3.
The probability of death for male and female based on age in the interval between 20 – 80 years.
Figure 3.
The probability of death for male and female based on age in the interval between 20 – 80 years.
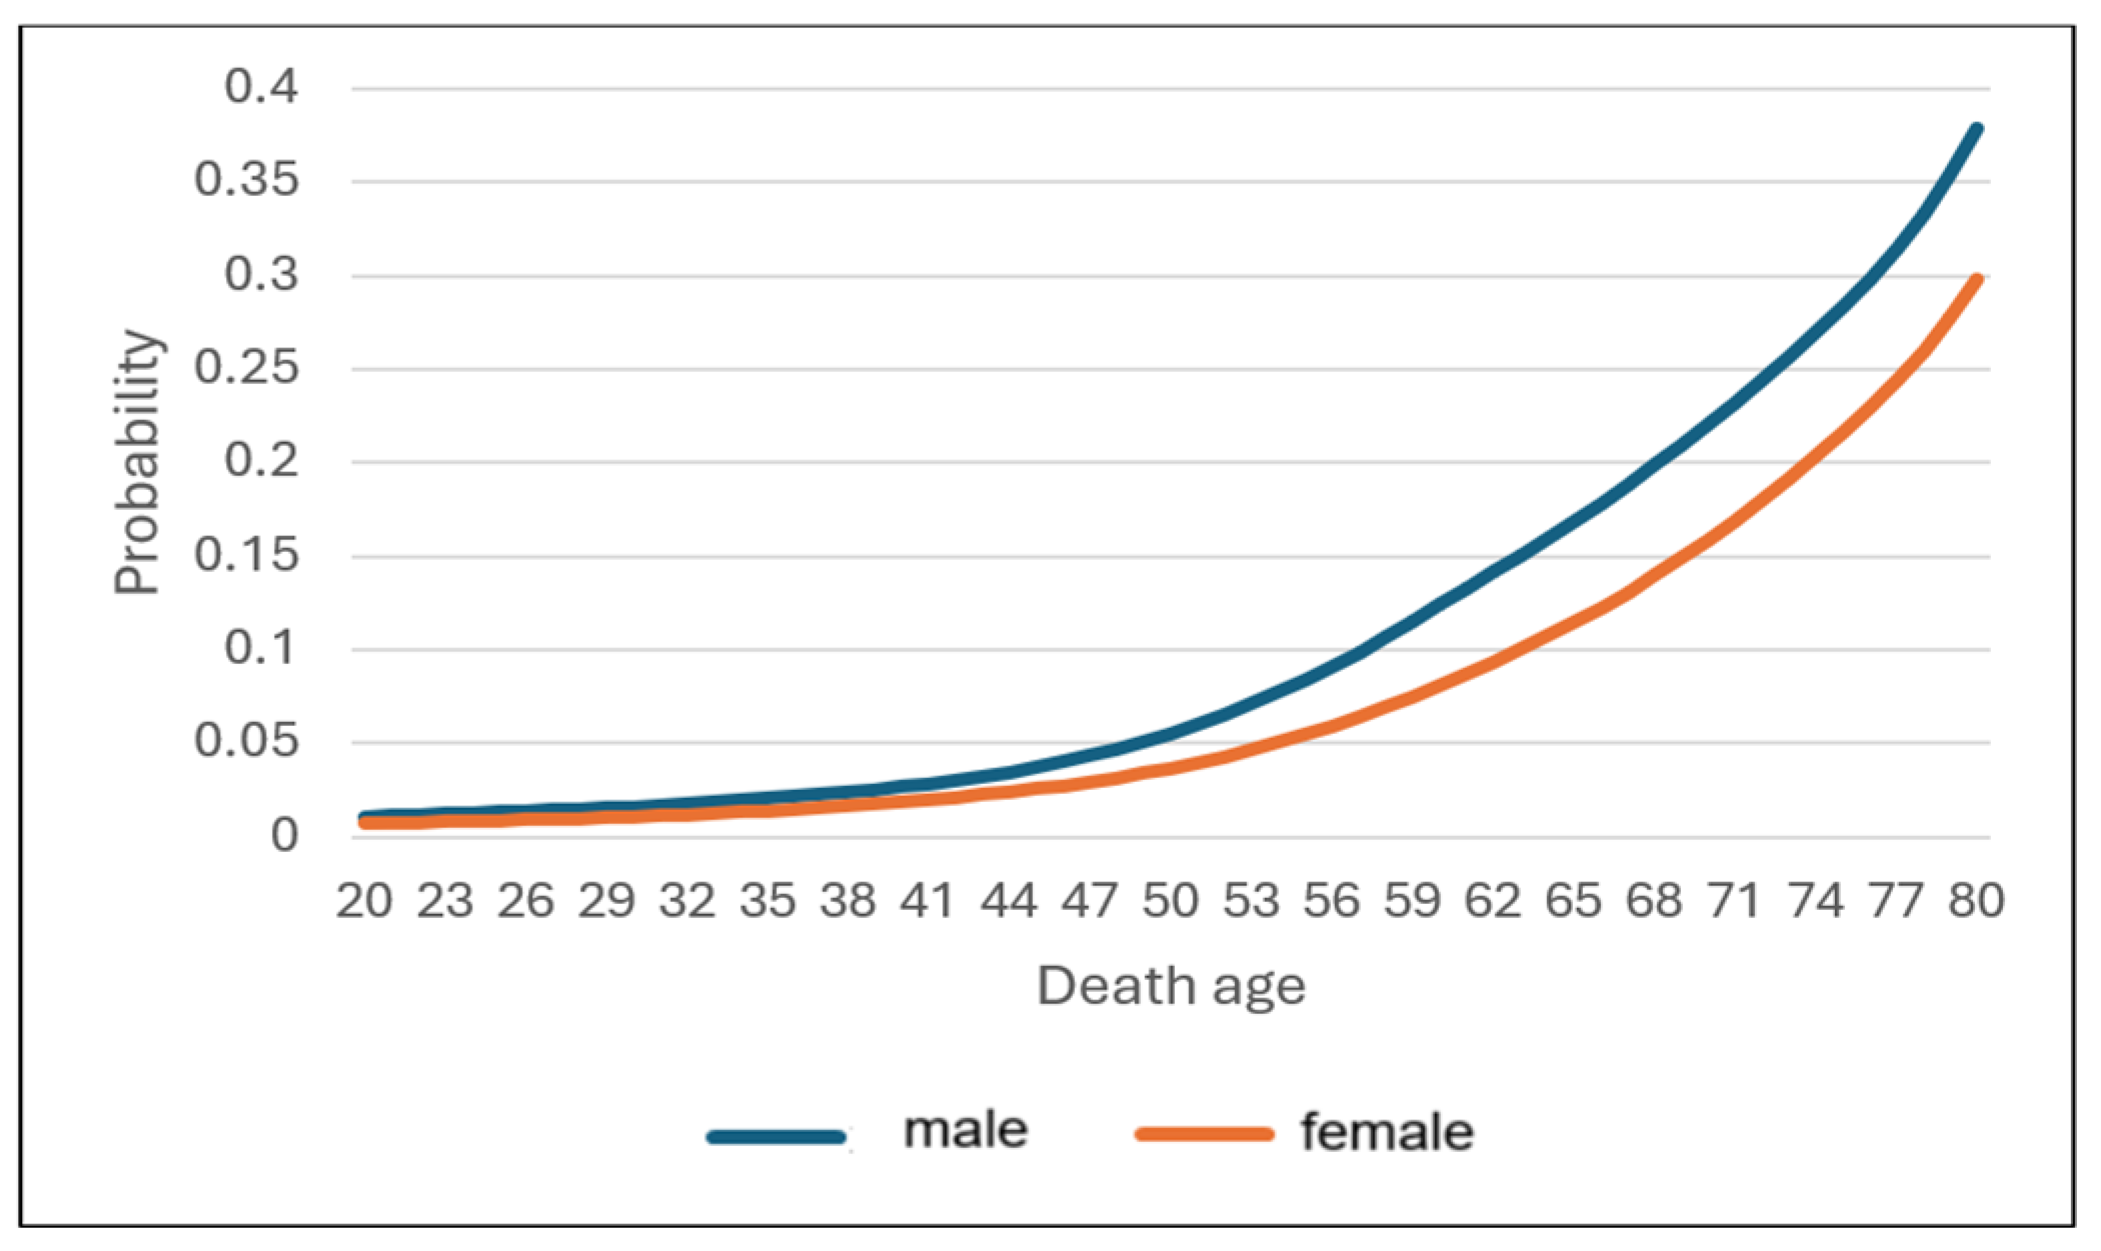
Figure 4.
Fitted cumulative distribution function of insured average ages when making claim based on different expert judgments. Figure 4a–d represent CDFs for experts A, B, C, and D respectively.
Figure 4.
Fitted cumulative distribution function of insured average ages when making claim based on different expert judgments. Figure 4a–d represent CDFs for experts A, B, C, and D respectively.
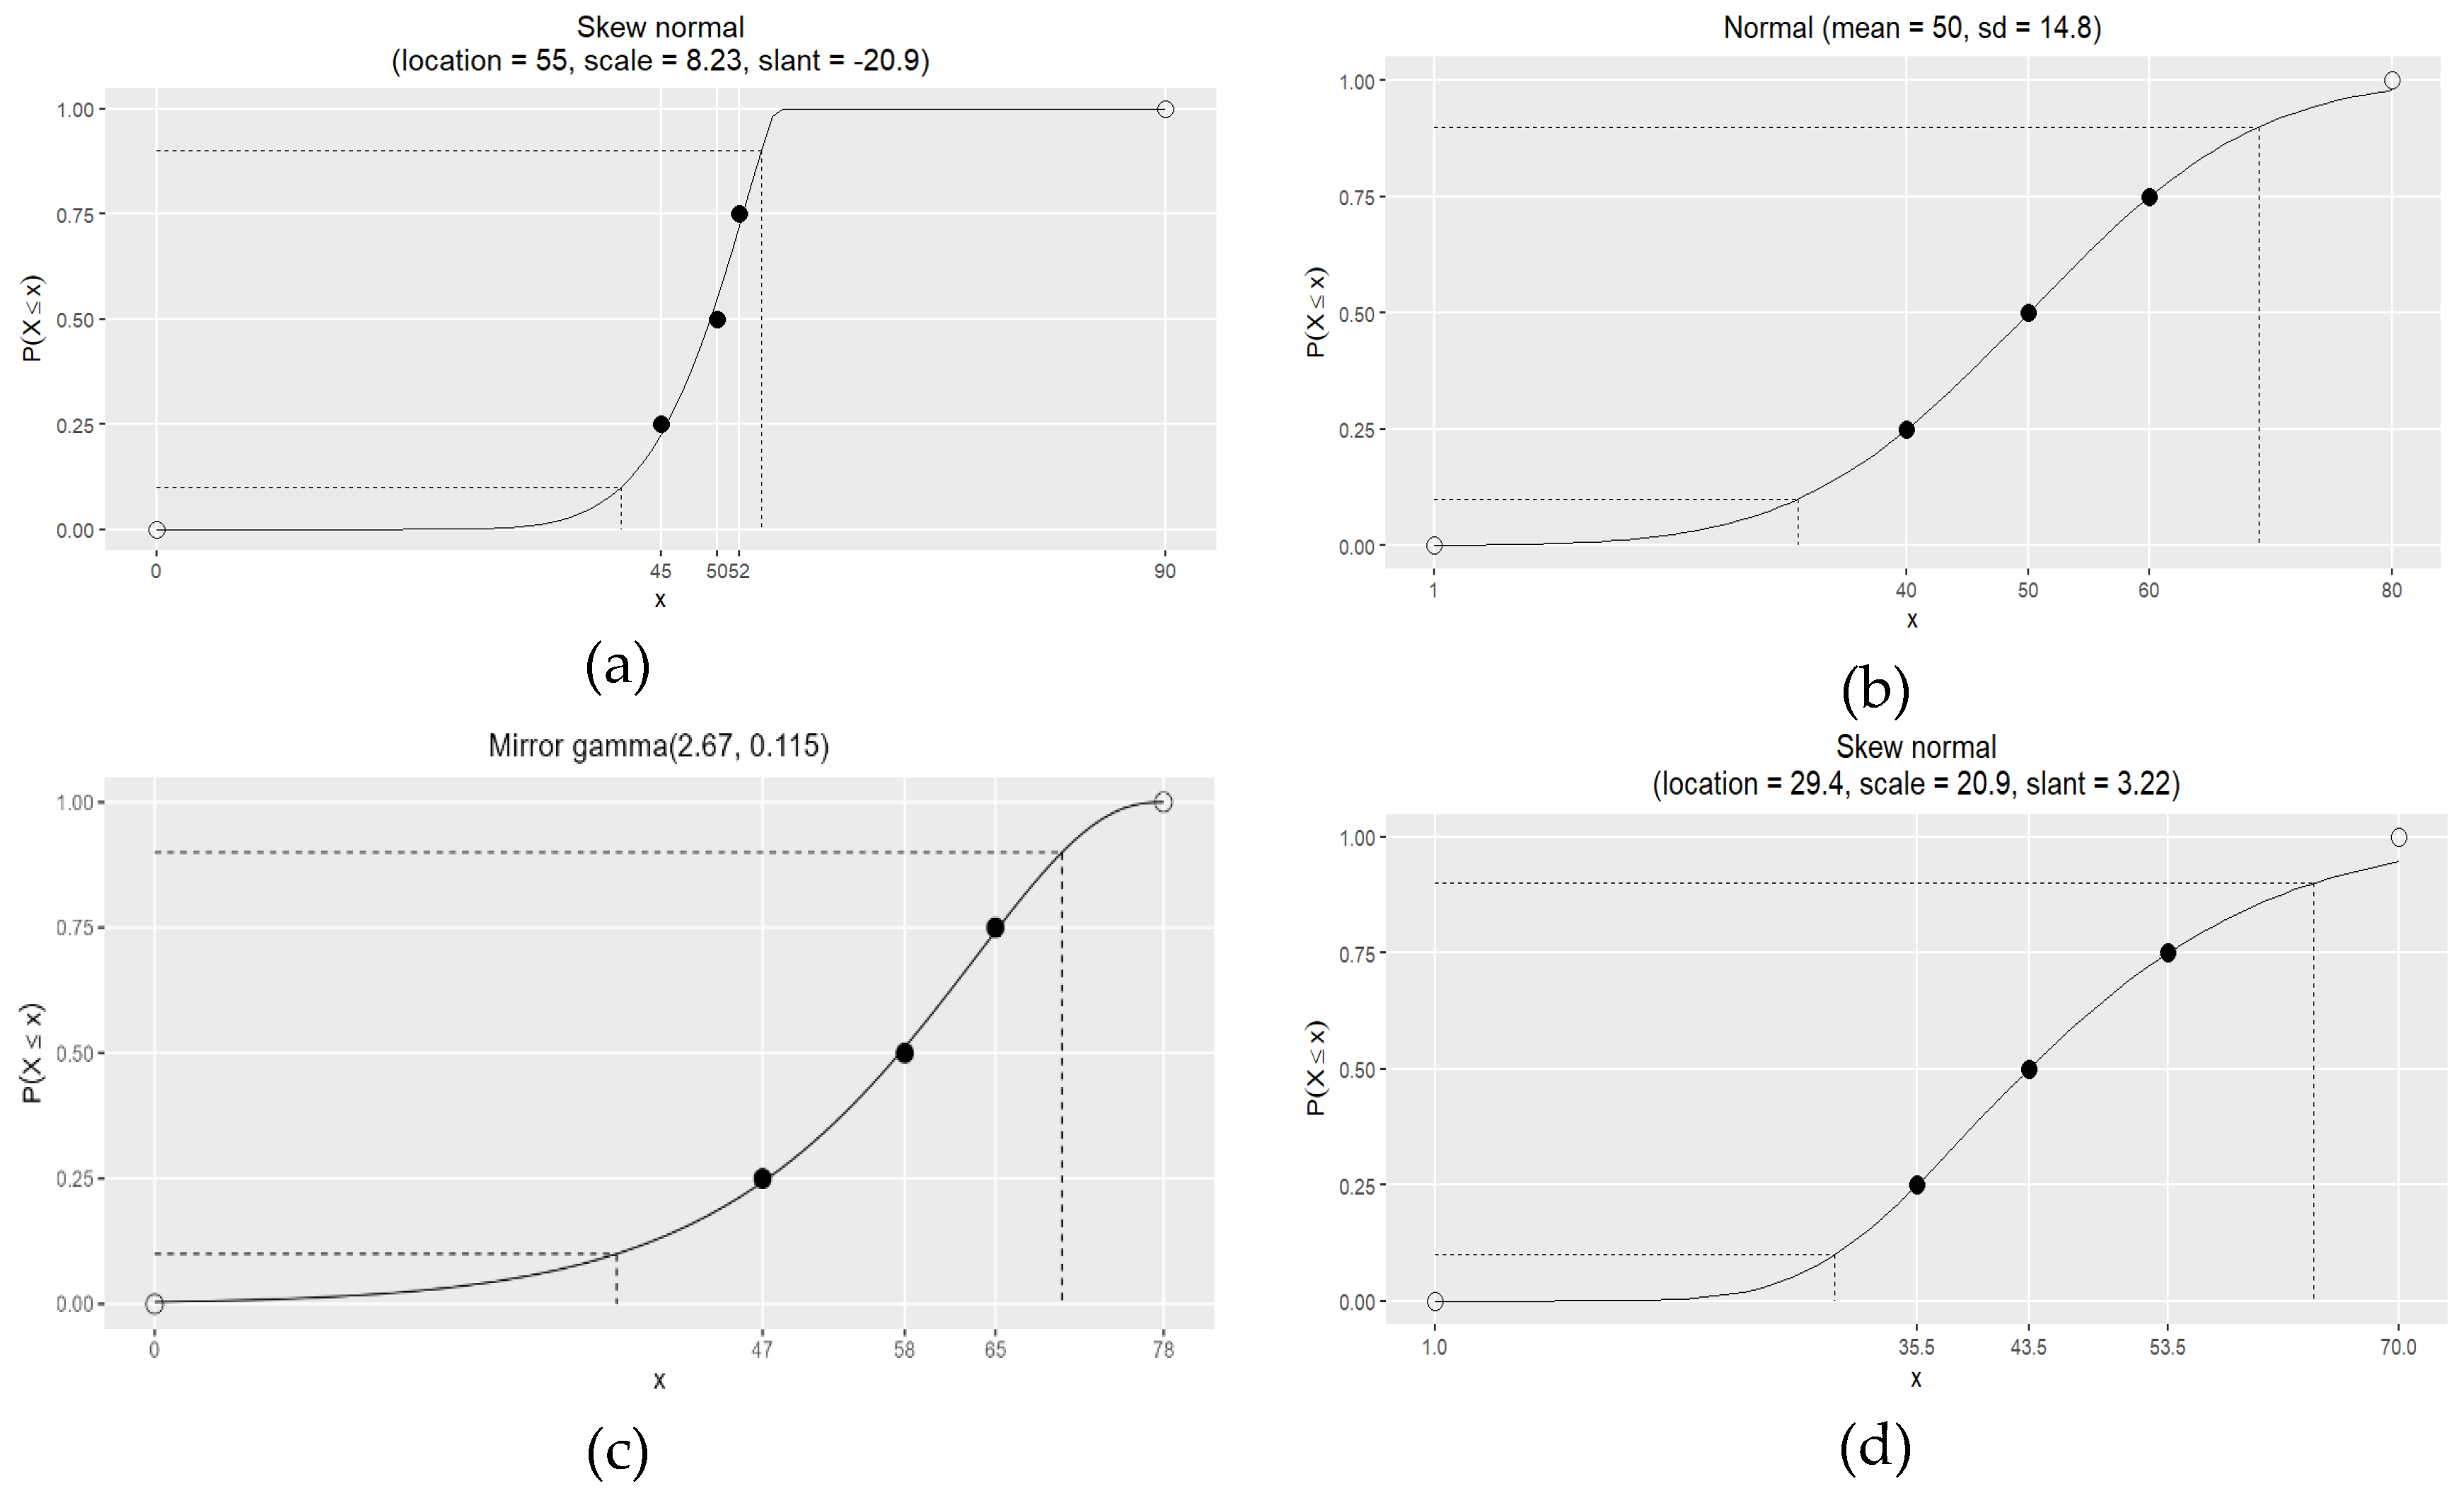
Figure 5.
Fitted probability density function of insured average ages when making claim based on different expert judgments. Figure 5a–d represent pdfs for expert A, B, C, and D respectively.
Figure 5.
Fitted probability density function of insured average ages when making claim based on different expert judgments. Figure 5a–d represent pdfs for expert A, B, C, and D respectively.
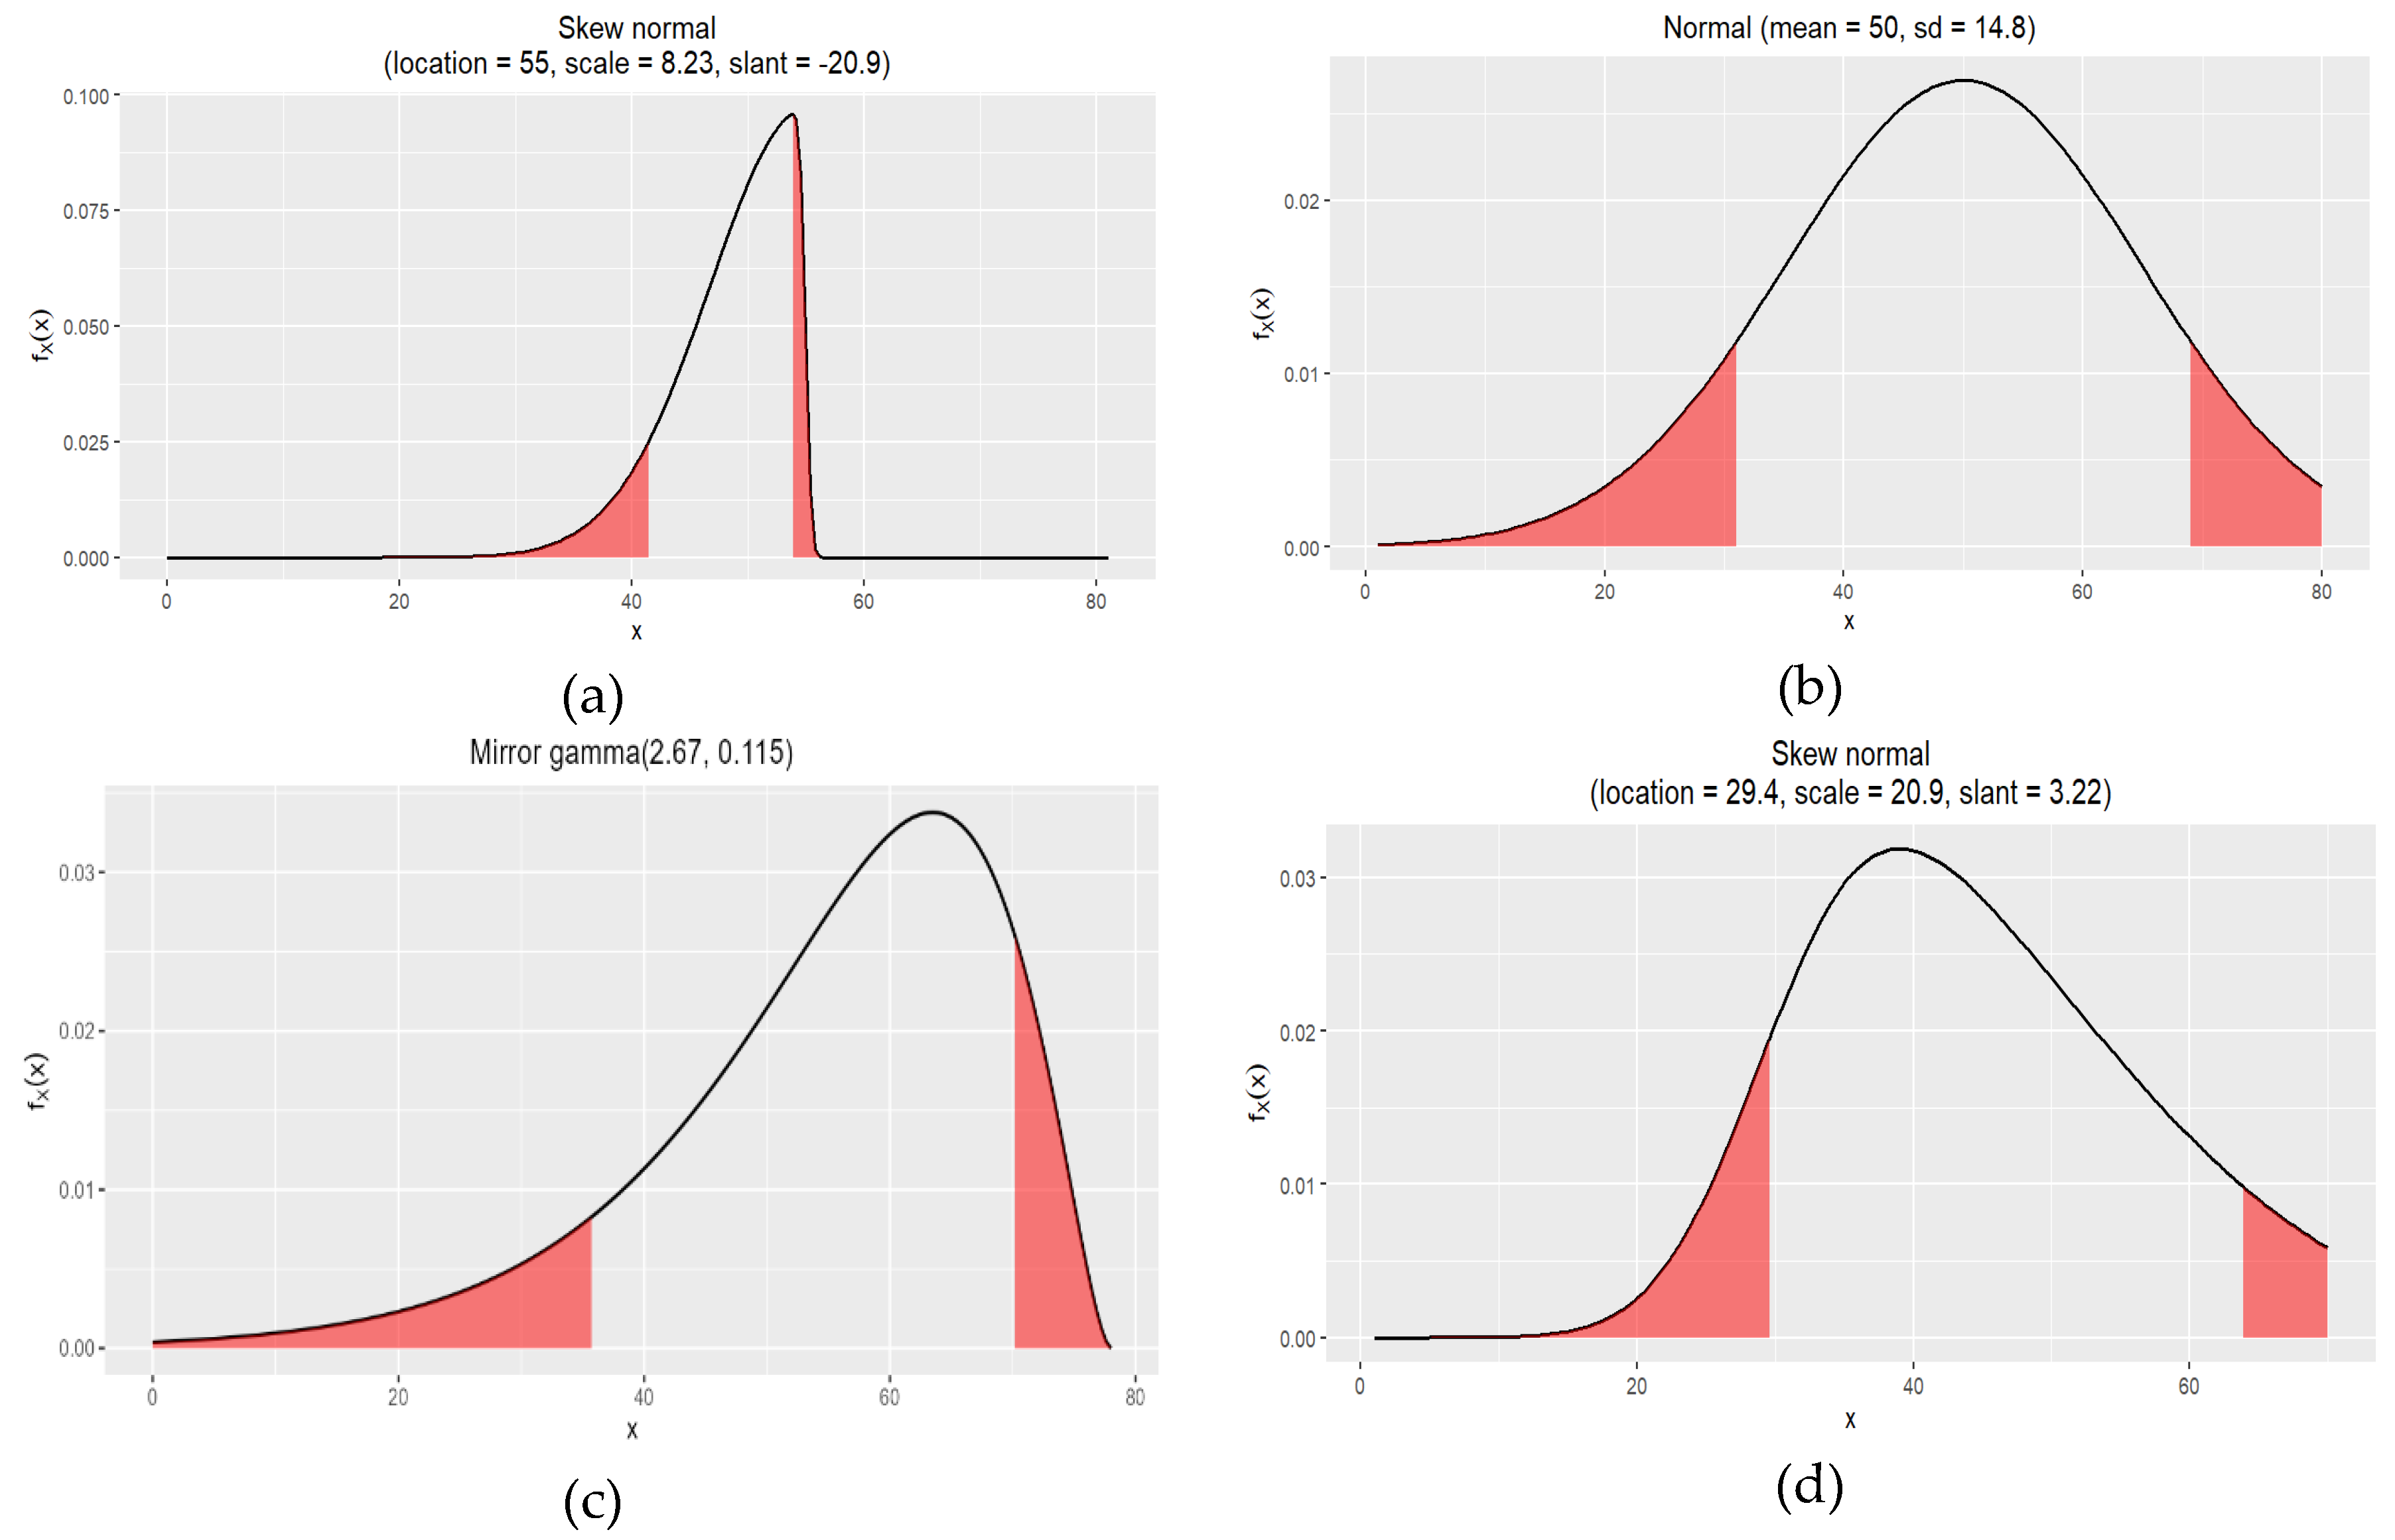
Figure 6.
Consensus distribution of Expert Judgment via Linear Pooling.
Disclaimer/Publisher’s Note: The statements, opinions and data contained in all publications are solely those of the individual author(s) and contributor(s) and not of MDPI and/or the editor(s). MDPI and/or the editor(s) disclaim responsibility for any injury to people or property resulting from any ideas, methods, instructions or products referred to in the content. |
© 2024 by the authors. Licensee MDPI, Basel, Switzerland. This article is an open access article distributed under the terms and conditions of the Creative Commons Attribution (CC BY) license (http://creativecommons.org/licenses/by/4.0/).
Copyright: This open access article is published under a Creative Commons CC BY 4.0 license, which permit the free download, distribution, and reuse, provided that the author and preprint are cited in any reuse.


