

Submitted:
14 November 2024
Posted:
18 November 2024
Read the latest preprint version here
Abstract
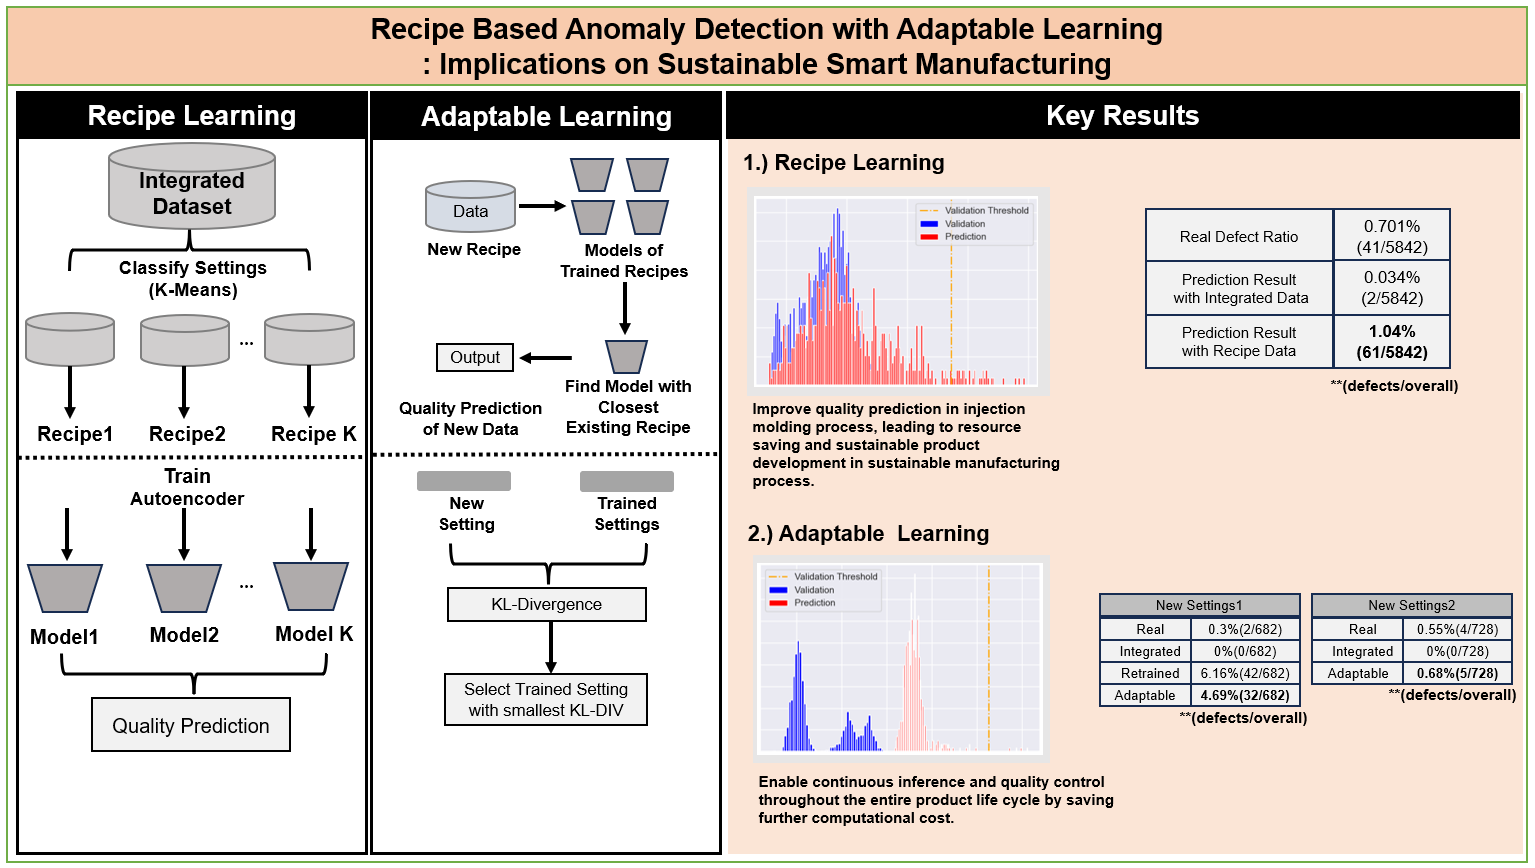
Manufacturing industry have seen benefits due to the advent of Industry 4.0 which main aspects are the efficiency of quality management, better customization, reduction of cost and environmental impact, sustainability of production development etc. This has led to exploring new directions of various researches and real world applications mainly based on artificial intelligence. It has been known that combining traditional methods and artificial intelligence based approaches enhance the overall performance of manufacturing process. However, application of AI solutions are still left for further development in many sectors. Especially in the field of injection molding, there are circumstances where quality inspection in product development is done in lots rather than individual units. In this case, only the overall defect ratios and the count of good or bad cavities can be known. This implicates that prediction can only be done in lots at best. Also, due to frequent changes of setting values, the whole process consists of various unique settings each leading to different data characteristics. Based on this background, we use lot based production data consisting of multiple settings in our work . First, we apply K-Means to separate data into multiple setting based recipes. Second, autoencoders are trained with one integrated and multiple recipe data consisting of only good cavities(normal quality) for anomaly detection. Third, for adaptable learning, we apply KL-Divergence to find the closest trained recipe and its model of new data with unseen settings. This leads to a direct prediction without further training. The results show that recipe based models predict acceptable quantity of anomalies in the test data, while the integrated model barely predicts any. In a real world perspective, such improvement of quality inspection in injection molding process efficiently saves resource leading to eco-friendly products. Also, the adaptable learning process enables continuous inference and better quality control throughout the entire product life cycle by saving computational cost. As AI becomes vastly integrated throughout manufacturing sectors, it is essential to explore new directions among various real world applications. The proposed approach of this work provides a realistic perspective of applying AI solution for sustainable manufacturing process.
Keywords:
sustainable manufacturing
; injection molding
; setting values
; recipe
; autoencoder
; anomaly detection
; k-means
; kl-divergence
; adaptable learning
; eco-friendly product
1. Introduction
1.1. Background
Industrialization plays a critical role in solving key challenges for maintaining viability by introducing cutting-edge technologies in manufacturing. Recently, many industries are accelerating the application of Industry 4.0 to improve quality control and customization efficiency, and expect benefits such as increased production speed, reduced manufacturing costs, and reduced environmental impact. However, many industries are facing difficulties in efficiently adopting cutting-edge technologies due to financial, regulatory, and organizational management issues. Nevertheless, the future impact of Industry 4.0 on the manufacturing ecosystem is inevitable, and this has led to active research and experiments on the possibility of manufacturing innovation [1,2].
In particular, the introduction of artificial intelligence (AI) is attracting attention as a key element of manufacturing process innovation in Industry 4.0. AI optimizes data-based decision-making through techniques such as machine learning, deep learning, and reinforcement learning, and enables efficient predictive engineering and condition monitoring, thereby enhancing the sustainability and flexibility of manufacturing processes. However, since each manufacturing process has different characteristics of product development, it is important to carefully explore the data characteristics and apply the optimal algorithm.
–> add sustainable product development In addition, research results are also showing that the development of AI in the manufacturing sector can solve environmental problems [3,4]. In other words, if manufacturing AI is developed efficiently and continuously developed efficiently, it is expected to contribute to society in various ways.
1.2. Issue
Many studies have shown that the application of manufacturing AI can lead to the advancement of the industry and this is a task that must continue for development in the future [5,6,7]. However, despite the technological advancement of hardware and software, the use of AI solutions in the manufacturing sector faces many limitations, such as scalability, and it is said that much research is still needed [8].
In the field of injection molding, the datasets used in research often do not sufficiently reflect the characteristics of the entire product development process. The datasets generally have a balanced ratio of results for normal and defect qualities. But in actual industrial sites, there is a significant lack of defective data, making it difficult to build an AI model that takes this imbalance into account [11]. In addition, labeling the status of products on a 1:1 product basis is very important in building AI [12]. However, the injection molding process has difficulty of performing real time quality inspection throughout the process of every product. So products are generally collected in lots and quality evaluation is done by the count of defective products per each lot. This method makes it difficult to determine whether the characteristics of a each data indicates a normal or defect quality. And if there is a lack of defective data, application of AI is also limited.
In addition, there are results of several researches in the field of injection molding that the setting values in product development process are frequently changed, which makes training the data more complicated [13].
1.3. Our Idea
This paper propose a new framework for sustainable manufacturing specialized in the injection molding process. By utilizing the process characteristics with few defects, we aim to build an Anomaly Detection model that learns only good data in a lot process and detect actual defects throughout the remaining data. Also, in order to reflect the frequent changes of setting values during product development process, we introduce the ’Recipe-based learning’ approach. A ’recipe’ is defined as a unique set of setting values that is manipulated throughout process. If even one value is changed from a set of multiple settings, it is considered as a new recipe. With this concept, Recipe-based learning means a method of classifying the dataset by each recipe and training its model. Here, we aim to present an approach that can optimize the setting parameters and anomaly detection models of the injection molding process. With further extension, we introduce the ’Adaptable-learning’ approach. Here, we aim to directly predict new data with unseen settings by using trained models of the closest recipe. For the experiment, we used an injection molding data set collected from a private company in South Korea.
1.4. Contributions
- Optimization in Defect Detection: This paper advances the field of injection molding by focusing on AI-driven modeling to enhance the accuracy and efficiency of defect detection, aiming to optimize manufacturing quality and process reliability.
- Reduced training time: Since Additional learning for new data becomes unnecessary, the required learning time is reduced and the maintenance period of the product life cycle can be extended.
- Securing corporate competitiveness: By reducing the cost of quality inspection due to an advanced detection of defects, the company can secure its own quality competitiveness of the overall product development.
- Reduction of resource waste: When modeling is performed for each individual setting, optimizing model parameters in training process becomes more simple due to distinguishable data characteristics. This reduces the cost of inference. When additional data is received, the cost of retraining is also reduced. Both aspects can be implied as the reduction of resource waste and lead to eco-friendly product yield.
Section 2 provides context for our approach by reviewing the evolution of injection molding technology and recent AI advancements in this area, emphasizing how our method builds upon and improves existing techniques. Section 3 details the algorithms and methodology we use to enhance defect detection accuracy, demonstrating how our approach impacts production efficiency. In Section 4, experimental data showcases our method’s real-world effectiveness, significantly outperforming traditional models in defect detection accuracy. The Discussion section interprets these results, highlighting the potential for AI-driven defect detection to improve sustainability and resource efficiency in manufacturing. Finally, the Conclusion advocates for the targeted use of AI in manufacturing automation and proposes future research paths that align with sustainable and resource-efficient practices.
2. Literature Review
The injection molding industry has made great strides over time in leveraging AI.
2.1. Initial Experimentation and Predictive Modeling (Early 2000s)
Early AI implementations in injection molding aimed at predictive maintenance and process optimization, often using basic machine learning algorithms to forecast equipment failures and adjust parameters based on historical data. However, these systems struggled with data limitations, as molding processes are highly complex and sensitive to subtle fluctuations in conditions. This made prediction accuracy inconsistent and dependent on operator expertise to validate predictions, limiting scalability in complex production environments [9].
2.2. Integration with Industry 4.0 and Real-Time Monitoring (Mid-2010s)
With the onset of Industry 4.0, AI’s role in injection molding expanded to include real-time data monitoring and adaptive process controls. By using IoT sensors and more advanced machine learning models, manufacturers began adjusting molding parameters on the fly, significantly enhancing efficiency and reducing defect rates. Yet, challenges remained, particularly with data compatibility across different machine systems and the difficulty in achieving “zero-defect” manufacturing due to high variability in material and environmental factors [10].
2.3. Advanced Quality Prediction and Zero-Defect Ambitions (2020s)
More recent advancements focus on achieving high quality and zero-defect production through complex AI models like neural networks and human-in-the-loop systems. These allow AI to refine parameters in real-time, reducing waste and maintaining consistency. However, these systems demand substantial computational resources and skilled data scientists to manage and interpret results, creating a high entry barrier for smaller manufacturers. Additionally, the effectiveness of these systems is often limited by variability in data quality and completeness, hindering universal application [11].
Over time, the importance of AI in the injection molding field is increasing day by day, and its accuracy is also improving. However, due to frequent changes in the set values, it is very difficult to utilize AI [13]. In addition, deploying AI for defect detection and quality prediction in the injection molding industry has difficulty in learning effective models due to the very small number of defect data. This lack of defect samples limits the ability of AI models to generalize and accurately predict rare defects [14].
2.4. This Work
We propose a method to learn by separating the setting values. If the setting values are classified, the regularity of the training data set can be secured as an example of Figure 1. If modeling is performed based on this regularity, higher performance of quality inspection can be maintained. Furthermore, due to the nature of the Injection Molding field, if labeling is not actually performed per each product, there are many cases where only the overall quality ratio of the entire process is known from the dataset. Especially with existing defects, it is unable to specify which individual data is anomalous, and the defect ratio itself is only known.
Accordingly, if the Autoencoder is applied using only the good product data with optimal thresholds being set, the count of defects of the product development process for quality inspection can be verified.
3. Methodology
In this section, we introduce our proposed architecture focused on how to implement anomaly detection with setting values and no proper labeling result per each data. The overall procedure is described in Figure 2. Main algorithms used are K-Means clustering [15], Autoencoder [25], and KL-Divergence [29].
3.1. Data Collection
The injection molding dataset used in our work is based on a lot measured procedure described in Figure 3. First, a product consists of one or multi cavity molds. A single-cavity mold produces one product per cycle and a multi-cavity mold produces several partial products per cycle. For example, if a 4 cavity mold product consists of 3 normal and 1 defect cavities, the defect ratio of this product is 25 percent. Now, these cavity based products are assigned to a specific lot which name is the process date. However, manufacturing processes generally inspect products for good and bad products by lot rather than by cavity unit. In a lot production, labeling is not actually performed for each product. Instead, only the overall defect ratio of the lot process based on good and bad cavity counts can be known. That’s why it’s difficult to apply general AI models to these kinds of datasets (Unlabeled Dataset per unit).
The description of the dataset collected for experiment is as follows.
- Collected data size is D with N features.
- dataset consists of F facilities and P products.
- Each product consists of C cavities.
- S setting features are used for classifying data into recipes.
- I input features are used for modeling Autoencoders.
Rest of the features include information such as facility and product code, process date etc. And the target feature for prediction is the overall defect ratio of good and bad cavities in the lot process.
3.2. Recipe Separation
In our work, the main objective is to compare prediction results of models trained based on setting based classified data the original product(recipe integrated) data. Then, setting based models are aimed to improve prediction accuracy.
First, to classify data into specific setting based recipes, the K-Means Clustering algorithm [15] is applied to the original product data.
The K-Means Clustering is a distance based unsupervised algorithm for grouping data based on similar characteristics. The process is simply done as follows.
- First, the number of clusters K is decided for how many clusters the dataset should be divided into.
- Next, initial centroids per each cluster are given. Data points which are close to each centroid are assigned to each cluster by using distance based metrics.
- After grouping data, initial centroids move to the center of the data points per each assigned cluster. This process is repeated until every data are assigned to each cluster and centroids are adjusted.
The example of K-Means is shown in Figure 4.
Classifying data into setting based recipes is as follows.
- Among Data size of D, select data with features of the existing N setting parameter values.
- Drop duplicated data and C unique combinations of setting values are left.
- Set the parameter n clusters as K.
- Apply standard-scaler to values for unifying different feature measures.
- Train K-Means Clustering with data size of d rows and N features
- Return to the original data size D and predict each data of setting parameter variables.
- Cluster Number from 1 to K for each data is now designated.
- Define cluster numbers as setting based recipes.
The application of K-Means is shown in Figure 5.
Additionally, If the recipe of a new input is to be known, first, select the setting values of the new input. Second, predict the inputs of setting values with the trained K-Means model. Then, the predicted cluster is designated as the recipe number.
3.3. Train/Test Data Definition
As mentioned in 3.1, only the overall defect ratio and count of good and bad cavities are known in the dataset which lack the labeling result of each product. However, in a lot process with only good cavities, all individual data in the lot can be known as true normal quality results.
With consideration, train and test data are divided based on the defect ratio of processed lots. Data with lots of defect ratio =0.0% are selected as normal data. The classified recipes and the normal data itself(integrated data) are used for training models. Data with lots with defect ratio > 0.0% are selected as test data. In the train data, 90% of the train data are actually used for training and 10% for validation to prevent overfitting issues in modeling procedure. In the test data, additional removal is done in two situations.
- Suppose a lot process of the test data consists of multiple recipes and data of recipes also exist in the train data. At first, it seems predictable. However, note that only the real defect ratio of the entire lot process itself is known. This becomes impossible to compare predicted defect ratios per each classified recipe. In other words, defect ratio per each recipe is untrackable.
- Suppose a recipe in the train data does not exist in the test data. In this case, only partial prediction of the lot process can be done leading to incomplete quality measurement.
Accordingly, lot process which have one unique setting recipe are left in the test data. The classified recipes and adjusted test data itself(integrated data) are directly used for prediction.
3.4. Min-Max Regularization
Before modeling, a min-max scaling method which transforms the range of inputs from 0 to 1 is applied to features [16]. In deep-learning methods, regularization with scaling is vital for properly training data. Especially, it can mitigate input bias [17], gradient vanishing or exploding [18], covariance shift [19], and exponential convergence of training loss [20]. With this approach, scaling is first done based on the train dataset. Then, features of validation and test data are regularized based on the train dataset.
3.5. Predictive Modeling
3.5.1. Autoencoder Application
Based on 3.3, normal data is to be trained, and test data of lot process with good and bad cavities are to be predicted. For prediction, anomaly detection is decided as the main approach for modeling procedure. In our work, we applied the Autoencoder method.
Since the priority of our work is to verify if AI is applicable in a specific manufacturing process, it is closer to a data-driven approach [21]. This is why Autoencoder of a fundamental structure like Figure 6 is used rather than applying Autoencoder variants [22] focused on improving model performance which is model-driven approach [23,24].
The main function of Autoencoder is reconstructing the inputs into similar outputs throughout a symmetric architecture. [25,26]
- Inputs are compressed through the encoder into the latent vector.
- In the latent vector, non linear correlations between features are captured which can effectively learn important components of inputs.
- Throughout the latent vector, reconstructed outputs are predicted with decoder.
Inputs for training Autoencoders of the recipes and the entire normal data(integrated data) are the I input features.
3.5.2. Evaluation Metrics
After training Autoencoder, the loss value of reconstruction errors between the inputs and predicted outputs is calculated using mean absolute error. Among several metrics, The Mean Absolute Error (MAE) is chosen to see a more intuitive difference between the inputs and outputs. The MAE function calculates the mean value of absolute errors between the given inputs and predicted output values [27]. From the equation , where n is the train data size, is the input , and is the reconstructed output [28] .
3.5.2.1
Furthermore, thresholds for anomaly detection are based on the maximum MAE value of the reconstruction error of the validation normal data. If the MAE values of test data exceed the threshold, it is predicted as anomaly. The application is to be explained in Section 4.5.2.
3.6. Adaptable Learning
To predict new data of untrained recipes without additional training, we first focus on finding the closest trained setting recipe compared to new recipes. Then, the trained model of the closest recipe becomes adaptable for predicting new recipe data. First, KL-Divergence is applied in the process.
The Kullback-Leibler (KL) divergence is a statistical measure which quantifies the distance between two probability distributions. From the equation below, [29], the definition of distribution P and Q in our work is explained as follows.
- P is defined as each setting value of the trained recipe.
- Q is defined as each setting value of new recipe. And is interpreted as whether it can properly infer P.
The range of KL-Divergence is from zero to infinity. If the divergence is lower, the closer the distributions are.
3.6.0.2
Next, the main procedure of finding adaptable recipes for new data with KL-Divergence is as follows.
- Select trained recipes R,...., R+K.
- Select new recipes r,...., r+k . ( Recipe numbers are predicted with the trained K-Means in 3.2. )
- Select N setting parameter values per each trained recipe.
- Select N setting parameter values per each new recipe.
- Calculate the KL-Divergence value of each setting value between each new recipe and trained recipes individually.
- Calculate the sum of KL-Divergence of the setting values.
- Select trained recipe with the lowest KL-Divergence compared to the new recipe.
- Select model of trained recipe and predict data of new recipe.
- Define I input features used for prediction.
The application of KL-Divergence is shown in Figure 7. With this approach, the objective is to lower computational cost and secure consecutiveness of quality inspection.
4. Experiment Setup
4.1. Data Collection
The injection molding dataset used in our work is collected from a private manufacturing company in South Korea. Referred to Section 3.1, inputs are defined as D = 432089 , N = 132, F = 4, P = 14, C = 1, S = 76,I = 6. By information, data size of 432098 with 132 features consist of 14 products manufactured in 4 facilities. Mold type of a product is a single cavity. 76 setting values are used for recipe separation and 6 input features are used for modeling Autoencoders.
4.2. Recipe Separation
The collected dataset is first classified with unique setting values. Then, inputs following procedure 3.2 are designated as D = 432089 , N = 76, C = 366, K = 366, d = 366.
An example of a understanding the complete dataset of one lot process is described in Table 1. As mentioned in 3.1, the lot number is the date of process. The lot process 20231214 with recipe number 10 results in approximately 1.37% defect ratio of cavity based products.
4.3. Select Experiment Data
From the complete dataset, we chose a subset for experiment based on the following order.
- Remove data which facility does not consist of any defects.
- Select data from a specific facility where most defect ratios exist.
- Select data of a specific product the largest size.
The specified dataset now have data size of 26577 and 132 features. 36 setting based recipes exist throughout 57 lot process from 2023-12-14 to 2024-07-17. And the descriptive statistics of 6 input features for modeling procedure is shown in Table 2.
4.4. Train / Test Data Organization
Referred to Section 3.3, there remain 6 recipes for the selected experiment data. The descriptions of train and test data are shown in Table 3 and Table 4. In case of recipe 4,5,6, only training is available since no identical recipes exist in the test data. Prediction is to be done if new data of these recipes are collected. Then, validation data are defined and by 3.4, min-max regularization is done. With final organization of the train and test data, prediction of integrated and recipe based models follow the next step.
4.5. Results
4.5.1. Autoencoder Configuration
4.5.2. Threshold optimization
As mentioned in 4.4, for each recipe and integrated data, validation data of normal process are predicted with each trained Autoencoder . Then, based on the distributions of reconstruction errors in Figure 8, the optimal thresholds for anomaly detection are decided. Instead of calculating thresholds via statistical approach, referred to Section 3.5.2, the maximum value of the reconstruction errors are decided as optimal thresholds to secure utmost objectivity. Threshold values are described in Table 6.
4.5.3. Prediction Comparisons
With the optimized thresholds, predictions of test data with existing defect ratios are done. Comparison of the real defect ratio, integrated and recipe based predicted results are described in Table 7. Ratios and count of defect cavities from each lot is also shown. Test data of recipe 1 is processed from lot number 20240402 to 20240623. Recipe 2 and 3 are processed in lot number 20240717 and 20240322. It is seen that prediction with the integrated model barely predict defect data. This is due to not considering the difference of unique settings, leading to improper results.
By contrast, recipe based models lead to an outstanding performance for defect prediction. Especially for lot number 20240402 and 20240617, recipe based models predicted the same number of defective cavities compared to the actual ones. As a result, considering the difference of inputs based on unique setting values are critical for quality inspection.
4.6. Adaptable Learning
Referred to Section 3.6 , we further used extra inputs predicted as new recipe number 6 and 7 via 3.2. The new data have distinct characteristics as follows.
- For recipe 6, there exist two lot process each with lot defect ratio of 0.0% and >0.0%. The first lot process have only good cavities and the second lot have good and bad cavities.
- For Recipe 7, there exist one lot process with lot defect ratio of >0.0%. The lot process have good and bad cavities.
Both recipes with lot process which contain defect cavities are to be predicted with two main approaches.
- Find the nearest trained recipe per each new recipe 6 and 7 with KL-Divergence calculation.
- Select trained Autoencoders based on the nearest recipe.
- Predict new data of recipe 6 and 7 with each selected Autoencoder.
- Predict new data of recipe 6 and 7 as a whole with the integrated Autoencoder.
- Compare prediction results of integrated model and recipe models.
Exceptionally for recipe 6, since there is a lot process with normal cavities, it is also used for additional train and test and total 3 results are to be compared.
4.6.1. KL-Divergence Calculation
After inputs for procedure of 3.6 are designated as R=1,K=2, r=6, k=1, N= 76, I=6. the calculation results are described in Table 8. With this approach, the closest trained recipe of new recipe 6 and 7 are both defined as recipe 1.
4.6.2. Data Organization
Referred to Section 3.5.2 and 4.5.2, before direct prediction, validation data with normal data is required for defining the optimal threshold for final prediction. For recipe 6, the lot process of normal data is known. So with the trained AutoEncoder of recipe 1, data with normal lot process from recipe 6 is directly used as the validation data and data with lot process of defect ratio>0.0% is used as the test data.
For recipe 7, data have good and bad cavities leading to defect ratio>0.0% of the lot process. In this case, the closest trained recipe 1 is first decided as the adaptable Autoencoder is shown in Table 9. Validation data for predicting data of recipe 7 is secured as follows.
- From recipe 1, select the closest recipe among remaining recipe 2 and 3.
- Inputs for procedure of 3.6 are designated as R=2, K=1, r=1, k=0, N=76 , I=6.
- Through calculation, the closest setting values to recipe 1 is recipe 3.
- The existing train data of recipe 3 is decided as the validation data for setting the optimal threshold.
4.6.3. Prediction Comparisons
In Table 9, validation data are first predicted through Autoencoder of recipe 1. Then, the maximum value of the reconstruction errors are decided as the optimal thresholds for anomaly detection of recipe 6 and 7. Predictions results with the trained integrated model in Table 5 and the adaptable learning procedure of this section is compared. Additionally for recipe 6, the result of additional train and test is also compared.
In Table 10, the integrated model still fails to predict defect cavities in a lot process. On the other hand, the adaptable learning procedure results in relatively acceptable predictions. Especially in recipe 7, predicted counts of defect cavities are almost equal to the real value, even surpassing the result of additional learning. In this case, it can be inferred that new inputs like recipe 7 can have better quality prediction without additional training leading to less computational cost.
5. Discussion
The results of this study provide compelling evidence for the efficacy of setting-specific modeling over traditional integrated approaches in the context of manufacturing AI. By developing and implementing models optimized for specific settings rather than relying on a single, unified model, we observed noticeable improvements in prediction accuracy and defect detection. This setting-specific model design acknowledges the inherent variability in different operational conditions and allows the AI system to account for circumstances that an integrated model may overlook. Consequently, these tailored models have demonstrated a notable performance advantage, as they can more precisely interpret variations within each setting, ultimately yielding enhanced reliability and robustness in manufacturing outcomes.
Before configuring models according to specific settings, recent studies across various fields have shown that hyperparameter tuning is essential for improving AI model performance. Applying these techniques has led to significant performance enhancements [33,34,35]. Although we used the simplest model, Autoencoder, only to mainly compare the performance difference between the Setting model and the Integrated model, we performed Parameter Tuning by changing various parameters to maximize the performance of the model itself.
One of the primary benefits of setting-specific models is their ability to streamline the data processing pipeline, effectively minimizing noise and irrelevant information that may confound an integrated model. Integrated models, although broadly applicable, often face challenges in addressing the subtle variances of distinct manufacturing environments, leading to a compromise in accuracy and increased instances of false positives or negatives. By comparison, setting-specific models leverage the targeted nature of data optimization, thus avoiding the one-size-fits-all limitations of integrated modeling and significantly boosting accuracy in defect identification. The results indicate that setting-specific models not only improve prediction quality but also save resource and reduce computational demand, as these models do not need to generalize across a broader range of variables. This streamlined model structure directly impacts the efficiency and scalability of AI in manufacturing, reinforcing its value for large-scale industrial applications.
Beyond setting-specific models, the second approach in this study further highlights the transformative potential of personalized AI. Prediction with fine-tuning thresholds based on existing setting-specific models without additional learning on new data achieves significant performance over existing modeling techniques through innovative improvements and additional adjustments to the experiment procedure. This enables continuous inference efficiently throughout the entire product life cycle. Based on a nuanced understanding of feature selection and data segmentation, this approach leverages performance unique to each setting. The ability to isolate and prioritize features that directly affect the defect outcome proves to be invaluable, as it allows the AI model to focus computational resources on the most influential variables rather than on the widely distributed inputs of the integrated data. By improvement of these aspects, the second approach not only elevates prediction accuracy, but also optimizes processing efficiency, reducing latency and computing overhead.
Compared to standard models, this advanced methodology highlights the importance of adaptive modeling in rapidly changing industrial environments. While traditional approaches often assume that a single model can serve a variety of contexts with equal efficacy, the new direction of our findings demonstrate that adaptability is a cornerstone of high-performance manufacturing AI. Specifically, the understanding of feature selection and data segmentation in the second approach emphasizes the critical role of relevant data curation. Instead of training models on expansive datasets that may introduce redundancy, this approach creates leaner, context-aware models, capable of highly accurate compared to the total model and additionally trained model predictions with minimized resource expenditure.
Overall, the results of both approaches illustrate the significant benefits of moving beyond integrated modeling and toward more specialized, context-driven methodologies. These findings support the conclusion that AI models optimized for specific settings and refined by advanced feature selection techniques can deliver superior performance with less computational load, thus fostering both efficiency and scalability. Moving forward, the application of these methods has the potential to redefine AI’s role in manufacturing, setting a new standard for precision, adaptability, and resource efficiency. Further exploration of setting-specific and adaptive AI models, especially in complex manufacturing environments, holds considerable promise for unlocking even greater levels of product development and quality assurance across the industry.
6. Conclusions
As AI becomes increasingly integrated into various sectors, including manufacturing, the need for responsible and sustainable AI development has grown more pressing. AI’s advantages in promoting environmental sustainability have been demonstrated in small-scale initiatives and qualitative testing [39]. For instance, AI is now used in ecosystem service assessments, species detection and conservation, climate change modeling, natural disaster prediction, and waste and wastewater management [36,37,38]. The benefits of AI for environmental sustainability have been clearly demonstrated in small-scale project initiatives and hypothetical or qualitative tests [40]. Yet, these solutions focused on enhancing eco-friendly products have not yet been scaled to large-scale, real-world applications [41].
To make a meaningful impact from an AI and sustainability perspective, it is essential to not only identify and improve environmental factors, but also prioritize those that are competitive and beneficial to the business [42]. This means effectively reducing waste and better classifying product defects to gain competitiveness of yielding eco-friendly products. Even small reductions, if widely adopted, can collectively lead to significant environmental benefits. These changes can establish a new paradigm where small but meaningful actions collectively address the critical issue of environmental waste.
In manufacturing, achieving this balance requires a focused approach to AI advancement that values efficiency and environmental consciousness. By optimizing data based on well-defined parameters, AI systems can attain high precision in identifying high-quality products versus defective ones, effectively reducing production waste and improving product quality. This optimized approach supports manufacturing efficiency and strengthens organizations’ competitive edge by enabling consistent, high-quality outcomes.
A key consideration for sustainable AI-driven manufacturing is the use of optimized datasets. With refined data, companies can deploy simpler models that maintain high accuracy without relying on complex, parameter-heavy systems. This reduction in model complexity lowers computational demands, creating direct cost benefits and facilitating accessible AI solutions of sustainable manufacturing across industries.
Furthermore, when optimization is guided by standardized values, it allows for accurate differentiation between acceptable and defective products, further reducing waste and enhancing resource efficiency. This technique helps companies secure a competitive edge while addressing pressing environmental issues. Additionally, integrating domain-specific knowledge into AI models, especially regarding features impacting product defects, can exponentially increase the potential of refined data usage, enabling higher accuracy with lower computational costs.
Such targeted refinement also enhances model interpretability, allowing teams to pinpoint defect sources and implement proactive quality control measures, shifting manufacturing from a reactive to a predictive process.
In conclusion, as AI continues to evolve within manufacturing and other sectors, the focus should be on building impactful and sustainable solutions. By advancing cost-effective, accurate, and environmentally conscious AI methodologies, this study highlights AI’s potential to improve quality and reduce waste in manufacturing. Future research should prioritize integrating domain expertise, targeted feature identification, and optimized data practices to foster intelligent, efficient, and sustainable progress across industries.
References
- Cioffi, Raffaele, et al. "Artificial intelligence and machine learning applications in smart production: Progress, trends, and directions." Sustainability 12.2 (2020): 492. [CrossRef]
- Tseng, Ming-Lang, et al. "Sustainable industrial and operation engineering trends and challenges Toward Industry 4.0: A data driven analysis." Journal of Industrial and Production Engineering 38.8 (2021): 581-598. [CrossRef]
- Waltersmann, Lara, et al. "Artificial intelligence applications for increasing resource efficiency in manufacturing companies—a comprehensive review." Sustainability 13.12 (2021): 6689. [CrossRef]
- Chen, Yixuan, and Shanyue Jin. "Artificial intelligence and carbon emissions in manufacturing firms: The moderating role of green innovation." Processes 11.9 (2023): 2705. [CrossRef]
- Rakholia, Rajnish, et al. "Advancing Manufacturing Through Artificial Intelligence: Current Landscape, Perspectives, Best Practices, Challenges and Future Direction." IEEE Access (2024). [CrossRef]
- Peres, Ricardo Silva, et al. "Industrial artificial intelligence in industry 4.0-systematic review, challenges and outlook." IEEE access 8 (2020): 220121-220139. [CrossRef]
- Arinez, Jorge F., et al. "Artificial intelligence in advanced manufacturing: Current status and future outlook." Journal of Manufacturing Science and Engineering 142.11 (2020): 110804. [CrossRef]
- Espina-Romero, Lorena, et al. "Challenges and Opportunities in the Implementation of AI in Manufacturing: A Bibliometric Analysis." Sci 6.4 (2024): 60. [CrossRef]
- Charest, Meaghan, Ryan Finn, and Rickey Dubay. "Integration of artificial intelligence in an injection molding process for on-line process parameter adjustment." 2018 Annual IEEE International Systems Conference (SysCon). IEEE, 2018. [CrossRef]
- Silva, Bruno, et al. "Enhance the injection molding quality prediction with artificial intelligence to reach zero-defect manufacturing." Processes 11.1 (2022): 62. [CrossRef]
- Rousopoulou, Vaia, et al. "Predictive maintenance for injection molding machines enabled by cognitive analytics for industry 4.0." Frontiers in Artificial Intelligence 3 (2020): 578152. [CrossRef]
- Xu, Jiawen, et al. "A review on AI for smart manufacturing: Deep learning challenges and solutions." Applied Sciences 12.16 (2022): 8239. [CrossRef]
- Jung, Hail, et al. "Application of machine learning techniques in injection molding quality prediction: Implications on sustainable manufacturing industry." Sustainability 13.8 (2021): 4120. [CrossRef]
- Thabtah, Fadi, et al. "Data imbalance in classification: Experimental evaluation." Information Sciences 513 (2020): 429-441. [CrossRef]
- K. P. Sinaga and M. -S. Yang. "Unsupervised K-Means Clustering Algorithm." IEEE Access, vol. 8, pp. 80716-80727, 2020. [CrossRef]
- Deepa, Bharathi and K. Ramesh. “Epileptic seizure detection using deep learning through min max scaler normalization.” International journal of health sciences (2022). [CrossRef]
- Nayak, S. C., Bijan B. Misra, and Himansu Sekhar Behera. "Impact of data normalization on stock index forecasting." International Journal of Computer Information Systems and Industrial Management Applications 6 (2014): 13-13.
- S. Al-Abri, T. X. Lin, M. Tao and F. Zhang. "A Derivative-Free Optimization Method With Application to Functions With Exploding and Vanishing Gradients." IEEE Control Systems Letters, vol. 5, no. 2, pp. 587-592, April 2021. [CrossRef]
- Sullivan, Joe H., and William H. Woodall. "Change-point detection of mean vector or covariance matrix shifts using multivariate individual observations." IIE transactions 32.6 (2000): 537-549. [CrossRef]
- Song, Yang, Alexander Schwing, and Raquel Urtasun. "Training deep neural networks via direct loss minimization." International conference on machine learning. PMLR, 2016.
- Hosen, Mohammed Shahadat, et al. "Data-Driven Decision Making: Advanced Database Systems for Business Intelligence." Nanotechnology Perceptions (2024): 687-704.
- Berahmand, Kamal, et al. "Autoencoders and their applications in machine learning: a survey." Artificial Intelligence Review 57.2 (2024): 28. [CrossRef]
- Yang, Tianyi, et al. "Deep learning model-driven financial risk prediction and analysis." (2024).
- Bariah, Lina, and Merouane Debbah. "The interplay of ai and digital twin: Bridging the gap between data-driven and model-driven approaches." IEEE Wireless Communications (2024).
- Chen, Zhaomin, et al. "Autoencoder-based network anomaly detection." 2018 Wireless telecommunications symposium (WTS). IEEE, 2018. [CrossRef]
- Sewak, Mohit, Sanjay K. Sahay, and Hemant Rathore. "An overview of deep learning architecture of deep neural networks and autoencoders." Journal of Computational and Theoretical Nanoscience 17.1 (2020): 182-188. [CrossRef]
- Hodson, Timothy O. "Root mean square error (RMSE) or mean absolute error (MAE): When to use them or not." Geoscientific Model Development Discussions 2022 (2022): 1-10. [CrossRef]
- Givnan, Sean, et al. "Anomaly detection using autoencoder reconstruction upon industrial motors." Sensors 22.9 (2022): 3166. [CrossRef]
- F. Perez-Cruz, "Kullback-Leibler divergence estimation of continuous distributions." 2008 IEEE International Symposium on Information Theory, Toronto, ON, Canada, 2008, pp. 1666-1670.
- Yu, Miao, et al. "A model-based collaborate filtering algorithm based on stacked AutoEncoder." Neural Computing and Applications (2022): 1-9. [CrossRef]
- Liu, Tong, et al. "High-ratio lossy compression: Exploring the autoencoder to compress scientific data." IEEE Transactions on Big Data 9.1 (2021): 22-36. [CrossRef]
- Wang, Jianlong, et al. "Parameter selection of Touzi decomposition and a distribution improved autoencoder for PolSAR image classification." ISPRS Journal of Photogrammetry and Remote Sensing 186 (2022): 246-266. c. [CrossRef]
- Awwad, Ameen, Ghaleb A. Husseini, and Lutfi Albasha. "AI-Aided Robotic Wide-Range Water Quality Monitoring System." Sustainability 16.21 (2024): 9499. [CrossRef]
- Tynchenko, Vadim, et al. "Predicting Tilapia Productivity in Geothermal Ponds: A Genetic Algorithm Approach for Sustainable Aquaculture Practices." Sustainability 16.21 (2024): 9276. [CrossRef]
- Liu, Yang, et al. "Ada-XG-CatBoost: A Combined Forecasting Model for Gross Ecosystem Product (GEP) Prediction." Sustainability 16.16 (2024): 7203. [CrossRef]
- Nañez Alonso, Sergio Luis, et al. "Digitalization, circular economy and environmental sustainability: The application of Artificial Intelligence in the efficient self-management of waste." Sustainability 13.4 (2021): 2092. [CrossRef]
- Zhao, Lin, et al. "Application of artificial intelligence to wastewater treatment: A bibliometric analysis and systematic review of technology, economy, management, and wastewater reuse." Process Safety and Environmental Protection 133 (2020): 169-182. [CrossRef]
- Zhou, Lei, et al. "Emergency decision making for natural disasters: An overview." International journal of disaster risk reduction 27 (2018): 567-576. [CrossRef]
- Wu, Carole-Jean, et al. "Sustainable ai: Environmental implications, challenges and opportunities." Proceedings of Machine Learning and Systems 4 (2022): 795-813.
- Khakurel, Jayden, et al. "The rise of artificial intelligence under the lens of sustainability." Technologies 6.4 (2018): 100. [CrossRef]
- Tanveer, Muhammad, Shafiqul Hassan, and Amiya Bhaumik. "Academic policy regarding sustainability and artificial intelligence (AI)." Sustainability 12.22 (2020): 9435. [CrossRef]
- Yigitcanlar, Tan, and Federico Cugurullo. "The sustainability of artificial intelligence: An urbanistic viewpoint from the lens of smart and sustainable cities." Sustainability 12.20 (2020): 8548. [CrossRef]
Figure 1.
Distribution of Injection Molding data by Settings.
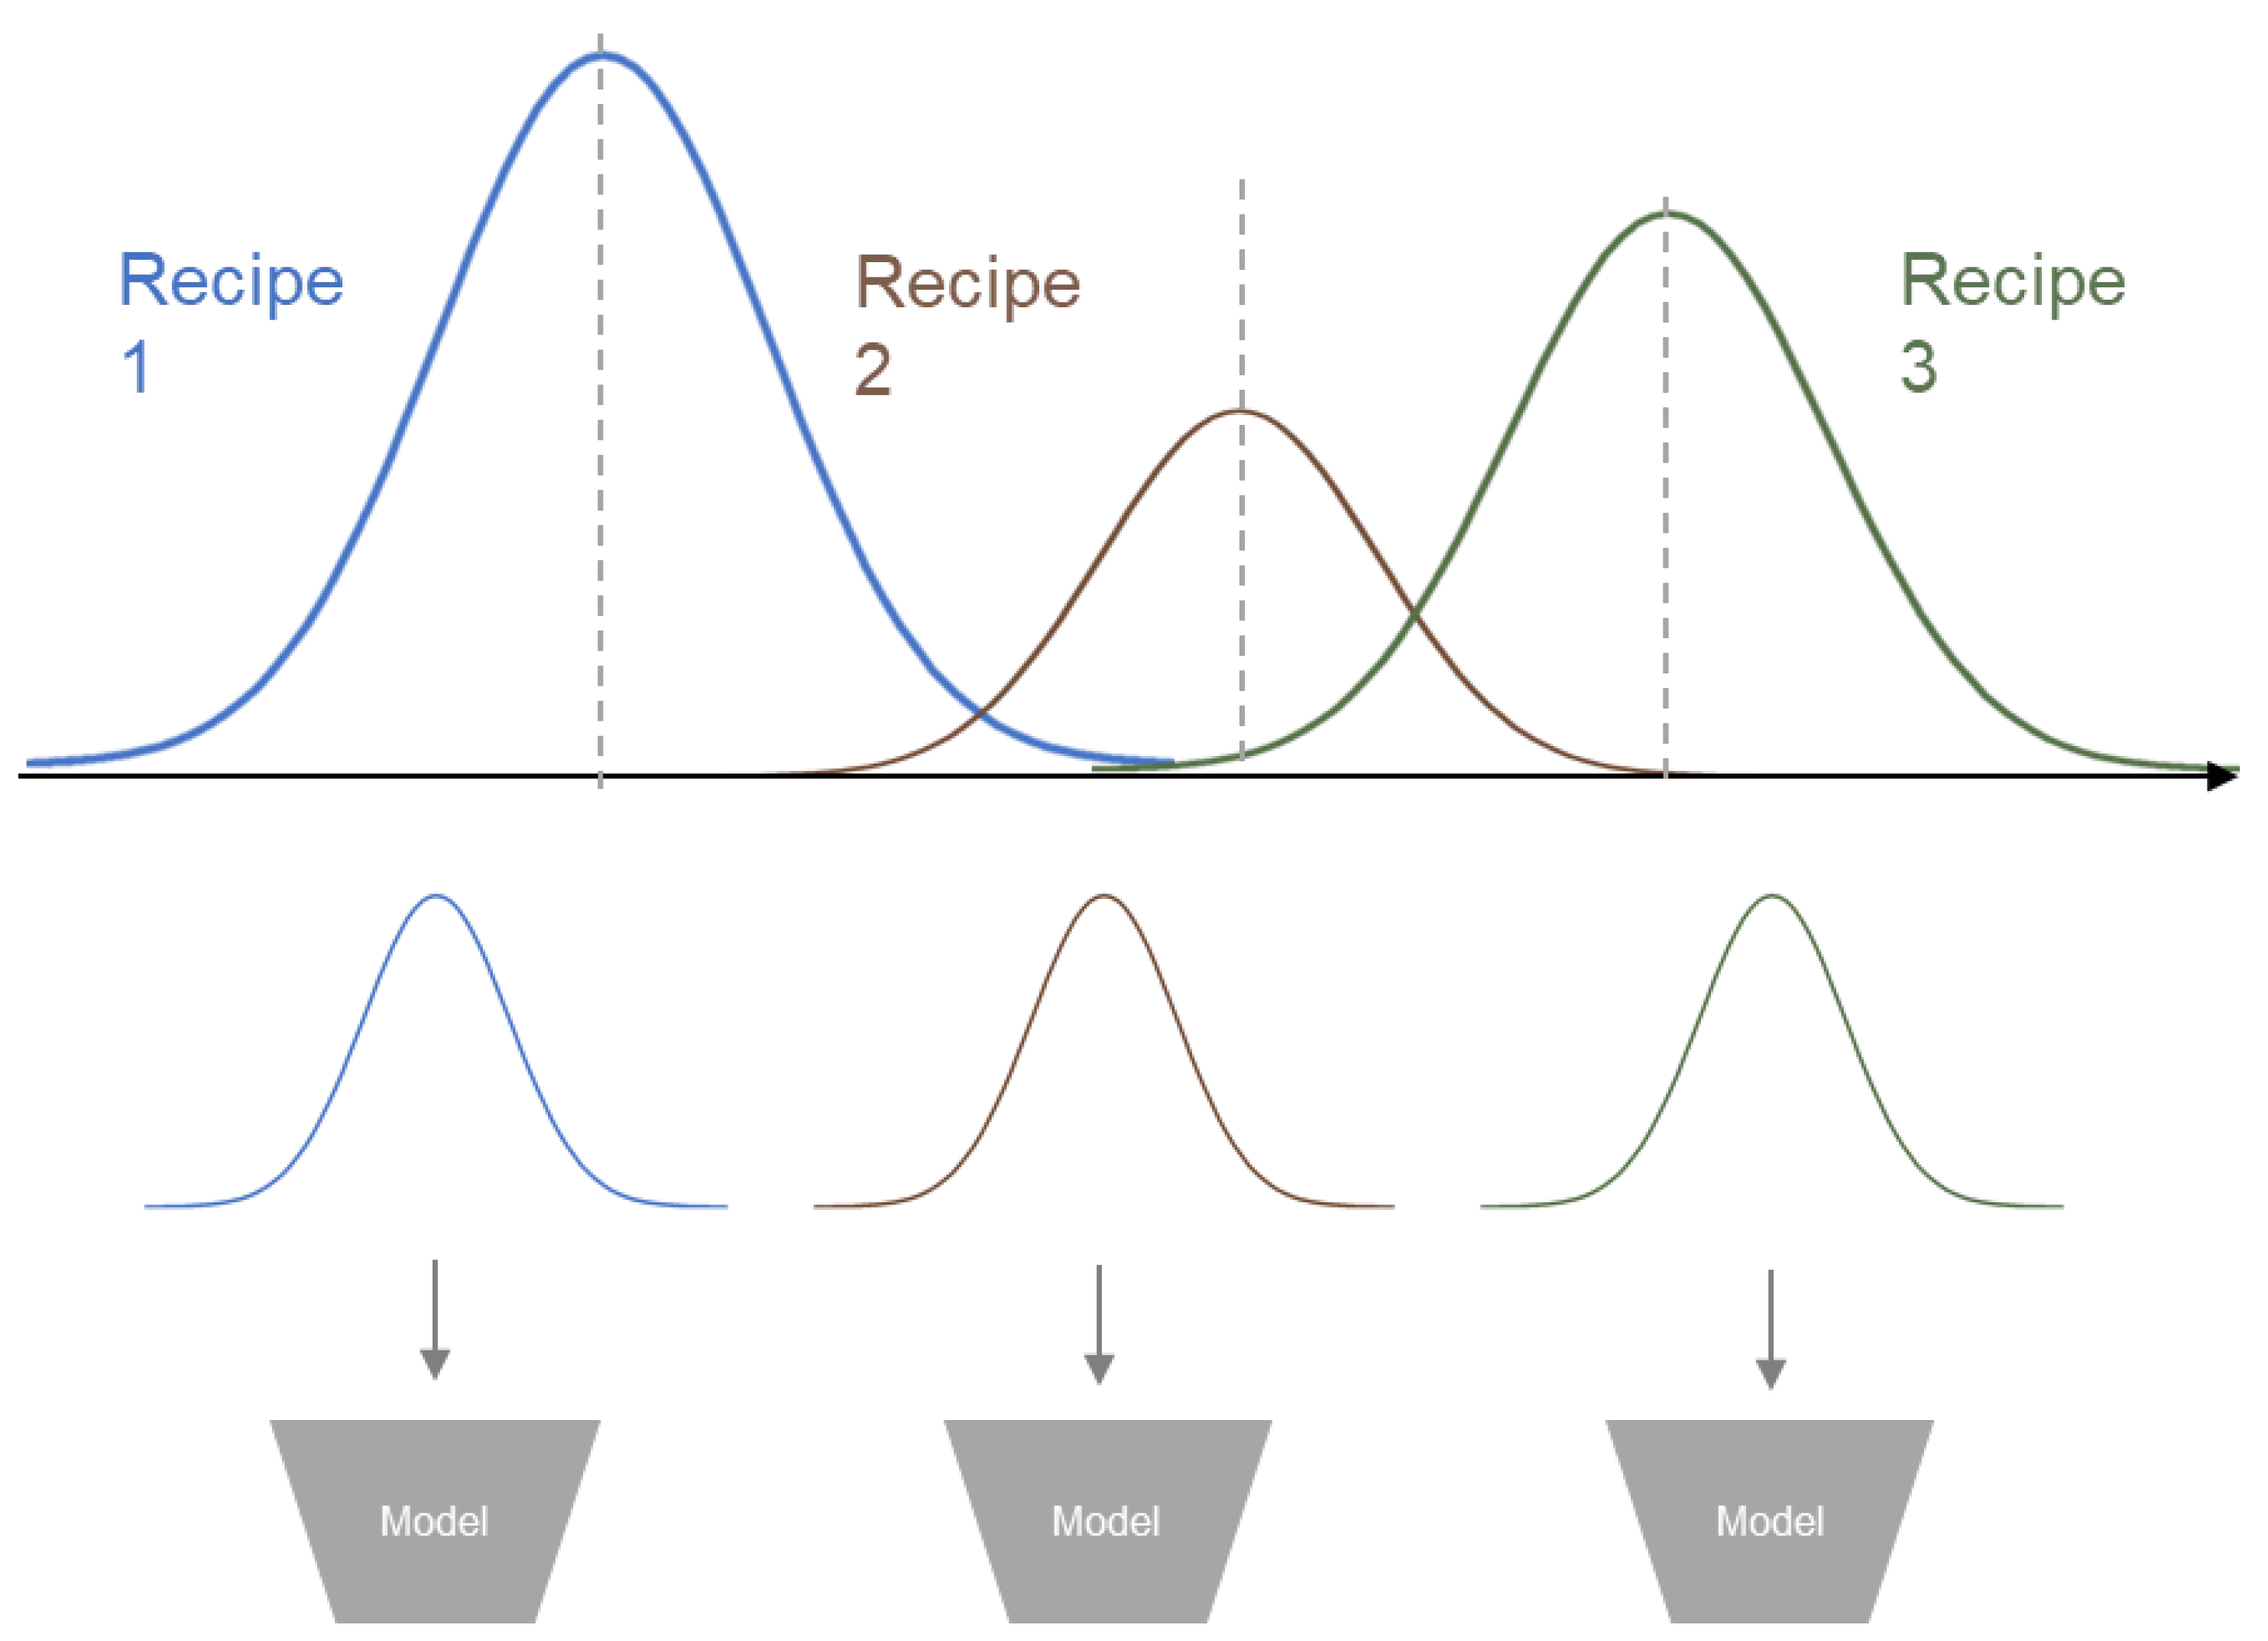
Figure 2.
General Architecture of Proposed Method.
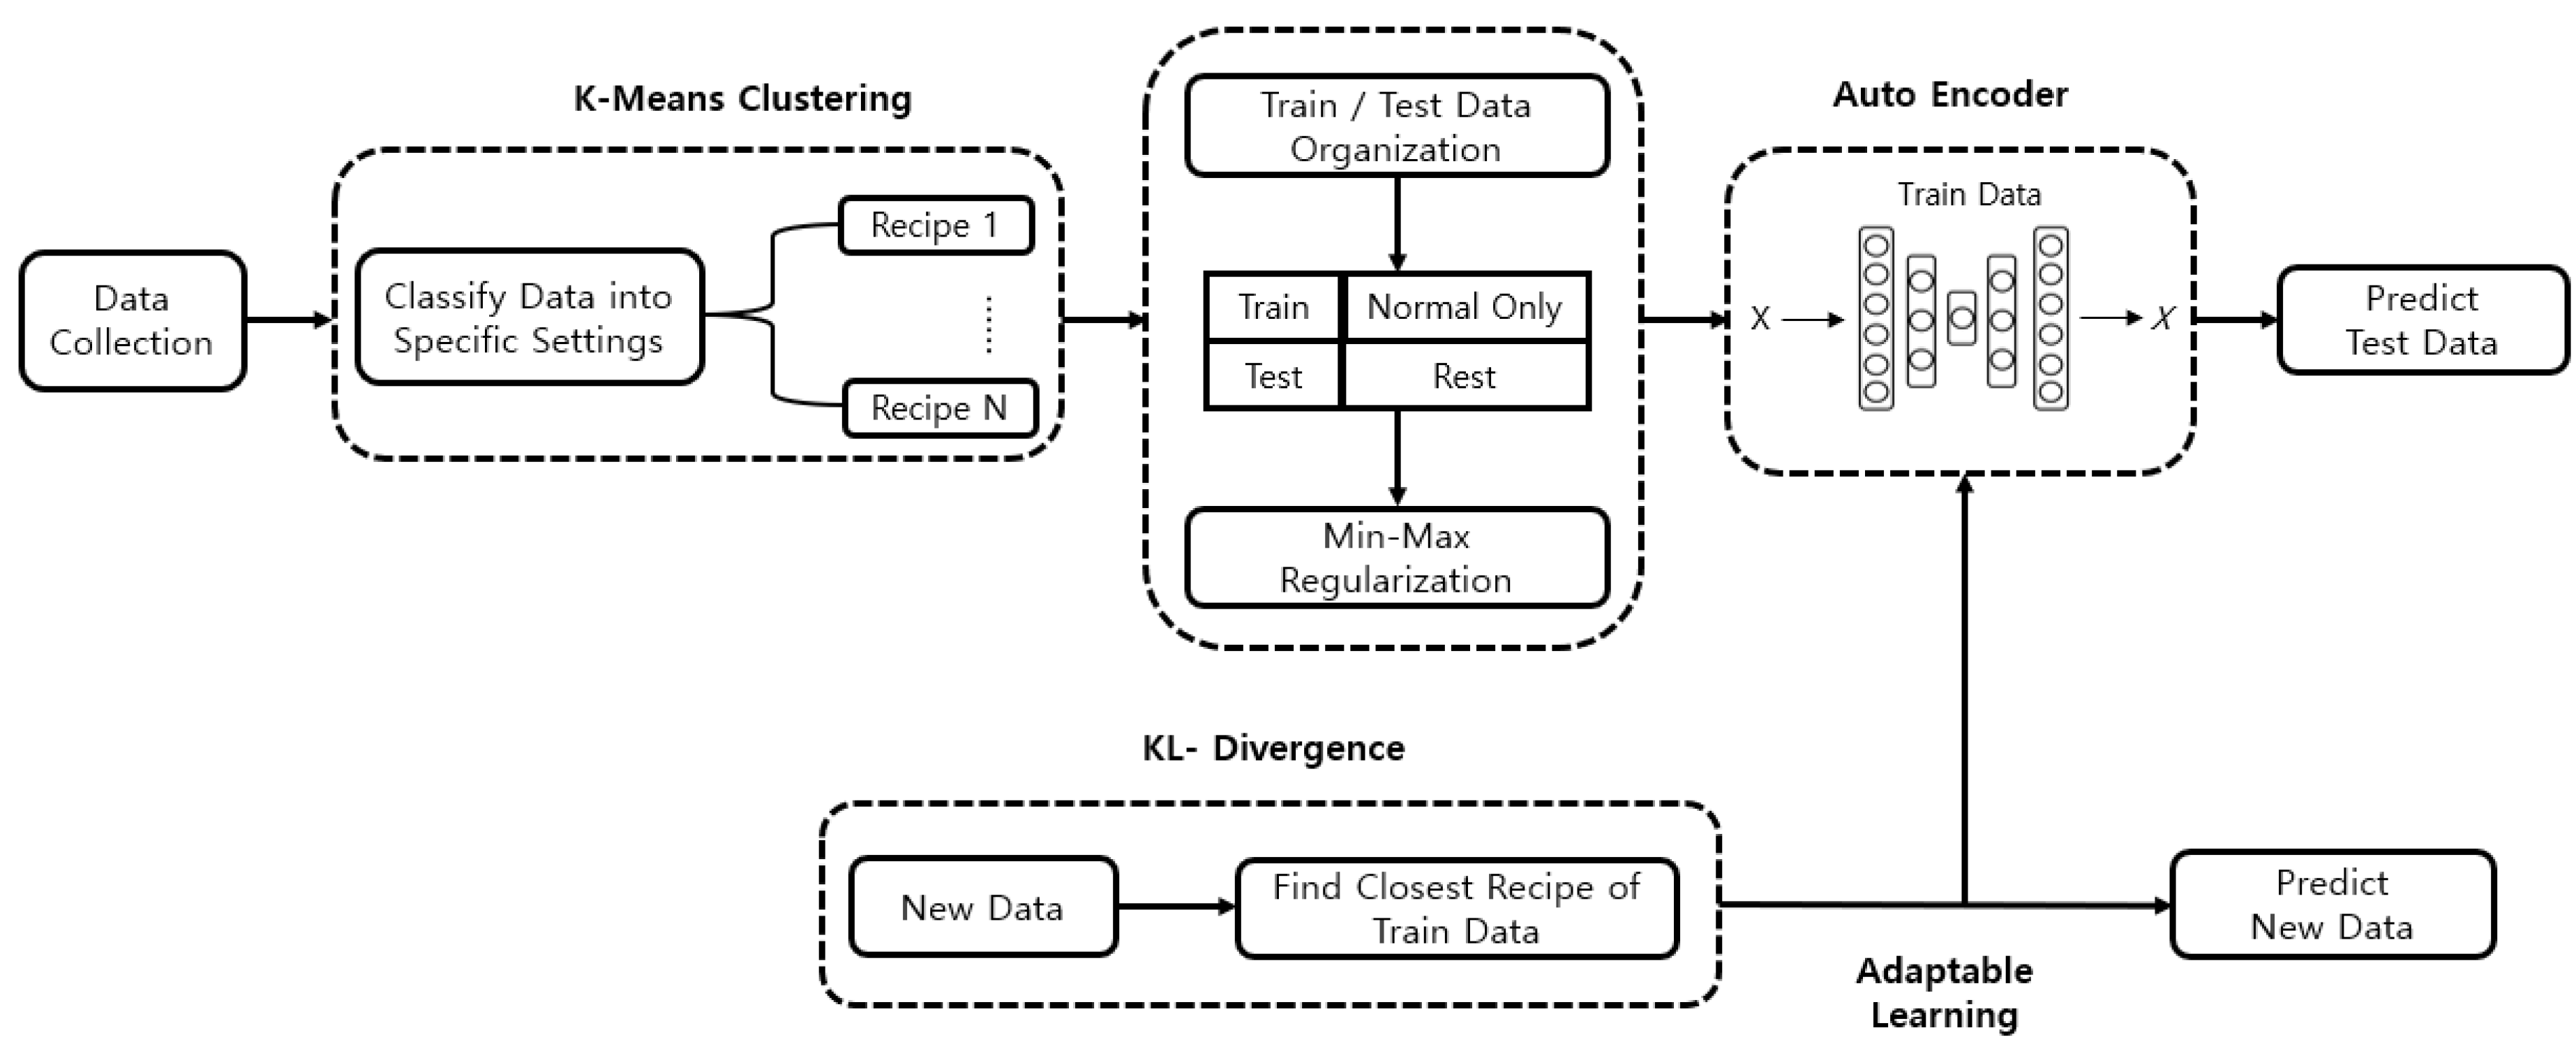
Figure 3.
Lot Process Management.

Figure 4.
K-Means Clustering Example.
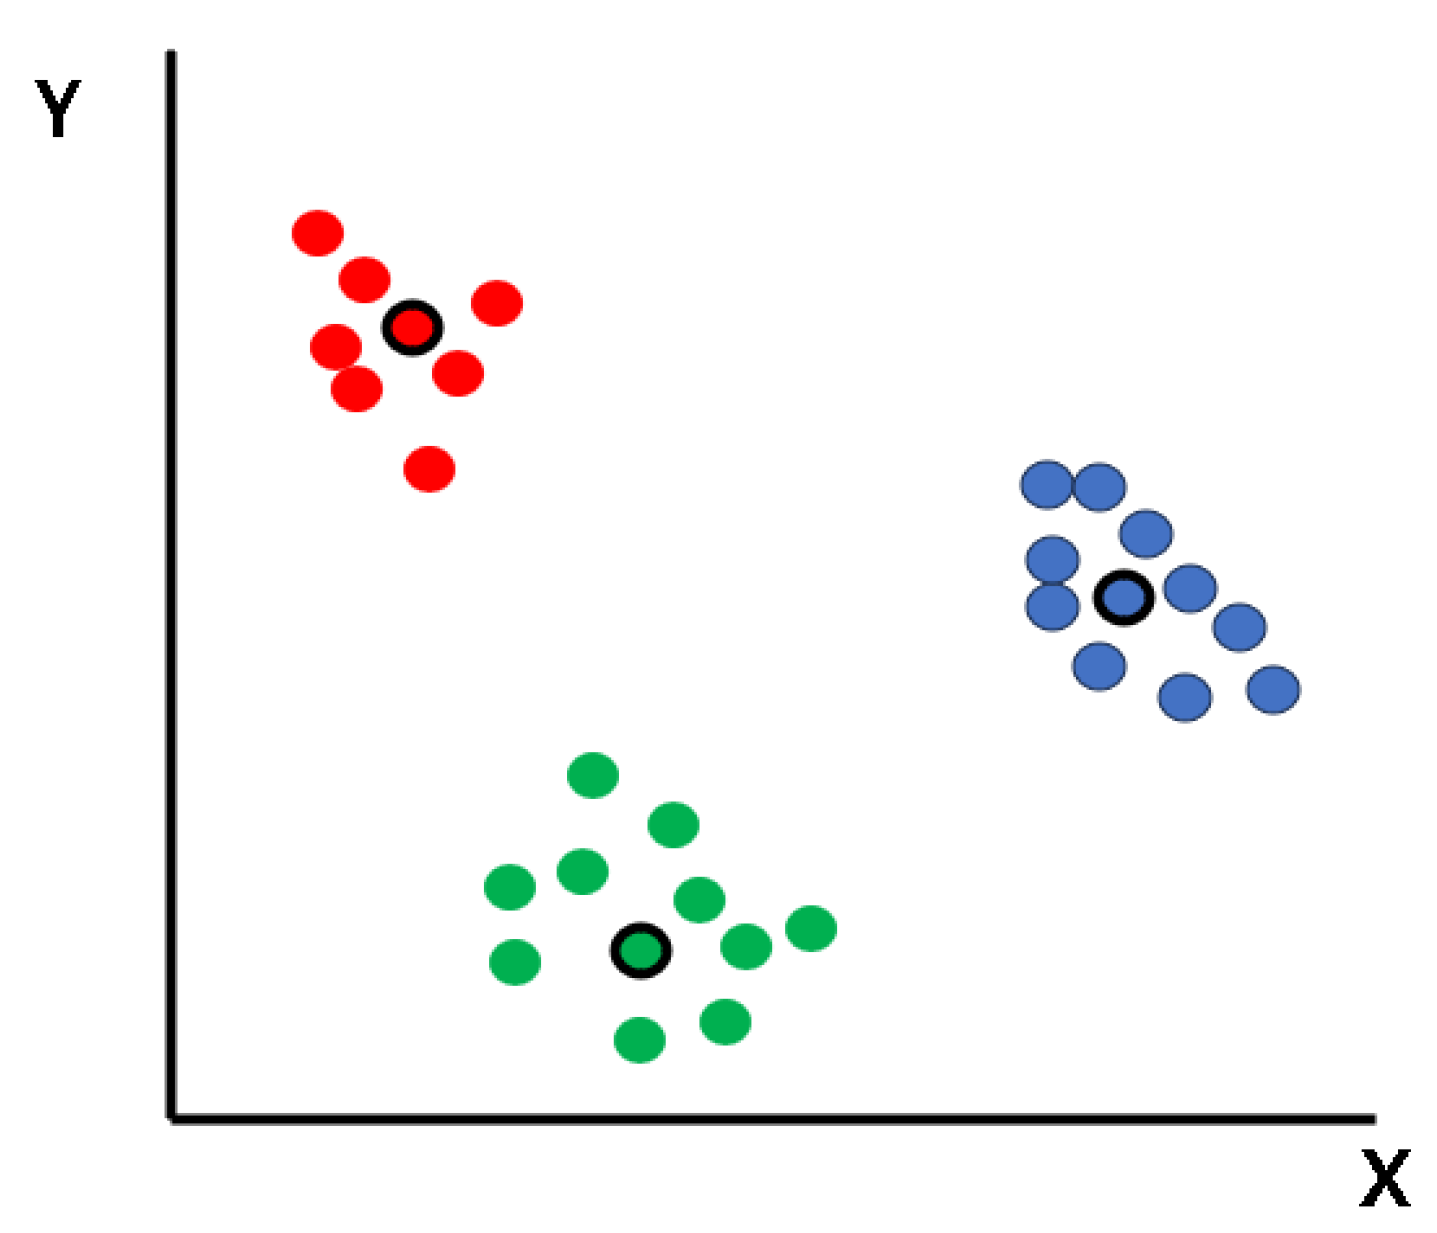
Figure 5.
Classify Data into Recipe Settings.
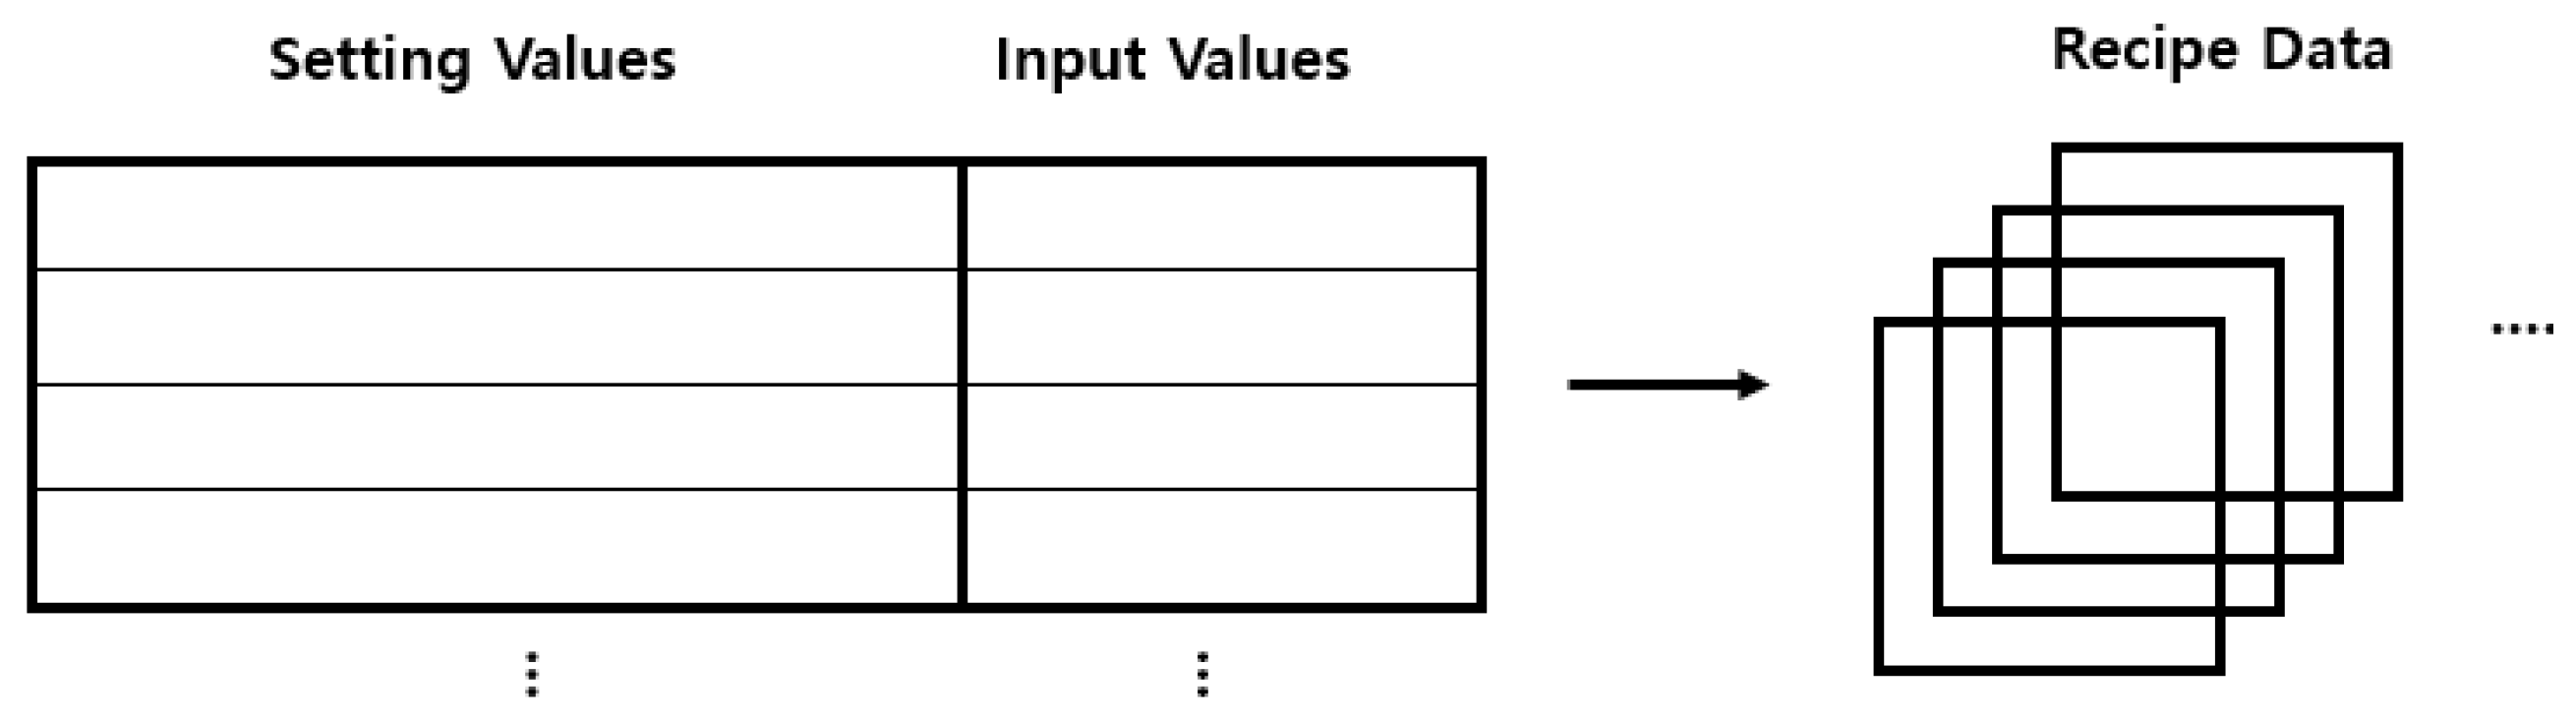
Figure 6.
Autoencoder Structure.
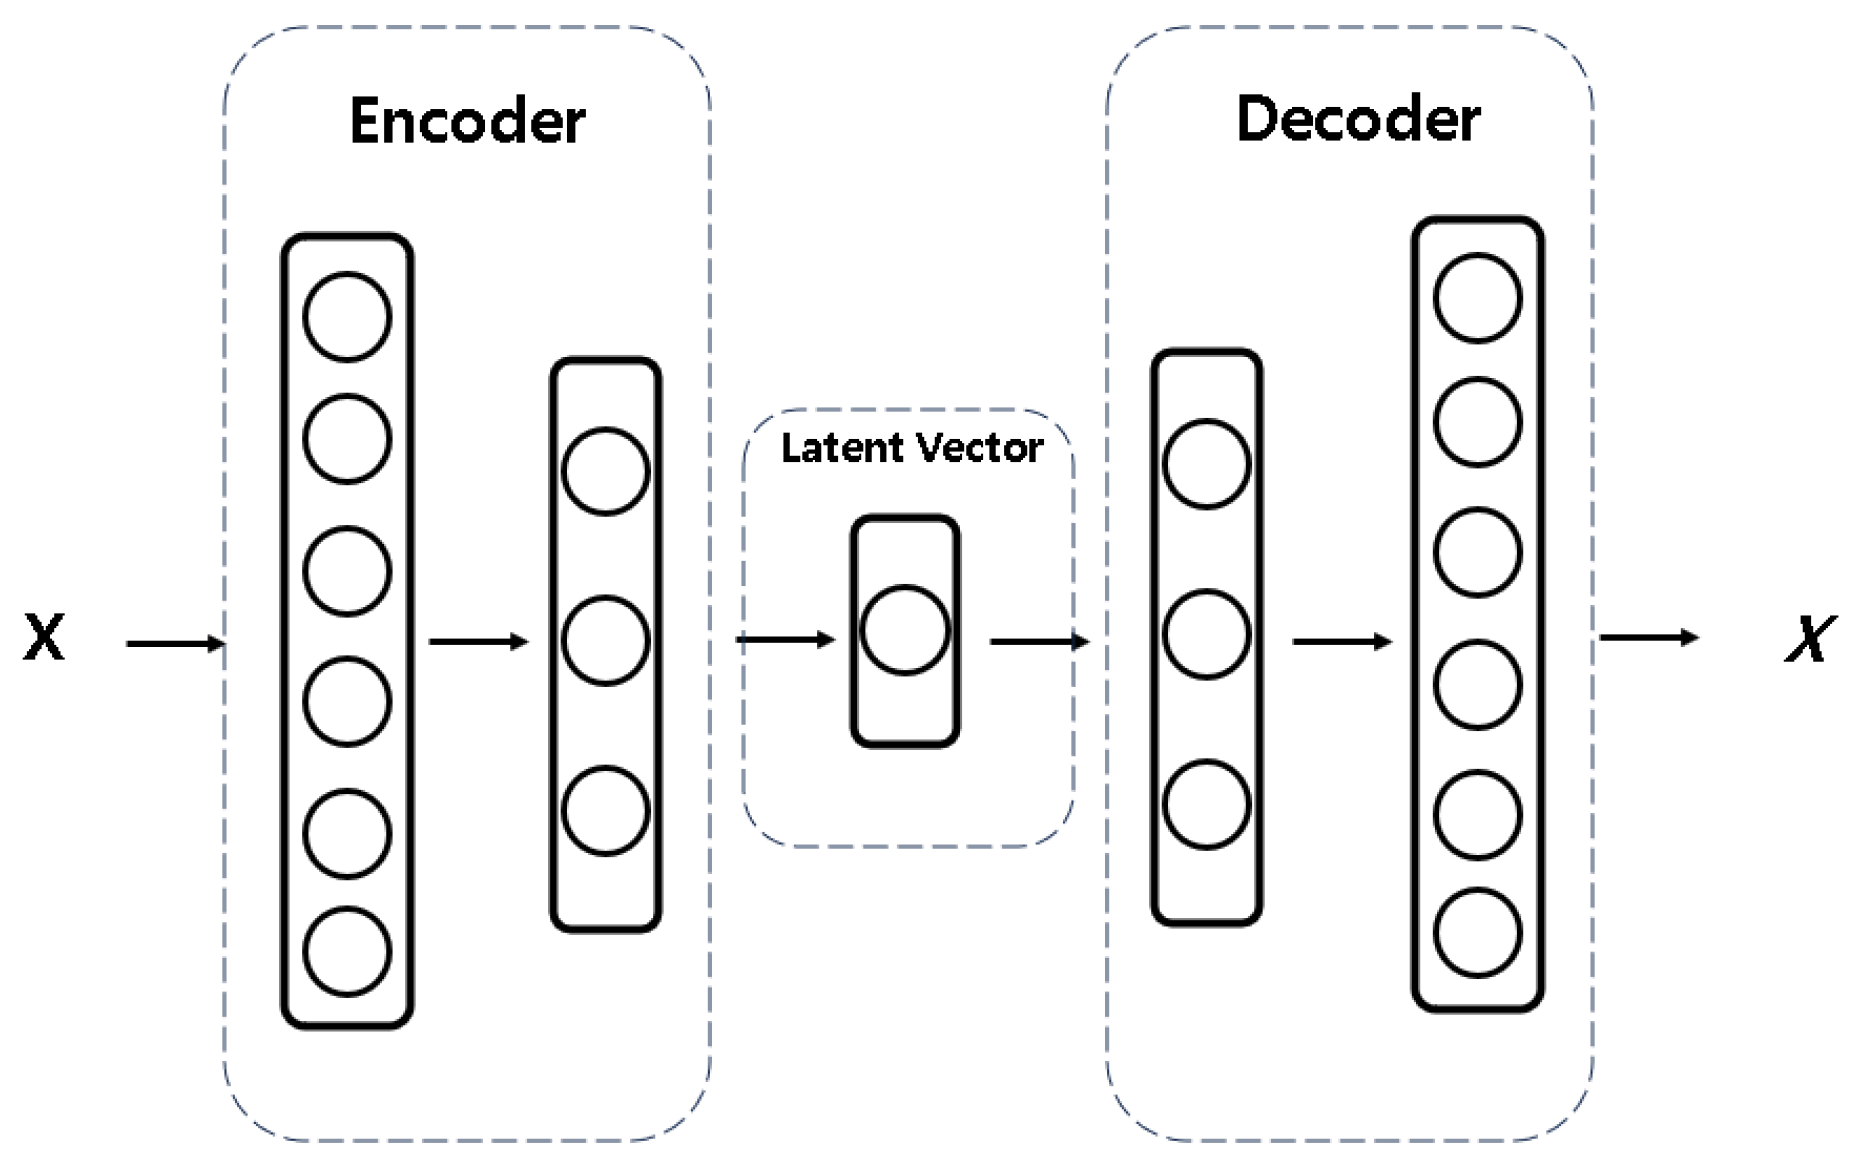
Figure 7.
KL-Divergence Application.
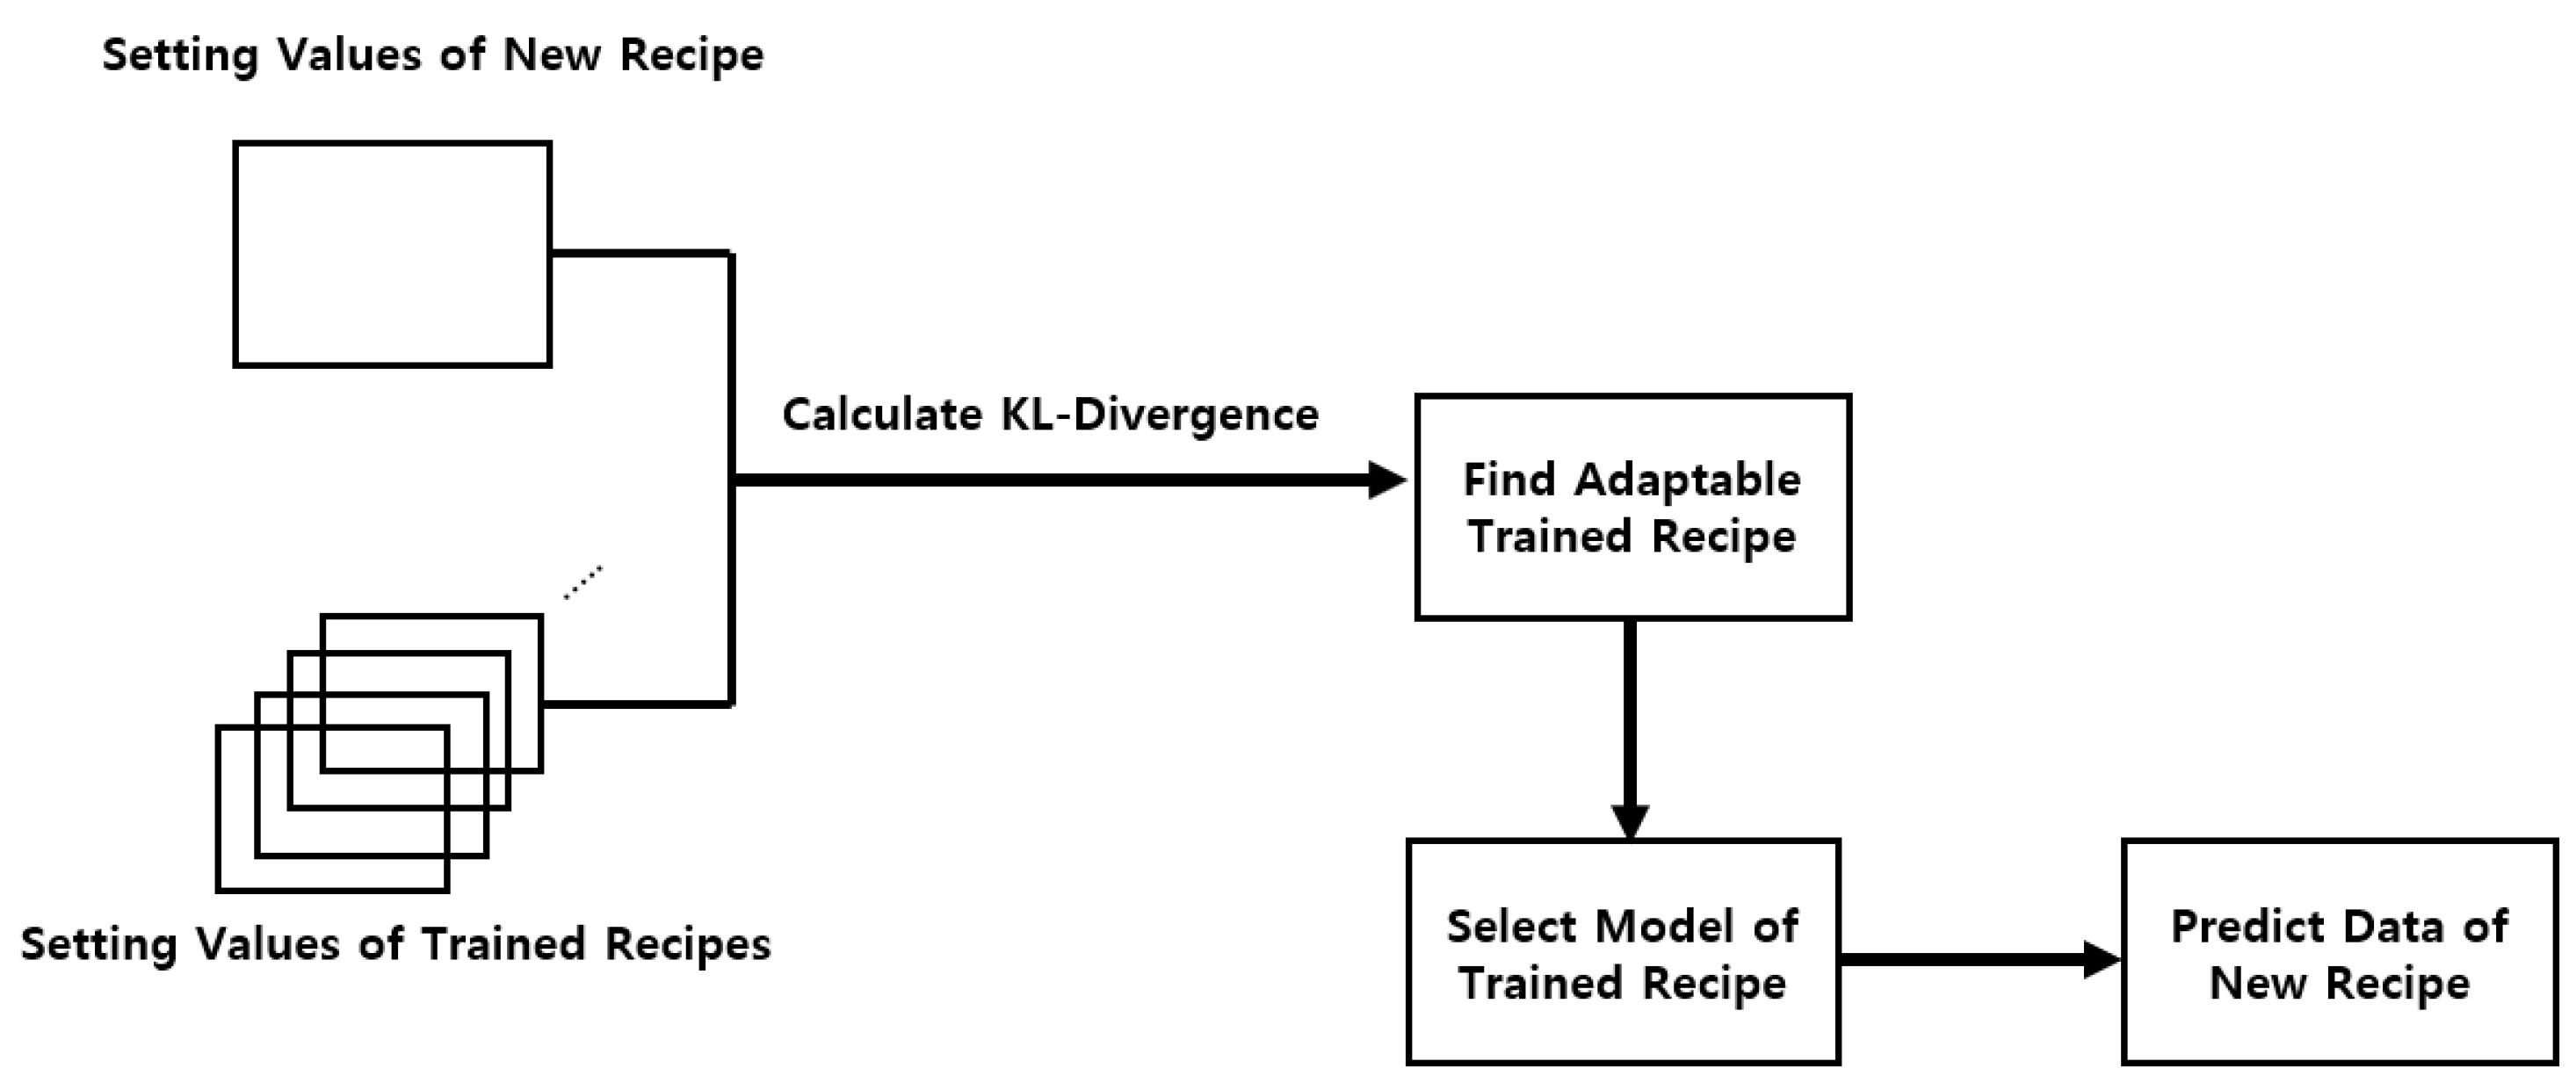
Figure 8.
Validation Thresholds.
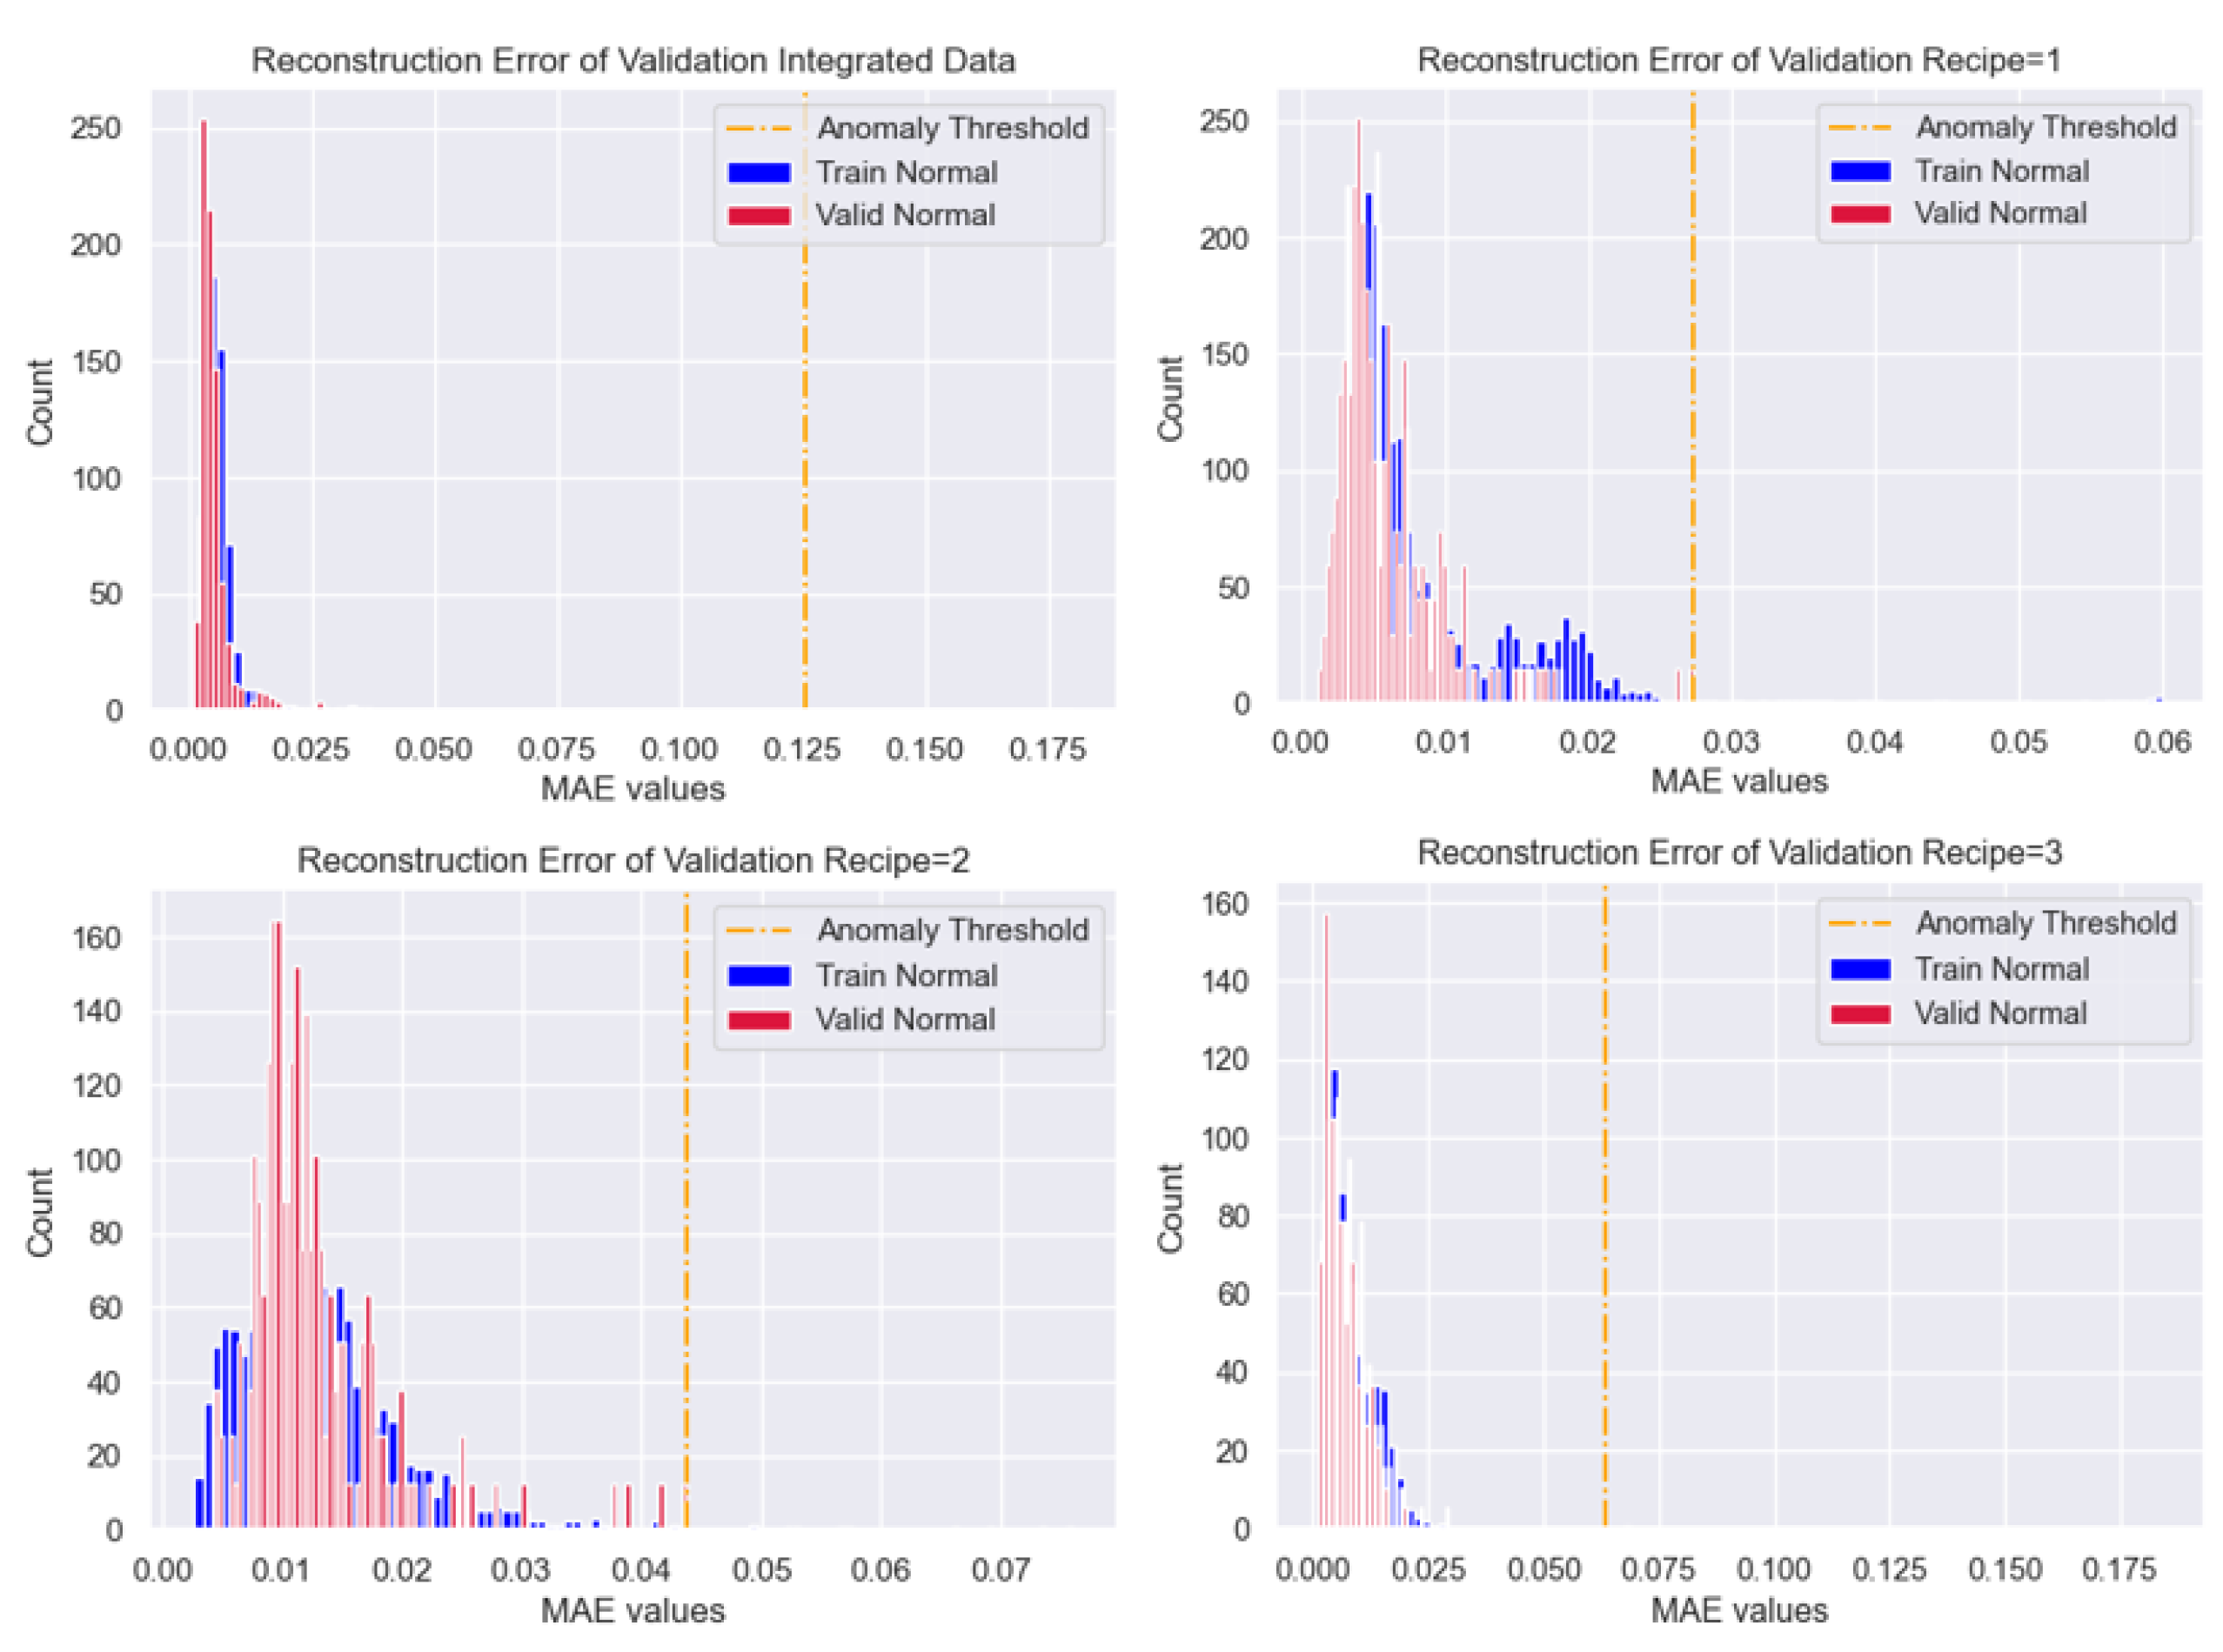

Table 1.
Example of Lot process.
| Lot Information with Specific Setting Recipe | |||||
| Lot Process Number | 20231214 | ||||
| Data Shape | 438 Data Size and 132 Features | ||||
| Setting Features | 76 Setting Values | ||||
| Input Features | 6 Input Features | ||||
| Number of Products | 438 | ||||
| Recipe(Cluster) Number | 10 | ||||
| Good Cavity Counts(Total) | 432 | ||||
| Defect Cavity Counts(Total) | 6 | ||||
| Overall Defect Ratio | Approximately 1.37 % | ||||
Table 2.
Descriptive Statistics of Input Features.
| Feature | Injection Time | Switch Position | Cushion Distance | Weight Time | Max Injection Press | Peak Pressure |
| Mean | 2.33 | 13.46 | 11.29 | 24.10 | 151.52 | 13321.01 |
| Std | 0.08 | 2.83 | 2.72 | 2.76 | 2.52 | 12.31 |
| Min | 2.19 | 7.99 | 5.88 | 17.33 | 118.73 | 13260.5 |
| 25% | 2.30 | 12.00 | 9.81 | 23.85 | 149.91 | 13312.6 |
| 50% | 2.340 | 13.50 | 11.39 | 24.26 | 151.40 | 13323.0 |
| 75% | 2.35 | 15.99 | 13.69 | 24.52 | 153.17 | 13330.4 |
| Max | 6.39 | 21.0 | 18.56 | 172.03 | 171.26 | 13358.9 |
Table 3.
Train Data Description.
| Train Dataset | Test Appliable | |||||
| Lot Defect Ratio | =0.0% | O | ||||
| Integrated Data Shape | 8190 Data Size and 6 Features | O | ||||
| Recipe1 Data Shape | 2654 Data Size and 6 Features | O | ||||
| Recipe2 Data Shape | 1996 Data Size and 6 Features | O | ||||
| Recipe3 Data Shape | 3073 Data Size and 6 Features | O | ||||
| Recipe4 Data Shape | 435 Data Size and 6 Features | X | ||||
| Recipe5 Data Shape | 31 Data Size and 6 Features | X | ||||
| Recipe6 Data Shape | 1 Data Size and 6 Features | X | ||||
Table 4.
Test Data Description.
| Test Dataset | |||||
| Lot Defect Ratio | >0.0% | ||||
| Integrated Data Shape | 5842 Data Size and 6 Features | ||||
| Recipe1 Data Shape | 4396 Data Size and 6 Features | ||||
| Recipe2 Data Shape | 475 Data Size and 6 Features | ||||
| Recipe3 Data Shape | 971 Data Size and 6 Features | ||||
Table 5.
Parameter Descriptions of Trained Autoencoders.
| Applied Parameters | Integrated Data | Recipe 1 | Recipe 2 | Recipe 3 |
| Outer Layer Size | 128 | 128 | 64 | 64 |
| Inner Layer Size | 64 | 64 | 32 | 32 |
| Latent Vector Size | 16 | 4 | 16 | 16 |
| Dropout Ratio | 0.15 | 0.1 | 0.15 | 0.15 |
| Activation Function | ’Tanh’ | |||
| Optimizer | ’Adam’ | |||
| Batch Size | 100 | 10 | 10 | 10 |
| Number of Epochs | 200 | |||
| Validation Split Ratio | 0.15 | 0.1 | 0.15 | 0.15 |
| Learning Rate | 0.01 | |||
| Early Stopping | 200 | |||
| Loss | Mean Absolute Error | |||
Table 6.
Autoencoder Anomaly Thresholds.
| Autoencoder | Validation Maximum Threshold |
| Integrated | 0.125 |
| Recipe1 | 0.0273 |
| Recipe2 | 0.0437 |
| Recipe3 | 0.0635 |
Table 7.
Prediction Comparisons(Defect Ratio).
| Lot No | Real Defect Ratio | Integrated pred | Recipe Pred |
| 20240322 | 0.514(5/971) | 0.102(1/971) | 0.617(6/971) |
| 20240402 | 0.319(1/313) | 0.00(0/313) | 0.319(1/313) |
| 20240429 | 0.879(6/682) | 0.00(0/682) | 1.173(8/682) |
| 20240430 | 0.833(7/835) | 0.00(0/835) | 1.556(13/835) |
| 20240502 | 0.611(5/817) | 0.00(0/817) | 1.22(10/817) |
| 20240507 | 1.920(7/368) | 0.00(0/368) | 0.271(1/368) |
| 20240614 | 1.312(5/381) | 0.262(1/381) | 2.099(8/381) |
| 20240617 | 0.647(2/309) | 0.00(0/309) | 0.647(2/309) |
| 20240623 | 0.289(2/691) | 0.00(0/691) | 0.723(5/691) |
| 20240717 | 0.210(1/475) | 0.00(0/475) | 1.473(7/475) |
| Sum | 0.701%(41/5842) | 0.034%(2/5842) | 1.04%(61/5842) |
Table 8.
KL-Divergence Calculation Result.
| KL-Divergence Value | |||
| New Recipes | Trained Recipe1 | Trained Recipe2 | Trained Recipe3 |
| Recipe6 | 40.1 | 41.63 | 41.12 |
| Recipe7 | 11.13 | 12.66 | 12.15 |
Table 9.
Data Organization for Additional Prediction.
| Train | Validation | Prediction |
| Recipe1 | Recipe6(Normal) | Recipe6(Defect) |
| Recipe1 | Recipe3 | Recipe 7 |
Table 10.
Prediction Comparisons of new recipes.
| New Data | Lot No | Defect Ratio | Integrated | Adaptable | Additional |
| Recipe 6 | 20240903 | 0.293(2/682) | 0.00(0/682) | 4.692(32/682) | 6.158(42/682) |
| Recipe 7 | 20240902 | 0.546(4/728) | 0.0(0/728) | 0.683(5/728) | X |
Disclaimer/Publisher’s Note: The statements, opinions and data contained in all publications are solely those of the individual author(s) and contributor(s) and not of MDPI and/or the editor(s). MDPI and/or the editor(s) disclaim responsibility for any injury to people or property resulting from any ideas, methods, instructions or products referred to in the content. |
© 2024 by the authors. Licensee MDPI, Basel, Switzerland. This article is an open access article distributed under the terms and conditions of the Creative Commons Attribution (CC BY) license (http://creativecommons.org/licenses/by/4.0/).
Copyright: This open access article is published under a Creative Commons CC BY 4.0 license, which permit the free download, distribution, and reuse, provided that the author and preprint are cited in any reuse.