Submitted:
14 November 2024
Posted:
15 November 2024
You are already at the latest version
Abstract
Abstract
Background: Persistently hyperglycemic condition in type 2 diabetic mellitus disrupts the controlled coordinated system of glucose metabolism by glycolysis and this is aggravated by lipid peroxidation end products (ALEs). Purpose of this study is to determine the role of advanced lipoxidation end products on the activities of hexokinase, the gatekeeper enzyme and lactate dehydrogenase, the survival enzyme of glycolysis in different stages of diabetic retinopathy.
Methods: In the present study, we enrolled a total of 236 consecutively selected subjects comprising of 57 healthy control (HC), 59 diabetics with no retinopathy (DNR), 55 mild non-proliferative diabetic retinopathy (MNPDR or just NPDR), and 65 high-risk proliferative diabetic retinopathy (HRPDR). Erythrocyte Hexokinase (HK) activity was assessed by specific methods. The activity of hexokinase was expressed as µmol of glucose phosphorylated/min/g Hb. Lactase Dehydrogenase (LDH) activity in plasma was estimated utilizing an LDH-P kit (Cat. No. D94651, DIALAB, Neudorf, Austria). Hexanoyl Lysine (HLY) was measured by competitive enzyme immune assay technique using commercial kits.
Results: Hexokinase activity is significantly dependent on advanced lipid peroxidation products, HLY.
Conclusion: At the progression of DR (MNPDRHRPDR) from DNR group, dysregulation of glycolytic pathway by lipid peroxidation is responsible.
Keywords:
DR
; HK
; LDH
; HLY
1. Introduction
It is clearly established that prolonged glycemia may not be the sole factor for the development of microangiopathy in diabetes mellitus. It is also perceived that continuity of glycolysis, the principal route of metabolism of glucose at the coordinated method may prevent or delay the microvascular complication.
Glucose enters into the principal metabolic pathway of glucose utilization, for example, glycolytic pathway by phosphorylation to glucose 6-phosphate and this reaction is catalyzed by hexokinase. ATP is verry much essential as phosphate donor and this phosphorylation reaction requires Mg-ATP complex where terminal high-energy phosphate of ATP is used and ADP is produced. Under pathological conditions, the phosphorylation reaction is associated with considerable loss of free energy as heat and is regarded as irreversible. Though glucose 6-phosphate is an important product or compound at the junction of several metabolic pathway, for example, glycolysis, pentose phosphate pathway, glycogenesis and glycogenolysis; hexokinase is inhibited in an allosteric manner by glucose 6-phosphate. In glycolysis, glucose 6-phosphate undergoes another phosphorylation with ATP catalyzed by phosphofructokinase to form fructose 1,6-biphosphate. This reaction is also considered as functionally irreversible and rate-limiting in glycolysis because generation of glyceraldehyde 3-phosphate is totally NAD+ dependent. Adequately continuous supply of NAD+ in longstanding hyperglycemia is interrupted and is considered as the most basic or root biochemical anomaly leading to various metabolic derangements owing to non-utilization of significant portion of intracellular glucose in glycolysis. [1,2] To run the glycolysis pathway under the pseudo-hypoxic condition, lactate dehydrogenase enzyme embrace the remarkable responsibility to reduce pyruvate, the end product of glycolysis, to lactate in order to re-oxidize NADH and therefore regenerate sufficient NAD+ for continuity of glycolysis.
Due to increased lactate production from anaerobic glycolysis, lowering pH of neuronal environment inhibits glutamate uptake from synaptic space. Increased extracellular glutamate activates NMDA receptors of adjacent neurons leading to increased intracellular Ca++ and activation of phospholipase causing degradation of membrane phospholipid and generation of eicosanoids and platelet activating factors. Ultimately, vasoconstriction-ischemia and oxygen derived free radicals promote lipid peroxidation. [3,4] Reactive lipid peroxidation product interact with amino acid residues of membrane protein resulting in adduct formation which finally led to formation of electrophilic lipoxidation end product. These ALEs alter the conformational integrity of protein including enzymes of glycolysis and inhibit the binding of substrates with the catalytic sites of enzymes. [5,6] So, one thread of glycolysis is controlled by ALEs and avoidance of ALEs formation may shower new therapeutic light in diabetic related complications.
2. Methodology
2.1. Study Subjects
This study included 236 subjects from the Retina Clinic of Regional Institute of Ophthalmology (RIO), Kolkata, categorized as follows: 57 healthy controls (HC), 59 with diabetic non-retinopathy (DNR), 55 with mild/moderate non-proliferative diabetic retinopathy (MNPDR), and 65 with high-risk proliferative diabetic retinopathy (HRPDR). The subjects age ranged from 45 to 65 years. Exclusion criteria included coronary artery disease, hypertension (systolic BP > 140 mm Hg, diastolic BP > 90 mm Hg, or on antihypertensive treatment), neuropathy, nephropathy (serum creatinine > 1.5 mg/dl or urine albumin-to-creatinine ratio > 300 μg/mg), and other ocular diseases (e.g., glaucoma, cataracts, branch retinal vein occlusion, optic neuropathy, or Eales disease). Ethical approval was obtained from the Institutional Ethics Committee of the RIO, Medical College, Kolkata (Ref. No: MC/KOL/IEC/NON-SPON/181/12-2018). Informed consent was secured from all participants per the Declaration of Helsinki. Participants diagnosed with Type 2 diabetes mellitus (T2DM) followed the American Diabetes Association (2010) guidelines. Glycemic status was assessed via fasting plasma glucose (FPG), postprandial plasma glucose (PPG), and glycated hemoglobin (HbA1c %). None were on insulin or lipid-lowering medications during the study.
2.2. Ophthalmological Examinations
All study subjects underwent comprehensive ophthalmological evaluations, which included slit-lamp biomicroscopy (using a 90-diopter lens and a Goldman 3-mirror lens), digital fundus photography with fluorescein angiography (to confirm diabetic retinopathy in T2DM subjects), and spectral-domain optical coherence tomography (SD-OCT) to detect macular edema. Visual function was also assessed by measuring visual acuity (VA). Diabetic retinopathy (DR) was diagnosed following the modified Early Treatment Diabetic Retinopathy Study (ETDRS) guidelines (1991).
2.3. Collection and Processing of Blood Samples
Following overnight fasting, 5 ml of venous blood was collected from each subject in ethylenediaminetetraacetic acid (EDTA) vacutainers. The levels of HbA1C (%) and the enzymatic activities of hexokinase (HK) was assessed from hemolysate samples. Plasma samples were used to evaluate glucose levels, lactate dehydrogenase (LDH) activity, and various lipid components, including free fatty acids (FFA), malondialdehyde (MDA), 4-hydroxynonenal (HNE), and hydroxylysine (HLY).
2.4. Evaluation of Glycemic Status
Fasting and postprandial plasma glucose levels were determined using the colorimetric endpoint method (Trinder, 1969) with a commercially available kit (Labcare Diagnostics (India) Pvt. Ltd., Mumbai, India). Glycated hemoglobin (HbA1C) was measured by direct enzymatic assay using a Diazyme Laboratories kit (Poway, CA), as previously discussed in our earlier publication (Mondal et al., 2019).
2.5. Measurement of Hexanoyl Lysine (HLY)
Human plasma HLY was measured using a competitive enzyme immunoassay technique with commercial kits (MyBioSource, Catalog no: MBS753480) according to the manufacturer's protocol.
2.6. Assessment of Erythrocyte Hexokinase Activity
Packed erythrocytes were lysed using cold hypotonic phosphate-buffered saline (pH 7.4). Hemolysate was separated by centrifugation at 2000 rpm for 10 minutes, and the supernatant was used to assess hexokinase activity, as reported by Ramalingam et al. (2020) [7]. A reaction mixture (5.3 ml total volume) was prepared using 1 ml glucose (0.005 M), 0.5 ml adenosine triphosphate (0.072 M), 0.1 ml magnesium chloride (0.05 M), 0.4 ml potassium dihydrogen phosphate (0.0125 M), 0.4 ml potassium chloride (0.1 M), 0.4 ml sodium fluoride (0.5 M), and 2.5 ml Tris-HCl buffer (0.01 M, pH 8.0). After 5 minutes of pre-incubation at 37°C, 1 ml of supernatant was added to initiate the reaction. A zero-time sample was collected, and after a 30-minute incubation at 37°C, the reaction was stopped, and the residual glucose was quantified using the O-toluidine method. The activity of hexokinase was expressed as µmol of glucose phosphorylated/min/g Hb.
2.7. Assessment of Plasma LDH Activity
Plasma LDH activity was determined using the DGKC method as described by Javaraiah et al. (2020) [8], utilizing an LDH-P kit (Cat. No. D94651, DIALAB, Neudorf, Austria) asper manufacturer’s instructed protocol.
2.8. Statistical Analysis Approach
The aim of the analysis was to explore relationships between the enzyme levels, advanced lipoxidation end-product and the progression of diabetic retinopathy. The following steps were taken for the statistical analysis:
1. Descriptive Statistics: Means and standard deviations for each enzyme were calculated within each patient group to understand the central tendencies and variability of the data [9].
2. One-Way Analysis of Variance (ANOVA): The one-way ANOVA is used to compare the means of three or more groups to determine if there is a statistically significant difference between them. In this study, it was applied to evaluate the mean levels of enzymes (e.g., Hexokinase, LDH) and HLY across different diabetic retinopathy categories (DNR, HC, HRPDR, NPDR). The F-value in an ANOVA test measures the ratio of variance between group means to the variance within the groups [9]. It is calculated as:
where:
MSB (Mean Square Between) measures the variance between group means,
MSW (Mean Square Within) measures the variance within groups.
The p-value indicates the probability that the observed F-value occurred by chance under the null hypothesis (i.e., all group means are equal). It is used to determine the statistical significance of the F-value. A high F-value and a p-value < 0.05 indicate that at least one group mean is significantly different from the others, suggesting that enzyme or HLY levels vary across DR categories.
3. Covariance and Precision Matrices: To investigate the interdependence between the three enzymes, covariance and precision matrices were calculated. The covariance matrix provided insights into the strength and direction of linear relationships between the enzyme levels. The precision matrix, the inverse of the covariance matrix, helped reveal direct interactions between the enzymes while controlling for the effects of others [10].
(a) Covariance Matrix:
The covariance matrix shows the pairwise covariance between different variables (e.g., HLY, Hexokinase, and LDH). It measures how much two variables change together:
Positive values indicate that as one variable increases, the other tends to increase.
Negative values suggest an inverse relationship. In this study, the covariance matrix helps us understand how the enzymes (Hexokinase, LDH) and HLY interact with each other across different categories of diabetic retinopathy.
(b) Precision Matrix:
The precision matrix is the inverse of the covariance matrix and provides insight into the conditional dependencies between variables:
Each non-zero off-diagonal element in the precision matrix indicates a direct relationship between the corresponding variables, after controlling for the effects of the other variables.
In our context, the precision matrix helps identify direct interactions between enzymes and HLY, offering insights into their role in disease mechanisms without the influence of other enzymes.
4. Linear Regression: Linear regression is a statistical method used to model the relationship between a dependent variable (outcome) and one or more independent variables (predictors) [11]. In this study, it was applied to examine the relationship between enzyme levels (i.e., Hexokinase, LDH), advanced lipoxidation end product (HLY) and their impact on specific categories of diabetic retinopathy (DNR, HC, HRPDR, NPDR). Two linear regression models were fitted to explore the relationships between pairs of enzymes:
Model 1: HLY as the predictor and Hexokinase as the outcome.
Model 2: HLY as the predictor and LDH as the outcome.
The aim is to find the best-fit line that gives the least residual error as given by the formula:
where:
is the dependent variable (e.g., Hexokinase or LDH),
is the independent variable (e.g., HLY),
is the intercept (value of when ),
is the slope (change in for a one-unit change in ),
is the error term (residuals).
The method commonly used to find the best-fit line is Ordinary Least Squares (OLS), which minimizes the sum of the squared residuals (the errors) to find the optimal values for and .
In this study, linear regression helps to quantify the relationship between the biochemical markers (e.g., HLY) and enzyme activities (Hexokinase, LDH). This helps to predict enzyme levels based on the values of other variables (e.g., how changes in HLY levels affect LDH) and to understand how strongly each enzyme or marker is associated with different stages of diabetic retinopathy, providing insights into their potential as biomarkers for disease progression. The analysis yields important coefficients, the R-squared (which explains how much of the variance in the dependent variable is explained by the independent variable), and p-values for testing the statistical significance of these relationships.
3. Results
3.1. Descriptive Statistics
The means and standard deviations of enzyme levels were calculated for each group to provide an overview of the enzyme activity distribution. The results (Table 1) showed distinct patterns:
Hexokinase levels were highest in the HC group (mean = 1.53 µM of glucose phosphorylated/min/gm Hb) and decreased progressively across the DNR, MNPDR, and HRPDR groups, with the lowest levels observed in the HRPDR group (mean = 0.345 µM of glucose phosphorylated/min/gm Hb).
LDH levels, in contrast, increased progressively from HC (mean = 160.4 U/L) to HRPDR (mean = 394.5 U/L), indicating a positive association between LDH and the severity of diabetic retinopathy.
HLY levels varied similarly to LDH, showing an increase as the condition progressed.
3.2. One-Way ANOVA and Post-Hoc Analysis
The one-way ANOVA indicated significant differences in enzyme levels across the four groups for all three enzymes. The conclusions that can be drawn are as follows:
Hexokinase: The HRPDR group had significantly lower Hexokinase activity compared to all other groups. Similarly, MNPDR and DNR groups showed reduced Hexokinase activity compared to HC.
LDH: LDH levels were significantly higher in the HRPDR group compared to the other groups, with the most substantial increase seen between HRPDR and HC.
HLY: HLY levels followed the same trend, with significant increases from HC to HRPDR.
These results suggest a clear trend in enzyme activity changes as diabetic retinopathy progresses, with Hexokinase levels decreasing and LDH and HLY levels increasing.
3.3. Covariance and Precision Matrices
Covariance Matrix Analysis
Table 2 presents the covariance matrix for the variables HLY (hydroxylysine), Hexokinase, LDH (lactate dehydrogenase), and the NAD+/NADH ratio. The results indicate the following significant relationships:
HLY exhibited a strong positive covariance with LDH (9450.35), suggesting that increases in HLY levels are associated with increased LDH levels. In contrast, HLY displayed a moderate negative covariance with both Hexokinase (-45.28) and the NAD+/NADH ratio (-508.16), indicating that higher HLY levels correspond to lower levels of these variables.
Hexokinase had a negative covariance with LDH (-39.86), suggesting an inverse relationship, while it demonstrated a slight positive covariance with NAD+/NADH (2.25), indicating a minimal association.
LDH showed a strong positive covariance with HLY (9450.35) and a moderate negative covariance with NAD+/NADH (-451.16), reinforcing the notion that elevated LDH levels may coincide with reduced NAD+/NADH levels.
The NAD+/NADH ratio displayed a moderate negative covariance with both HLY (-508.16) and LDH (-451.16), indicating an inverse relationship, while it had a weak positive covariance with Hexokinase (2.25).
Precision Matrix Analysis
The precision matrix, shown in Table 3, elucidates the direct relationships among the variables after controlling for the influence of others:
The partial correlation between HLY and Hexokinase (0.0539) suggests a moderate positive association, indicating that HLY influences Hexokinase when accounting for LDH and NAD+/NADH.
Hexokinase exhibited a high precision value (24.814), reflecting strong internal regulation and suggesting a high degree of independence from the other variables.
A strong inverse relationship (-0.8886) was observed between Hexokinase and NAD+/NADH, indicating that changes in Hexokinase activity are closely linked to shifts in redox balance.
The relationship between LDH and NAD+/NADH was negligible (0.0006), suggesting that any association between these variables is likely indirect, influenced more by HLY and Hexokinase.
These results underscore the intricate interactions among metabolic and oxidative stress markers, emphasizing the potential biological implications of these relationships in the context of conditions such as diabetic retinopathy.
4. Linear Regression Analysis
Three linear regression models were fitted to explore relationships between pairs of enzymes:
Model 1 (HLY vs. Hexokinase): The model is shown in Figure 1. The R-squared value was 0.782, indicating that 78.2% of the variation in Hexokinase levels could be explained by changes in HLY levels. The relationship was significant, with a negative coefficient for HLY, suggesting that higher HLY levels correspond to lower Hexokinase activity.
It shows a clear negative slope, indicating an inverse relationship. As HLY levels increase, Hexokinase levels decrease.
Equation: Hexokinase=1.7449−0.0039×HLY
R-squared: 0.782 (78.2% of variability explained)
The strong negative correlation suggests that higher HLY levels significantly inhibit Hexokinase, contributing to metabolic disruption in diabetic conditions.
Model 2 (HLY vs. LDH): This model is shown in Figure 2. This model showed a moderate positive correlation, with an R-squared value of 0.549. HLY had a positive effect on LDH levels, meaning that an increase in HLY was associated with an increase in LDH activity.
It shows an upward trend, with a positive slope, meaning that LDH activity increases as HLY levels rise.
Equation: LDH=88.4583+0.8220×HLY
R-squared: 0.549 (54.9% of variability explained)
A moderate positive relationship indicates that HLY may be linked with the increase in LDH, potentially reflecting a shift towards anaerobic metabolism.
Model 3 (HLY vs. NAD+/NADH): This model is shown in figure 3. The analysis showed a strong negative correlation between HLY levels and the NAD+/NADH ratio, with an R-squared value of 0.770, indicating that 77.0% of the variability in HLY levels could be explained by changes in the NAD+/NADH ratio. The relationship is significant, with a negative coefficient for NAD+/NADH, suggesting that higher NAD+/NADH levels correspond to lower HLY levels.
The model displays a clear downward trend, with a negative slope, indicating that HLY levels decrease as the NAD+/NADH ratio increases.
Equation: HLY = 472.6467 - 17.4286 × (NAD+/NADH)
R-squared: 0.770 (77.0% of variability explained)
This strong negative relationship suggests that higher NAD+/NADH levels significantly reduce HLY levels, possibly pointing towards metabolic shifts associated with diabetic conditions.
4. Discussion
Despite prolonged hyperglycemia, some patients remain visually asymptomatic and evade the microvascular complication for a considerable period, while other group develop retinopathy within five years after the diagnosis of diabetes mellitus. [12] Our previous work suggested that not only hyperglycemia, hyperlipidemia induced lipid peroxidation and advanced lipoxidation end product accelerate the process of microvascular complication in type 2 diabetic mellitus. [5] ALEs have been implicated in stimulation and aggregation of platelets and reduced bioavailability of nitric oxide resulting in tissue hypoxia and create the background for development of microvascular complications. [13]
Glycolysis is the principal pathway for the metabolism of glucose and provide ATP in presence or absence of oxygen. In diabetes, persistent hyperglycemia dismantle the coordinated system of this pathway. Hexokinase, the gate-keeper enzyme of glycolysis, is inhibited by its product glucose-6 phosphate in allosteric manner, i.e., binding of glucose-6 phosphate to a separate site turning the enzyme off by changing the shape of the enzyme active site. In the early period of diabetes, the continuous huge flux of glucose in insulin independent tissue, like retina, is metabolized by the next enzyme acting sequentially to maintain the homeostasis of the system but gradually the accumulated glucose-6 phosphate enters into an alternative route for its further metabolism. Non-enzymatic glycation end product formation and anaerobic glycolysis induced glutamate cascade-mediated lipid peroxidation run after some years of diabetes. The precursor of advanced glycoxidation and lipoxidation end products are generally lipophilic in nature. Our previous study, demonstrated that ALEs exert their detrimental bioactivity through covalent modification of proteins and enzymes, and crosslinks of ALEs with the catalytic or binding side of the enzyme result in loss of their biological function and conformational integrity. [5] The electrophile HLY react with the nucleophilic amino acids in proteins and enzymes including HK and LDH. Reactions include Michael addition and Schiff based formation leading to covalent modification. [6,14,15] These modification can inactivate LDH, and HK disrupting their metabolic roles and contributing to pathological condition associated with oxidative stress. These contributes to cellular disfunction, inflammation and disease progression in condition like diabetes. Under hypoxic condition, hypoxia inducible factor (HIF) increases the expression of critical genes that promote survival of tissue in low oxygen condition. HIF up-regulates glycolytic enzymes like HK and LDH, which allow ATP synthesis in an oxygen-independent manner. [16] So, after some months and years of diabetes, activities of hexokinase in glycolysis pathway slow down, whereas LDH under the background of lactic acidosis takes enhanced up-regulation by HIF and tries its best to continue glycolysis which provide ATP for survival of tissue and VEGF secretion. The extent of VEGF secretion and its phosphorylation at the time of reaction with its receptor 2 dictate the initiation of background diabetic retinopathy and further progression to proliferative stage in an attempt to revascularize the ischaemic tissue. [17,18,19]
Anaerobic glycolysis is the centrifugal point in glucose metabolism which directs the pathways related to neurodegeneration and neovascularization in retinal tissue in diabetic mellitus. In early part of diabetes, enzyme systems of glycolysis maintain their activities to cope with huge influx of glucose in insulin independent tissue. As time goes, gradual exhaustion of NAD+, the principal oxidized co-factor in glycolysis invites anaerobic glycolysis mediated by LDH. NAD+:NADH and pyruvate:lactate ratio change. Gradual accumulation of lactate makes the tissue environment acidic, which inhibit glutamate aspartate transporter from synaptic space. Increased extracellular glutamate stimulate NMDA receptors and metabotropic receptors in adjacent neurons. This receptor activation leads to abnormally large influx of Ca+ ion and increased level of intracellular Ca+ ion activates proteases and phospholipase which cause degradation of phospholipid leading to the formation of platelet activating factor and eicosanoids. These two factors induce vasoconstriction. Now pseudohypoxia and ischemia produce hypoxia inducible factor (HIF-α) which stimulates secretion of glycolytic enzymes like lactate dehydrogenase (LDH) and vascular endothelial growth factor (VEGF). Metabolism of eicosanoids generates oxygen free radicals, which bring about peroxidative damage of phospholipid of neuronal membrane that create lipid peroxidation product. These reactive lipid peroxidation product interacts with the amino acid residue of the protein, especially the basic side chains, the sulphur containing side chain and aromatic groups. Consequently, protein peroxidation occurs following Michael addition and Schiff’s base formation, which undergo secondary reaction with an additional electrophile leading to the formation of advanced lipoxidation end-product (ALEs). [20] These are reactive electrophile and attack active side of enzymes and make them inactive by covalent modification. The electrophilic ALEs inhibit enzymes of glycolysis but LDH surprisingly demonstrate their increased activities due to up-regulation in another pathway mediated by HIF-α. The interesting relation between hexokinase, LDH and ALE in diabetes mellitus probably plays a hidden link between anaerobic glycolysis, lipid peroxidation and diabetic complication.
A study by Kumar et al (2018) demonstrated that LDH activity rapidly increases when cells undergo apoptosis, necrosis and other forms of cellular damage. [21] Shamansurova et al reported a decreased Hexokinase activity in erythrocytes and increase in blood serum in patients with diabetic mellitus. [22] In a study, Jovanovic et al showed that LDH activity increases when the cell membrane integrity is disrupted. [23]
From the descriptive statistical analysis, it is evident that hexokinase levels are highest in HC (healthy control) and decrease progressively across DNR, MNPDR, and HRPDR stages of Diabetic Retinopathy. Conversely, LDH levels increase progressively from HC towards HRPDR. Similarly, HLY levels show a gradual rise from HC to HRPDR. The ANOVA test indicates that LDH has the highest statistical significance in distinguishing HRPDR from HC, followed by HLY, suggesting their effectiveness as biomarkers for DR progression. Hexokinase levels, while moderately lower in HRPDR compared to HC, highlight their decreased presence as DR progresses. The covariance and precision matrix reveal a positive partial correlation between Hexokinase and HLY, indicating that HLY directly influences hexokinase levels. Hexokinase exhibits the highest internal precision, suggesting strong internal regulation. In contrast, the relationship between LDH and HLY is negligible, implying that their connection is indirect. The linear regression analysis for the two models shows distinct trends in enzyme behavior in the presence of HLY. The Hexokinase vs HLY model demonstrates a negative correlation, suggesting that HLY inhibits hexokinase levels. On the other hand, the LDH vs HLY model shows a moderate positive correlation, indicating a shift towards anaerobic metabolism as HLY levels rise.
The integration of ANOVA, covariance/precision matrices, and linear regression in this study provides comprehensive insights into the metabolic shifts occurring in DR progression. Specifically, the results highlight:
The increasing reliance on anaerobic metabolism (LDH) and decreasing aerobic glucose metabolism (Hexokinase) in advanced DR.
HLY as a key driver of these metabolic shifts, reflecting the hypoxic conditions that characterize advanced stages of DR.
4.1. Metabolic Shifts and Disease Progression
The reduction in Hexokinase activity, particularly in patients with MNPDR and HRPDR, points to a potential inhibition of glycolysis as diabetic retinopathy worsens. Hexokinase, being an essential enzyme for glucose metabolism, appears to be downregulated, possibly due to increased glucose-6-phosphate levels and increased HLY which inhibit Hexokinase in a feedback mechanism and covalent modification of catalytic sites of the enzyme. Lactate, the end product of glycolysis changes the metabolic paradigm and acts as a multifunctional signaling molecule through receptors expressed in various cells. Accelerated lactate production contributes to epigenetic gene regulation by lactylating lysine residues of histone. Excessive lactate production continually activates HIF-α and c-MYC, resulting in increased expression of pyruvate dehydrogenase kinase and lactate dehydrogenase-A. [22,23]
In summary, insulin-independent tissues, in order to maintain utilization of huge influx of glucose, typically undergo metabolic reprogramming with the direction towards enhanced glycolysis to provide sufficient energy for cells in low oxygen environments. In hypoxic microenvironment, retinal cells are particularly active to continue glycolysis following the shift from aerobic to anaerobic pathway. Excessive production of lactate makes the cellular medium acidic and inhibit glutamate-aspartate transporter. Increased extracellular glutamate activate glutamate cascade resulting in increased lipid peroxidation which ultimately generates advanced lipoxidation end products. The interplay between lactate and ALEs dictates the fate of glycolysis and development of microvascular complications. ALEs inhibit the activities of Hexokinase and LDH but lactate-mediated epigenetic changes of LDHA upregulates LDH secretion. However, the limitations of this research include the relatively small sample size and the fact that only two enzymes involved in glycolysis were assessed, which may restrict the broader applicability of the findings.
Author Contributions
A.M.: software, data analysis, and writing—original draft. S.P.: Collected data, Perform laboratory experiments and writing, L.K.M.: conceptualization, and writing—reviewing and editing. All authors contributed to the article and approved the submitted version.
Funding
This study did not receive any specific grants from funding agencies in the public, commercial, or not-for-profit sectors.
Institutional Review Board Statement
The study was carried out in accordance with the Declaration of Helsinki and approved by the Ethics Committee of Regional Institute of Ophthalmology, Medical College, Kolkata. Ref. No: MC/KOL/IEC/NON-SPON/181/12-2018).
Acknowledgments
Professor Asim Kumar Ghosh, Director, Regional Institute of Ophthalmology, for his encouragement and support in the fulfilment of this work.
Competing interests: The authors declare no competing interests.
References
- Beckert, S. , Farrati F., Aslam R.S., et al. Lactate Stimulates Endothelial Cell Migration. Wound Repair Regen. 2006; 14(3): 321-4.
- Cikamatana, L. , Mitchell P., Rochtchina E., et al. Five-year incidence and progression of diabetic retinopathy in a defined older population: the Blue Mountains Eye Study. Eye. 2007; 21(4): 465-471.
- Géron, A. Hands-On Machine Learning with Scikit-Learn, Keras, and TensorFlow, 3rd ed. O'Reilly Media, Inc.; 22. ISBN: 9781098125974. 20 October.
- Hussain Rao, Jonathan Jalali, Thomas P Johnston, Peter Koklen. Emerging Roles of Dyslipidemia and Hyperglycemia in Diabetic Retinopathy: Molecular Mechanisms and Clinical Perspectives. Front Endocrinol. 2021; 12. [CrossRef]
- Jovanovic, P. , Zoeic L., Stefanovic I., et al. Lactate Dehydrogenase and Oxidative Stress Activity in Primary Open-Angle Glaucoma Aqueous Humour. Boson J Basic Med Sci. 2010; 10(1): 83-88.
- Kumar, P. , Nagaranjan A. D. Analysis of Cell Viability by Lactate Dehydrogenase Assay. Cold Spring Harb Protoc. 2018. [CrossRef]
- Kumar, V.B.S. , Viji R.I., Kiran M.S., et al. Endothelial Cell Response to Lactate: Implication of PAR Modification of VEGF. J Cell Physiol. 2007; 211(2): 477-485.
- Mondal, L.K. , Bhaduri G., Bhattacharya B. Biochemical Scenario behind Initiation of Diabetic Retinopathy in Type 2 Diabetes Mellitus. Indian J Ophthalmol. 2018; 66: 535-40.
- Mondal, L.K. , Choudhuri S., Paine S.K., et al. Anaerobic Glycolysis is the Centre of Different Biochemical Disarrays Associated with the Onset of Diabetic Retinopathy. J Evol Med Dent Sci. 2013; 2: 2320-8.
- Mondal, L.K. , Pramanik S., Choudhuri S., et al. Do Different Lipid Components Accelerate the Pathogenesis and Severity of Diabetic Retinopathy? Int J Retina Vitreous. 2012; 8: 39. [CrossRef]
- Moldovan, L. , Moldovan N.L. Oxygen Free Radicals and Redox Biology of Organelles. Histochem Cell Biol. 2004; 122(4): 395-412.
- Pamplona, R. Advanced Lipoxidation End Products. Chem Biol Interact. 2011; 192(12): 14-20.
- Pizzimentis, S. , Ciamporcero E., Daga M., et al. Interaction of Aldehydes Derived from Lipid Peroxidation and Membrane Proteins. Front Phys. 2013; 4: 242.
- Ramalingam, S. , Karuppiah M., Thiruppathi M., et al. Antioxidant Potential of Biflavonoid Attenuates Hyperglycemia by Modulating the Carbohydrate Metabolic Enzymes in High Fat Diet/Streptozotocin Induced Diabetic Rats. Redox Rep. 2020; 25(1): 1-10. [CrossRef]
- San-Millan, I. , Brooks G.A. Re-examining Cancer Metabolism: Lactate Production for Carcinogenesis Could Be the Purpose and Explanation of the Warburg Effect. Carcinogenesis. 2017; 38(2): 119-133.
- Semenza, G.L. Hydroxylation of HIF-1: Oxygen Sensing at Molecular Level. Physiology (Bethesda). 2004; 19: 176-82.
- Vistoli, G. , Maddis D., Cipak A., et al. Advanced Glycoxidation and Lipoxidation End Products (AGEs and ALEs): An Overview of Their Mechanisms of Formation. Free Radic Res. 2013; 47: 3-27.
- Xu, K. , Zhang K., Wang Y., et al. Comprehensive Review of Histone Lactylation: Structure, Function and Therapeutic Targets. Biochem Pharmacol. 2024; 225: 116331. [CrossRef]
- Yan Zhang, Qiu Peng, Jinhua Zheng, Yuzhong Yang, Xuemei Zhang, Aiyu Ma, Yuxia Qin, Zailong Qin, Xiang Zheng. The Function and Mechanism of Lactate and Lactylation in Tumor Metabolism and Microenvironment. Genes Dis. 2023; 10(5): 2029-2037.
- R.K. Javaraiah, C.M. R.K. Javaraiah, C.M. David, J. Namitha, et al. Evaluation of Salivary Lactate Dehydrogenase as a Prognostic Biomarker in Tobacco Users with and without Potentially Malignant Disorders of the Oral Cavity. South Asian J Cancer. 2020; 9(2): 93–98. [CrossRef]
- Choudhuri, S. , Mondal L.K., Paine S.K., et al. Role of Hyperglycemia-Mediated Erythrocyte Redox State Alteration in the Development of Diabetic Retinopathy. Retina. 2013; 33: 207-16.
- Montgomery, D.C. Design and Analysis of Experiments. John Wiley & Sons; 2017.
- C. Uhler. Gaussian Graphical Models: An Algebraic and Geometric Perspective. Available; arXiv:1707.04345, 2017. [Online]. [CrossRef]
Figure 1.
The linear regression graph between HLY and Hexokinase.
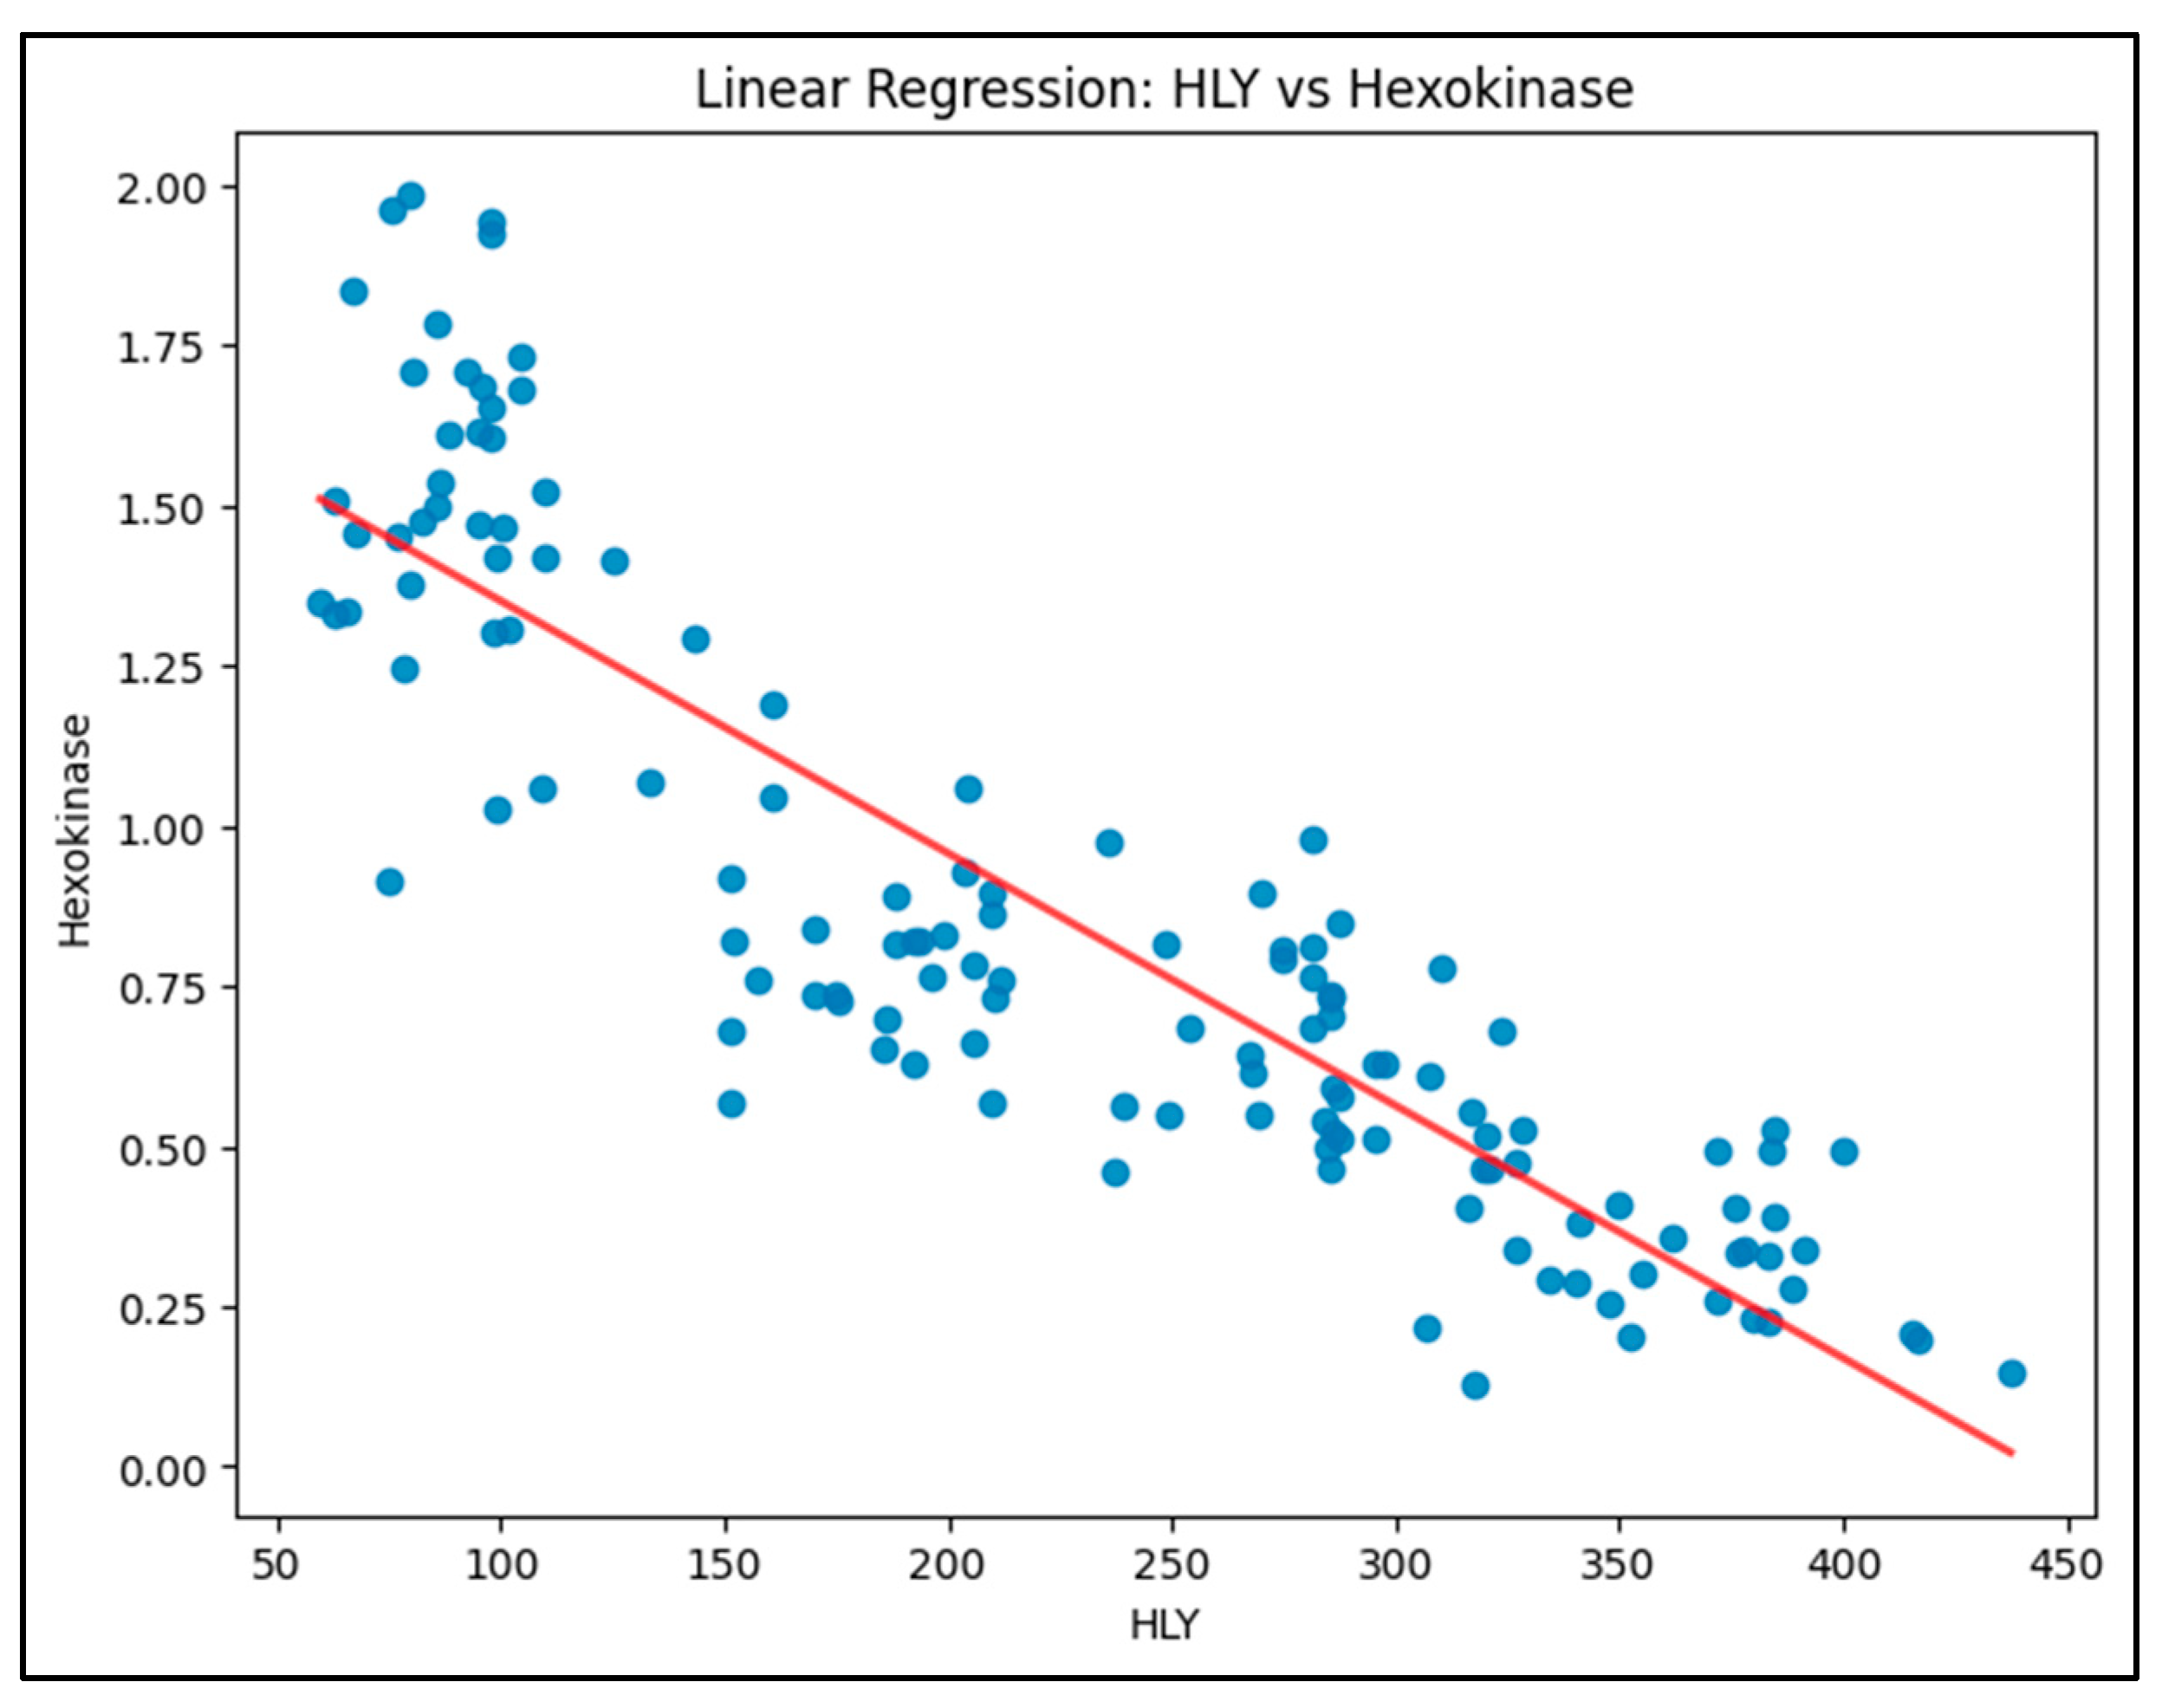
Figure 2.
The linear regression graph between HLY and LDH.
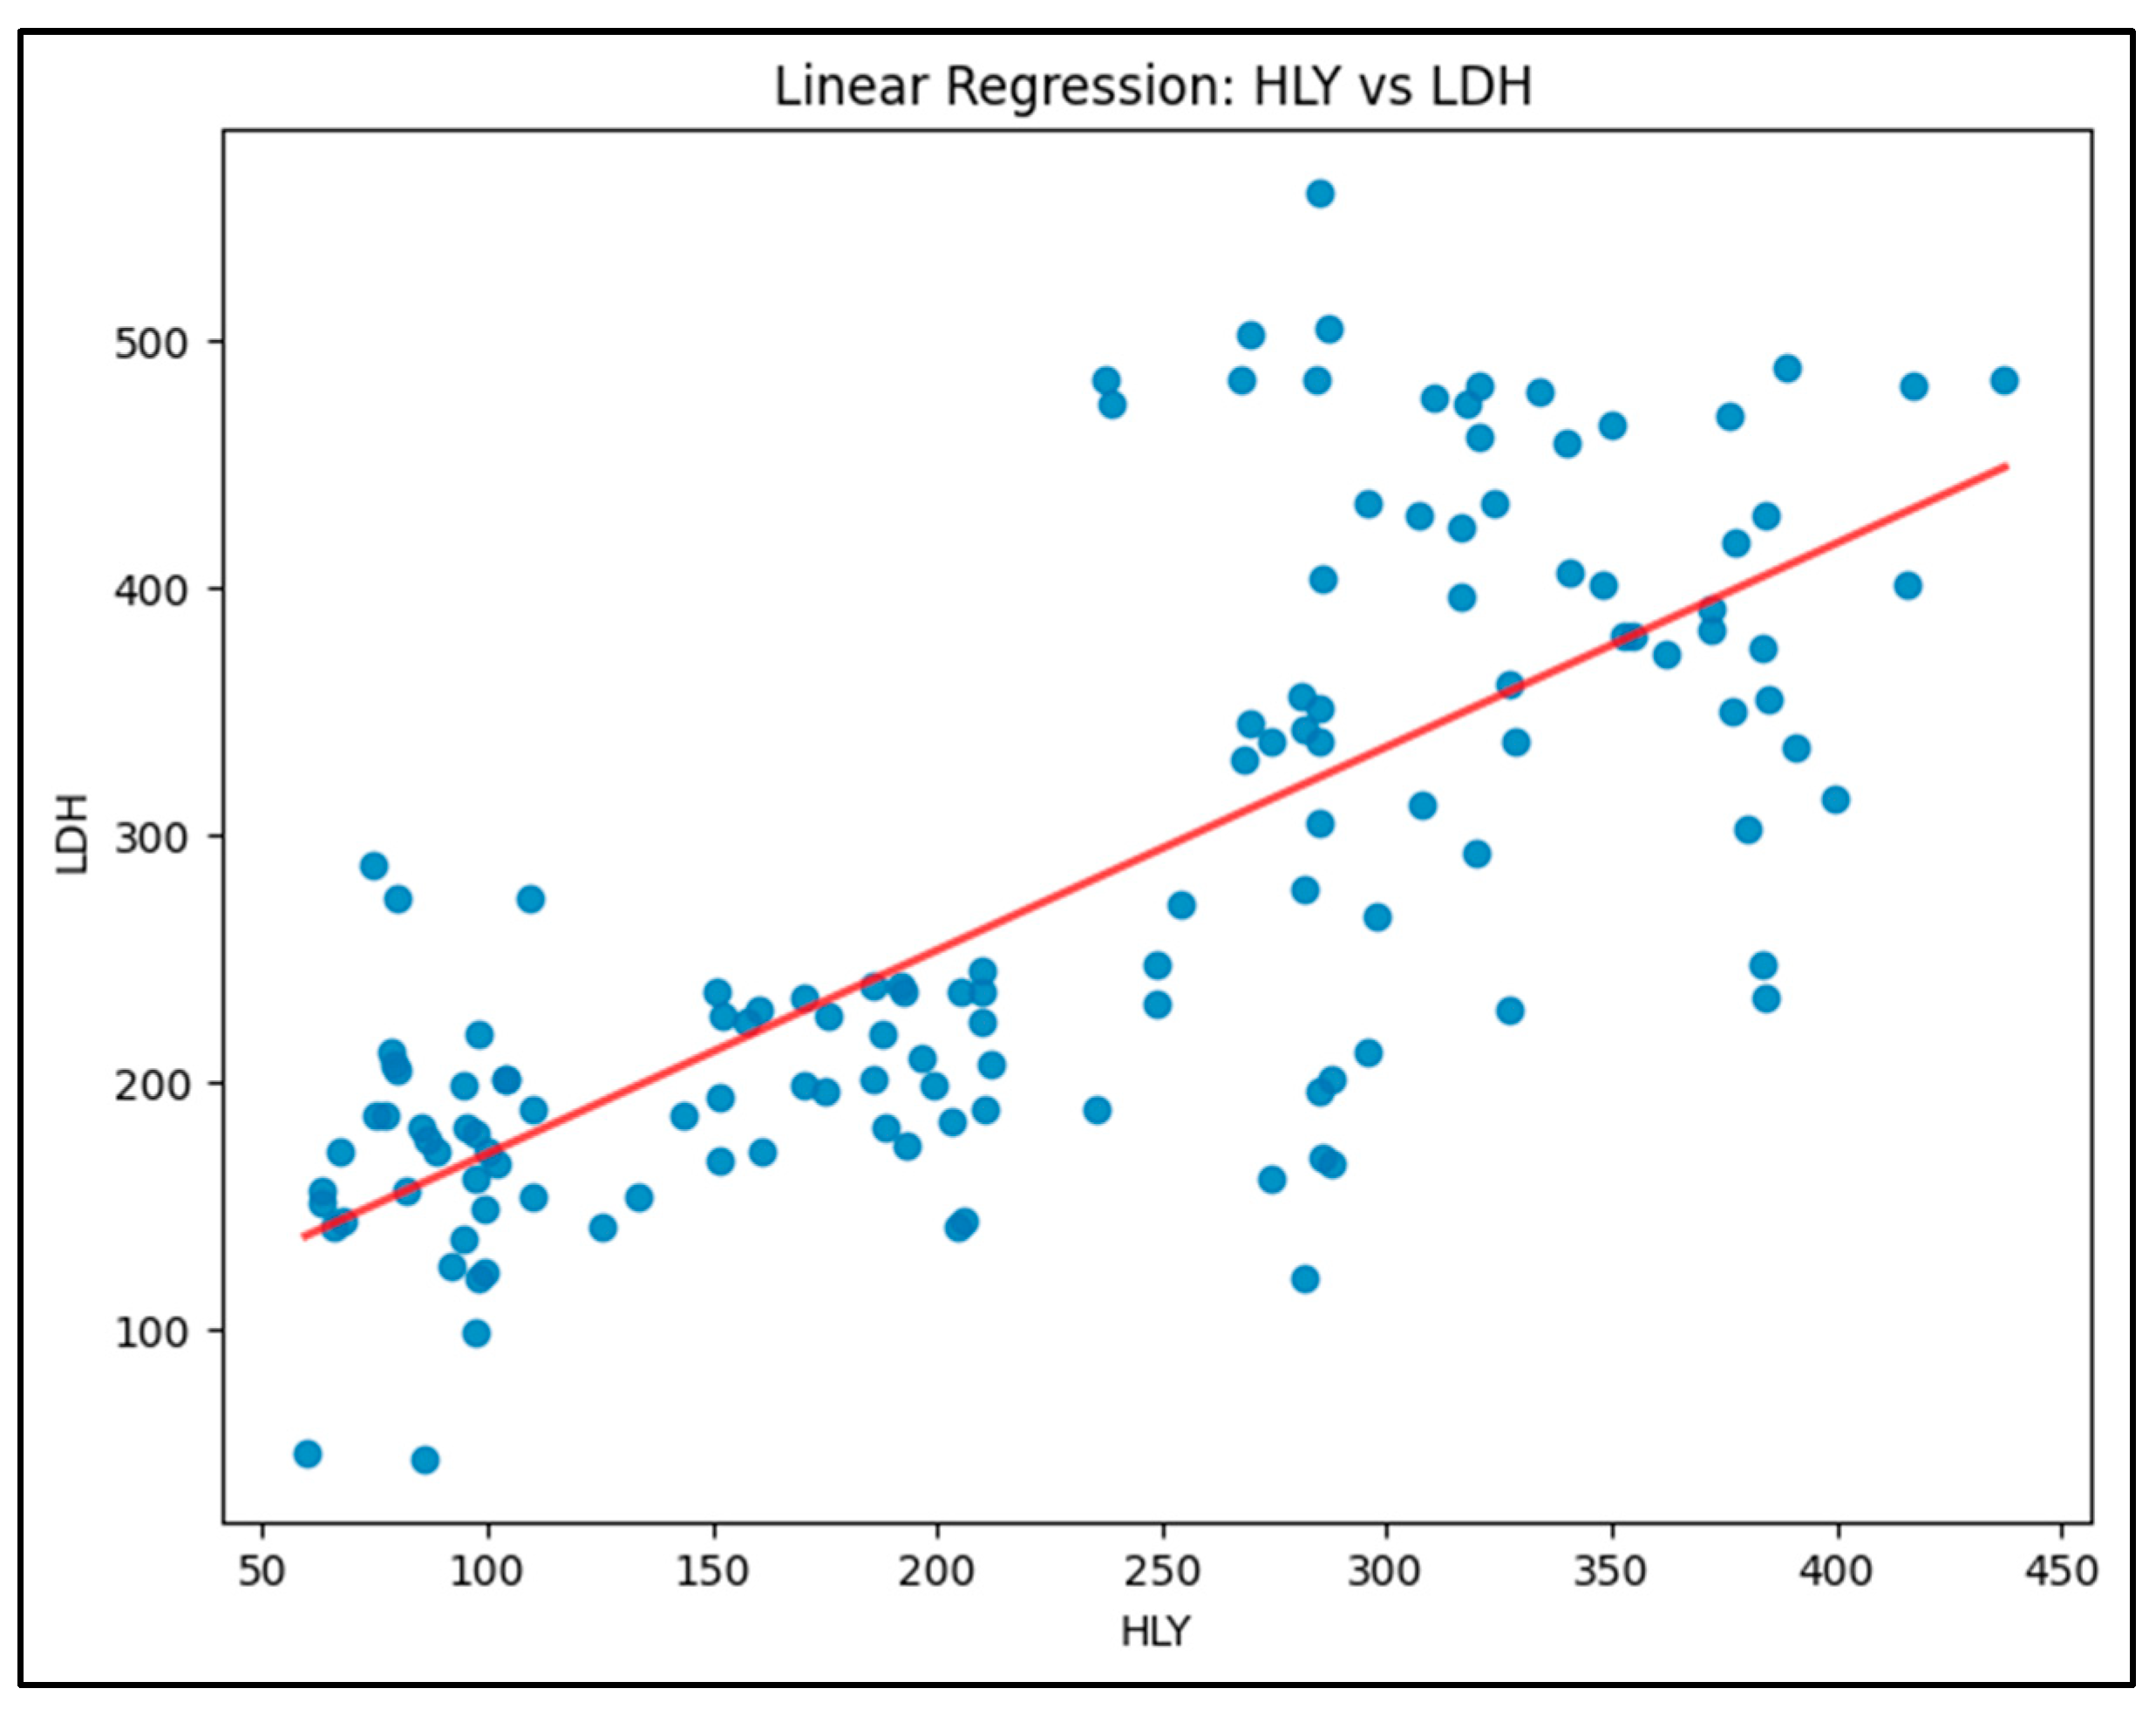
Figure 3.
The linear regression graph between HLY and NAD+/NADH ratio.
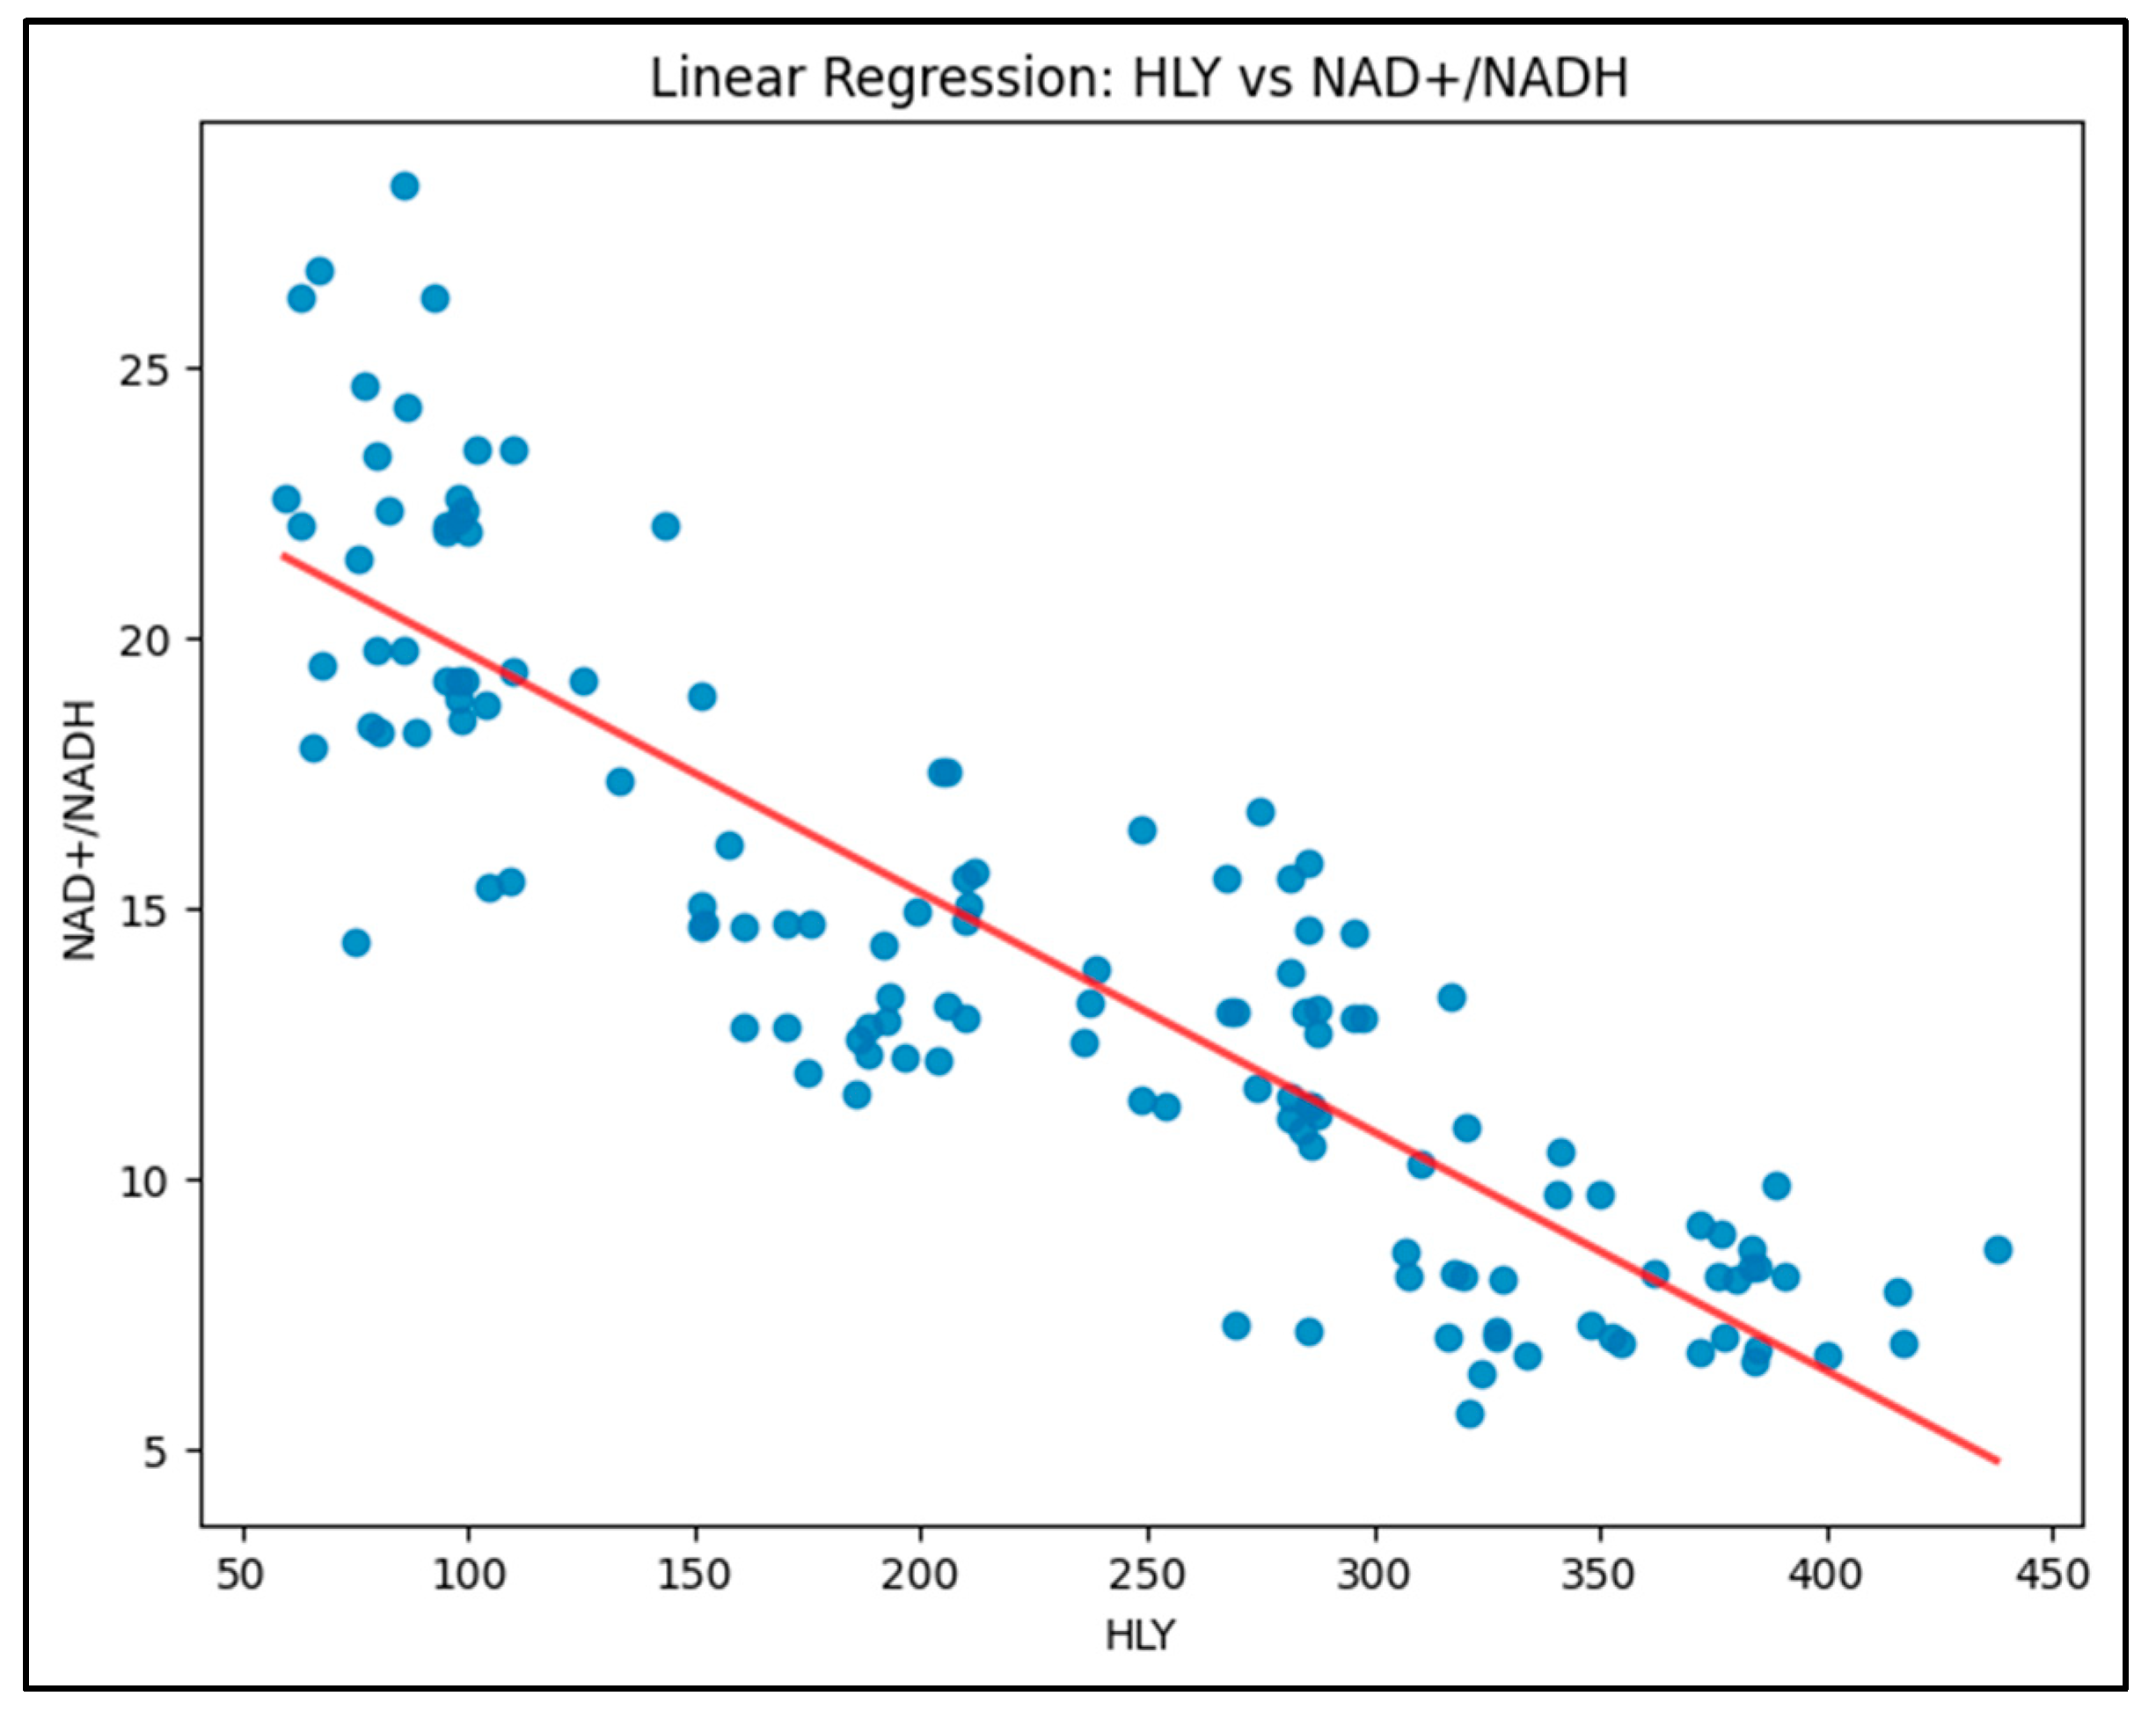

Table 1.
Results from Descriptive Statistics Analysis.
| Parameters | HC (n = 57) | DNR (n = 57) | MNPDR (n = 65) | HRPDR (n = 55) | p value |
|---|---|---|---|---|---|
| HLY (nmol/L) | 89.93±17.82 | 191.7±24.23**** | 274.9±43.04****,¥ ¥ ¥ ¥ | 359.5±37.85****,¥¥¥¥,§§§§ | <0.0001 |
| HK activity (µM of glucose phosphorylated/min/gm Hb) | 1.53± 0.22 | 0.783 ±0.14**** | 0.624±0.142****,¥ ¥ ¥ ¥ | 0.345±0.141****,¥¥¥¥,§§§§ | <0.0001 |
| NAD+/NADH | 21.50 ± 2.799 | 14.46 ± 1.966**** | 12.52±1.957****, ¥ ¥ ¥ ¥ | 7.957±1.055****, ¥ ¥ ¥ ¥,§§§§ | < 0.0001 |
Data are presented as Mean ± SD. A one-way analysis of variance (ANOVA) followed by Tukey’s HSD test was applied, and p < 0.05 considered statistically significant. HC vs DNR, MNPDR, HRPDR is denoted by *; DNR vs MNPDR, HRPDR is denoted by ¥; and MNPDR vs HRPDR is dented by §. **, ¥¥, §§ = p < 0.01; ***, ¥¥¥, §§§ = p < 0.001; ****, ¥¥¥¥, §§§§ = p < 0.0001.
Table 2.
The covariance matrix.
| HLY | Hexokinase | LDH | NAD+/NADH | |
|---|---|---|---|---|
| HLY | 11496.34 | -45.28 | 9450.35 | -508.16 |
| Hexokinase | -45.28 | 0.23 | -39.86 | 2.25 |
| LDH | 9450.35 | -39.86 | 14156.88 | -451.16 |
| NAD+/NADH | -508.16 | 2.25 | -451.16 | 29.16 |
Table 3.
The precision matrix.
| HLY | Hexokinase | LDH | NAD+/NADH | |
|---|---|---|---|---|
| HLY | 0.000554 | 0.053879 | -0.000085 | 0.004190 |
| Hexokinase | 0.053879 | 24.813951 | 0.005571 | -0.888642 |
| LDH | -0.000085 | 0.005571 | 0.000162 | 0.000603 |
| NAD+/NADH | 0.004190 | -0.888642 | 0.000603 | 0.185196 |
Disclaimer/Publisher’s Note: The statements, opinions and data contained in all publications are solely those of the individual author(s) and contributor(s) and not of MDPI and/or the editor(s). MDPI and/or the editor(s) disclaim responsibility for any injury to people or property resulting from any ideas, methods, instructions or products referred to in the content. |
© 2024 by the authors. Licensee MDPI, Basel, Switzerland. This article is an open access article distributed under the terms and conditions of the Creative Commons Attribution (CC BY) license (http://creativecommons.org/licenses/by/4.0/).
Copyright: This open access article is published under a Creative Commons CC BY 4.0 license, which permit the free download, distribution, and reuse, provided that the author and preprint are cited in any reuse.


