
Submitted:
14 November 2024
Posted:
15 November 2024
You are already at the latest version
Abstract
Background: Elite kayaking demands peak conditioning—tracking these athletes reveals the science behind world-class performance. We tracked physiological demands and body composition changes of Elite male kayakers during the preparatory and transition periods of a kayaking competitive season. Methods: We applied laboratory (body composition assessment and a 4-min all-out test in a kayak ergometer) on-field tests (4×1500-m incremental intermittent protocol with 30-s rest intervals in a kayaking/rowing track) to follow 8 Elite male kayakers (23.1 ± 5.6 y; 80 ± 8.8 kg; 177.0 ± 6.8 cm) at the beginning of the kayaking season (preparatory period — M1; first week of October), 22 weeks later, at beginning of transition period (M2; last week of February), and 5 weeks later, at end of transition period, i.e., beginning of competitive period of the season (M3; first week of April). The M3 corresponded to the participation in international competitions. Results: Distance at VO2peak on the kayak ergometer improved by 36.7 meters from M1 to M3, pace at V4 reduced (improved) by 25.2 s·km-1 from M1 to M2, and 25.6 s·km-1 by M3. Body weight decreased by 2.3 kg from M1 to M2, and fat mass percentage and kilograms decreased by 1.8% and 3.1% respectively. Fat-free mass increased by 1.9% and 3.1% respectively. Skinfold measurements showed a decrease in subscapular, suprailiac, abdominal, and geminal skinfold. Cardiorespiratory fitness improved by 0.7 L·min-1 from M1 to M2, and by 1.1 L·min-1 by M3, and from M2 to M3 was ~ 0.5 L·min-1. Relative VO2peak improved from M1 to M2, and from M2 to M3, with an increase of 6.4 ml·kg-1·min-1. Conclusions: Elite male kayakers improved their physiological performance and body composition during the preparatory and transition phases of the competitive season. Notable gains in performance were mainly due to increased peak oxygen uptake, enhanced cardiorespiratory fitness, and positive body composition changes. These findings provide insights for optimizing training strategies and boosting competitive performance.
Keywords:
kayaking
; aerobic power
; aerobic capacity
; fat mass
; performance
1. Introduction
According to the International Canoe Federation (ICF) rules (https://www.canoeicf.com/rules), in kayaking, athletes sit in the boat and use a double-bladed paddle to propel themselves forward. The kayak has a closed deck. Concerning race distances, men and women compete in 200 m, 500 m, and 1000 m events at the Olympic Games in individual (K1), pairs (K2), or teams of four (K4). These distances are similar during World Championships but may also include additional distances such as 5000 m.
Optimizing athletic performance for kayaking competitions requires adjusting training stimuli throughout the season, which reflect changes in performance-related indicators (e.g. energetics, kinematics, etc.). The kayaking paddling technique is highly specific, and out-of-water simulations using land ergometers seem to be far from the real effort, the reason why experiments in real practice conditions would provide deeper insights into Kayakers’ performance-related variables. Likewise, integrated assessments in kayaking could better guide researchers and coaches to improve planning strategies and training methods. However, kayak ergometers, typically used in training routines (especially in winter), have also been used in laboratories to reproduce the water effort and assess kayaking performance throughout the season, while avoiding climate fluctuations [1]. Despite that, selecting the appropriate evaluation device and protocol is important. For instance, Bielik et al. [2] found treadmill incremental tests could not distinguish between Elite and non-Elite sprint and slalom kayakers regarding aerobic power (i.e., maximal or peak oxygen uptake;O2max; O2peak). Early studies showed thatO2peak was higher on a treadmill than on an arm ergometer in canoeists [3].
Another issue is the challenge of recruiting volunteers with a high-performance caliber [4]. Indeed, performance-related data (e.g., bioenergetics, biomechanics, and body composition) from athletes of different caliber may no longer be applicable to Elite athletes. Thus, besides the necessity to assess specific training-induced changes in kayakers, the availability of performance indicators within a cohort of Elite athletes is essential, not only for the broader scientific sports community but particularly for those engaged in this branch of canoeing. Therefore, this study aimed to evaluate physiological, body composition, and performance changes in Elite male kayakers, both indoors (laboratory setting) and outdoors (on-field, i.e., kayaking/rowing track) throughout preparatory and transition training periods.
2. Materials and Methods
2.1. Participants
After receiving information about the study’s objectives, experimental protocol, and procedures, eight Elite kayakers gave their written consent to participate in this study (Table 1). All kayakers were familiarized with the physiological and body composition procedures prior to the experiments. They were evaluated in three distinct moments: beginning of the kayaking season (preparatory period — M1; first week of October), beginning of transition period (M2; last week of February), and end of transition period, i.e., beginning of competitive period of the season (M3; first week of April). The M3 corresponded to the participation in international competitions. All participants were instructed to abstain from intensive training for 24 hours prior to each experiment.
2.2. Body Composition and Physiological Demands and Performance-Related Variables
After body composition evaluation, each kayaker performed two kayaking tests. Trial one was performed at the laboratory, a 4 min all-out test in kayak ergometer. Test two (on-field) was realized in a kayaking/rowing track, two days after the laboratory-based test.
2.2.3. Laboratory Tests
Body composition measurements were performed in the same venue immediately before physiological tests to prevent sweating and blood flow to the skin from inducing measurement errors. Testing took place at the same moment of the day to avoid or minimize the effects of circadian variations. Body weight was assessed using a portable bioelectrical impedance scale (TANITA BC-418 MA Segmental Body Composition Analyzer Tanita Corporation, Tokyo, Japan) in the three moments at the same time of day (9:00 am - 1:15 am) after morning ablutions and at least 1 hour after regular breakfast. Athletes wore only their underwear. Height was measured with a portable stadiometer (Holtain, UK) with the head positioned to the Frankfurt plane. Arm spam was measured using an anthropometer (Siber-Hegner, GPM, Zurich, Switzerland). Both measurements were taken with a precision of 0.1 cm. The amount and peripheral dispersion of body fat were evaluated by measuring the thickness of subcutaneous adipose tissue. For skinfold assessment, triple measurements were taken in eight standard sites: tricipital, bicipital, subscapular, supra iliac, supraspinal, abdominal, front thigh, and medial calf using the Harpender skinfold caliper. The sum of the eight skinfolds gave an overview of the distribution of subcutaneous fat. The sum of four skinfolds (tricipital, bicipital, subscapular, and suprailiac) was used to calculate body density. Body density was estimated according to the Durnin & Womersley equations [5] and fat mass was calculated with Siri’s equation [6] All skinfolds were measured using standardized protocols established by the International Society for the Advancement of Kinanthropometry.
All participants performed a 5-minute warm-up (Self-paced), and soon after, a 4-min all-out test [1] in a kayak-ergometer (Dansprint. I Bergmann A/S, Hvidovre, Denmark) simulating a 1000-m flat-water race where peak oxygen uptake () and heart rate at (HR at ) were identified. Briefly, expired respiratory gas fractions were measured using an open circuit breath-by-breath automated gas-analysis system (Cortex, Metalyzer, 3 B, Leipzig, Germany). The processor provided 10-second averages of the respiratory data. The HR at was measured and recorded every 5 s using an HR monitor (Polar® OH1; Polar Electro Oy, Kempele, Finland). Maximal effort during the 4-min all-out test was assumed when respiratory exchange ratio ≥ 1.15 or blood lactate ≥ 8 mmol·L-1 and maximal HR ≥ 90% of the age-predicted maximal heart rate. Parallel to the evaluation of the , ergometric data were collected corresponding to the distance covered during the 4-min all-out test (distance at . Capillary blood samples were collected from the earlobe with Lactate Pro 2 analyser (Arkay, Inc, Kyoto, Japan) to assess blood lactate concentration ([La-]) and at the 3rd and 5th min soon after the 4-min all-out test. Thus, [La-]peak values were computed. All tests were performed in the same venue in the three moments whereby fluctuations in ambient humidity and temperature were negligible. Throughout the trials, verbal encouragement was given by the coach to motivate the athletes. The athletes paddled with a self-chosen pace and strategy.
2.2.4. On-Field Tests
The on-field test consisted of a 4 × 1500-m incremental intermittent protocol with 30-s rest intervals in a kayaking/rowing track) with pacing controlled by a heart rate (HR) monitor (120, 140 160 and >160 beats per minute) to assess aerobic capacity, i.e., the pace at [La-] of 4 mmol·L-1 (Pace at V4, seconds per kilometer; s·km-1) and HR at V4 (beats per minute; bpm). Each level of intensity was monitored through the Polar® OH1 (Polar Electro Oy, Kempele, Finland). Capillary blood samples were collected from the earlobe at with Lactate Pro 2 analyser (Arkay, Inc, Kyoto, Japan) during the intervals between each 1500-m. After completing the protocol, we plotted graphs of the [La-] values (mmol·L-1) and HR (bpm) as a function of pace (s·km-1) to identify Pace at V4 and HR at V4. The water track for carrying out the tests was always the same and was calm and without current in the three moments of the study. An anemometer was used that allowed us to verify that in no time the wind blew at more than 2 m·s-1. However, the wind speed was negligible because the trail was made with a round trip. Before testing each kayaker realized a 5-minute warm-up at a low pace.
2.3. Statistical Analysis
We employed a linear mixed model (LMM) using restricted maximum likelihood (REML) estimation to investigate the relationship between the dependent variables and the predictor variables time, age, and subject. The model is specified as follows (Equation 1):
Variable of interest ~ 1 + Time + Age + (1|subj) (1)
Bonferroni correction was applied when necessary and the adjusted p-value was presented. Cohen’s d was used as the effect size measure, with the following benchmarks: small = 0.2; medium = 0.5; large = 0.8. Data are presented as estimated marginal means (EMM) and confidence interval (95%CI). The treatment effect was presented as an estimated mean difference (EMD) and 95%CI. The statistically significant value was set as = 0.05. Statistical analyses were conducted using R statistical software (version 4.1.2, R Foundation for Statistical Computing, Vienna, Austria).
3. Results
Table 4 shows the results of Elite male Kayakers before and after preparatory and transition training periods. Changes in several variables were observed. Distance at on the kayak ergometer improved by 36.7 m from M1 to M3 (p = 0.0021, d = 0.98). The pace at V4 (s·km-1) reduced (i.e., improved) by 25.2 s·km-1 from M1 to M2, and 25.6 s·km-1 by M3, respectively. Body weight showed a noticeable reduction, with a decrease of 2.3 kg from M1 to M2. Fat mass, both in percentage and kilograms, also decreased. From M1 to M2, fat mass percentage dropped by 1.8%, and by 3.1% by M3. Likewise, the fat mass in kilograms decreased by 1.8 kg from M1 to M2, and by 2.9 kg by M3. Conversely, fat-free mass increased over the same period. There was an increase of ~1.9% increase from M1 to M2, and a 3.1% increase by M3, respectively. In terms of specific skinfold measurements (Table 5), the subscapular skinfold decreased by 0.9 mm from M1 to M2 and by 0.7 mm by M3. The suprailiac skinfold showed a larger decrease of 4.4 mm from M1 to M2, and 7.1 mm by M3. Similarly, the abdominal skinfold decreased by 3.0 mm from M1 to M2, and by 4.3 mm by M3. A reduction was also observed in the geminal skinfold, which decreased by 1.5 mm from M1 to M2. Cardiorespiratory fitness (O2peak in L·min-1) showed improvement by 0.7 L·min-1 from M1 to M2, and by 1.1 L·min-1 by M3, respectively. The increase from M2 to M3 was ~ 0.5 L·min-1. The relative O2peak (i.e., in ml·kg-1·min-1) improved by 8.6 ml·kg-1·min-1 from M1 to M2, and by 15.0 ml·kg-1·min-1 by M3. The increase from M2 to M3 was 6.4 ml·kg-1·min-1. Figure 1 illustrates the mean percentage changes from baseline to the preparatory and transition periods of a competitive season.
4. Discussion
This study aimed to verify the evolution of several indicators — physiological, body composition, and kayaking performance — during preparatory and transition training periods in Elite kayak paddlers. Our kayakers showed average body weight values below those of some international Elite. Protzer et al. [7] found mean values of ~86 ± 8.1 kg in Elite Hungarian kayakers. As in well-trained athletes, the values of fat mass are relatively similar; the reduced body weight of the kayakers studied has both advantages and disadvantages. While lower muscle mass may limit the potential for maximum strength development, a lighter body weight could enhance overall efficiency by reducing resistance in the boat. However, maintaining an optimal balance between muscle mass (for power generation) and body weight is crucial for maximizing performance in kayaking. The paddlers in our study showed higher percentage of body fat than the Hungarian Elite kayakers [7]. Some studies highlight the relationship between kayaking performance and total body weight [4], and lean body weight [8], which underlines the importance of strength training and subsequent development of muscle mass in kayaking which must be accompanied by a reduction in fat mass. Usually, kayakers place an important emphasis on developing their body weight through gaining muscle mass. In our kayakers, while lean body weight remained quite stable during the season the decrease seen in body weight was clearly associated with the reduction of body fat. Usually, during the transition period between seasons, athletes increase their body fat which is lost when training resumes. This was verified in soccer players, sprinters, and endurance runners [9]. The values of body fat found at the peak of the competitive period are like those found by van Someren & Howatson [10], also in kayakers at a similar moment of the season.
Typically, the first training cycle in canoeing, i.e., the preparatory period, puts the emphasis on continuous loads while in the pre-competitive period, the more intense interval loads are frequently used. Maximal oxygen uptake (O2max) and O2peak, both related to aerobic power, are important variables for kayak performance even for a more explosive event as the 200-m kayaking race [11]. In kayakers, O2max and O2peak assessments can be conditioned by the type of ergometer used, however Rodrigues dos Santos et al. [3], with well-trained kayakers, found no significant differences in O2peak obtained in the treadmill and kayak ergometer in two moments of the season, but the values obtained with the treadmill inclined to be higher. Although the kayak ergometer cannot completely replicate on-water kinematics, it seems that the physiological responses after short-term high-intensity kayaking are similar. Someren et al. [1], in well-trained kayakers, found similar O2peak values in open water kayaking (4.10 ± 0.49 L·min-1) and in kayak ergometer (4.09 ± 0.53 L·min-1) as well as approximate blood lactate values after an all-out 4 min test. Corroborating this data, Protzner et al. [7], found similar values of O2peak and maximum lactate after progressive treadmill test until volitional exhaustion at kayak-ergometer in Hungarian Elite kayaker.
In our study, O2peak increased progressively during the season, both in absolute and relative terms. O2peak values in our kayakers at the start of the competitive period (M3) were higher than those obtained in other studies as the Elite Hungarian (~4.4 ± 0.6 L·min-1 or ~56.4 ± 4.1 ml·kg-1·min-1) [7], but similar (~4.8 ± 0.4 L·min-1 or ~61.4 ± 4.4 ml.kg-1.min-1) to the values found with on-water progressive testing by Buglione et al. [12] in Elite Italian kayakers. The O2max values obtained by van Someren et al. [1], in a test like ours are clearly lower than those obtained in the present study (4.1 ± 0.51 L·min-1) which may be related to differences in performance level between samples. Nevertheless, it cannot be ruled out that the training profile of Hungarian kayakers places greater emphasis on anaerobic training, thus reducing maximal aerobic expression. The progressive increase in O2peak during the season observed in our study can mean (i) a significant loss of aerobic power during the off-season, (ii) a progressive adaptation to the kayak-ergometer, or (iii) a better training plan.
In this study, blood lactate behavior 3 min after effort did not show significant differences (p>0.05). Blood lactate concentration 5 min after effort showed significant differences (p = 0.004) between M1 and M3. It´s difficult to give physiological meaning to this difference. From our data, it can be assumed that the stability of the blood lactate behavior combined with the improvement in the kayak-ergometer performance is in line with the improvement seen in the O2peak. The potentiation of aerobic mechanisms, e.g., increased capillary density, increased quantity of mitochondrial enzymes, and improved β-oxidation, is reflected either in the superior capacity to oxidize lactate in the mitochondria or in the improvement of lactate oxidation in the surrounding fibers. Blood lactate values after exertion in our study are like those obtained by Protzner et al. [7] in Elite Hungarian kayakers (12.0 ± 0.9 mmol·L-1). Interestingly, a 300-m all-out effort in flat water, lasting between 79 and 102 seconds, elicited similar blood lactate values (11.9 mmol·L-1) [14] to the 4-minute all-out effort in our study. This is in line with the results from Lacour et al. [15] who found identical blood lactate levels after running competition with 20.1± 2.2, 21.9 ± 2.1, and 20.8 ± 2.7 mmol·L-1 for the 400m, 800m, and 1500m, respectively. After an initial dramatic increase, after approximately 1 min, blood lactate level during maximal efforts reaches a plateau above which there are no further increases. Confounding the metabolic validation of blood lactate, Rodrigues dos Santos et al. [13] found a dramatic increase in blood lactate after 3-4 seconds of effort in Elite sprinters while in non-Elite sprinters the increase was not so pronounced. Lactate kinetics remains an open field in scientific research.
The anaerobic threshold is an important tool for aerobic capacity assessment in training control despite the controversies it involves. We set a fixed blood lactate threshold of 4 mmol (V4) to evaluate aerobic endurance during incremental exercise. This threshold correlated well with the maximal lactate steady state although Li et al. [16] found that a fixed blood lactate of 5.4 mmol·L-1 instead of 4 mmol·L-1 is a better intensity plateau to achieve the maximal lactate steady state in kayaking. For training control purposes, a fixed value of 4 mmol·L-1 is more operative and allows comparison with other studies. In this study, aerobic capacity (V4) increased significantly between M1 and M2 and remained unaltered in M3. This verification is in accordance with the intended adaptations during the season. From M2 onwards, the training objective was no longer the potentiation of aerobic mechanisms per se, but the improvement of specific resistance to competition with a high contribution of anaerobic mechanisms.
5. Conclusions
Elite kayakers, who undergo eleven months of intensive training with two to three daily sessions, need recovery time between seasons. However, this recovery should involve more active rest to prevent an increase in body fat and a significant decline in functional capabilities. In the preparatory phase of the annual training cycle for elite kayakers, there is a reduction in body weight along with improvements in aerobic power (O2max or O2peak) [17] and aerobic capacity (V4). During the pre-competitive phase, aerobic capacity stabilizes, while aerobic power continues to improve, and both the quantity and percentage of body fat decrease.
Author Contributions
Conceptualization, J.A.R.S., G.B. and R.Z.; methodology, J.A.R.S., G.B. and R.Z.; formal analysis, J.A.R.S., G.B. and R.Z.; investigation, J.A.R.S., G.B. and R.Z.; resources, J.A.R.S., G.B. and R.Z.; data curation, J.A.R.S., G.B. and R.Z.; writing—original draft preparation, J.A.R.S., G.B. and R.Z.; writing—review and editing, J.A.R.S., G.B. and R.Z.; visualization, J.A.R.S., G.B. and R.Z.; supervision, R.Z.; project administration, J.A.R.S., G.B. and R.Z.; funding acquisition, R.Z. All authors have read and agreed to the published version of the manuscript.
Funding
R.Z is founded by the Research Center in Physical Activity, Health, and Leisure - CIAFEL, Faculty of Sport University of Porto. Portuguese Foundation for Science and Techonology (UIDB/00617/2020: doi: 10.54499/UIDB/00617/2020) and The laboratory for Integrative and Translational Research in Population Health (ITR), Porto, Portugal (la/p/oo64/2020).
Institutional Review Board Statement
The study was conducted in accordance with the Declaration of Helsinki and approved by the Ethics Committee of FACULTY OF SPORTS—UNIVERSITY OF PORTO (CEFADE 37_2019; Date of Approval: March 16th 2023).
Informed Consent Statement
Informed consent was obtained from the subject involved in this study.
Data Availability Statement
The data presented in this study are only available upon request from the corresponding author. The data are not publicly available due to their containing of information that could compromise the privacy of study participant.
Conflicts of Interest
The authors declare no conflicts of interest.
References
- Someren, K.A.; Phillips, G.R.; Palmer, G.S. Comparison of physiological responses to open water kayaking and kayak ergometry. Int J Sports Med. 2000, 21, 200–204. [Google Scholar] [CrossRef] [PubMed]
- Bielik V, Lendvorsky, Vadja M et al.. Comparison of aerobic and muscular power between Junior /U23 slalom and sprint paddlers: an analysis of international medallists and non-medallists. Front Physiol. 2021 11:617041. [CrossRef]
- Rodrigues dos Santos, J.A.; Sousa, R.F.S.; Amorim, T.P. Comparison of treadmill and kayak ergometer protocols for evaluating Peak Oxygen Consumption. TOSSJ. 2012, 5, 130–133. [Google Scholar] [CrossRef]
- Rodrigues dos Santos, J.A.; Viana da Silva, A. Correlation between strength and kayaking performance in water. J Sport Health Res. 2010, 2, 129–138. [Google Scholar]
- Durnin, J.V.; Womersley, J. Body fat assessment from total body density and its estimation from skinfold thickness: measurements on 481 men and women aged 16 to 72 years. Br J Nutr. 1974, 32, 77–97. [Google Scholar] [CrossRef]
- Siri, WE. Body composition from fluid spaces and density: analysis of methods. In: J Brozek & A Henschel (eds). Techniques for Measuring Body Composition. Washington DC: National Academy of Sciences. 1961. pp:223-244.
- Protzner, A.; Szmodis, M.; Udvardy, A.; et al. Hormonal neuroendocrine and vasoconstrictor peptide responses of ball game and cyclic sport elite athletes by treadmill test. PLoS One. 2015, 10, e0144691. [Google Scholar] [CrossRef] [PubMed]
- Galán-Rioja, M.A.; González-Mohíno, F.; Danders, D.; Mellado, J.; González-Ravé, J.M. Effects of body weight vs. Lean body mass son Wingate Anaerobic Test performance in endurance athletes. Int J Sports Med. 2020, 41, 545–551. [Google Scholar] [CrossRef]
- Rodrigues dos Santos, JA. Physiological, anthropometric, and motor comparative study between footballers of different competitive levels and sprinters, middle-distance runners and long-distance runners. PhD final thesis. 1995. Faculty of Sport. University of Porto. Portugal (Thesis in Portuguese).
- Someren, K.A.; Howatson, G. Prediction of flatwater kayaking performance. Int J Sports Physiol Perform. 2008, 3, 207–218. [Google Scholar] [CrossRef]
- Pickett, C.W.; Nosaka, K.; Zois, J.; et al. Maximal upper-body strength and oxygen uptake are associated with performance in high-level 200-m sprint kayakers. J Strength Cond Res. 2018, 32, 3186–3192. [Google Scholar] [CrossRef]
- Buglione, A.; Lazzer, S.; Colli, R.; Introini, E.; Di Prampero, P.E. Energetics of best performance in elite kayakers and canoeists. Med Sci Sports Exerc. 2011, 43, 877–884. [Google Scholar] [CrossRef] [PubMed]
- Rodrigues dos Santos, J.A.; Affonso, H.O.; Boullosa, D.; Pereira, T.M.C.; Fernandes, R.J. Conceição F. Extreme blood lactate rising after very short efforts in top-level track and field male sprinters. Res Sports Med. 2021, 1–7. [Google Scholar] [CrossRef]
- Zamparo, P.; Tomadini, S.; Didonè, F.; Grazzina, F.; Rejc, E.; Capelli, C. Bioenergetics of a slalom kayak (K1) competition. Int J Sports Med. 2006, 27, 546.552. [Google Scholar] [CrossRef] [PubMed]
- Lacour, J.R.; Bouvat, E.; Barthélémy, J.C. Post-competition blood lactate concentrations as indicators of anaerobic energy expenditure during 400-m and 800-m races. Eur J Appl Physiol Occup Physiol. 1990, 61, 172–176. [Google Scholar] [CrossRef] [PubMed]
- Li, Y.; Niessen, M.; Chen, X.; Hartmann, U. Maximal lactate steady state in kayaking. Int J Sports Med. 2014, 35, 939–942. [Google Scholar] [CrossRef] [PubMed]
- Azevedo, P.; Bhammar, D.M.; Babb, T.G.; Bowen, T.S.; Witte, K.K.; Rossiter, H.B.; Brugniaux, J.V.; Perry, B.D.; Dantas de Lucas, R.; Turnes, T.; Sabino-Carvalho, J.L.; Lopes, T.R.; Zacca, R.; Fernandes, R.J.; McKie, G.L.; Hazell, T.J.; Helal, L.; da Silveira, A.D.; McNulty, C.R.; Roberg, R.A.; Nightingale, T.E.; Alrashidi, A.A.; Mashkovskiy, E.; Krassioukov, A.; Clos, P.; Laroche, D.; Pageaux, B.; Poole, D.C.; Jones, A.M.; Schaun, G.Z.; de Souza, D.S.; de Oliveira Barreto Lopes, T.; Vagula, M.; Zuo, L.; Zhao, T. Commentaries on Viewpoint: V̇o2peak is an acceptable estimate of cardiorespiratory fitness but not V̇o2max. J Appl Physiol (1985). Erratum in: J Appl Physiol (1985). 2018, 125, 970. doi: 10.1152/japplphysiol.zdg-2795-corr.2018. 2018, 125, 233–240. [Google Scholar] [CrossRef] [PubMed]
Figure 1.
Percentage changes from baseline to the preparatory and transition periods of a competitive season of Elite male kayakers (N=8).
Figure 1.
Percentage changes from baseline to the preparatory and transition periods of a competitive season of Elite male kayakers (N=8).
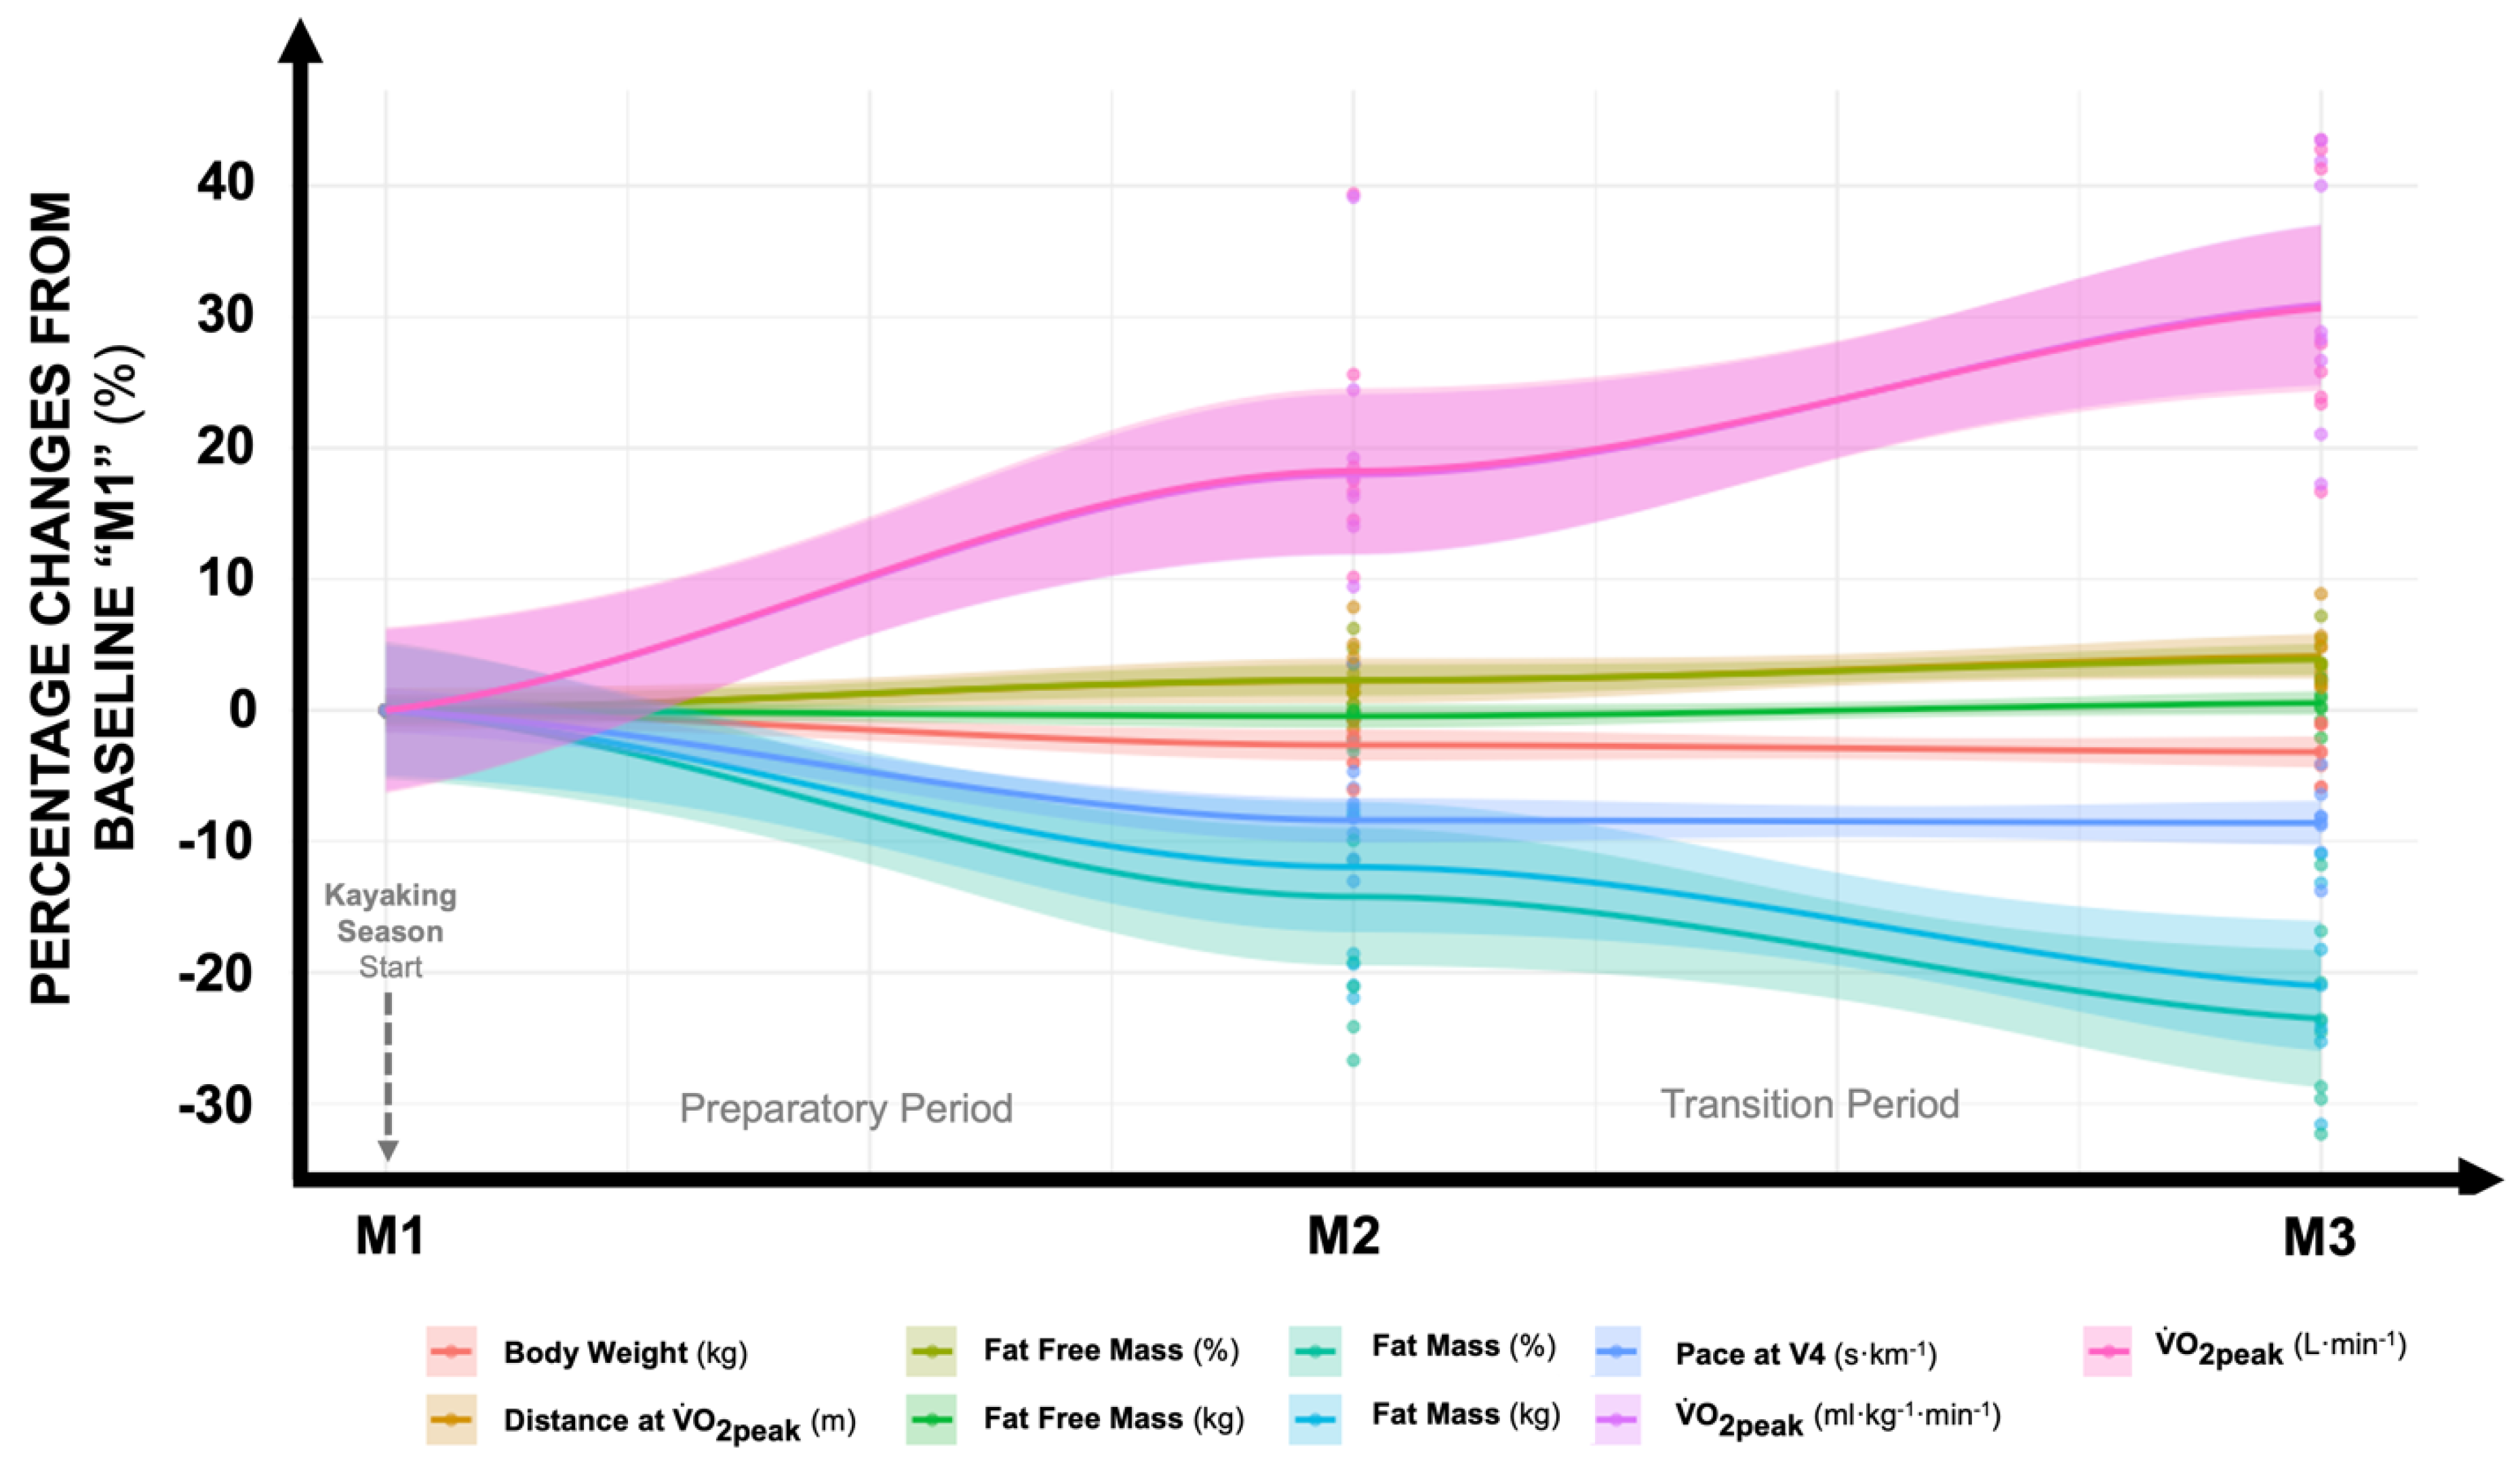

Table 1.
Elite Kayakers' characteristics at the beginning of the kayaking season (N=8).
| Variable | Mean ± SD | 95%CI |
|---|---|---|
| Age (y) | 23.1 ± 5.6 | 19.3 to 27.0 |
| Body Weight (Kg) | 80.0 ± 8.8 | 73.9 to 86.1 |
| Height (cm) | 177.0 ± 6.9 | 172.2 to 181.8 |
| Arm span (cm) | 183.4 ± 7.4 | 178.3 to 188.5 |
| Data are presented as mean, standard deviation (SD), and 95% confidence interval (95%CI) | ||
Table 2.
Microcycle applied during the preparatory period (from M1 — first week of October; to last week of February — M2); Duration: ~ 22 weeks.
Table 2.
Microcycle applied during the preparatory period (from M1 — first week of October; to last week of February — M2); Duration: ~ 22 weeks.
| SESSIONS | DAYS OF WEEK | ||||||
| MONDAY | TUESDAY | WEDNESDAY | THURSDAY | FRIDAY | SATURDAY | SUNDAY | |
| Morning Session |
Kayaking 12 km SPM: 60 |
Kayaking 30’ Recovery: 3min SPM: 65 |
Kayaking 14 km SPM: 60 |
Cycling 1h45min |
Kayaking 14 km SPM: 60 |
Kayaking 16 km SPM: 65 |
Cycling 1h45 |
| Morning session volume and intensity description | |||||||
|
Volume (km) |
12 | 15 | 14 | - | 14 | 16 | - |
|
Intensity (km SPM) |
720 | 975 | 840 | - | 840 | 1040 | - |
| Afternoon Session |
Strength ) 12 exercises 25 maximal repetitions Recovery: 3min + Running: 40min |
Swimming 500m Recovery: 2 min |
Strength 6 exercises 12 maximal repetitions 7 sets + Core Exercises |
Rest |
Strength Identical to Monday |
Swimming 500m Recovery: 2min |
Rest |
| Afternoon volume and intensity description | |||||||
|
Volume (km) |
- | 2 | - | - | - | 2 | - |
|
Intensity (km SPM) |
- | 130 | - | - | - | 130 | - |
| Total daily and weekly volume and intensity | |||||||
|
Total Volume per day (km) |
12 | 17 | 14 | - | 14 | 18 | - |
|
Total intensity per day (km SPM) |
720 | 1105 | 840 | - | 840 | 1170 | - |
|
Total Volume per week (km) |
75 | ||||||
|
Total intensity per week (km SPM) |
4675 | ||||||
| SPM: Strokes per minute; -: not applicable All training sessions end with 15’ of passive stretching | |||||||
Table 3.
Microcycle applied during the transition period (M2 — last week of February; to the first week of April — M3); Duration: ~5 weeks.
Table 3.
Microcycle applied during the transition period (M2 — last week of February; to the first week of April — M3); Duration: ~5 weeks.
| SESSIONS | DAYS OF WEEK | ||||||
| MONDAY | TUESDAY | WEDNESDAY | THURSDAY | FRIDAY | SATURDAY | SUNDAY | |
| Morning Session |
Kayaking 18km + 62km Recovery: 3min SPM: 75-80 |
Kayaking 18km SPM: 70-75 |
Kayaking 16km + 61.5km SPM: 0.5km: 75 0.5km: 80 0.5km: 85 … |
Kayaking 12km SPM:65 + 615s Recovery: 1min45s SPM: 120 Boat in movement |
Kayaking 18km + 91.25km Recovery:3min SPM: 100m – 75 250m – 85 … |
Kayaking 18km SPM: 70-75 |
Kayaking 12km SPM: 65 or Cycling 1h10min |
| Morning session volume and intensity description | |||||||
|
Volume (km) |
30 | 18 | 25 | 12 | 29.25 | 18 | 12 |
|
Intensity (km SPM) |
2250 | 1350 | 2000 | 780 | 2340.75 | 1350 | 780 |
| Afternoon Session |
Strength 7 Sets 6 exercises 8 maximal repetitions + Core Exercises |
Kayaking 12km SPM: 65 + Running: 40min |
Strength 5 sets 12 exercises 20 maximal repetitions Recovery: 2 min + Core Exercises |
Rest |
Strength 12km Identical to Monday |
Kayaking 12km SPM: 65 + Running: 40min |
Rest |
| Afternoon volume and intensity description | |||||||
|
Volume (km) |
- | 12 | - | - | - | 12 | - |
|
Intensity (km SPM) |
- | 780 | - | - | - | 780 | - |
| Total daily and weekly volume and intensity | |||||||
|
Total Volume per day (km) |
30 | 30 | 25 | 12 | 29.25 | 30 | 12 |
|
Total intensity per day (km SPM) |
2250 | 2130 | 2000 | 780 | 2340.75 | 2130 | 780 |
|
Total Volume per week (km) |
168.25 | ||||||
|
Total intensity per week (km SPM) |
12410.75 | ||||||
| SPM: Strokes per minute; -: not applicable All training sessions end with 15’ of passive stretching | |||||||
Table 4.
Physiological responses in Elite male Kayakers before and after preparatory and transition training periods.
Table 4.
Physiological responses in Elite male Kayakers before and after preparatory and transition training periods.
| VARIABLE | M1 | M2 | M3 | TRAINING EFFECT | ||
|---|---|---|---|---|---|---|
| M1 VS M2 | M1 VS M3 | M2 VS M3 | ||||
| BODY COMPOSITION | ||||||
| Body weight (kg) | 80.1 (73.2; 87.0) |
77.8 (70.9; 84.7) |
77.2 (70.3; 84.1) |
-2.3 (-3.3; -1.2) p = 0.002; d = -0.27 |
-2.9 (-4.0; -1.7) p < 0.001; d = -0.35 |
-0.6 (-1.7; 0.49) p = 0.881; d = -0.07 |
| Body density | 1.09 (1.07; 1.10) |
1.10 (1.08; 1.12) |
1.10 (1.08; 1.11) |
0.01 (-0.01; 0.03) p = 0.731; d = 0.47 |
0.01 (-0.01; 0.03) p = 0.765; d = 0.56 |
0.0 (-0.02; 0.02) p = 1.000; d = 0.00 |
| Fat Mass (%) | 15.5 (12.7; 18.2) |
13.6 (10.9; 16.4) |
12.4 (9.6; 15.1) |
-1.8 (-2.8; -0.9) p = 0.005; d = -0.58 |
-3.1 (-4.1; -2.1) p < 0.001; d = -0.94 |
-1.2 (-2.2; -0.3) p = 0.065; d = -0.36 |
| Fat Mass (kg) | 12.5 (9.9; 15.1) |
10.7 (8.1; 13.3) |
9.6 (7.0; 12.2) |
-1.8 (-2.8; -0.9) p = 0.006; d = -0.58 |
-2.9 (-3.9; -2.0) p < 0.001; d = -0.94 |
-1.1 (-2.0; -0.1) p = 0.124; d = 0.80 |
| Fat Free Mass (kg) | 67.6 (62.0; 73.2) |
67.2 (61.6; 72.8) |
67.6 (62.1; 73.2) |
-0.4 (-1.1; 0.3) p = 0.718; d = -0.06 |
0.04 (-0.7; 0.8) p = 1.000, d = 0.00 |
0.46 (-0.3; 1.2) p = 0.696; d = 0.06 |
| Fat Free Mass (%) | 84.5 (81.8; 87.3) |
86.4 (83.6; 89.1) |
87.6 (84.9; 90.4) |
1.9 (0.9; 2.8) p = 0.005; d = 0.58 |
3.1 (2.1; 4.1) p < 0.001; d = 0.94 |
1.2 (0.3; 2.2) p = 0.065; d = 0.36 |
| LABORATORY TEST (4-MIN ALL-OUT) | ||||||
| (L·min-1) | 3.9 (3.4; 4.3) |
4.5 (4.1; 5.0) |
5.0 (4.5; 5.4) |
0.7 (0.5; 0.9) p < 0.001; d = 1.11 |
1.1 (0.9; 1.4) p < 0.001; d = 2.04 |
0.5 (0.3; 0.7) p = 0.001; d = 0.93 |
| (ml·kg-1·min-1) | 49.9 (45.5; 54.2) |
58.5 (54.1; 62.9) |
64.9 (60.5; 69.2) |
8.6 (6.0; 11.3) p < 0.001; d = 1.64 |
15.0 (12.4; 17.8) p < 0.001; d = 2.88 |
6.4 (3.7; 9.1) p = 0.001; d = 1.22 |
| Distance at (m) | 939.7 (908.3; 971.2) |
959.7 (928.3; 991.2) |
976.4 (945.0; 1007.9) |
20.0 (3.4; 36.6) p = 0.099; d = 0.53 |
36.7 (19.9; 53.5) p = 0.002; d = 0.98 |
16.7 (0.0; 33.4) p = 0.209; d = 0.44 |
| [La-]peak (mmol·L-1) | 12.7 (10.8; 14.5) |
12.1 (10.2; 14.0) |
11.4 (9.5 13.3) |
0.6 (-0.41; 1.53) p = 0.830; d = 4.65 |
1.3 (0.29; 2.25) p = 0.070; d = 4.33 |
0.7 (-0.27; 1.68) p = 0.530; d = -0.31 |
| HR at (bpm) | 182.8 (174.4; 191.1) |
181.8 (173.5; 190.2) |
180.3 (171.9; 188.7) |
-0.9 (-4.5; 2.6) p = 1.000; d = -0.10 |
-2.5 (-6.1; 1.2) p = 0.610; d = -0.25 |
-1.5 (-5.1; 2.1) p = 1.000; d = -0.15 |
| ON-FIELD TEST (4×1500-M INCREMENTAL) | ||||||
| HR at V4 (bpm) | 158.3 (149.4; 167.2) |
164.3 (155.5; 173.2) |
162.7 (153.9; 171.6) |
6.0 (-1.7; 13.8) p = 0.445; d = 0.57 |
4.4 (-3.4; 12.2) p = 0.850; d = 0.41 |
-1.6 (-9.4; 6.1) p = 1.000; d = -0.15 |
| Pace at V4 (s·km-1) | 297.8 (285.5; 310.1) |
272.6 (260.3; 284.9) |
272.3 (259.9; 284.6) |
-25.2 (-31.2; -19.2) p < 0.001; d = -1.71 |
-25.6 (-31.6; 5.7) p < 0.001; d = -1.73 |
-0.4 (-6.4; 5.7) p = 1.000; d = -0.02 |
|
Notes: Data are presented as EMm and 95%CI. The treatment effect are presented as estimated mean difference (EMD) and 95%CI. Abbreviation: Moment 1 (M1); Moment 2 (M2); Moment 3 (M3); Heart rate (HR); | ||||||
Table 5.
Skinfold measurements.
| VARIABLE | M1 | M2 | M3 | TRAINING EFFECT | ||
|---|---|---|---|---|---|---|
| M1 VS M2 | M1 VS M3 | M2 VS M3 | ||||
| Tricipital (mm) | 8.7 (5.9; 11.5) |
9.5 (6.7; 12.3) |
8.8 (6.0; 11.6) |
0.8 (-0.1; 1.6) p = 0.299; d = 0.24 |
0.1 (-0.8; 1.0) p = 1.000; d = 0.03 |
-0.7 (-1.6; 0.2) p = 0.415; d = -0.21 |
| Subscapular (mm) | 9.5 (8.2; 11.0) |
8.7 (7.3; 10.1) |
8.9 (7.5; 10.3) |
-0.9 (-1.3; -0.4) p = 0.007; d = -0.48 |
-0.7 (-1.1; -0.2) p = 0.036; d = -0.36 |
0.2 (-0.3; 0.6) p = 1.000; d = 0.12 |
| Bicipital (mm) | 5.5 (4.3; 6.8) |
3.9 (2.6; 5.1) |
3.8 (2.6; 5.1) |
-1.6 (-2.9; 0.3) p = 0.077; d = -1.07 |
-1.7 (-3.0; -0.4) p = 0.064; d =-1.14 |
-0.1 (-0.5; 0.4) p = 1.000; d = -0.07 |
| Suprailiac (mm) | 15.6 (11.7; 19.4) |
11.2 (7.3; 15.0) |
8.4 (4.6; 12.3) |
-4.4 (-7.2; -1.6) p = 0.025; d = -31.44 |
-7.1 (-10.0; -4.3) p < 0.001; d = -32.05 |
-2.7 (-5.6; 0.1) p = 0.238; d = -0.61 |
| Supraspinal (mm) | 11.2 (8.2; 14.3) |
8.8 (5.6; 11.8) |
10.5 (7.5; 13.6) |
-2.4 (-5.4; 0.6) p = 0.408; d = -0.65 |
-0.7 (-.37; 2.3) p = 1.000; d = -0.19 |
1.7 (-1.3; 4.7) p = 0.842; p = 0.46 |
| Abdominal (mm) | 15.7 (10.7; 20.8) |
12.7 (7.6; 17.8) |
11.5 (6.4; 16.5) |
-3.0 (-4.6; -1.5) p = 0.005; d = -0.49 |
-4.3 (-5.9; -2.7) p < 0.001; d = -0.78 |
-1.3 (-2.8; 0.3) p = 0.411; d = -0.28 |
| Crural (mm) | 15.5 (10.7; 20.4) |
13.8 (8.9; 18.6) |
12.8 (7.9; 17.7) |
-1.8 (-3.3; -0.3) p = 0.105; d = -0.29 |
-2.7 (-4.3; -1.2) p = 0.009; d = -0.46 |
-1.0 (-2.5; 0.6) p = 0.705; d = -0.17 |
| Geminal (mm) | 8.7 (4.6; 12.9) |
7.3 (3.1; 11.4) |
7.4 (3.3; 11.5) |
-1.5 (-2.5; -0.5) p = 0.036; d = -0.28 |
-1.3 (-2.4; -0.3) p = 0.075; d = -0.26 |
0.2 (-1.4; 1.7) p = 1.000; d = 0.02 |
|
Notes: Data are presented as estimated marginal means (Emm) and 95%CI. The treatment effect are presented as estimated mean difference (EMD) and 95%CI. Abbreviation: Moment 1 (M1); Moment 2 (M2); Moment 3 (M3); | ||||||
Disclaimer/Publisher’s Note: The statements, opinions and data contained in all publications are solely those of the individual author(s) and contributor(s) and not of MDPI and/or the editor(s). MDPI and/or the editor(s) disclaim responsibility for any injury to people or property resulting from any ideas, methods, instructions or products referred to in the content. |
© 2024 by the authors. Licensee MDPI, Basel, Switzerland. This article is an open access article distributed under the terms and conditions of the Creative Commons Attribution (CC BY) license (https://creativecommons.org/licenses/by/4.0/).
Copyright: This open access article is published under a Creative Commons CC BY 4.0 license, which permit the free download, distribution, and reuse, provided that the author and preprint are cited in any reuse.


