

Submitted:
11 November 2024
Posted:
13 November 2024
You are already at the latest version
Abstract
The extensive use of polypropylene (PP) in various industries necessitates the development of efficient and reliable methods for predicting the mechanical properties of PP compounds. This study presents the development of an analytical model (AM) designed to predict the tensile modulus of PP compounds with various fillers and additives, including chalk, impact strength modifiers, and peroxide additives. The AM, incorporating both logarithmic and linear compo-nents, was benchmarked against an Artificial Neural Network (ANN) to evaluate its performance. The results demonstrate that the AM consistently outperforms the ANN, achieving lower Mean Absolute Error (MAE) and higher Coefficient of Determination (R²) values. The simplicity and robustness of the AM make it a useful tool for the plastics industry, providing a practical approach to optimising compound formulations with minimal empirical testing.
Keywords:
polypropylene
; tensile modulus
; analytical model
; artificial neural network
; fillers and additives
; compound formulation
; mechanical properties
1. Introduction
Plastics have become an indispensable part of modern life, deeply embedded in various industries due to their versatility, durability and cost-effectiveness. Among the most important sectors for plastic products in Europe are the packaging industry, which accounts for 39% of total plastic use, the construction industry with 21% and the automotive industry with 9% [1,2]. These industries rely heavily on commodity plastics such as polypropylene (PP) and polyethylene (PE), which together account for almost half of all plastic applications. In the packaging sector in particular, polyolefins such as PP and PE are used predominantly, often alongside polyethylene terephthalate (PET), due to their favourable balance of mechanical properties and processability [1].
One of the key mechanical properties that determines the performance of plastic products is the modulus of elasticity, or tensile modulus. This property describes the relationship between tensile stress (force per unit area) and strain (proportional change in length) and indicates the stiffness of the material and its resistance to deformation under load. A higher tensile modulus means that the material is stiffer, which is often desirable in applications where structural integrity is critical [3].
In plastic packaging, the tensile modulus is particularly important. It has a direct impact on how well the packaging retains its shape and protects its contents during mechanical stresses such as stacking, transportation or handling. A packaging material with an appropriate tensile modulus contributes to a package that is strong enough to prevent deformation and potential damage, yet remains lightweight and cost effective [3]. Achieving this balance is essential in developing packaging solutions that are both durable and functional, meeting the stringent demands of modern logistics and consumer expectations. Examples of such packaging applications include rigid containers, flexible films, and caps or closures, which all require a careful balance between strength, flexibility, and cost efficiency to meet industry demands. Furthermore, during the packaging process of various consumer goods or food, the packaging container or film itself must withstand a multitude of forces during its handling and filling.
2. Development of New Compound Recipes
The modulus of elasticity of plastics can be finely tuned through formulation development. This involves not only the choice of base polymer, but also systematic modification by blending different polymers, incorporating fillers (such as chalk or talc) or adding specific additives [4,5,6,7,8,9]. However, modifying these components is not straightforward, as changes intended to improve the tensile modulus can simultaneously affect other critical properties, such as the viscosity of the compound. As a result, the formulation development process is complex and requires careful consideration to achieve the desired balance of properties [5,10,11].
2.1. Process of Recipe Development in the Industry
Traditionally, the industry has relied heavily on the expertise of experienced compounders to develop or refine compound formulations. While their knowledge and intuition are invaluable, this empirical and iterative approach is often labour-intensive, time-consuming and lacks reproducibility. This method involves numerous cycles of compounding, testing and adjusting formulations, which can be resource-intensive, especially when fine-tuning existing formulations or developing new ones to meet specific performance criteria [11,12]. The challenge of predicting material properties when blending different polymers further complicates this process, often requiring extensive trial and error to achieve the desired results [5,10,13].
In recent years, machine learning techniques, particularly Artificial Neural Networks (ANNs), have shown great promise in aiding the development of new compounds. For example, research by Lopez-Garcia et al. has shown that various machine learning models can predict the mechanical properties of fibre reinforced compounds with high accuracy, achieving model scores (R² values) as high as 0.96 indicating an almost perfect match between model prediction and experiment [14]. These models have also proved effective in optimising specific properties such as colour and impact resistance in polyamides [15]. The application of machine learning in materials science has expanded rapidly, with studies highlighting its potential to accelerate the discovery and optimisation of materials using large datasets and complex models [11,16,17].
However, the success of these data-driven approaches is largely dependent on the availability of comprehensive data sets, which must include detailed records of formulation components, processing conditions and fully characterised material properties [11]. The application of such data-driven methods becomes particularly challenging in environments where documentation is incomplete or where data on new materials or formulations is scarce. While there is ongoing research focused on identifying optimal experimental designs that minimise the effort required to train ANNs and reduce the number of trials required, the need to generate new data for accurate model training remains a significant hurdle in the industry [11].
2.2. Proposed Aim of This Paper
As outlined above, the current approach used in many companies to develop new formulations to achieve defined moduli of elasticity is largely iterative and unsystematic, often requiring considerable time and resources. To improve the current methodology of developing new or adjusting existing recipes, more systematic methods are being investigated within this paper.
While AI-based methods, such as those using ANNs, offer a more systematic approach when large data sets are available, they are still limited. Even with optimised experimental designs, a significant number of tests must be performed, and the ability of AI models to generalise to new formulation components is often limited by the type and amount of data available.
This paper proposes the development of an analytical mathematical model (AM) specifically designed to predict the modulus of elasticity of complex PP formulations. Unlike AI models, which can require extensive data and computational resources, this analytical model can be characterised by only a few modifiable fitting parameters. These parameters can be easily adjusted to accommodate new formulation components, making the model highly adaptable and practical for industrial use. The effectiveness of such models has already be proven for the application on the Melt Flow Rate (MFR) and shear viscosity of PP blends [10].
The primary objective of this work is to demonstrate that such an AM can provide accurate predictions for the tensile modulus of PP compounds across different formulations, with significantly less empirical data required compared to traditional AI methods. To validate the effectiveness of this approach, the paper also includes a comparative analysis with an ANN-based model, evaluating the performance of both models in terms of prediction accuracy in dependence of the available amount of data. The results of this comparison will highlight the potential advantages and limitations of each approach, providing valuable insights for future applications in polymer formulation development.
3. Experimental
In order to obtain experimental data on the tensile modulus depending on the composition of blends, additives and fillers, different compound formulations are identified and produced.
3.1. Materials and Characterisation
Four virgin homopolymer PP grades were used for the experiments. These were supplied by Lyondell Basell, Rotterdam, The Netherlands and Saudi Basic Industries Corporation (SABIC), Riyadh, Saudi Arabia. The additives used to specifically adjust the tensile modulus of the compounds produced were a peroxide masterbatch supplied by Polyvel Europe GmbH, Jork, Germany, and an impact modifier masterbatch supplied by DOW Inc., Midland, Michigan, USA [18,19]. Two common types of chalk supplied by OMYA GmbH, Oftringen, Switzerland were used as fillers. The MFR values and tensile moduli from the data sheets and the designation for the subsequent tests are given in Table 1 [20,21].
3.2. Laboratory Equipment for Compounding
All materials were compounded on a co-rotating twin screw extruder (Coperion GmbH, Stuttgart, Germany) with a screw diameter of 26 mm. Two different sets of compound compositions were used for the investigations. In order to investigate the effect of blending two types of homopolymer with each other on the tensile modulus, the composition shown in Table 2 was used for blending PP1350 with PP1600 as well as PP1450 with PP1600. Both series were only used for the analysis of the pure blend models in Chapter 4.1 without any additives or fillers. Only for those two series, the machine temperature was set to 220 °C during processing. For all other compounds, including additives and fillers, the blend composition of PP1500 and PP1600 was used. The blending ratios are given in Table 3. The machine temperature was set to 210 °C. The composition of the screw elements consisted only of conveying screw elements with a combination of kneading and mixing elements used at the beginning of the process to plasticise the polymers. The speed of the compounder was kept at 300 min-1 for all trials.
The blend composition PP1500-PP1600 was the basis for all tests with fillers and additives. Table 4 shows the different percentages of the different fillers and additives. Only one additive or filler was used at a time for compounding with each of the four base compositions. No compounds containing more than one filler or additive were prepared.
To characterise the tensile modulus, type 1A specimens were produced in accordance with DIN EN ISO 527 on an IntElect 100-250 injection moulding machine from Sumitomo (SHI) Demag Plastics Machinery GmbH, Schwaig, Germany [22]. The specimens were tested on a Z100 tensile testing machine manufactured by ZwickRoell GmbH & Co. KG, Ulm, Germany. A test speed of 1 mm/min was used to determine the tensile modulus in accordance with DIN EN ISO 527 [22]. For each compound, a minimum of 5 specimens were tested and used to calculate the average tensile modulus.
4. Development of Partial Models for the Prediction of the Tensile Modulus
Subsequently, several partial models will be developed to predict the tensile modulus of the different compounds as a function of their formulation. Following the development of a model capable of predicting the tensile modulus of the binary blends, additional models will be developed and evaluated for the effect of chalk, impact modifier and peroxide.
4.1. Development of a Model to Predict the Tensile Modulus of Binary Homo Polymer Blends
This section focuses on developing a predictive model for the tensile modulus of binary homopolymer blends. The tensile modulus measurements for all binary blends, without the inclusion of any fillers or additives, are illustrated in Figure 1.
It is generally observed that as the proportion of PP1600 in the binary blends increases, the tensile modulus of the mixtures also rises, reaching a maximum value with pure PP1600. For the PP1600-PP1350 and PP1600-PP1450 blend series, it is apparent that the relationship between the proportion of PP1600 and the tensile modulus is rather linear when the PP1600 content exceeds 20%. However, the increase in tensile modulus between 0% and 20% is significantly more pronounced and does not follow a linear trend. Traxler et al. conducted similar investigations on blends of various PP types and also investigated mechanical properties including the tensile modulus. Their findings indicated a similar drop in tensile modulus at a 20% content of the polymer with a higher tensile modulus in homopolymer blends, despite a linear relationship in other blend types [5]
To develop a model capable of predicting these relationships, several boundary conditions were established. Firstly, the model should only require the tensile moduli of the pure blend components and their proportions in the blend as input parameters. Additionally, the model should be as simple as possible and applicable across all test series using the same constants. The latter condition is particularly important to ensure the model's applicability to the materials considered in this series of tests.
Various mathematical functions, including exponential, polynomial, and power functions, were evaluated. Ultimately, a logarithmic model was found to best fit the data. The logarithmic model is given by Equation 1:
In this equation, represents the tensile modulus of the binary blend, with and denoting the tensile moduli of the two blend partners. represents the share of the blend partner with the higher tensile modulus in the binary blend. Due to the logarithmic function's parameters being dependent on the ratios and differences of the tensile moduli of the two blend partners, this model can be applied across all blends using the same constants. These constants were determined by minimising the error between the model's predictions and the average tensile moduli of all blends. The fitted constants are provided in Table 5.
- Figure 2 illustrates the application of the model to all three blends. The dotted lines represent the model predictions, while the individual measurements, including their standard deviations, are depicted as dots. The model effectively captures the linear relationship for higher shares of PP1600 and accurately models the steep increase for shares below 20%.
To quantify the performance of the models, the Mean Absolute Error (MAE) and the Coefficient of Determination (R²) are calculated with being the number of samples and being the tensile moduli of both model predictions and measurements.
The R² is a metric used to determine the proportion of variance in a dependent variable that is accounted for by one or more independent variables within a regression model. An R² value of 1 signifies a perfect fit, where the model's predictions align exactly with the observed data. In contrast, an R² of 0 implies that the model fails to capture any of the variance in the dependent variable. It's important to note that a low R² does not necessarily indicate a poor model; it may reflect significant inherent variability in the data or the challenging nature of modelling in certain domains. Nevertheless, comparing R² values for models applied to the same dataset can reveal important insights into their performance. Additionally, the Mean Absolute Error (MAE) is calculated to assess the model's prediction accuracy in terms of the average magnitude of errors.
The MAE and R² values of the model, along with the measurement error of the observed data, are summarised in Table 6. For the PP1600-PP1350 and PP1600-PP1450 blends, the MAE is lower than the measurement error, and the R² values are notably high, with 0.984 for PP1600-PP1350 and 0.993 for PP1600-PP1450. However, for the PP1600-PP1500 blend, the MAE of 14.323 exceeds the measurement error of 11.477, and the R² is slightly lower, at 0.892. An examination of the PP1600-PP1500 blend series in Figure 2 suggests that the model fits the formulations with 0%, 33%, and 100% PP1600 quite well, while the formulation with 67% PP1600 may be an outlier, as the drop in tensile modulus between 33% and 100% PP1600 does not align with expectations
4.2. Modelling the Tensile Modulus of Blends with Chalk
Following the development of the model for binary homopolymer blends, this section investigates the effect of adding chalk as a filler on the tensile modulus. The boxplot diagrams for the blends containing fine chalk are presented in Figure 3. Both types of chalk used in this study are surface-treated, which inhibits chemical interactions with other components in the formulation. The data clearly show that, for all blends, the tensile modulus increases linearly with the addition of chalk, consistent with findings in the literature [6,8].
According to Vollenberg et al, the effect of chalk on the tensile modulus in PP can be described using a modified Kerner equation [9]. However, this equation typically provides satisfactory results only for perfectly adhering chalk and does not account for the particle size of the chalk. Moreover, the equation requires additional information about the tensile modulus of the chalk itself and the Poisson’s ratio of both the PP and the chalk. Such detailed information is often unavailable in technical datasheets, necessitating a more straightforward modelling approach.
To identify a model that is both simple and effective, a linear model following Equation 4 was fitted to the data. For each of the four blends, the tensile modulus without any chalk as well as the slope were optimised to minimise the MAE for the individual blends. is the share of chalk in the blend.
Figure 4 displays the fitted linear models alongside the average tensile modulus and standard deviation for each blend. The results indicate that the model provides a satisfactory fit to the experimental data. The calculated MAE, R², and measurement error for each blend are summarised in Table 7.
For all blends, an R² score of 0.97 or higher was achieved, except for the blend containing 33% PP1600, which included an outlier. For the blends with 67% and 100% PP1600, the MAE is even lower than the measurement error, indicating an excellent fit. Upon further investigation, a linear relationship between the slope of the fitted models and the tensile modulus of the base blend without chalk was identified, as shown in Figure 5.
This linear relationship between the slope and allows for the development of a unified model for all four blends, as expressed in Equation 5:
In this model, instead of determining the slope individually for each blend, the parameters are reduced to two: the intercept and the slope from the linear fit in Figure 5. This approach not only simplifies the model but also enhances its general applicability.
A similar approach was applied to the polymer blends with the second type of chalk. The results for these blends are summarised in Table 8. The measurement error for these blends is similar to that observed for the fine chalk, and the MAE is generally lower, with values of 3.870 for the 100% PP1500 blend and 1.906 for the 33% PP1500 blend being exceptionally low. It is worth noting, however, that only two concentrations of chalk were tested, resulting in three data points for the linear model. Despite this limitation, the model demonstrates good accuracy for both types of chalk, confirming its validity.
4.3. Modelling the Tensile Modulus of Blends with Impact Strength Modifier
This section addresses the impact of adding an ethylene-octene copolymer as an impact strength modifier on the tensile modulus of the blends. Unlike chalk, which is commonly used in percentages ranging from 10% to 30% in industrial applications, the impact strength modifier is typically used in much smaller amounts, usually less than 5%. Although the primary purpose of this additive is to enhance the impact strength of the compound, it also significantly affects the tensile modulus, which must be considered. The boxplot diagrams for the various blends with the impact strength modifier are shown in Figure 6.
Similar to the chalk blends, a linear trend is observed, with the tensile modulus decreasing as the proportion of the impact strength modifier increases. Consequently, a linear model was fitted for each blend, analogously to the approach used for chalk with Equation 4. The fitted linear models, along with the data points and measurement deviations, are depicted in Figure 7.
The linear models generally fit the data well. The MAE and R² values, along with the measurement deviations for each blend, are presented in Table 9.
For the blend series with 100% PP1600, the linear model is highly accurate, achieving an R² value of 0.962 and an MAE of 8.929, which is lower than the measurement error of 38.332. However, for the other blends, the MAE values exceed the measurement error, indicating less accuracy. One potential reason for these discrepancies, compared to the trials involving chalk, may be the different magnitudes of the component proportions. The chalk trials used percentages ranging from 10% to 30%, where small deviations in dosing may have had a lesser impact compared to the dosing differences in the impact strength modifier, which was used in much smaller amounts (up to 5%). Despite the lower R² values for some blends, the linear models successfully capture the general trend.
To further analyse the effect of the impact strength modifier, the relationship between the slope of the linear models and the tensile modulus of the pure blends was investigated. This relationship is illustrated in Figure 8. For the blends with 0% PP1600, 33% PP1600, and 100% PP1600, the slopes can be fitted almost perfectly with a linear function. However, the slope for the blend with 67% PP1600 and 33% PP1500 is an outlier and was therefore not considered in determining the generalised model for the impact strength modifier.
4.4. Modelling the Tensile Modulus of Blends with Peroxide Additive
This section explores the effect of adding a peroxide-containing masterbatch on the tensile modulus of the blends. The boxplot diagrams for the different blends with varying percentages of the peroxide additive are presented in Figure 9. For the blends containing 100% PP1600 and 33% PP1600, no significant effect of the peroxide additive on the tensile modulus was observed. A similar lack of effect was noted for the blend with 67% PP1600, with the exception of the formulation containing 0.15% peroxide. However, in the blend with 100% PP1500, a clear decrease in tensile modulus was identified as the peroxide content increased.
The observed differences in the effect of peroxide across the blends cannot be fully explained without additional information regarding the formulations of the base materials. Although both types of polypropylene used were homopolymers, differences in the additives, such as stabilisers, present in the virgin compounds may contribute to these discrepancies. Furthermore, a close examination of the data points for the peroxide-containing blends revealed considerable variability in the tensile modulus, particularly in formulations such as 0.25% peroxide for the 33% PP1600 blend, and 0.15% and 0.25% peroxide for the 67% PP1600 blend.
To further investigate this variability, an example of the stress-strain diagram measured during tensile testing for the 0.25% peroxide formulation in the 33% PP1600 and 67% PP1500 blend is shown in Figure 10. While the stress-strain curves between 0% and 10% strain are relatively consistent, significant deviations in the slopes of the curves are observed between 0% and 0.3% strain. According to DIN EN ISO 527, the tensile modulus is calculated as the slope between 0.05% and 0.25% strain [22]. These deviations are more pronounced in the trials containing peroxide compared to the other trials, suggesting that the primary purpose of peroxide in the formulations—adjusting polymer viscosity—may be influencing these results. The injection moulding machine's parameters were kept constant for all formulations to ensure comparability of the test specimens, but the introduction of peroxide may have caused inconsistencies during the moulding process, particularly in the filling or holding phases.
For further analysis, the three formulations with the highest measurement deviations were excluded. Since a linear relationship can be anticipated in Figure 9, similar to the findings for chalk and the impact strength modifier, a generalised model was sought to describe all four series within a single framework. However, no clear relationship between the slope of the individual linear models and the tensile modulus of the blends without peroxide was found. Instead, a correlation with the proportion of PP1500 in the blend was observed, as shown in Figure 11.
A power model was fitted to these four data points, resulting in the following equation:
This equation describes the tensile modulus of the blend series as a function of the peroxide additive proportion and the proportion of PP1500 in the blend . The fitting parameters for the power model were found to be = N/mm² and = .
Figure 12 demonstrates the application of this equation to the four blends. The R² and MAE values, along with the measurement error for each data point, are summarised in Table 10. Although the model provides a reasonably good fit for some blends, the variability in the data indicates that further refinement may be necessary to fully capture the effects of peroxide in these formulations.
5. Aggregation of Partial Models to a Complete Model
In the previous sections, individual models were developed to predict the tensile modulus of binary PP blends and the effects of various fillers and additives, such as chalk, impact strength modifiers, and peroxide additives. Each of these models was tailored to specific conditions, focusing on particular blend compositions and additive types. The next logical step is to integrate these partial models into a comprehensive framework that can reliably predict the tensile modulus of a wide range of PP compounds, including those with complex formulations.
To achieve this, the assumption is made that the various fillers and additives do not interact with each other in ways that would significantly alter the underlying relationships identified in the previous models. This assumption allows for the combination of the individual models into a single equation that can account for the effects of multiple additives within a single compound. The general form of this aggregated model is given by Equation 7:
In this equation, represents the tensile modulus of the complete compound, which includes the effects of blending and the addition of fillers or additives. is the tensile modulus of the binary polymer blend without any additives, as previously modelled using a logarithmic function (Equation 8):
The effects of the individual additives are modelled as adjustments to this base modulus. For each type of chalk (fine and rough), impact strength modifier, and peroxide, the effect on the tensile modulus is described by equations analogous to those developed in earlier sections:
- 2.
- These equations incorporate the parameters fitted in the previous sections, with , , , and representing the proportions of the respective additives in the blend. The coefficients and correspond to the intercept and slope parameters identified for each additive, while and are the fitting parameters for the peroxide model.
- 3.
- After developing the complete model by combining these partial models, all parameters were optimised using the full dataset to minimise the overall MAE. The tensile moduli and of the pure materials were measured, but to ensure the best possible accuracy for the aggregated model, these values were also refined during the optimisation process. The final optimised parameters for the complete model are presented in Table 11.
6. Benchmarking with Artificial Neural Networks
After developing and aggregating the partial models into a comprehensive analytical model (AM) for predicting the tensile modulus of polypropylene compounds, the next step is to benchmark this model against an Artificial Neural Network (ANN) approach. This comparison will evaluate the efficacy of the analytical model relative to the ANN in terms of prediction accuracy and robustness, particularly in scenarios where data is limited or noisy.
For the ANN, the MLPRegressor from the scikit-learn library (version 1.5.1) was employed, using Python version 3.10 [23]. The typical approach in machine learning involves splitting the dataset into a training set, used to train the model, and a test set, used to evaluate its performance. For this study, an 80/20 split was chosen, with 80% of the data allocated for training and 20% reserved for testing.
To ensure a robust comparison, the dataset was split randomly into training and test sets ten times, mitigating any bias that might arise from a single dataset split. This randomisation helps to prevent scenarios where, for example, all data points for a specific additive end up in the training set, skewing the results. The aggregated model (AM) was evaluated on the same splits as the ANN for consistency.
The analysis was performed on two versions of the dataset: the full dataset, which includes all data points, and a reduced dataset, from which outliers with a measurement deviation exceeding 50 N/mm² were removed. This allowed for an examination of how well each model handles data variability and outliers.
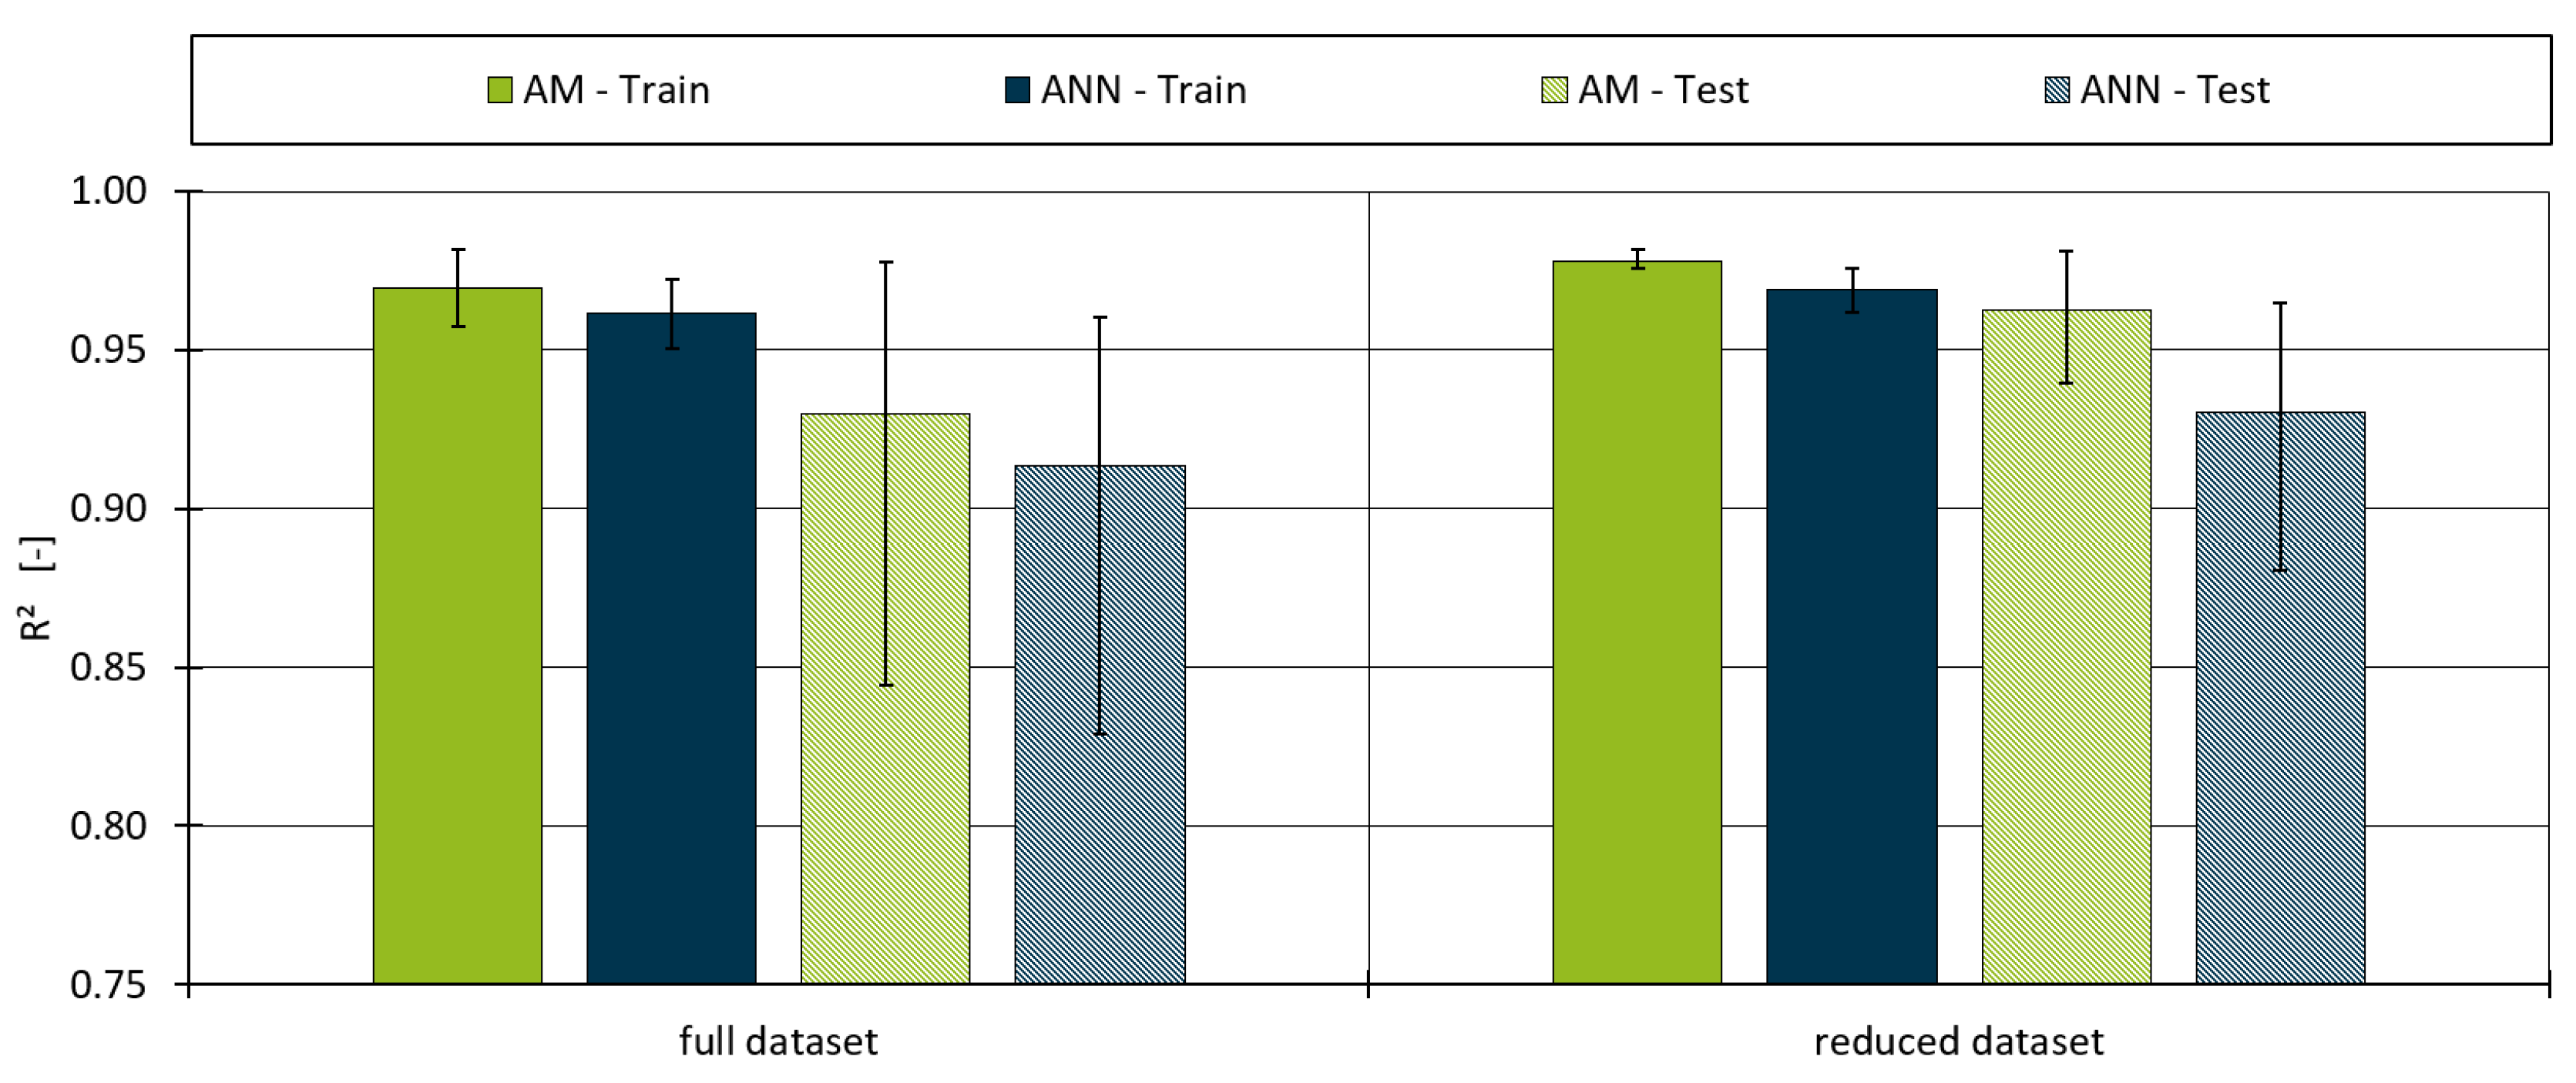
The results of the Mean Absolute Error (MAE) and the Coefficient of Determination (R²) for both models are summarised in Figure 13 and Figure 14.
Figure 13 illustrates the MAE values for both the AM and ANN models across all dataset splits, for both training and testing. As expected, the MAE for the test datasets is generally higher than that for the training datasets, reflecting the challenge of generalising the model to unseen data. However, the AM consistently outperforms the ANN, achieving lower MAE values across both the full and reduced datasets. For the full dataset, the AM demonstrated an average MAE of 25.70 for the training data and 38.41 for the test data. In comparison, the ANN produced an average MAE of 33.93 for training and 45.21 for testing. These results indicate that the AM is more accurate overall, with performance close to the inherent variability in the data, as the measurement error for the full dataset was 24.07. When examining the reduced dataset, which excludes outliers with significant measurement deviations, the AM's performance improved further.
The model achieved a minimum MAE of 24.00 for the training data and 28.29 for the test data. In contrast, the ANN showed only a modest improvement under the same conditions, with average MAE values of 32.86 for training and 42.47 for testing. This suggests that the AM is more robust in handling variability and outliers in the data.
Figure 14 presents the R² values for both models, which indicate the proportion of variance in the dependent variable that is predictable from the independent variables. For the full dataset, the AM achieved an average R² of 0.97 for the training data and 0.93 for the test data, indicating a strong fit to the data. The ANN's performance was slightly lower, with R² values of 0.96 for training and 0.91 for testing, further demonstrating that the AM is more effective in capturing the underlying relationships in the data.
The reduced dataset results highlight the AM’s superior performance, where it exhibited an R² of 0.98 for the training data and 0.96 for the test data, suggesting an excellent fit even when data variability is reduced. In contrast, the ANN's R² values were lower, at 0.97 for training and 0.93 for testing, underscoring the AM’s robustness and effectiveness in predictive modelling.
The benchmarking results reveal that the aggregated analytical model (AM) not only matches but often exceeds the performance of the Artificial Neural Network (ANN), especially in terms of Mean Absolute Error (MAE). This outcome is somewhat unexpected, given that ANNs are typically well-suited to handle complex, non-linear relationships within large datasets. However, the AM’s superior performance, particularly with reduced datasets, underscores its robustness and efficiency in predicting the tensile modulus of PP compounds.
One of the critical advantages of the AM lies in its simplicity. Unlike the ANN, which relies on the optimisation of numerous neuron weights, the AM is governed by only 14 fitting parameters. This simplicity enables the AM to achieve high accuracy with fewer data points, which is a significant advantage in real-world applications where extensive datasets are often unavailable. Moreover, the AM’s better generalisation to unseen data suggests that it may be less prone to overfitting compared to the ANN. This characteristic is crucial for practical applications, where the ability to predict the performance of new formulations based on limited data is highly valuable.
The results further indicate that the AM is particularly effective at handling variability and outliers within the data. When outliers were removed, the model’s performance improved noticeably, achieving lower MAE values and higher R² scores. This robustness in the face of data variability makes the AM an attractive option for industrial applications, where the quality of data can often be inconsistent.
7. Discussion
This study presents a comprehensive analytical model for predicting the tensile modulus of complex polypropylene (PP) compounds, taking into account the effects of various fillers and additives. The developed model, which includes logarithmic and linear components, effectively predicts the tensile modulus across different PP blends with notable accuracy. For binary homopolymer blends, the model achieved R² values as high as 0.993 for the PP1600-PP1450 blend and a Mean Absolute Error (MAE) lower than the measurement error for two out of three blends, highlighting its precision.
In the evaluation of fillers, both fine and rough chalk demonstrated linear increases in tensile modulus, with the model achieving R² values consistently above 0.97. The highest accuracy was observed for the blend with 67% PP1600 and fine chalk, where the MAE was significantly lower than the measurement error, confirming the model’s reliability. A unified model was further developed for chalk-filled blends, capturing the relationship between the slope of the linear models and the base blend’s tensile modulus with a high degree of accuracy.
When analysing the impact strength modifier, the model also revealed a linear relationship, albeit with lower R² values compared to chalk, particularly for blends with a higher percentage of PP1600. Despite these challenges, the model still managed to reflect the general trend accurately. The effect of peroxide additives presented more complexity, with significant variations in tensile modulus observed in blends with 100% PP1500. The developed power model for peroxide-containing blends demonstrated that while some outliers existed, the general predictive capability of the model remained robust, as indicated by R² values around 0.77 for the 0% PP1600 blend.
In benchmarking against an Artificial Neural Network (ANN), the aggregated analytical model outperformed the ANN across all datasets, achieving a lower average MAE of 25.70 for the training data and 38.41 for the test data on the full dataset, compared to 33.93 and 45.21 for the ANN. The aggregated model’s R² values also surpassed those of the ANN, particularly in the reduced dataset, with values reaching 0.98 for training and 0.96 for testing. These results underscore the analytical model’s superior performance in scenarios with limited data availability.
Overall, the developed model not only provides a highly accurate and efficient method for predicting the tensile modulus of PP compounds but also offers a practical tool for the industry to optimise formulations with minimal empirical testing. For the development of the current model, possible side effects of combining multiple additives which interact with each other was neglected. Future work could explore the extension of this model to other polymer types and more complex formulations to enhance its applicability and robustness further.
Author Contributions
Conceptualisation, L.S.; methodology, L.S.; software, L.S.; validation, L.S.; formal analysis, L.S.; investigation, L.S.; resources, L.S.; data curation, L.S.; writing—original draft preparation, L.S.; writing—review and editing, L.S. and L.L. and Ch. H.; visualisation, L.S.; supervision, L.S. and L.L. and Ch. H.; project administration, L.S. and L.L. and Ch. H.; funding acquisition, L.S. and L.L. and Ch. H. All authors have read and agreed to the published version of the manuscript.
Funding
This research received financial support from the German Bundesministerium für Bildung und Forschung (No. 033KI101). Open access funding was provided by the Open Access Publishing Fund of RWTH Aachen University.
Institutional Review Board Statement
Not applicable.
Data Availability Statement
All data presented in this study are available on request from the corresponding author.
Acknowledgments
We want to thank LyondellBasell, Saudi Basic Industries Corporation (SABIC), Polyvel Europe GmbH, DOW Inc and OMYA GmbH for supplying the materials and supporting the investigations.
Conflicts of Interest
The authors declare no conflict of interest.
References
- N.N. Plasticts - the Facts 2020; 2020. [Google Scholar]
- N.N. Stoffstrombild Kunststoffe in Deutschland 2019.; 2020. [Google Scholar]
- Erhard, G. Konstruieren mit Kunststoffen; Carl Hanser Verlag GmbH & Co. KG: München, 2008; Volume 4, p. 549. [Google Scholar]
- N.N. Evonik Industries AG - Additives for the Plastics Industry. 2024. Available online: https://products.evonik.com/assets/21/88/Additives_for_Plastics_Recycling_Industry_EN_Asset_1662188.pdf.
- Traxler, I.; Kaineder, H.; Fischer, J. Simultaneous Modification of Properties Relevant to the Processing and Application of Virgin and Post-Consumer Polyproylene. Polymers 2023, 15. [Google Scholar] [CrossRef] [PubMed]
- Peng, Y. , et al., Calcium Carbonate Particles Filled Homopolymer Polypropylene at Different Loading Levels: Mechanical Properties Characterization and Materials Failure Analysis. Journal of Composites Science 2021, 5. [Google Scholar] [CrossRef]
- Zweifel, H.; Maier, R.D.; Schiller, M. Plastics Additives Handbook; Carl Hanser Verlag: München, 2009. [Google Scholar]
- Švehlová, V.; Polouček, E. Mechanical properties of talc-filled polypropylene. Influence of filler content, filler particle size and quality of dispersion. Die Angewandte Makromolekulare Chemie 2003, 214, 91–99. [Google Scholar] [CrossRef]
- Vollenberg, P.H.T.; Heikens, D. The mechanical properties of chalk.filled polypropylene: a preliminary investigation. Journal of Materials Science 1990, 25, 3089–3095. [Google Scholar] [CrossRef]
- Seifert, L.; Leuchtenberger-Engel, L.; Hopmann, C. Enhancing the Quality of Polypropylene Recyclates: Predictive Modelling of the Melt Flow Rate and Shear Viscosity. Polymers 2024, 16. [Google Scholar] [CrossRef] [PubMed]
- Seifert, L.; Hopmann, Ch. Investigations on suitable design of experiments for predicting compound properties. 32nd International Colloquium Plastics Technology 2024, Aachen; 2024. [Google Scholar]
- Kohlgrüber, K.; Bierdel, M.; Rust, H. Polymer-Aufbereitung und Kunststoff-Compoundierung; Carl Hanser Verlag: München, 2019. [Google Scholar]
- Hubo, S., et al. Blending of recycled mixed polyolefins with recycled polypropylene: Effect on physical and mechanical properties. In Polymer Processing Society PPS; AIP Publishing: Graz, Austria, 2015.
- Lopez-Garcia, P., et al. Compounding process optimization for recycled materials using machine learning algorithms. Procedia CIRP 2022.
- Rudolf, M. Recent achievements in polyamide compound development using Artificial Intelligence. Peformance Polyamides 2021. [Google Scholar]
- Merchant, A. Merchant, A., et al., Scaling deep learning for materials discovery. Nature 2023, 624, 80–85. [Google Scholar] [CrossRef] [PubMed]
- Chong, S.S., et al., Advances of machine learning in materials science: Ideas and techniques. Frontiers of Physics 2023, 19.
- Sebbel, A. Sebbel, A., Peroxid-Masterbatches ermöglichen die Verarbeitung von Polypropylen-Rezyklaten in unterschiedlichen Anwendungen. Extrusion 2022, 27, 22–23. [Google Scholar]
- DOW. Technical Information ENGAGE 8200 Polyolefin Elastomer 2019.
- SABIC. Technical Datasheets 2024 [cited 2024 18.08]. 2024. Available online: https://www.sabic.com/en/products/polymers/polypropylene-pp/sabic-pp.
- LyondellBasell. Technical Datasheets. 2024. [cited 2024 18.08]. Available online: https://www.lyondellbasell.com/en/products-technology/advanced-polymer-solutions/technical-data-sheets/.
- N.N. Kunststoffe - Bestimmung der Zugeigenschaften - Teil 1: Allgemeine Grundsätze (ISO 527-1:2019); Berlin: Beuth Verlag, 2019. [Google Scholar]
- Pedregosa, F., et al., Scikit-learn: Machine learning in Python. Journal of machine learning research 2011, 12, 2825–2830.
Figure 1.
Boxplot diagrams of the tensile moduli of the binary blends.
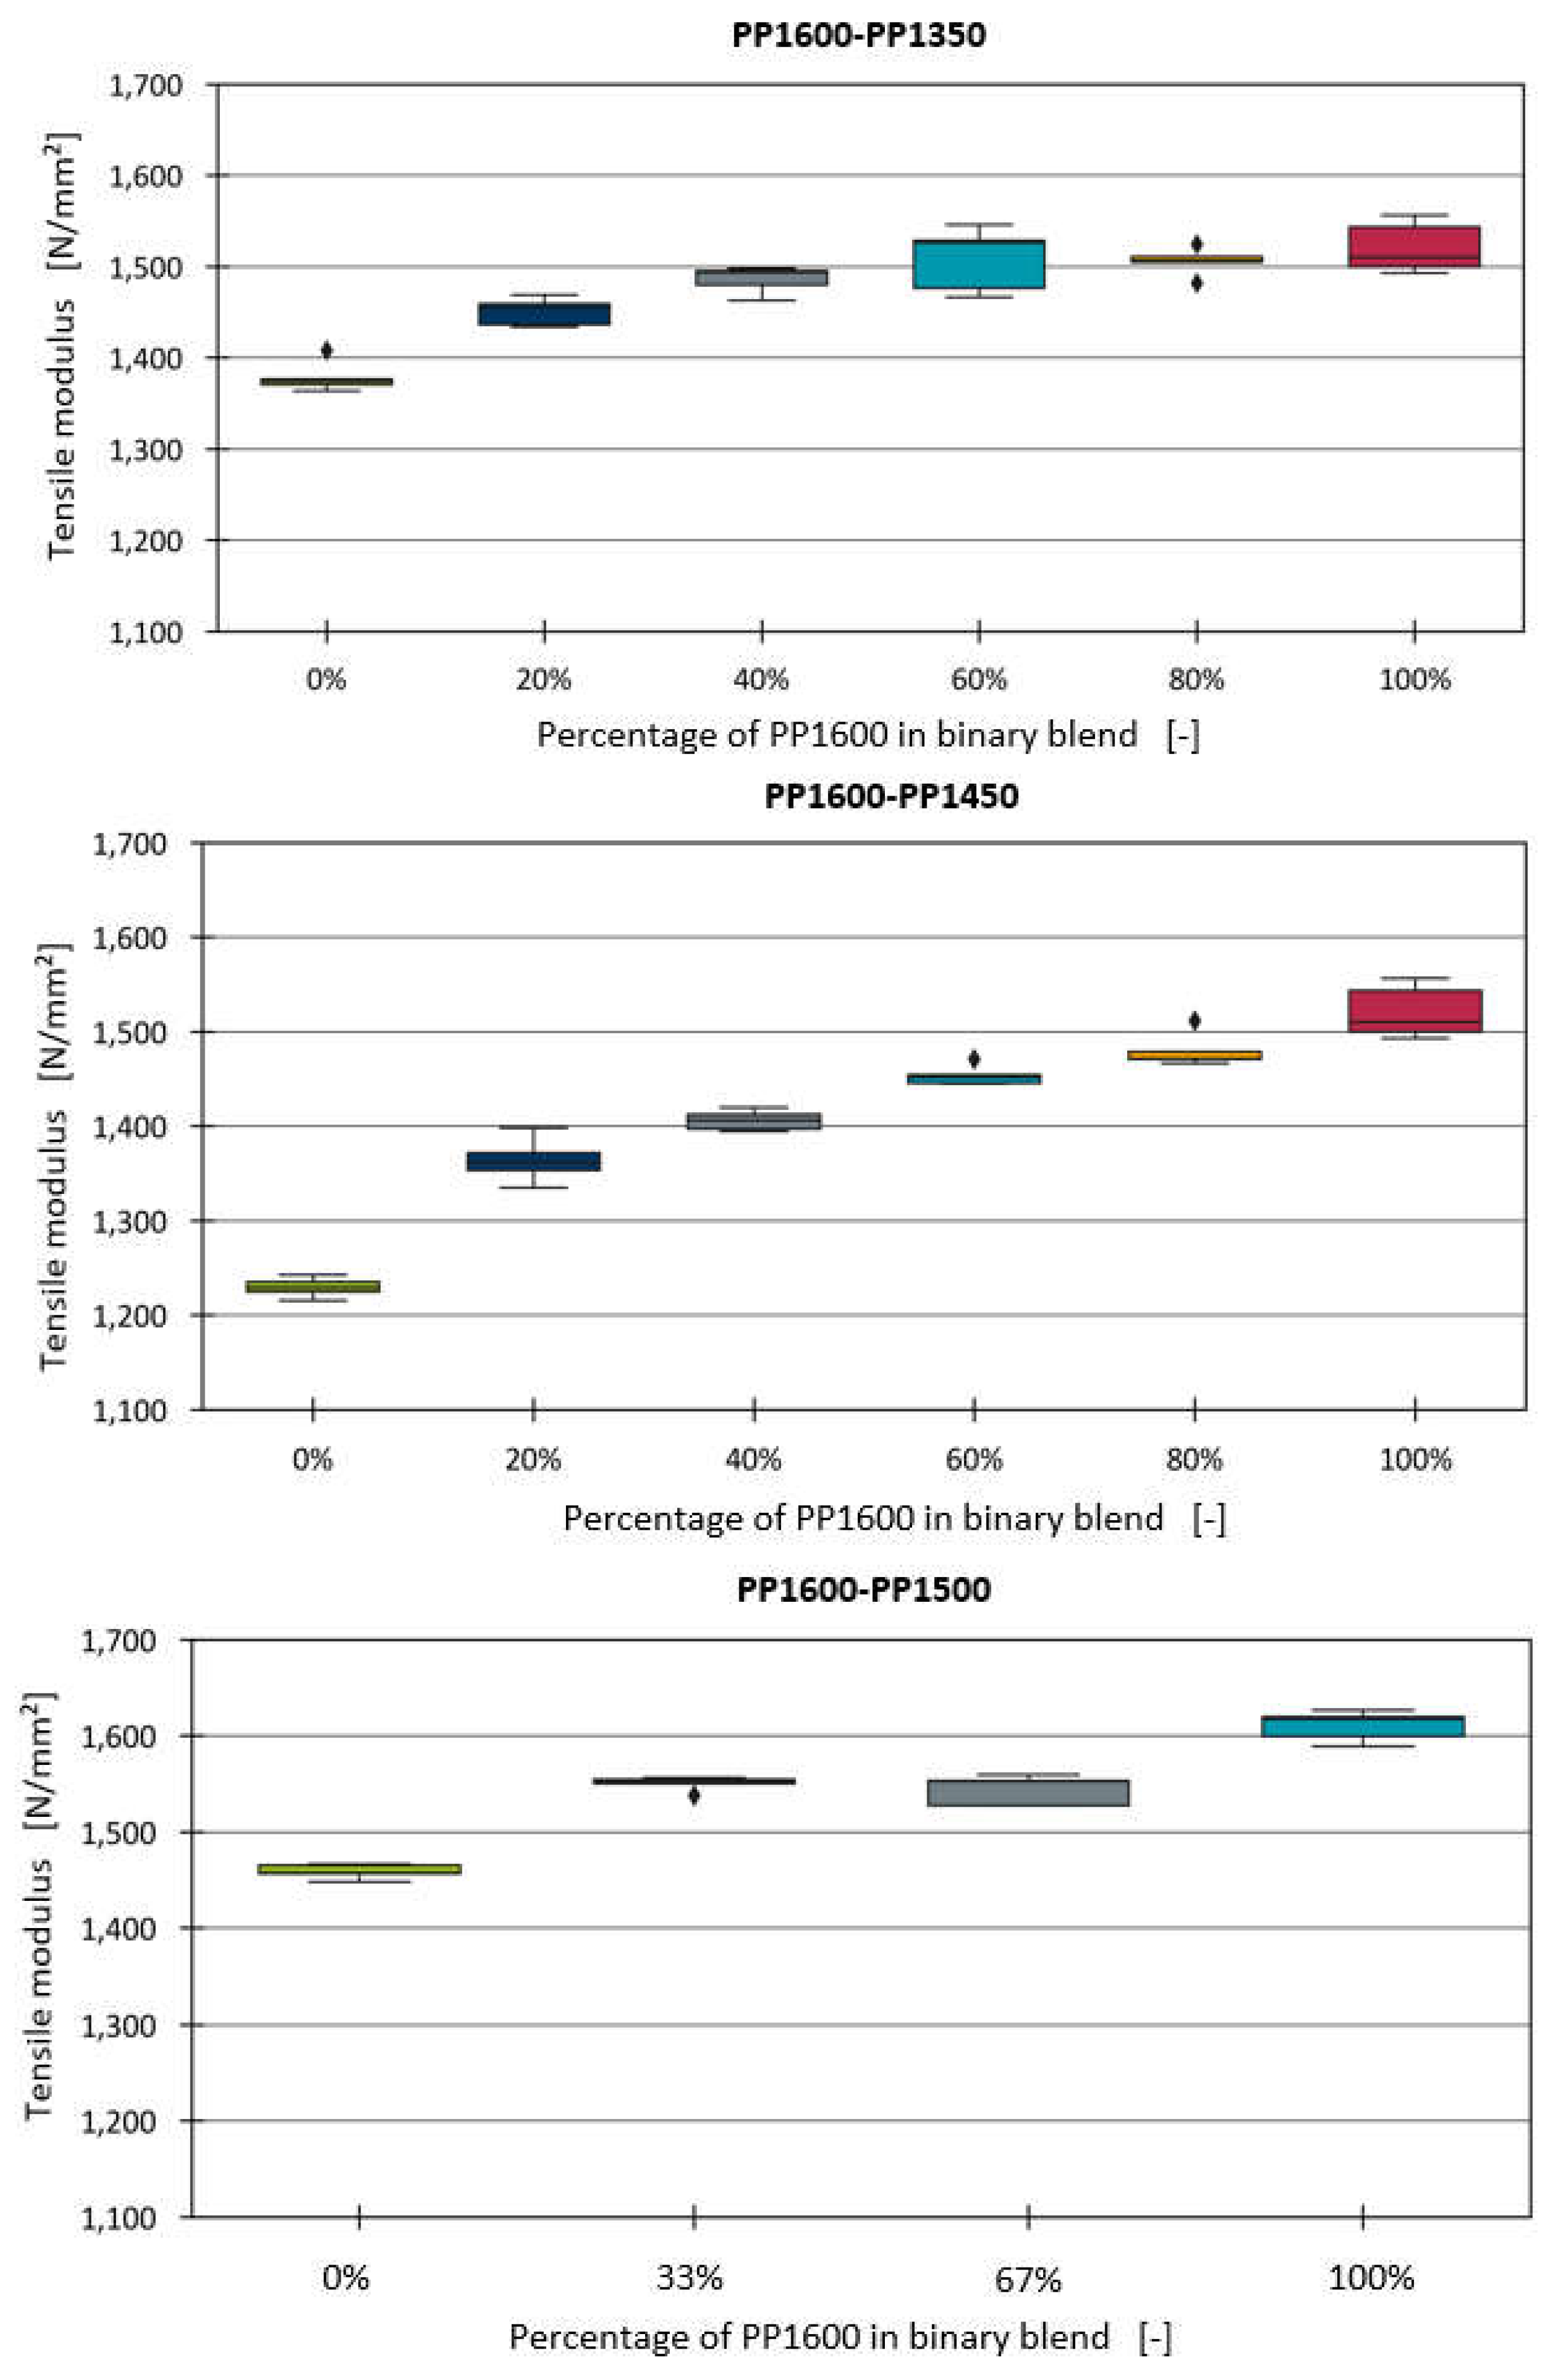
Figure 2.
Model predictions and measured data points for the binary blends.
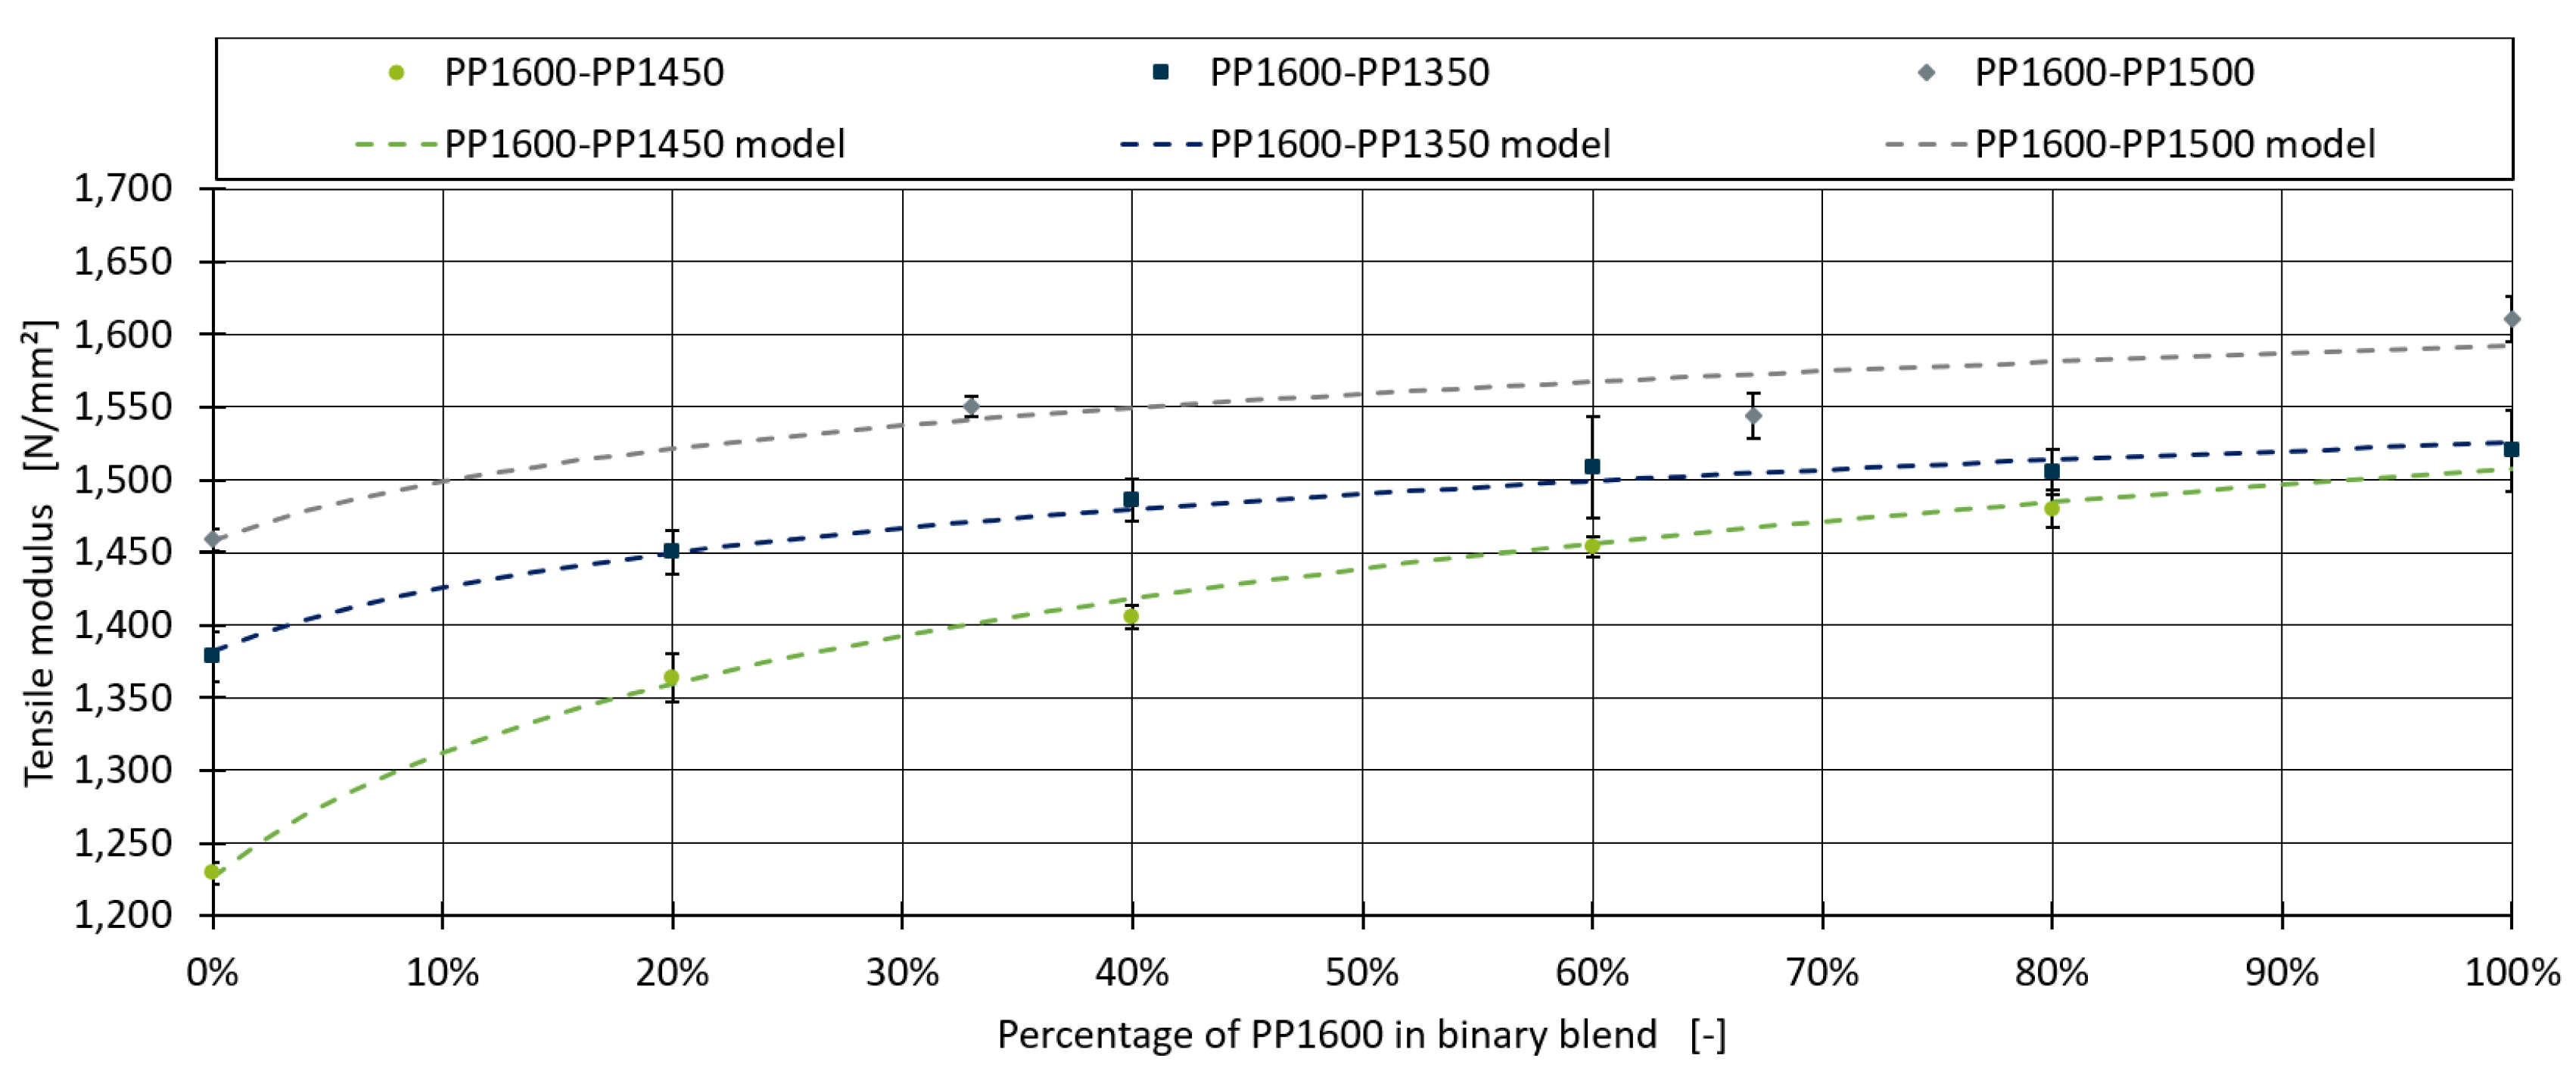
Figure 3.
Boxplot diagrams of the tensile moduli of the binary blends with fine chalk.
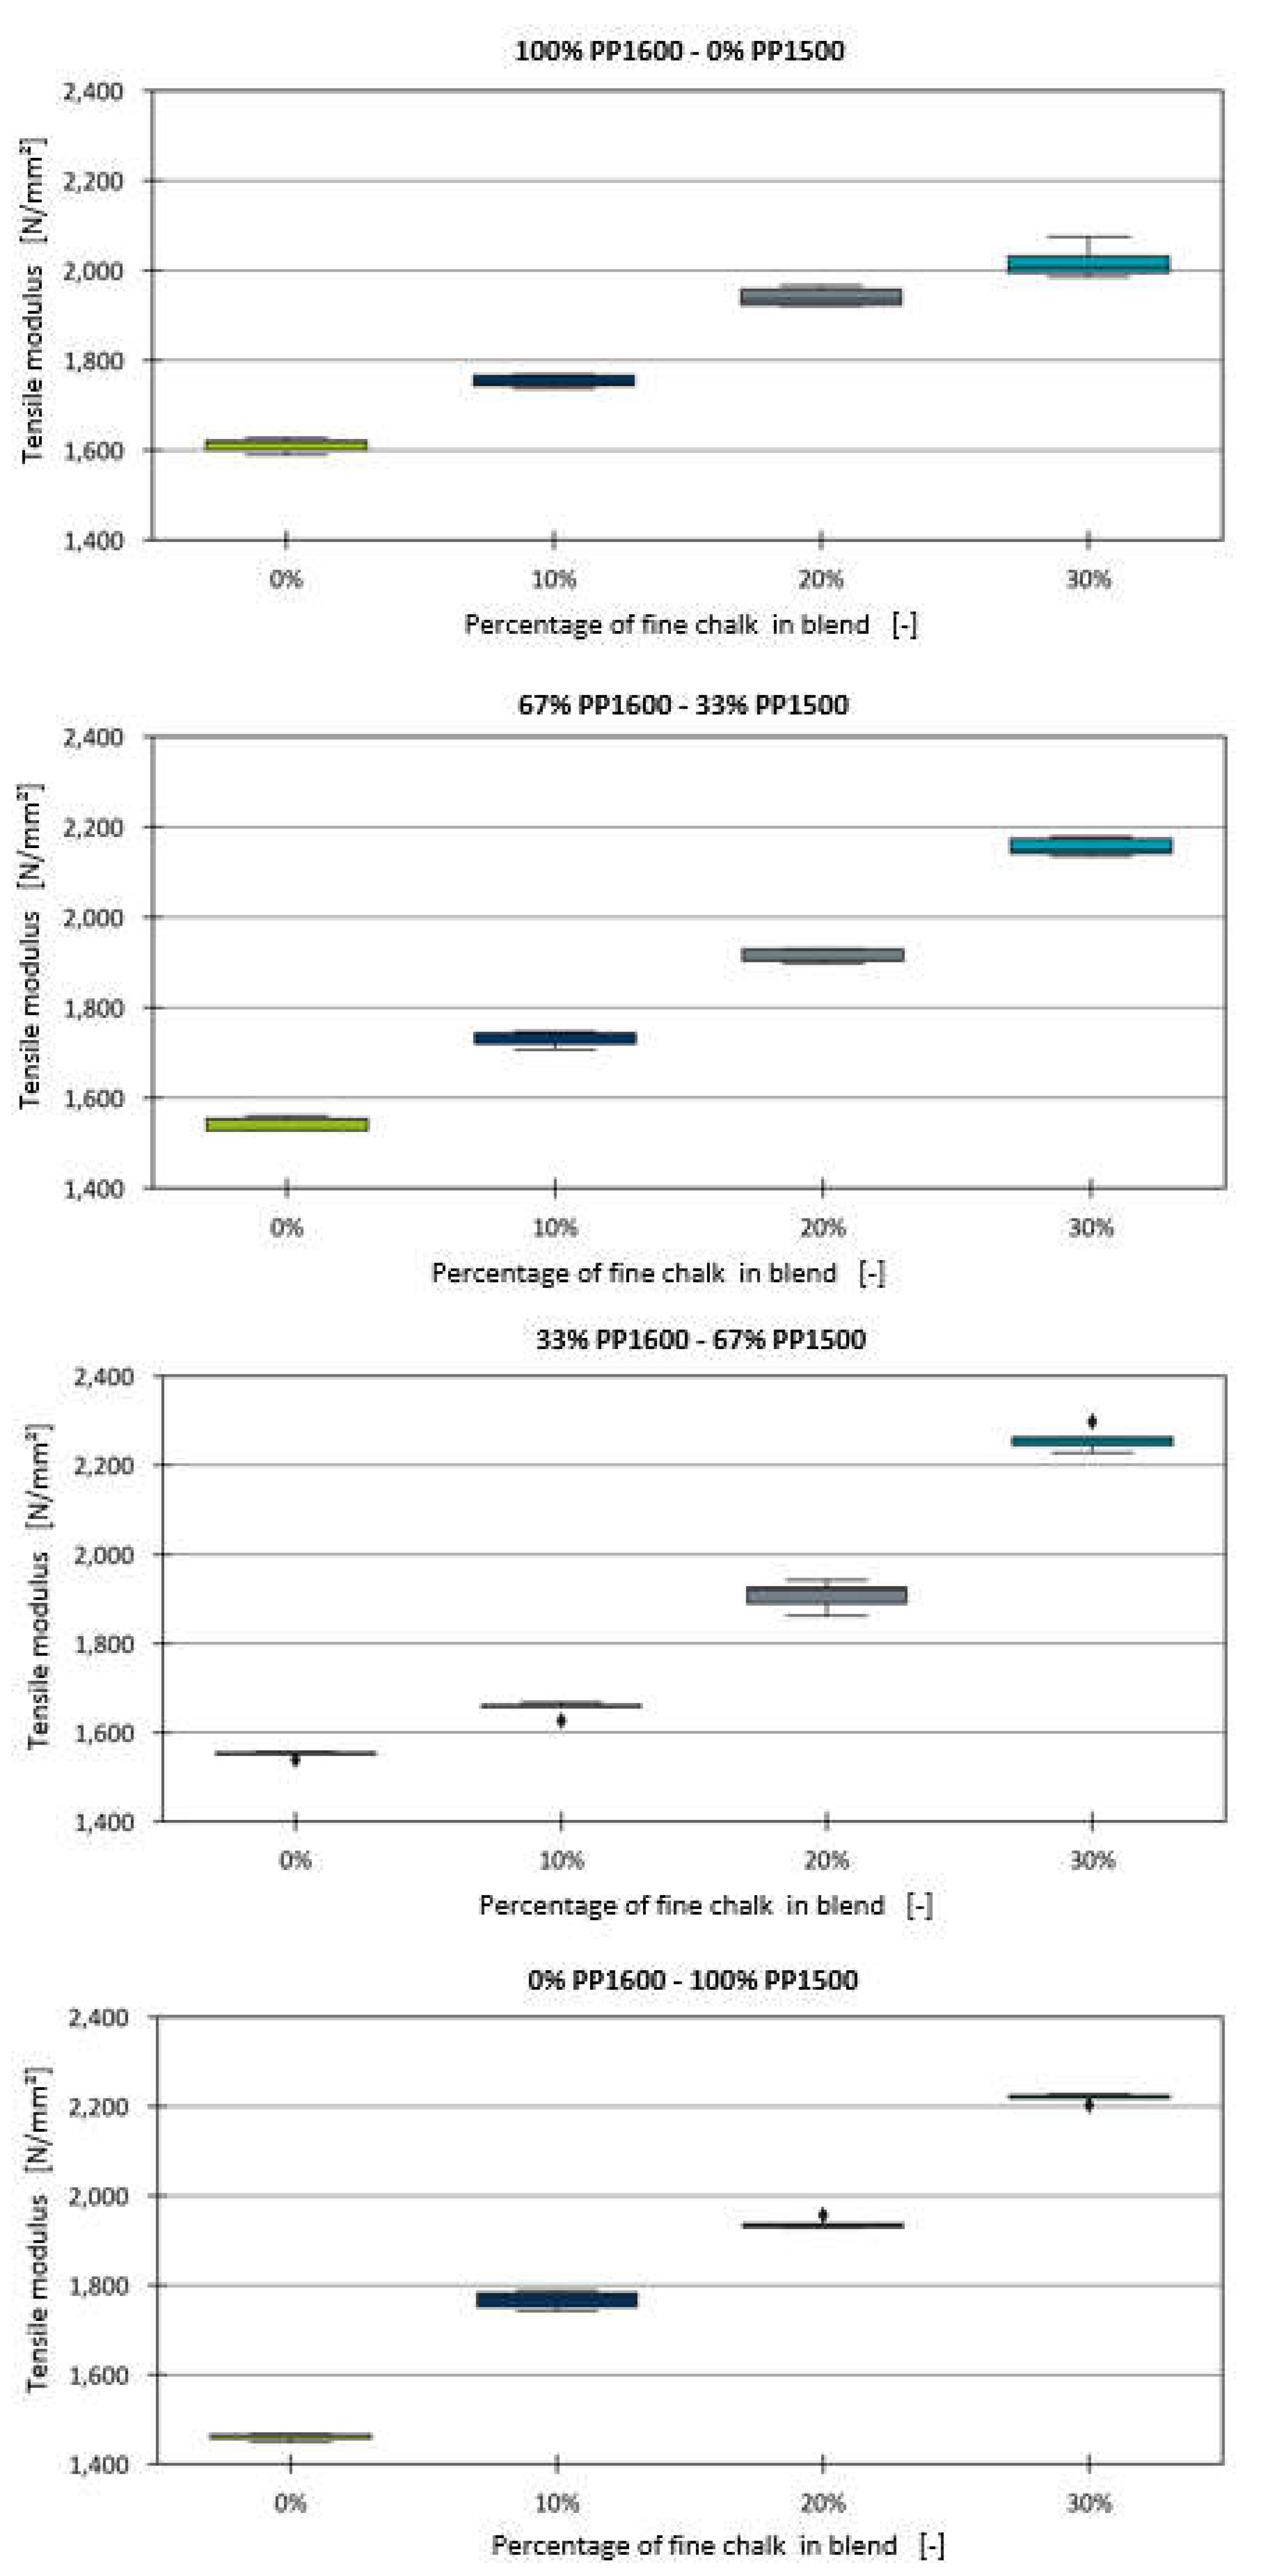
Figure 4.
Linear models for the effect of fine chalk fitted for all four blends.
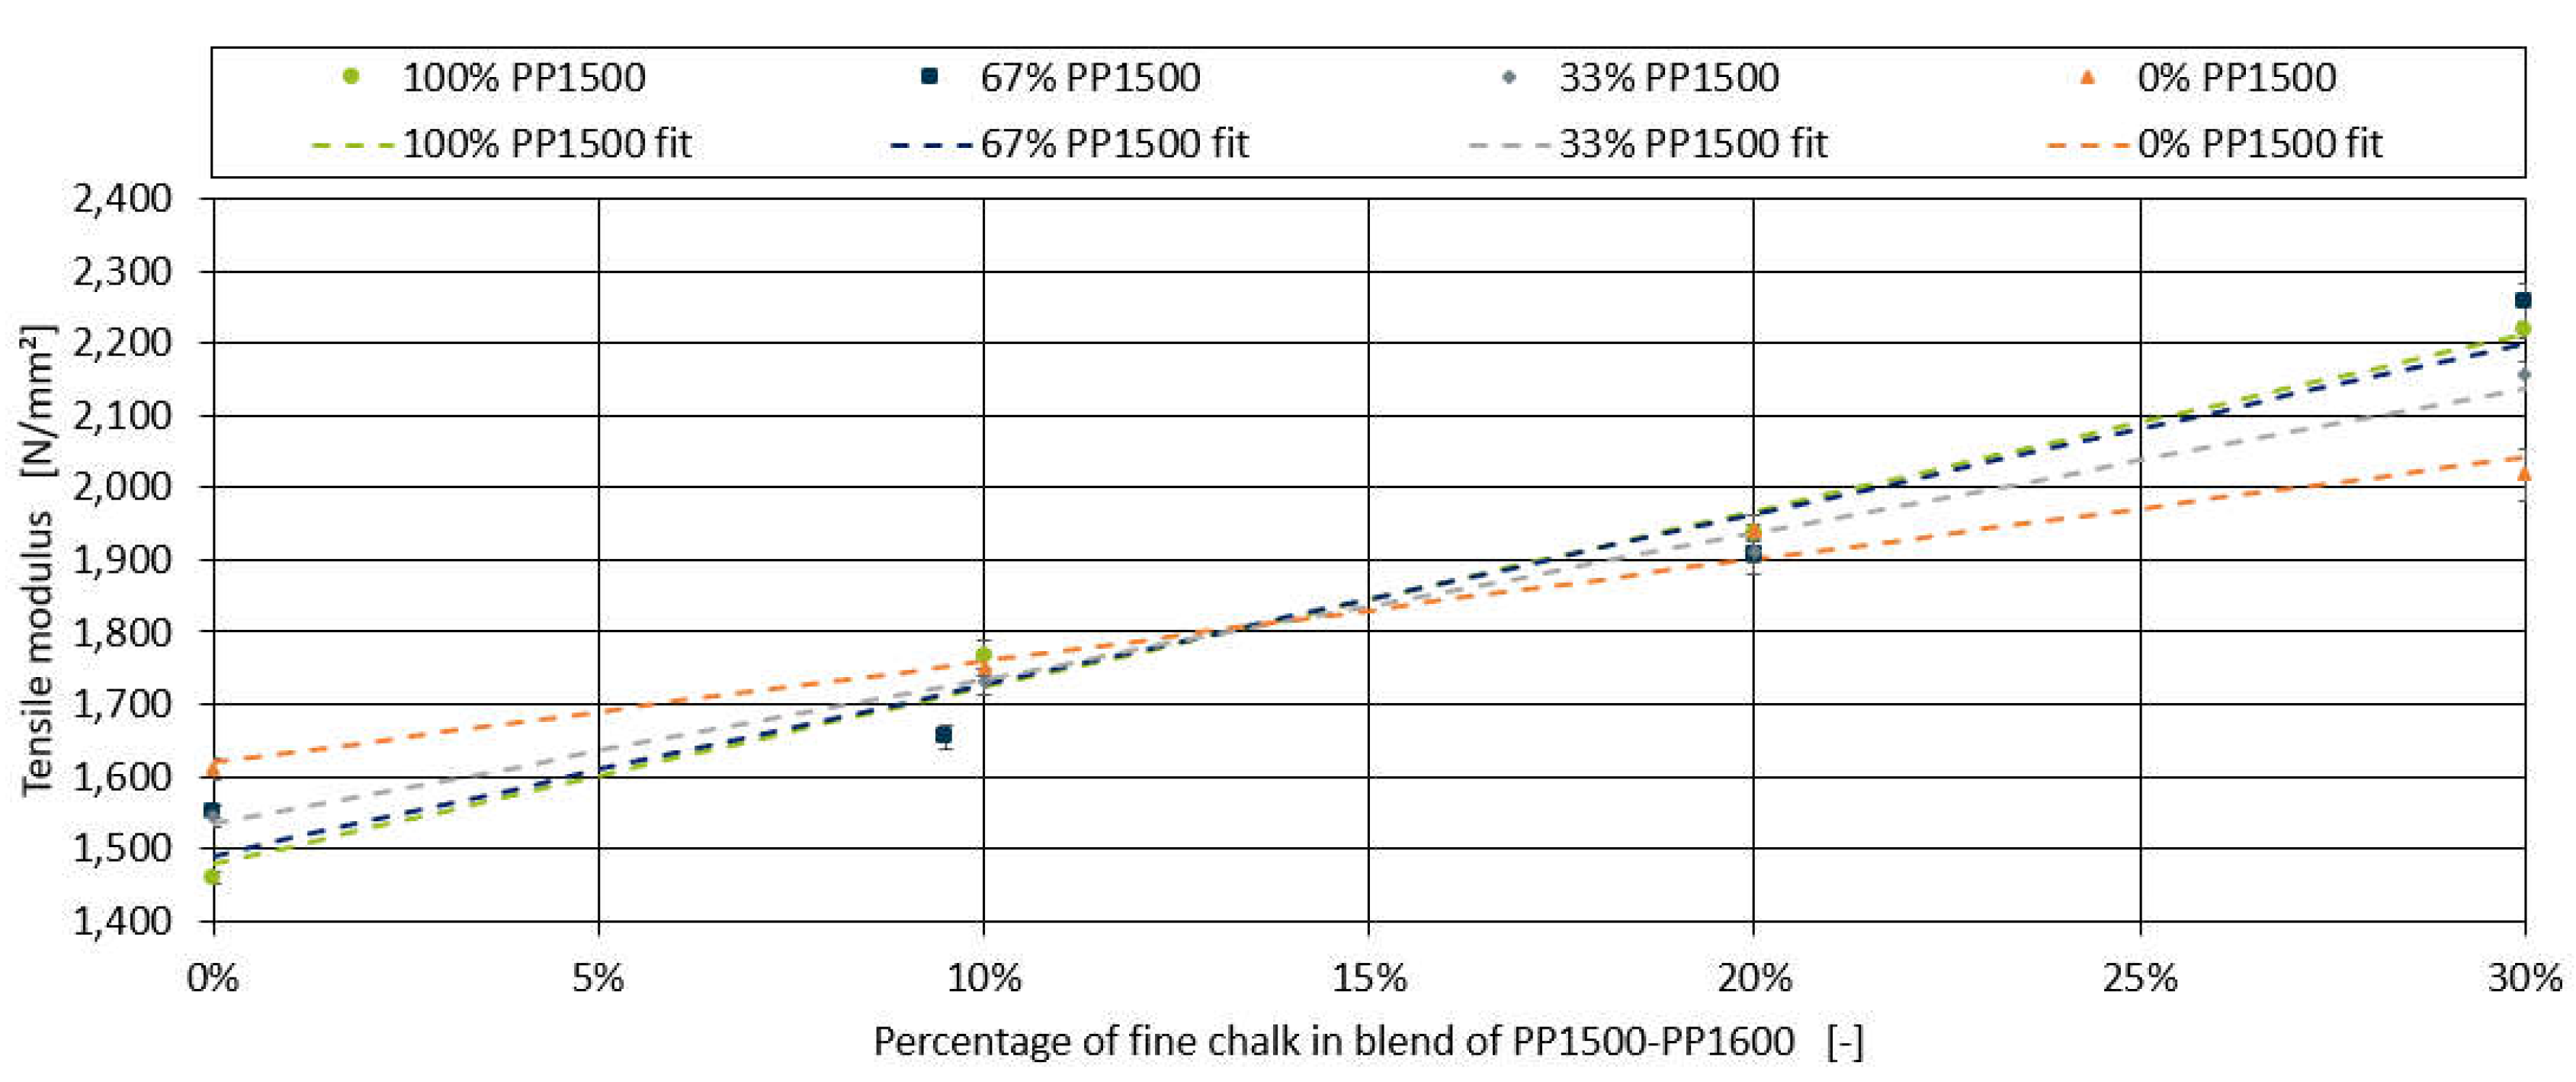
Figure 5.
Relationship between the slope of the linear models and.
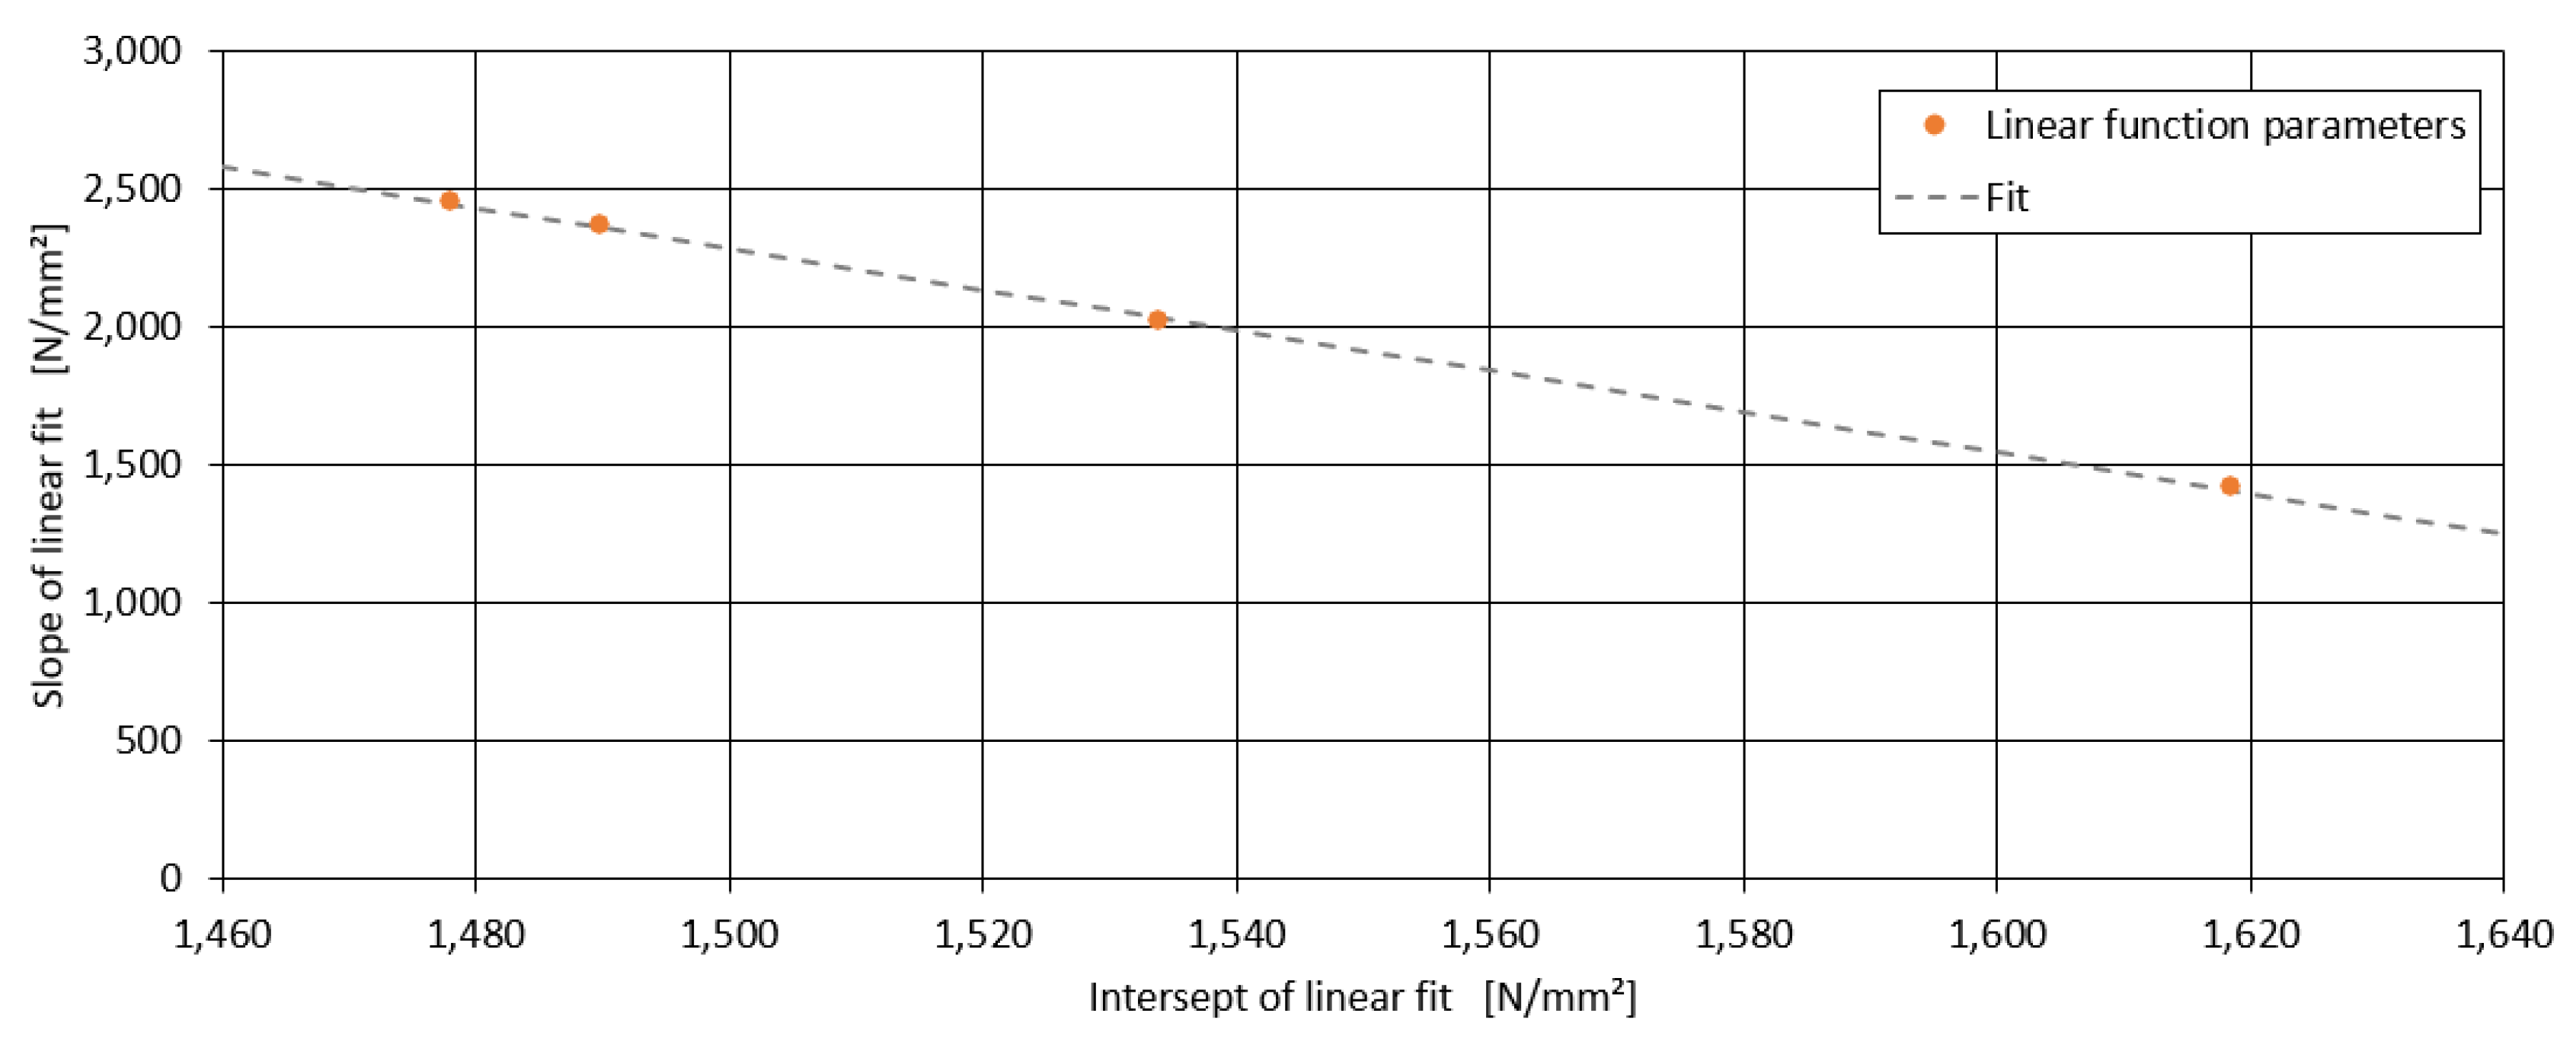
Figure 6.
Boxplot diagrams of the tensile moduli of the binary blends with impact strength modifier.
Figure 6.
Boxplot diagrams of the tensile moduli of the binary blends with impact strength modifier.
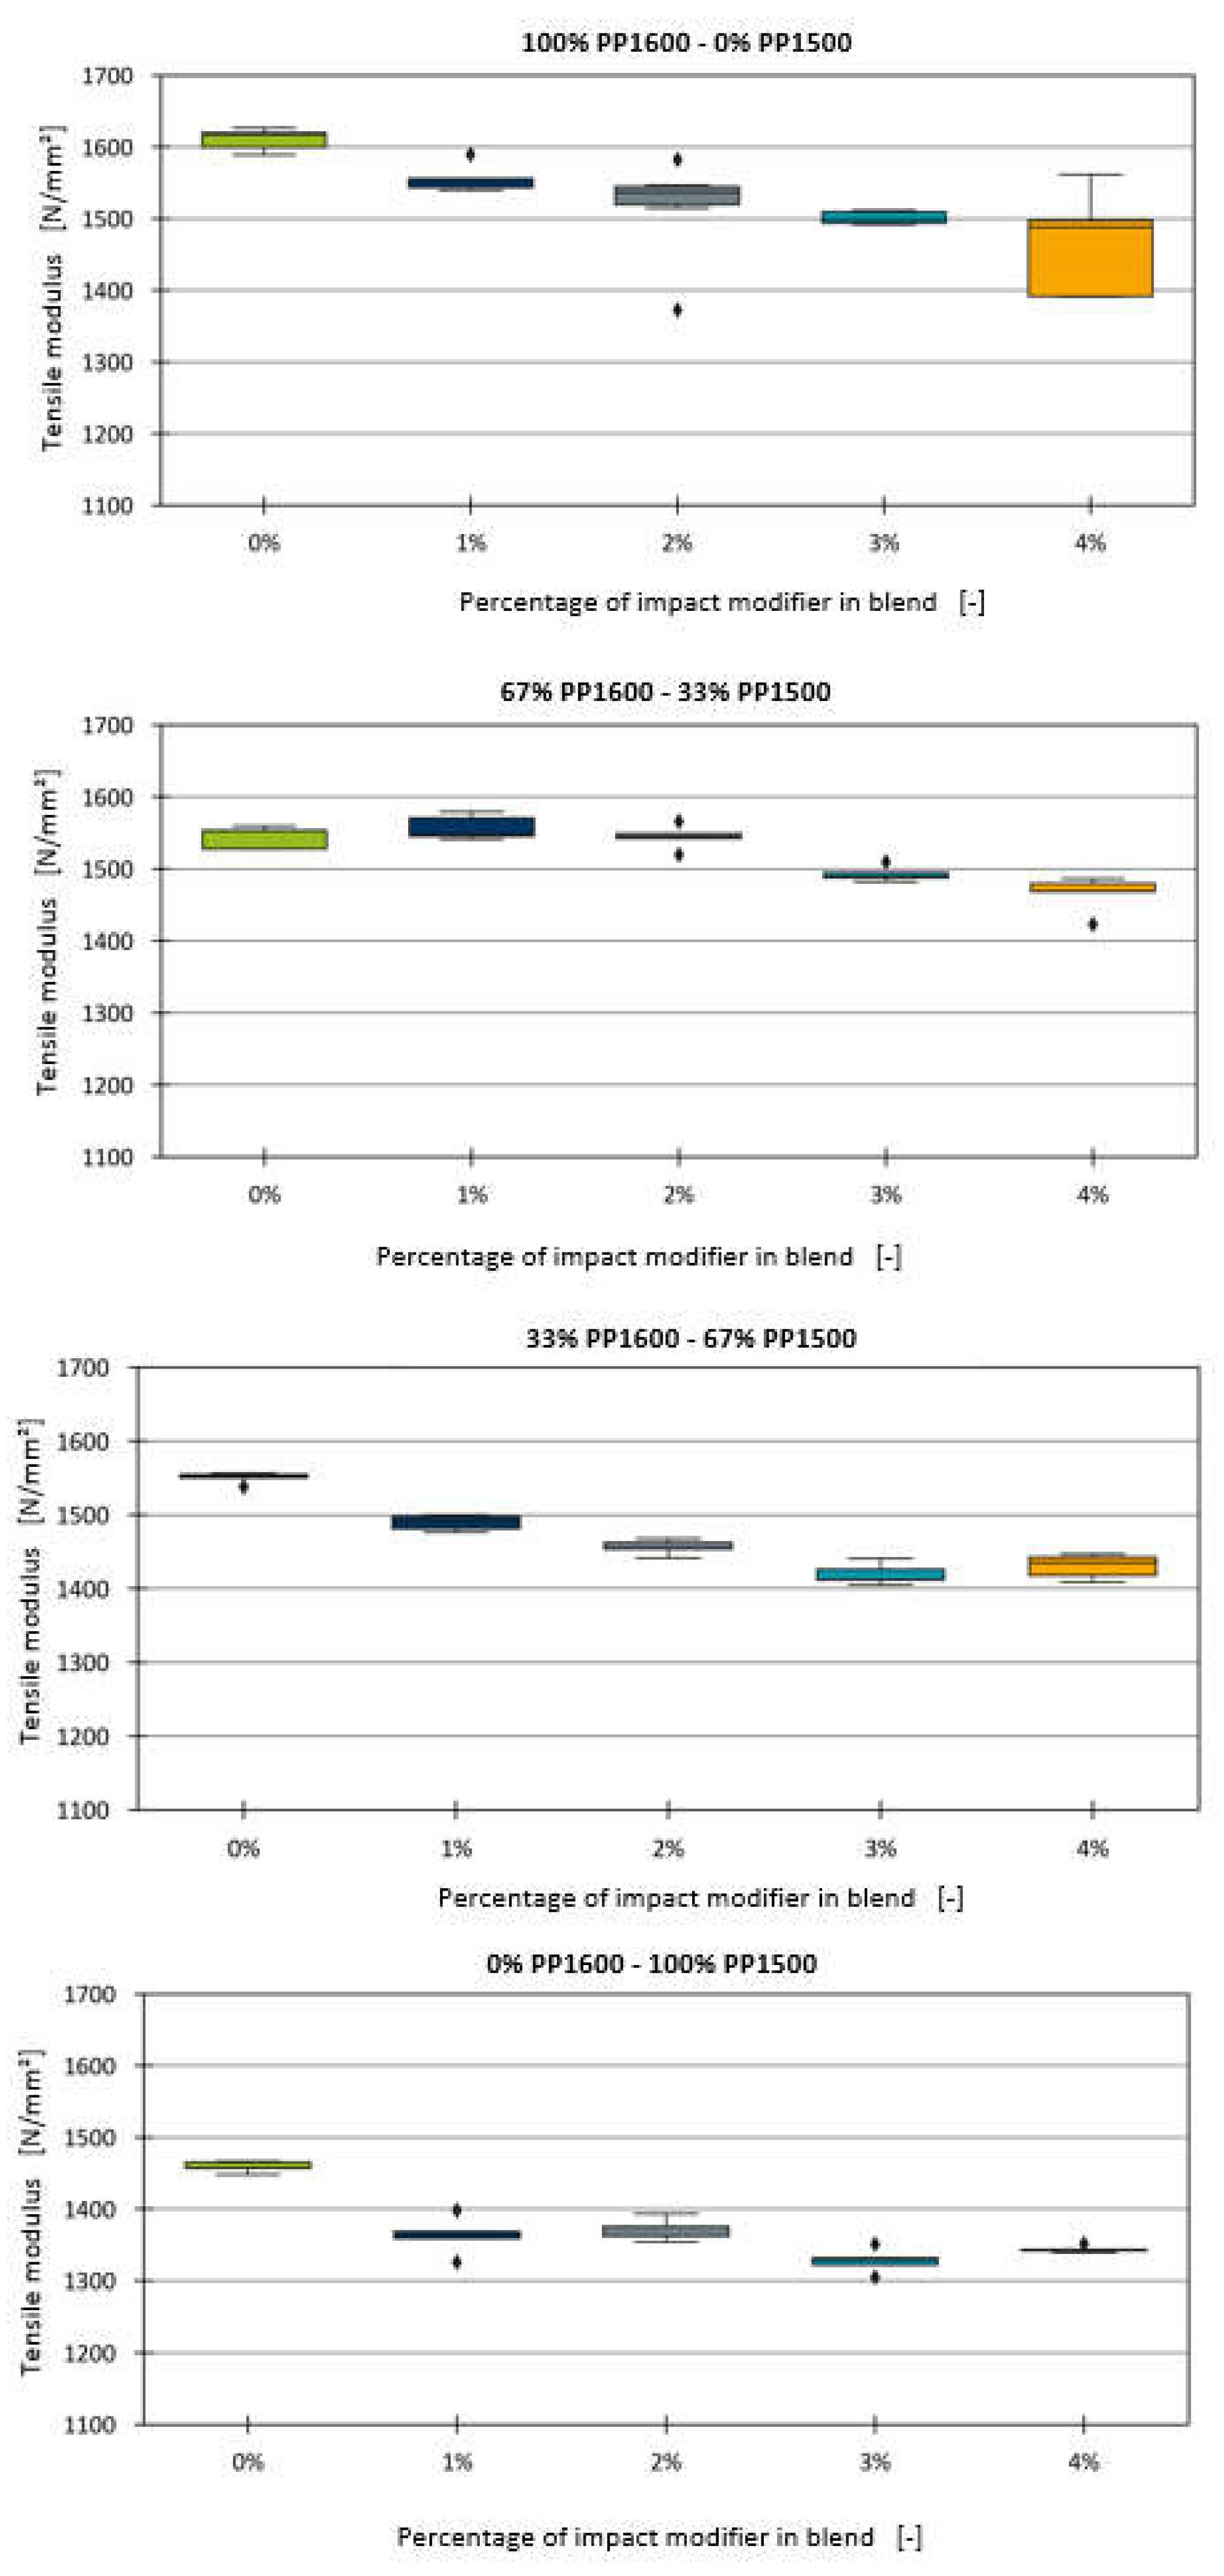
Figure 7.
Linear models for the effect of impact strength modifier fitted for all four blends.
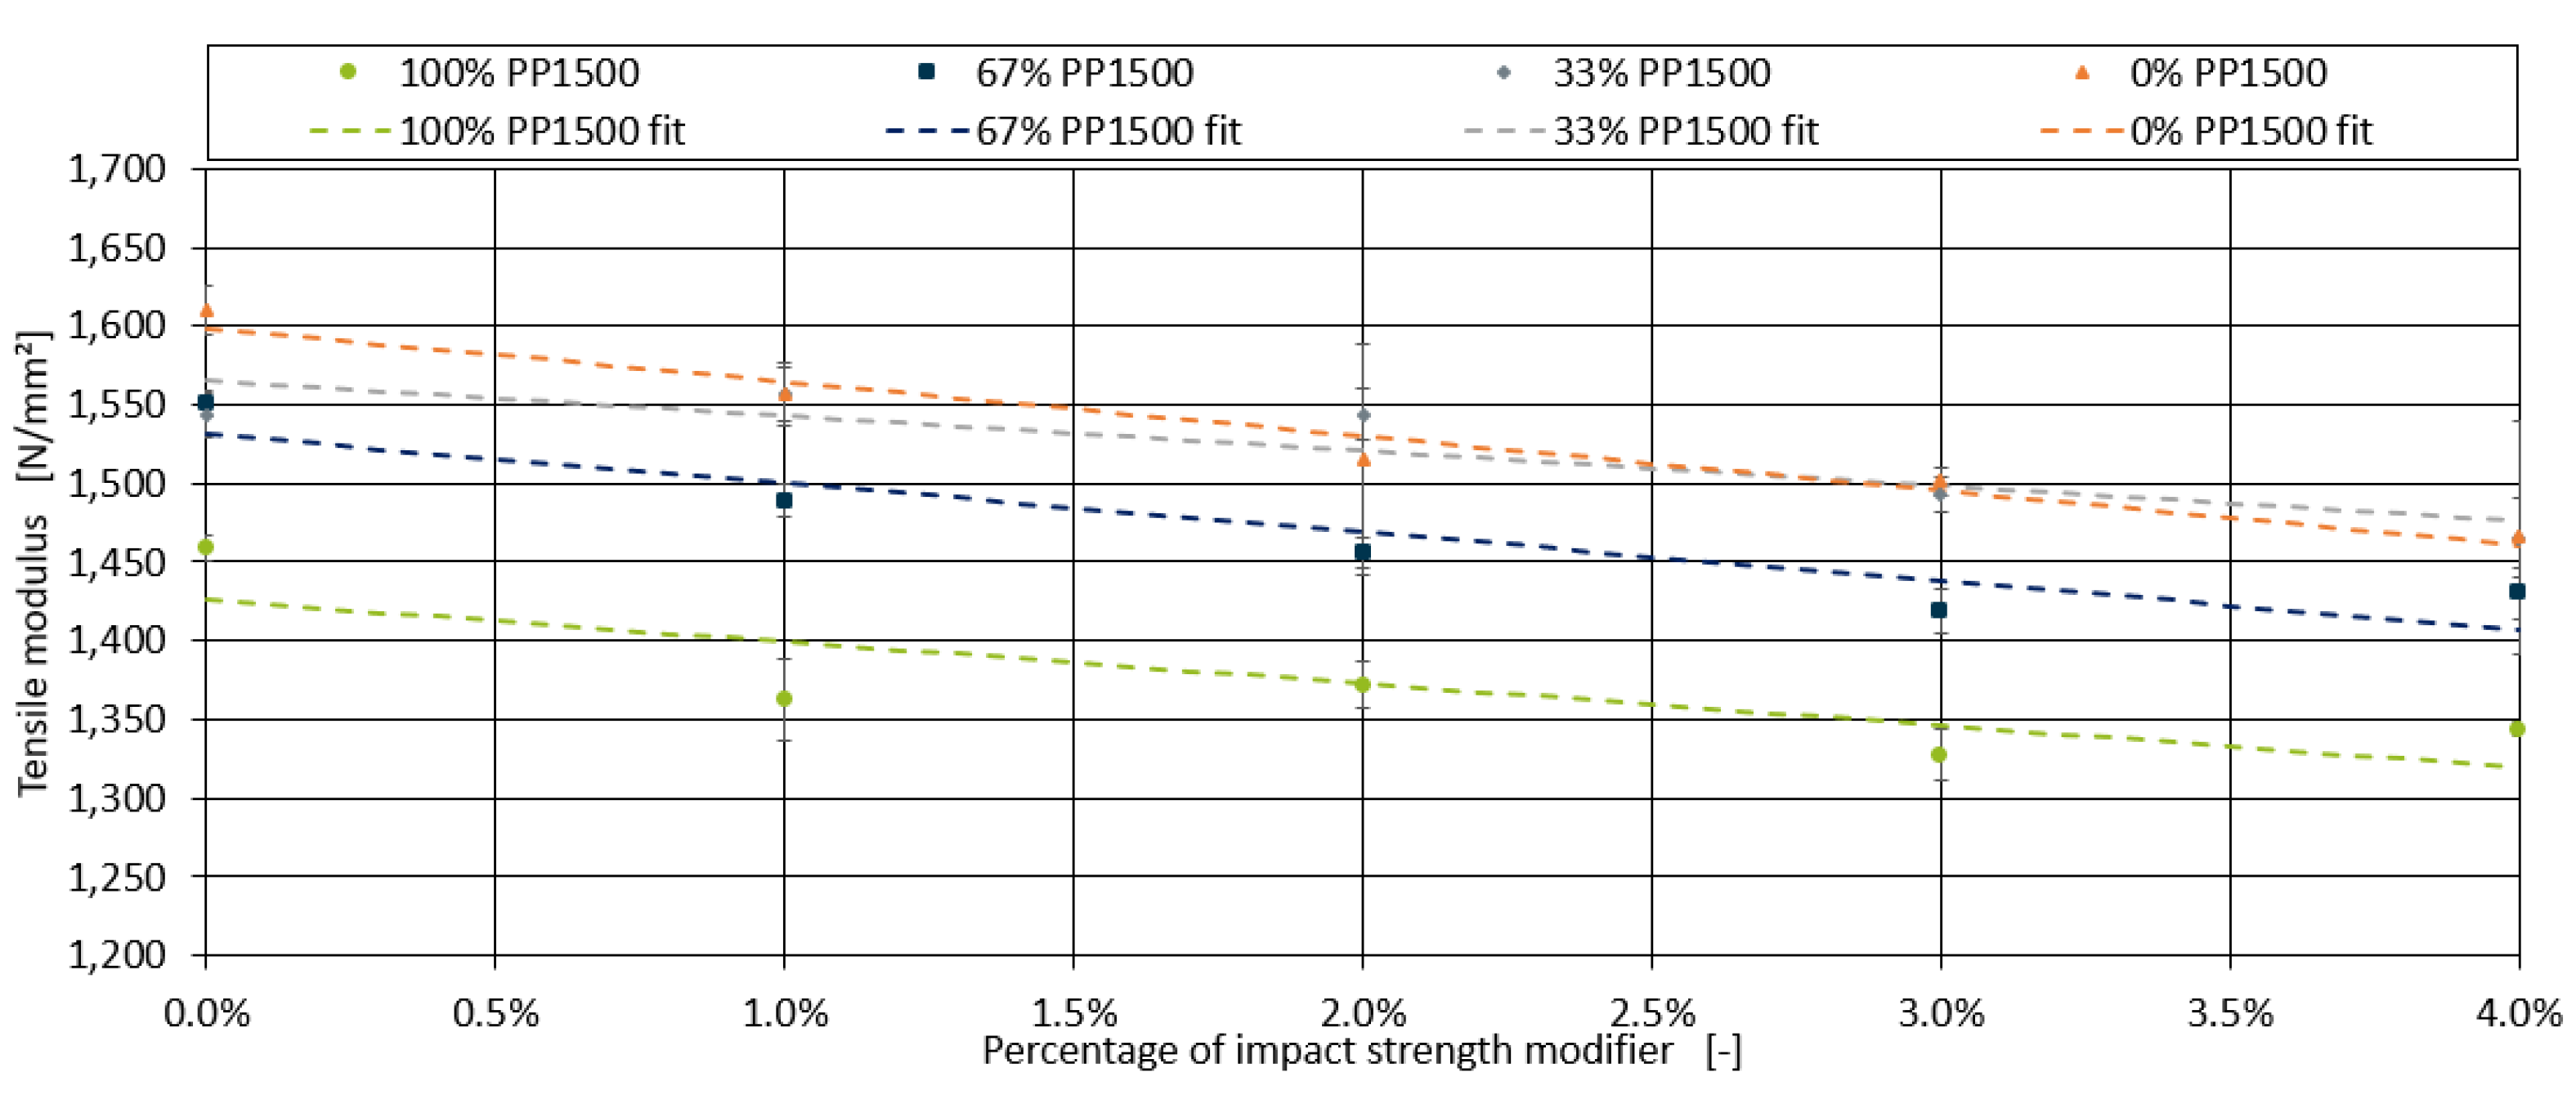
Figure 8.
Relationship between the slope of the linear models and for the impact strength modifier.
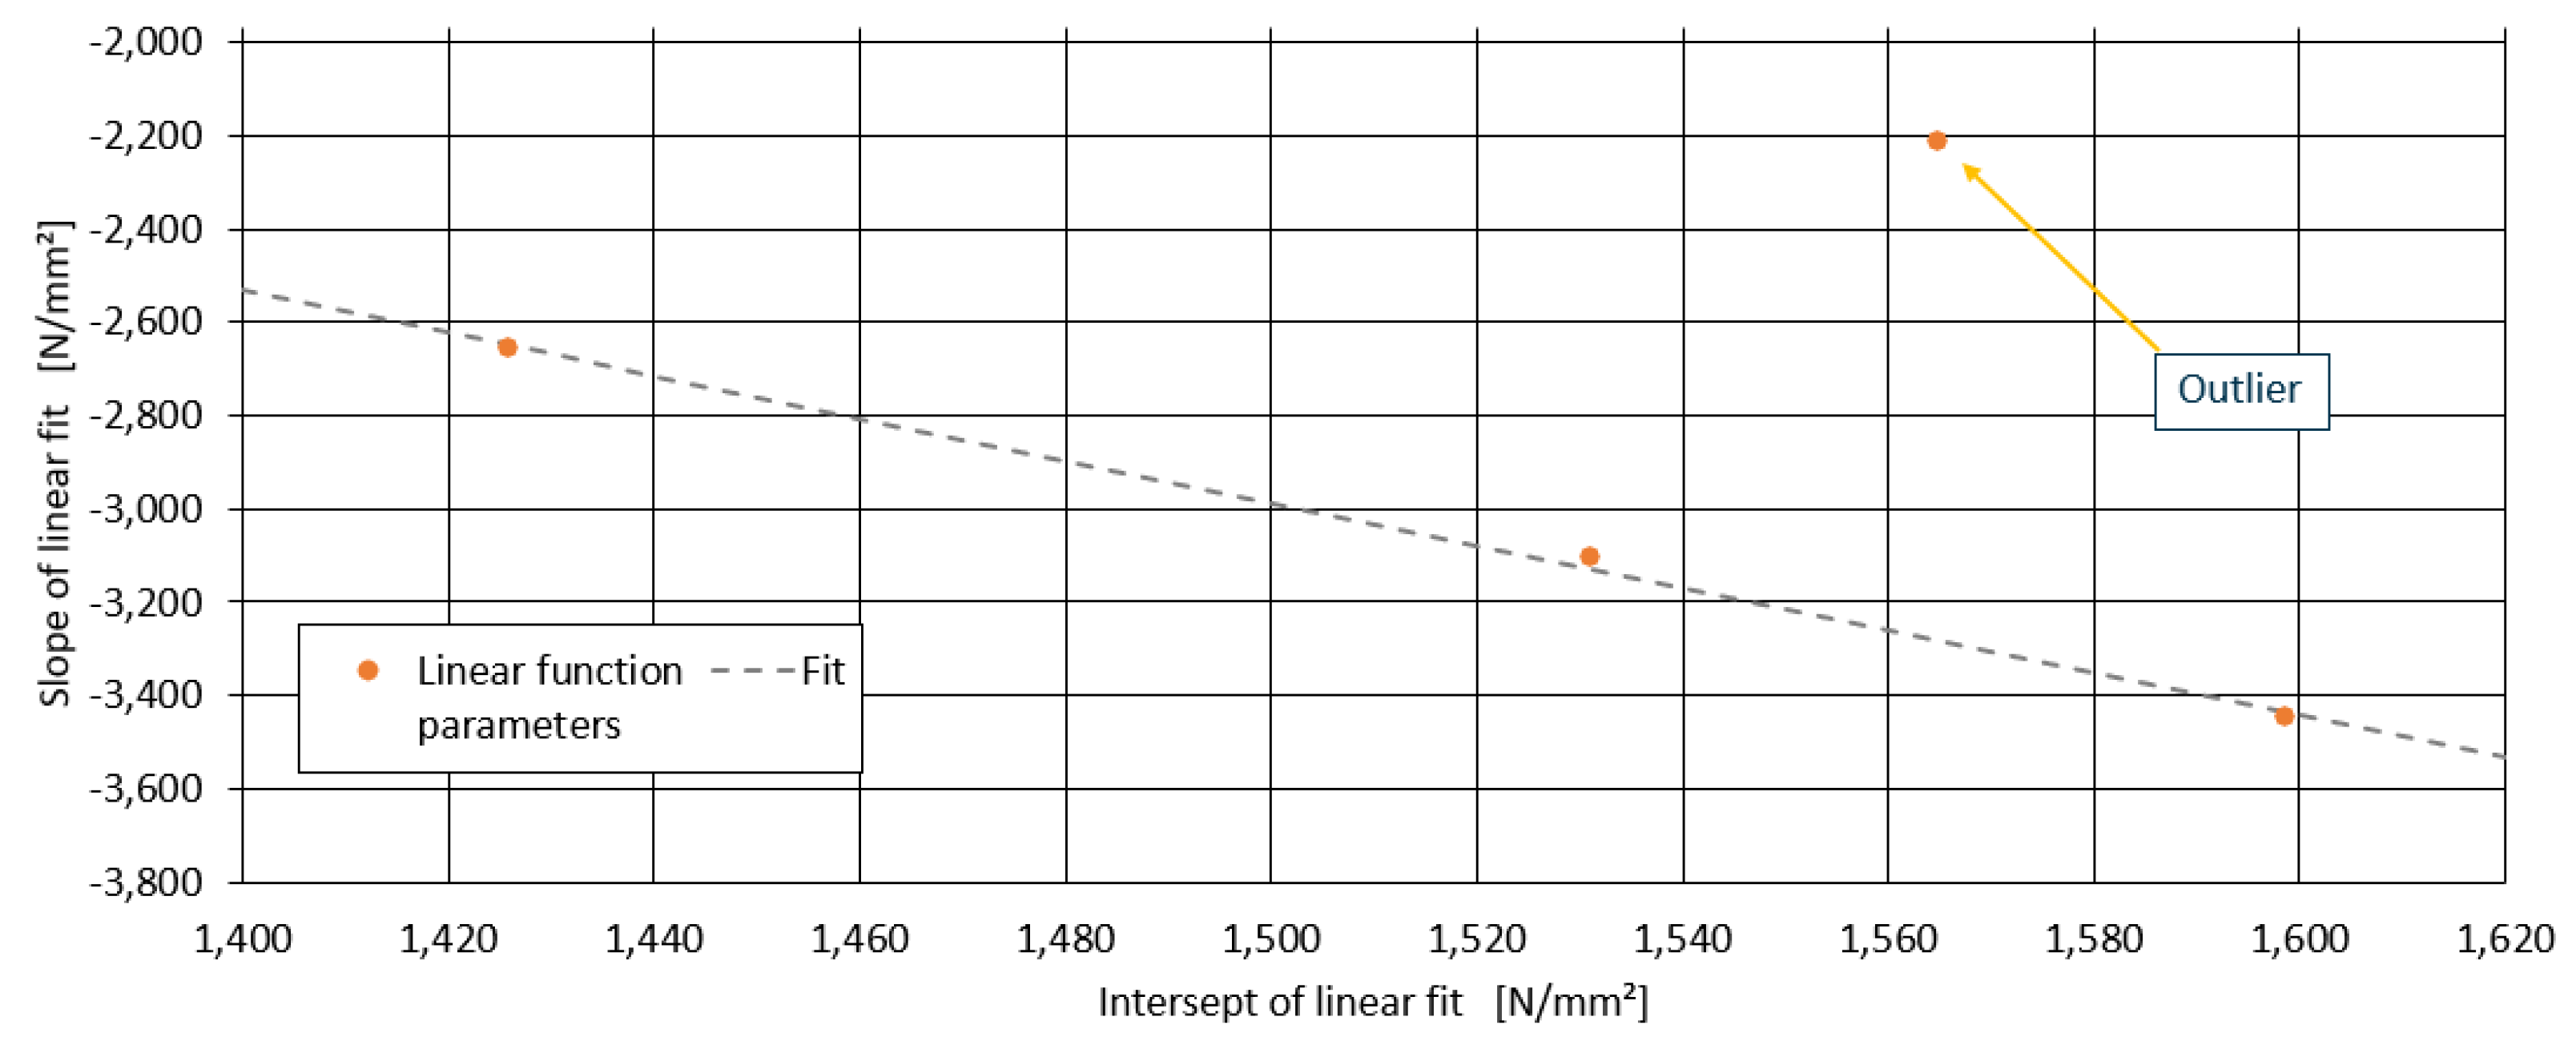
Figure 9.
Boxplot diagrams of the tensile moduli of the binary blends with the peroxide containing additive.
Figure 9.
Boxplot diagrams of the tensile moduli of the binary blends with the peroxide containing additive.
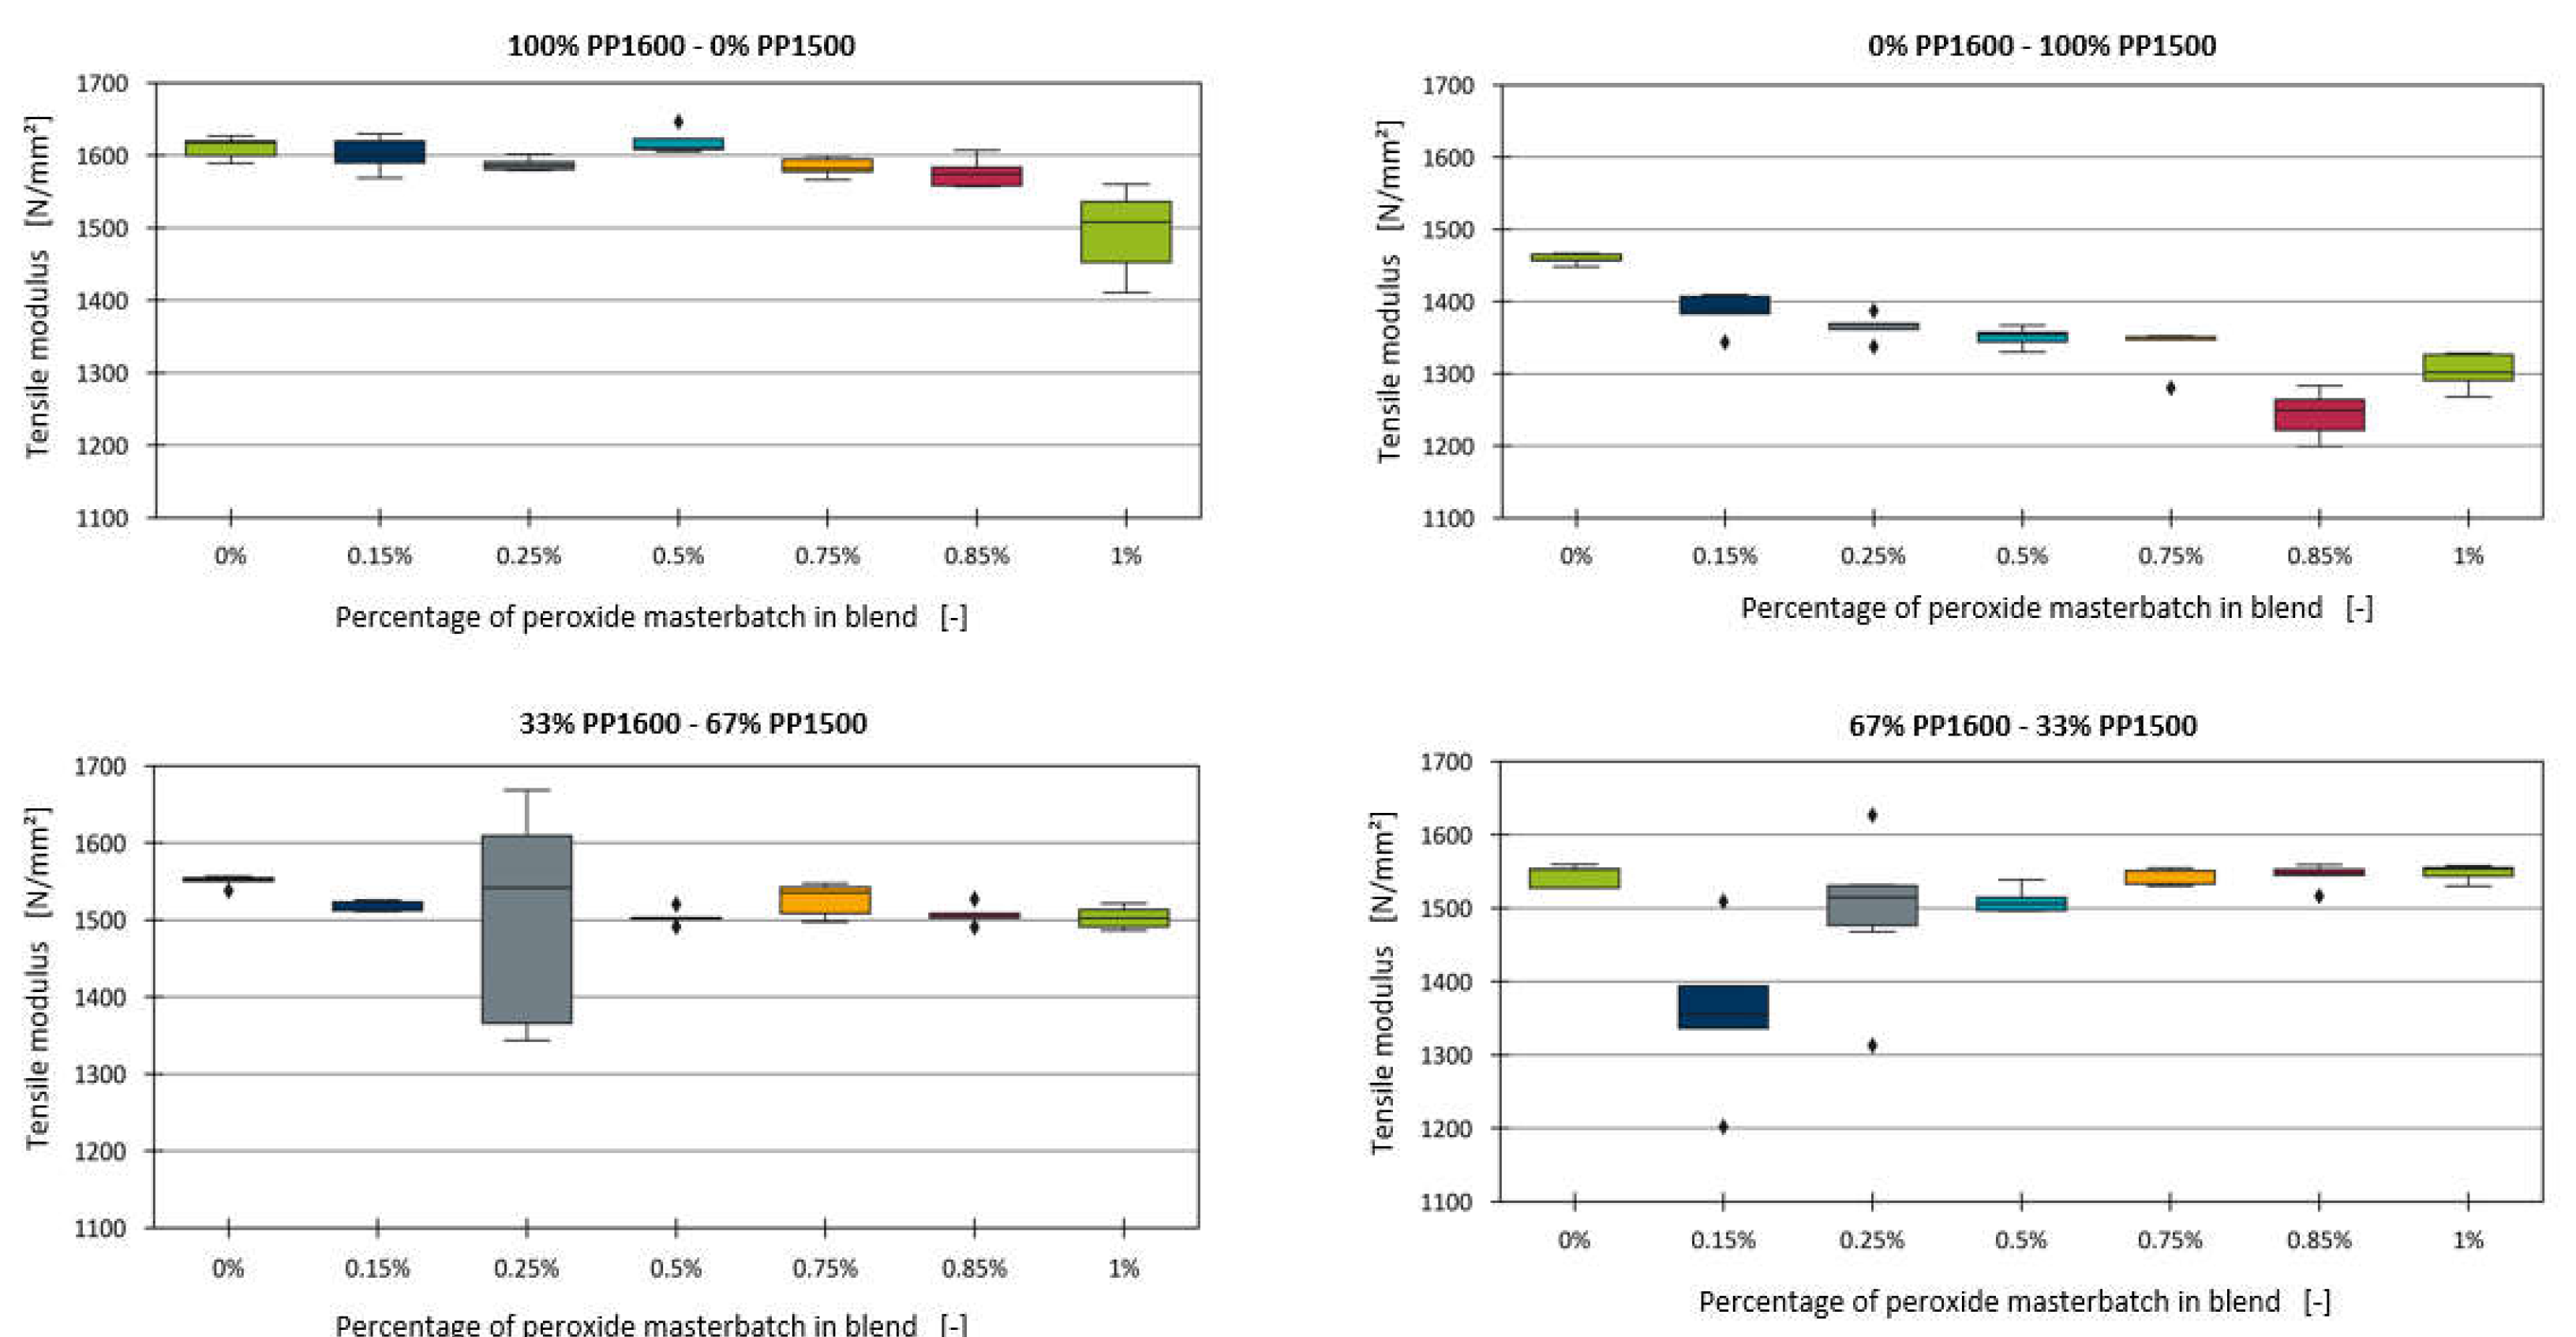
Figure 10.
Stress-strain diagram for the blend of 33% PP1600 and 67% PP1500 with 0.25% perxoide additive.
Figure 10.
Stress-strain diagram for the blend of 33% PP1600 and 67% PP1500 with 0.25% perxoide additive.
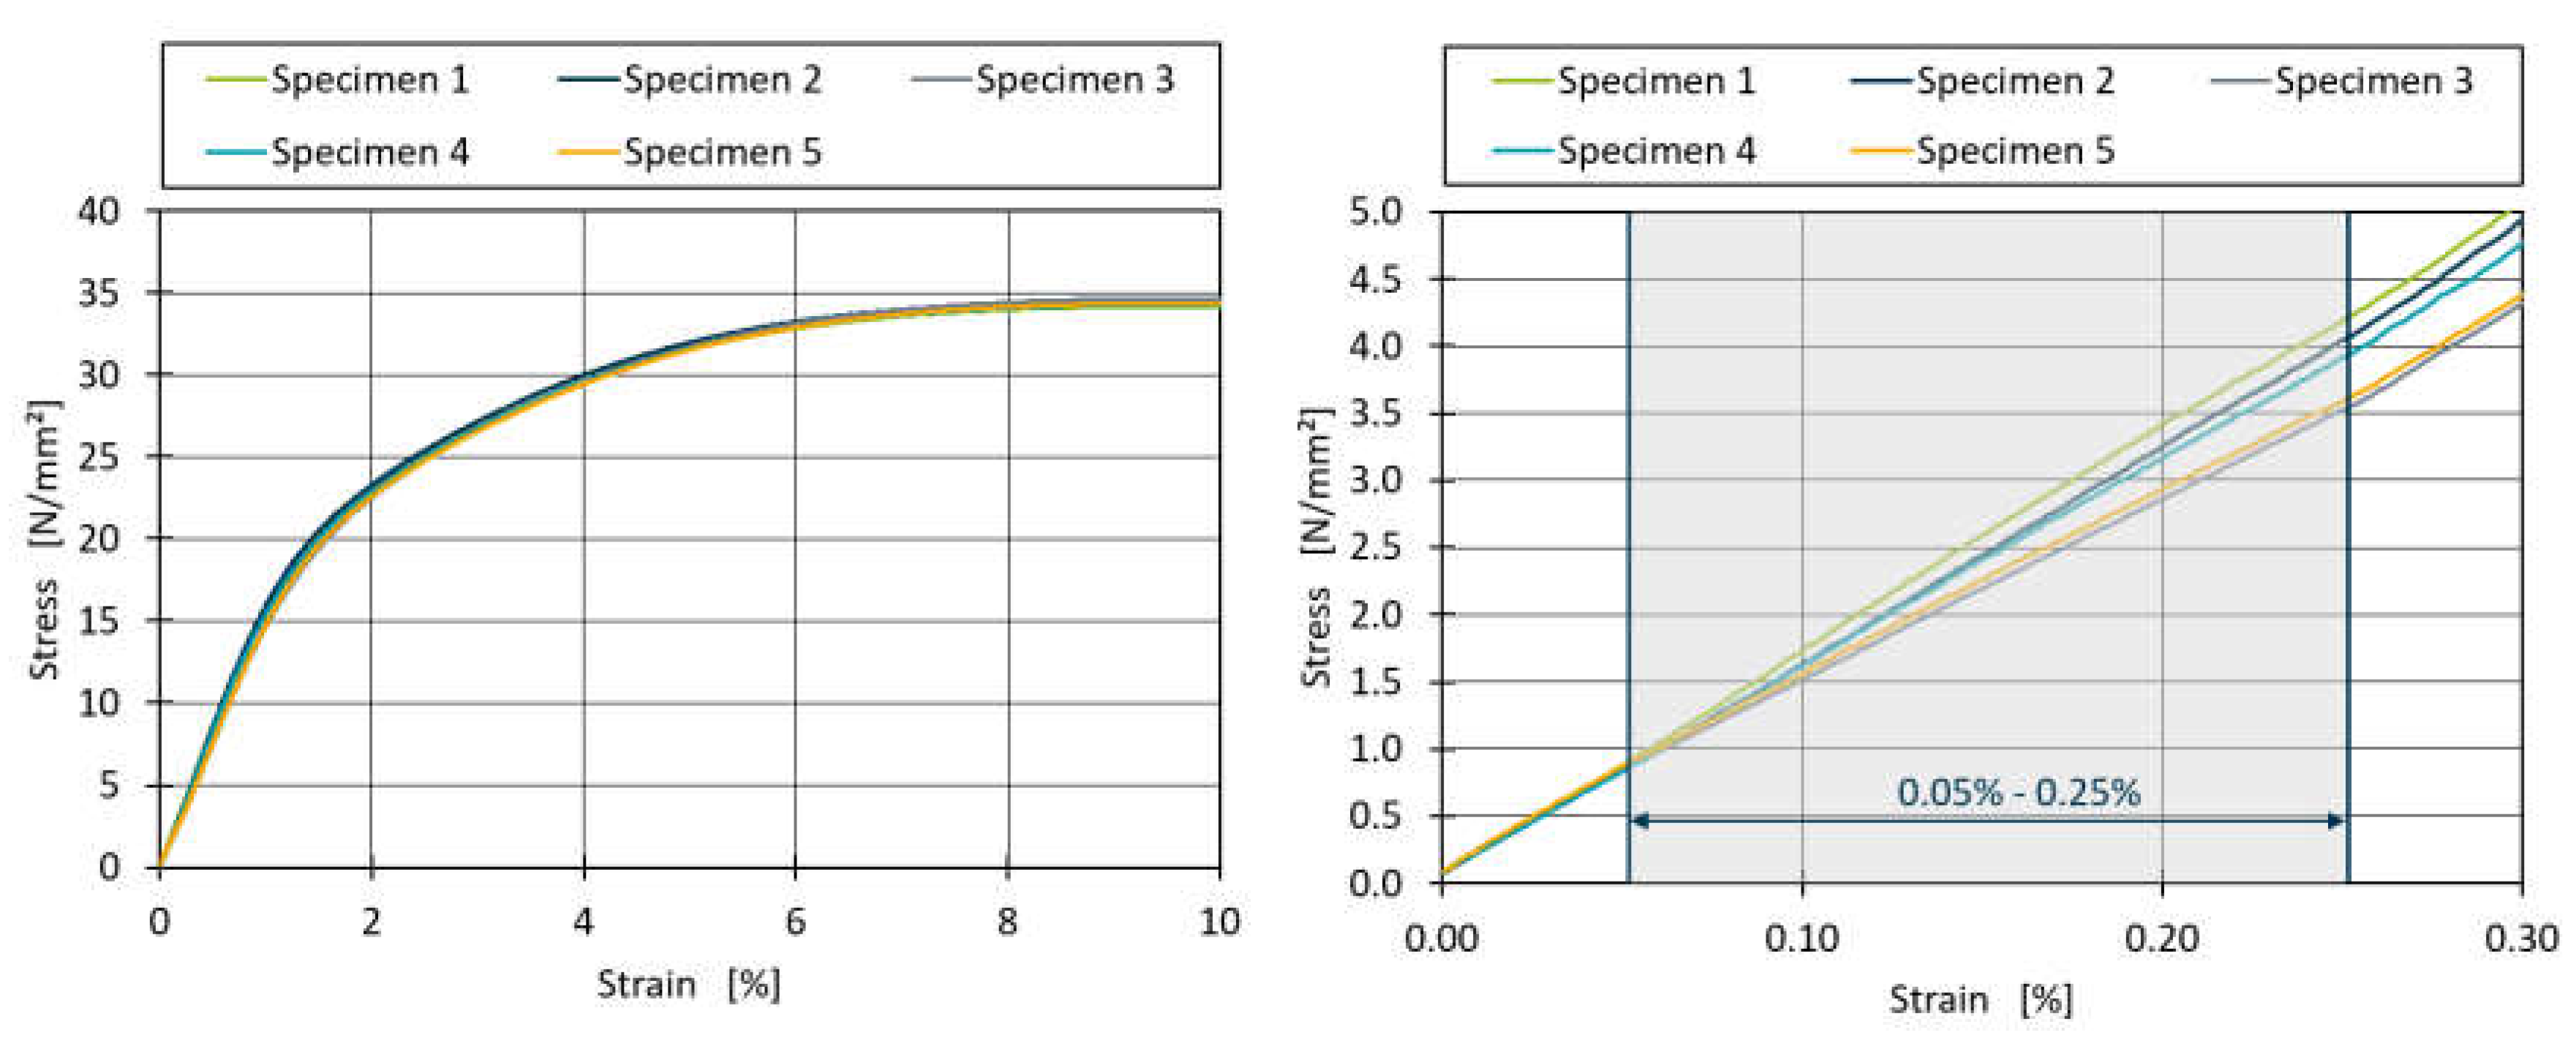
Figure 11.
Relationship between the slope of the linear models and the share of PP1500 in the blend.
Figure 11.
Relationship between the slope of the linear models and the share of PP1500 in the blend.
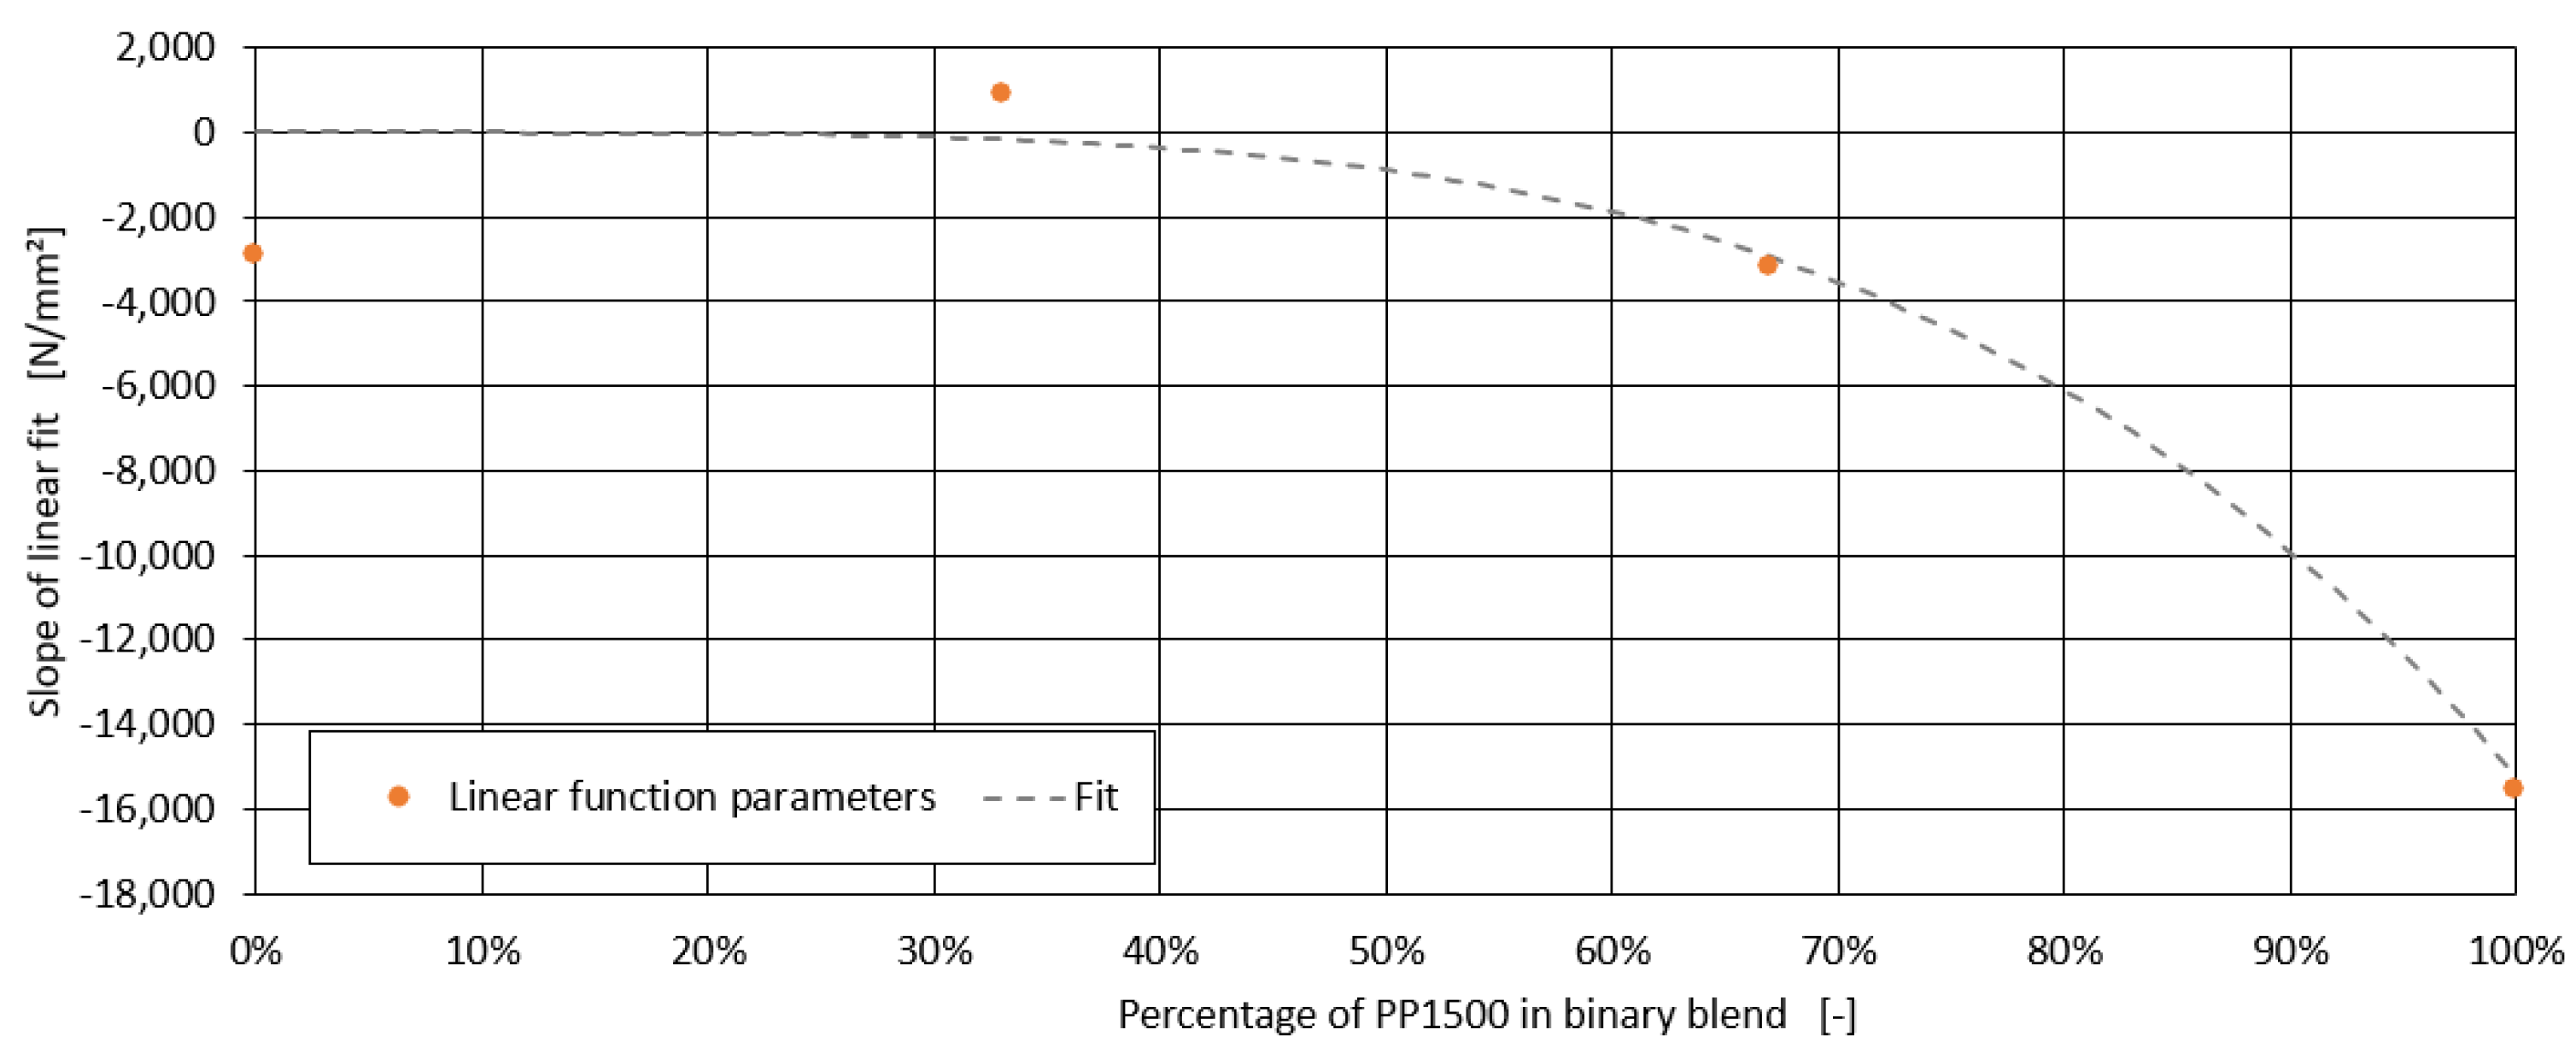
Figure 12.
Linear models for the effect of perocide fitted for all four blends of PP1500-PP1600.
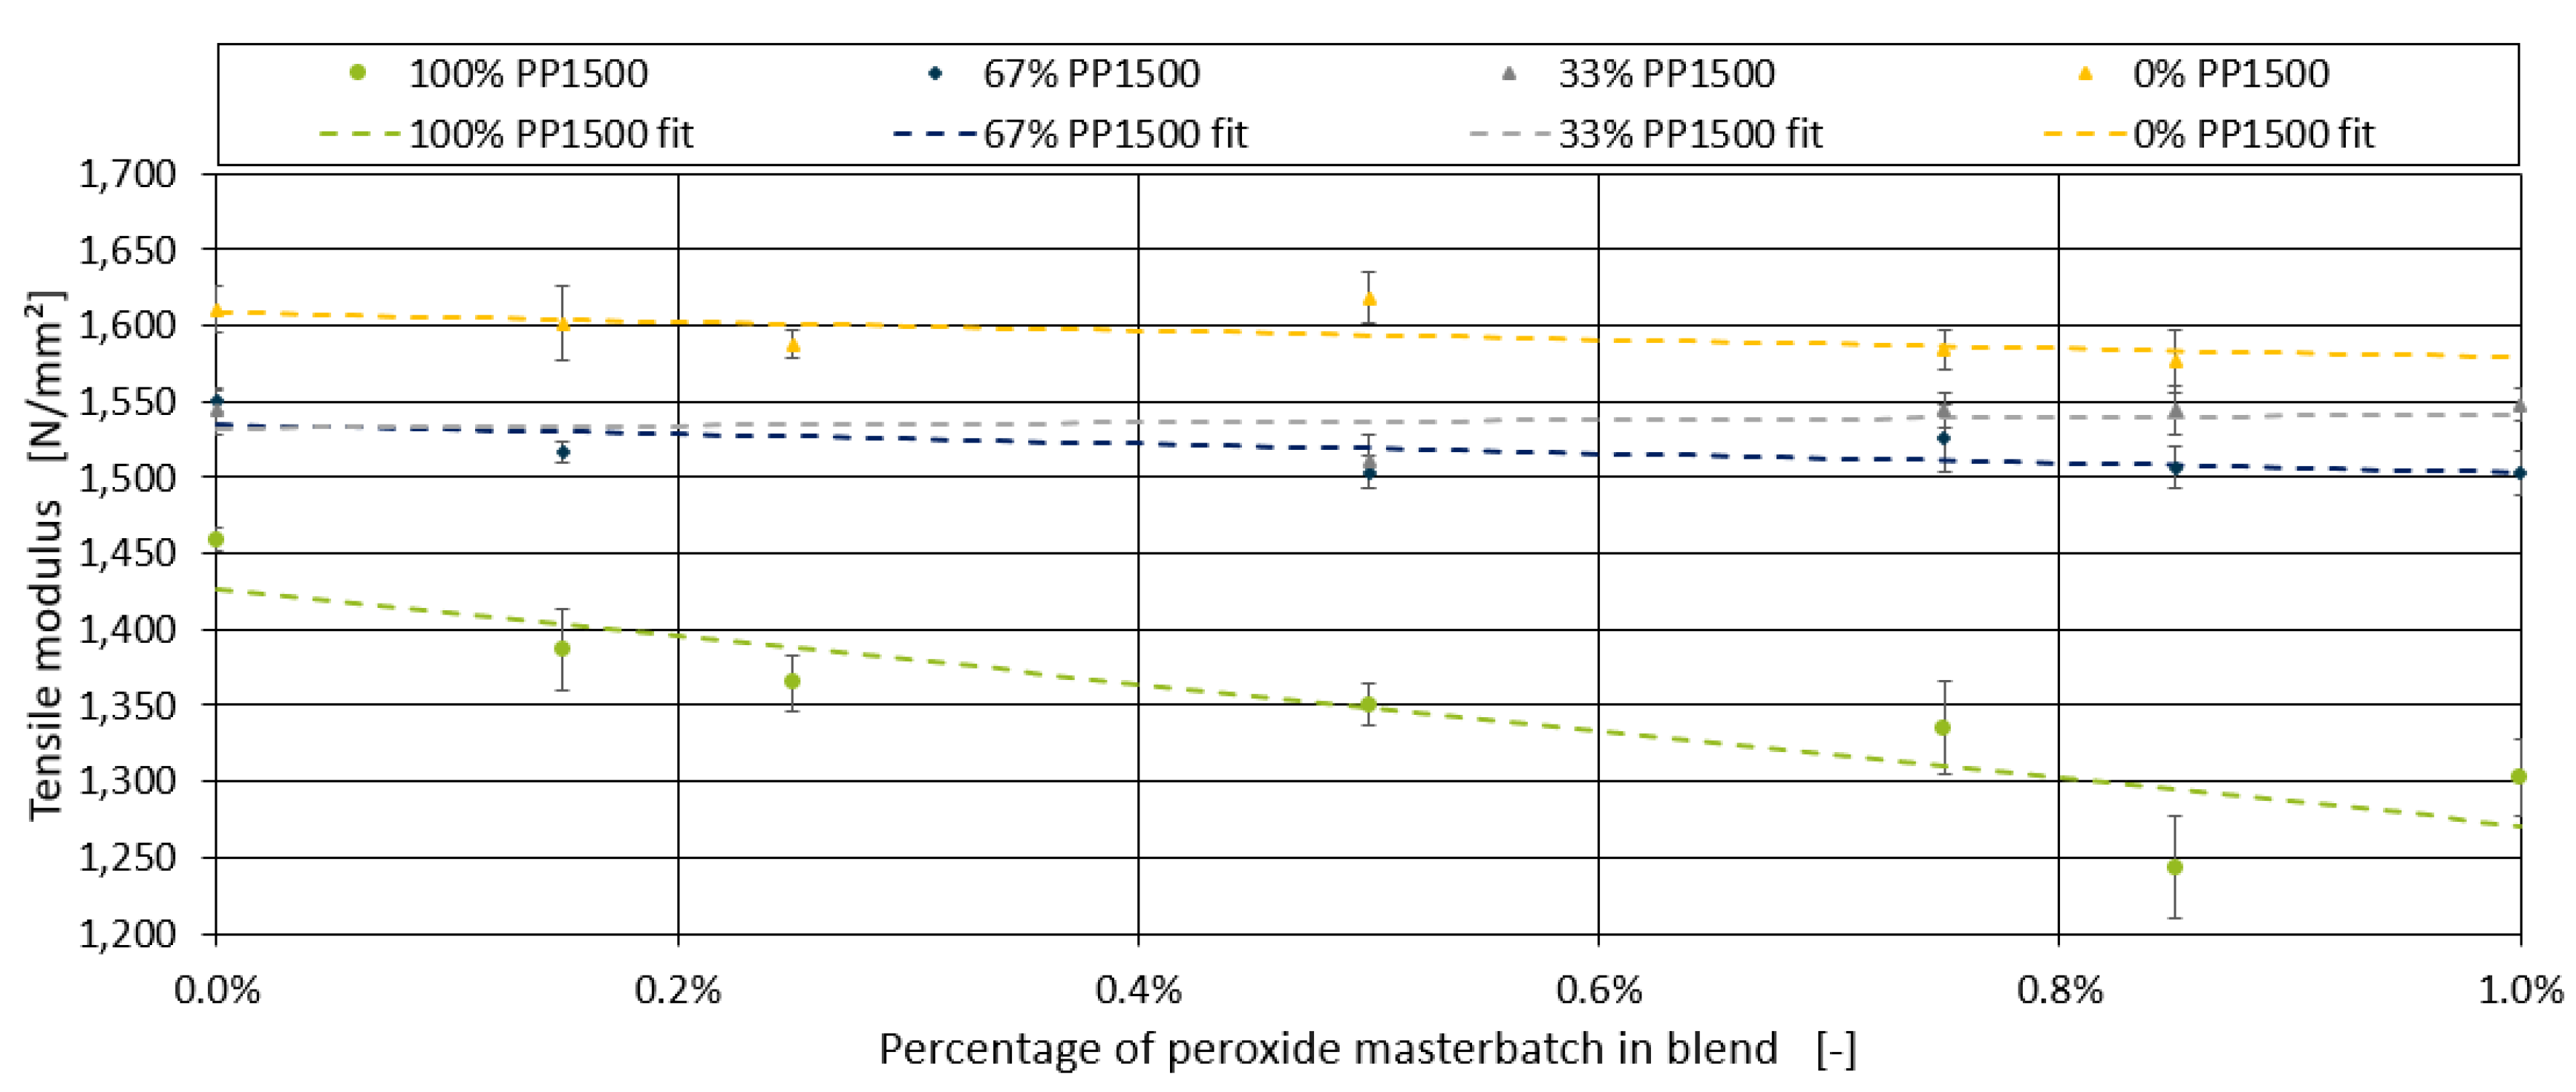
Figure 13.
Model MAE for both the aggregated and ANN model for both datasets and the train and test subsets. The maximum and minimum values of each data set are indicated by the ends of the error bar.
Figure 13.
Model MAE for both the aggregated and ANN model for both datasets and the train and test subsets. The maximum and minimum values of each data set are indicated by the ends of the error bar.
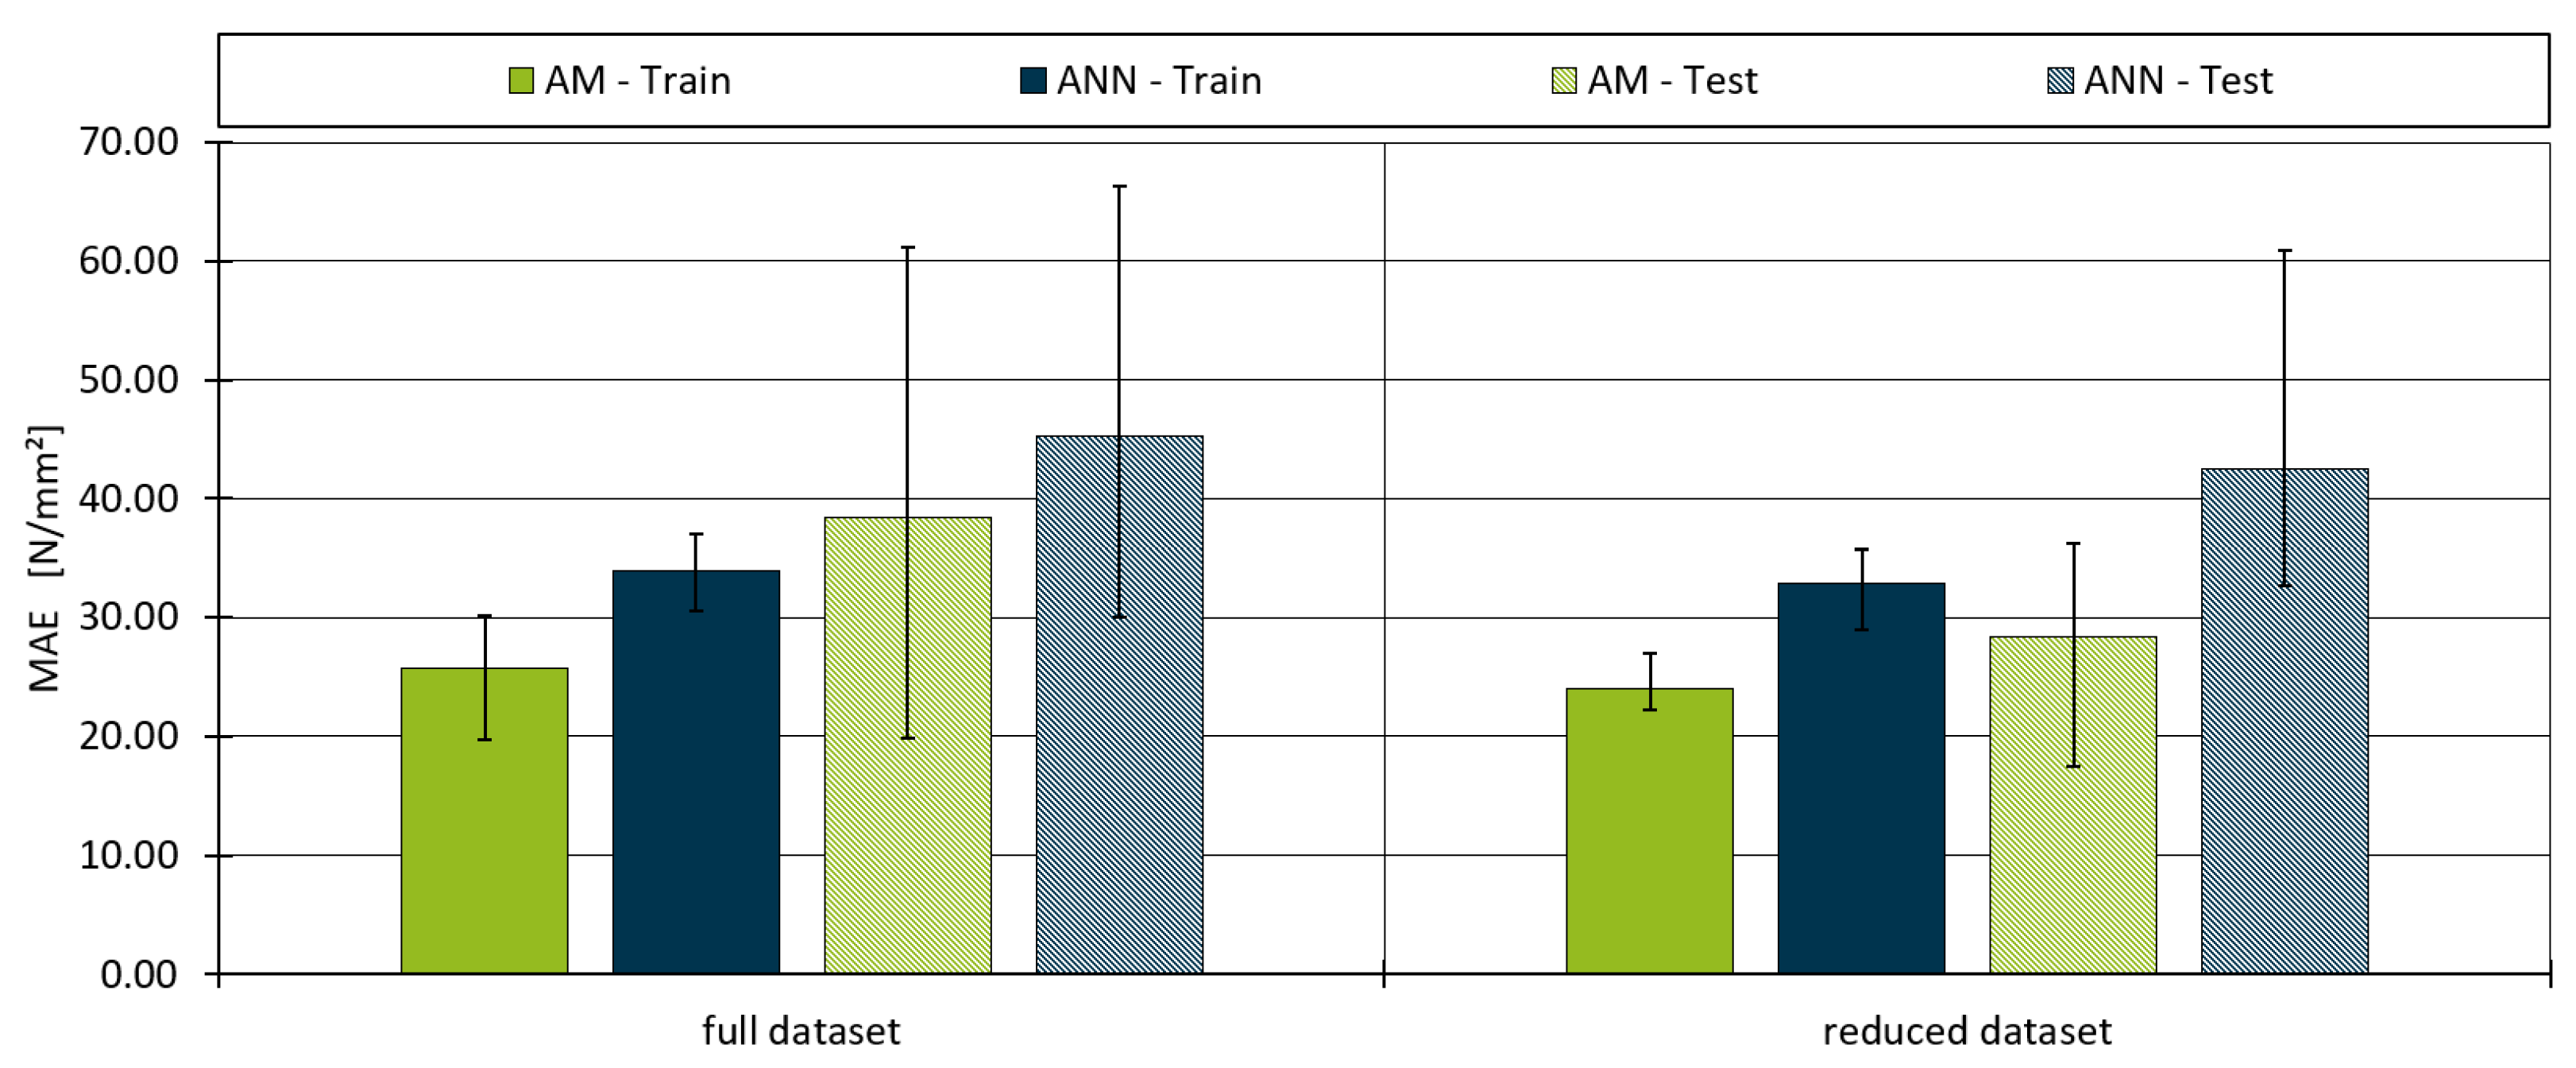
Figure 14.
Model R² for both the aggregated and ANN model for both datasets and the train and test subsets. The maximum and minimum values of each data set are indicated by the ends of the error bar.
Figure 14.
Model R² for both the aggregated and ANN model for both datasets and the train and test subsets. The maximum and minimum values of each data set are indicated by the ends of the error bar.

| Designation | Material | MFR [g/10min] | Tensile Modulus [MPa] |
|---|---|---|---|
| PP1500 | 505P | 2.0 | 1,500 |
| PP1450 | HP525J | 3.0 | 1,450 |
| PP1350 | HP501M | 7.5 | 1,350 |
| PP1600 | HP548R | 23.0 | 1,600 |
Table 2.
Blend composition to investigate the blending of virgin materials without any additives or fillers for the blends of PP1350-PP1600 and PP1450-PP1600.
Table 2.
Blend composition to investigate the blending of virgin materials without any additives or fillers for the blends of PP1350-PP1600 and PP1450-PP1600.
| X1 | 0% | 20% | 40% | 60% | 80% | 100% |
|---|---|---|---|---|---|---|
| X2 | 100% | 80% | 60% | 40% | 20% | 0% |
Table 3.
Base composition for the trials including additives and fillers with PP1500-PP1600.
| PP1500 | 0% | 33% | 67% | 100% |
|---|---|---|---|---|
| PP1600 | 100% | 67% | 33% | 0% |
Table 4.
Blend, filler and additive compositions for the blend of PP1500-PP1600.
| Designation | Material | Percentages | |||||||
|---|---|---|---|---|---|---|---|---|---|
| Fine chalk | Omyalite 95 T | 10% | 20% | 30% | |||||
| Rough chalk | Omyalite 50 H | 10% | 20% | ||||||
| Impact Modifier | Engage 8200 | 1% | 2% | 3% | 4% | ||||
| Peroxide Additive | Polyvel CR5P | 0.15% | 0.25% | 0.5% | 0.75% | 0.85% | 1.0% | ||
Table 5.
Constants found for Equation 1 to minimise the squared error between the prediction and the experimental observation.
Table 5.
Constants found for Equation 1 to minimise the squared error between the prediction and the experimental observation.
| Constant | ||||
|---|---|---|---|---|
| Value | 0.38364 | 7.52671 | 0.65223 | 1.01744 |
Table 6.
Evaluation of the model metrics for the binary homo polymer blends.
| Blend | Measurement Error | MAE | R² |
|---|---|---|---|
| PP1600-PP1350 | 20.865 | 5.529 | 0.984 |
| PP1600-PP1450 | 13.347 | 6.628 | 0.993 |
| PP1600-PP1500 | 11.477 | 14.323 | 0.892 |
Table 7.
Evaluation of the model metrics for blends containing fine chalk.
| Polymer Ratio | Measurement Error | MAE | R² |
|---|---|---|---|
| 0% PP1600 – 100% PP1500 | 12.058 | 25.120 | 0.984 |
| 33% PP1600 – 67% PP1500 | 19.495 | 58.256 | 0.906 |
| 67% PP1600 – 33% PP1500 | 16.975 | 13.678 | 0.993 |
| 100% PP1600 – 0% PP1500 | 21.436 | 19.571 | 0.976 |
Table 8.
Evaluation of the model metrics for blends containing rough chalk using Equation 5.
| Polymer Ratio | Measurement Error | MAE | R² |
|---|---|---|---|
| 0% PP1600 – 100% PP1500 | 12.711 | 3.870 | 0.999 |
| 33% PP1600 – 67% PP1500 | 13.856 | 21.500 | 0.946 |
| 67% PP1600 – 33% PP1500 | 15.356 | 1.906 | 0.999 |
| 100% PP1600 – 0% PP1500 | 16.017 | 29.481 | 0.905 |
Table 9.
Evaluation of the model metrics for blends containing impact strength modifier.
| Polymer Ratio | Measurement Error | MAE | R² |
|---|---|---|---|
| 0% PP1600 – 100% PP1500 | 13.940 | 22.582 | 0.680 |
| 33% PP1600 – 67% PP1500 | 11.648 | 17.085 | 0.860 |
| 67% PP1600 – 33% PP1500 | 16.842 | 18.422 | 0.565 |
| 100% PP1600 – 0% PP1500 | 38.332 | 8.929 | 0.962 |
Table 10.
Evaluation of the model metrics for blends containing peroxide additive.
| Polymer Ratio | Measurement Error | MAE | R² |
|---|---|---|---|
| 0% PP1600 – 100% PP1500 | 22.239 | 25.814 | 0.774 |
| 33% PP1600 – 67% PP1500 | 12.471 | 10.410 | 0.473 |
| 67% PP1600 – 33% PP1500 | 14.366 | 11.134 | 0.020 |
| 100% PP1600 – 0% PP1500 | 16.674 | 13.862 | 0.555 |
Table 11.
Optimised parameters for minimising the total MAE of the complete model.
| Parameter | Value | Parameter | Value |
|---|---|---|---|
| 0.38364 | 13415.550 | ||
| 7.52671 | 8628.090 | ||
| 0.65223 | 3852.150 | ||
| 1.01744 | 7.421 | ||
| 1458.86 | 4.505 | ||
| 1610.54 | 4.560 | ||
| 0.0000963 | 4.100 |
Disclaimer/Publisher’s Note: The statements, opinions and data contained in all publications are solely those of the individual author(s) and contributor(s) and not of MDPI and/or the editor(s). MDPI and/or the editor(s) disclaim responsibility for any injury to people or property resulting from any ideas, methods, instructions or products referred to in the content. |
© 2024 by the authors. Licensee MDPI, Basel, Switzerland. This article is an open access article distributed under the terms and conditions of the Creative Commons Attribution (CC BY) license (http://creativecommons.org/licenses/by/4.0/).
Copyright: This open access article is published under a Creative Commons CC BY 4.0 license, which permit the free download, distribution, and reuse, provided that the author and preprint are cited in any reuse.


