
Submitted:
08 November 2024
Posted:
12 November 2024
You are already at the latest version
Abstract
The ongoing increase in anthropogenic CO₂ emissions since the industrial revolution has accelerated ocean acidification (OA) by introducing CO₂ into seawater, forming carbonic acid and reducing pH levels. This acidification threatens marine calcifiers by weakening their capacity to build calcium carbonate structures and promoting the dissolution of existing skeletons. Nonetheless, calcifying organisms may contribute to mitigating OA effects. This study explores the roles of corals (rolling Siderastrea radians, a seagrass dweller) and free-living calcifying coralline algae (back reef) in CO₂ mitigation in seawater. Field experiments were conducted on Isla Grande (Corales del Rosario and San Bernardo National Natural Park, Colombian Caribbean), to observe the diel variations in photosynthesis and calcification of these uncommon reef builders across different times of the day. Results demonstrate diel shifts influenced by photosynthesis/respiration and calcification/dissolution, with free-living coralline algae exhibiting higher productivity and calcification rates than corals during the day. Notably, free-living coralline algae displayed pronounced hysteresis, reflecting high sensitivity to light. These findings underscore the significant role of free-living coralline algae in marine carbon cycling, suggesting a more substantial impact on CO₂ mitigation than previously recognized. Conserving free-living coralline algae and their habitats is thus critical for supporting marine ecosystem health and resilience amidst global change, warranting further research into their metabolic responses to inform conservation strategies.
Keywords:
Free-living (CCA)
; Corals
; Ocean acidification
; carbon dioxide
; climate change
; calcification
; photosynthesis
1. Introduction
Human-induced CO₂ emissions have markedly increased owing to the rise in fossil fuel use since the Industrial Revolution in the 18th century [1]. The oceans serve as a significant sink for anthropogenic CO₂ emissions, absorbing approximately 48% of these emissions since the onset of the Industrial Revolution. [2]. When atmospheric CO2 reacts with seawater, carbonic acid (H2CO3) is formed. This compound is unstable in the marine environment and dissociates into bicarbonate (HCO3−) and carbonate (CO32−) ions, while releasing hydrogen ions (H+) [1]. While the ocean's absorption of CO2 alleviates the accumulation of greenhouse gases and rising temperatures in the Earth's atmosphere, it alters the carbonate chemistry of the ocean, resulting in decreased pH and aragonite saturation states, which are essential for marine calcifying organisms and the carbonate cycle within coral reef ecosystems [3]. This process is often known as ocean acidification (OA).
Ocean acidifications possess a twofold threat to marine life: it not only diminishes the ability of organisms to calcify but also accelerates the dissolution of their calcium carbonate (CaCO3) structures. The rapid pace of this change produces significant concern, as many marine organisms, especially those that form calcium carbonate structures, may struggle to adapt quickly enough to survive [4,5]. The management of CO2 in marine ecosystems includes efforts to remove excess from the atmosphere. In this context, nature climate solutions have emerged as a preferred option to achieve this goal [6]. Recent studies have indicated that corals and free-living crustose coralline algae CCA may play a significant role in carbon sequestration by absorbing and storing atmospheric CO₂ [7]. This process potentially mitigates climate change impacts and helps offset anthropogenic carbon emissions [8,9,10,11].
In most calcifying phototrophs such as corals and free-living CCA, calcification occurs concurrently with photosynthesis when light is available [12]. However, the interactions between these two metabolic processes at the organismal level remain poorly understood [13,14]. The connection between photosynthesis and calcification may represent a crucial mechanism for carbon recycling. Although this phenomenon has been observed within calcifying communities [15,16], a detailed mechanistic comprehension at the organismal scale is still lacking [17]. From this perspective, numerous studies on corals and coralline algae have demonstrated that calcification rates are highly dependent upon photosynthesis, supporting the concept of photosynthetically enhanced calcification, also known as light-enhanced calcification (LEC) [17,18,19,20]. Calcification takes place during both day and night, but rates are notably higher during daylight, as photosynthesis can stimulate calcification through LEC [12,21]. This is evidenced by the consistently higher calcification rates observed during the day in comparison to night [22,23].
The carbon cycle of coral reefs at the ecological level is governed by the interrelated processes of photosynthesis, respiration, calcification, and dissolution, collectively referred to as coral reef metabolism [18,24]. Given these interconnected processes, it is crucial to understand the broader carbon cycle, particularly as shifts in seawater pH alter the balance between the different forms of dissolved inorganic carbon (DIC), represented by the following equilibrium:
CO2 + H2O ⇔ H+ + HCO3− ⇔ 2H+ + CO32−
This equilibrium is mediated by the processes of calcification-dissolution and photosynthesis-respiration [18]. Photosynthesis and respiration significantly influence hydrogen ion concentration [H+], with photosynthesis raising pH by reducing [H+] and respiration lowering pH by increasing [H+]. Net photosynthesis (Pnet) represents the balance between photosynthesis and respiration, positive and negative flux respectively, and, unlike calcification-dissolution, photosynthesis-respiration does not affect total alkalinity (TA). Moreover, calcification and dissolution are inversely related, with net calcification (Gnet) representing the total of calcification (positive) and dissolution (negative flux). These processes influence the relative concentrations of carbonate (CO32−), bicarbonate (HCO3−), and carbon dioxide (CO2).
Calcification is a biological process significantly influenced by photosynthesis and respiration, which alter pH and consequently affect the carbon chemistry of seawater [19]. Additionally, the impact of a coral reef's metabolism on seawater chemistry is observed through the rhythmic, daily, and seasonal fluctuations in total alkalinity (TA) and dissolved inorganic carbon (DIC), often referred to as the 'metabolic pulse.' Since variations in TA and DIC primarily reflect coral reef metabolic activity, they serve as valuable indicators of disturbances affecting coral reefs at the organismal, community, and ecosystem levels [18]. In summary, these metabolic processes are essential in regulating seawater chemistry. These processes govern the balance of pH, DIC and TA and serve as key indicators of reef perturbations across organismal, community, and ecosystem scales.
The aim of this study was to compare 1) the metabolic processes of photosynthesis-respiration and calcification-dissolution in the free-living rolling coral Siderastrea radians, a seagrass dweller, and calcifying coralline algae (coated grains), usually made single or a consortium of 2-3 species including variably Lithothamnion spp., Hydrolithon spp. and Mesophyllum spp., from the back reef [25] and 2) to clarify and characterize the process of carbonate chemistry recycling within these two different types of tropical calcifiers in the proximity of coral reefs. As both are photosynthesizers, they have the potential to manage high CO2 concentrations in seawater that may help mitigate ocean acidification within the context of climate change. We hypothesize that free-living (CCA) and rolling corals actively contribute to CO2 mitigation in seawater through their photosynthetic-respiration and calcification-dissolution processes, with significant variations in their carbon capture capacity depending on the time of day. Moreover, both corals and free-living (CCA) efficiently move carbon cycle in the seawater, playing a crucial role in regulating total alkalinity and dissolved inorganic carbon within their microenvironments through these metabolic activities.
2. Materials and Methods
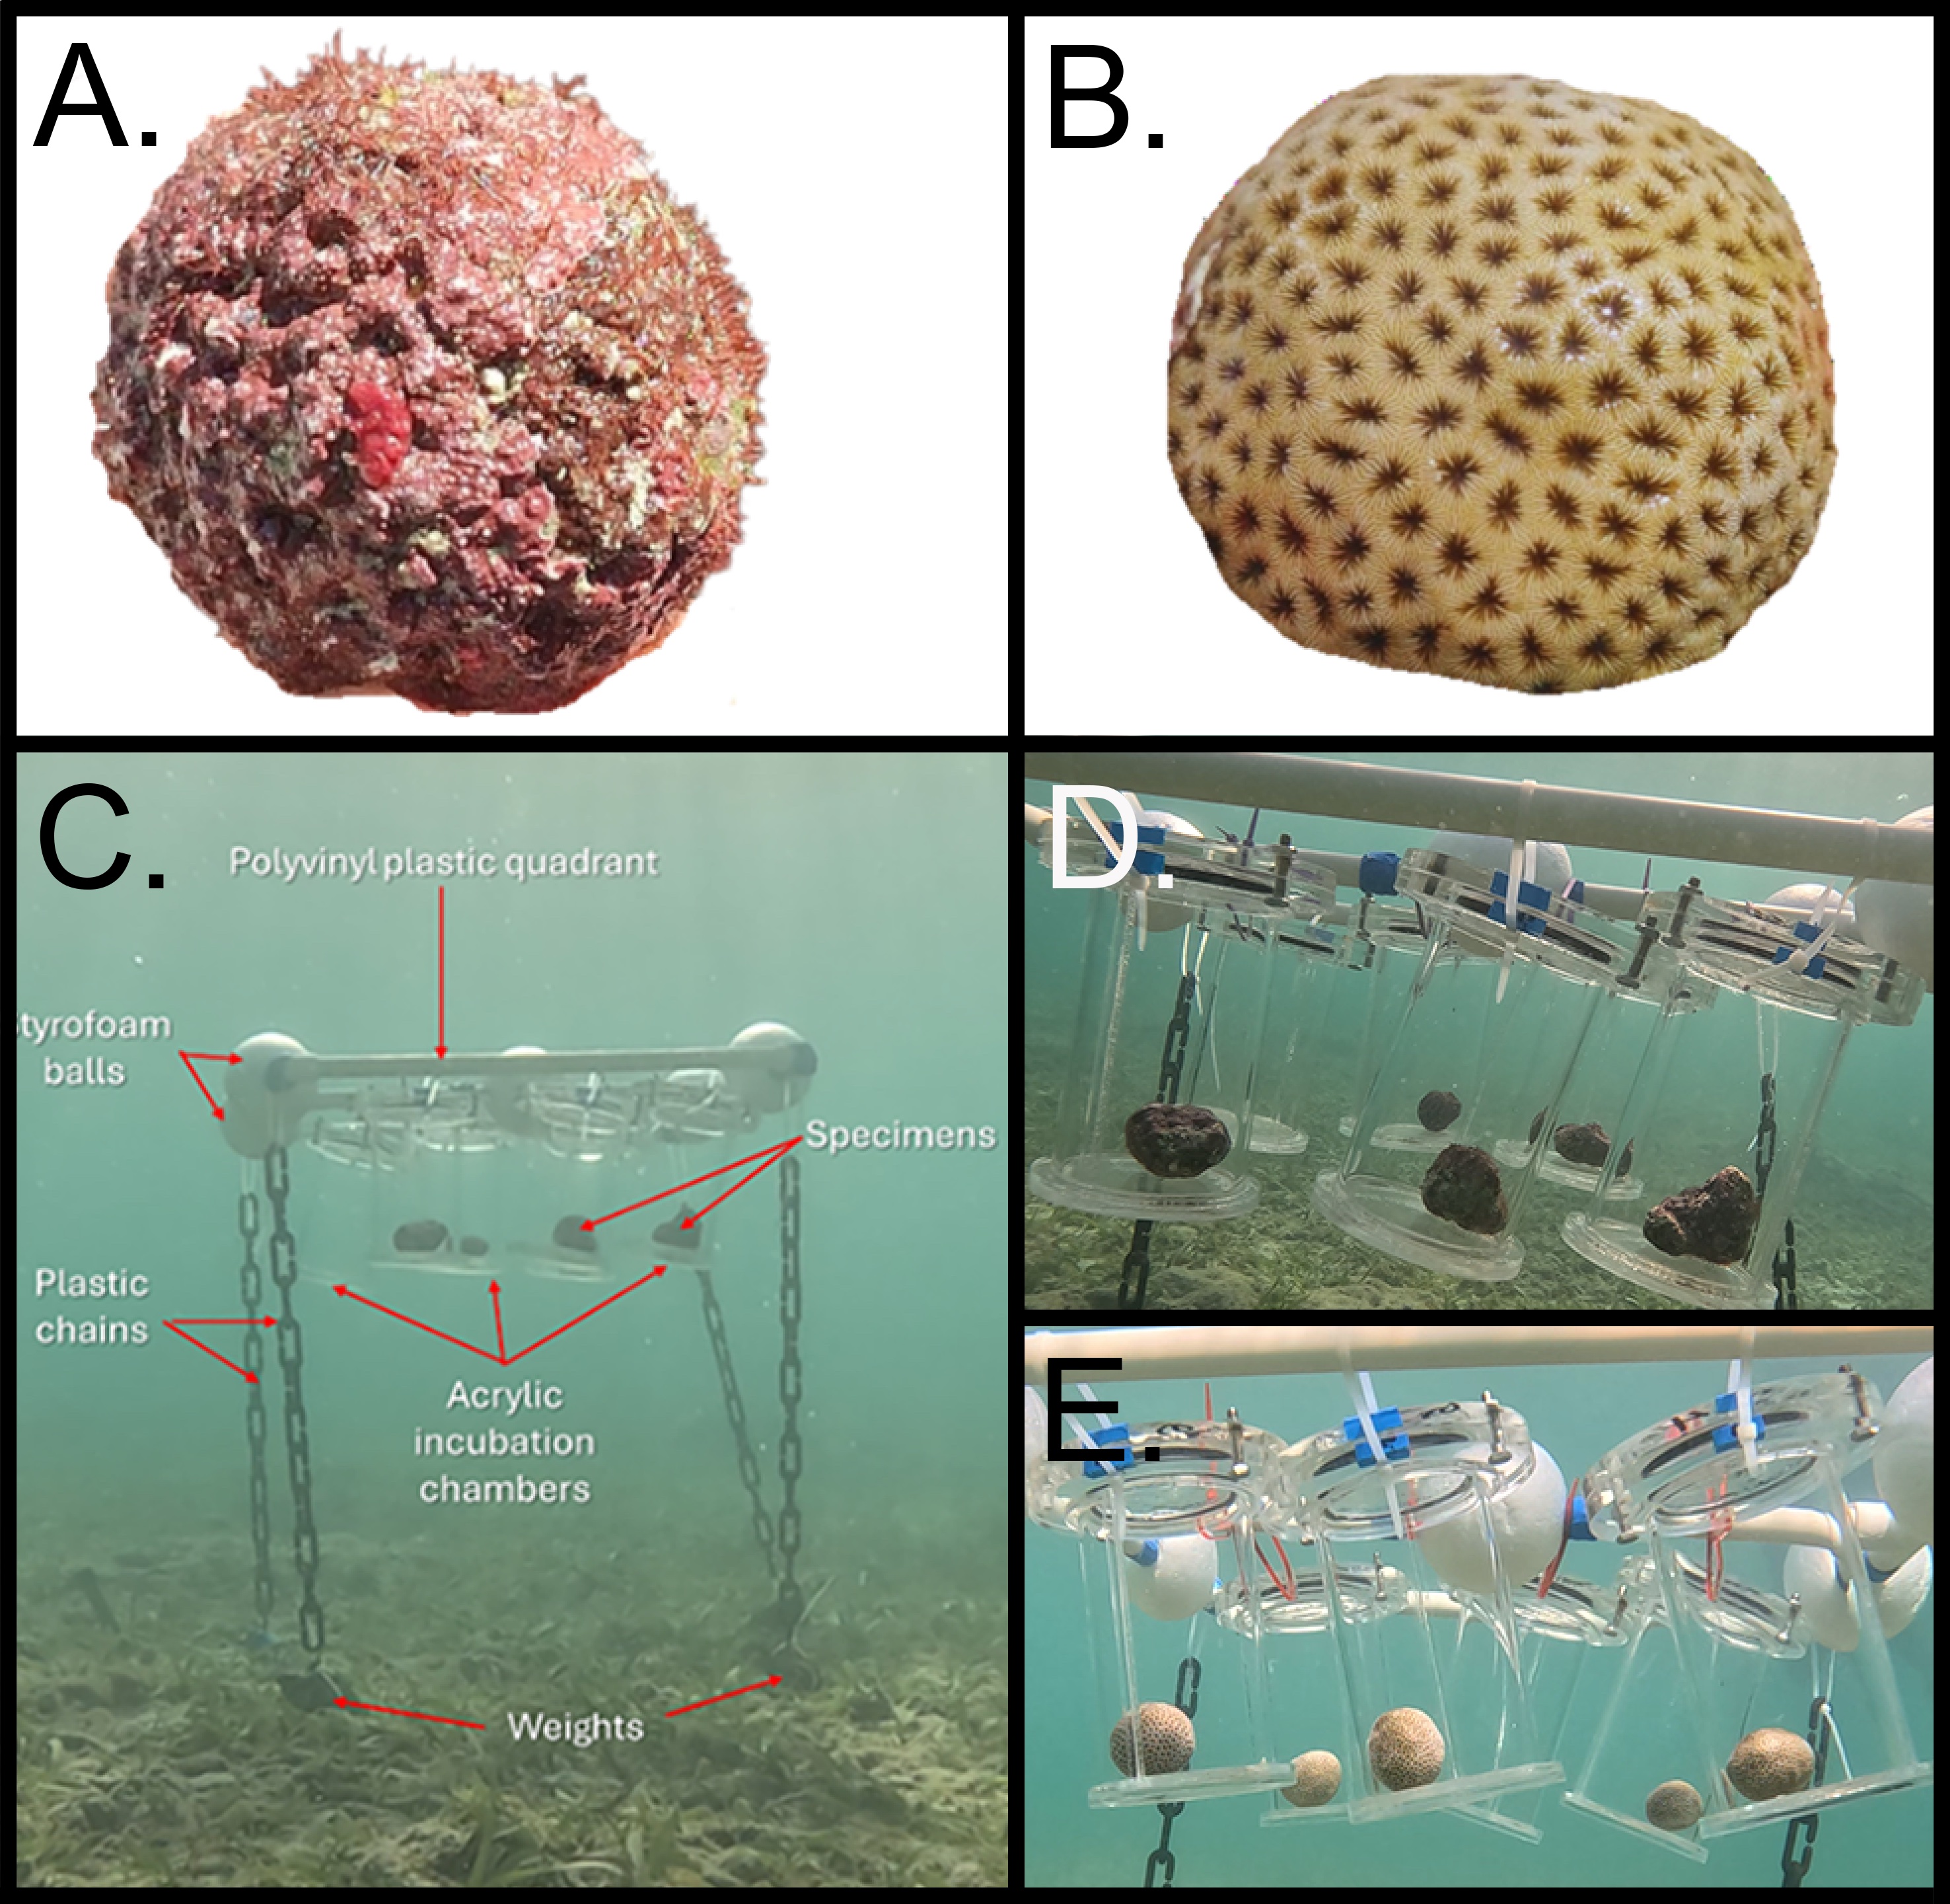
From January 8th to 13th – 2024, we manually collected free living non-geniculate calcifying coralline algae (CCA) nodules (coated grains) [25] from the back of the fringing reef on the north side of Isla Grande (10.1836 N, -75.7436 W) and free living semispherical colonies of Siderastrea radians coral from a seagrass environment (10.1714 N; -75.746 W) at depths between 2 to 4 meters (Figure 1 A,B). Isla Grande is part of the marine protected area within the Corales del Rosario and San Bernardo National Natural Park, located in the archipelago of the Rosario Islands, Cartagena, Colombian Caribbean (Figure S1 Supplementary Material).
2.1. Experimental Deployment
We conducted in situ experiments with corals and free-living CCA using custom-made acrylic incubation chambers (volume ~800 ml) (Figure 1 D,E) following standardized methodology [26]. The chambers were situated in their natural habitat and affixed to polyvinyl plastic quadrants (50 x 50 cm), which were suspended in the water column at a height of 70 cm above the substrate. This attachment was achieved by using styrofoam balls placed on the sides of the structure to ensure positive buoyancy. At each corner of the quadrant, a plastic chain attached to a lead weight served to anchor the structure securely to the substrate, thereby mitigating displacement while facilitating movement in response to the prevailing current. This facilitated natural circulation within the chambers, ensuring a uniform distribution [27]. The structure was positioned on the sandy seabed within the seagrass patch, where S. radians and free-living CCA thrives, at a depth of 3 meters (Figure 1C). Readings of PAR were taken during each incubation period with an underwater sensor Odyssey® photosynthetic irradiance recording system oriented horizontally and providing high resolution data of Photosynthetic Active Radiation in the wavelength range of 400 to 700nm. The Odyssey® PAR logger was previously calibrated with a Li-Cor Quantum Sensor LI-190 to convert pulses in µmol photons m-2 s-1.
To evaluate metabolic rates (calcification, respiration, and primary productivity) we conducted incubations separately for free-living CCA and corals, at three times of the day: morning between 9:00 – 12:00, afternoon between 14:30 – 17:00, and night between 19:00 – 22:00. Five replicate specimens of each type of organism were incubated individually in acrylic chambers for approximately two hours per session. To account for changes in the metabolic activity caused by e.g., microbial activity, a blank chamber containing only seawater was incubated concurrently under the same conditions. This value was then subtracted from the value of the chamber containing the specimens (Figueiredo et al., 2012). We collected an in-situ seawater sample at the time of closing the chambers, which serve as the initial time (T1) measurement for the physicochemical variables. Care was taken at the time of collection to ensure no bubbles were left inside the container before closing (Dickson et al., 2007). At the start and end of each incubation trial we measured temperature, salinity, dissolved oxygen and pHT (total scale) in the initial seawater sample and in each of the chambers at the end of the incubation period to get the difference (∆ values) in metabolic rates. Photosynthetically active radiation (PAR) (µmol photons m-2 s-1) was registered at the site of incubations. Salinity was taken with a handheld refractometer (Vital SineTM, resolution 1ppt), dissolved oxygen and temperature was taken with a RDO Thermo Scientific Orion Star A223 (resolution 0.01 mg L-1, accuracy ±0.2%; temperature resolution 0.1°C, accuracy ±0.1°C), and pH was taken in mV (millivolts) with a pH/temp probe Thermo Scientific Orion Star A121 (resolution 0.1mV, accuracy ±0.2mV, temperature resolution 0.1°C, accuracy ±0.1°C) immediately after collection. Additionally, in-situ temperature was monitored with a HOBO® sensor (Onset®) pendant UA-002 throughout the duration of the trials (precision 0.14 °C, accuracy ± 0.53 °C). All seawater samples were collected in 250 mL clean high-density polystyrene plastic bottle container and preserved with 100 µL of saturated mercury chloride solution (HgCl2) to avert alterations in the carbonate chemistry resulting from biological activity (Dickson et al., 2007). The containers were stored at room temperature until analysis, which was performed within two months of collection.
2.2. Laboratory Analysis
We employed the alkalinity anomaly method to calculate the calcification-dissolution rates, based on the assumption that for one mol of CaCO3 precipitated by biological activity, total alkalinity is reduced by two moles [28]. Total alkalinity (TA) was determined by open cell potentiometric titration using a Titrino Plus 877 following standard protocols [29](SOP3) using hydrochloric acid as titrant (Batch A26 - 0.1 mol L-1 HCl buffered in 0.6 mol L-1 NaCl, CRM Dickson Lab, Scripps Institution of Oceanography, La Jolla, California, USA). For pH total, we used a glass electrode (ROSS Ultra pH/ATC Triode 8107BNUMD) calibrated with Tris–HCL buffer solution obtained from the Dickson Lab (Batch 22). The carbonate system was derived from total alkalinity (TA) and pH total using the Excel-CO2SYS program [30], taking as parameters the dissociation constant for carbonic acid from [31], refit by [32], the constants K1 and K2 from [33], KHSO4 by [34] and Boron by [35]. These two parameters were taken as input alongside with temperature and salinity data to characterize DIC (µmol kg-1), partial pressure of CO2 in the system (µatm pCO2), bicarbonate (HCO3-) (µmol kg-1), carbonate concentration (CO32-) (µmol kg-1) and aragonite saturation states (Ωarag). To determine the accuracy of the analysis, the samples were validated with certified reference material (CRM) for TA, which were <0.5% estimated error (AT: ±10 µmol kg-1 SW) (Batch 139, CRM Dickson Lab, Scripps Institution of Oceanography, La Jolla, CA, USA).
2.3. Quantification of Metabolic Rates
Net production of corals and free-living CCA (μmol C cm-2 h-1) during light incubations was determined by subtracting the initial dissolved oxygen (DO) (PDO) concentrations from the measurements recorded at the end of the incubation period (final – initial), using the following equation:
where ΔDO indicates the variations in DO concentrations in μmol L-1 of sea water. The incubation chamber volume in liters is denoted as V, A represents the sample's surface area (cm2), and t refers to the incubation duration in hours. The same equation was applied to the dark incubation data for respiration calculations.
Net calcification (Gnet) of corals and free-living CCA (μmol CaCO3 cm-2 h-1) for both light and dark incubation conditions was determined utilizing the alkalinity anomaly method, as described by the following equation:
where ΔTA denotes the changes in total alkalinity (TA) concentrations in μmol kg-1 [20], V is the volume in liters, A is the surface area of the specimen, and t is the time in hours. To normalize the results from each incubation, the surface area was calculated for each specimen, which was obtained by generating 3D image files type .glb using the Polycam - LiDAR & 3D Scanner for iPhone & Android application. The files were analyzed in the Blender 4.1 software to calibrate the size and calculate the surface area of each specimen.
2.4. Statistical Analysis
All the statistical analysis and figures were performed in RStudio (version R.4.3.1), with data visualization in the ggplot2 package [36]. Normality and data distribution of the physiological variables were checked with Shapiro-Wilk tests. Multivariate Analysis of Variance (MANOVA) was employed to examine the effects of time of the day (morning, afternoon, night) and type of organisms (free-living CCA or coral) on the following dependent variables: change in total alkalinity (ΔTA), dissolved inorganic carbon (ΔDIC), bicarbonate (ΔHCO3), carbon dioxide (ΔCO2), carbonate (ΔCO3) dissolved oxygen (ΔDO), and rates of photosynthesis from dissolved oxygen changes (PDO), photosynthesis by carbon assimilation (PDIC), and calcification (Gnet) rates. Kruskal-Wallis test was used to evaluate differences between PAR measurements in morning, afternoon and night, a post-hoc analysis was used (Dunn’s test with Bonferroni correction) to pairwise comparisons (afternoon – morning; afternoon – night and morning - night). Another MANOVA analysis was applied to evaluate the effect of both organism and time of day (moment) on diel fluctuations of net calcification (Gnet) and aragonite saturation state (Ωarag).
3. Results
For every incubation set, PAR light values were recorded in the morning, afternoon, and night. Differences in photosynthetically active radiation (μmol photons m-2 s-1) at different times of the day were assessed using a Kruskal-Wallis test, following confirmation of non-normal data distribution via the Shapiro-Wilk test. The Kruskal-Wallis analysis revealed significant differences between the moments of day (χ² = 175.34, df = 2, p < 0.05). A post-hoc analysis using Dunn’s test with Bonferroni correction showed that all pairwise comparisons (afternoon - morning; afternoon - night and morning - night) were statistically significant. Specifically, the comparison between afternoon and morning yielded a Z= -5.16; p < 0.05, while the comparison between afternoon and night presented a Z= 7.42; p < 0.05. These results confirm significant variations in photosynthetically active radiation throughout the day, being highest during the morning compared to the afternoon and night (Figure S2 Supplementary Material).
3.1. Daily Changes in Concentration of TA, DIC, HCO3, CO2, CO3 and DO
Both free-living CCA and corals influence seawater chemistry through their metabolic process (photosynthesis-respiration and calcification-dissolution). The lowest change in total alkalinity (∆TA), dissolved inorganic carbon (∆DIC), bicarbonate (∆HCO3), and carbon dioxide (∆CO2) were consistently observed during periods of expected net photosynthesis (morning and afternoon) (Figure 2 A–D respectively), while the highest values were observed at night. Conversely, changes in carbonate (∆CO3) and dissolved oxygen (∆DO) exhibited the opposite pattern, with greater influence during daylight hours (Figure 2 E,F) (Table 1).
Statistical analysis revealed significant effects of both organism type (free-living CCA or coral) and time of day (morning, afternoon, night) on changes in total alkalinity (∆TA) (F=11.076, p < 0.003 for organism type; F=11.174, p < 0.01 for time of day), dissolved inorganic carbon (∆DIC) (F=7.271, p < 0.05; F=61.992, p < 0.001), bicarbonate (∆HCO3) (F=5.140, p < 0.033; F=71.130, p < 0.001) and dissolved oxygen (∆DO) (F=20.321, p < 0.001; F=176.543, p < 0.001). While carbonate (∆CO3) and carbon dioxide (∆CO2) levels also vary significantly with time of day (F=72.285, p < 0.001) (F=82.265, p < 0.001) respectively, they were not significantly affected by type of organism (p = 0.403; p = 0.203) respectively. These findings suggest that while both organism type and time of day influence various seawater chemistry variables, their combined effects are not significant across all cases. Notably, a significant interaction effect was observed only for ∆TA indicating that the influence of organism on total alkalinity depends on the type and time of day (Table 2).
3.2. Rates of Metabolism
3.2.1. Photosynthesis from Oxygen Changes (PDO)
Free-living CCA exhibited significantly higher photosynthetic rates (PDO) compared to corals during both morning and afternoon incubations, with mean values and standard deviations of 0.975±0.2 and 0.927±0.3, respectively, while corals exhibited rates of 0.686±0.1 and 0.462±0.1. However, at night, corals showed a significantly higher respiration rate than free-living CCA, with a mean and standard deviation of -0.333±0.1, as evidenced by negative PDO values, reflecting net O2 consumption (Table 3, Figure 3). Statistical analysis revealed a significant effect of organism type on PDO (F =20.95, p < 0.001), indicating differences in photosynthetic activity between free-living CCA and corals. Additionally, the time of day significantly influenced PDO (F=136.654, p < 0.001), although the interaction between organism type and time of day was not significant (F=3.383, p = 0.051) (Table 2).
3.2.2. Calcification (Gnet)
We observed significantly higher calcification rates in free-living CCA (0.243±0.1; 0.307±0.1) than in corals (0.134±0.1; 0.111±0.1) for both morning and afternoon, while corals calcify (0.070±0.1) significantly more at night than free-living CCA (0.020±0.1) (Figure 3 and Table 3). Notably, both free-living CCA and corals showed CaCO3 dissolution at night, with free-living CCA exhibiting higher dissolutions rates (Figure 3). Statistical analysis showed significant effect in both organism type (F=7.823, p < 0.01) and time of the day (F=11.948, p < 0.001) on net calcification (Gnet), indicating differences between free-living CCA and corals as well as throughout different times of the day. A significant interaction effect between organism type and time of day (F=5.062, p =0.015) indicates that the relationship between free-living CCA and coral calcification rates is influenced by the time of day (Table 2).
On the other hand, the comparison between net fluxes of calcification rates Gnet and productivity PDO between type of organisms shows that free-living CCA exhibit greater Gnet variation between day and night compared to corals, with a clear increase in Gnet during the day and a notable reduction at night. This pattern is less pronounced in corals, where Gnet values remain more consistent between both periods. Likewise, a similar dynamic is observed in PDO for both organisms, with a significant increase in productivity during the day and a decline at night. However, free-living CCA shows a greater amplitude in the day/night changes compared to corals. This indicates how free-living CCA shows more pronounced changes in the net fluxes of Gnet and PDO between day and night compared to corals (Figure 4). Moreover, free-living CCA exhibited 24.7% greater productivity and 79.4% higher calcification than corals when assessed the mean values from day and night (Table 4). These results highlight important differences in productivity and calcification patterns between the evaluated organisms, suggesting implications for understanding biogeochemical cycles in marine ecosystems.
3.3. The Relationship Between Gnet and Ωarag
Plotting the Gnet linear regression as a function of Ωarag has become a widespread way to describe reef calcification [19]. For instance, a linear regression analysis was employed to evaluate the relationship between net calcification Gnet and aragonite saturation state (Ωarag). In free-living CCA incubations, the analysis revealed a statistically significant positive relationship (p = 0.0195), suggesting that Gnet increases with higher Ωarag. The regression equation (Gnet = 0.16 ⋅ Ωarag + −0.5) indicates that for each unit increase in Ωarag, the calcification Gnet rises by approximately 0.16 μmol cm-² h-1, with the model explaining 35.29% of the variance in Gnet (R2= 0.3529). In contrast, the regression analysis for coral samples demonstrated that the relationship between Gnet and Ωarag was not statistically significant (p = 0.2306). The regression equation (Gnet = 0.05 ⋅ Ωarag + −0.08) suggests that each unit increase in aragonite saturation only correlates with an increase of 0.04521 μmol cm-² h-1 in Gnet. This model accounted for 10.85% of the variance in Gnet (R2= 0.1085), indicating weak explanatory power. These findings highlight the distinct influences of aragonite saturation on calcification processes in free-living CCA compared to corals, suggesting that while aragonite saturation significantly impacts net calcification in free-living CCA, other factors may play a more crucial role in coral calcification dynamics (Figure 5).
3.4. Diel Hysteresis and Calcification Patterns
Grouping the data of Gnet and Ωarag for type of organism and time of day reveals a distinct pattern of diel hysteresis (Figure 6). Both organisms show significant variation in the link between Ωarag and Gnet throughout the day. The highest values of Ωarag and the highest calcification rates occur in the afternoon, indicating increased calcification efficiency under optimal photosynthetic conditions. In contrast, intermediate calcification rates are observed in the morning, while free-living CCA even show negative Gnet values at night, suggesting a CaCO3 dissolution process under these conditions. Additionally, a more pronounced diel hysteresis pattern is evident in free-living CCA compared to corals. In free-living CCA, the relationship between Gnet and Ωarag shows a distinct separation at each time of day. In contrast, corals exhibit overlapping patterns of this relationship during the morning and afternoon (Figure 6).
The MANOVA results reveal significant effects of both organism and time of day (moment) on net calcification (Gnet) and aragonite saturation state (Ωarag). For the Gnet response, a significant main effect of the factor organism (F = 7.84, p = 0.0099) indicates that calcification rates differ significantly between corals and free-living CCA. Additionally, the effect of moment is highly significant (F = 11.97, p = 0.00025), suggesting a consistent diel variation in calcification, with peak rates observed in the afternoon. The interaction between the organism and the time of day is also noteworthy (F = 5.06, p = 0.0146), indicating different hysteresis patterns in calcification for each organism, each responding uniquely to the varying environmental conditions throughout the day. In terms of Ωarag, the effect of moment of day is highly significant (F = 42.23, p < 0.0001), indicating strong diel fluctuations. The effect of the organism type on Ωarag is not significant (F = 4.07, p = 0.055), indicating that there are no substantial differences in Ωarag between corals and free-living CCA. The interaction between organism and moment is not statistically significant (F = 2.19, p = 0.134), indicating similar diel patterns for both organisms. Overall, these findings underscore the complex, non-linear relationship between calcification, aragonite saturation, and diel environmental changes in marine ecosystems.
4. Discussion
This study provides a comparative analysis of marine carbon flux (carbonate cycle) by two types of photosynthetic and calcifying seafloor rolling organisms, such as free-living CCA and the coral Siderastrea radians. Our results highlight the significant influence of both organisms on different seawater chemistry variables through their metabolic processes.
We observed a consistent diel pattern in total alkalinity (∆TA), dissolved inorganic carbon (∆DIC), bicarbonate (∆HCO3), and carbon dioxide (∆CO2), which all reached their lowest values during morning and afternoon hours, with peak values observed at night. This pattern shows the influence of photosynthesis and calcification processes on seawater chemistry, which is more active during daylight hours, as was observed in other studies studying diurnal changes in coral-algae metabolism [19]. Conversely, carbonate (∆CO3) and dissolved oxygen (∆DO) exhibited opposite trends, reaching their lowest values at night. This indicates the night-time predominance of respiration that release CO2 and favor dissolution of calcium carbonate, highlighting the importance of the dynamic interplay between organic and inorganic metabolic processes (photosynthesis-respiration/calcification-dissolution) in influencing the diel cycles of seawater chemistry [18,19]. Statistical analyses confirmed the significant influence of both type of organism and time of day on the seawater chemistry variables ∆TA, ∆DIC and ∆HCO3. While ∆CO3 and ∆CO2 also showed substantial diel variation, they did not differ significantly between free-living CCA and corals. Interestingly, a significant interaction effect was observed only in ∆TA, indicating that the influence of organism type on total alkalinity is dependent on the time of day.
Measurements of photosynthesis through oxygen changes (PDO) revealed significantly higher photosynthetic rates in free-living CCA compared to corals during the morning and afternoon incubations. Conversely, corals exhibited a significantly higher respiration rate at night. The differences found indicate how these organisms contribute to the seawater chemistry at different times of the day. During the morning and afternoon, free-living CCA perform photosynthesis at a much higher rate than corals. Therefore, it generates more oxygen and absorbs more carbon dioxide during these hours compared to corals. Additionally, at night, corals have a significantly higher respiration rate than free-living CCA. Thus, while free-living CCA produces oxygen during the day, corals consume oxygen more rapidly at night. These findings suggest that CCA may play a more substantial role in carbon fixation within the marine ecosystem, which aligns with growing understanding of the potentially contribution of rhodolith beds to the global carbon budget [8,37,38,39] and in future scenarios of ocean acidification [40]. This is particularly relevant in the context of current efforts to identified nature-based solutions for mitigating anthropogenic carbon emissions that are leading to climate change [41].
Significant differences in net calcification (Gnet) were observed between free-living CCA and corals as well as throughout the diel cycle. Free-living CCA exhibited higher calcification rates during the morning and afternoon, while corals showed higher dark calcification at night, despite both organisms experiencing CaCO3 dissolution. These findings highlight the importance of considering both organism type and time of day when evaluating biogeochemical processes in marine ecosystems. Our findings align with recent evidence suggesting that CCA may play a greater role than corals to reef carbonate production in specific areas [9]. The observed temporal variability underscores the need for studies that integrate both daily variation and differences among organism types to better understand their influence on marine ecosystem dynamics.
The comparison of net fluxes between calcification rates (Gnet) and productivity (PDO) during the day and night in both types of organisms, provides important insights into their distinct roles in marine ecosystems. Free-living CCA demonstrates a more dynamic calcification response to diurnal light changes. This variation could be attributed to differences in metabolic regulation, where it might be more sensitive to light availability, photosynthesis rates, or environmental conditions that affect calcification. In contrast, the more stable Gnet values in corals suggest a more consistent calcification process that may be less influenced by diurnal fluctuations. The pronounced changes in both Gnet and PDO in free-living CCA compared to corals suggest that the former contribute more significantly to carbon cycling during the day, when their calcification and productivity peak. This may indicate that free-living CCA act as carbon sinks during daylight hours, potentially playing a more substantial role in mitigating CO2 levels in marine environments than previously thought. The increased calcification during the day in free-living CCA, followed by a sharp reduction at night, contrasts with the more moderate changes seen in corals, highlighting its greater ecological plasticity in responding to environmental changes.
The 24.7% greater productivity and 79.4% higher calcification in free-living CCA compared to corals, further reinforces the idea that CCA have a stronger influence on carbon biogeochemical cycle. This difference in performance could be linked to their structural composition and ecological interactions, suggesting that free-living CCA may contribute more effectively to the long-term storage of carbon in marine ecosystems. Our results are noteworthy as a recent study revealed conflicting patterns in the assessed calcifying algae (CCA), exhibiting smaller variations compared to the coral species P. astreoides, A. cervicornis, O. faveolata, and S. siderea in the relationship between both Gnet and Gdark, as well as PDO and RDO [20]. Our results indicate that free-living CCA show greater fluctuations in the net fluxes of Gnet and PDO, particularly between day and night, suggesting a higher sensitivity to diurnal environmental changes. Overall, these results highlight the need to further investigate the mechanisms behind the greater amplitude of day/night changes in free-living CCA. Understanding these processes could improve predictive models of carbon cycling and inform conservation efforts aimed at preserving critical marine habitats that play a role in global carbon dynamics.
A diel hysteresis pattern could be demonstrated when grouping the data according to time of day in the linear regression between Gnet and Ωarag in free-living CCA and corals (Figure 6). Our observations revealed that highest Ωarag values and calcification rates occur in the afternoon, reflecting an enhanced calcification efficiency under optimal photosynthetic conditions. Intermediate rates are seen in the morning, while free-living CCA display negative Gnet values at night, indicating possible dissolution of CaCO3. Additionally, CCA show a more pronounced diel hysteresis compared to corals, with a clear separation of the Gnet-Ωarag relationship across different times of day. In contrast, corals exhibit overlapping patterns in this relationship between morning and afternoon. This pattern is consistent with the diel hysteresis documented in other studies, where irradiance serves as a primary driver of carbon assimilation during photosynthesis, subsequently regulating calcification rates [19]. Moreover, previous research has attributed the pronounced diurnal hysteresis observed in coral reefs to the interplay between photosynthesis and respiration processes [18,42,43]. Additionally, the diel hysteresis patterns observed in free-living CCA and corals support the concept of light-enhanced calcification, where photosynthetic processes during the day increase calcification efficiency in these organisms. The higher calcification efficiency in the afternoon and the negative Gnet values observed at night in CCA and corals suggest a dependency of calcification on irradiance. This phenomenon may reflect distinct photosynthetic and respiratory processes between CCA and corals, aligning with previous studies that link daytime photosynthesis to increased calcification rates [19,20,22,23]. The more pronounced diel hysteresis observed in CCA compared to corals highlights their sensitivity to daytime irradiance and underscores their potential role in carbon assimilation in marine ecosystems. Additionally, emphasizes the need to consider temporal dynamics when assessing the role of calcifying organisms in biogeochemical processes, particularly regarding ocean acidification and climate change.
However, the linear regression analysis of Gnet vs. Ωarag for free-living CCA and coral explained only a part of the variance (R2 = 0.352 and R2= 0.108 respectively). This suggests that the linear regression does not effectively capture the variance associated with the diel pattern. Nevertheless, a similar situation was observed by [19] when comparing the same variable relationships in a mesocosm experiment. However, unlike our results, they reported a clear hysteresis pattern in corals but not in algae alone. This suggests that additional factors beyond aragonite saturation state, such as light availability, temperature, or nutrient levels, may play a significant role in driving the diel patterns observed. Additionally, the difference in hysteresis patterns suggests that the physiological responses of corals and free-living CCA to environmental variables are distinct, potentially influenced by species-specific traits or environmental conditions that were not fully captured in either study's linear models. This underscores the need for more comprehensive models that incorporate a wider range of variables to better understand the underlying drivers of calcification dynamics.
This study highlights the critical role of free-living CCA and corals in the marine environment, particularly concerning their contributions to the fluxes and reservoirs of oceanic carbon. While both types of organisms exhibit significant rates of calcification and photosynthesis, CCA contribute substantially more to biological carbon sequestration compared to corals. In this regard, in coral reef geology and ecology, crustose coralline algae are increasingly recognized as essential contributors to reef accretion and carbonate production [7,9,44]. These findings are important in the current context of global change, as the ongoing global bleaching events make it increasingly evident that reefs face severe threats [45,46]. It therefore seems reasonable that the loss of corals would lead to reduced reef growth and, eventually, the degradation of reef structures. [44]. Assessing the contribution of coralline calcifying algae (CCA) to net calcium carbonate production and structural stability in coral reefs is becoming essential as climate change progressively diminishes coral cover [47]. However, detailed assessments of reef growth over ecological timescales have demonstrated that, even with coral loss, accretion can continue, with crustose coralline algae making a particularly notable contribution to this process [48]. Therefore, the preservation and study of crustose coralline algae and free-living CCA should be a priority in marine conservation efforts, ensuring the stability of reef structures in changing global conditions.
5. Conclusions
This study presents a comparative analysis of carbon sequestration by free-living (CCA) and the coral Siderastrea radians, emphasizing their significant roles in influencing seawater chemistry through their metabolic processes. Our findings reveal consistent diel patterns influenced by the interplay between photosynthesis/respiration and calcification/dissolution processes, particularly highlighting free-living CCA greater productivity and calcification rates compared to corals during daylight hours. The contrasting respiratory rates observed at night suggest that while free-living CCA contribute significantly to carbon fixation during the day, corals dominate respiration processes at night. Notably, free-living CCA displayed a pronounced hysteresis, indicating a more sensitive response to light availability, which aligns with previous studies highlighting the importance of irradiance in driving carbon assimilation. However, the limited variance explained by our linear models suggests that additional environmental factors may influence these dynamics. Our results underscore the critical importance of free-living CCA in marine carbon cycling, suggesting that they may play a more substantial role in mitigating CO2 levels than previously understood. This aligns with emerging perspectives that recognize the significant contributions of crustose coralline algae to reef carbonate production and stability. As global change threatens coral ecosystems, understanding and conserving free-living CCA and their related habitats become imperative for maintaining marine ecosystem health and resilience. Thus, further research is needed to elucidate the mechanisms underlying the differences observed in metabolic responses and to inform conservation strategies aimed at preserving these vital marine organisms.
Supplementary Materials
The following supporting information can be downloaded at the website of this paper posted on Preprints.org, Figure S1: Study area. (A). Map of the northern region of Colombia, the inset shows the region of the Barú Peninsula and the Rosario Islands. (B). Barú Peninsula and the Rosario Islands Archipelago (Rosario Islands National Natural Park), the inset shows Isla Grande. (C). Isla Grande, with red dots indicating the sampling points: the northern point marks a coral barrier where the free-living CCA were collected; and the southern point represents a seagrass patch where corals were collected.; Figure S2: PAR light values (µmol photons m-2 s-1) measured for each incubation set at each of the three moments of day (morning, afternoon and night). Boxplots show mean (red point), median (horizonal line), and IQR (box and whisker). The number of individual measurements carried out within each time period (n). Colors represent the time periods: morning= yellow, afternoon= orange, and night= black. Morning PAR was 1276 ± 532 μmol photons m-2 s-1 (mean ± SD), afternoon 465±240 μmol photons m-2 s-1, and night 0±0 μmol photons m-2 s-1..
Author Contributions
Conceptualization, D.M., C.E.G. and J.S.; methodology, D.M. and C.E.G.; software, D.M. and C.E.G.; validation, D.M., C.E.G. and J.S.; formal analysis, D.M., C.E.G. and J.S.; investigation, D.M., C.E.G. and J.S.; resources, J.S.; data curation, D.M. and C.E.G.; writing—original draft preparation, D.M.; writing—review and editing, C.E.G. and J.S.; visualization, D.M.; supervision, J.S.; project administration, J.S.; funding acquisition, J.S. All authors have read and agreed to the published version of the manuscript.
Funding
This research was funded by Universidad de los Andes through the project INV-2022-151-2609 and Minciencias program "Observatorio de la microbioerosión, acidificación oceánica y la disolución en arrecifes coralinos," code 1204-852-70251.
Institutional Review Board Statement
Not applicable.
Data Availability Statement
Data available in a publicly accessible repository DOI: https://doi.org/10.6084/m9.figshare.27628080.v1.
Acknowledgments
We express our special gratitude to Parques Nacionales Naturales (Corales del Rosario and San Bernardo National Natural Parks) for allowing us to conduct the study in their jurisdiction and to perform chemical analyses at their facilities. We acknowledge the help from local communities at Rosario islands and the Centro de Investigación Educación y Recreación (CEINER) – Oceanario Islas del Rosario for allowing us to use their facilities for field activities.
Conflicts of Interest
The authors declare no conflicts of interest.
References
- Leung, J.Y.S.; Zhang, S.; Connell, S.D. Is Ocean Acidification Really a Threat to Marine Calcifiers? A Systematic Review and Meta-Analysis of 980+ Studies Spanning Two Decades. Small Weinh. Bergstr. Ger. 2022, 18, e2107407. [Google Scholar] [CrossRef] [PubMed]
- Sabine, C.L.; Feely, R.A.; Gruber, N.; Key, R.M.; Lee, K.; Bullister, J.L.; Wanninkhof, R.; Wong, C.S.; Wallace, D.W.R.; Tilbrook, B.; et al. The Oceanic Sink for Anthropogenic CO2. Science 2004, 305, 367–371. [Google Scholar] [CrossRef] [PubMed]
- Doney, S.C.; Fabry, V.J.; Feely, R.A.; Kleypas, J.A. Ocean Acidification: The Other CO2 Problem. Annu. Rev. Mar. Sci. 2009, 1, 169–192. [Google Scholar] [CrossRef] [PubMed]
- Cooley, S.; Schoeman, D.; Bopp, L.; Boyd, P.; Donner, S.; Ito, S.; Kiessling, W.; Martinetto, P.; Ojea, E.; Racault, M.-F.; et al. Chapter 3: Oceans and Coastal Ecosystems and Their Services. Available online: https://www.ipcc.ch/report/ar6/wg2/downloads/report/IPCC_AR6_WGII_FinalDraft_Chapter03.pdf (accessed on 9 August 2024).
- Guinotte, J.M.; Fabry, V.J. Ocean Acidification and Its Potential Effects on Marine Ecosystems. Ann. N. Y. Acad. Sci. 2008, 1134, 320–342. [Google Scholar] [CrossRef] [PubMed]
- Macreadie, P.I.; Costa, M.D.P.; Atwood, T.B.; Friess, D.A.; Kelleway, J.J.; Kennedy, H.; Lovelock, C.E.; Serrano, O.; Duarte, C.M. Blue Carbon as a Natural Climate Solution. Nat. Rev. Earth Environ. 2021, 2, 826–839. [Google Scholar] [CrossRef]
- Schubert, N.; Tuya, F.; Peña, V.; Horta, P.A.; Salazar, V.W.; Neves, P.; Ribeiro, C.; Otero-Ferrer, F.; Espino, F.; Schoenrock, K.; et al. “Pink Power”—the Importance of Coralline Algal Beds in the Oceanic Carbon Cycle. Nat. Commun. 2024, 15, 8282. [Google Scholar] [CrossRef]
- Amado-Filho, G.M.; Moura, R.L.; Bastos, A.C.; Salgado, L.T.; Sumida, P.Y.; Guth, A.Z.; Francini-Filho, R.B.; Pereira-Filho, G.H.; Abrantes, D.P.; Brasileiro, P.S.; et al. Rhodolith Beds Are Major CaCO3 Bio-Factories in the Tropical South West Atlantic. PLOS ONE 2012, 7, e35171. [Google Scholar] [CrossRef]
- Cornwall, C.E.; Carlot, J.; Branson, O.; Courtney, T.A.; Harvey, B.P.; Perry, C.T.; Andersson, A.J.; Diaz-Pulido, G.; Johnson, M.D.; Kennedy, E.; et al. Crustose Coralline Algae Can Contribute More than Corals to Coral Reef Carbonate Production. Commun. Earth Environ. 2023, 4, 1–12. [Google Scholar] [CrossRef]
- Costa, D. de A.; Dolbeth, M.; Christoffersen, M.L.; Zúñiga-Upegui, P.T.; Venâncio, M.; de Lucena, R.F.P. An Overview of Rhodoliths: Ecological Importance and Conservation Emergency. Life 2023, 13, 1556. [Google Scholar] [CrossRef]
- Tuya, F.; Schubert, N.; Aguirre, J.; Basso, D.; Bastos, E.O.; Berchez, F.; Bernardino, A.F.; Bosch, N.E.; Burdett, H.L.; Espino, F.; et al. Levelling-up Rhodolith-Bed Science to Address Global-Scale Conservation Challenges. Sci. Total Environ. 2023, 892, 164818. [Google Scholar] [CrossRef]
- Gattuso, J.P.; Alemand, D.; Frankignoulle, M. Photosynthesis and Calcification at Cellular, Organismal and Community Levels in Coral Reefs: A Review on Interactions and Control by Carbonate Chemistry1. Am. Zool. 1999, 39, 160–183. [Google Scholar] [CrossRef]
- Borowitzka, M.A.; Larkum, A.W.D. Calcification in Algae: Mechanisms and the Role of Metabolism. Crit. Rev. Plant Sci. 1987, 6, 1–45. [Google Scholar] [CrossRef]
- McCoy, S.J.; Pueschel, C.M.; Cornwall, C.E.; Comeau, S.; Kranz, S.A.; Spindel, N.B.; Borowitzka, M.A. Calcification in the Coralline Red Algae: A Synthesis. Phycologia 2023, 62, 648–666. [Google Scholar] [CrossRef]
- Gattuso, J.; Pichon, M.; Frankignoulle, M. Biological Control of Air-Sea CO2 Fluxes: Effect of Photosynthetic and Calcifying Marine Organisms and Ecosystems. Mar. Ecol. Prog. Ser. 1995, 129, 307–312. [Google Scholar] [CrossRef]
- Suzuki, A.; Nakamori, T.; Kayanne, H. The Mechanism of Production Enhancement in Coral Reef Carbonate Systems: Model and Empirical Results. Sediment. Geol. 1995, 99, 259–280. [Google Scholar] [CrossRef]
- Mao, J.; Burdett, H.; Kamenos, N. Efficient Carbon Recycling between Calcification and Photosynthesis in Red Coralline Algae. Biol. Lett. 2024, 20, 20230598. [Google Scholar] [CrossRef]
- Cyronak, T.; Andersson, A.J.; Langdon, C.; Albright, R.; Bates, N.R.; Caldeira, K.; Carlton, R.; Corredor, J.E.; Dunbar, R.B.; Enochs, I.; et al. Taking the Metabolic Pulse of the World’s Coral Reefs. PLOS ONE 2018, 13, e0190872. [Google Scholar] [CrossRef]
- Jokiel, P.L.; Jury, C.P.; Rodgers, K.S. Coral-Algae Metabolism and Diurnal Changes in the CO2-Carbonate System of Bulk Sea Water. PeerJ 2014, 2, e378. [Google Scholar] [CrossRef]
- Mallon, J.; Cyronak, T.; Hall, E.R.; Banaszak, A.T.; Exton, D.A.; Bass, A.M. Light-Driven Dynamics between Calcification and Production in Functionally Diverse Coral Reef Calcifiers. Limnol. Oceanogr. 2022, 67, 434–449. [Google Scholar] [CrossRef]
- Moya, A.; Tambutté, S.; Tambutté, E.; Zoccola, D.; Caminiti, N.; Allemand, D. Study of Calcification during a Daily Cycle of the Coral Stylophora Pistillata: Implications for `light-Enhanced Calcification’. J. Exp. Biol. 2006, 209, 3413–3419. [Google Scholar] [CrossRef]
- Gattuso, J.P.; Frankignoulle, M.; Smith, S.V. Measurement of Community Metabolism and Significance in the Coral Reef CO2 Source-Sink Debate. Proc. Natl. Acad. Sci. 1999, 96, 13017–13022. [Google Scholar] [CrossRef] [PubMed]
- Goreau, T.F. The Physiology of Skeleton Formation in Corals. i. a Method for Measuring the Rate of Calcium Deposition by Corals under Different Conditions. Biol. Bull. 1959, 116, 59–75. [Google Scholar] [CrossRef]
- Albright, R.; Benthuysen, J.; Cantin, N.; Caldeira, K.; Anthony, K. Coral Reef Metabolism and Carbon Chemistry Dynamics of a Coral Reef Flat. Geophys. Res. Lett. 2015, 42, 3980–3988. [Google Scholar] [CrossRef]
- Teichert, S. Attached and Free-Living Crustose Coralline Algae and Their Functional Traits in the Geological Record and Today. Facies 2024, 70, 8. [Google Scholar] [CrossRef]
- Gómez, C.E.; Acosta-Chaparro, A.; Bernal, C.A.; Gómez-López, D.I.; Navas-Camacho, R.; Alonso, D. Seasonal Upwelling Conditions Modulate the Calcification Response of a Tropical Scleractinian Coral. Oceans 2023, 4, 170–184. [Google Scholar] [CrossRef]
- Hurd, C.L. Water Motion, Marine Macroalgal Physiology, and Production. J. Phycol. 2000, 36, 453–472. [Google Scholar] [CrossRef]
- Chisholm, J.R.M.; Gattuso, J.-P. Validation of the Alkalinity Anomaly Technique for Investigating Calcification of Photosynthesis in Coral Reef Communities. Limnol. Oceanogr. 1991, 36, 1232–1239. [Google Scholar] [CrossRef]
- Dickson, A.G.; Sabine, C.L.; Christian, J.R. Guide to Best Practices for Ocean CO2 Measurements.; North Pacific Marine Science Organization, 2007. 2007. [Google Scholar]
- Pierrot, D.E.; Lewis, E.; Wallace, D.W.R.; Wallace, D.W.R. MS Excel Program Developed for CO2 System Calculations.
- Mehrbach, C.; Culberson, C.H.; Hawley, J.E.; Pytkowicx, R.M. Measurement of the Apparent Dissociation Constants of Carbonic Acid in Seawater at Atmospheric Pressure. Limnol. Oceanogr. 1973, 18, 897–907. [Google Scholar] [CrossRef]
- Dickson, A.G.; Millero, F.J. A Comparison of the Equilibrium Constants for the Dissociation of Carbonic Acid in Seawater Media. Deep Sea Res. Part Oceanogr. Res. Pap. 1987, 34, 1733–1743. [Google Scholar] [CrossRef]
- Lueker, T.J.; Dickson, A.G.; Keeling, C.D. Ocean pCO2 Calculated from Dissolved Inorganic Carbon, Alkalinity, and Equations for K1 and K2: Validation Based on Laboratory Measurements of CO2 in Gas and Seawater at Equilibrium. Mar. Chem. 2000, 70, 105–119. [Google Scholar] [CrossRef]
- Dickson, A.G. Thermodynamics of the Dissociation of Boric Acid in Synthetic Seawater from 273.15 to 318.15 K. Deep Sea Res. Part Oceanogr. Res. Pap. 1990, 37, 755–766. [Google Scholar] [CrossRef]
- Lee, K.; Millero, F.J.; Byrne, R.H.; Feely, R.A.; Wanninkhof, R. The Recommended Dissociation Constants for Carbonic Acid in Seawater. Geophys. Res. Lett. 2000, 27, 229–232. [Google Scholar] [CrossRef]
- Wickham, H. Ggplot2; Use R!; Springer International Publishing: Cham, 2016; ISBN 978-3-319-24275-0. [Google Scholar]
- Mao, J.; Burdett, H.L.; McGill, R.A.R.; Newton, J.; Gulliver, P.; Kamenos, N.A. Carbon Burial over the Last Four Millennia Is Regulated by Both Climatic and Land Use Change. Glob. Change Biol. 2020, 26, 2496–2504. [Google Scholar] [CrossRef] [PubMed]
- Smith, S.; Mackenzie, F. The Role of CaCO3 Reactions in the Contemporary Oceanic CO2 Cycle. Aquat. Geochem. 2016, 22. [Google Scholar] [CrossRef]
- van der Heijden, L.H.; Kamenos, N.A. Reviews and Syntheses: Calculating the Global Contribution of Coralline Algae to Total Carbon Burial. Biogeosciences 2015, 12, 6429–6441. [Google Scholar] [CrossRef]
- Jury, C.P.; Bahr, K.D.; Cros, A.; Dobson, K.L.; Freel, E.B.; Graham, A.T.; McLachlan, R.H.; Nelson, C.E.; Price, J.T.; Rocha de Souza, M.; et al. Experimental Coral Reef Communities Transform yet Persist under Mitigated Future Ocean Warming and Acidification. Proc. Natl. Acad. Sci. 2024, 121, e2407112121. [Google Scholar] [CrossRef]
- Hilmi, N.; Chami, R.; Sutherland, M.D.; Hall-Spencer, J.M.; Lebleu, L.; Benitez, M.B.; Levin, L.A. The Role of Blue Carbon in Climate Change Mitigation and Carbon Stock Conservation. Front. Clim. 2021, 3. [Google Scholar] [CrossRef]
- Cyronak, T.; Mcmahon, A.; Eyre, B. Carbon Cycling Hysteresis in Permeable Carbonate Sands over a Diel Cycle: Implications for Ocean Acidification. Limnol. Oceanogr. 2013, 58, 131–143. [Google Scholar] [CrossRef]
- McMahon, A.; Santos, I.R.; Cyronak, T.; Eyre, B.D. Hysteresis between Coral Reef Calcification and the Seawater Aragonite Saturation State. Suppl. McMahon Al 2013 Hysteresis Coral Reef Calcif. Seawater Aragon. Satur. State Geophys. Res. Lett. 4017 4675-4679 Httpsdoiorg101002grl50802 2013.
- Bellwood, D.R.; Brandl, S.J.; McWilliam, M.; Streit, R.P.; Yan, H.F.; Tebbett, S.B. Studying Functions on Coral Reefs: Past Perspectives, Current Conundrums, and Future Potential. Coral Reefs 2024, 43, 281–297. [Google Scholar] [CrossRef]
- Hughes, T.P.; Barnes, M.L.; Bellwood, D.R.; Cinner, J.E.; Cumming, G.S.; Jackson, J.B.C.; Kleypas, J.; van de Leemput, I.A.; Lough, J.M.; Morrison, T.H.; et al. Coral Reefs in the Anthropocene. Nature 2017, 546, 82–90. [Google Scholar] [CrossRef] [PubMed]
- Sully, S.; Burkepile, D.E.; Donovan, M.K.; Hodgson, G.; van Woesik, R. A Global Analysis of Coral Bleaching over the Past Two Decades. Nat. Commun. 2019, 10, 1264. [Google Scholar] [CrossRef] [PubMed]
- Kayanne, H.; Hata, H.; Kudo, S.; Yamano, H.; Watanabe, A.; Ikeda, Y.; Nozaki, K.; Kato, K.; Negishi, A.; Saito, H. Seasonal and Bleaching-Induced Changes in Coral Reef Metabolism and CO2 Flux. Glob. Biogeochem. Cycles 2005, 19. [Google Scholar] [CrossRef]
- Kench, P.S.; Beetham, E.P.; Turner, T.; Morgan, K.M.; Owen, S.D.; McLean, R.F. Sustained Coral Reef Growth in the Critical Wave Dissipation Zone of a Maldivian Atoll. Commun. Earth Environ. 2022, 3, 1–12. [Google Scholar] [CrossRef]
Figure 1.
Type of organisms used in the experiments. A). Free-living non-geniculate calcifying coralline algae (CCA) from the barrier reef. B). Semispherical colonies of Siderastrea radians collected from a seagrass environment. C). In situ incubation setup with acrylic chambers. D). Acrylic chambers with free-living CCA specimens inside. E). Acrylic chambers with S. radians corals inside.
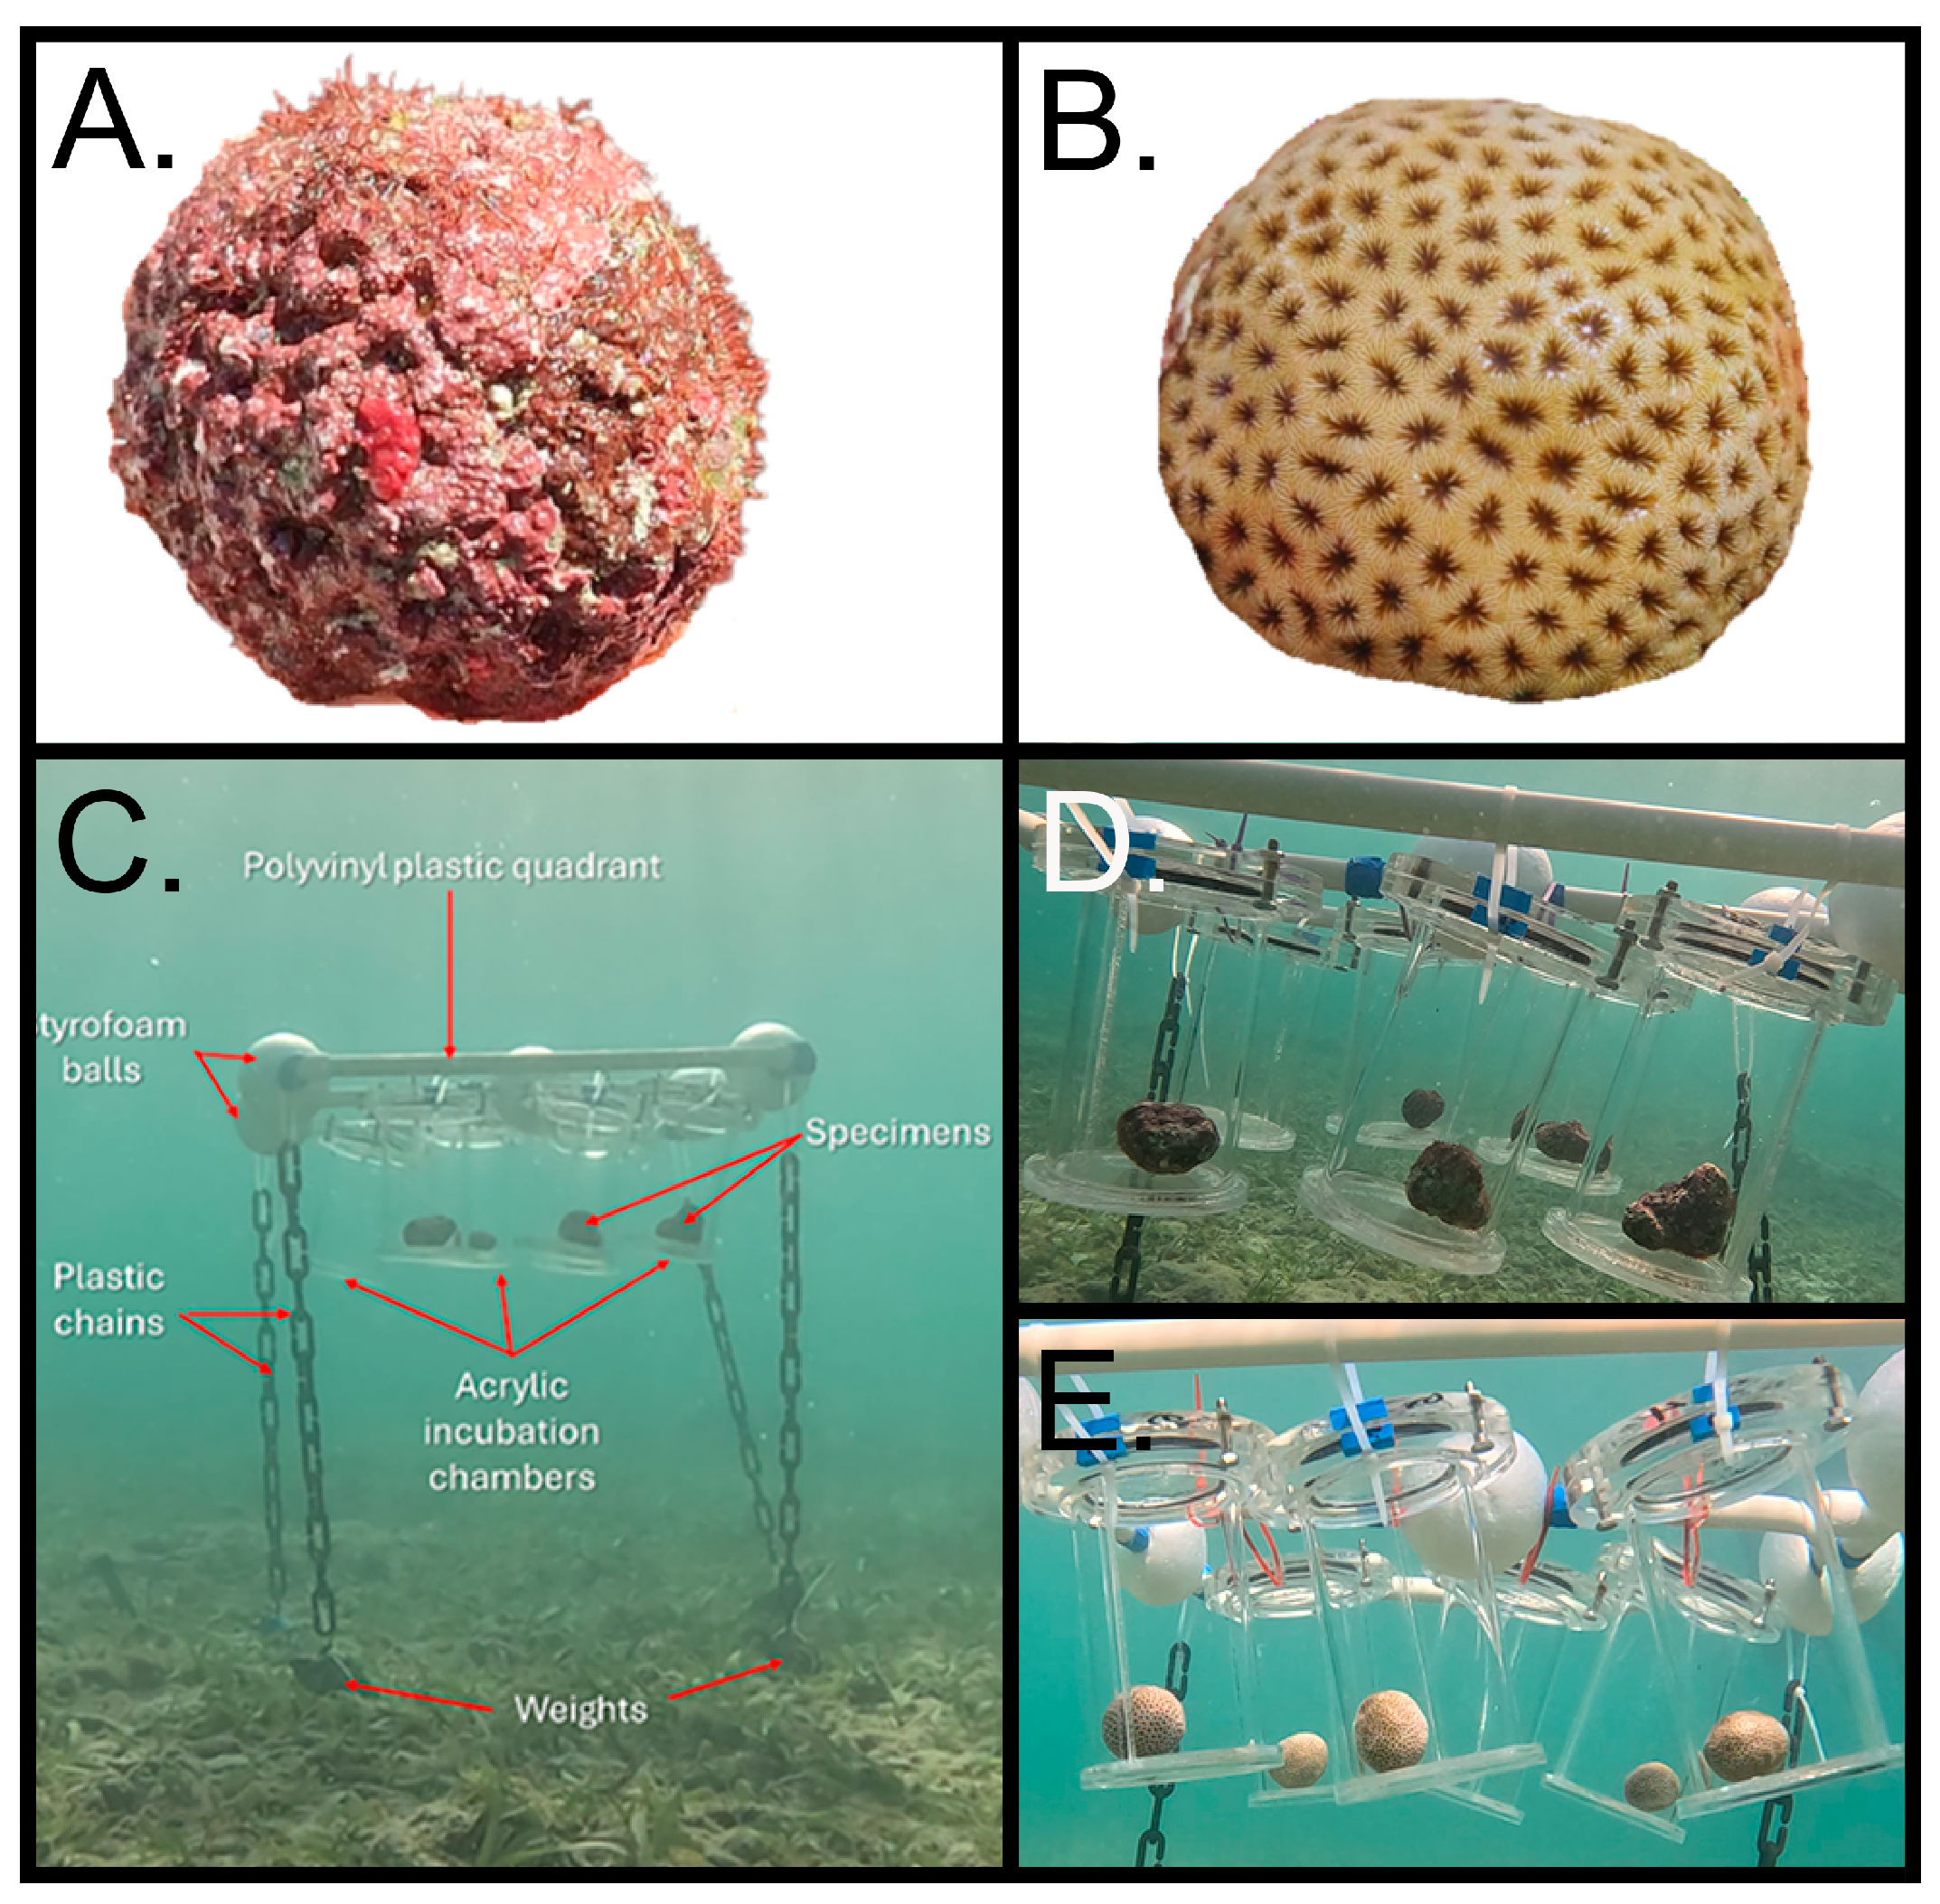
Figure 2.
Plots showing the values of seawater chemistry variables of A) total alkalinity (∆TA), B) dissolved inorganic carbon (∆DIC), C) bicarbonate (∆HCO3), D) carbon dioxide (∆CO2), E) carbonate (∆CO3) and F) dissolved oxygen (∆DO) for incubations at different times of the day (morning, afternoon, and night). Plots show median (horizonal bar with black circle) and IQR (whisker), mean (empty black circle) and Individual data points are represented as empty circles. x-axes show free-living CCA and corals.
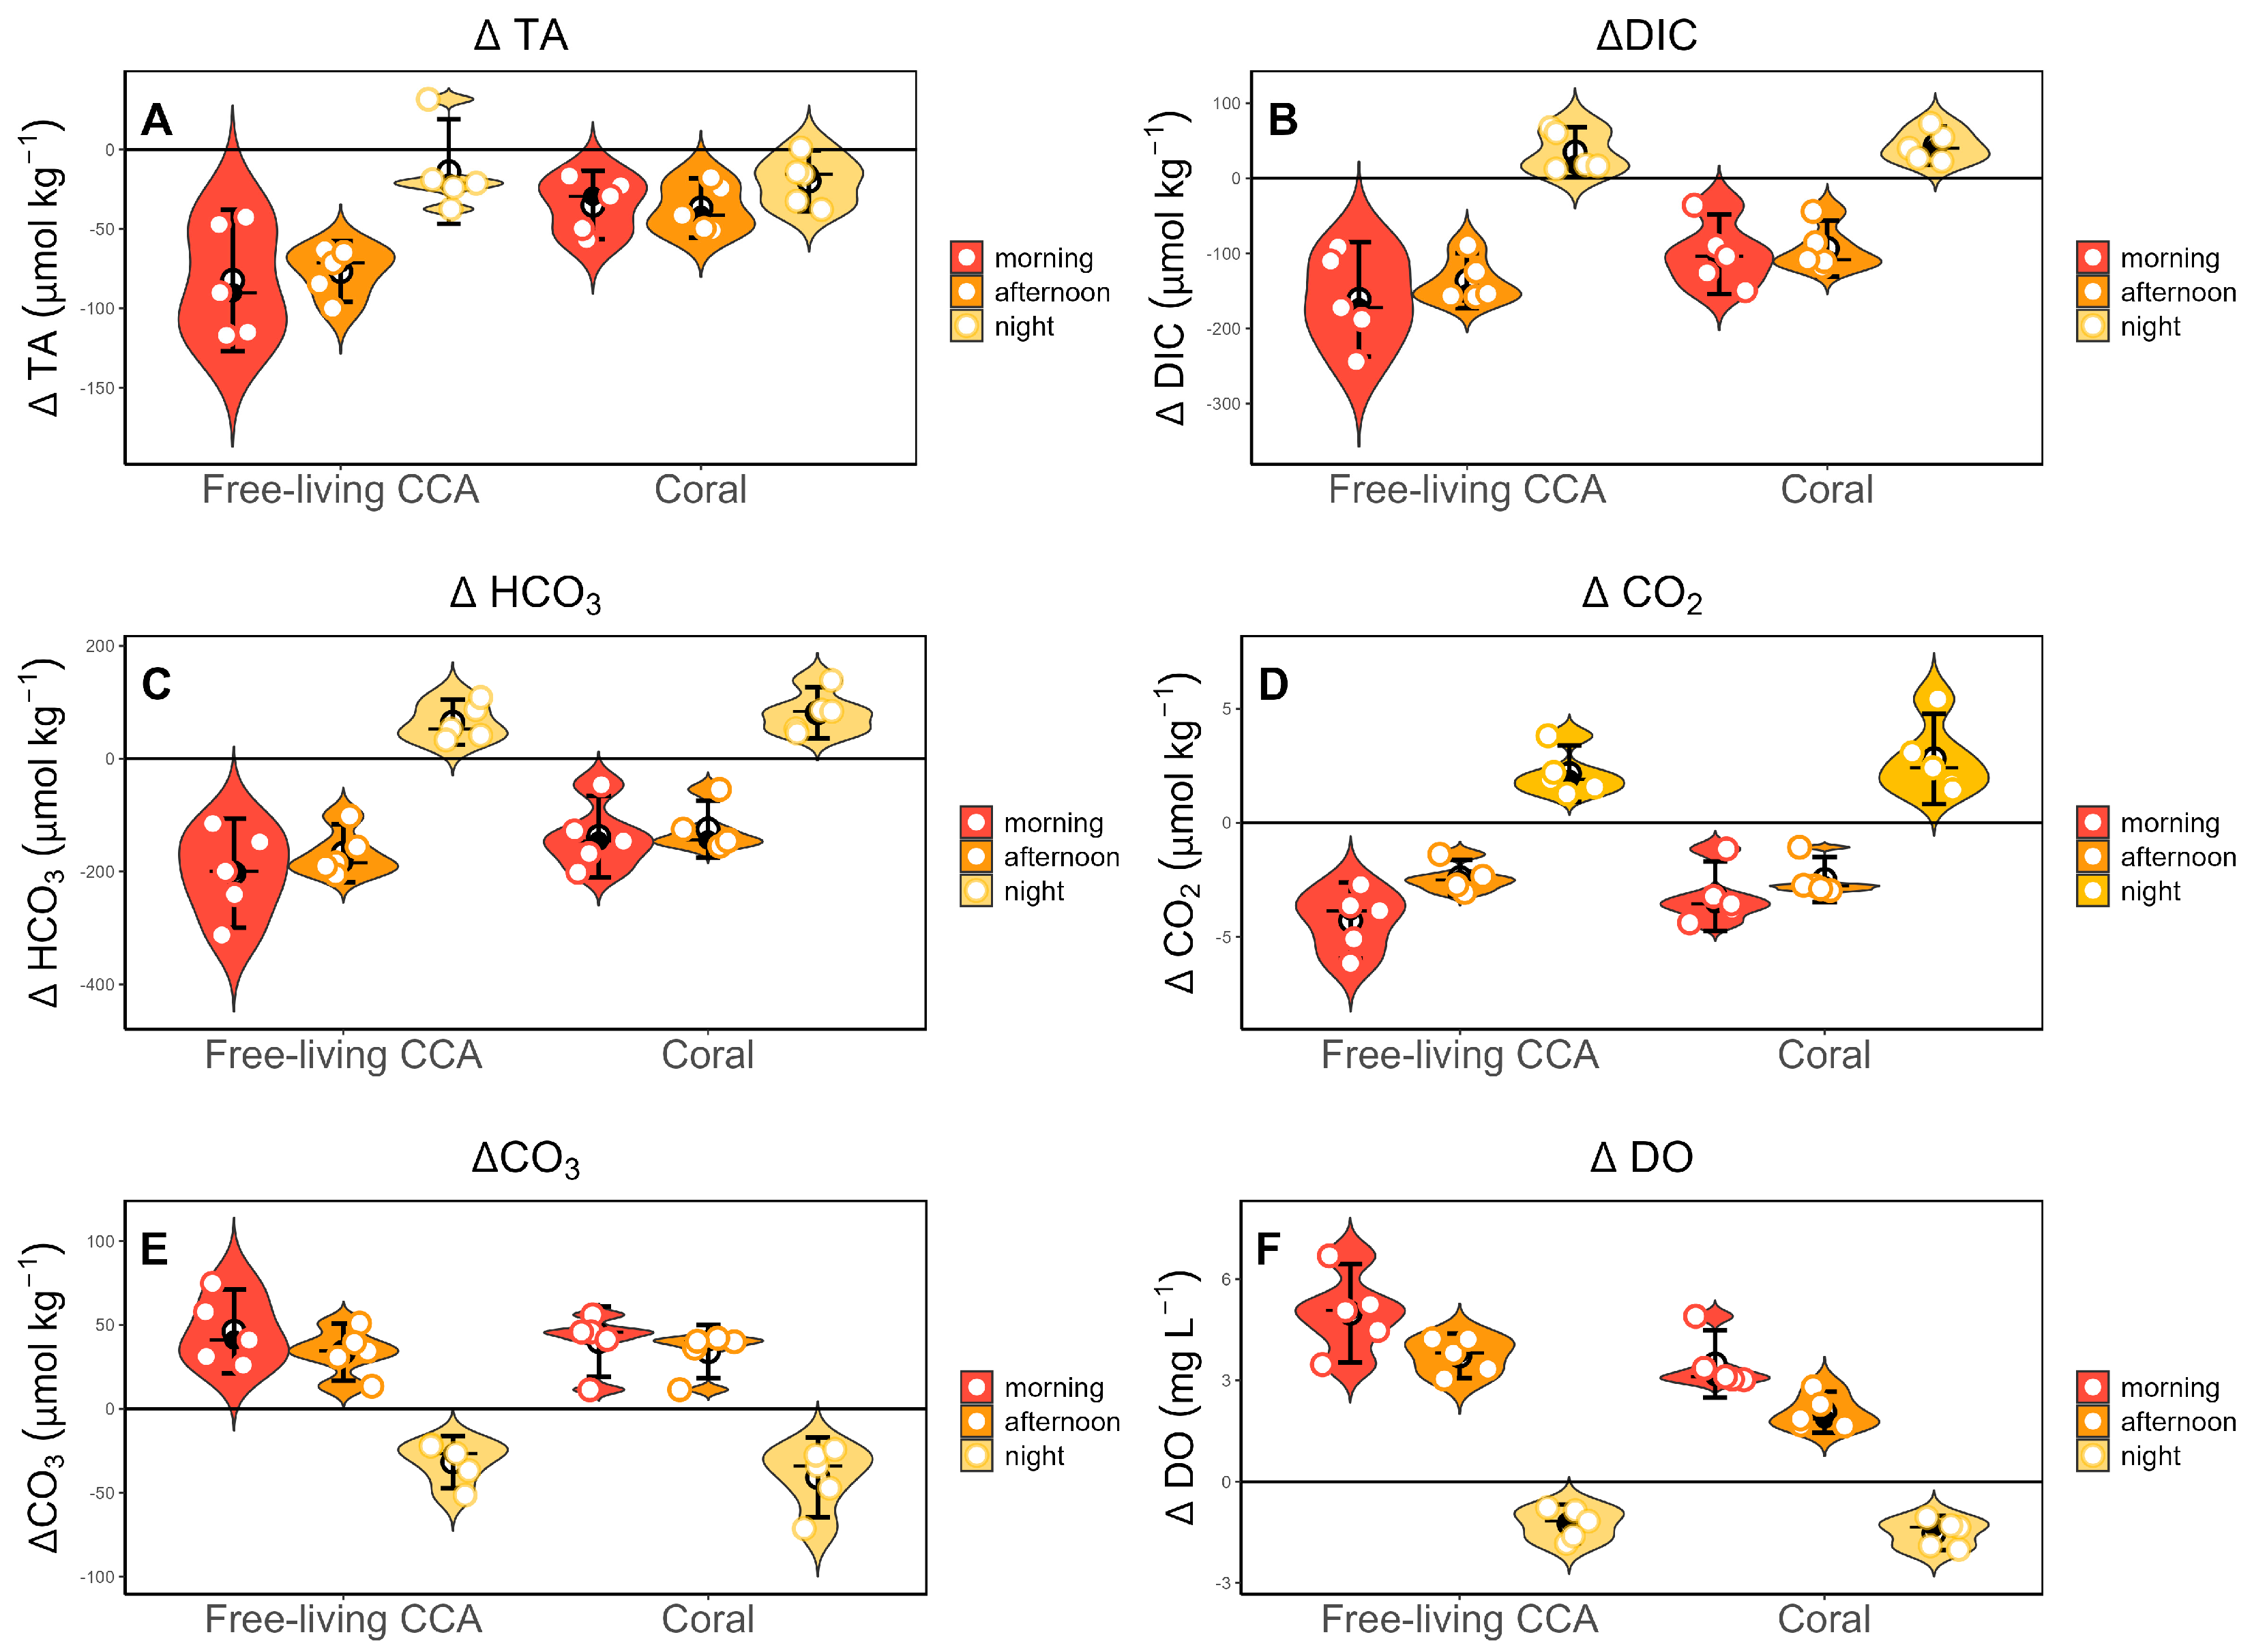
Figure 3.
Plots for metabolic rates at different times of day (morning, afternoon and night) in Free-living CCA and corals. A) rates of photosynthesis during the day and respiration at night as measured by oxygen changes (PDO: μmol C cm2 h-1) and B) net calcification (Gnet: μmol CaCO3 cm2 h-1) rates during the morning, afternoon and night. .
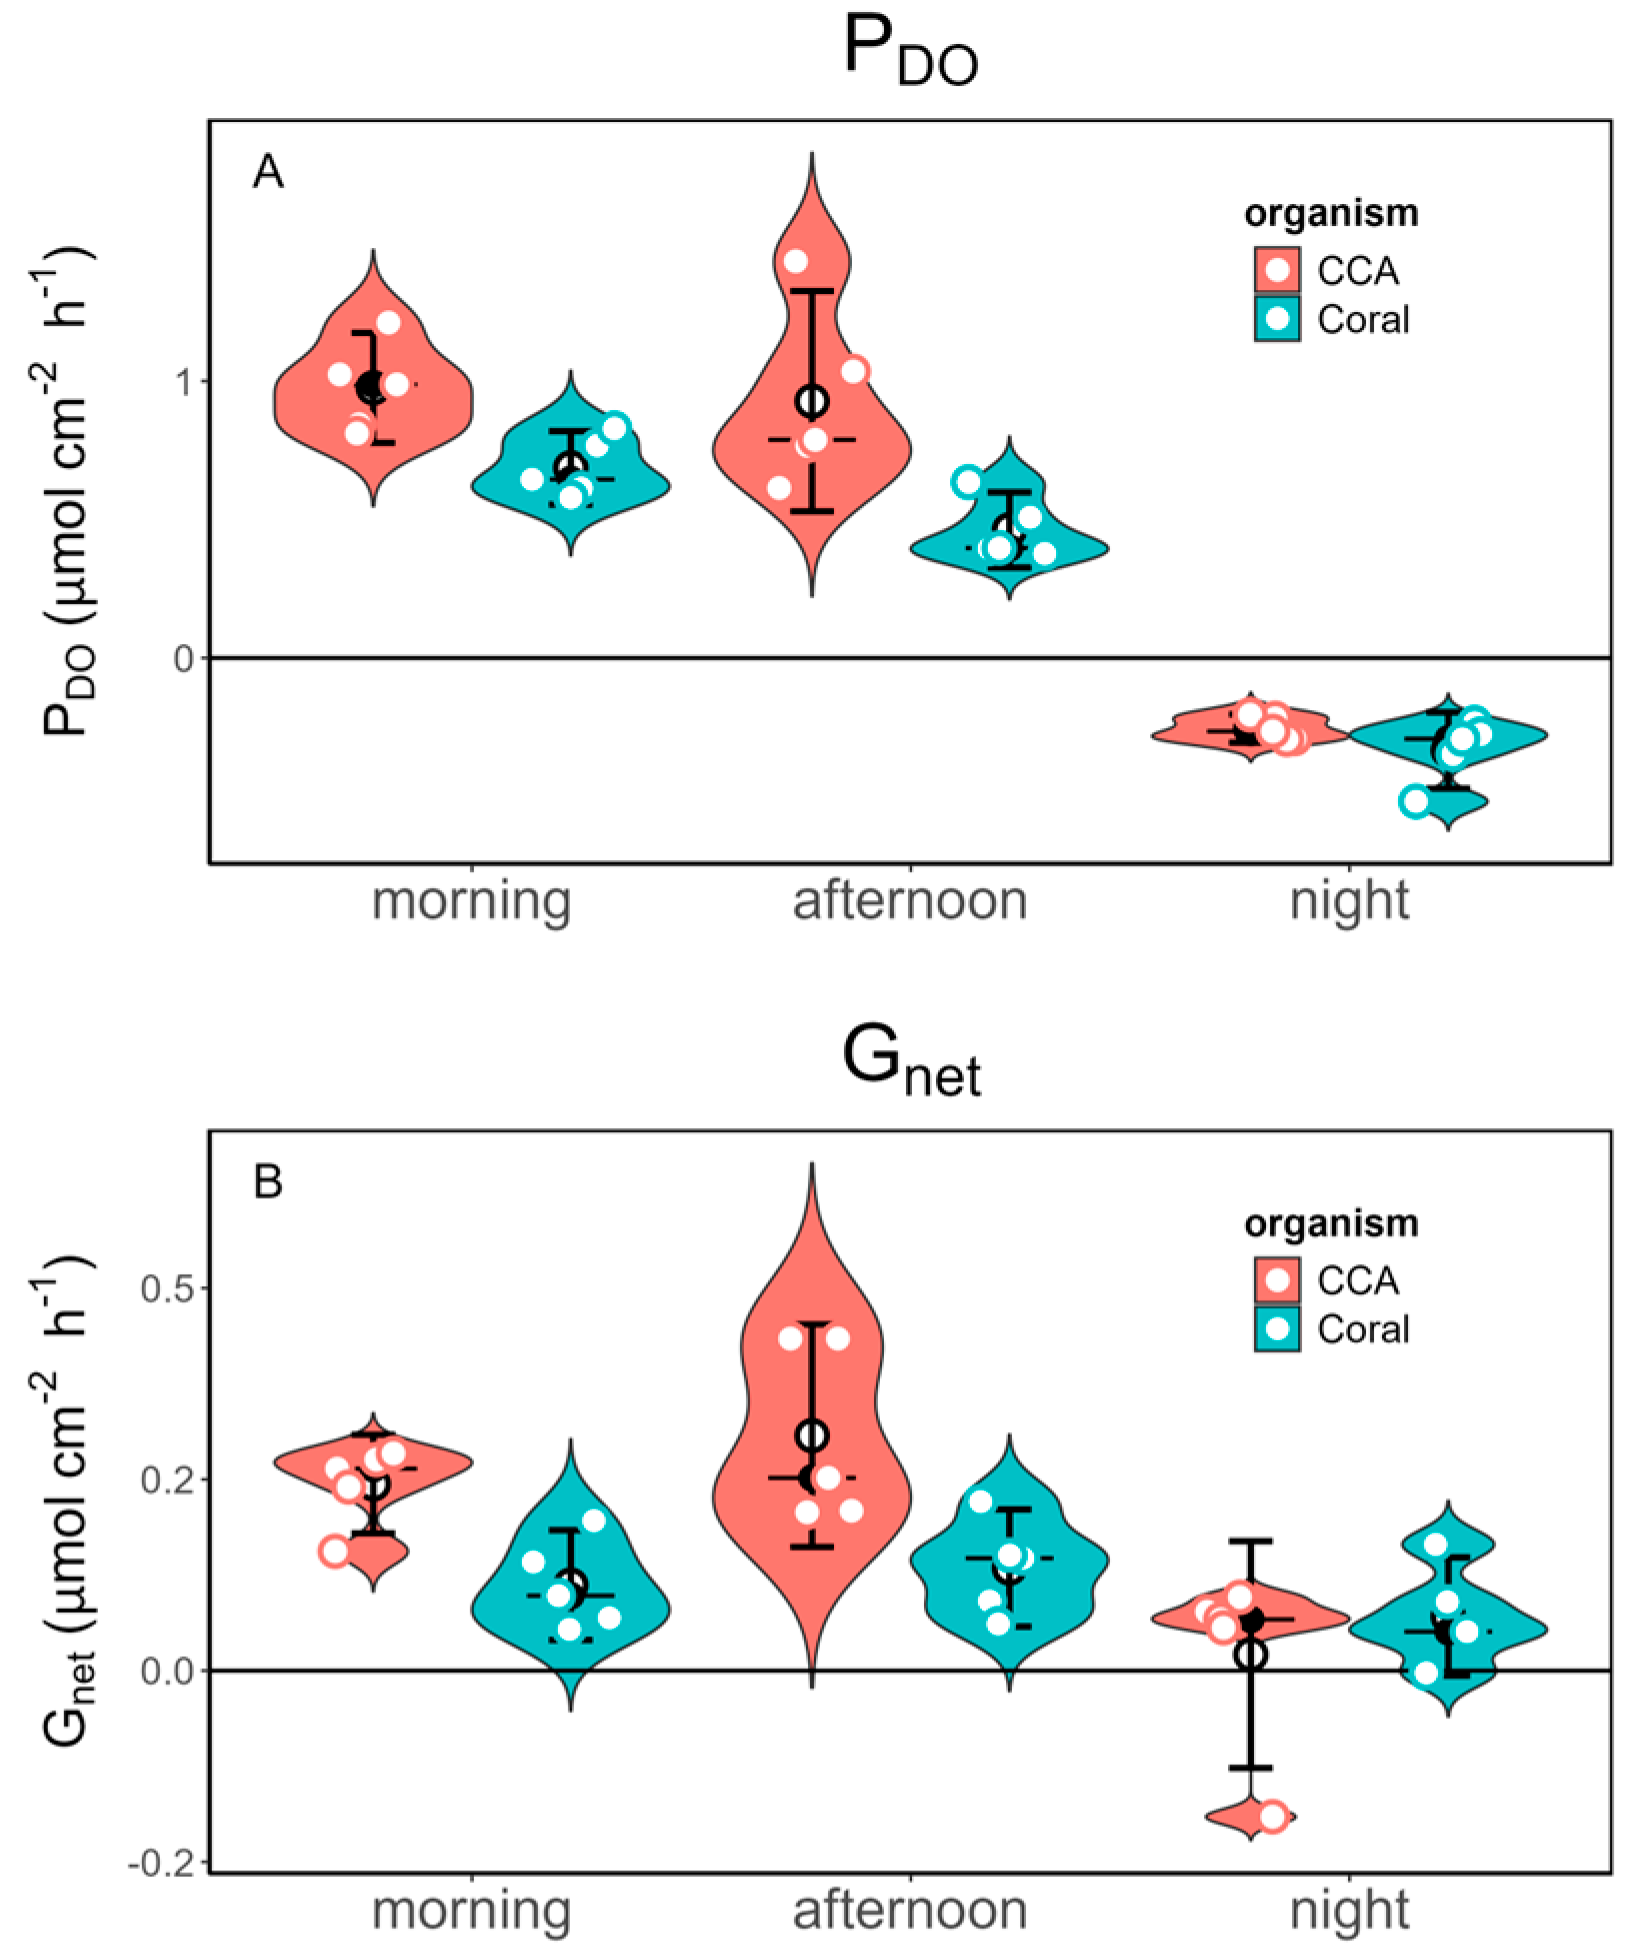
Figure 4.
Comparison of net fluxes of calcification rates Gnet and productivity through PDO between corals (left panels) and free-living CCA (right panels) during day (red box) and night (green box) periods. Photosynthesis and respiration were calculated from DO: PDO and RDO; light and dark calcification was calculated from changes in total alkalinity during light and dark incubations Gnet and Gdark.
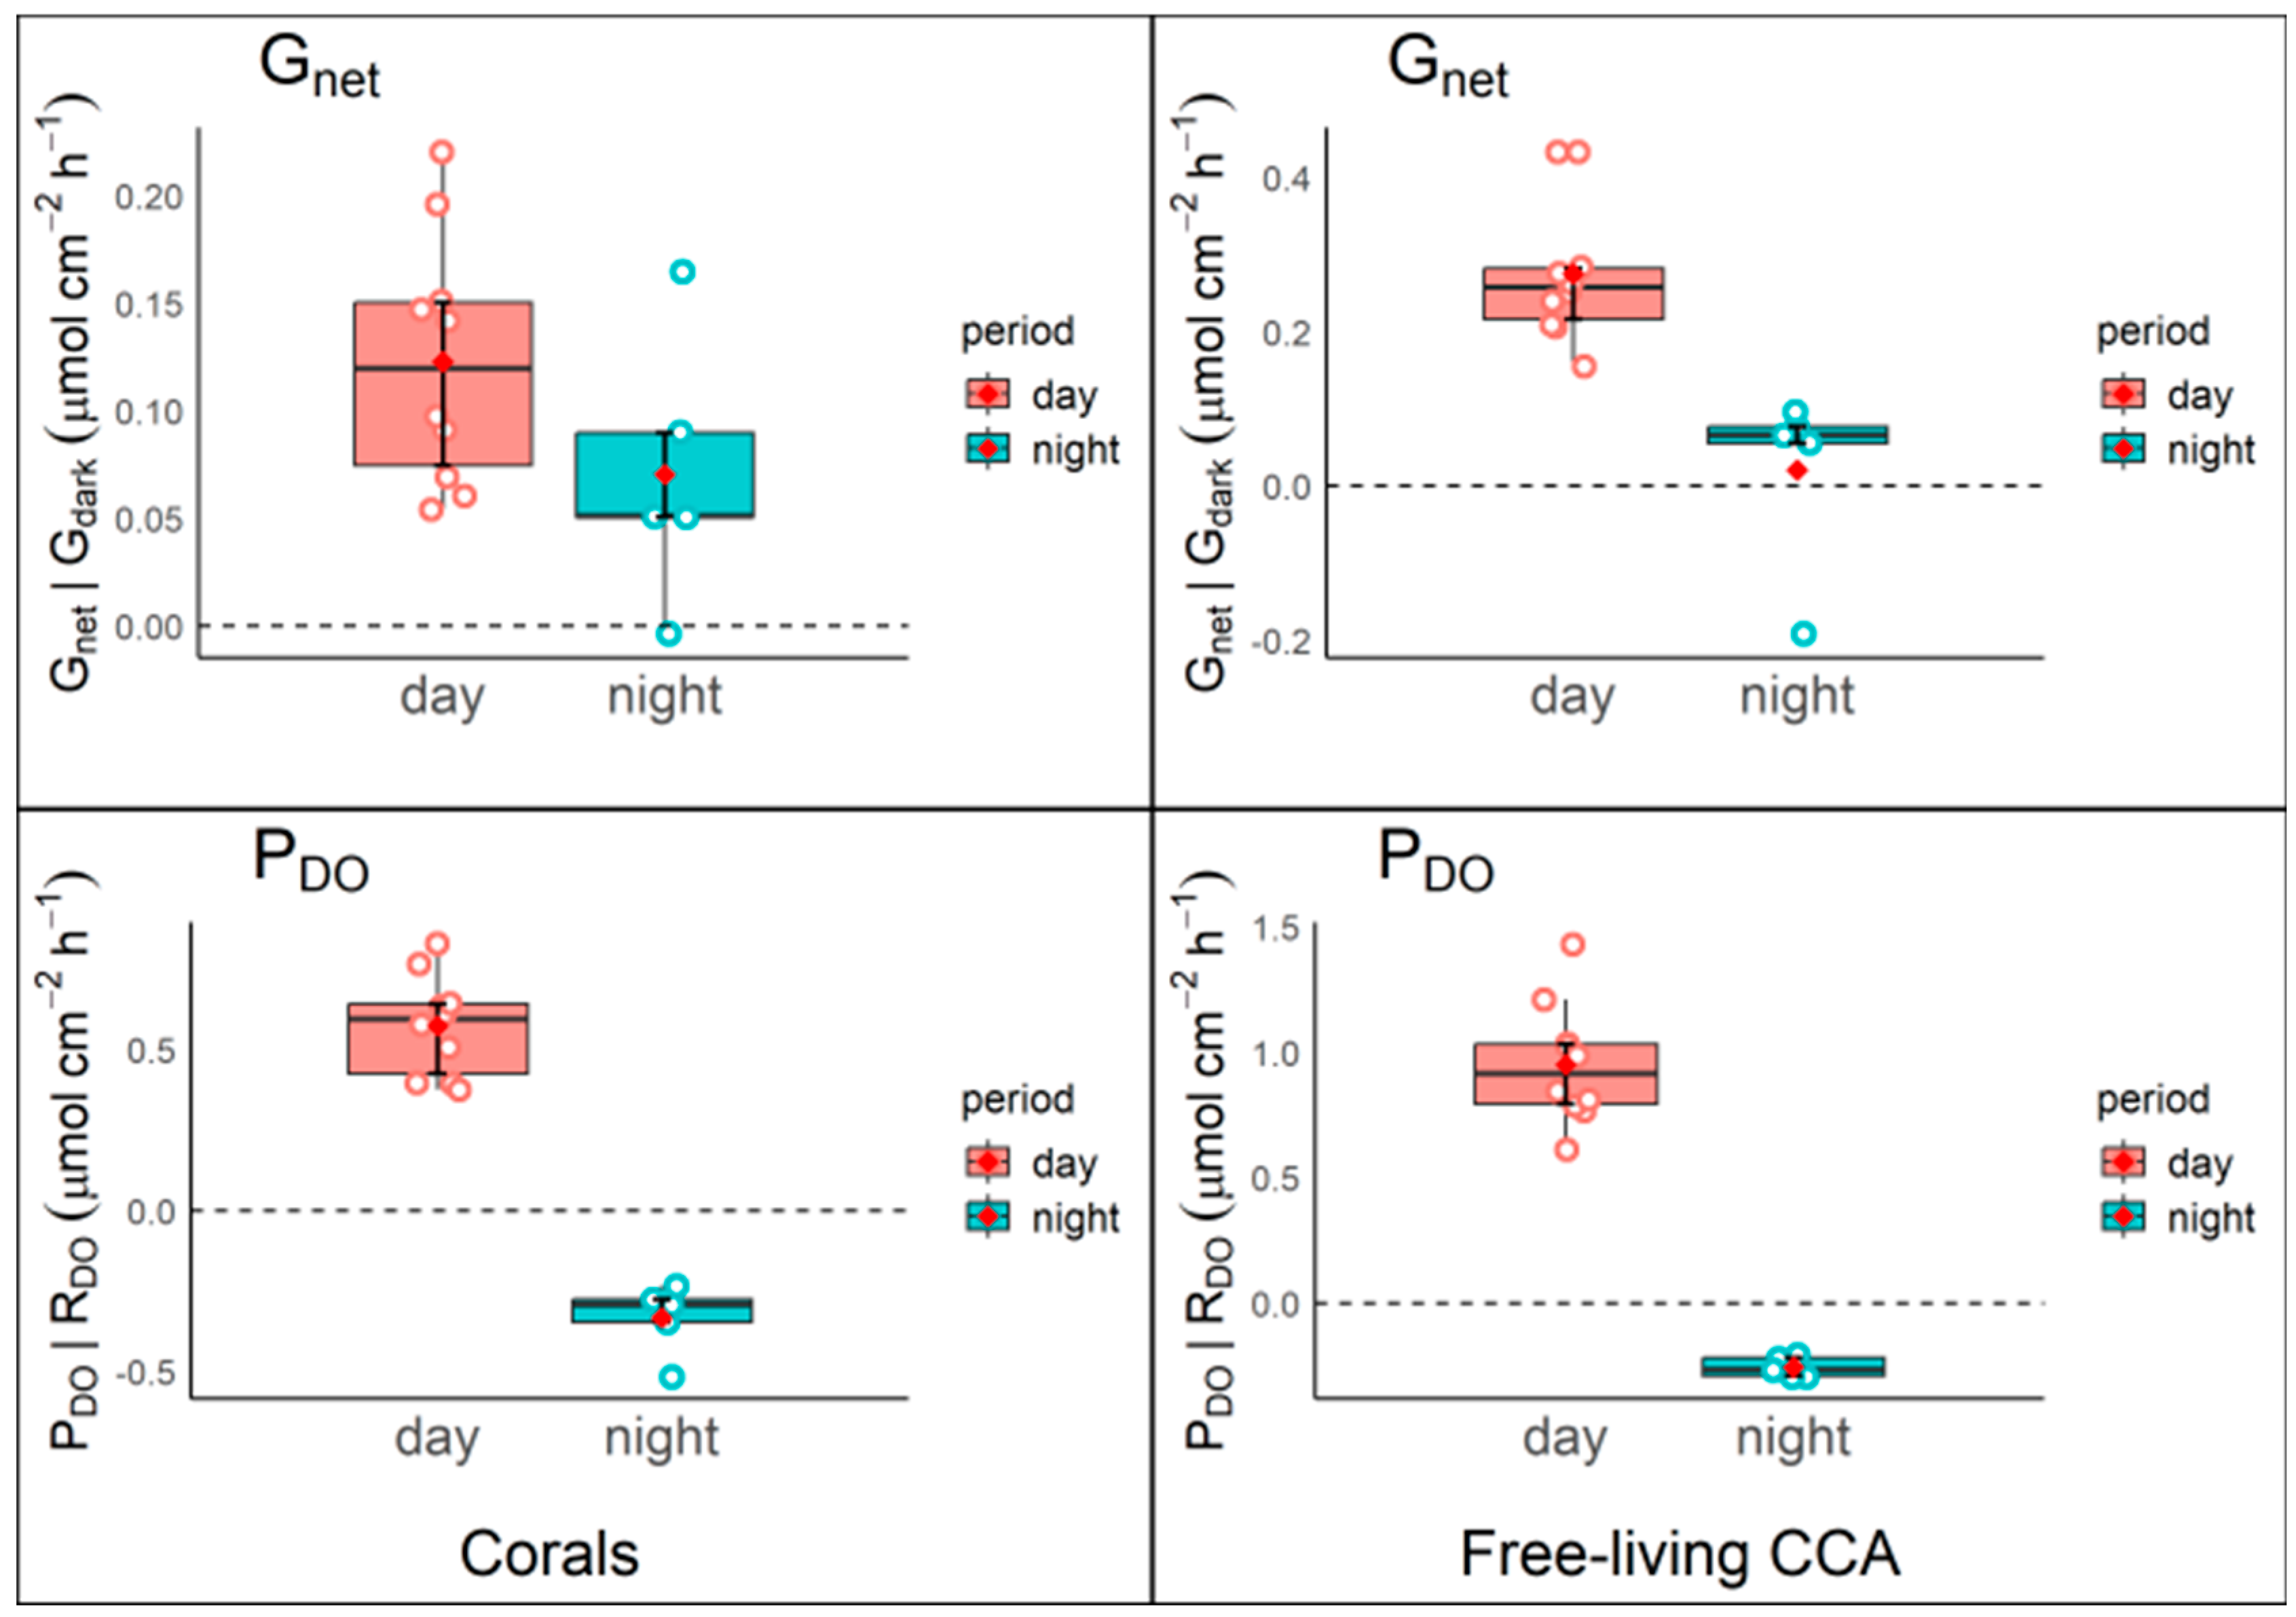
Figure 5.
Relationship between net calcification gain (Gnet in µmol of CaCO3 cm−2 h−1) and aragonite saturation (Ωarag) in free-living CCA and corals. The scatter plots display data for both organisms, with the fitted regression line and the 95% confidence interval represented by the shaded gray area. (A) Free-living (CCA) incubations, the linear regression equation is y = 0.16 x + -0.5 with an R² value of 0.35 (p = 0.02). (B) Coral incubations, regression equation y = 0.05 x + -0.08 with an R² value of 0.11 (p = 0.231).
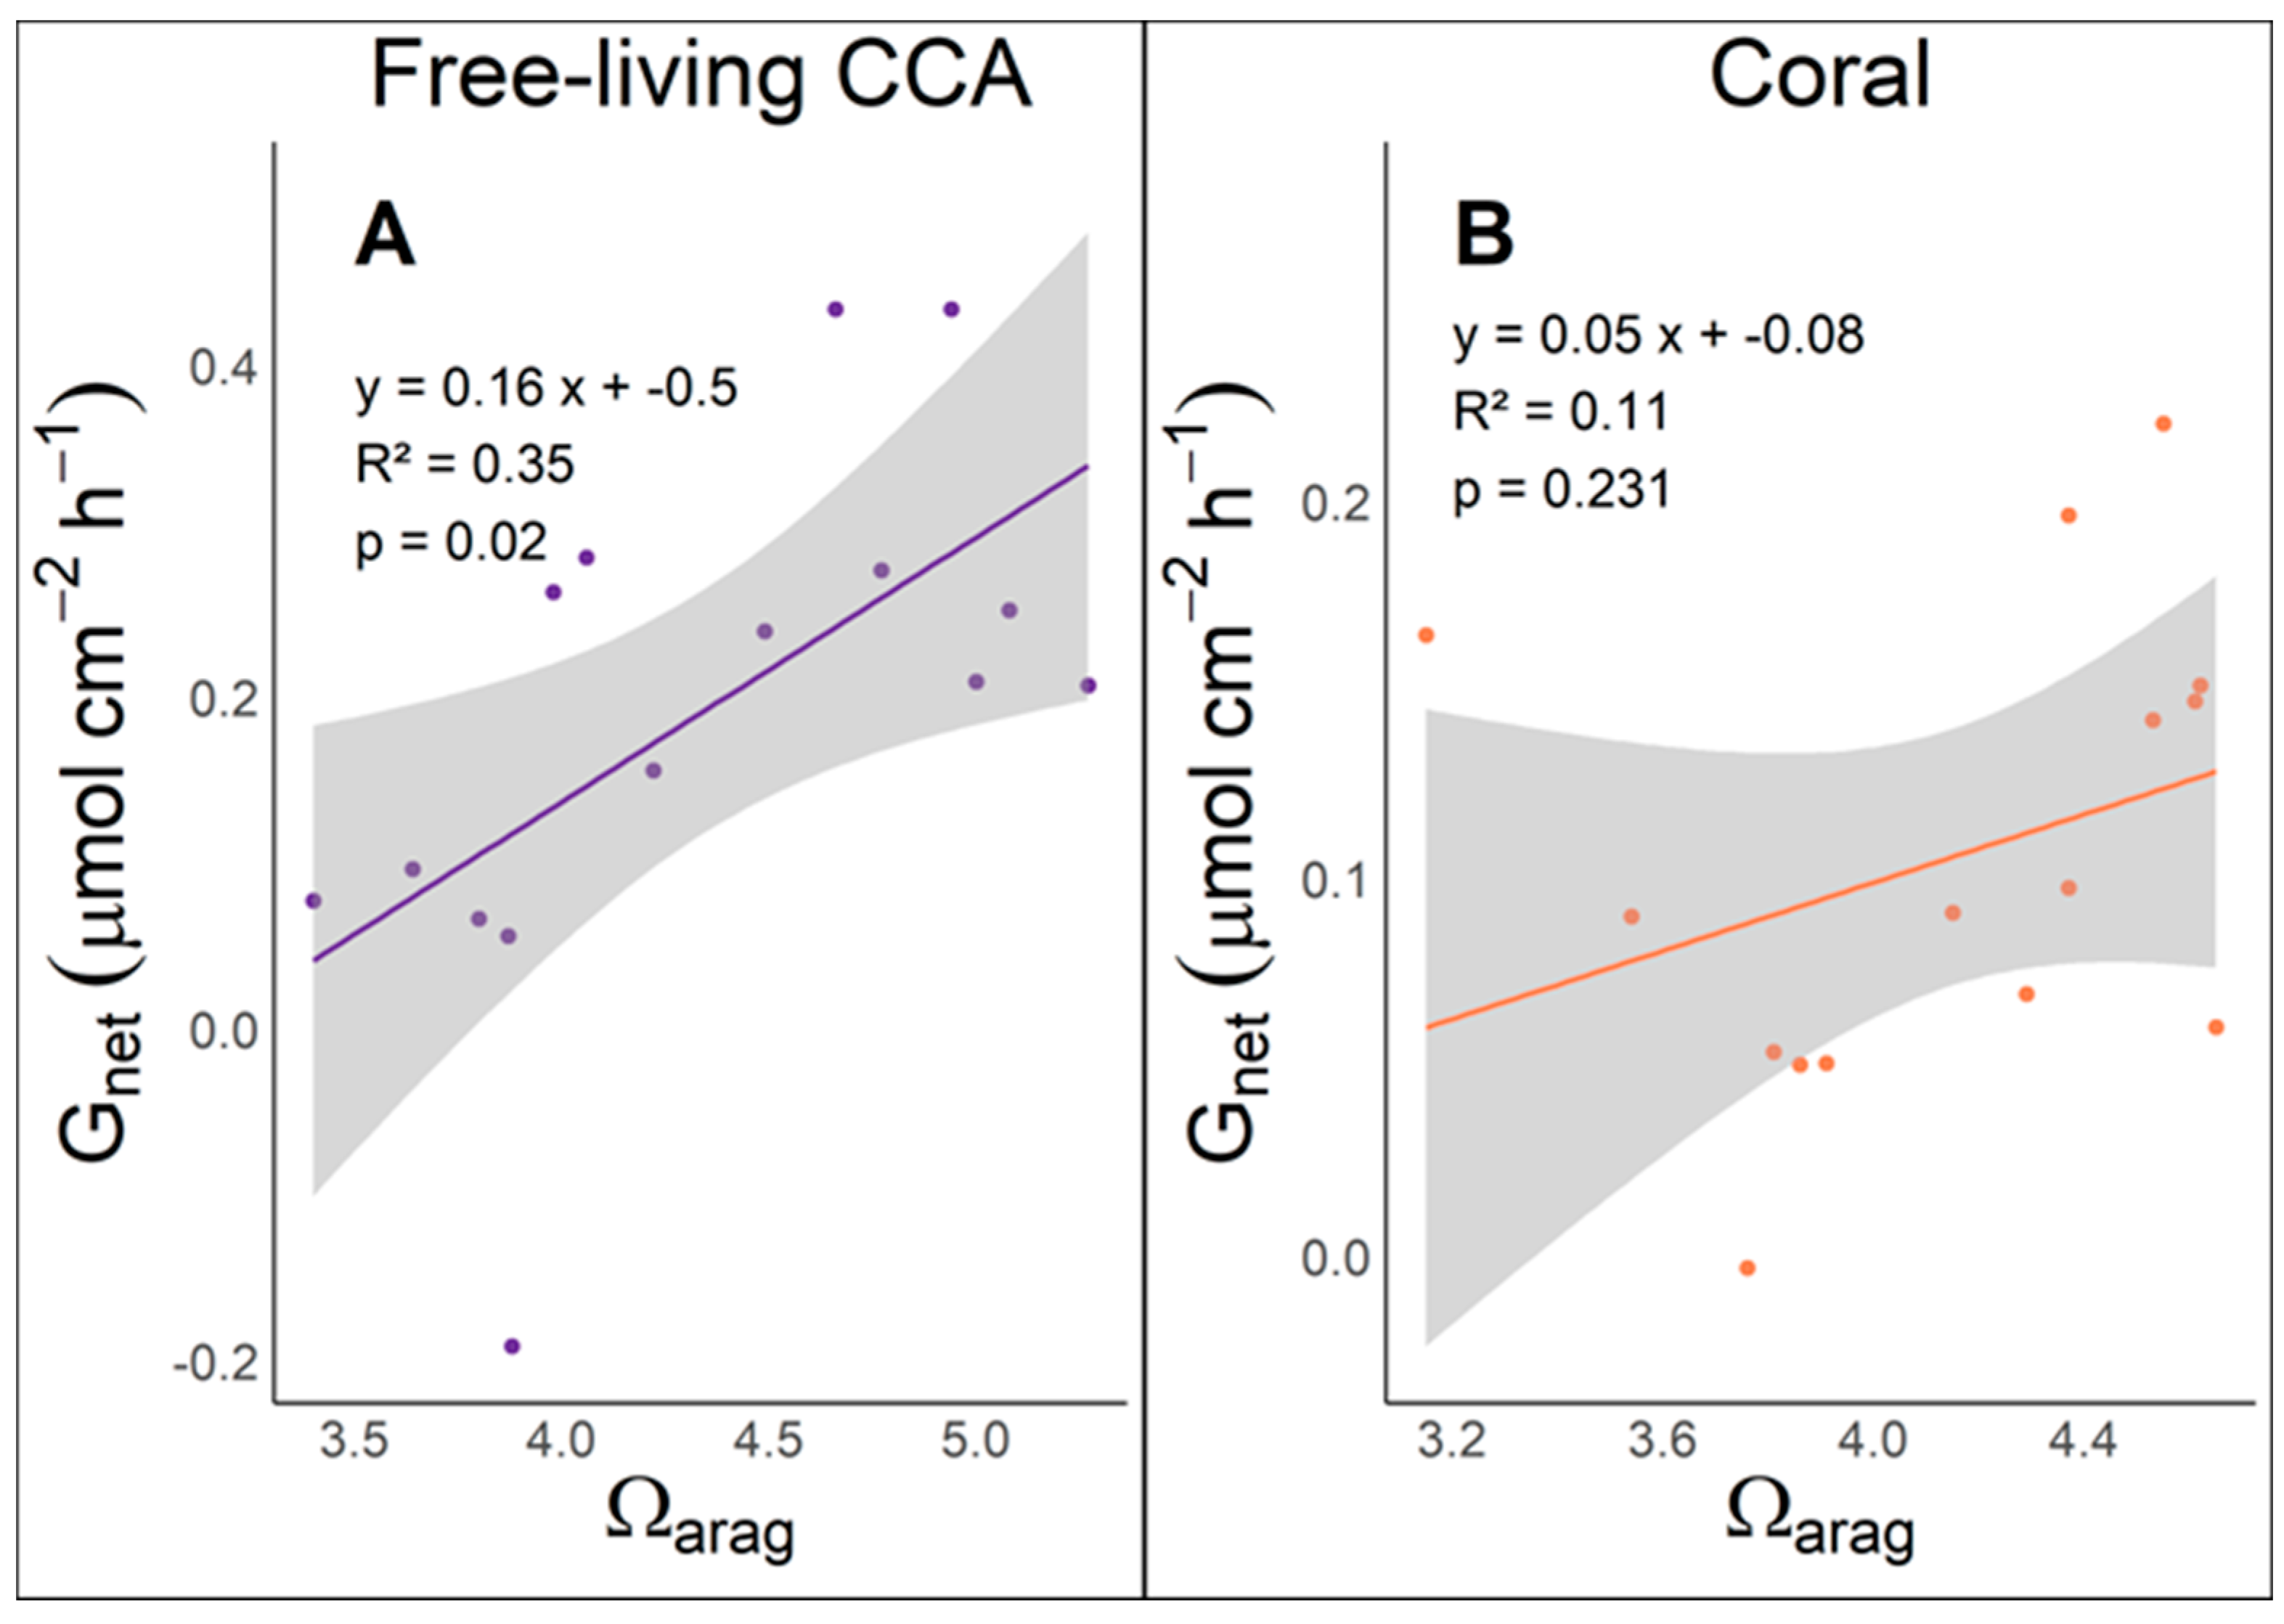
Figure 6.
Relationship between calcification rates Gnet and aragonite saturation state Ωarag in free-living CCA and corals throughout the diel cycle (morning, afternoon, and night). Free-living CCA (left panel), Corals (right panel).
Figure 6.
Relationship between calcification rates Gnet and aragonite saturation state Ωarag in free-living CCA and corals throughout the diel cycle (morning, afternoon, and night). Free-living CCA (left panel), Corals (right panel).
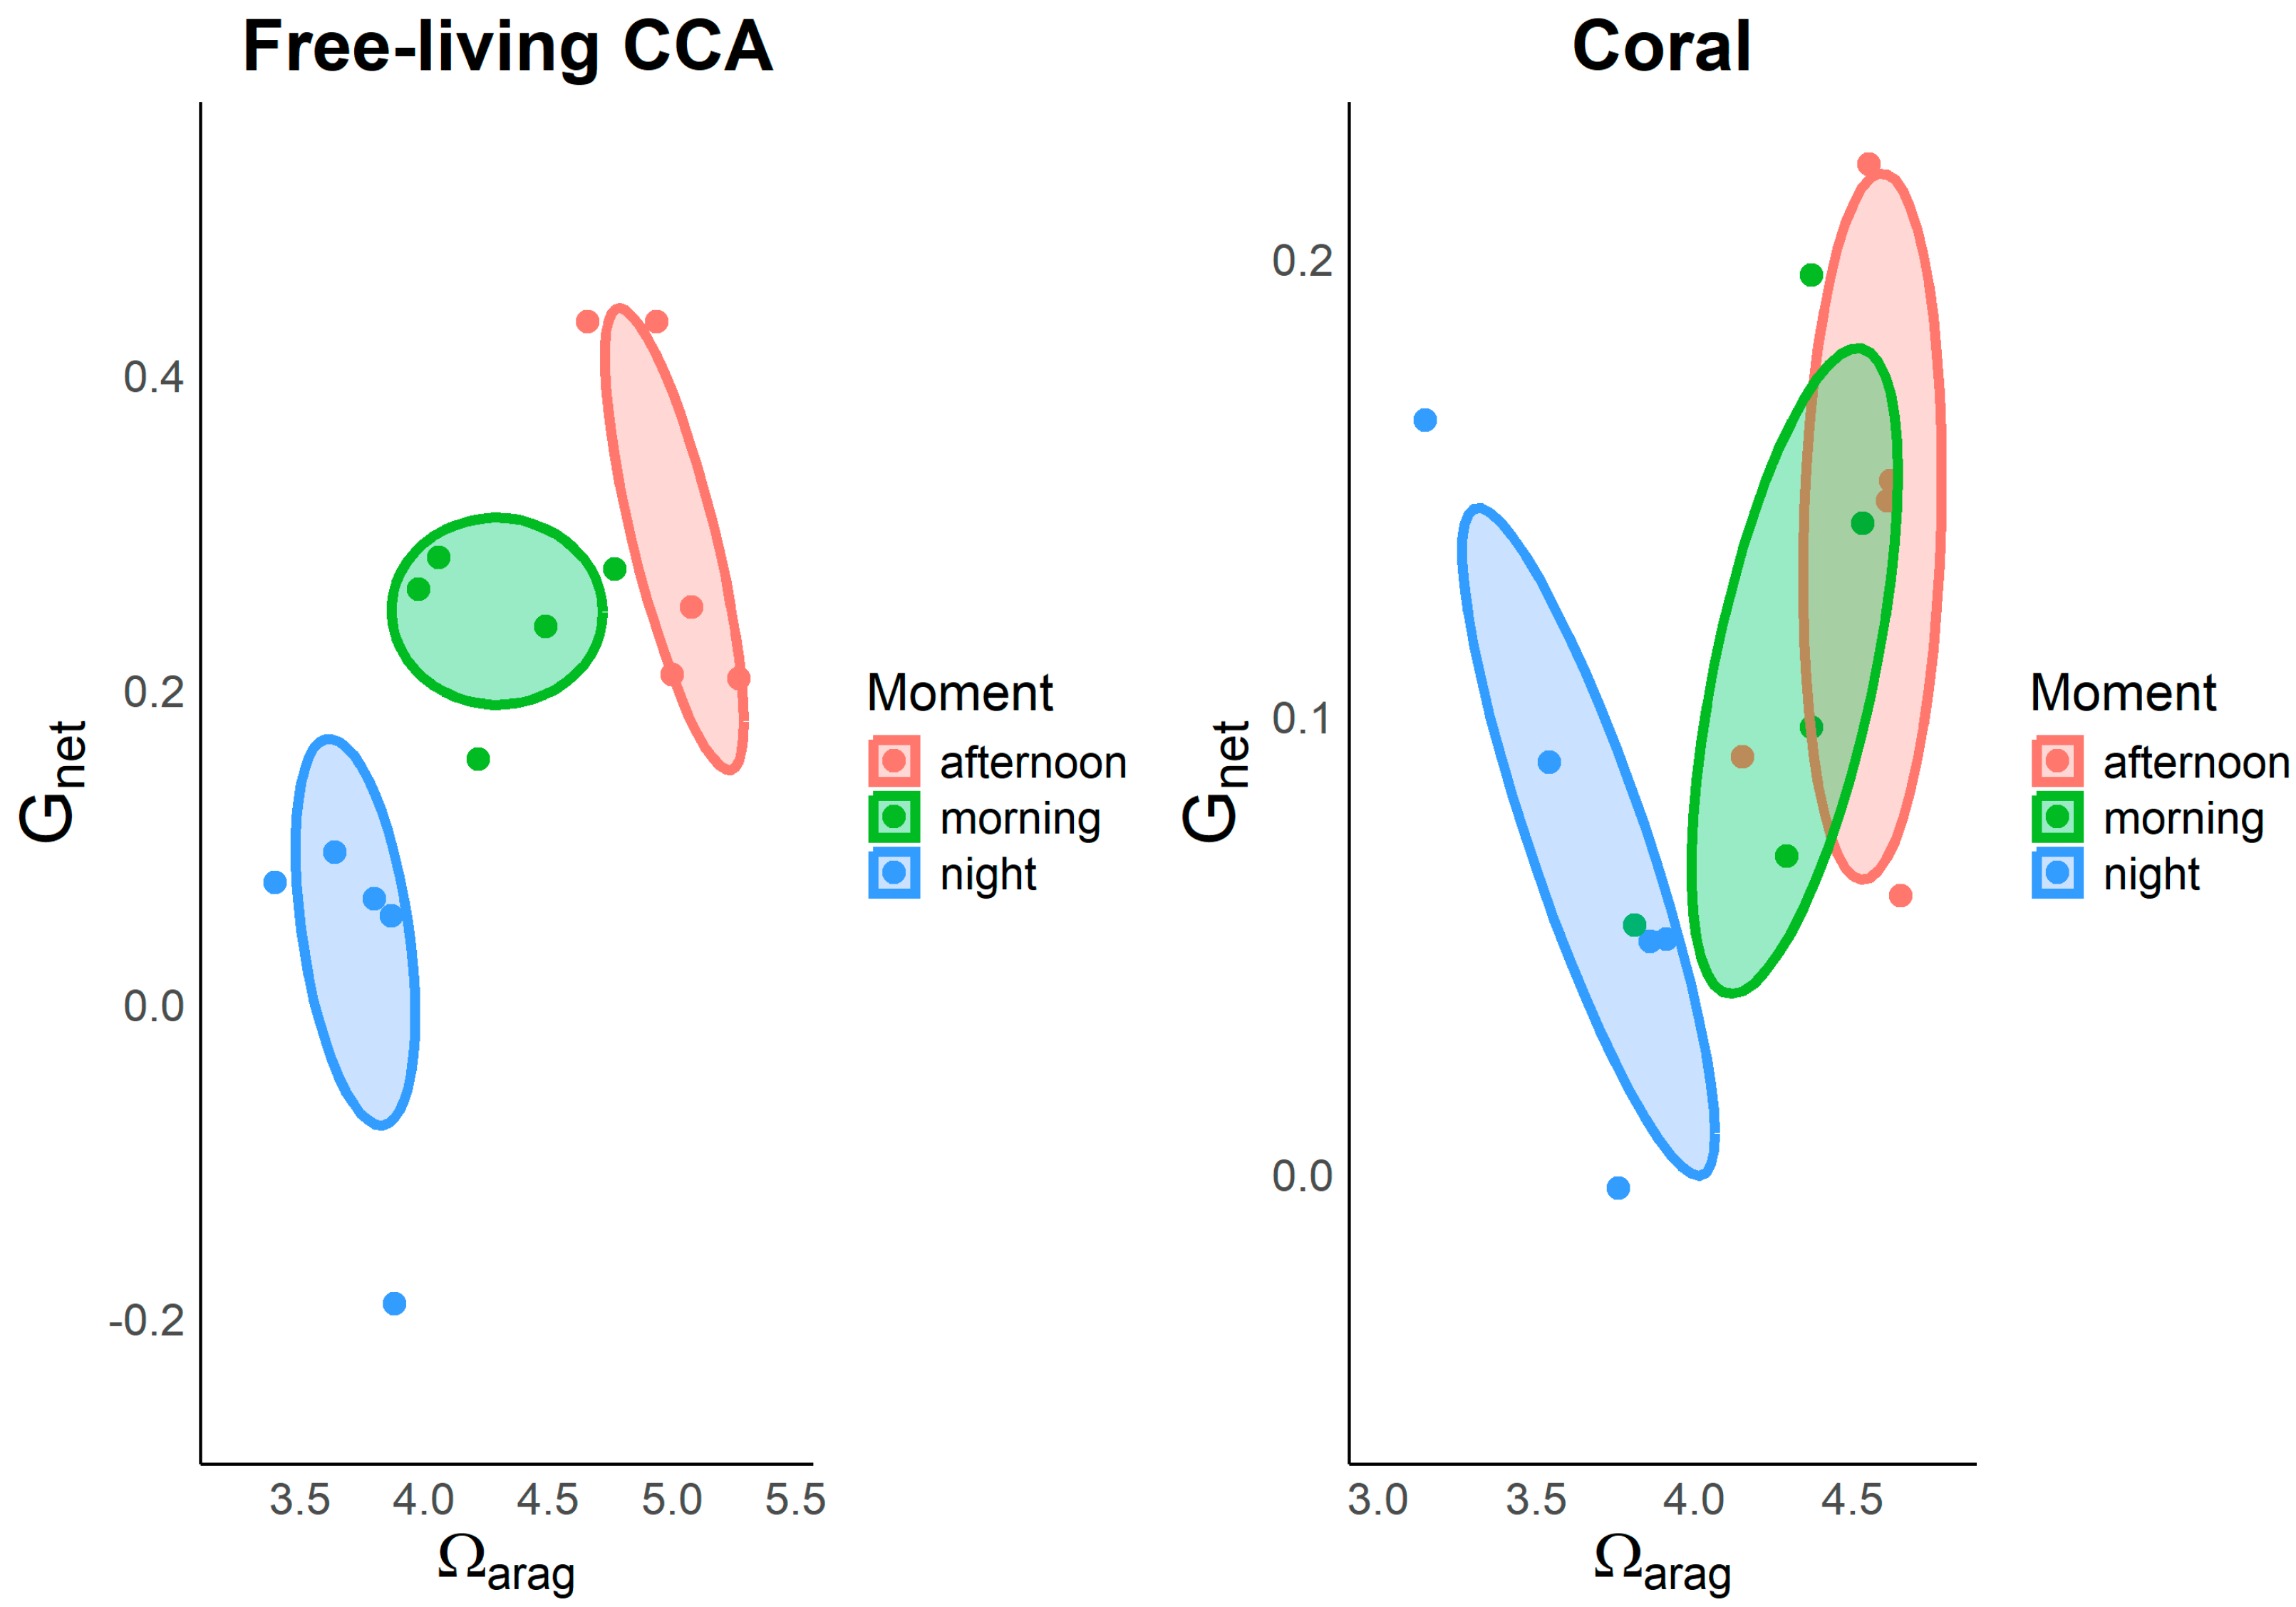

Table 1.
Physicochemical parameters (means and standard deviation SD) of seawater chemistry indicate the difference between the measurements taken at the end of the incubation period and the initial values (final – initial = ∆) of (total alkalinity ∆TA (µmol/kg-1), dissolved inorganic carbon ∆DIC (µmol/kg-1), bicarbonate ∆HCO3 (µmol/kg-1), carbon dioxide ∆CO2 (µmol/kg-1), carbonate ∆CO3 (µmol/kg-1) and dissolved oxygen ∆DO (mg L-1)) for free-living CCA and corals at different times of day, morning, afternoon and night.
| Organism | Time of the day | Temp ◦C | Sal | pHT | Surface area (cm2) | ∆TA (µmol/kg-1) |
∆DIC (µmol/kg-1) |
∆HCO3 (µmol/kg-1) |
∆CO2 (µmol/kg-1) |
∆CO3 (µmol/kg-1) |
∆DO (mg L-1) |
||||||
|---|---|---|---|---|---|---|---|---|---|---|---|---|---|---|---|---|---|
| Mean | SD | Mean | SD | Mean | SD | Mean | SD | Mean | SD | Mean | SD | ||||||
| Free-living CCA | morning | 29,9 | 36,0 | 8,1 | 66,7 | -82,4 | 35,8 | -161,1 | 61,5 | -203,0 | 77,9 | -4,3 | 1,3 | 46,2 | 20,1 | 5,0 | 1,2 |
| afternoon | 30,5 | 36,0 | 8,2 | 66,7 | -76,7 | 15,4 | -136,3 | 29,7 | -167,7 | 41,1 | -2,4 | 0,6 | 33,9 | 13,7 | 3,7 | 0,5 | |
| night | 30,3 | 36,0 | 8,0 | 66,7 | -14,0 | 26,5 | 35,0 | 26,8 | 64,6 | 32,0 | 2,2 | 1,0 | -31,7 | 12,6 | -1,2 | 0,5 | |
| Coral | morning | 29,9 | 36,0 | 8,1 | 62,8 | -35,1 | 17,4 | -101,0 | 42,8 | -137,9 | 58,1 | -3,2 | 1,2 | 40,1 | 16,9 | 3,5 | 0,8 |
| afternoon | 30,7 | 36,0 | 8,1 | 62,8 | -36,8 | 15,0 | -93,3 | 30,1 | -124,9 | 40,8 | -2,5 | 0,8 | 34,0 | 12,8 | 2,1 | 0,5 | |
| night | 30,3 | 36,0 | 8,0 | 62,8 | -19,8 | 15,5 | 43,4 | 20,6 | 81,4 | 36,8 | 2,8 | 1,6 | -40,9 | 19,2 | -1,5 | 0,4 | |
Table 2.
Output of Multivariate Analysis of Variance (MANOVA) tests regarding delta of several dependent variables as physicochemical parameters (∆TA, ∆DIC, ∆HCO3, ∆CO2, ∆CO3 and ∆DO) of seawater and photosynthesis measured by oxygen changes (PDO), and calcification (Gnet) rates between type of organisms and time of day as independent variables. Df (Degrees of Freedom), Sum Sq (Sum of Squares), Mean Sq (Mean Square), F value, p (p-value), Significance codes (SC): <0.001 ‘***’, 0.001 ‘**’, 0.01 ‘*’.
| Dependent variables | Independent variables and interaction | Df | Sum Sq | Mean Sq | F | p | SC |
|---|---|---|---|---|---|---|---|
| ∆TA | Organism | 1 | 5519.8 | 5519.8 | 11.076 | 0.003 | ** |
| Time of day | 2 | 11136.5 | 5568.3 | 11.174 | < 0.001 | *** | |
| Interaction | 2 | 4145.8 | 2072.9 | 4.159 | 0.028 | * | |
| ∆DIC | Organism | 1 | 10355 | 10355 | 7.271 | 0.013 | * |
| Time of day | 2 | 176563 | 88281 | 61.992 | < 0.001 | *** | |
| Interaction | 2 | 3485 | 1742 | 1.223 | 0.312 | ||
| ∆HCO3 | Organism | 1 | 13001 | 13001 | 5.140 | 0.033 | * |
| Time of day | 2 | 359792 | 179896 | 71.130 | < 0.001 | *** | |
| Interaction | 2 | 2922 | 1461 | 0.577 | 0.569 | ||
| ∆CO3 | Organism | 1 | 189 | 189.4 | 0.725 | 0.403 | |
| Time of day | 2 | 37740 | 18870.2 | 72.285 | < 0.001 | *** | |
| Interaction | 2 | 113 | 56.7 | 0.217 | 0.806 | ||
| ∆CO2 | Organism | 1 | 2.254 | 2.254 | 1.716 | 0.203 | |
| Time of day | 2 | 216.007 | 108.004 | 82.265 | < 0.001 | *** | |
| Interaction | 2 | 1.702 | 0.851 | 0.648 | 0.5318 | ||
| ∆DO | Organism | 1 | 9698 | 9698 | 20.321 | < 0.001 | *** |
| Time of day | 2 | 168498 | 84249 | 176.543 | < 0.001 | *** | |
| Interaction | 2 | 2835 | 1417 | 2.969 | 0.070 | ||
| PDO | Organism | 1 | 0.5782 | 0.5782 | 20.953 | < 0.001 | *** |
| Time of day | 2 | 7.5425 | 3.7712 | 136.654 | < 0.001 | *** | |
| Interaction | 2 | 0.1867 | 0.0934 | 3.383 | 0.051 | ||
| Gnet | Organism | 1 | 0.054 | 0.054 | 7.823 | < 0.01 | ** |
| Time of day | 2 | 0.166 | 0.083 | 11.948 | < 0.001 | *** | |
| Interaction | 2 | 0.070 | 0.035 | 5.062 | 0.015 | * |
Table 3.
Means and standard deviations SD of net productivity (PDO) and calcification (Gnet) rates of free-living CCA and corals across different times of the day.
Table 3.
Means and standard deviations SD of net productivity (PDO) and calcification (Gnet) rates of free-living CCA and corals across different times of the day.
| Organism | Time of the day | Net Productivity | Net Calcification | ||
|---|---|---|---|---|---|
| PDO (μmol C cm2 h-1) | Gnet (μmol CaCO3 cm2 h-1) | ||||
| Mean | SD | Mean | SD | ||
| Free-living CCA | morning | 0.975 | 0.2 | 0.243 | 0.1 |
| afternoon | 0.927 | 0.3 | 0.307 | 0.1 | |
| night | -0.254 | 0.0 | 0.020 | 0.1 | |
| Coral | morning | 0.686 | 0.1 | 0.134 | 0,1 |
| afternoon | 0.462 | 0.1 | 0.111 | 0,1 | |
| night | -0,333 | 0.1 | 0.070 | 0,1 | |
Table 4.
Day and night variation of net productivity PDO and calcification Gnet in free-living CCA and corals. day means include morning and afternoon data, net (day mean – nigh mean), %: comparative differences between free-living CCA and corals in net productivity and net calcification.
Table 4.
Day and night variation of net productivity PDO and calcification Gnet in free-living CCA and corals. day means include morning and afternoon data, net (day mean – nigh mean), %: comparative differences between free-living CCA and corals in net productivity and net calcification.
| Organism | Time of day | Net Productivity | Net Calcification | ||
|---|---|---|---|---|---|
| PDO | Gnet | ||||
| Mean | net (day - night) |
Mean | net (day - night) |
||
| Free-living CCA | day | 0.951 | 1.206 | 0.275 | 0.254 |
| night | -0,333 | 0.020 | |||
| Coral | day | 0.574 | 0.907 | 0.123 | 0.052 |
| night | -0,333 | 0.070 | |||
| % difference | 24.7 | 79.4 | |||
Disclaimer/Publisher’s Note: The statements, opinions and data contained in all publications are solely those of the individual author(s) and contributor(s) and not of MDPI and/or the editor(s). MDPI and/or the editor(s) disclaim responsibility for any injury to people or property resulting from any ideas, methods, instructions or products referred to in the content. |
© 2024 by the authors. Licensee MDPI, Basel, Switzerland. This article is an open access article distributed under the terms and conditions of the Creative Commons Attribution (CC BY) license (http://creativecommons.org/licenses/by/4.0/).
Copyright: This open access article is published under a Creative Commons CC BY 4.0 license, which permit the free download, distribution, and reuse, provided that the author and preprint are cited in any reuse.


