
Submitted:
08 November 2024
Posted:
12 November 2024
You are already at the latest version
Abstract
We demonstrate that a short oligonucleotide complementary to a G quadruplex domain can invade this iconic, noncanonical DNA secondary structure in ways that profoundly influence the properties and differential occupancies of the resulting DNA polymorphic products. Our spectroscopic mapping of the conformational space of the associated reactants and products, both before and after strand invasion, yield unanticipated outcomes which reveal several overarching features. First, strand invasion induces disruption of DNA secondary structural elements in both the invading strand (which can assume an iDNA tetrad structure) and the invaded species (a G quadruplex). The resultant cascade of coupled alterations represents a potential pathway for the controlled unfolding of kinetically trapped DNA states, a feature that may be characteristic of biological regulatory mechanisms. Furthermore, the addition of selectively designed, exogenous invading oligonucleotides can enable manipulation of noncanonical DNA conformations for biomedical applications. Secondly, our results highlight the importance of metastability, including the interplay between slower and faster kinetic processes in determining preferentially populated DNA states. Collectively, our data reveal the importance of sample history in defining state populations, which, in turn, determine preferred pathways for further folding steps, irrespective of the position of the thermodynamic equilibrium. Finally, our spectroscopic data reveal the impact of topological constraints on the differential stabilities of base-paired domains. We discuss how our collective observations yield insights into the coupled and uncoupled cascade of strand-invasion induced transformations between noncanonical DNA forms; potentially as components of molecular wiring diagrams that regulate biological processes.
Keywords:
Metastable DNA states
; G-quadruplex/iDNA/duplex interconversions
; rough energy landscapes
; competing kinetic and thermodynamic states
; coupled transformations of higher-order DNA states
; DNA self-regulation pathways
1. Introduction
1.1. Background
Biological pathways often exhibit complex, so-called “rough,” energy landscapes, with multiple local minima and variable height transition state barriers between them [1,2,3,4,5]. Information content scales with such landscape complexity and often reflects a comingling and differential temporal phasing of thermodynamically controlled (stability) and kinetically-controlled (speed/rate) cascades of interconverting states, which, in part, are dependent on the local cellular milieu (see, for example, the elegant analysis of transcription regulation by Greive and von Hippel [6]). In this context, sequence-dependent, higher-order, noncanonical DNA structures ([7,8,9,10,11]), may exhibit coupled interactions that can be modulated by strand invasion events, as has been proposed as part of homologous recombination, gene regulation pathways, and for telomeric function [12,13,14] [15,16,17,18,19]. The associated conformational “gymnastics” of higher-order DNA structures can produce unanticipated molecular “dance partners.” In this article, we posit that the mapping of such “coupled polymorphism” of noncanonical DNA states can yield insights into how higher-order DNA species participate in the “molecular tuning” of pathways associated with DNA (self-) regulation.
We initially chose to focus our attention on the conformational gymnastics [20] between canonical and non-canonical DNA states associated with G and C-rich DNA segments found in promoters of a number of critical oncogenes [21,22,23,24]. Justification for our system design comes from the results of prior studies that collectively suggest that oncogene transcription is likely regulated, at least in part, by arrays of kinetically and thermodynamically-controlled transformations between the Watson-Crick duplex, G quadruplex, and iDNA states that can be adopted by these G and C-rich DNA domains [25,26,27,28,29].
Nomenclature and Biological Justification for Studying Such Higher-Order DNA Structural Motifs: G and C rich DNA Segments in Gene Control Regions Are Prone to Form Noncanonical DNA Secondary Structures in Competition with Duplex DNA
Guanine- rich nucleic acid sequences that contain 4 or 5 G tracts of 3 or more guanines in length, separated by a variable number of non-G bases can be designated as [G3-4L1-7]4-5 (where L=A, T, or C). In some instances, L also can be a G residue. Such domains are statistically highly overrepresented in the genome[30,31], as are the corresponding, complementary C-rich sequences in the opposing strand, which can be designated as [C3-4L1-7]4-5 (where L=A, T, or G, and rarely C). Such types of G-rich (and C-rich) domains frequently are found in the promoter and enhancer regions of many genes, while being especially prevalent in promotor regions of critical oncogenes, where they likely contribute to the regulation of promoter activity ([32,33,34,35]). G-rich oligonucleotides (and their corresponding C-rich complements) derived from such promoter sequences exhibit a propensity to adopt a host of related noncanonical G quadruplex and iDNA structural motifs, with subtle variations in sequence defining which of the energetically closely related G quadruplex/iDNA conformers are preferred ([36,37,38]). It is envisioned that in vivo these non-canonical structures compete with conventional B-DNA duplex formation via dynamic DNA conformational exchanges ([21,39,40,41,42]). Such competing conformational interconversions lend credence to suggestions that regulatory outcomes of promoters containing such G/C rich domains may, in part, be tuned by dynamic transitions between different DNA conformations.
Current models for how such dynamic conformational exchanges might regulate DNA transcription involve a broad range of proposals; including the following suggestions: once formed, G quadruplexes function as passive barriers to RNA polymerase progression (a negative regulatory process) ([43,44,45,46]); the secondary structure acts as a “transient” binding site for critical transcription factors needed for RNA polymerase activity (a positive regulatory outcome)[47,48] [49]); and G quadruplexes facilitate large DNA loop formation, possibly via transcription factor binding, as part of enhancer element function (also a positive regulatory outcome) ([50,51]).
Conceptual models for the role of iDNA to date focus largely on its role as a CIS acting regulator of DNA transcription through the dynamic competition between the structured iDNA and unstructured C rich loop isomers, with protein or ligand binding interactions stabilizing the iDNA form, thereby resulting in increased transcription levels ([52,53]). Evidence also is accumulating for mutually antagonistic interactions between the iDNA form in one DNA strand and G-quadruplex formation in the opposing DNA strand, supporting the perspectives noted above on the importance of the dynamic conformational exchanges between different DNA states for regulating DNA transcription ([54,55,56,57]).
Additional support for such proposals also comes from observations that ligands which selectively stabilize G quadruplex and/or iDNA structures ([58,59]) alter promoter activity, with antibodies specific for G quadruplex structures tending to bind preferentially to promoters that contain such G-rich domains [60,61,62,63]. The observation that ligands specific to G quadruplex structures can modulate promoter activity has spurred a widespread search for G quadruplex specific ligands [64,65,66,67,68,69,70,71]). This focus reflects a strategic effort to deliberately manipulate the dynamic equilibria that control these noncanonical forms, with the ultimate goal of altering regulatory outcomes for in vitro and in vivo biomedical applications.
In this regard, oligonucleotides or oligonucleotide analogs represent an intriguing group of potential sequence specific DNA ligands. Here the foundational Peptide Nucleic Acid (PNA) studies of Nielson, Norden, Wilson, Armitage, and others are pertinent[72,73]. They demonstrate strand invasion by “designer” PNA’s into duplex DNA's[74,75], including strand invasion by PNA’s targeting the C rich strand of [G3-4L1-7]4-5·[C3-4L1-7] 4-5 tracts in duplex DNA. Such strand invasion induced binding of the C rich strand can force extrusion/formation of G quadruplexes in the opposing strand [76,77,78]. These experimental results elegantly demonstrate that a strand invasion event at one site can induce formation of a noncanonical state at a distal site; features conceptually associated with regulatory switches.
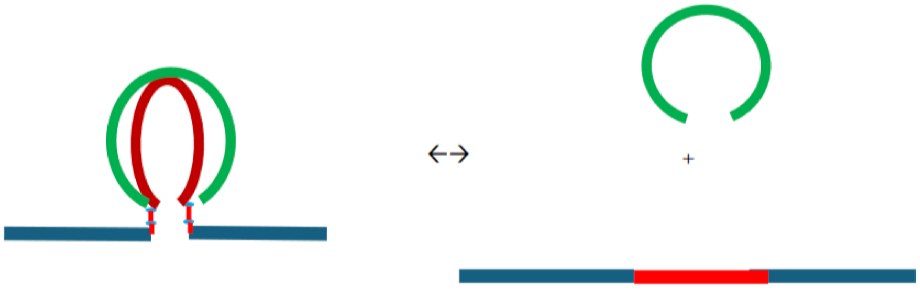
By contrast, the study reported here focusses on a cascade of strand invasion-induced events that can result in disruption rather than formation of the G quadruplex secondary structure. Specifically, we focus on the “zero-order” intermolecular interactions between separate oligonucleotides that can form a specific G quadruplex structure embedded within a duplex domain absent its C-rich complementary strand, and a C-rich oligonucleotide, exclusively complementary, in the Watson and Crick sense, to the G rich segment that folds into the quadruplex conformation.
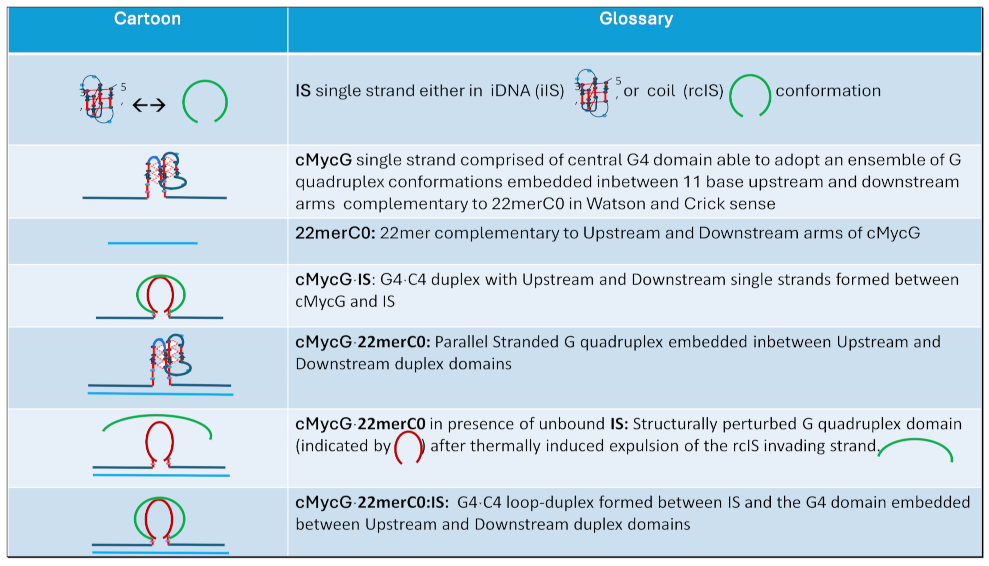
Table 1a lists the sequences and the designated names of the three oligonucleotides we have selected for this study. Table 1b schematically illustrates the range of potential inter- and intramolecular interactions between these three DNA oligomers, in their various unimolecular, bimolecular, and trimolecular states. The cMycG strand in Table 1a is named based on the near homology of the central G rich domain with G tracts I-IV of the nuclease hypersensitivity element NHEIII of the cMyc oncogene promoter sequence. The cMycG single strand exists as an ensemble of closely related quadruplex conformers of which the parallel strand arrangement of the G 4 domain depicted in Table 1b is only one, albeit likely the dominant, isomer adopted at low temperature in K+ salt ([36,37,38]). The iDNA conformer of the Invading Strand (IS) also reflects low temperature ensembles of closely related conformations of the iDNA species formed by the C-rich domains, rather than implying that the cartoon structure reflects any single conformation. Henceforth, we designate the condition-dependent C-rich invading strand (IS) either as iIS, rcIS, or generically as IS to indicate that it refers to the invading strand predominately in either its intramolecular iDNA folded conformation, the unstructured, single stranded, random coil (rc) state, or as simply IS, thereby acknowledging the co-mingling of these two extremes in a manner that depends on the solution conditions under consideration.
By design, as illustrated in Table 1b, the 22merCO single strand is largely unstructured (see text) and is intermolecularly complementary, in a Watson-Crick sense, to the 5’ and 3’ terminal domains of the cMycG sequence, with a centrally extruded G-rich quadruplex (see Table 1b) reflective of a bimolecular complex in which the G quadruplex is embedded within a duplex structure.
Table 1b outlines, in a pictorial format, the different ways by which the three single-stranded DNA oligonucleotides can inter- and intramolecularly interact mono-, bi-.and or trimolecularly, as indicated in the last column of the table. The far-left column of Table 1b illustrate examples of intramolecular structures that can be formed using each of these three single-stranded oligonucleotides in isolation, whereas the right side of Table 1b pictorially illustrates intermolecular structures formed by complexes between different combinations of these three strands. For the sake of clarity, we represent the noncanonical secondary structure domains (G quadruplex and iDNA) as pseudo-3- dimensional ball-stick figures, whereas the Watson and Crick domains are depicted only as solid lines. The pictorial form of the single strands depicted on the left side of Table 1b reflect low temperature ensembles of closely related G quadruplex conformations adopted by cMycG and iDNA conformations by IS in the single stranded form. As noted above, the cMycG strand is named based on the near homology of the central G rich domain with G tracts I-IV of the nuclease hypersensitivity element NHEIII of the cMyc oncogene promoter sequence. Similarly, the iDNA designation also reflects low temperature ensembles of closely related conformations of iDNA species formed by the C-rich domains, rather than any single conformation being implied by the cartoon structure. By design, the 22merCO single strand is largely unstructured (see text) and is complementary, in a Watson-Crick sense, to the 5’ and 3’ terminal domains of the cMycG sequence, with a centrally extruded G-rich quadruplex. Going forward, we will allude to the schematic figures and the short-hand notations shown in this composite 1a and 1b Table, as we propose correlations between the presence of specific DNA species and the characteristic spectroscopic features we detect and report herein for their free and interacting states.
1.2. Rationale for Design of the System Studied
Spectroscopic Features of and Reasons for Studying the “mutated”/site altered cMyc Sequences
For this investigation, we selected a mutated cMyc sequence derived from G tracts I-IV of the nuclease hypersensitivity element NHEIII of the cMyc oncogene promoter [79]. We made this selection since prior work demonstrates this mutated sequence in K+ salt to adopt a unique and stable parallel G quadruplex conformation ([23]). The tendency of this mutated cMyc sequence to form such a singular G quadruplex, absent evidence for the presence of other competing G quadruplex forms, has made it a preferred and widely studied model for biophysical studies of a “homogeneous” G quadruplex ([80,81,82,83,84,85,86,87]). Nevertheless, it should be noted that the presence of competing G quadruplex polymorphs frequently observed for natural G tracts derived from cMyc, as well as other oncogene promoters, may well be biologically relevant in that they provide alternative folding intermediates that may further modulate promoter activity.
As shown by the cMycG strand listed in Table 1a, in the mutated version of the cMyc promoter element, all four G tracts (henceforth collectively referred to as the G4 domain) are of equal length and are comprised of 3 G’s, with consecutive G tracts separated by either one adenine (that putatively form loops 1 and 3 in the G quadruplex), or by a TA base step (the putative loop 2). To differentiate local conformational changes within the G4 domain from global changes monitored by classical spectroscopic ensemble averaging methods (CD, UV), we selectively replaced the adenine in the TA base step (loop 2) with its fluorescent analog 2-Aminopurine (2Ap) which serves as a local spectroscopic probe [88,89,90,91,92,93]. The two short single strand segments (11bp each) placed 3’ and 5’ of the G4 domain are not related to any cMyc promoter segments, but rather are able to form stable duplex arms with the complementary strand designated as 22merC0. These arms correspond to a “generic” duplex domain we previously have used in trinucleotide repeat DNA studies [94,95,96,97,98], and which we have demonstrated can accommodate looped out domains without forming potentially competing secondary structures themselves. We also included two unpaired T residues 3’ and 5’ of the G4 domain to serve as flexible hinges, thereby minimizing any yet unknown consequences of forming junctions between the G quadruplex structure and the adjacent duplex domains. We posit that the presence of such flexible hinges makes it likely that the upstream/downstream duplex and the G4 domains act as (semi-) independent entities; thereby providing a test for the degree of coupling of the physical properties of the different sequence/structure domains. We refer to the resulting complex as cMycGˑ22merC0, in which the dot-centered period (ˑ) indicates Watson-Crick base pair formation between the 22merC0 strand and the single strand segments upstream and downstream of the G4 domain in cMycG.
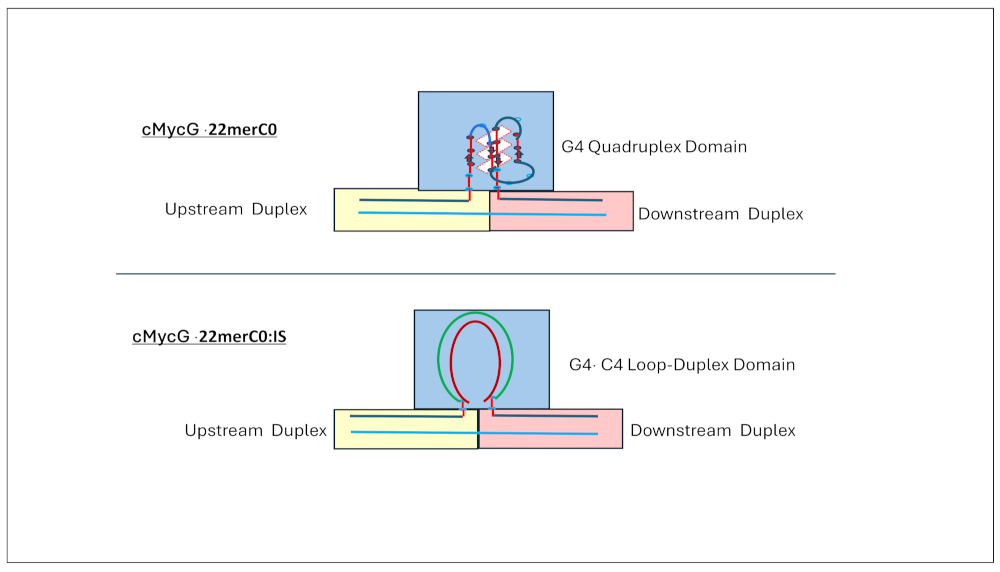
The intermolecular invading strand (IS), is complementary, in a Watson-Crick sense, to the G4 domain, but lacks the bases complementary to either the flexible hinge domain or the upstream /downstream duplex domains. This IS oligomer can fold, under the appropriate conditions, into an intramolecular iDNA, held together by pairs of hemi-protonated cytosine-cytosine base pairs interdigitated to form the 4 stranded complex, [99,100,101,102,103]. When this oligomeric invading strand (IS) is bound to the G4 domain, we will refer to the resulting complex as the G4ˑC4 duplex, to underscore the Watson-Crick base pairing interactions between IS and the G4 domain of cMycG. As elaborated below, we are able to distinguish 2 forms of the G4 ˑC4 duplex; namely, the linear duplex formed between cMycG-IS (as cartooned in column 2, row 1 of Table 1b) and the G4 ˑC4 loop-duplex when IS is bound to the cMycGˑ22merC0 complex (as cartooned in column 2, row 3 of Table 1b). We interpret our spectroscopic results as consistent with both forms formally being characterized by the same Watson-Crick base pairing interactions but differing in physical properties due to different topological constraints.
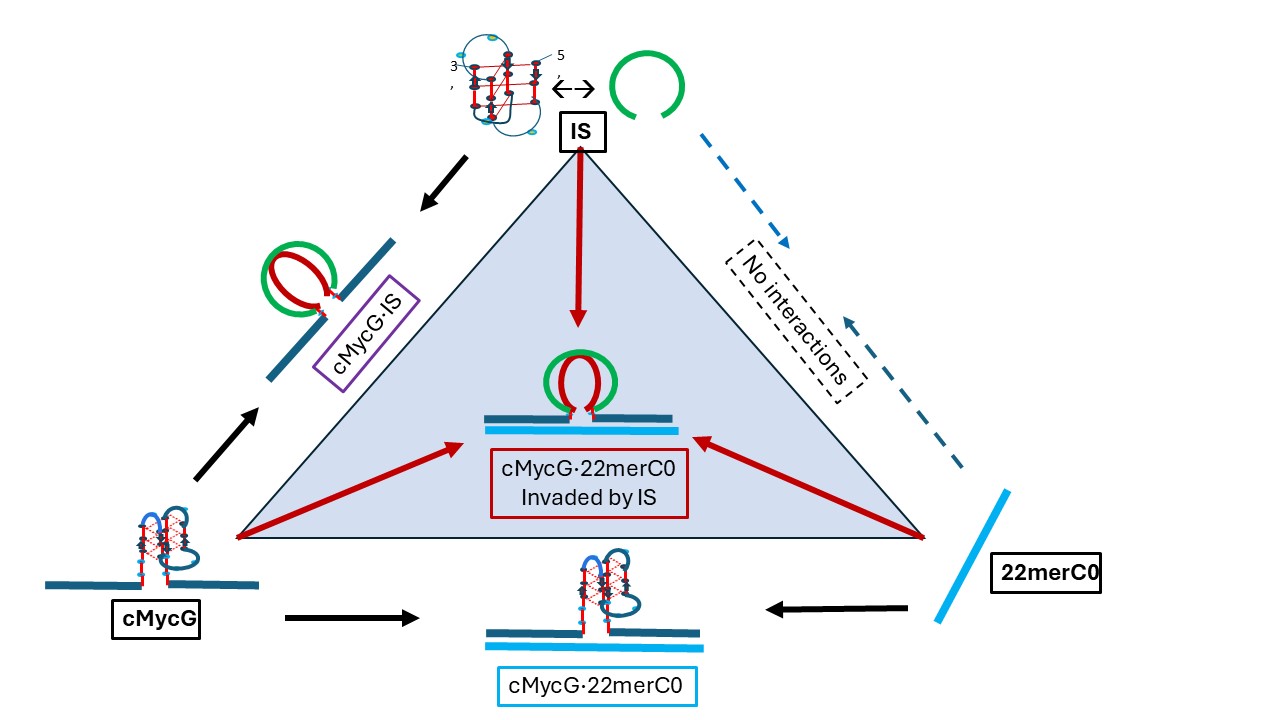
The interactions between the three DNA oligomers discussed above and the relationship between the different constructs that can form between them, conveniently can be represented in the form of a triangular, interconverting “state diagram,” as illustrated in Scheme 1 below. In this format, each triangular corner represents one of the three DNA oligonucleotide single strands by themselves. Binary complexes between any two oligonucleotides are shown along the sides of the triangle connecting the relevant corners, while the center of mass of the triangle reflects ternary interactions between all three oligonucleotides. Due to lack of sequence complementarity between oligonucleotides IS and 22merC0, no binary interactions between these two oligonucleotides are shown along the right side of the triangle.
These sequences, along with their associated designations and roles in the strand invasion process are listed in Table 1 and in the summary glossary section provided below.
1.3. Glossary of Designated States
Below we present a two-part glossary of the collective designations we use to specify each DNA species, as well as the complexes they can form under a given set of conditions, including the DNA domains we designate within these complexes. Going forward, this multi-component glossary should facilitate the reader’s ability to correlate a given DNA structural species, its complexes and/or domains, with the shorthand notation employed throughout this article.
Glossary:
Glossary, part 2: Domain assignments
In the sections that follow, we present local and global spectroscopic profiles of the isolated DNA states and their associated complexes that can form within mixtures of the various DNA species. Significantly, these profiles were measured as a function of temperature, time, sample preparation/history, solution conditions, as well as in the presence of competing species, including the impact of the order of addition. The resulting multi-dimensional array of measurements allows us to construct summary state diagrams/flow charts, as introduced below. Collectively, these multivariable/multidimensional flow charts pictorially present the overall cascade of interrelated transformations we propose based on our interpretation of the spectroscopic measurements we have conducted.
For clarity and continuity, at the beginning of each section below, we include a cartoon representation of the relevant transition under discussion. Following the presentation of our experimental observations, and towards the end of this article, we reintroduce these summary state diagrams/flow charts as we present a global integration of our spectroscopic observations in support of our primary conclusions.
Particularly noteworthy, from a global perspective, is the impressive diversity of multiple DNA states we spectroscopically detect that can result from the comingling of just three oligonucleotides. Throughout this paper, we underscore this recurring theme; namely, the range and complexity of coupled and uncoupled DNA states that can result from strand invasion events triggered by the co-mingling of a relatively few initial oligonucleotide species.
1.4. Summary Flow Charts:
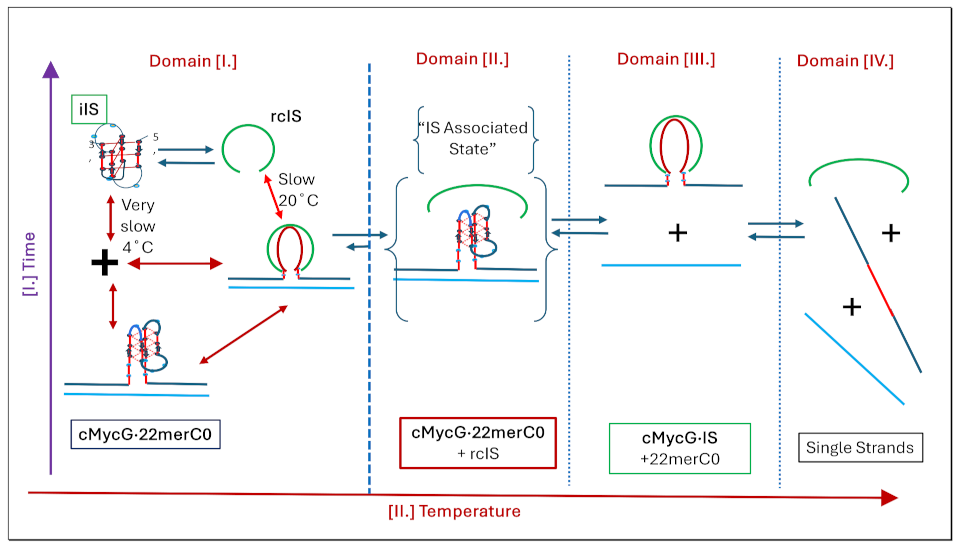
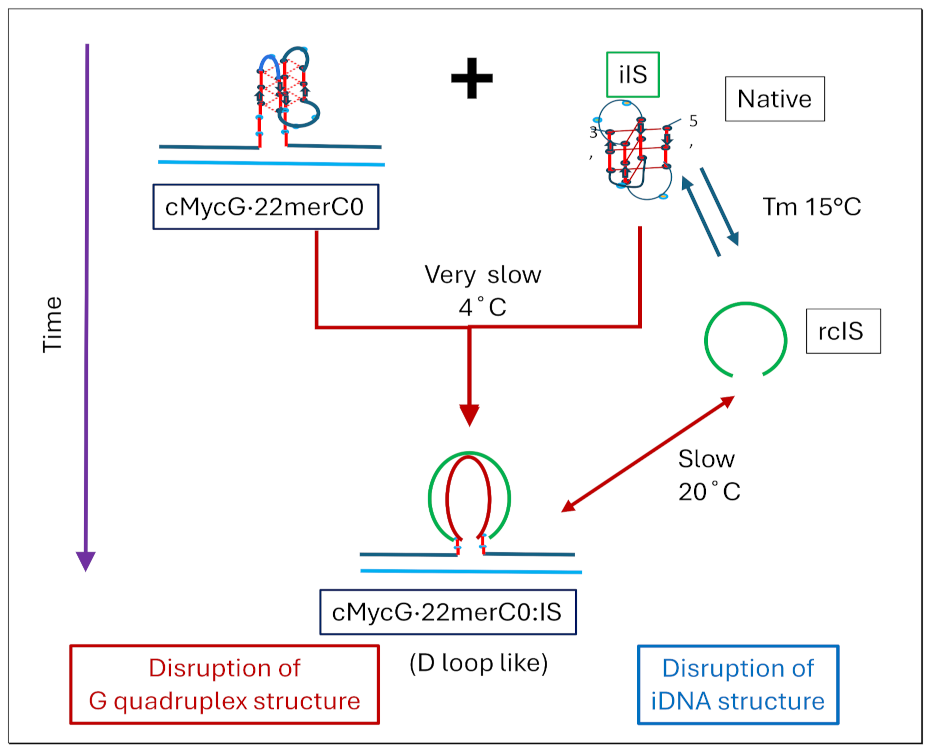
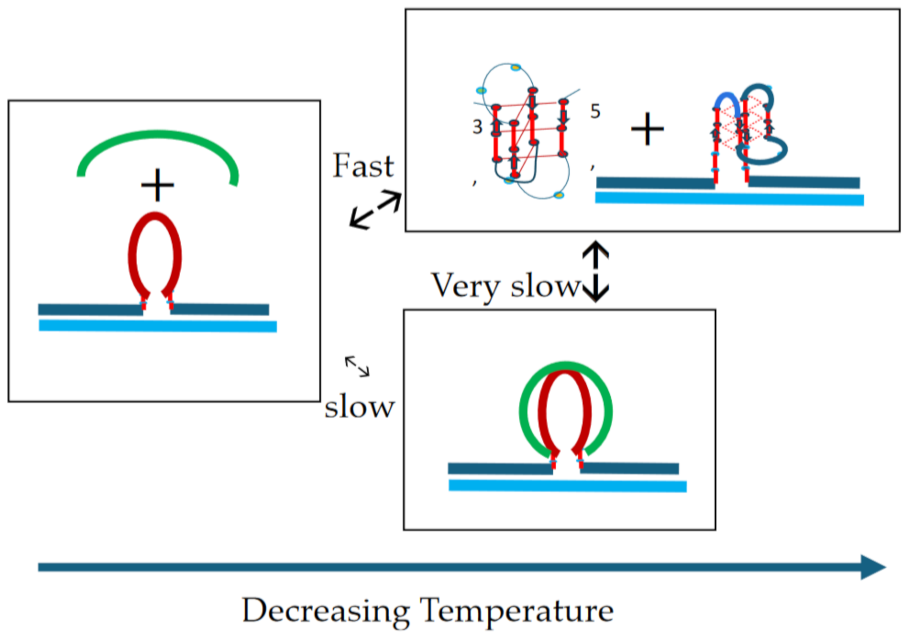
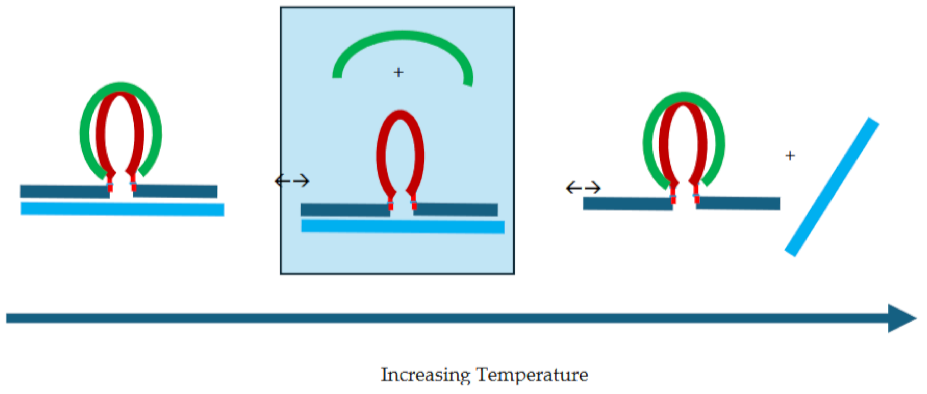
Flowchart 1 provides pictorial representations that summarize the temperature-and time- induced transformations we observe within our DNA system across four discretely designated temperature domains.
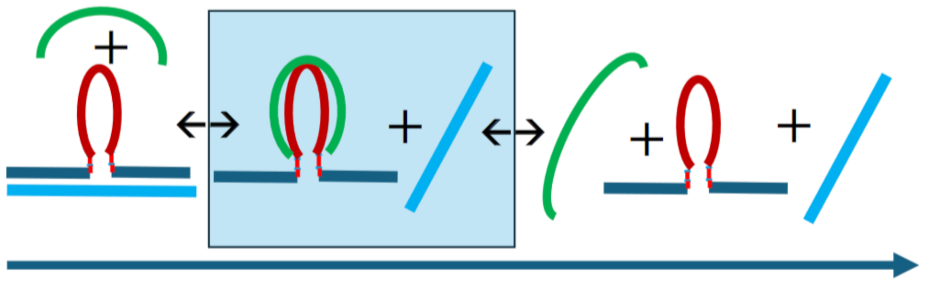
Flowchart 2 provides pictorial representations of strand invasion and the associated disruption of secondary structures
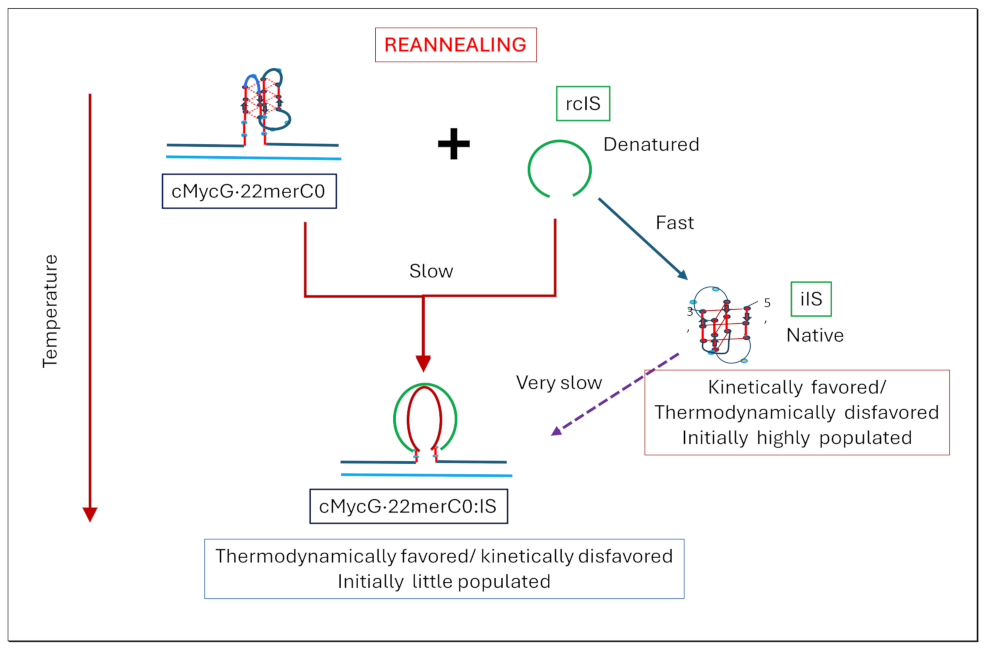
Flowchart 3 pictorially presents the impact of metastability and sample history on the distribution of the DNA species formed.
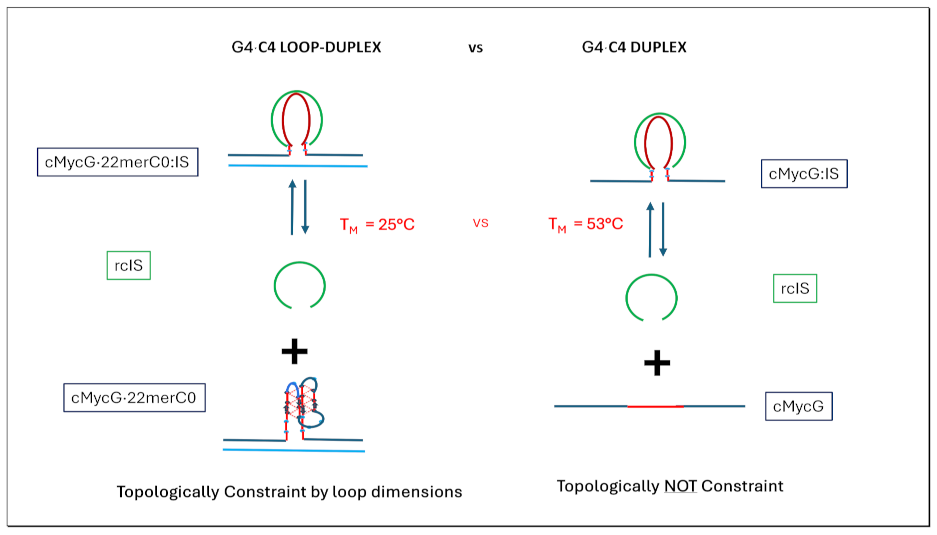
Flowchart 4 pictorially illustrates the impact of topological constraints on proposed transformational outcomes
In the sections that follow, we present the underlying experimental data that support the interpretations manifest in these summary charts.
2. Materials and Methods
2.1. Materials:
The HPLC purified oligonucleotides listed in Table 1a were obtained from IDT and dissolved in distilled water. Aliquots of individual oligonucleotides from stock concentrations of between 0.4 and 0.6mM were separately added to small volumes of the desired buffer. The resulting solution then was heat equilibrated prior to mixing different strands together at the desired incubation temperature. DNA concentrations were determined using the following molar extinction coefficients: ε260(IS)=123900 M-1 cm-1; ε260 (cMycG)= 399200 M-1 cm-1. The extinction coefficient of 22merC0, ε260 (22merC0))= 190400 M-1 cm-1, was determined independently by phosphate assay ([104,105]). Potential complexes between any two strands were formed by using separately established protocols that employed specified incubation temperatures and times. These same protocols also were used prior to addition of a third strand in experiments in which we probed third stand interactions with preexisting conformations. Unless otherwise specified, measurements were conducted in a pH 6.8 potassium buffer consisting of 10 mM Potassium Cacodylate, 0.1 mM EDTA, and sufficient KCL to give a final concentration of 50mM in K+ cations. In cases where a different cation (e.g. Li+ or Na+) was required, the same pH 6.8 buffer was used, except the Potassium Cacodylate and KCL were replaced by Lithium Cacodylate/LiCl or Natrium Cacodylate/NaCl as appropriate. All buffer components were purchased from Sigma in the highest purity grade available.
2.2. Spectroscopy
CD, UV, and fluorescence excitation spectra at the 2AP emission maximum of 370nm were recorded as a function of temperature using an AVIV 435 fluorescence CD spectropolarimeter, as previously described ([106]). The unique design of the instrument allows for the simultaneous detection on the same sample of CD spectra and UV spectra in one direction, and fluorescent spectra at right angles to the incident beam. Temperature-dependent spectra were recorded between 360 nm and 205 nm (monitoring 2Ap emission at 370nm) for all 3 observables, which were collected every 1˚C for heating and 2˚C for cooling cycles in 1 nm increments using a 3 sec averaging time, with a 60 sec temperature equilibration time prior to the measurement. Buffer spectra obtained in the same manner were subtracted from sample spectra and the resulting wavelength/temperature/intensity matrix was subjected to singular value decomposition (SVD) to identify the minimum number of significant components needed to describe the data and to reduce experimental noise. Oligonucleotide strand concentrations were 1 µM in strand in 1x1 cm fluorescent cells. Single wavelength heating and cooling curves at select wavelengths were extracted from the relevant wavelength/temperature/intensity matrix. Time-dependent measurements were collected using the same basic protocol, except for keeping the temperature constant at the incubation temperature, and for measuring the spectra at predetermined time intervals.
3. Results and Discussion
3.1. PART I. Background of the isolated DNA component species
3.1.1. Spectroscopic Evidence for Formation of a Parallel Stranded G Quadruplex by cMycGˑ22merC0
Cartoon 1: cMycGˑ22merC0.
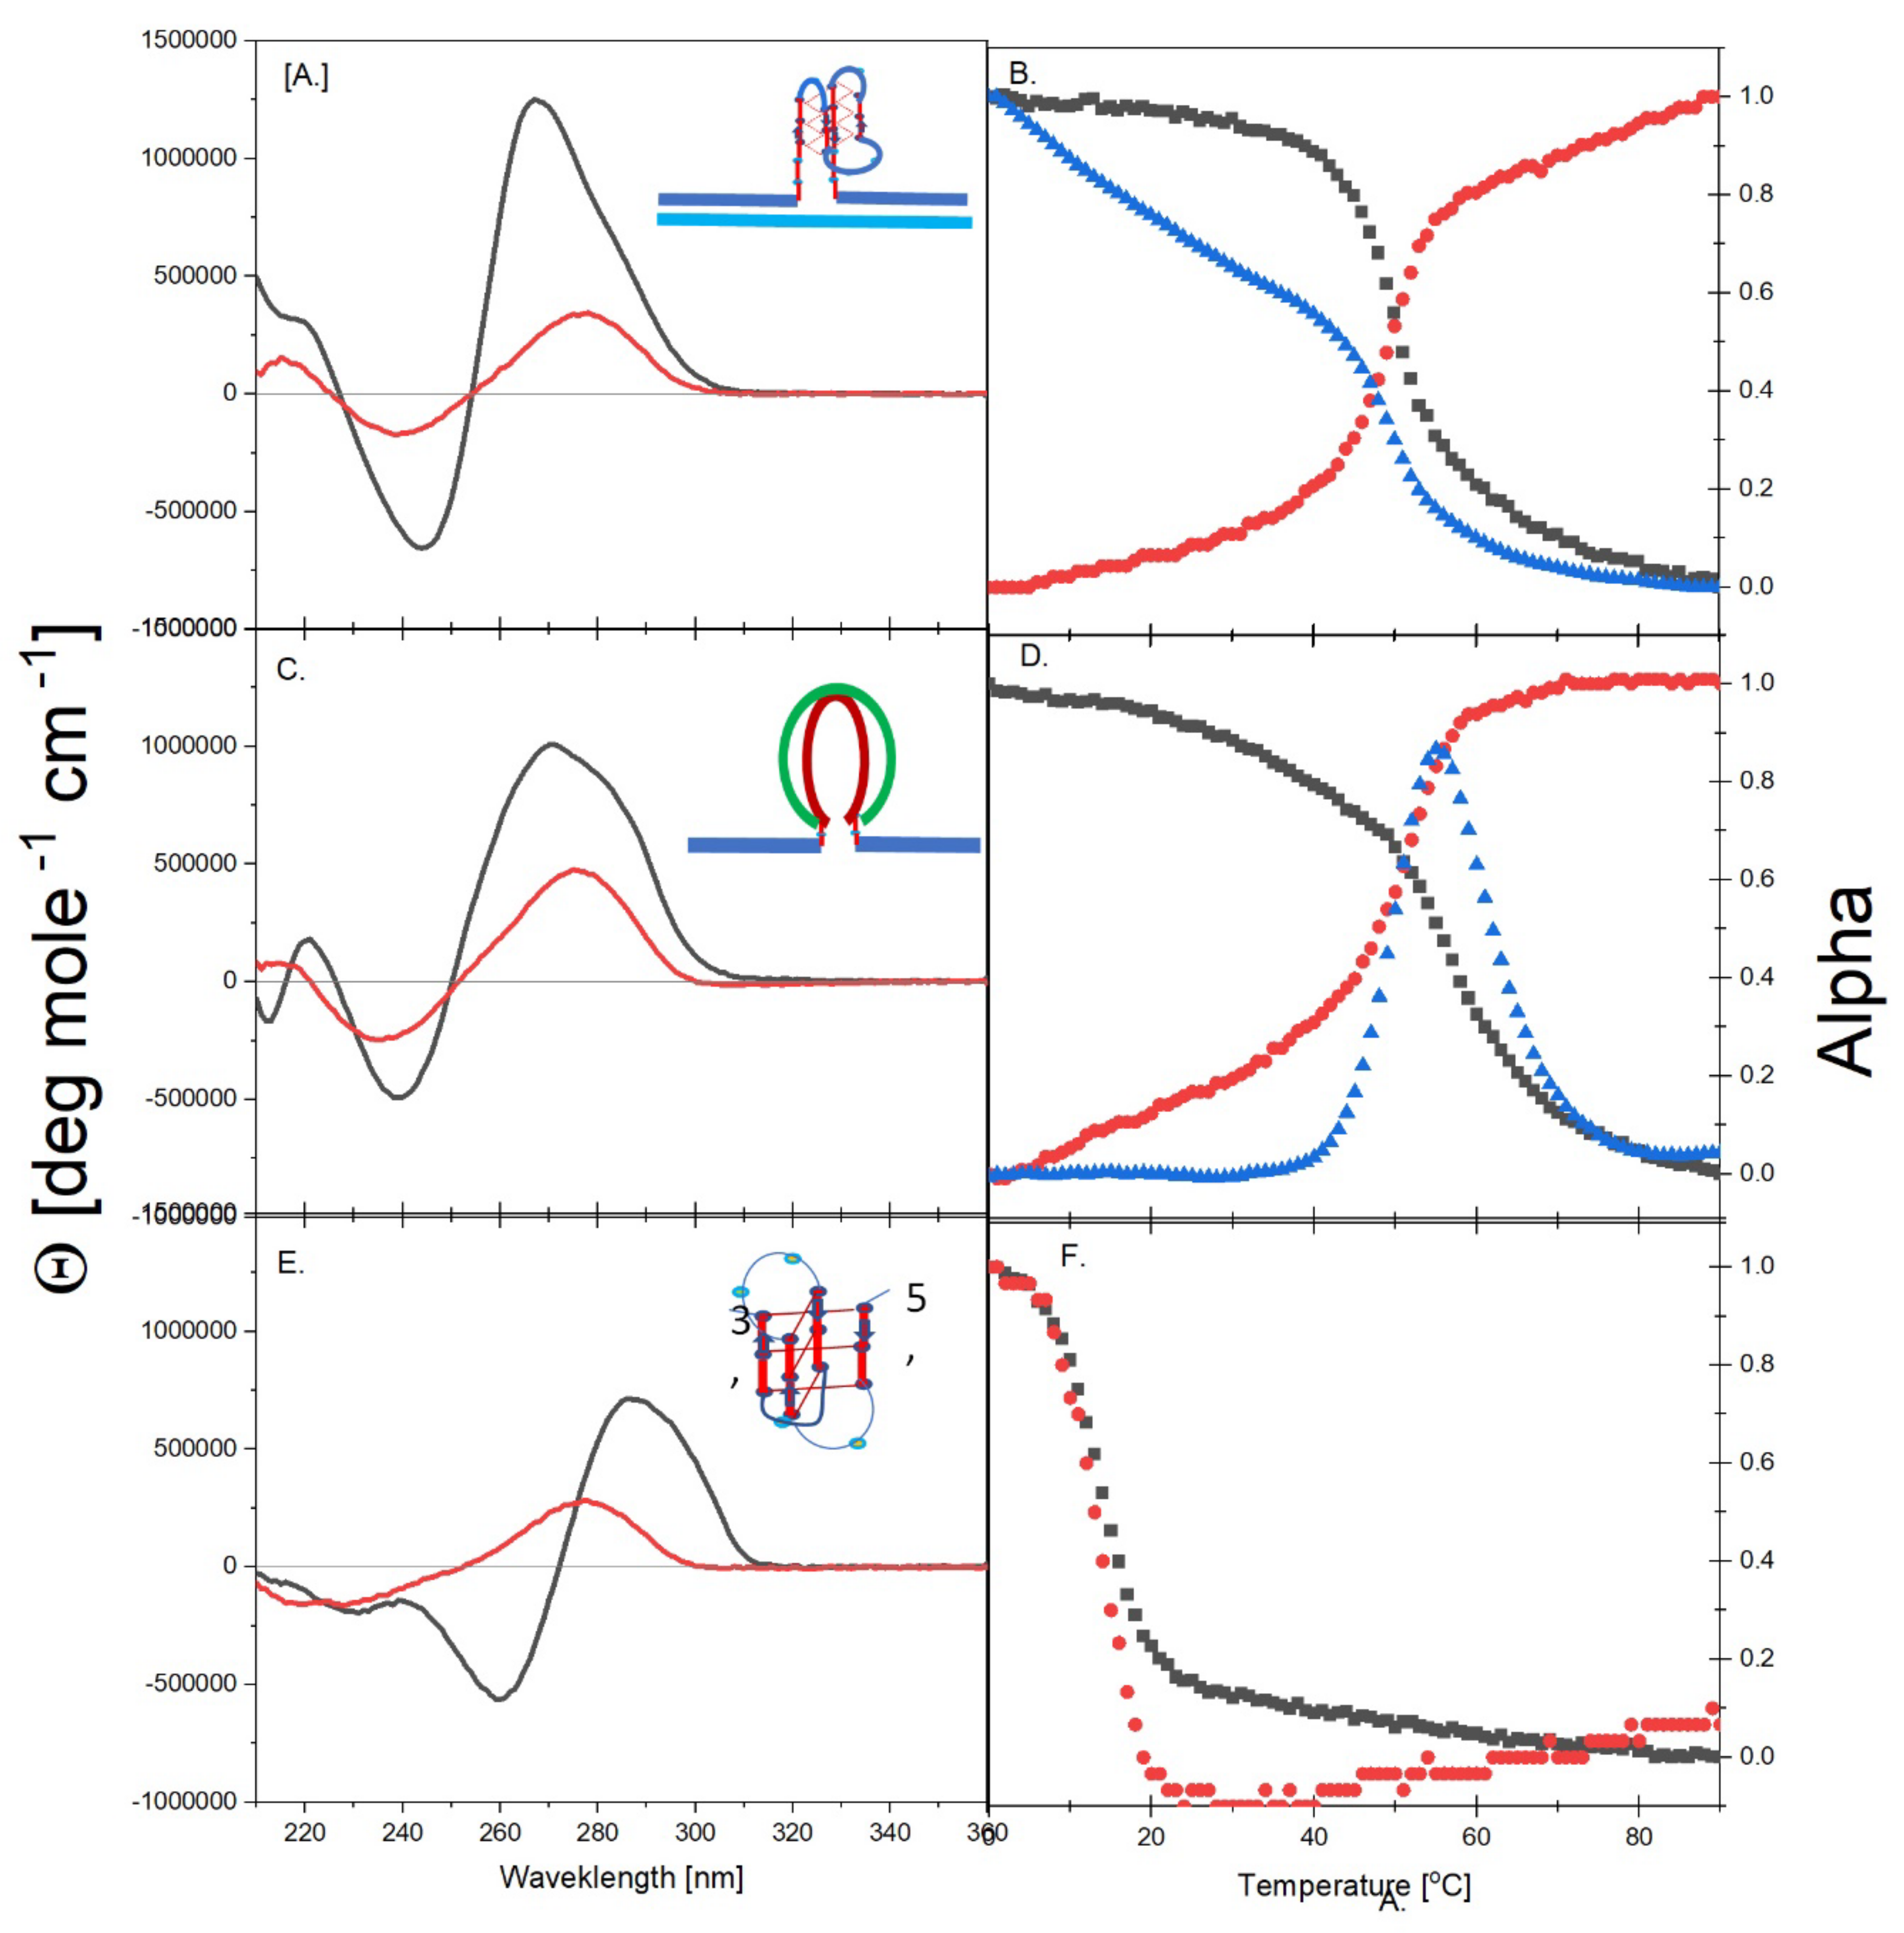
Figure 1, Panel A, shows typical CD spectra we measured at 0°C (native conditions) and 90°C (denatured conditions) for cMycG mixed 1:1 with the 22merC0 in 50mM K+ buffer. The native CD spectrum, with its strong positive ellipticity at 264 nm, is considered reflective of a parallel stranded G quadruplex[107,108].[109,110] In fact, the CD spectrum of the associated complex, cMycGˑ22merC0, can be represented, almost perfectly, as the sum of the CD spectrum of the 22mer duplex (22merC0ˑ22merG0) and the CD spectrum of the isolated G4 domain that make up its component parts (not shown). The isolated G4 domain in K+ salt is known to adopt a parallel stranded G quadruplex conformation [23,111,112,113]([114]). The very strong enhancement in 2Ap fluorescence we observe (roughly 15 times more intense in K+ relative to Li+ or Na+; spectra not shown) also is consistent with the G4 domain in cMycGˑ22merC0 adopting the parallel G quadruplex conformation under native conditions. Further shown in Panel B of Figure 1 are the (normalized) corresponding CD-melting curve at 264nm (black curve), the UV-melting curve at 270nm (red curve), and the fluorescence melting curve (excitation at 308nm, emission at 370nm; blue curve) for cMycGˑ22merC0. All three curves reveal a single cooperative melting transition with identical Tm values of 48°C. We propose that this transition, detected via multiple observables, corresponds to the coupled unfolding of the parallel G4 quadruplex domain together with the upstream and downstream duplex arms of cMycGˑ22merC0.
3.1.2. Spectroscopic Evidence for the Formation of a Duplex with Overhanging Single Stranded Ends Between cMycG and IS
Cartoon 2: cMycGˑIS.
Figure 1, Panel C, shows typical CD spectra at 0°C (native conditions) and 90°C (denatured conditions) for a 1:1 mixture of cMycG and IS. The corresponding CD, UV, and fluorescence melting curves are shown in Panel D. The 1:1 mixture of cMycG and IS exhibits a single cooperative melting transition with a Tm of 53°C. Note that this Tm is higher than that which we observe for cMycGˑ22merC0. The native CD spectrum of cMycGˑIS (Panel C) differs from that of cMycGˑ22merC0 by an overall decrease in intensity and a significant shift in maximum to 272nm. Although the measured CD spectrum shows evidence for the presence of a small amount of G4 quadruplex and iDNA due to residual single stranded cMycG and IS folding, the overall spectrum of the cMycGˑIS sample closely resembles that of a GC rich duplex.[109,114] We posit that the dominant spectral component represents the spectrum of a central G4ˑC4 duplex domain between cMycG and IS, which is surrounded by the unpaired upstream and downstream single strand domains that are part of the cMycG oligonucleotide. The presence of a small amount of G quadruplex and iDNA states at equilibrium in oligonucleotides with the relevant degrees of freedom is due to the relative differential energetics of the duplex, G quadruplex, and iDNA states, as previously shown by Chalikian and coworkers [114,115], and independently confirmed by us (not shown).
3.1.3. Spectroscopic Evidence for the Formation of an Unstable iDNA by IS
Cartoon 3: IS
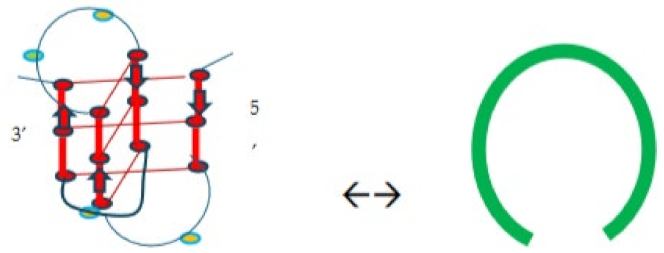
Figure 1, Panel E, shows the typical CD spectra at 0°C (native conditions) and 90°C (denatured conditions) measured for IS by itself. The corresponding CD and UV melting curves are shown in Panel F. Since IS lacks a 2-Aminopurine base, no fluorescence melting curves are shown in Panel F. The CD spectra of IS at 0°C exhibits features typical of an iDNA conformation, with a CD maximum at 288nm and minimum at 260nm [109,110,116,117,118], while also exhibiting a low melting transition with a Tm of 15°C under the conditions employed here; namely, 50 mM K+ salt, pH 6.8. Reducing the pH of the solution shifts this lower melting transition to higher temperatures but does not alter the shape of the CD spectrum observed at 0°C (not shown). Based on these collective observations, we propose that the isolated IS strand adopts a relatively unstable iDNA conformation at low temperature under our experimental conditions.
3.1.4. cMycGˑ22merC0, cMycGˑIS, and IS Exhibit Unique Spectroscopic Properties
In the aggregate, our observations are consistent with the G4 domain in cMycGˑ22merC0 folding into the predicted stable parallel G quadruplex, with the invading IS strand in isolation adopting an unstable iDNA structure at low temperature. Above its low melting temperature, the isolated IS strand remains largely unstructured. Significantly, we conclude that IS can form a Watson-Crick duplex with the bases in the G4 domain of the cMycG strand, and therefore, is able to bind to the looped out (and structured) G4 domain in cMycGˑ22merC0, as illustrated in Flow charts 1 and 2.
In the sections that follow, we probe to what extent IS is able to invade and disrupt the G quadruplex form of cMycGˑ22merC0 by forming a competing G4ˑC4 loop-duplex. Our just described observations reveal that the native state CD spectra of cMycGˑ22merC0 (panels A), of the cMycGˑIS complex (panel C), and of IS (Panel E) exhibit distinct differences from one another. These different optical signals enable us to spectroscopically identify the dominant species in solutions that contain all three strands; namely, cMycG, 22merC0, and IS. In particular, the changes we detect in 2Ap fluorescence with time, temperature, and sample preparation enable us to assign conformational changes associated specifically with the G4 domain.
Figure 1.
Figure 1 shows the CD spectra of the native (0°C, black) and denatured state (90°C, red) of the cMycGˑ22merC0 quadruplex (Panel A), the duplex formed from cMycGˑIS (Panel C), and the IS single strand iDNA complex (Panel E). The corresponding normalized CD melting curves, recorded at the wavelength of the respective CD maximum (black curves), the absorbance melting curves at 270nm (red curves), and the fluorescence melting curves (blue curves) measured for these 3 constructs, with each shown in Panels B, D and F. Note the unusual shape of the fluorescence melting curve in panel D, where the melting of the G4ˑC4 duplex initially results in an increase in 2Ap fluorescence, followed by significant quenching at higher temperature. The initial increase in 2Ap fluorescence is what is expected of melting of a duplex containing a stacked 2ApˑT base pair, while the rapid subsequent quenching of 2Ap fluorescence likely is due to the known rapid dark state quenching of 2Ap by neighboring guanines when both bases are freely mobile. As expected, Panel E does not show a fluorescent melting curve, as free IS does not contain a fluorescent 2Ap base.
3.2. Part II: Spectroscopic Evidence for Strand Invasion of the G Quadruplex by IS
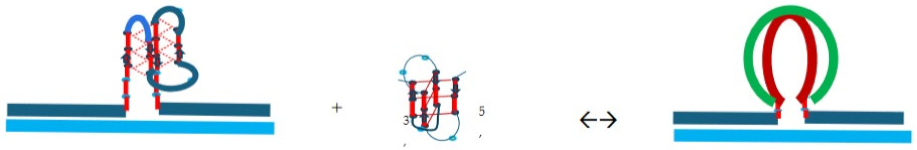
Cartoon 4: cMycGˑ22merC0 plus IS.
Addition of the C rich oligonucleotide, IS, to the pre-formed, parallel stranded, G quadruplex, formed by cMycGˑ22merC0, results in the characteristic changes in spectra and melting behavior shown in Figure 2. Specifically, panels A, C, and E respectively reveal characteristic changes in the CD, UV, and fluorescence spectra, immediately after addition of IS, and after a 2-week incubation period at 4°C of a freshly prepared sample. Also shown in Figure 2 (panels B, D, and F) are the corresponding heating and cooling curves, at characteristic wavelengths, for each of the 3 spectroscopic observables. The CD, UV, and fluorescence spectra were recorded simultaneously on the same sample using an AVIV fluorescence CD instrument, while melting curves at select wavelengths were extracted from collections of spectra recorded in 1°C intervals for those samples.
The following general observations are pertinent:
- All three spectral observables obtained immediately after mixing (black curves) differ from the spectral observables after incubation for 2 weeks at 4°C (red curves); with the most profound changes observed for the local 2Ap fluorescence probe inserted in the center of the G4 domain. By contrast, the 90°C denatured state spectra (dark blue and cyan) are indistinguishable, as one would expect for the fully denatured forms. These collective observations are consistent with slow interactions between cMycGˑ22merC0 and IS at the low incubation temperatures employed here. These conclusions are pictorially reflected in the corresponding Flowcharts.
- The associated melting curves reveal multiple transitions, with only the low temperature transition(s) depending on incubation times. In addition, the curves reveal hysteresis at low temperature upon heating and cooling. By contrast, the higher temperature transitions are identical for freshly prepared samples, and for those incubated at 4°C for 2 weeks prior to the melting experiments, and are completely reversible, as reflected by the identical heating and cooling curves. On the other hand, for all observables, the features of the initial low temperature transition depend strongly on the history of the sample, consistent with the pictorial representations within the relevant Flow Charts.
- While all optical observables reveal multiple temperature induced transitions, the 2Ap fluorescence melting curves exhibit the greatest resolution of identifiable transitions. We posit that this greater resolution, at least in part, results from the additional quenching of 2Ap by freely mobile guanines surrounding the 2Ap site following disruption of base paired/secondary structure elements involving the guanines that surround the local 2Ap residue [119,120,121,122,123] The implications of these results are further discussed in later sections.
- The cooling /reannealing curves identically “reverse” the heating/melting transitions observed at high temperature, yet they diverge for the low temperature transition in a reproducible manner. Specifically, the reannealing curves fall in between the heating curves initially observed upon melting and those observed after preincubation at 4°C, while also exhibiting an intriguing and reproducible “wiggle” in the fluorescence annealing curves. Starting at the temperature where the heating and cooling curves begin to diverge during cooling, the 2Ap signal initially and gradually decreases to a temperature of about 20°C, whereas at lower temperatures the 2Ap fluorescence begins to increase again. The significance of this behavior is discussed below, while also being pictorially illustrated in the relevant Flow Charts.
- Particularly noteworthy, as previously underscored, and worth repeating for emphasis, is the impressive diversity of multiple DNA states we spectroscopically detect that can result from the comingling of just three oligonucleotides. We re-emphasize how the kinetic and thermodynamically controlled array of interacting species and their product complexes are dependent on temperature, time, sequence, and sample history/preparation, including incubation of individual species prior to mixing. We regularly allude to this recurring theme; namely, the range and complexity of coupled and uncoupled DNA states that can result from strand invasion events triggered by the co-mingling of a relatively few initial oligonucleotide species.
In the sections that follow, we focus our attention on the analysis of the fluorescence melting curve (Fig2 F), as it is the most informative for understanding and assigning the complexity of the different transitions associated within this apparently “simple” DNA system.
3.3. Part III: Towards a Globally Integrated Understanding of the Collective Observations
3.3.1. AP Fluorescence-Detected, Thermally-Induced Alterations in the G-Quadruplex Strand of the cMyGˑ22merC0 +IS Complex
To aid in resolving and assigning the nature of the conformational transitions observed when cMycGˑ22merC0 is mixed with IS and incubated for variable times, we direct the reader’s attention to Figure 3. This figure represents an expanded version of panel F of Figure 2. Note that in Figure 3 we indicate clearly identifiable conformational transitions by arrows associated with Arabic numerals. We also define the temperature domains relevant to these transitions, which are designated by Roman numerals. Below we discuss features of the transitions associated with each temperature domain. The conformational processes we propose for each temperature domain are schematically represented in the associated tables and identified by the relevant Arabic numerals in the main text.
The black curve in Figure 3 reflects melting behavior immediately after mixing, while the red curve reflects melting after a 2-week incubation period at 4°C. These behaviors collectively reflect the extremes of the incubation time effect we tested. The heating curves for samples incubated at 4˚C for intermediate time periods result in melting curves that fall between these two sets of curves (not shown). This intriguing incubation time dependence is important for understanding the set of reannealing curves shown in light and dark blue in Figure 3. In essence, the results shown in Figure 3 reflect a projection of the 3rd dimension “incubation time” axis onto the 2-dimensional fluorescence/temperature axis of a “classic” melting curve.
Figure 3.
An expanded version of Panel F of Figure 2. As we show below, the conformational transitions designated 1 and 2 in temperature domain [I.] are related to one another by the time variable and are discussed together in the text.
Figure 3.
An expanded version of Panel F of Figure 2. As we show below, the conformational transitions designated 1 and 2 in temperature domain [I.] are related to one another by the time variable and are discussed together in the text.
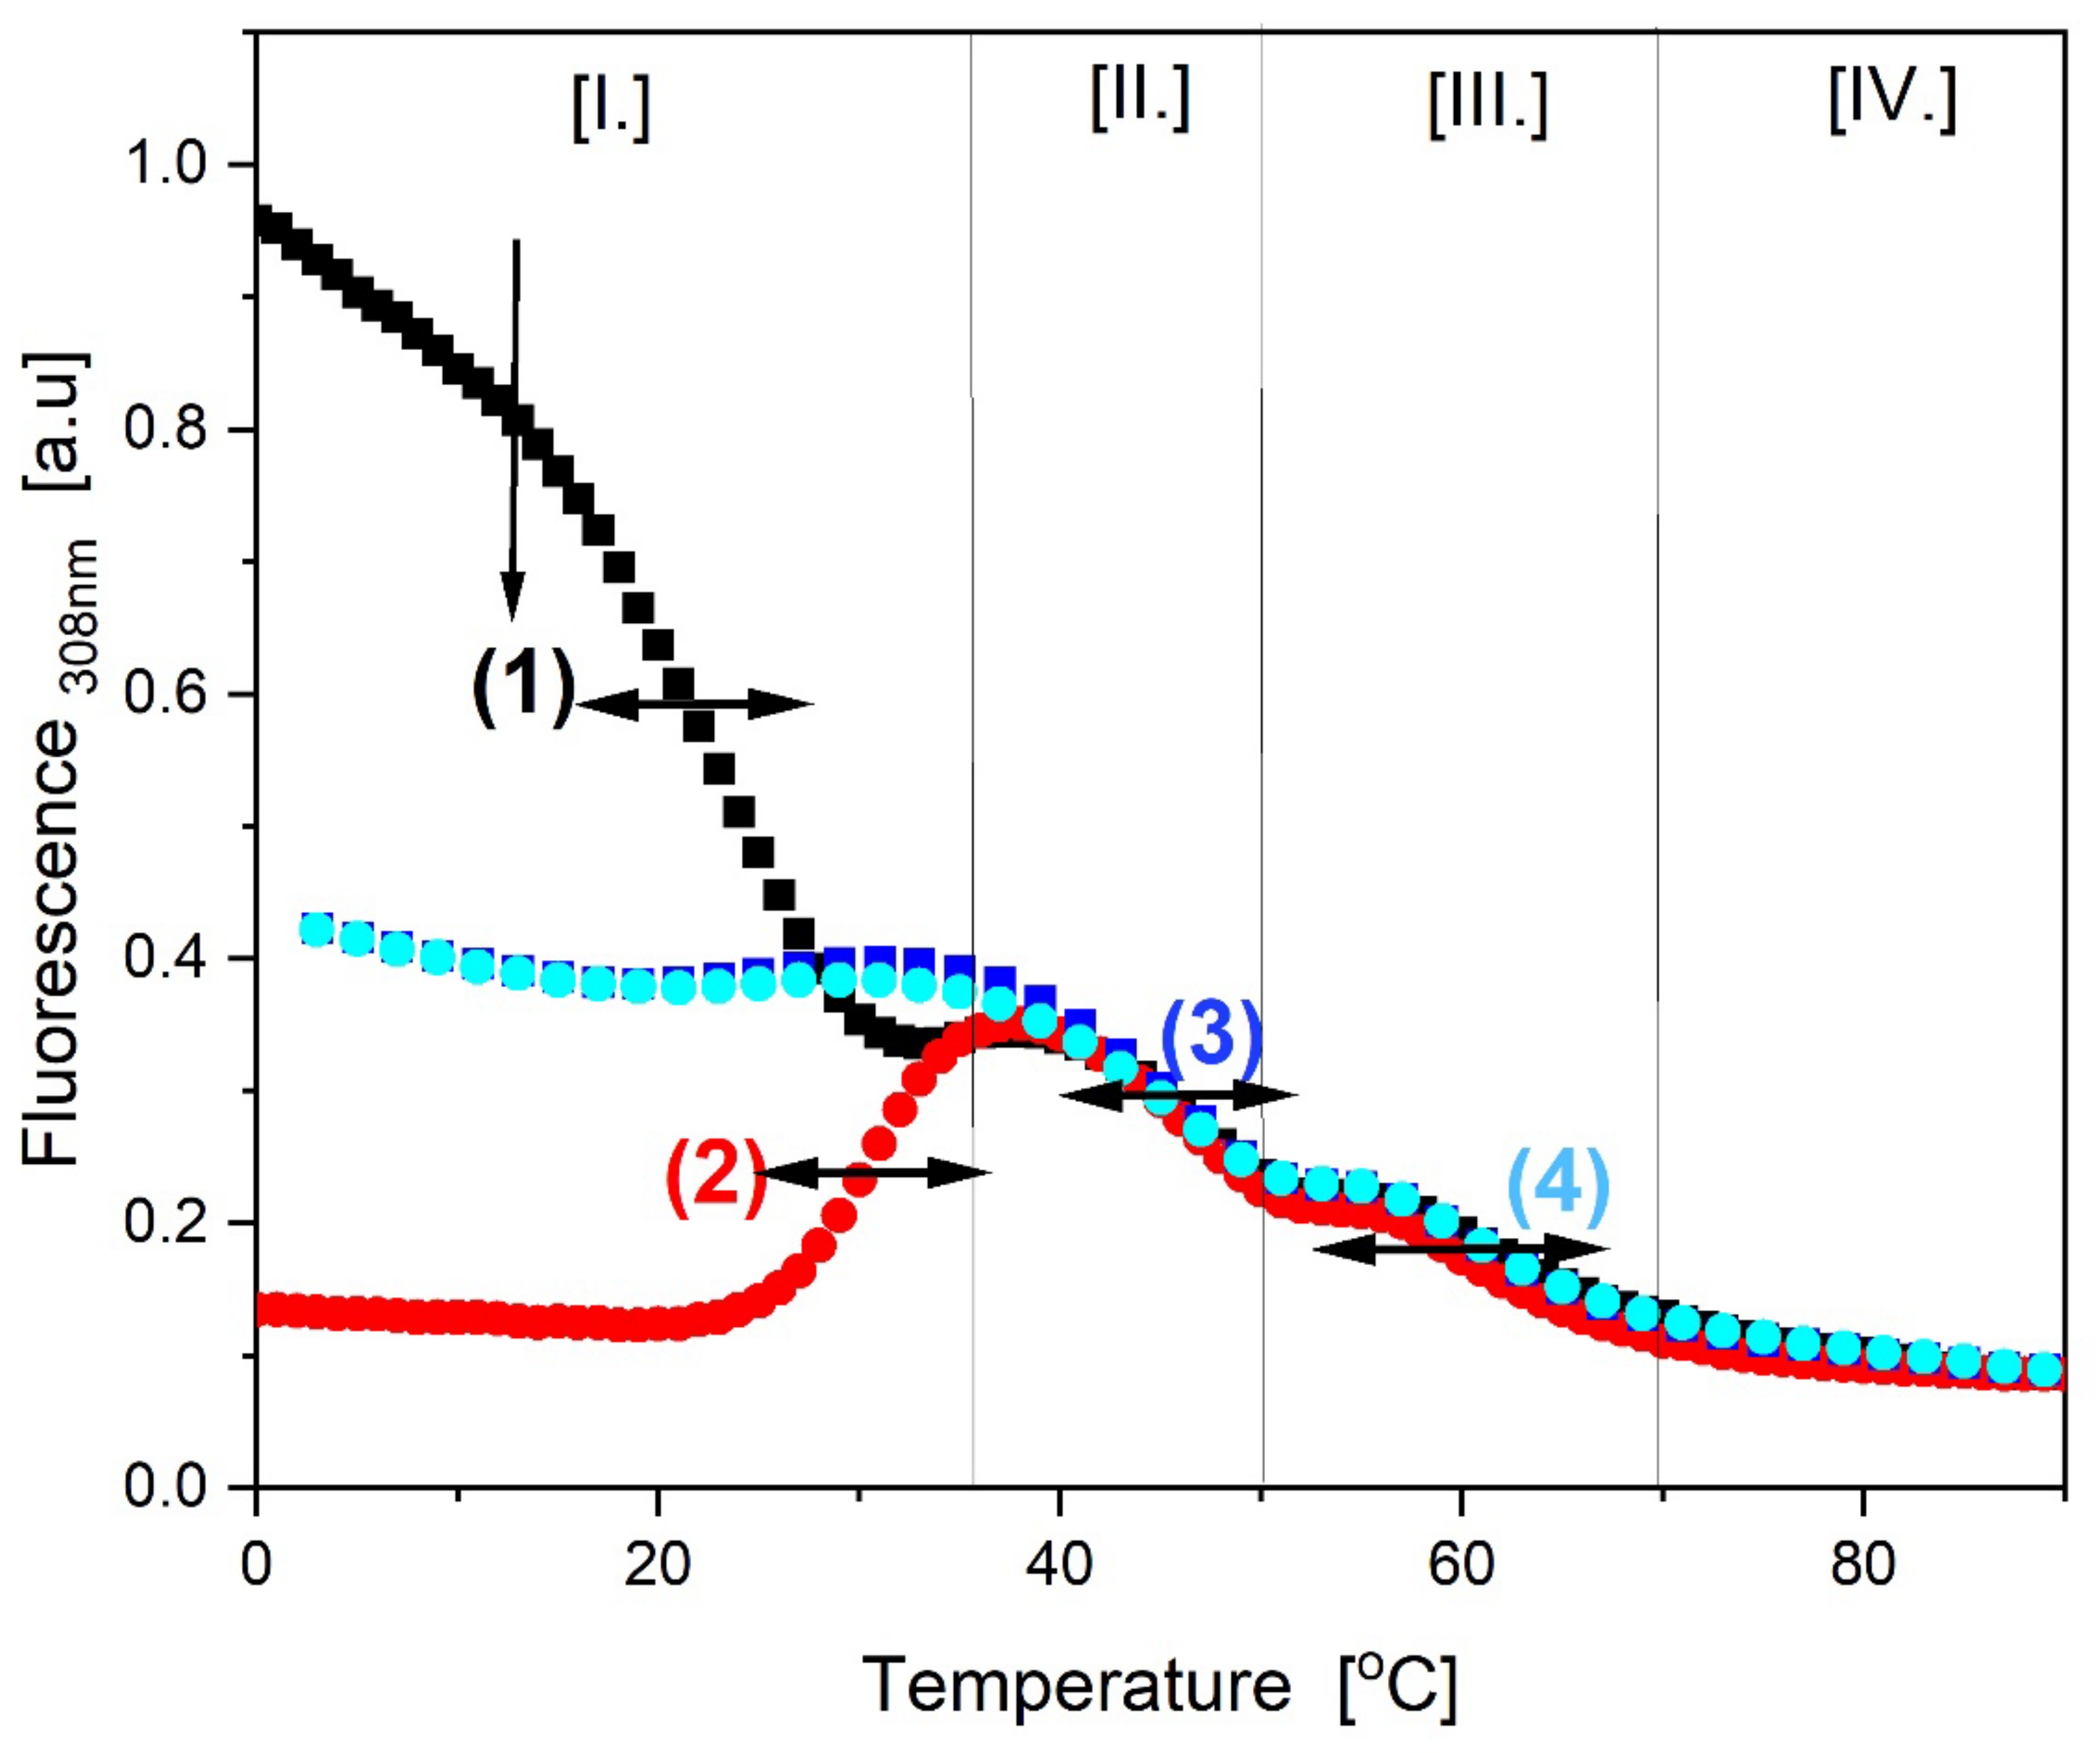
Inspection of Figure 3 reveals 4 distinct temperature domains, indicated by the vertical lines in Fig 3 and designated by Roman numerals I-IV, defined by clearly separated spectral transitions in the fluorescence signal, as indicated by Arabic numeral/ arrows. Upon inspection of the data depicted in Figure 2, one observes similar transitions, albeit less well resolved, in both the UV and CD signals at characteristic wavelengths. For the UV and CD melting curves we find that different wavelengths are differentially sensitive to different conformational transitions. This reality results in the apparent absence of a particular transition or lack of resolution at one wavelength, with that same transition being clearly detectable at a different wavelength, where another transition detected at the first wavelength shows no clear signal.
Recall that we incorporated the 2-Aminopurine base (2Ap) in the center of the G4 domain of cMycG, with the specific goal of monitoring local conformational rearrangements of the G4 quadruplex domain embedded within neighboring duplex arms. Changes in UV or CD profiles reflect contributions not only from the G quadruplex domain, but also from the neighboring duplex arms, as well as those arising from the added IS invading strand. This multiplicity of contributions may partially mask the behavior of the G4 domain, which we primarily are interested in probing. Despite this complexity, we nevertheless still observe similar, albeit less well resolved, transitions in the CD and UV melting curves to those shown in Figure 3; an observation consistent with the observed fluorescence changes corresponding to conformational transitions of the DNA construct, or at least parts of it, rather than just the local rearrangements of the 2Ap base within the otherwise unperturbed G4 domain.
In the sections that follow, we discuss individually the DNA states associated with the different conformational transitions observed in Figure 3. To assist in this endeavor, the reader is re-introduced to Flowchart 1, which, using the same layout as the fluorescence melting curves shown in Figure 3, depict the various transitions between different DNA states we have identified and designated in pictorial form. Specifically, we will show that the observed spectral changes in temperature domain [ I.] are consistent with the time constrained invasion of the G quadruplex domain by IS (transitions 1), and the subsequent melting of the resulting G4·C4 loop-duplex (transitions 2). We note that the G4·C4 loop-duplex embedded in between the upstream and downstream duplex arms exhibits features characteristic of D-loops (displacement loops) that are proposed to play important roles in telomeric function ([124,125]), as well as having a role in homologous/nonhomologous strand exchange reactions; ([12,13,14]) two additional biological processes that also involve strand invasion events.
We further present spectroscopic evidence suggesting that temperature domain [II.] corresponds to formation and subsequent melting of the cMycG·22merC0 complex in the presence of the expelled single stranded IS (transition 3), while temperature domain [III.] corresponds to formation and subsequent melting of the cMycG·IS complex (i.e. the G4ˑC4 duplex) in the presence of the 22merC0 single strand (transition 4). In temperature domain [IV.], all DNA conformations are fully denatured. See the flowchart differences as a function of the temperature domains. As we discuss below, the above italicized emphasis on the wording “in the presence of single strand…” is of significance, as the relevant complexes exhibit different properties when these single strands are absent, reminiscent of so-called memory effects observed in some solvolysis reactions and their associated solvent separated and intimate ion pairs [126,127].
To aid in making the assignments noted above, we have made use of melting curves of the isolated components of the cMycG ·22mer :IS mixture (e.g. cMycG ·22mer, cMyc·IS, and IS). We also made use of experiments orthogonal to classic melting curves in terms of monitoring the effects of time after mixing of specific combinations of strands and/or by varying the order by which the strands initially are mixed and allowed to incubate at given temperatures. Unlike traditional melting experiments, where the heating rate is generally much slower than the kinetics of the melting process ([128,129,130,131,132]), we find that for some of the observed conformational changes the kinetics of the transition is much slower than the relatively slow heating rate (~1˚C/16 min) employed here.
Further, we observe that the order by which partial intermediates form can be critical for the population of states initially adopted, and the time required to eventually form the equilibrium distribution. The preferential population of some states, to the temporary exclusion of others, becomes important for understanding the reannealing curves. For such curves, the order by which the complexes form is determined by a balance of thermal and thermodynamic preferences of individual subsets of the components as the temperature is lowered, as well as their relative rates of formation. Experimentally, these influences can be tested by varying the order with which the 3 component strands are added together at different temperatures, and by varying the incubation time they are allowed to interact. The importance of the history of the sample in defining the preferred distribution of conformational states also suggests that the use of conventional heat annealing processes routinely applied to oligonucleotide systems can lead to populations of non-equilibrium “initial” states and possibly erroneous conclusions about the samples, particularly if unrecognized slow kinetic processes contribute to the overall system. These realities are reflected in the corresponding flow charts.
3.3.2. Temperature Domain [I.] Coupled Strand Invasion and Expulsion of the Invading IS Strand
Cartoon 5: cMycGˑ22merC0 plus IS, invasion and expulsion of IS.
- Comparison of cMycGˑ22merC0: IS with IS: Evidence for strand invasion by IS.
Figure 4 overlays the CD melting curve at 288nm of the isolated (pre-equilibrated) IS strand (blue) over the two sets of cMycG·22merC0 plus IS fluorescence melting / annealing curves recorded immediately after mixing (black curve) and after two-weeks incubation at 4˚C (red curve). The annealing curve is shown in cyan. The set of fluorescence melting curves in Figure 4 are the same as those shown in Figure 3.
Note that the decrease in 2Ap fluorescence seen in the cMycG·22merC0 plus IS sample, measured immediately after mixing (black curve, corresponding to transition 1 in Figure 3), is similar in shape to the melting of the isolated IS iDNA complex detected by CD, although it is offset in temperature (and therefore also in time) to higher temperatures. Only the cMycG strand contains a 2Ap fluorescent base in the center of the G4 domain, so the observed fluorescence change reflects alterations of the G4 domain in the cMycG·22merC0 complex, not changes in IS. In contrast to the more familiar fluorescent melting behavior of 2Ap in duplex DNA where melting results in an increase in fluorescence [88,89,119] , when the 2Ap site is part of a parallel G 4 quadruplex, denaturation of the secondary structure in this system or duplex formation is associated with a decrease in 2Ap fluorescence. However, isolated cMycGˑ22merC0 that has never been exposed to IS does not exhibit either a CD, a UV, or a fluorescence transition in temperature domain [I.] (see also Figures 6 and 7). We therefore propose that the observed correlation between the IS melting transition detected by CD and the temperature/time offset of the 2Ap fluorescence change in cMycGˑ22merC0 reflects IS induced slow (relative to the heating rate) unfolding of the G4 quadruplex in cMycG to form a G4ˑC4 loop-duplex within the loop domain of the cMycGˑ22merC0 construct.
Incubation of cMycGˑ22merC0 with IS at 4°C results in an even more pronounced decrease in the initial 2Ap fluorescence intensity absent heating compared to the temperature induced maximum decrease in fluorescence intensity seen for the sample heated immediately after mixing. This observation is reflective of additional 2Ap quenching due to more complete G4ˑC4 loop base pair formation when the sample is incubated at 4°C for 2 weeks, absent changes in temperature (the red curve). Collectively these observations suggest that G4ˑC4 loop-duplex formation remains incomplete during heating of the freshly mixed sample (transition 1 in Fig 3, black curve). Melting of the sample incubated at 4°C for 2 weeks, on the other hand, leads to a temperature induced increase in fluorescence that cannot be duplicated by any combination of isolated components of this system (transition 2 in Figure 3).
We propose that the increase in 2AP fluorescence seen for the 2-week incubated sample reflects disruption of the fully formed G4ˑC4 loop-duplex domain and expulsion of the invaded IS strand. We confirmed that the low temperature transition seen after 2-week incubation (red curve) indeed reflects expulsion of the invaded IS strand by observing rapid displacement of IS from a pre-formed cMycGˑIS complex upon addition of free 22merC0 at 36°C, which is above the temperature of the first transition seen in Figure 3. Interestingly, addition of 22merC0 to pre-formed cMycGˑIS duplex at 4°C (rather than 36°C) leads to the fairly rapid formation of the species that is formed only after 2 weeks incubation, when the order of addition is reversed and IS is added to pre-formed cMycGˑ22merC0 at 4°C. Formation of the cMycGˑIS duplex however is slow at both temperatures (4°C and 36°C), indicating that the slow kinetics of G4ˑC4 duplex formation is, at least, partially due to the secondary structures adopted by the G4 domain. The flow charts illustrate many of these spectroscopically based assignments.
As shown in Figure 4, the temperature induced initial increase in fluorescence for the 2-week incubated sample occurs in roughly the same temperature range, and results in the same final fluorescence intensity at 36°C as the decrease in fluorescence detected upon melting immediately after mixing with IS. Samples that were incubated for intermediate times, or samples recovered after reannealing, fall in-between these two extreme melting behaviors (not shown). In other words, at the temperature boundary between domains 1 and 2, differences in the nature of the samples that depend on the initial incubation time, and are reflected in different initial fluorescence signals, no longer exist. The observed heating/cooling/ incubation time properties described here also are reproduced in samples only heated past the initial melting transition to 36°C and are therefore independent of the conformational transitions observed at higher temperature.
- Formation of the G4ˑC4 loop-duplex by strand invasion is kinetically inhibited but thermodynamically favored.
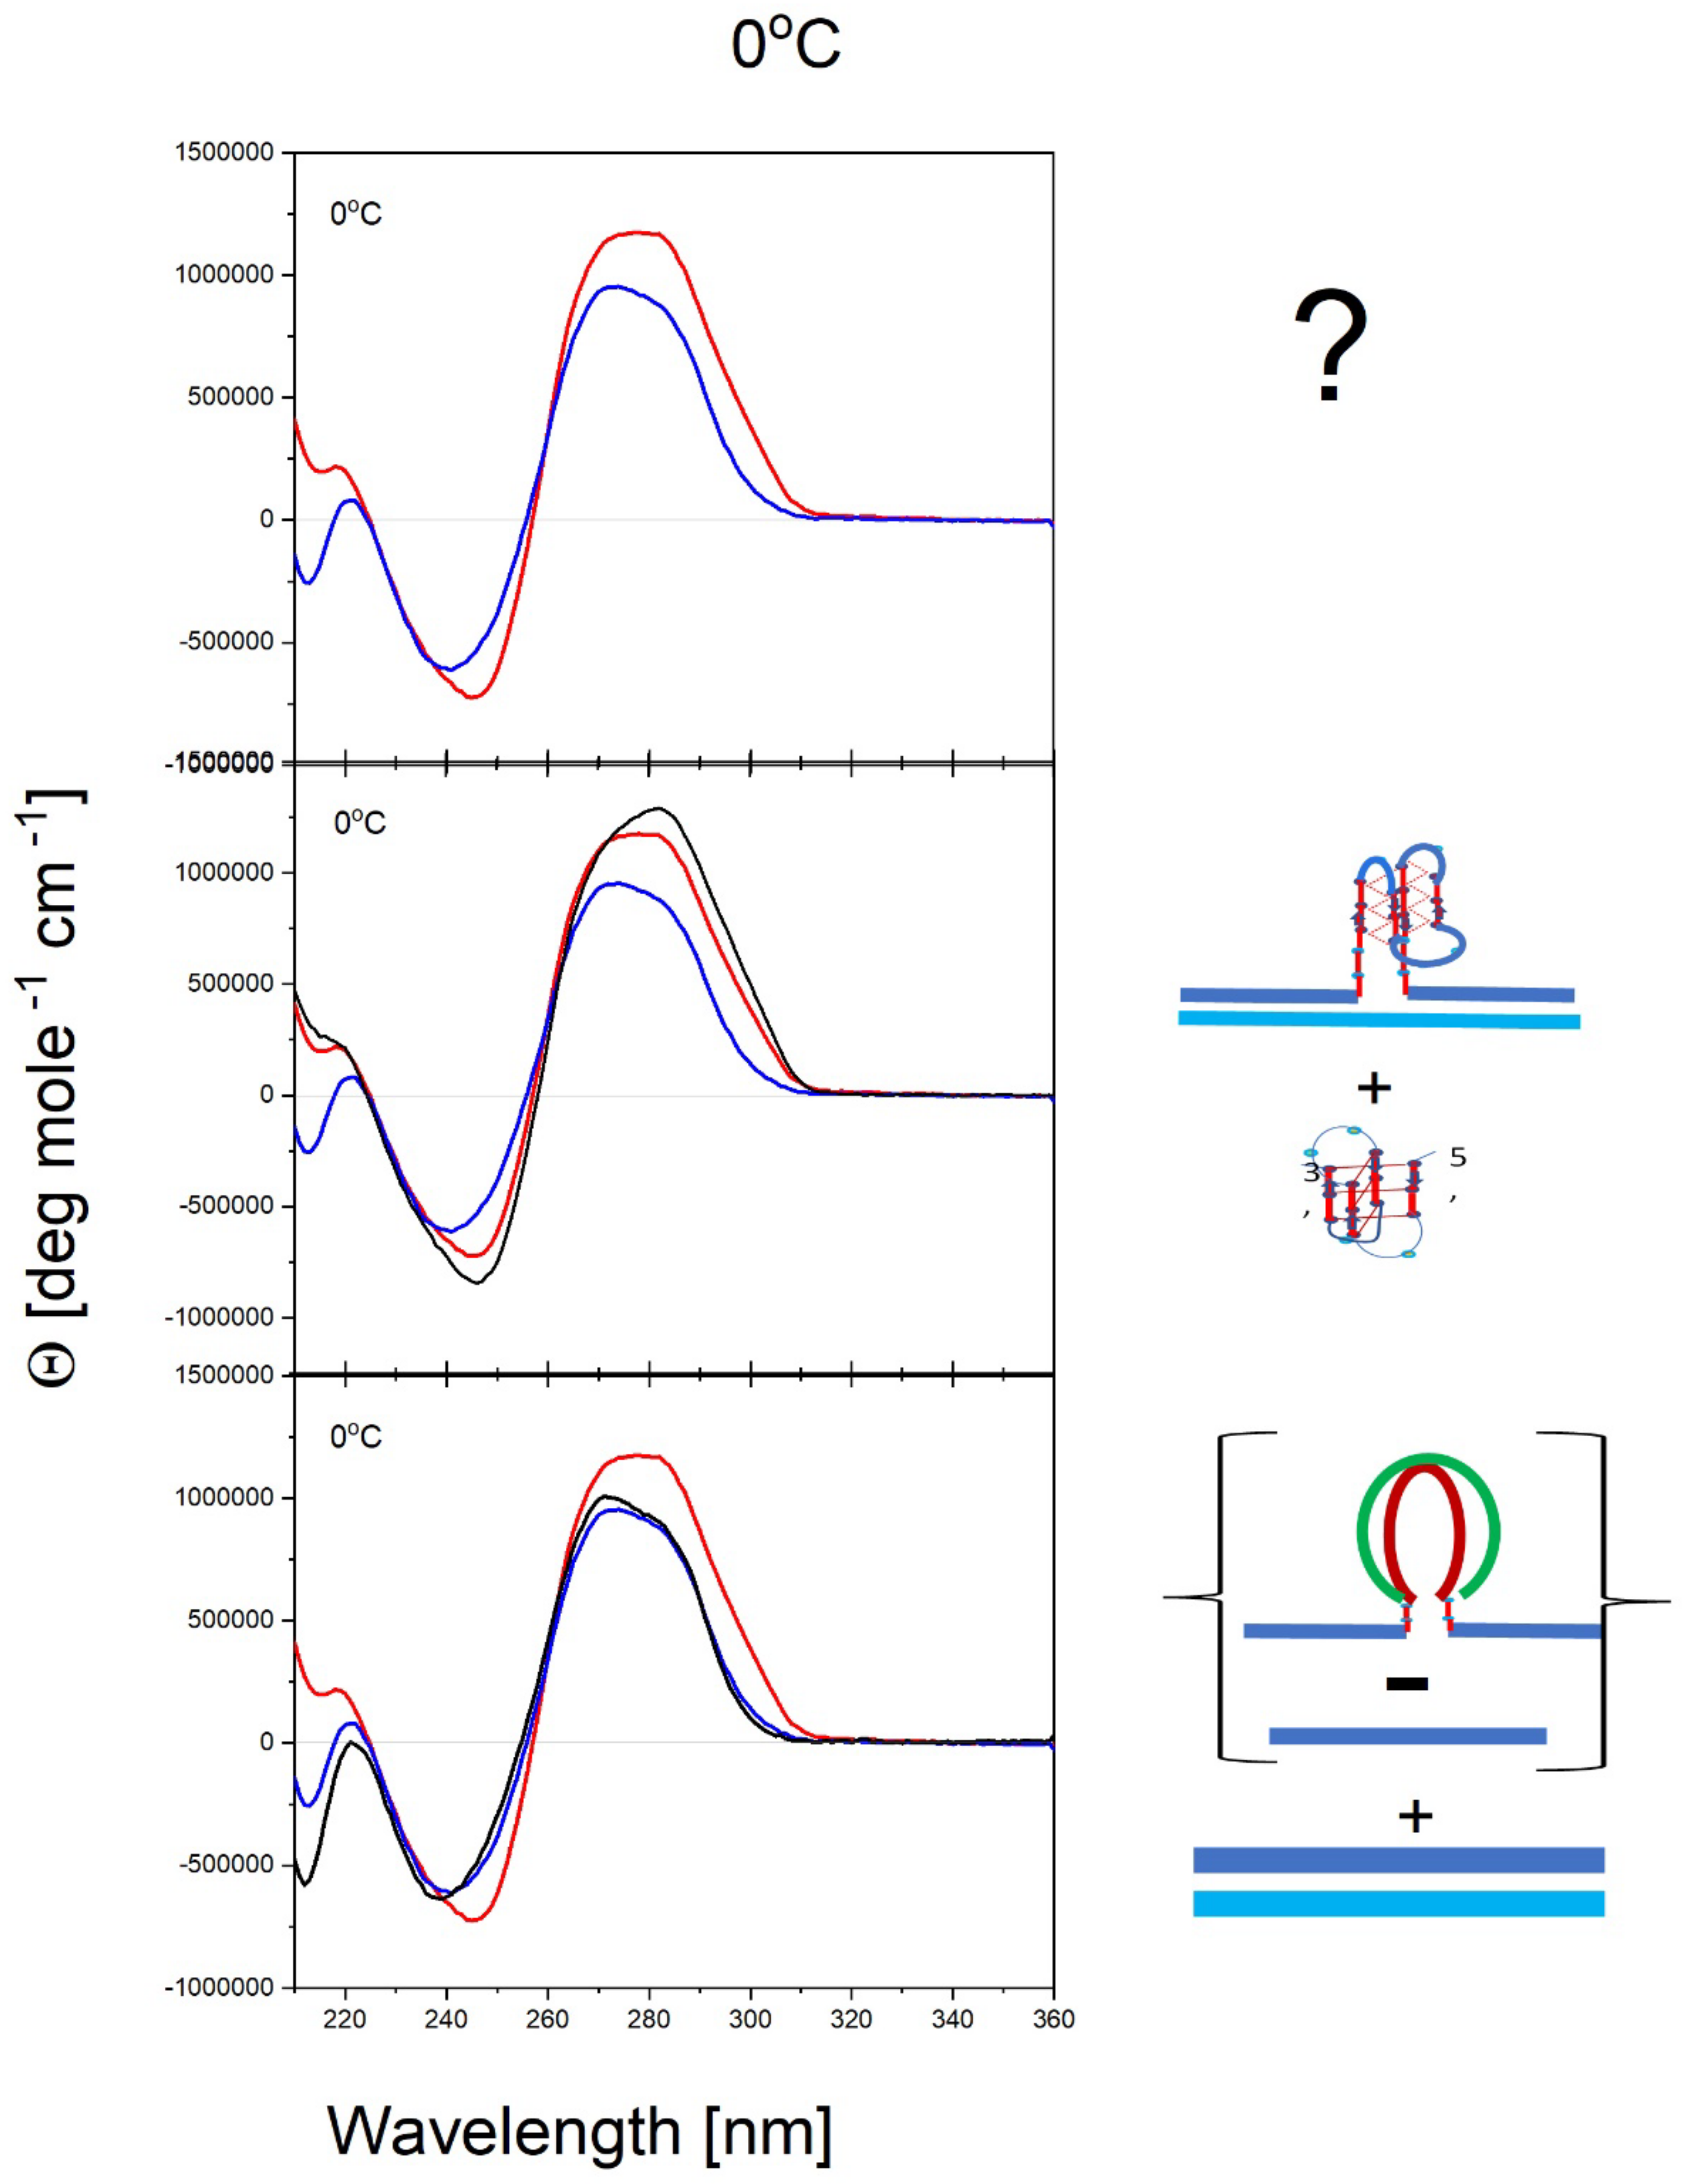
Based on these collective observations we propose that formation of the G4ˑC4 loop-duplex domain by strand invasion of the IS oligomer into the G4 quadruplex flanked by upstream and downstream duplex arms is a very slow process (2 weeks incubation time at 4°C), and at least partially is inhibited by the G4 quadruplex and IS iDNA secondary structures. The slow formation of the G4ˑC4 loop-duplex at 4°C suggests that the G4ˑC4 loop-duplex, while kinetically inhibited, is thermodynamically favored over the isolated IS iDNA and G4 quadruplex conformers. Support for this interpretation comes from our observation that the CD spectrum measured immediately after mixing can be approximated by the sum of the CD spectra of the components that were mixed together (cMycGˑ22merC0 and IS), suggesting minimal interactions between the components that were mixed. By contrast the CD spectrum measured after 2 weeks incubation at 4°C is best approximated by the sum of the CD spectra of the duplex components (22mer duplex and cMycGˑIS minus 22merG0) suggesting that the conformation after 2-week incubation includes interactions between IS and cMycGˑ22merC0 that are substantially similar to the G4ˑC4 duplex seen in cMycGˑIS (Figure 5).
Figure 5.
Panel 1 show the differences in CD spectrum for cMycGˑ22merC0:IS at 0°C obtained immediately after mixing (red curve), and after 2-week incubation at 4°C (blue curve). As shown in Panel 2 the CD spectrum of cMycGˑ22merC0:IS at 0°C immediately after mixing (red curve) is best approximated by the sum of the spectra of isolated cMycGˑ22merC0 and IS,(black curve), whereas panel 3 shows that the CD spectrum of cMycGˑ22merC0:IS after 2 week incubation at 4°C (blue) is best approximated by the sum of CD spectra of the cMycGˑi CShort duplex plus 22merC0ˑ22merG0 duplex minus 22merG0 single strand (black curve). Subtraction of 22merG0 single strand is needed to account for the singe stranded overhanging ends in the cMycGˑIS duplex.
In summary, based on the collective observations reported here, our data reveal a balance between slow strand invasion and faster expulsion of the invading strand, as illustrated pictorially in the summary flow charts. Such an intriguing balance of coupled events explains the melting behavior we observe absent prolonged incubation at low temperature. We further posit that upon melting of the IS secondary structure in freshly mixed samples, strand invasion accelerates relative to the 4°C sample. Nevertheless, the strand invasion reaction remains slow relative to the slow heating rate of these experiments, thereby resulting in the observed offset in the temperature (and time) axis of the 2Ap fluorescence change relative to the IS CD melting curve. We further propose, based on the melting behavior of the 2-week incubated sample, that during the melting process of the freshly mixed sample, any temperature-induced increase in the rate of strand invasion to form the G4ˑC4 loop-duplex is increasingly counteracted by concurrent melting of some fraction of the newly formed G4ˑC4 loop-duplex.
Note that the initial melting of the cMyc Gˑ22merC0: IS sample incubated for 2 weeks starts and ends at a slightly higher temperature than the melting/invasion by IS of the freshly mixed cMycGˑ22merC0: IS sample. The net result of these opposing processes, namely, the relatively slow invasion of denatured IS into the G4 quadruplex to form the G4ˑC4 loop-duplex domain versus the relatively fast melting of the G4ˑC4 loop-duplex domain, yields the formation of a non-interacting cMycGˑ22merC0 complex plus the denatured IS construct following completion of the first transition observed in the complex melting profiles presented above.
- Hysteresis in cooling curves reflects competing kinetic processes that occur at different relative rates and lead to population of metastable intermediates.
Cartoon 6: cMycGˑ22merC0 plus IS hysteresis.
Our experimental results reveal hysteresis when reannealing/cooling the cMycGˑ22merC0: IS sample from temperatures above 35°C. Specifically, our measurements display characteristic and reproducible features in the reannealing curve; namely, an initial slow decrease in fluorescence followed by a subsequent gradual increase in fluorescence at lower temperatures. The initial (slow) decrease in the fluorescence signal upon cooling from 35°C to 20°C is expected, given the slow rate of formation of the G4ˑC4 loop-duplex from the cMycGˑ22merC0 complex and denatured IS. Indeed, incubation at 20°C results in slow mono-exponential kinetics of formation of the invaded cMycGˑ22merC0:IS complex, while also exhibiting the spectral characteristics of the 2-week incubated samples of cMycGˑ22merC0:IS when the reaction has reached its equilibrium state (not shown).
How then does one explain the gradual increase in fluorescence at temperatures below 20°C in the annealing curves? Close inspection of the CD spectra obtained below 20°C reveals an increase in that part of the CD signal that can be assigned to the iDNA form of IS. Folding of IS is an intramolecular process that is faster than the intermolecular interaction with the (folded) G4 domain. We also note that melting of the IS native state is incomplete at temperatures below 20°C. Since IS does not contain 2Ap, IS iDNA formation does not by itself cause an increase in the 2Ap fluorescence signal at lower temperature. Rather, as discussed above, the rate of G4ˑC4 loop-duplex formation from the folded form of IS is slowed down significantly, thereby reducing the rate by which cMycGˑ22merC0 converts to the low fluorescence cMycGˑ22merC0:IS complex. Fluorescence of 2Ap in the center of a parallel stranded G4 quadruplex shows a pronounced linear temperature dependence, even absent gross conformational changes. In part, the increase in 2Ap fluorescence we observe below 20°C can be assigned to this temperature dependence of 2Ap fluorescence in the parallel G4 quadruplex form that has not yet reacted with IS.
Furthermore, as we discuss in subsequent sections, unfolded IS appears to remain loosely associated with, but not formally bound to, the G4 loop domain, resulting in quenching of 2Ap fluorescence in the G4 quadruplex. Addition of folded IS at low temperature however does not cause a similar 2Ap quenching prior to strand invasion, suggesting that refolding of IS into its iDNA conformation in competition with strand invasion also reduces the IS induced quenching of the cMycGˑ22merC0 complex, which contributes to the observed increase in 2Ap fluorescence.
Based on these observations, we propose that upon reannealing we observe temperature dependent competition between intramolecular refolding of IS into the iDNA conformation in competition with intermolecular strand invasion to form the G4ˑC4 loop-duplex. The relative fractional occupancies of these competing states depend on the relative rates of formation at each temperature interval, with the intramolecular iDNA formation initially outcompeting strand invasion. The 2-week incubation data however suggest that the invaded complex is thermodynamically the most stable state, and eventually will form when sufficient time has passed (e.g. 2 weeks at 4°C). This reannealing behavior we observe represents an example of how relative differences in rates of competing pathways can lead to metastable intermediates and dictate the fractional occupancies one observes (see also von Hippel)[6].
The different processes contributing to changes in the low temperature heating and cooling curves of the cMycGˑ22merC0 plus IS mixtures discussed above are summarized schematically in Table 2.

Inspection of the information embedded in each of four top to bottom horizontal transformations illustrated in Table 2 leads us to the following conclusions:
- (1)
- For a freshly prepared sample, we propose coupled transformations that correspond to the invasion of the G4 quadruplex by IS, likely via an unfolded intermediate, followed, at slightly higher temperature, by the melting of the G4ˑC4 loop-duplex.
- (2)
- For a sample incubated at 4°C, we propose formation of the G4ˑC4 loop-duplex, with the unfolded IS as a likely intermediate, coupled transformations that collectively exhibit complex kinetics.
- (3)
- For a sample incubated at 20°C, we propose formation of G4ˑC4 loop-duplex with slow, single exponential kinetics associated with IS invasion
- (4)
- For a sample preincubated at 4°C we propose melting of G4ˑC4 loop-duplex to form cMycGˑ22merC0 and IS. However, as we show in the next section, IS remains closely associated but not formally bound to cMycGˑ22merC0, leading to altered properties of the cMycGˑ22merC0 complex.
3.3.3. Temperature Domain [II.] cMycG·22merC0 in the Presence of IS
Coupled transformations as illustrated and discussed below
Cartoon 7: cMycGˑ22merC0:IS, Coupled Exchange of IS and 22merC0 bound to cMycG.
Comparison of cMycGˑ22merC0: IS with cMycGˑ22merC0: Evidence for IS induced changes in the nature of the G4 loop domain.
In Figure 6 we compare the fluorescent melting curve of the isolated cMycGˑ22merC0 complex (blue curve) to those observed for the 1:1 cMycGˑ22merC0:IS mixture at different incubation times. To facilitate this comparison, we scaled the y axis of the isolated cMycGˑ22merC0 melting curve in Fig 6 to mimic the magnitude of the cMycGˑ22merC0: IS transition that it most closely resembles in intensity. Note that we observe close agreement between the isolated cMycGˑ22merC0 melting transition and the 2nd, reversible, transition (transition 3 in Figure 3) at around 48°C, as seen in all the cMycGˑ22merC0: IS samples, regardless of the prior history of the sample. This observation suggests that the low temperature transitions (i.e. transitions labeled 1 and 2 in Figure 3- see also Table 2.) of the cMycGˑ22merC0: IS complex, indeed result in the formation of the cMycGˑ22merC0 complex plus the denatured IS strand. Subtle differences in shape of the 2nd melting transition (transition 3 in Figure 3) of cMycGˑ22merC0: IS relative to cMycGˑ22merC0 on its own, primarily at the high temperature side of the melting transition, are indicative of the impact of IS on cMycGˑ22merC0. Specifically, as outlined in Table 3, these subtle differences in the shape of the melting curve relative to that of cMycGˑ22merC0 without IS reflects binding of IS to free cMycG after dissociation of 22merC0, in what amounts to a coupled exchange reaction. We further discuss this exchange process below in the section on melting domain [III.].
cMycGˑ22merC0 in the presence of free IS differs from isolated cMycGˑ22merC0 absent IS;
Interestingly, when we compare fluorescence melting curves of cMycGˑ22merC0: IS and cMycGˑ22merC0 in real terms (i.e. not scaled to reflect similar changes in the magnitude of the fluorescent change in the transition region) we find significant differences in 2Ap fluorescence intensity following expulsion of the IS strand at temperatures above ~ 35 °C, compared to an cMycGˑ22merC0 sample that was never exposed to IS, despite identical sample concentrations. As illustrated in Figure 7, at temperatures below 10°C and above 65°C the 2Ap fluorescence intensities in both samples are almost identical, but between 10°C and 65°C there are significant differences. These fluorescence intensity differences also are mirrored by subtle differences in the corresponding CD spectra in this temperature range. (Figure 8). A direct comparison of the fluorescent melting curves in absolute terms (i.e., in “real terms”) is justified, as the signal in both cases originates from the single 2Ap base in the cMycG strand that is present in identical concentrations in both samples. A small reduction, not exceeding 6% in total fluorescence of the IS containing sample, can be assigned to an inner filter effect caused by the non-zero absorbance at 308nm of the added native IS iDNA. Such an inner filter effect is expected to diminish as IS melts/binds to the G quadruplex loop, since neither bound nor denatured IS retains significant absorbance at 308 nm compared to the iDNA state of the IS. The inner filter effect, however, cannot explain the observed loss of fluorescence seen in the presence of IS relative to the IS free sample at ~35°C. We note that the measured CD spectrum of the cMycGˑ22merC0:IS mixture at 36°C cannot be simply explained in terms of the sum of the CD spectra of isolated cMycGˑ22merC0 and free IS (black line in Figure 8). Collectively, these comparative observations suggest that after expulsion of the invading IS strand, either IS or cMycGˑ22merC0 or both adopt different CD sensitive conformations relative to the isolated components.
Equally intriguingly, we find that when IS is added to preformed cMycGˑ22merC0 at 36°C, a temperature above the first melting transition of the cMycGˑ22merC0:IS complex, we observe a rapid loss of fluorescence intensity and a change in the CD spectrum to values similar to what is seen during melting of the cMycGˑ22merC0:IS complex, as previously noted. The lack of further changes in the time-dependent spectral properties of a preformed cMycGˑ22merC0:IS sample heated to 36°C (not shown) suggests that an equilibrium state is reached after the first melting transition. How then does one explain the loss in fluorescence for the cMycGˑ22merC0:IS complex between 35°C and 55°C, when the invading IS strand has been expelled? In the next section we propose a possible explanation for these intriguing observations.
Figure 7.
compares, in absolute fluorescence terms, the fluorescent melting curves of the cMycGˑ22merC0 complex, which never has been exposed to the IS (black dots), to that measured for cMycGˑ22merC0:IS immediately after mixing (red dots). The small difference in initial fluorescence intensity at 0°C reflects an inner filter effect, not exceeding 6%, caused by the absorbance of the native IS, This inner filter effect is likely absent at higher temperatures when the IS is denatured, as neither denatured IS nor cMycGˑIS (or native or cMycGˑ22merC0:IS) significantly absorb at 308nm.
Figure 8.
Comparison between CD spectra for the cMycGˑ22merC0: IS complex at 36°C (red: initial heating, and blue: following 2 weeks incubation) versus calculated CD spectra derived by addition of the IS spectrum at 36 °C to native cMycGˑ22merC0 in K+ (black) versus the spectrum of isolated 22merC0 36 °C added to the spectrum of cMycGˑIS (Green). The lack of agreement in the CD spectra compared in Figure 8, especially in terms of iso-elliptic points between the measured CD spectra and the calculated/expected spectra for cMycGˑ22merC0 plus IS and cMycGˑIS plus 22merC0 is consistent with the cMycGˑ22merC0: IS sample at 36°C not being reflective of a mixture of these two species.
IS remains loosely associated with cMycGˑ22merC0 without being bound in a formal sense;
To explain these observations, we favor a model whereby the IS strand expelled from the G4ˑC4 loop-duplex domain remains loosely associated with the cMycGˑ22merC0 complex, without being formally bound via conventional base pairing interactions. Such loosely associated DNA states are reminiscent of solvent separated ion pairs which also are loosely associated as opposed to formally bound, like condensed counterions, as compared with the corresponding solvent-excluded, intimately “bound” ion pairs [126,127]. Based on our analysis, we posit that such an “IS associated state” may well reflect an IS induced altered equilibrium between a planar and a folded state of the pseudo three-way junction formed by the parallel G quadruplex embedded between upstream and downstream duplex domains. DNA three-way junctions containing unpaired bases at the junction, ([133,134,135,136,137]) as well as DNA pseudo three-way junctions, in which one of the arms is a CAG repeat bulge loop ([138,139]) are known to exist in a salt dependent dynamic equilibrium between a planar and one or two related folded states that differ by the relative stacking arrangement between the 3 arms in 3-dimensional space. This condition can prevail without altering base pairing interactions at the junction. Evidence for planar and bent/folded forms for an extruded G quadruplexes embedded within a larger duplex domain absent an invading strand, but conceptually similar to the one we have studied here, have recently been described based on cryo-microscopy studies ([140]). For these collective reasons, it is not unreasonable to suggest that addition of the polyanionic IS strand, that is “associated with the G quadruplex DNA”, may well alter such an equilibrium without necessarily being formally bound to the G quadruplex domain. Notably, changes in a planar vs folded equilibrium of the G quadruplex pseudo three-way junction due to a loosely associated, but not formally bound, IS strand is consistent with the observed subtle CD changes and more pronounced fluorescence changes described above. Moreover, such a “loosely associated” but not formally bound state may well reflect an early transition state along the pathway of strand invasion. Such a pathway would be reasonable to consider if and when conditions (e.g. temperature) allow for stand invasion to either form the G4ˑC4 loop-duplex upon cooling or to form the G4ˑC4 duplex upon expulsion of the 22merC0 strand.
Temperature domain [III.] Formation and melting of the cMycG·IS complex in the presence of 22merC0.
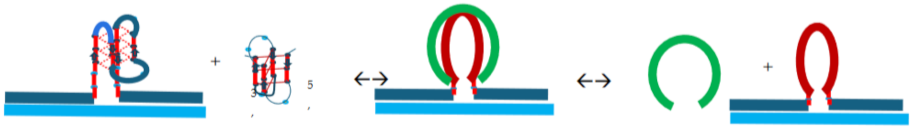
Cartoon 8: cMycGˑ22merC0 plus IS <-> cMycGˑ IS plus 22merC0 <-> cMycGplus IS plus 22merC0 .
Comparison of cMycGˑ22merC0: IS with cMycGˑIS: Evidence for a reversible temperature-controlled switch between cMycGˑ22merC and cMycGˑIS;
Figure 9 compares the 3rd melting transition observed for all cMycG·22merC0-IS samples (transition 4 in Figure 3) with the fluorescent melting curve of an isolated cMycGˑIS duplex. Recall that we previously proposed that the reversible transition 3 corresponds to melting of cMycGˑ22merC0 in the presence of “free” IS. However, given that the isolated cMycGˑIS complex exhibits a higher melting temperature than cMycGˑ22merC0, denaturation of cMycGˑ22merC0 allows for the formation of cMycGˑIS from the newly liberated and fully unfolded cMycG strand and free IS strand that is already present in solution. The coincidence in the melting curves observed for the 3rd melting transition of the cMycG/22merC0/IS sample with the melting curve of the isolated cMycGˑIS duplex suggest that, upon melting of cMycGˑ22merC0, cMycG reassociates with IS to form cMycGˑIS with free 22merC0. In effect, melting transition 3 corresponds to a coupled exchange of DNA strands bound to cMycG from 22merC0 to IS. Confirmation of this assignment comes from a comparison of the measured CD spectra at 50°C with the CD spectra calculated by adding up independently measured spectra for cMycGˑIS and free 22merC0, as illustrated in Figure 10.
Figure 10.
Comparison of the observed CD spectrum for cMycGˑ22merC0: IS at 50°C (red: initial heating, and blue 2weeks incubated) versus calculated CD spectra by addition of the 22merC0 spectrum at 50 °C to that of native cMycGˑIS at 50 °C (black)).
Figure 10.
Comparison of the observed CD spectrum for cMycGˑ22merC0: IS at 50°C (red: initial heating, and blue 2weeks incubated) versus calculated CD spectra by addition of the 22merC0 spectrum at 50 °C to that of native cMycGˑIS at 50 °C (black)).
Temperature controlled reversible exchange between 22merC0 and the IS bound to cMycG;
More interesting than the initial formation of the cMycGˑIS complex upon melting of cMycGˑ22merC0 and its subsequent denaturation, is the observation that both transitions are fully reversible upon cooling. This observation suggests that during cooling from the fully denatured state, cMycGˑIS initially reforms in accordance with its higher melting temperature, while the 22merC0 remains free in solution. However, at the temperature where the cMycG·22merC0 complex in isolation becomes stable, the 22merC0 strand displaces the already bound IS strand to reform the cMycG·22merC0 complex, releasing the bound IS strand. We have tested this hypothesis by adding free 22merC0 to pre-formed cMycGˑIS complex at 36°C. Based on characteristic CD and fluorescence changes, we observe the rapid displacement of the bound IS strand to form cMycGˑ22merC0 and ‘free’ (perhaps “loosely associated”) IS. As noted earlier, this observation is consistent with our melting studies which suggest that by 36°C IS has been displaced from (but perhaps remains loosely associated with) the cMycGˑ22merC0 complex, thereby resulting in cMycG ˑ22merC0 plus “free” IS.
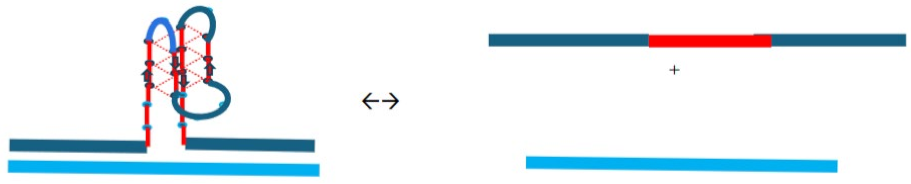
The rapid displacement of the IS strand suggests that the overhanging upstream and downstream single stranded arms in cMycGˑIS provide ideal “toehold-like” nucleation sites ([141,142,143]) for initiating cMycGˑ22merC0 formation. However, our system is unlike the ‘conventional’ toehold strand displacement reactions, where the invading strand binds to a single stranded toehold domain and then displaces an already bound strand downstream from the toehold domain by competition for base pairing interactions. Instead, in our case, the 22merC0 does not physically compete with the IS strand for base pairing sites, but rather bridges the G4 domain to optimize all base pairing interactions in the upstream and downstream duplex domains. Simultaneously, the base paired G4ˑC4 domain is forced to loop out. We posit that constraints imposed by the persistence length of G rich duplexes that make up the G4ˑC4 loop-duplex, when forced to conform to the restricted loop dimensions, destabilizes the base pairing interactions between the G4 domain and the IS strand. We posit further that such destabilization of the base paired loop region, coupled with the availability of energetically favorable intra loop G-G type base pairing interactions within the single stranded G4 loop, collectively result in the displacement of the IS strand at intermediate temperatures (i.e. temperature domain [II.]). We also know from the results we presented above that at much lower temperature (i.e. in temperature domain [I.]) IS can successfully reinvade and form a stable G4ˑC4 loop-duplex complex, albeit one with much lower melting temperature and very slow formation kinetics. These observations suggest significantly different temperature dependencies in the balance of forces stabilizing/ destabilizing the G4ˑC4 base pairs within a linear duplex versus within a loop-duplex arrangement. Such balancing of competing forces may be required for the invading strand to act as a catalyzme/ catassembler ([144,145]). Additional support for such a novel point of view comes from our observation that in a dumbbell construct which is less able to accommodate a base paired rigidly constrained G4ˑC4 domain, due to restricted rotation of the upstream and downstream duplex domains, the melting temperature for displacement of the invading IS strand is even lower than in the cMycGˑ22merC0: IS complex reported here (unpublished results), while the G4ˑC4 duplex with unpaired upstream and downstream duplex arms is never populated.
3.4. How IS Interacting with the G4 Quadruplex Domain Influences cMycGˑ22merC0 Properties
3.4.1. Invasion of the G4 Quadruplex is Kinetically Inhibited by the Quadruplex Fold as well as by The Self-Structure of the Invading Strand
To summarize, we find that the IS when added to the pre-formed cMycG·22merC0 quadruplex can unfold and invade the parallel stranded G quadruplex domain of cMycG·22merC0 at low temperatures to form a constrained G4·C4 loop-duplex embedded within upstream and downstream duplex domains, although it does so very slowly. The main conclusions discussed in this section are pictorially summarized in flowchart 2. The G4·C4 loop-duplex that results from the invasion process has features resembling that of a three-stranded, branched D-loop, a feature that plays important roles at telomere ends and during nonhomologous strand exchange processes ([13,14,146]r[124,125] [19,147]). The complex invasion kinetics at 4˚C, where the IS adopts the iDNA conformation, coupled with the more conventional but slow single exponential kinetics at 20˚C, where IS is fully unfolded, suggest that the invasion process proceeds via the unfolded state of IS. However, even at 20˚C, where the secondary structure of IS is fully denatured under our conditions, the kinetics of strand invasion is still orders of magnitude slower than expected for conventional duplex formation ([148,149,150]). We also find very slow kinetics of G4·C4 duplex formation compared to non-quadruplex forming sequences for interactions of denatured IS with the cMycG single strand. The G4 domain within the cMycG single strand adopts an ensemble of G quadruplex conformations that includes, among other, the parallel G quadruplex adopted by cMycG·22merC0 (Not shown). We also find that addition of 22merC0 to a preformed cMycG· IS duplex already containing the G4·C4 duplex at low temperatures (20°C and below) results in the comparatively rapid formation of the cMycG·22merC0:IS complex, which is seen only after two weeks incubation when adding IS to preformed cMycG·22merC0.
Considering these multiple observations/results collectively, suggests that, in addition to the IS self-structure, the quadruplex fold also slows down the invasion process. It is likely that the base pairing arrangements in the G quadruplex inhibits initiation complex formation with (unfolded) IS, thereby slowing invasion kinetics despite the resulting duplex being the thermodynamically more stable state. We also posit that the kinetics of the denatured IS invasion is slowed down by the sequence redundancy inherent in any G quadruplex domain, (as well as the invading complementary strand) which can lead to sequence misalignment in some of the initiation complexes. Given the cooperative nature of the G quadruplex structure, we expect that even misaligned initiation complex formation between the invading IS strand and the G4 domain will disrupt the quadruplex structure. While such misaligned initiation complexes will need to be unfolded again for strand invasion to proceed to completion, it may be sufficient to prevent refolding of the G quadruplex on the timescale of “repair” of the misaligned initiation complex. The combination of both processes, in addition to the need to, at least partially, unfold the invading IS strand, makes for a highly “rough” energy landscape for invasion, with many local energy minima traps, thereby resulting in the correspondingly slow invasion kinetics. Going forward, it may be of interest to see if invasion by a DNA strand that is able to form a toehold “guide duplex” [143]with bases of one of the adjacent duplex domains might speed up the invasion kinetics, not only through improved initiation complex formation via the toehold domain, but also by guiding the alignment of the invading strand.
3.4.2. The Product of Invasion of the G quadruplex by IS: The G4·C4 Loop-Duplex, Is Thermally less Stable than the Corresponding Linear G4·C4 duplex
Once formed, the G4·C4 loop-duplex is relatively unstable compared to the equivalent G4·C4 duplex that is not constrained into a loop topology by neighboring duplex arms. The constraint imposed by the loop topology leads to a decrease in melting temperature of some 30˚C (ΔTm= 30˚C) relative to the unconstrained duplex, as summarized in flowchart 4. Interestingly, expulsion of the invading IS strand does not lead to the recovery of the optical properties characteristic of the parallel G4 quadruplex structure in cMycG·22merC0, even though the parallel G4 quadruplex is stable at this temperature absent the IS strand.
3.4.3. Expulsion of the Invaded IS Strand Does not Allow Refolding of the G4 Quadruplex into the Conformation it Adopts Absent the Invading Strand
Subtly different CD spectra and vastly different fluorescence intensities of cMycG·22merC0 with and without IS present are consistent with structural alterations in the cMycG·22merC0 quadruplex after expulsion of the invading IS strand. It is currently unclear what conformation is adopted by the G4 domain in cMycG·22merC0 in the presence of IS, except that it is clearly not a fully unfolded loop either, based on comparison to cMycG·22merC0 in Li salt. The change in nature of the G4 domain is also not related to a trapped conformation after expulsion of the invaded IS strand, as it also forms rapidly when the IS is added to the fully folded cMycG·22merC0 at temperatures above the expulsion temperature for IS and below the melting temperature for cMycG·22merC0. Further, we do not detect any melting transition that could be assigned to partial base pairing interactions between IS and the G4 domain, although such a transition, if it exists, may be masked by the other melting processes. We speculate that the presence of the IS strand might alter the open (planar) /closed (2 stacked arms) equilibrium of the pseudo three-way junction that a G quadruplex embedded within upstream and downstream duplex domains resembles;[134,135,136,139,140,151] however, we currently do not have experimental evidence for this assertion. In the absence of additional information, we have chosen to refer to the conformation adopted by cMycG·22merC0 in the presence of IS as an “IS associated” conformation. It will be of considerable interest to see to what extend this “IS associated” state differs in terms of thermodynamic and kinetic stability compared to the parallel stranded G4 quadruplex absent the IS strand. Furthermore, it would be of interest to explore if and how the interactions of G4 quadruplex processing enzymes are altered by the presence of an IS or related oligonucleotide strands. Possible changes in regulatory outcomes due to subtle differences in DNA topology not requiring altered base pairing arrangements, perhaps triggered by the presence of an “associated” DNA strand, similar to what we observe here, have heretofore not been widely considered.
3.4.4. IS displaced from the G4·C4 Loop-Duplex Domain Can Reversibly Rebind cMycG After Melting of the cMycG·22merC0 Complex
We further observe that when cMycG·22merC0 melts in the presence of IS, the IS rebinds to the now free cMycG strand to form the cMycG·IS duplex with overhanging 3’ and 5’ single strands. Melting of cMycG·22merC0 and formation of cMycG·IS is a coupled process driven entirely by the differential stabilities of the base pairing interactions involved. It is of further interest to note that the coupled melting/formation reaction is entirely reversible upon cooling, with no hysteresis. In other words, upon cooling, the preferred formation of cMycG·22merC0 at lower temperature is coupled to the rapid displacement of IS from cMycG·IS, an observation we also have confirmed by adding free 22merC0 strand to preformed cMycG·IS within temperature domain [II.]. Intrguingly, the highly G rich G4·C4 domain does not provide a kinetic block to strand displacement by the 22merC0 strand. The strand displacement of IS by 22merC0 is entirely thermodynamically controlled, and likely aided by the ability of 22merC0 to rapidly form stable “toeholds” with either the upstream or downstream arms of cMycG or both. These observations provide yet another manifestation of an energetic cost being imposed by the loop topology on the G4·C4 duplex (see also flowchart 4). The loss of base pairing interactions between the G4 domain and IS is paid for by optimizing base pair formation in the upstream/downstream duplex arms, thereby constricting the G4 domain to a loop topology coupled with self-structure formation within the free G4 domain, even though the linear G4·C4 duplex formed between cMycG and IS is thermodynamically stable under these conditions. The fact that IS can and does bind to the G4 domain again at much lower temperatures (<30˚C) suggests significant differential heat capacity influences in this system that may not be readily apparent based on knowledge of heat capacity terms of its linear components [152,153,154,155,156,157,158]. It is worth noting that such differential temperature/heat effects coupled to topological constraints are likely an important, and largely unexplored, feature of higher order nucleic acid structures, especially those that can exist in dynamic equilibrium between different conformational states.
3.4.5. The Hysteresis Upon Cooling Is Driven by Differential Rates of Interactions Between the Invasion complex and the IS Self-Structure
As summarized in Flowchart 3, the results described above allow us to understand the hysteresis observed in temperature domain [I.] upon cooling. It is precisely the preference for the cMycGˑ22merC0 duplex over the cMycGˑIS duplex that creates the conditions that lead to the hysteresis we observe. To be specific, we have shown that addition of 22merC0 to pre-formed cMycGˑIS at low temperature leads to the rapid formation of the cMycGˑ22merC0:IS complex, but addition of IS to preformed cMycGˑ22merC0 requires a 2-week incubation time to achieve the same result. Preferential formation of cMycGˑ22merC0 upon cooling means that at the boundary between temperature domains [II.] and [I.], at ~30˚C, the sample contains unfolded IS that is in some manner “associated”, but not formally bound in a classic base pairing sense, with cMycG·22merC0. The G4 domain in the cMycG·22merC0 complex formed upon cooling in the presence of IS is structured, but not necessarily in its equilibrium parallel G4 quadruplex fold. The exact nature of the G4 domain and its “association” with IS is as yet unknown; however, detailed knowledge of the specifics of this “soft” interaction is not needed for understanding the basis of the hysteresis phenomenon. Invasion of the G4 domain by the unfolded IS oligonucleotide occurs, but it proceeds more slowly than the change in temperature during our cooling experiment, with the invasion rate slowing down further as the temperature decreases. Below 20˚C, a competing reaction in the form of the much faster intramolecular folding of IS into the iDNA state becomes more pronounced. iDNA formation by IS is primarily thermodynamically controlled, meaning the fraction of denatured iDNA that folds into the iDNA state is determined by the temperature, at least for the relatively slow cooling rates studied here. It is worth underscoring that DNA constructs with longer C tracts folding into the iDNA state can also become dependent on time ([159,160]. The iDNA folded state of IS however is thermodynamically less stable than the IS base paired to the G4 domain of cMycG·22merC0. Consequently, below 20˚C, the initial fractional occupancy of the iDNA state and the cMycG·22merC0-IS complex is determined entirely by the difference in rates by which these two states form, with the iDNA state once formed, gradually unfolding and invading the cMycG·22merC0 complex at a very slow rate. In short, as the temperature is lowered below 20˚C, the much faster rate of forming the iDNA state relative to the cMycG·22merC0:IS complex leads to the fraction of unfolded IS to preferentially fold into the iDNA state, which represents a kinetically trapped metastable state. The similarity in the cooling curves for both samples shown in Figure 2 and/or Figure 3 reflects the identical cooling rates from identical initial conditions at 30˚C. Significantly, under such circumstances, the dominant factor that determines the population distribution upon annealing is time rather than thermodynamic stability.
3.5. Integrating and Summarizing the Interactions Between the Multiplicity of DNA States
The primary results of our analysis of the multiple conformational transitions discussed here, are summarized pictorially in Flow chart 1. We initially presented this flow chart near the beginning of this article to foreshadow and summarize the time and temperature-dependent interacting DNA states proposed herein, based upon differential spectroscopic profiles. We reproduce it again here, as well as the other flow charts, so we can further elaborate on the assigned transformations, now in the context of the more detailed spectroscopic characterizations that we subsequently presented.
Flowchart 1
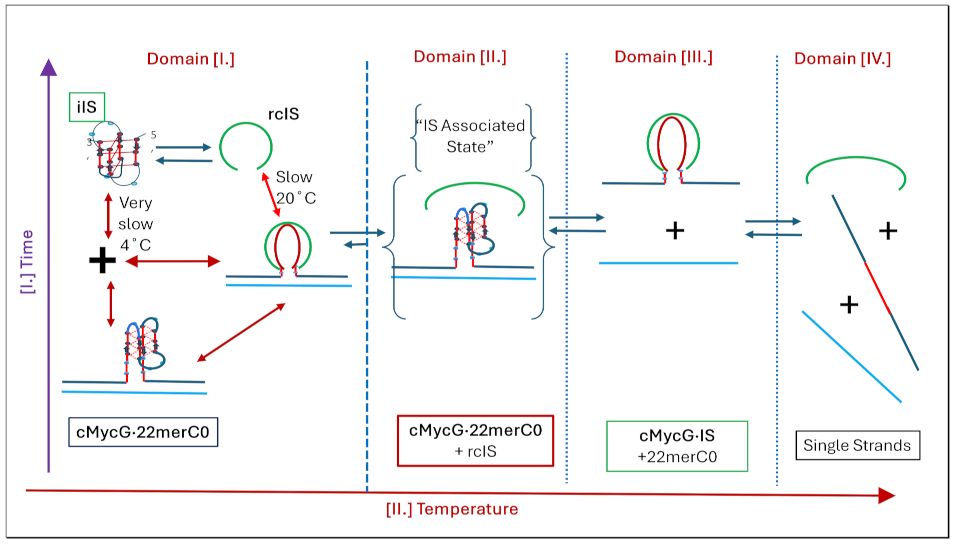
Our collective results are consistent with three overarching conclusions, which we propose reveal how coupled and uncoupled transformations aid in our understanding of dynamic processes in higher order nucleic acid systems. As we present each general conclusion below, we also underscore specific practical implications/applications. We emphasize that potential in vivo regulatory pathways may make use of the myriad of countervailing kinetically and thermodynamically-controlled transformations and species distributions associated with the cascade of interconversions activated/triggered by strand invasions of nonconical, higher-order DNA polymorphs. We list below our global conclusions, as well as, when appropriate, pictorially illustrate the associated molecular event(s) within the relevant flow chart(s)
Flowchart 2: Strand Invasion and Disruption of secondary structure
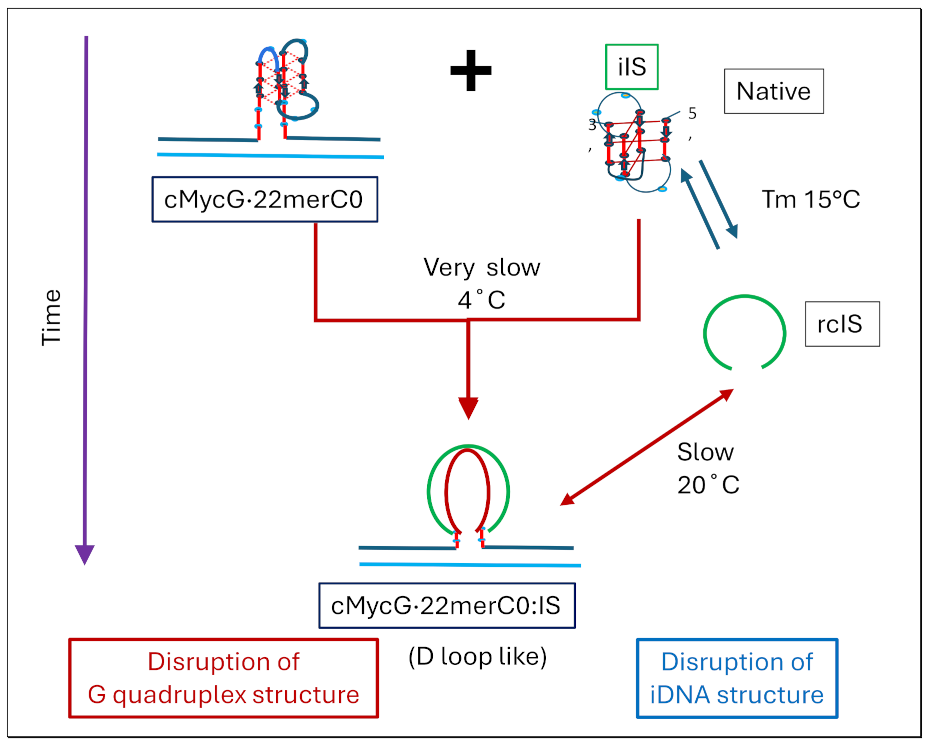
1) Depending on the temperature domain probed, a short C-rich oligonucleotide, in either its iDNA folded state, or its unstructured denatured state, which possesses sequence complementary to a parallel G quadruplex strand, can invade and disrupt the DNA secondary structure of the target species (see flow chart). The invasion process also disrupts any secondary structure present in the invading strand. This overall process exhibits slow kinetics, reflective of the composite impact of the different initial states of the invading C-rich strand, as well as any coupled perturbations in the target G-quadruplex.
Such strand invasion and disruption of DNA secondary structures, in either or both the invading and invaded species, represents a potential pathway for the controlled unfolding of kinetically trapped DNA states, such as the parallel G quadruplex studied here. The ability to unfold kinetically trapped states in a controlled manner is a feature that would enhance the ability for such states to be involved in biological regulatory mechanisms, such as has been proposed for the G rich domain of the NHEIII element in the cMyc oncogene promoter on which our model system is based [79]. It is also a potential avenue by which such DNA secondary structure-based regulatory switches may be manipulated for biomedical purposes via the deliberate addition of exogenous invading oligonucleotides. Our results suggest the use of such invading exogenous oligonucleotides, or oligonucleotide analogues, in a modified antisense/antigene strategy to regulate oncogene expression. More generally, the observations reported here suggest a potential avenue by which any DNA secondary structure susceptible to strand invasion events may be controlled and regulated.
2) Our results also highlight the importance of metastability for noncanonical nucleic acid structures, as well as the interplay between slower and faster kinetic processes in determining preferentially populated states at any given point in time.
Furthermore, our spectroscopic mapping of higher-order DNA conformational transformations suggest that the population of specific states can be defined and modulated by sample history, irrespective of where the thermodynamic equilibrium lays.
Flowchart 3: Metastability and Sample History
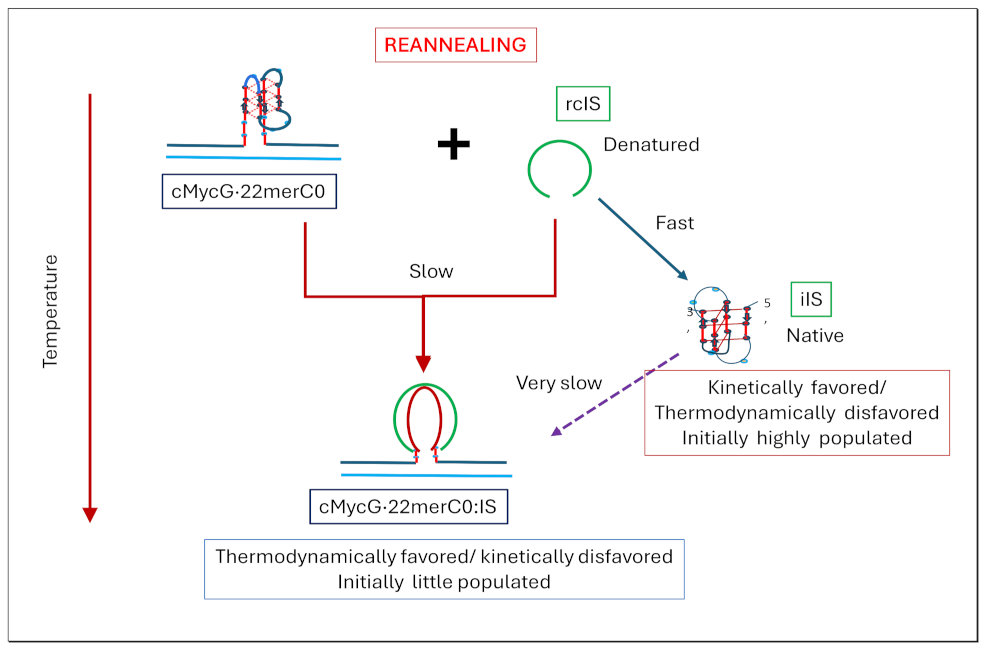
This observation underscores the importance of sample history in terms of relative refolding rates that dictate the populations of intermediate states, which, in turn, influences the preferred pathway for further folding steps, as revealed in our reannealing data (see flow chart 3).
3) Finally, our results provide evidence for topological constraints impacting the stabilities of base paired domains, which, in turn, may impact biological outcomes of higher-order nucleic acid secondary structures. Topological constraints are not readily accounted for in current nucleic acid models
Flowchart 4: Topological constraint
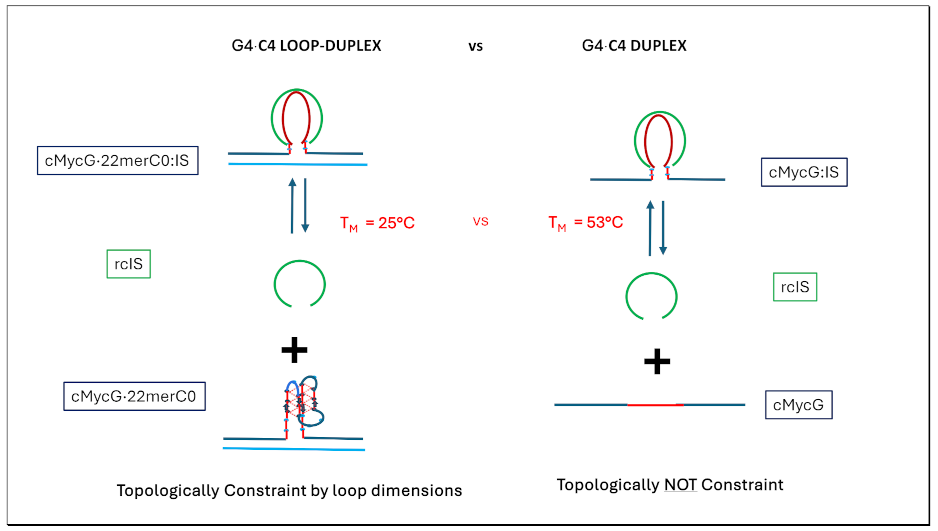
We observe that the G4ˑC4 duplex formed between the G4 domain and the invading IS oligonucleotide can be disrupted at low temperature when constrained by loop dimensions, as well as reversibly re-forming at higher temperature, when the loop constraint is absent. These observations provide a compelling example of the influences of topological constraints. Furthermore, topological constraints do not need to be large to exert their effects. Our results further suggest the impact of differential heat capacity effects, an influence that also is not readily accounted for in current models of DNA rough energy landscapes.
In mapping the cascade of strand-invasion induced DNA transformations, we primarily have used temperature to manipulate populations of different DNA oligonucleotide states. However, the transient formation of DNA states related to our temperature-induced states also can be induced isothermally as a result of several biological processes acting on genomic DNA. For example, strand separation as a result of passage of a polymerase can potentially cause formation of isothermal single loop domains that, in turn, can interact with short invading strands like IS. When the resulting loop is similar in size to the G4 domain, and /or has folded into its competing G quadruplex form, interactions between the short invading strand and the transiently single stranded looped out domain are likely to be topologically constrained, as we observe here for cMycGˑ22merC0: IS. However, when the resulting loop is very large, interactions between the invading strand and single stranded looped out domain are more like what we observe when the cMycGˑIS complex is formed. In either case, an invading short IS-like oligomer can have pronounced effects on the resulting pathway by which the (transient) equilibrium is reestablished.
Concluding Remarks
In the aggregate, the spectroscopic studies reported here demonstrate the diversity and complexity associated with the mapping of the countervailing forces, and the coupled/linked transitions, that collectively dictate the relative populations and interrelated transformations of DNA species produced by strand invasion of noncanonical, higher-order DNA structures (e.g. G-quadruplexes and iDNA tetraplexes). Such higher-order structures are of particular interest, given their frequent over-representation in gene promoter and enhancer regions. [60,61,62,63] As we have underscored, strand invasion of noncanonical, higher-order DNA secondary structures, produces a range of DNA polymorphs that exhibit unanticipated properties that likely could be of functional significance. Consequently, studies such as those reported here not only are important for a fundamental understanding of the diversity of forces that modulate the “rough” energy landscapes associated with the kinetic and thermodynamically controlled polymorphism of higher order DNA constructs, but also are essential for the rational design of ligands/drugs that selectively target biologically relevant check points within such complex conformational cascades induced by strand invasion events. After all, the most important DNA regulatory target(s) do not necessarily align with the most stable and/or the most highly populated DNA species. Hence the significance, as emphasized here, of mapping the “rough” energy landscapes of noncanonical DNA structures and their associated transformational pathways.
Author Contributions
Conceptualization, J.V., V.G. and K.J.B.; methodology J.V., V.G. and K.J.B.; formal analysis, J.V., V.G. and K.J.B.; investigation, J.V., V.G. and K.J.B.; writing—original draft preparation, J.V.; writing—review and editing, J.V., V.G. and K.J.B.; visualization, J.V., V.G. and K.J.B.; supervision, J.V. and K.J.B.; project administration, K.J.B.; funding acquisition, K.J.B. All authors have read and agreed to the published version of the manuscript.
Funding
This research was funded by the National Institutes of Health, grant numbers GM23509, GM34469, and CA47995 (all to K.J.B.).
Institutional Review Board Statement
Not applicable.
Informed Consent Statement
Not applicable.
Data Availability Statement
Data is contained within the article or supplementary material Or: Dataset available on request from the authors.
Acknowledgments
The authors wish to acknowledge Drs Craig A Gelfand and G. Eric Plum for insightful suggestions and helpful discussions.
Conflicts of Interest
The authors declare no conflicts of interest. The funders had no role in the design of the study; in the collection, analyses, or interpretation of data; in the writing of the manuscript; or in the decision to publish the results.
References
- Nussinov, R.; Wolynes, P.G. A second molecular biology revolution? The energy landscapes of biomolecular function. Phys Chem Chem Phys 2014, 16, 6321–6322. [Google Scholar] [CrossRef] [PubMed]
- Wales, D.J. Energy Landscape Applications to Clusters, Biomolecules and Glasses, University of Cambridge: Cambridge, 2004.
- Wales, D.J. Exploring Energy Landscapes. Annu Rev Phys Chem 2018, 69, 401–425. [Google Scholar] [CrossRef]
- Kim, K.; Wang, J. Potential Energy Landscape and Robustness of a Gene Regulatory Network: Toggle Switch. PLOS Computational Biology 2007, 3, e60. [CrossRef]
- Prada-Gracia, D.; Gómez-Gardeñes, J.; Echenique, P.; Falo, F. Exploring the Free Energy Landscape: From Dynamics to Networks and Back. PLOS Computational Biology 2009, 5, e1000415. [CrossRef]
- Greive, S.J.; Von Hippel, P.H. Thinking quantitatively about transcriptional regulation. Nat Rev Mol Cell Biol 2005, 6, 221. [Google Scholar] [CrossRef] [PubMed]
- Wang, G.; Vasquez, K.M. Dynamic alternative DNA structures in biology and disease. Nature Reviews Genetics 2023, 24, 211–234. [Google Scholar] [CrossRef] [PubMed]
- Matos-Rodrigues, G.; Hisey, J.A.; Nussenzweig, A.; Mirkin, S.M. Detection of alternative DNA structures and its implications for human disease. Molecular Cell 2023, 83, 3622. [Google Scholar] [CrossRef]
- Tateishi-Karimata, H.; Sugimoto, N. Roles of non-canonical structures of nucleic acids in cancer and neurodegenerative diseases. Nucleic Acids Res 2021, 49, 7839–7855. [Google Scholar] [CrossRef]
- Bacolla, A.; Wang, G.; Vasquez, K.M. New Perspectives on DNA and RNA Triplexes As Effectors of Biological Activity. PLOS Genetics 2015, 11, e1005696. [Google Scholar] [CrossRef]
- Bacolla, A.; Wells, R.D. Non-B DNA conformations as determinants of mutagenesis and human disease. Mol Carcinog 2009, 48, 273–285. [Google Scholar] [CrossRef]
- Shibata, T.; Iwasaki, W.; Hirota, K. The intrinsic ability of double-stranded DNA to carry out D-loop and R-loop formation. Computational and Structural Biotechnology Journal 2020, 18, 3350–3360. Available online: https://www.sciencedirect.com/science/article/pii/S2001037020304475. [CrossRef]
- Prado, F. Homologous Recombination: To Fork and Beyond. Genes 2018, 9. [Google Scholar] [CrossRef]
- Krejci, L.; Altmannova, V.; Spirek, M.; Zhao, X. Homologous recombination and its regulation. Nucleic Acids Research 2012, 40, 5795. [Google Scholar] [CrossRef]
- Vickers, i.A.; Griffith, M.C.; Ramasamy, K.; Risen, L.M.; Freier, S.M. Inhibition of NF-κB specific transcriptional activation by PNA strand invasion. Nucleic Acids Res 1995, 23, 3003–3008. [Google Scholar] [CrossRef] [PubMed]
- Alecki, C.; Chiwara, V.; Sanz, L.A.; Grau, D.; Arias Pérez, O.; Boulier, E.L.; Armache, K.; Chédin, F.; Francis, N.J. RNA-DNA strand exchange by the Drosophila Polycomb complex PRC2. Nature Communications 2020, 11, 1781. [Google Scholar] [CrossRef]
- Niehrs, C.; Luke, B. Regulatory R-loops as facilitators of gene expression and genome stability. Nature Reviews Molecular Cell Biology 2020, 21, 167–178. [Google Scholar] [CrossRef] [PubMed]
- Wulfridge, P.; Sarma, K. Intertwining roles of R-loops and G-quadruplexes in DNA repair, transcription and genome organization. Nat Cell Biol 2024, 26, 1025–1036. [Google Scholar] [CrossRef] [PubMed]
- Griffith, J.D.; Comeau, L.; Rosenfield, S.; Stansel, R.M.; Bianchi, A.; Moss, H.; de Lange, T. Mammalian Telomeres End in a Large Duplex Loop. Cell 1999, 97, 503–514. [Google Scholar] [CrossRef]
- Mills, M.; Mergny, J.L.; Klump, H.H. From quadruplex to helix and back: Meta-stable states can move through a cycle of conformational changes. Arch Biochem Biophys 2008, 474, 8–14. Available online: https://www.sciencedirect.com/science/article/pii/S000398610700608X. [CrossRef]
- Brooks, T.A.; Kendrick, S.; Hurley, L. Making sense of G-quadruplex and i-motif functions in oncogene promoters. The FEBS Journal 2010, 277, 3459. [Google Scholar] [CrossRef]
- Monsen, R.C.; Deleeuw, L.W.; Dean, W.L.; Gray, R.D.; Chakravarthy, S.; Hopkins, J.B.; Chaires, J.B.; Trent, J.O. Long promoter sequences form higher-order G-quadruplexes: an integrative structural biology study of c-Myc, k-Ras and c-Kit promoter sequences. Nucleic Acids Research 2022, 50, 4127. [Google Scholar] [CrossRef]
- Mathad, R.I.; Hatzakis, E.; Dai, J.; Yang, D. c-MYC promoter G-quadruplex formed at the 5′-end of NHE III 1 element: insights into biological relevance and parallel-stranded G-quadruplex stability. Nucleic Acids Research 2011, 39, 9023. [Google Scholar] [CrossRef]
- Yang, D.; Hurley, L.H. Structure of the Biologically Relevant G-Quadruplex in The c-MYC Promoter. Nucleosides, Nucleotides and Nucleic Acids 2006, 25, 951. [CrossRef]
- Del mundo, I.M.A.; Zewail-Foote, M.; Kerwin, S.M.; Vasquez, K.M. Alternative DNA structure formation in the mutagenic human c-MYC promoter. Nucleic Acids Research 2017, 45, 4929. [Google Scholar] [CrossRef] [PubMed]
- Kim, N. The Interplay between G-quadruplex and Transcription. CMC 2019, 26, 2898. [Google Scholar] [CrossRef]
- Rhodes, D.; Lipps, H.J. G-quadruplexes and their regulatory roles in biology. Nucleic Acids Res 2015, 43, 8627. [Google Scholar] [CrossRef] [PubMed]
- Murat, P.; Balasubramanian, S. Existence and consequences of G-quadruplex structures in DNA. Current Opinion in Genetics & Development 2013, 25, 22. [CrossRef]
- Kendrick, S.; Hurley, L.H. The role of G-quadruplex/i-motif secondary structures as cis-acting regulatory elements. 2010, 82, 1609–1621. [CrossRef]
- Bedrat, A.; Lacroix, L.; Mergny, J. Re-evaluation of G-quadruplex propensity with G4Hunter. Nucleic Acids Res 2016, 44, 1746–1759. [Google Scholar] [CrossRef]
- Todd, A.K.; Johnston, M.; Neidle, S. Highly prevalent putative quadruplex sequence motifs in human DNA. Nucleic Acids Res 2005, 33, 2901–2907. [Google Scholar] [CrossRef]
- Huppert, J.L. Structure, location and interactions of G-quadruplexes. The FEBS Journal 2010, 277, 3452–3458. [Google Scholar] [CrossRef]
- Huppert, J.L.; Balasubramanian, S. G-quadruplexes in promoters throughout the human genome. Nucleic Acids Res 2006, 35, 406–413. [Google Scholar] [CrossRef]
- Eddy, J.; Maizels, N. Gene function correlates with potential for G4 DNA formation in the human genome. Nucleic Acids Res 2006, 34, 3887–3896. [Google Scholar] [CrossRef]
- Verma, A.; Halder, K.; Halder, R.; Yadav, V.K.; Rawal, P.; Thakur, R.K.; Mohd, F.; Sharma, A.; Chowdhury, S. Genome-Wide Computational and Expression Analyses Reveal G-Quadruplex DNA Motifs as Conserved cis-Regulatory Elements in Human and Related Species. J Med Chem 2008, 51, 5641–5649. [Google Scholar] [CrossRef]
- Burge, S.; Parkinson, G.N.; Hazel, P.; Todd, A.K.; Neidle, S. Quadruplex DNA: sequence, topology and structure. Nucleic Acids Res 2006, 34, 5402–5415. [Google Scholar] [CrossRef]
- Weisz, K. A world beyond double-helical nucleic acids: the structural diversity of tetra-stranded G-quadruplexes. ChemTexts 2021, 7, 25. [Google Scholar] [CrossRef]
- Webba da Silva, M. Geometric Formalism for DNA Quadruplex Folding. Chemistry – A European Journal 2007, 13, 9738–9745. [CrossRef]
- Chalikian, T.V.; Liu, L.; Macgregor, J.,Robert, B. Duplex-tetraplex equilibria in guanine- and cytosine-rich DNA. Biophys Chem 2020, 267, 106473. Available online: https://www.sciencedirect.com/science/article/pii/S0301462220301812. [CrossRef]
- Gray, R.D.; Trent, J.O.; Arumugam, S.; Chaires, J.B. Folding Landscape of a Parallel G-Quadruplex. J Phys Chem Lett 2019, 10, 1146. [Google Scholar] [CrossRef] [PubMed]
- Qin, Y.; Hurley, L.H. Structures, folding patterns, and functions of intramolecular DNA G-quadruplexes found in eukaryotic promoter regions. Biochimie 2008, 90, 1149–1171. Available online: https://www.sciencedirect.com/science/article/pii/S0300908408000540. [CrossRef] [PubMed]
- Pandey, A.; Roy, S.; Srivatsan, S.G. Probing the Competition between Duplex, G-Quadruplex and i-Motif Structures of the Oncogenic c-Myc DNA Promoter Region. Chem Asian J 2023, 18, e202300510. [Google Scholar] [CrossRef]
- Kang, H.; Park, H. Novel Molecular Mechanism for Actinomycin D Activity as an Oncogenic Promoter G-Quadruplex Binder. Biochemistry 2009, 48, 7392–7398. [Google Scholar] [CrossRef]
- Ou, T.; Lu, Y.; Zhang, C.; Huang, Z.; Wang, X.; Tan, J.; Chen, Y.; Ma, D.; Wong, K.; Tang, J.C.; et al. Stabilization of G-Quadruplex DNA and Down-Regulation of Oncogene c-myc by Quindoline Derivatives. J Med Chem 2007, 50, 1465–1474. [Google Scholar] [CrossRef]
- Broxson, C.; Beckett, J.; Tornaletti, S. Transcription Arrest by a G Quadruplex Forming-Trinucleotide Repeat Sequence from the Human c-myb Gene. Biochemistry (N Y) 2011, 50, 4162–4172. [CrossRef]
- Belotserkovskii, B.P.; Mirkin, S.M.; Hanawalt, P.C. DNA Sequences That Interfere with Transcription: Implications for Genome Function and Stability. Chem Rev 2013, 113, 8620–8637. [Google Scholar] [CrossRef]
- Esain-Garcia, I.; Kirchner, A.; Melidis, L.; Tavares, R.D.C.A.; Dhir, S.; Simeone, A.; Yu, Z.; Madden, S.K.; Hermann, R.; Tannahill, D.; et al. G-quadruplex DNA structure is a positive regulator of MYC transcription. Proc Natl Acad Sci U S A 2024, 121. [Google Scholar] [CrossRef]
- Spiegel, J.; Cuesta, S.M.; Adhikari, S.; Hänsel-Hertsch, R.; Tannahill, D.; Balasubramanian, S. G-quadruplexes are transcription factor binding hubs in human chromatin. Genome Biol 2021, 22, 117. [Google Scholar] [CrossRef]
- Zhang, X.; Spiegel, J.; Martínez Cuesta, S.; Adhikari, S.; Balasubramanian, S. Chemical profiling of DNA G-quadruplex-interacting proteins in live cells. Nature Chemistry 2021, 13, 626–633. [Google Scholar] [CrossRef] [PubMed]
- Robinson, J.; Raguseo, F.; Nuccio, S.P.; Liano, D.; Di antonio, M. DNA G-quadruplex structures: more than simple roadblocks to transcription? Nucleic Acids Research 2021, 49, 8419. [Google Scholar] [CrossRef] [PubMed]
- Hou, Y.; Li, F.; Zhang, R.; Li, S.; Liu, H.; Qin, Z.S.; Sun, X. Integrative characterization of G-Quadruplexes in the three-dimensional chromatin structure. Epigenetics 2019, 14, 894–911. [Google Scholar] [CrossRef] [PubMed]
- Kang, H.; Kendrick, S.; Hecht, S.M.; Hurley, L.H. The Transcriptional Complex Between the BCL2 i-Motif and hnRNP LL Is a Molecular Switch for Control of Gene Expression That Can Be Modulated by Small Molecules. J Am Chem Soc 2014, 136, 4172–4185. [Google Scholar] [CrossRef] [PubMed]
- Kendrick, S.; Kang, H.; Alam, M.P.; Madathil, M.M.; Agrawal, P.; Gokhale, V.; Yang, D.; Hecht, S.M.; Hurley, L.H. The Dynamic Character of the BCL2 Promoter i-Motif Provides a Mechanism for Modulation of Gene Expression by Compounds That Bind Selectively to the Alternative DNA Hairpin Structure. J Am Chem Soc 2014, 136, 4161–4171. [Google Scholar] [CrossRef]
- Dhakal, S.; Yu, Z.; Konik, R.; Cui, Y.; Koirala, D.; Mao, H. G-Quadruplex and i-Motif Are Mutually Exclusive in ILPR Double-Stranded DNA. Biophysical Journal 2012, 102, 2575. [Google Scholar] [CrossRef]
- Sutherland, C.; Cui, Y.; Mao, H.; Hurley, L.H. A Mechanosensor Mechanism Controls the G-Quadruplex/i-Motif Molecular Switch in the MYC Promoter NHE III1. J Am Chem Soc 2016, 138, 14138. [Google Scholar] [CrossRef]
- Cui, Y.; Kong, D.; Ghimire, C.; Xu, C.; Mao, H. Mutually Exclusive Formation of G-Quadruplex and i-Motif Is a General Phenomenon Governed by Steric Hindrance in Duplex DNA. Biochemistry 2016, 55, 2291. [Google Scholar] [CrossRef]
- King, J.J.; Irving, K.L.; Evans, C.W.; Chikhale, R.V.; Becker, R.; Morris, C.J.; Peña Martinez, C.D.; Schofield, P.; Christ, D.; Hurley, L.H.; et al. DNA G-Quadruplex and i-Motif Structure Formation Is Interdependent in Human Cells. J Am Chem Soc 2020, 142, 20600. [Google Scholar] [CrossRef]
- Siddiqui-Jain, A.; Grand, C.L.; Bearss, D.J.; Hurley, L.H. Direct evidence for a G-quadruplex in a promoter region and its targeting with a small molecule to repress c-MYC transcription. Proceedings of the National Academy of Sciences 2002, 99, 11593–11598. [Google Scholar] [CrossRef]
- Brooks, T.A.; Hurley, L.H. Targeting MYC Expression through G-Quadruplexes. Genes & Cancer 2010, 1, 641–649. [CrossRef]
- Murat, P.; Balasubramanian, S. Existence and consequences of G-quadruplex structures in DNA. Curr Opin Genet Dev 2014, 25, 22–29. Available online: https://www.sciencedirect.com/science/article/pii/S0959437X13001494. [CrossRef] [PubMed]
- Lam, E.Y.N.; Beraldi, D.; Tannahill, D.; Balasubramanian, S. G-quadruplex structures are stable and detectable in human genomic DNA. Nature Communications 2013, 4, 1796. [Google Scholar] [CrossRef] [PubMed]
- Henderson, A.; Wu, Y.; Huang, Y.C.; Chavez, E.A.; Platt, J.; Johnson, F.B.; Brosh, R.M.; Sen, D.; Lansdorp, P.M. Detection of G-quadruplex DNA in mammalian cells. Nucleic Acids Res 2013, 42, 860–869. [Google Scholar] [CrossRef] [PubMed]
- Biffi, G.; Tannahill, D.; McCafferty, J.; Balasubramanian, S. Quantitative visualization of DNA G-quadruplex structures in human cells. Nature Chemistry 2013, 5, 182–186. [Google Scholar] [CrossRef] [PubMed]
- Balasubramanian, S.; Neidle, S. G-quadruplex nucleic acids as therapeutic targets. Current Opinion in Chemical Biology 2009, 13, 345. [Google Scholar] [CrossRef]
- Balasubramanian, S.; Hurley, L.H.; Neidle, S. Targeting G-quadruplexes in gene promoters: a novel anticancer strategy? Nature Reviews Drug Discovery 2011, 10, 261–275. [Google Scholar] [CrossRef]
- Neidle, S. Quadruplex nucleic acids as targets for anticancer therapeutics. Nature Reviews Chemistry 2017, 1, 0041. [Google Scholar] [CrossRef]
- Han, H.; Hurley, L.H.; Schaefer, H.J. PIIS0165614700014577.
- Carvalho, J.; Mergny, J.; Salgado, G.F.; Queiroz, J.A.; Cruz, C. G-quadruplex, Friend or Foe: The Role of the G-quartet in Anticancer Strategies. Trends in Molecular Medicine 2020, 26, 848. [Google Scholar] [CrossRef]
- Takahashi, S.; Kotar, A.; Tateishi-Karimata, H.; Bhowmik, S.; Wang, Z.; Chang, T.; Sato, S.; Takenaka, S.; Plavec, J.; Sugimoto, N. Chemical Modulation of DNA Replication along G-Quadruplex Based on Topology-Dependent Ligand Binding. J Am Chem Soc 2021, 143, 16458–16469. [Google Scholar] [CrossRef]
- Scott, L.; Chalikian, T.V. Stabilization of G-Quadruplex-Duplex Hybrid Structures Induced by Minor Groove-Binding Drugs. Life 2022, 12. [Google Scholar] [CrossRef]
- Li, X.; Dubins, D.N.; Völker, J.; Chalikian, T.V. G-Quadruplex Recognition by Tetraalkylammonium Ions: A New Paradigm for Discrimination between Parallel and Antiparallel G-Quadruplexes. J Phys Chem B 2024. [Google Scholar] [CrossRef] [PubMed]
- Armitage, B.A. The impact of nucleic acid secondary structure on PNA hybridization. Drug Discov Today 2003, 8, 222–228. Available online: https://www.sciencedirect.com/science/article/pii/S1359644603026114. [CrossRef] [PubMed]
- Ray, A.; Nordén, B. Peptide nucleic acid (PNA): its medical and biotechnical applications and promise for the future. The FASEB Journal 2000, 14, 1041–1060. [Google Scholar] [CrossRef]
- Wittung, P.; Nielsen, P.; Nordén, B. Direct Observation of Strand Invasion by Peptide Nucleic Acid (PNA) into Double-Stranded DNA. J Am Chem Soc 1996, 118, 7049–7054. [Google Scholar] [CrossRef]
- Ratilainen, T.; Holmén, A.; Tuite, E.; Nielsen, P.E.; Nordén, B. Thermodynamics of Sequence-Specific Binding of PNA to DNA. Biochemistry (N Y) 2000, 39, 7781–7791. [CrossRef]
- Gupta, A.; Lee, L.; Roy, S.; Tanious, F.A.; Wilson, W.D.; Ly, D.H.; Armitage, B.A. Strand Invasion of DNA Quadruplexes by PNA: Comparison of Homologous and Complementary Hybridization. ChemBioChem 2013, 14, 1476. [Google Scholar] [CrossRef]
- Onyshchenko, M.I.; Gaynutdinov, T.I.; Englund, E.A.; Appella, D.H.; Neumann, R.D.; Panyutin, I.G. Stabilization of G-quadruplex in the BCL2 promoter region in double-stranded DNA by invading short PNAs. Nucleic Acids Research 2009, 37, 7570. [Google Scholar] [CrossRef]
- Englund, E.A.; Gupta, P.; Micklitsch, C.M.; Onyshchenko, M.I.; Remeeva, E.; Neumann, R.D.; Panyutin, I.G.; Appella, D.H. PPG Peptide Nucleic Acids that Promote DNA Guanine Quadruplexes. ChemBioChem 2014, 15, 1887–1890. [Google Scholar] [CrossRef]
- González, V.; Hurley, L.H. The c-MYCNHE III1: Function and Regulation. Annu Rev Pharmacol Toxicol 2009, 50, 111. [Google Scholar] [CrossRef] [PubMed]
- Kim, B.G.; Evans, H.M.; Dubins, D.N.; Chalikian, T.V. Effects of Salt on the Stability of a G-Quadruplex from the Human c-MYC Promoter. Biochemistry 2015, 54, 3420–3430. [Google Scholar] [CrossRef]
- Ambrus, A.; Chen, D.; Dai, J.; Jones, R.A.; Yang, D. Solution Structure of the Biologically Relevant G-Quadruplex Element in the Human c-MYC Promoter. Implications for G-Quadruplex Stabilization. Biochemistry 2005, 44, 2048–2058. [CrossRef]
- Jana, J.; Weisz, K. A Thermodynamic Perspective on Potential G-Quadruplex Structures as Silencer Elements in the MYC Promoter. Chem Eur J 2020, 26, 17242–17251. [Google Scholar] [CrossRef]
- Grün, J.T.; Blümler, A.; Burkhart, I.; Wirmer-Bartoschek, J.; Heckel, A.; Schwalbe, H. Unraveling the Kinetics of Spare-Tire DNA G-Quadruplex Folding. J Am Chem Soc 2021, 143, 6185–6193. [Google Scholar] [CrossRef] [PubMed]
- Grün, J.T.; Schwalbe, H. Folding dynamics of polymorphic G-quadruplex structures. Biopolymers 2022, 113, e23477. [Google Scholar] [CrossRef] [PubMed]
- Grün, J.T.; Hennecker, C.; Klötzner, D.; Harkness, R.W.; Bessi, I.; Heckel, A.; Mittermaier, A.K.; Schwalbe, H. Conformational Dynamics of Strand Register Shifts in DNA G-Quadruplexes. J Am Chem Soc 2020, 142, 264–273. [Google Scholar] [CrossRef] [PubMed]
- Freyer, M.W.; Buscaglia, R.; Kaplan, K.; Cashman, D.; Hurley, L.H.; Lewis, E.A. Biophysical Studies of the c-MYC NHE III1 Promoter: Model Quadruplex Interactions with a Cationic Porphyrin. Biophysical Journal 2007, 92, 2007. [Google Scholar] [CrossRef]
- Hatzakis, E.; Okamoto, K.; Yang, D. Thermodynamic Stability and Folding Kinetics of the Major G-Quadruplex and Its Loop Isomers Formed in the Nuclease Hypersensitive Element in the Human c-Myc Promoter: Effect of Loops and Flanking Segments on the Stability of Parallel-Stranded Intramolecular G-Quadruplexes. Biochemistry (N Y) 2010, 49, 9152–9160. [CrossRef]
- Law, S.M.; Eritja, R.; Goodman, M.F.; Breslauer, K.J. Spectroscopic and Calorimetric Characterizations of DNA Duplexes Containing 2-Aminopurine. Biochemistry 1996, 35, 12329–12337. [Google Scholar] [CrossRef]
- Lee, B.J.; Barch, M.; Castner, E.W.; Volker, J.; Breslauer, K.J. Structure and dynamics in DNA looped domains: CAG triplet repeat sequence dynamics probed by 2-aminopurine fluorescence. Biochemistry 2007, 46, 10756–10766. [Google Scholar] [CrossRef]
- Gray, R.D.; Petraccone, L.; Trent, J.O.; Chaires, J.B. Characterization of a K+-Induced Conformational Switch in a Human Telomeric DNA Oligonucleotide Using 2-Aminopurine Fluorescence. Biochemistry (N Y) 2010, 49, 179–194. [CrossRef]
- Gray, R.D.; Petraccone, L.; Buscaglia, R.; Chaires, J.B. 2-Aminopurine as a Probe for Quadruplex Loop Structures. In G-Quadruplex DNA: Methods and Protocols; Baumann, P., Ed.; Humana Press: Totowa, NJ, USA, 2010; pp. 121–136. [Google Scholar]
- Buscaglia, R.; Jameson, D.M.; Chaires, J.B. G-quadruplex structure and stability illuminated by 2-aminopurine phasor plots. Nucleic Acids Res 2012, 40, 4203–4215. [Google Scholar] [CrossRef]
- Kimura, T.; Kawai, K.; Fujitsuka, M.; Majima, T. Monitoring G-quadruplex structures and G-quadruplex–ligand complex using 2-aminopurine modified oligonucleotides. Tetrahedron 2007, 63, 3585–3590. Available online: https://www.sciencedirect.com/science/article/pii/S0040402007001755. [CrossRef]
- Volker, J.; Plum, G.E.; Gindikin, V.; Klump, H.H.; Breslauer, K.J. Impact of bulge loop size on DNA triplet repeat domains: Implications for DNA repair and expansion. Biopolymers 2014, 101, 1–12. [Google Scholar] [CrossRef]
- Volker, J.; Gindikin, V.; Klump, H.H.; Plum, G.E.; Breslauer, K.J. Energy landscapes of dynamic ensembles of rolling triplet repeat bulge loops: implications for DNA expansion associated with disease states. Journal of the American Chemical Society 2012, 134, 6033–6044. [Google Scholar] [CrossRef]
- Volker, J.; Plum, G.E.; Klump, H.H.; Breslauer, K.J. DNA repair and DNA triplet repeat expansion: the impact of abasic lesions on triplet repeat DNA energetics. Journal of the American Chemical Society 2009, 131, 9354–9360. [Google Scholar] [CrossRef] [PubMed]
- Volker, J.; Klump, H.H.; Breslauer, K.J. DNA metastability and biological regulation: conformational dynamics of metastable omega-DNA bulge loops. Journal of the American Chemical Society 2007, 129, 5272–5280. [Google Scholar] [CrossRef]
- Volker, J.; Plum, G.E.; Gindikin, V.; Breslauer, K.J. Dynamic DNA Energy Landscapes and Substrate Complexity in Triplet Repeat Expansion and DNA Repair. Biomolecules 2019, 9. [CrossRef]
- Gehring, K.; Leroy, J.; Guéron, M. A tetrameric DNA structure with protonated cytosine-cytosine base pairs. Nature 1993, 363, 561–565. [Google Scholar] [CrossRef] [PubMed]
- Guéron, M.; Leroy, J. The i-motif in nucleic acids. Curr Opin Struct Biol 2000, 10, 326–331. Available online: https://www.sciencedirect.com/science/article/pii/S0959440X00000919. [CrossRef] [PubMed]
- Abou Assi, H.; Garavís, M.; González, C.; Damha, M.J. i-Motif DNA: structural features and significance to cell biology. Nucleic Acids Res 2018, 46, 8038–8056. [Google Scholar] [CrossRef]
- Mergny, J.; Lacroix, L.; Han, X.; Leroy, J.; Helene, C. Intramolecular folding of pyrimidine oligodeoxynucleotides into an i-DNA motif. J Am Chem Soc 1995, 117, 8887–8898. [Google Scholar] [CrossRef]
- Volker, J.; Klump, H.H.; Breslauer, K.J. The energetics of i-DNA tetraplex structures formed intermolecularly by d(TC5) and intramolecularly by d[(C5T3)3C5. Biopolymers 2007, 86, 136–147. [Google Scholar] [CrossRef]
- Snell, F.D.; Snell, C.T. Colorimetric methods of analysis, including some turbidimetric and nephelometric methods, R.E. Krieger Pub. Co: Huntington, N.Y., 1972; pp. v.
- Plum, G.E. Optical Methods. Current Protocols in Nucleic Acid Chemistry 2000, 00, 7.3.1–7.3.17. [CrossRef]
- Völker, J.; Breslauer, K.J. Differential repair enzyme-substrate selection within dynamic DNA energy landscapes. Q Rev Biophys 2022, 55, e1. Available online: https://www.cambridge.org/core/article/differential-repair-enzymesubstrate-selection-within-dynamic-dna-energy-landscapes/1CD6DD4B6383DDBFA6C81899552C4C03. [CrossRef]
- del Villar-Guerra, R.; Trent, J.O.; Chaires, J.B. G-Quadruplex Secondary Structure Obtained from Circular Dichroism Spectroscopy. Angew Chem Int Ed 2018, 57, 7171–7175. [Google Scholar] [CrossRef]
- del Villar-Guerra, R.; Gray, R.D.; Chaires, J.B. Characterization of Quadruplex DNA Structure by Circular Dichroism. Current Protocols in Nucleic Acid Chemistry 2017, 68, 17.8.1–17.8.16. [CrossRef]
- Vorlíčková, M.; Kejnovská, I.; Bednářová, K.; Renčiuk, D.; Kypr, J. Circular Dichroism Spectroscopy of DNA: From Duplexes to Quadruplexes. Chirality 2012, 24, 691–698. [Google Scholar] [CrossRef]
- Kypr, J.; Kejnovská, I.; Renčiuk, D.; Vorlíčková, M. Circular dichroism and conformational polymorphism of DNA. Nucleic Acids Res 2009, 37, 1713–1725. [Google Scholar] [CrossRef] [PubMed]
- Phan, A.T.; Modi, Y.S.; Patel, D.J. Propeller-Type Parallel-Stranded G-Quadruplexes in the Human c-myc Promoter. J Am Chem Soc 2004, 126, 8710–8716. [Google Scholar] [CrossRef] [PubMed]
- Kim, B.G.; Evans, H.M.; Dubins, D.N.; Chalikian, T.V. Effects of Salt on the Stability of a G-Quadruplex from the Human c-MYC Promoter. Biochemistry (N Y) 2015, 54, 3420–3430. [CrossRef]
- Seenisamy, J.; Rezler, E.M.; Powell, T.J.; Tye, D.; Gokhale, V.; Joshi, C.S.; Siddiqui-Jain, A.; Hurley, L.H. The Dynamic Character of the G-Quadruplex Element in the c-MYC Promoter and Modification by TMPyP4. J Am Chem Soc 2004, 126, 8702–8709. [Google Scholar] [CrossRef] [PubMed]
- Liu, L.; Ma, C.; Wells, J.W.; Chalikian, T.V. Conformational Preferences of DNA Strands from the Promoter Region of the c-MYC Oncogene. J Phys Chem B 2020, 124, 751–762. [Google Scholar] [CrossRef]
- Liu, L.; Zhu, L.; Tong, H.; Su, C.; Wells, J.W.; Chalikian, T.V. Distribution of Conformational States Adopted by DNA from the Promoter Regions of the VEGF and Bcl-2 Oncogenes. J Phys Chem B 2022, 126, 6654–6670. [Google Scholar] [CrossRef] [PubMed]
- Mathur, V.; Verma, A.; Maiti, S.; Chowdhury, S. Thermodynamics of i-tetraplex formation in the nuclease hypersensitive element of human c-myc promoter. Biochemical and Biophysical Research Communications 2004, 320, 1220. [Google Scholar] [CrossRef]
- Kim, B.G.; Chalikian, T.V. Thermodynamic linkage analysis of pH-induced folding and unfolding transitions of i-motifs. Biophys Chem 2016, 216, 19–22. Available online: https://www.sciencedirect.com/science/article/pii/S0301462216301636. [CrossRef]
- Liu, L.; Kim, B.G.; Feroze, U.; Macgregor, R.B.J.; Chalikian, T.V. Probing the Ionic Atmosphere and Hydration of the c-MYC i-Motif. J Am Chem Soc 2018, 140, 2229–2238. [Google Scholar] [CrossRef]
- Jones, A.C.; Neely, R.K. 2-aminopurine as a fluorescent probe of DNA conformation and the DNA–enzyme interface. Q Rev Biophys 2015, 48, 244–279. Available online: https://www.cambridge.org/core/product/A6142805AADDFF8FE114F2AA9F4C66D3. [CrossRef]
- Jean, J.M.; Hall, K.B. 2-Aminopurine fluorescence quenching and lifetimes: Role of base stacking. Proceedings of the National Academy of Sciences 2001, 98, 37–41. [Google Scholar] [CrossRef]
- Jean, J.M.; Hall, K.B. Stacking−Unstacking Dynamics of Oligodeoxynucleotide Trimers. Biochemistry (N Y) 2004, 43, 10277–10284. [CrossRef]
- Kawai, M.; Lee, M.J.; Evans, K.O.; Nordlund, T.M. Temperature and Base Sequence Dependence of 2-Aminopurine Fluorescence Bands in Single- and Double-Stranded Oligodeoxynucleotides. J Fluoresc 2001, 11, 23–32. [Google Scholar] [CrossRef]
- Somsen, O.J.G.; Keukens, L.B.; de Keijzer, M.N.; van Hoek, A.; van Amerongen, H. Structural Heterogeneity in DNA: Temperature Dependence of 2-Aminopurine Fluorescence in Dinucleotides. ChemPhysChem 2005, 6, 1622–1627. [Google Scholar] [CrossRef] [PubMed]
- Greider, C.W. Telomeres Do D-Loop–T-Loop. Cell 1999, 97, 419–422. [Google Scholar] [CrossRef] [PubMed]
- Yadav, T.; Zhang, J.; Ouyang, J.; Leung, W.; Simoneau, A.; Zou, L. TERRA and RAD51AP1 promote alternative lengthening of telomeres through an R- to D-loop switch. Mol Cell 2022, 82, 3985–4000.e4. [CrossRef]
- Berson, J.A. Memory Effects and Stereochemistry in Multiple Carbonium Ion Rearrangements. Angew Chem Int Ed Engl 1968, 7, 779–791. [Google Scholar] [CrossRef]
- Ghigo, G.; Maranzana, A.; Tonachini, G. Memory Effects in Carbocation Rearrangements: Structural and Dynamic Study of the Norborn-2-en-7-ylmethyl-X Solvolysis Case. J Org Chem 2013, 78, 9041. [Google Scholar] [CrossRef]
- Kozyavkin, S.A.; Lyubchenko, Y.L. The nonequilibrium character of DNA melting: effects of the heating rate on the fine structure of melting curves. Nucleic Acids Res 1984, 12, 4339–4349. [Google Scholar] [CrossRef]
- W., H.V., Robert; Avakyan, N.; Sleiman, H.F.; Mittermaier, A.K. Mapping the energy landscapes of supramolecular assembly by thermal hysteresis. Nature Communications 2018, 9, 3152. [CrossRef]
- Sanchez-Ruiz, J.M. Protein kinetic stability. Biophys Chem 2010, 148, 1–15. [Google Scholar] [CrossRef]
- Mayorga, O.L.; Freire, E. Dynamic analysis of differential scanning calorimetry data. Biophys Chem 1987, 27, 87–96. Available online: https://www.sciencedirect.com/science/article/pii/0301462287800492. [CrossRef]
- Volker, J.; Blake, R.D.; Delcourt, S.G.; Breslauer, K.J. High-resolution calorimetric and optical melting profiles of DNA plasmids: resolving contributions from intrinsic melting domains and specifically designed inserts. Biopolymers 1999, 50, 303–318. [Google Scholar] [CrossRef]
- Leveille, M.P.; Tran, T.; Dingillo, G.; Cannon, B. Detection of Mg(2+)-dependent, coaxial stacking rearrangements in a bulged three-way DNA junction by single-molecule FRET. Biophys Chem 2019, 245, 25–33.
- Shlyakhtenko, L.S.; Rekesh, D.; Lindsay, S.M.; Kutyavin, I.; Appella, E.; Harrington, R.E.; Lyubchenko, Y.L. Structure of Three-Way DNA Junctions 1. Non-Planar DNA Geometry. Journal of Biomolecular Structure and Dynamics 1994, 11, 1175–1189. [CrossRef]
- Shlyakhtenko, L.S.; Appella, E.; Harrington, R.E.; Kutyavin, I.; Lyubchenko, Y.L. Structure of Three-Way DNA Junctions. 2. Effects of Extra Bases and Mismatches. Journal of Biomolecular Structure and Dynamics 1994, 12, 131–143. [Google Scholar] [CrossRef]
- Leontis, N.B.; Kwok, W.; Newman, J.S. Stability and structure of three-way DNA junctions containing unpaired nucleotides. Nucleic Acids Res 1991, 19, 759–766. [Google Scholar] [CrossRef] [PubMed]
- Lilley, D.M.J. Structures of helical junctions in nucleic acids. Quart Rev Biophys 2000, 33, 109. [Google Scholar] [CrossRef] [PubMed]
- Cadden, G.M.; Wilken, S.J.; Magennis, S.W. A single CAA interrupt in a DNA three-way junction containing a CAG repeat hairpin results in parity-dependent trapping. Nucleic Acids Res 2024, gkae644. [Google Scholar] [CrossRef] [PubMed]
- Hu, T.; Morten, M.J.; Magennis, S.W. Conformational and migrational dynamics of slipped-strand DNA three-way junctions containing trinucleotide repeats. Nat Commun 2021, 12. [Google Scholar] [CrossRef]
- Monsen, R.C.; Chua, E.Y.D.; Hopkins, J.B.; Chaires, J.B.; Trent, J.O. Structure of a 28.5 kDa duplex-embedded G-quadruplex system resolved to 7.4 Å resolution with cryo-EM. Nucleic acids research 2023, 51, 1943–1959. Available online: https://www.ncbi.nlm.nih.gov/pubmed/36715343. [CrossRef]
- Simmel, F.C.; Yurke, B.; Singh, H.R. Principles and Applications of Nucleic Acid Strand Displacement Reactions. Chem Rev 2019, 119, 6326. [Google Scholar] [CrossRef]
- Wang, T.; Hellmer, H.; Simmel, F.C. Genetic switches based on nucleic acid strand displacement. Current Opinion in Biotechnology 2022, 79. [Google Scholar] [CrossRef]
- Srinivas, N.; Ouldridge, T.E.; Šulc, P.; Schaeffer, J.M.; Yurke, B.; Louis, A.A.; Doye, J.P.K.; Winfree, E. On the biophysics and kinetics of toehold-mediated DNA strand displacement. Nucleic Acids Res 2013, 41, 10641–10658. [Google Scholar] [CrossRef]
- Yao, D.; Zhang, Y.; Zhou, X.; Sun, X.; Liu, X.; Zhou, J.; Jiang, W.; Hua, W.; Liang, H. Catalytic-assembly of programmable atom equivalents. Proc Natl Acad Sci U S A 2023, 120. [Google Scholar] [CrossRef]
- DNA facilitates escape from metastability in self-assembling systems. Available online: https://phys.org/news/2023-05-dna-metastability-self-assembling.html.
- Sun, Y.; Mccorvie, T.J.; Yates, L.A.; Zhang, X. Structural basis of homologous recombination. Cell Mol Life Sci 2019, 77, 3. [Google Scholar] [CrossRef]
- Tomaska, L.; Nosek, J.; Kar, A.; Willcox, S.; Griffith, J.D. A New View of the T-Loop Junction: Implications for Self-Primed Telomere Extension, Expansion of Disease-Related Nucleotide Repeat Blocks, and Telomere Evolution. Frontiers in Genetics 2019, 10. Available online: https://www.frontiersin.org/journals/genetics/articles/10.3389/fgene.2019.00792.
- Wetmur, J.G. Hybridization and renaturation kinetics of nucleic acids. Annu Rev Biophys Bioeng 1976, 5, 337–361. [Google Scholar] [CrossRef]
- Ouldridge, T.E.; Šulc, P.; Romano, F.; Doye, J.P.K.; Louis, A.A. DNA hybridization kinetics: zippering, internal displacement and sequence dependence. Nucleic Acids Res 2013, 41, 8886–8895. [Google Scholar] [CrossRef] [PubMed]
- Porschke, D.; Eigen, M. Co-operative non-enzymic base recognition. 3. Kinetics of the helix-coil transition of the oligoribouridylic--oligoriboadenylic acid system and of oligoriboadenylic acid alone at acidic pH. J Mol Biol 1971, 62, 361–381. [CrossRef]
- Lilley, D.M.J. Structures of helical junctions in nucleic acids. Q Rev Biophys 2000, 33, 109–159. Available online: https://www.cambridge.org/core/product/6F6C39B8D3D4F6CF1C10090C0DA311C1. [CrossRef] [PubMed]
- Garabet, A.; Liu, L.; Chalikian, T.V. Heat capacity changes associated with G-quadruplex unfolding. J Chem Phys 2023, 159, 055101. [Google Scholar] [CrossRef] [PubMed]
- Chalikian, T.V.; Volker, J.; Plum, G.E.; Breslauer, K.J. A more unified picture for the thermodynamics of nucleic acid duplex melting: a characterization by calorimetric and volumetric techniques. Proceedings of the National Academy of Sciences of the United States of America 1999, 96, 7853–7858. [Google Scholar] [CrossRef]
- Völker, J.; Plum, G.E.; Breslauer, K.J. Heat Capacity Changes (ΔCp) for Interconversions between Differentially-Ordered DNA States within Physiological Temperature Domains: Implications for Biological Regulatory Switches. J Phys Chem B 2020, 124, 5614–5625. [Google Scholar] [CrossRef]
- Jelesarov, I.; Crane-Robinson, C.; Privalov, P.L. The energetics of HMG box interactions with DNA: thermodynamic description of the target DNA duplexes. J Mol Biol 1999, 294, 981–995. [Google Scholar] [CrossRef]
- Rouzina, I.; Bloomfield, V.A. Heat capacity effects on the melting of DNA. 2. Analysis of nearest-neighbor base pair effects. Biophys J 1999, 77, 3252–3255.
- Rouzina, I.; Bloomfield, V.A. Heat capacity effects on the melting of DNA. 1. General aspects. Biophys J 1999, 77, 3242–3251. [Google Scholar] [CrossRef]
- Nicholson, D.A.; Jia, B.; Nesbitt, D.J. Measuring Excess Heat Capacities of Deoxyribonucleic Acid (DNA) Folding at the Single-Molecule Level. J Phys Chem B 2021, 125, 9719–9726. [Google Scholar] [CrossRef]
- Cheng, M.; Chen, J.; Ju, H.; Zhou, J.; Mergny, J. Drivers of i-DNA Formation in a Variety of Environments Revealed by Four-Dimensional UV Melting and Annealing. J Am Chem Soc 2021, 143, 7792–7807. [Google Scholar] [CrossRef]
- Školáková, P.; Gajarský, M.; Palacký, J.; Šubert, D.; Renčiuk, D.; Trantírek, L.; Mergny, J.; Vorlíčková, M. DNA i-motif formation at neutral pH is driven by kinetic partitioning. Nucleic Acids Res 2023, 51, 2950–2962. [Google Scholar] [CrossRef]
Scheme 1.
illustrates the relationships between the three DNA oligonucleotides and their mono-, bi-.and or trimolecular complexes.
Scheme 1.
illustrates the relationships between the three DNA oligonucleotides and their mono-, bi-.and or trimolecular complexes.
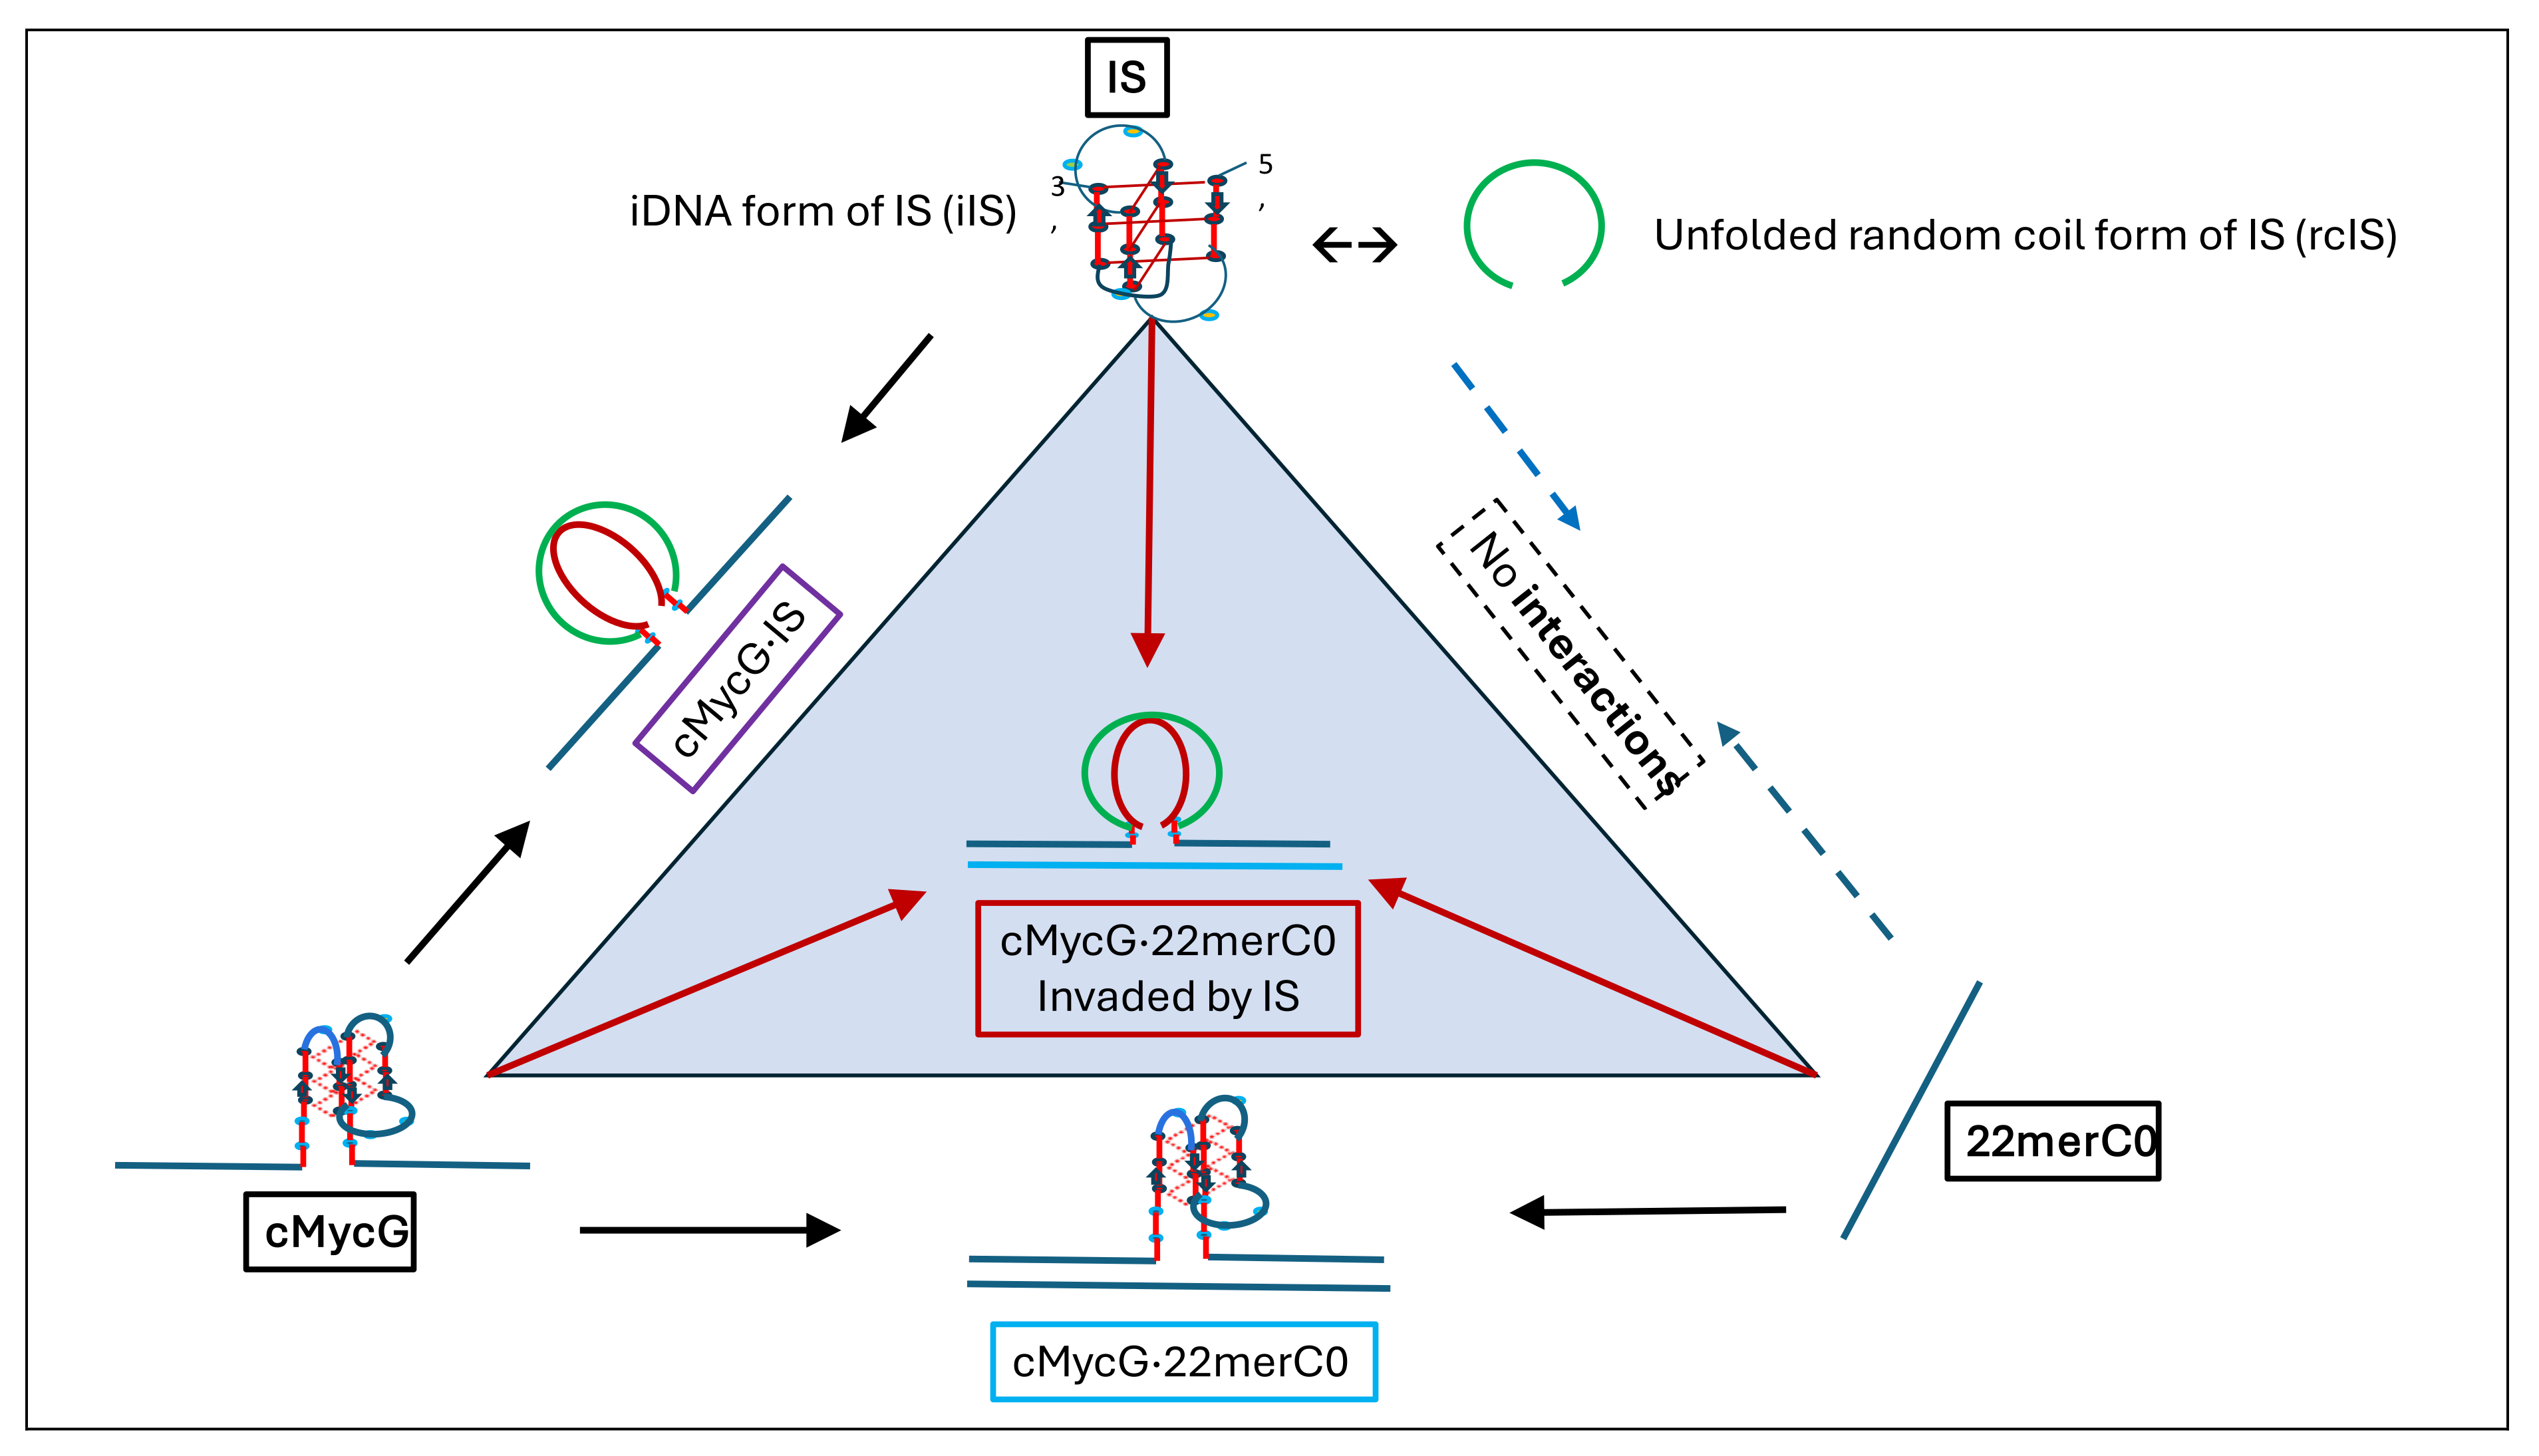
Figure 2.
The native (0°C) CD spectra (panel A), UV spectra (panel C), and Fluorescence excitation spectra (Panel E), of a freshly prepared cMycGˑ22merC0 / IS sample (black curves), as well as after incubation at 4°C for 2 weeks (red curve). Also shown in panels A, C, and E are the spectra of both samples under denaturing conditions at 90°C (dark and light blue). The corresponding CD, UV, and Fluorescence melting (black and red) and reannealing (light and dark blue) curves at characteristic wavelengths are shown in panels B, D, and F respectively.
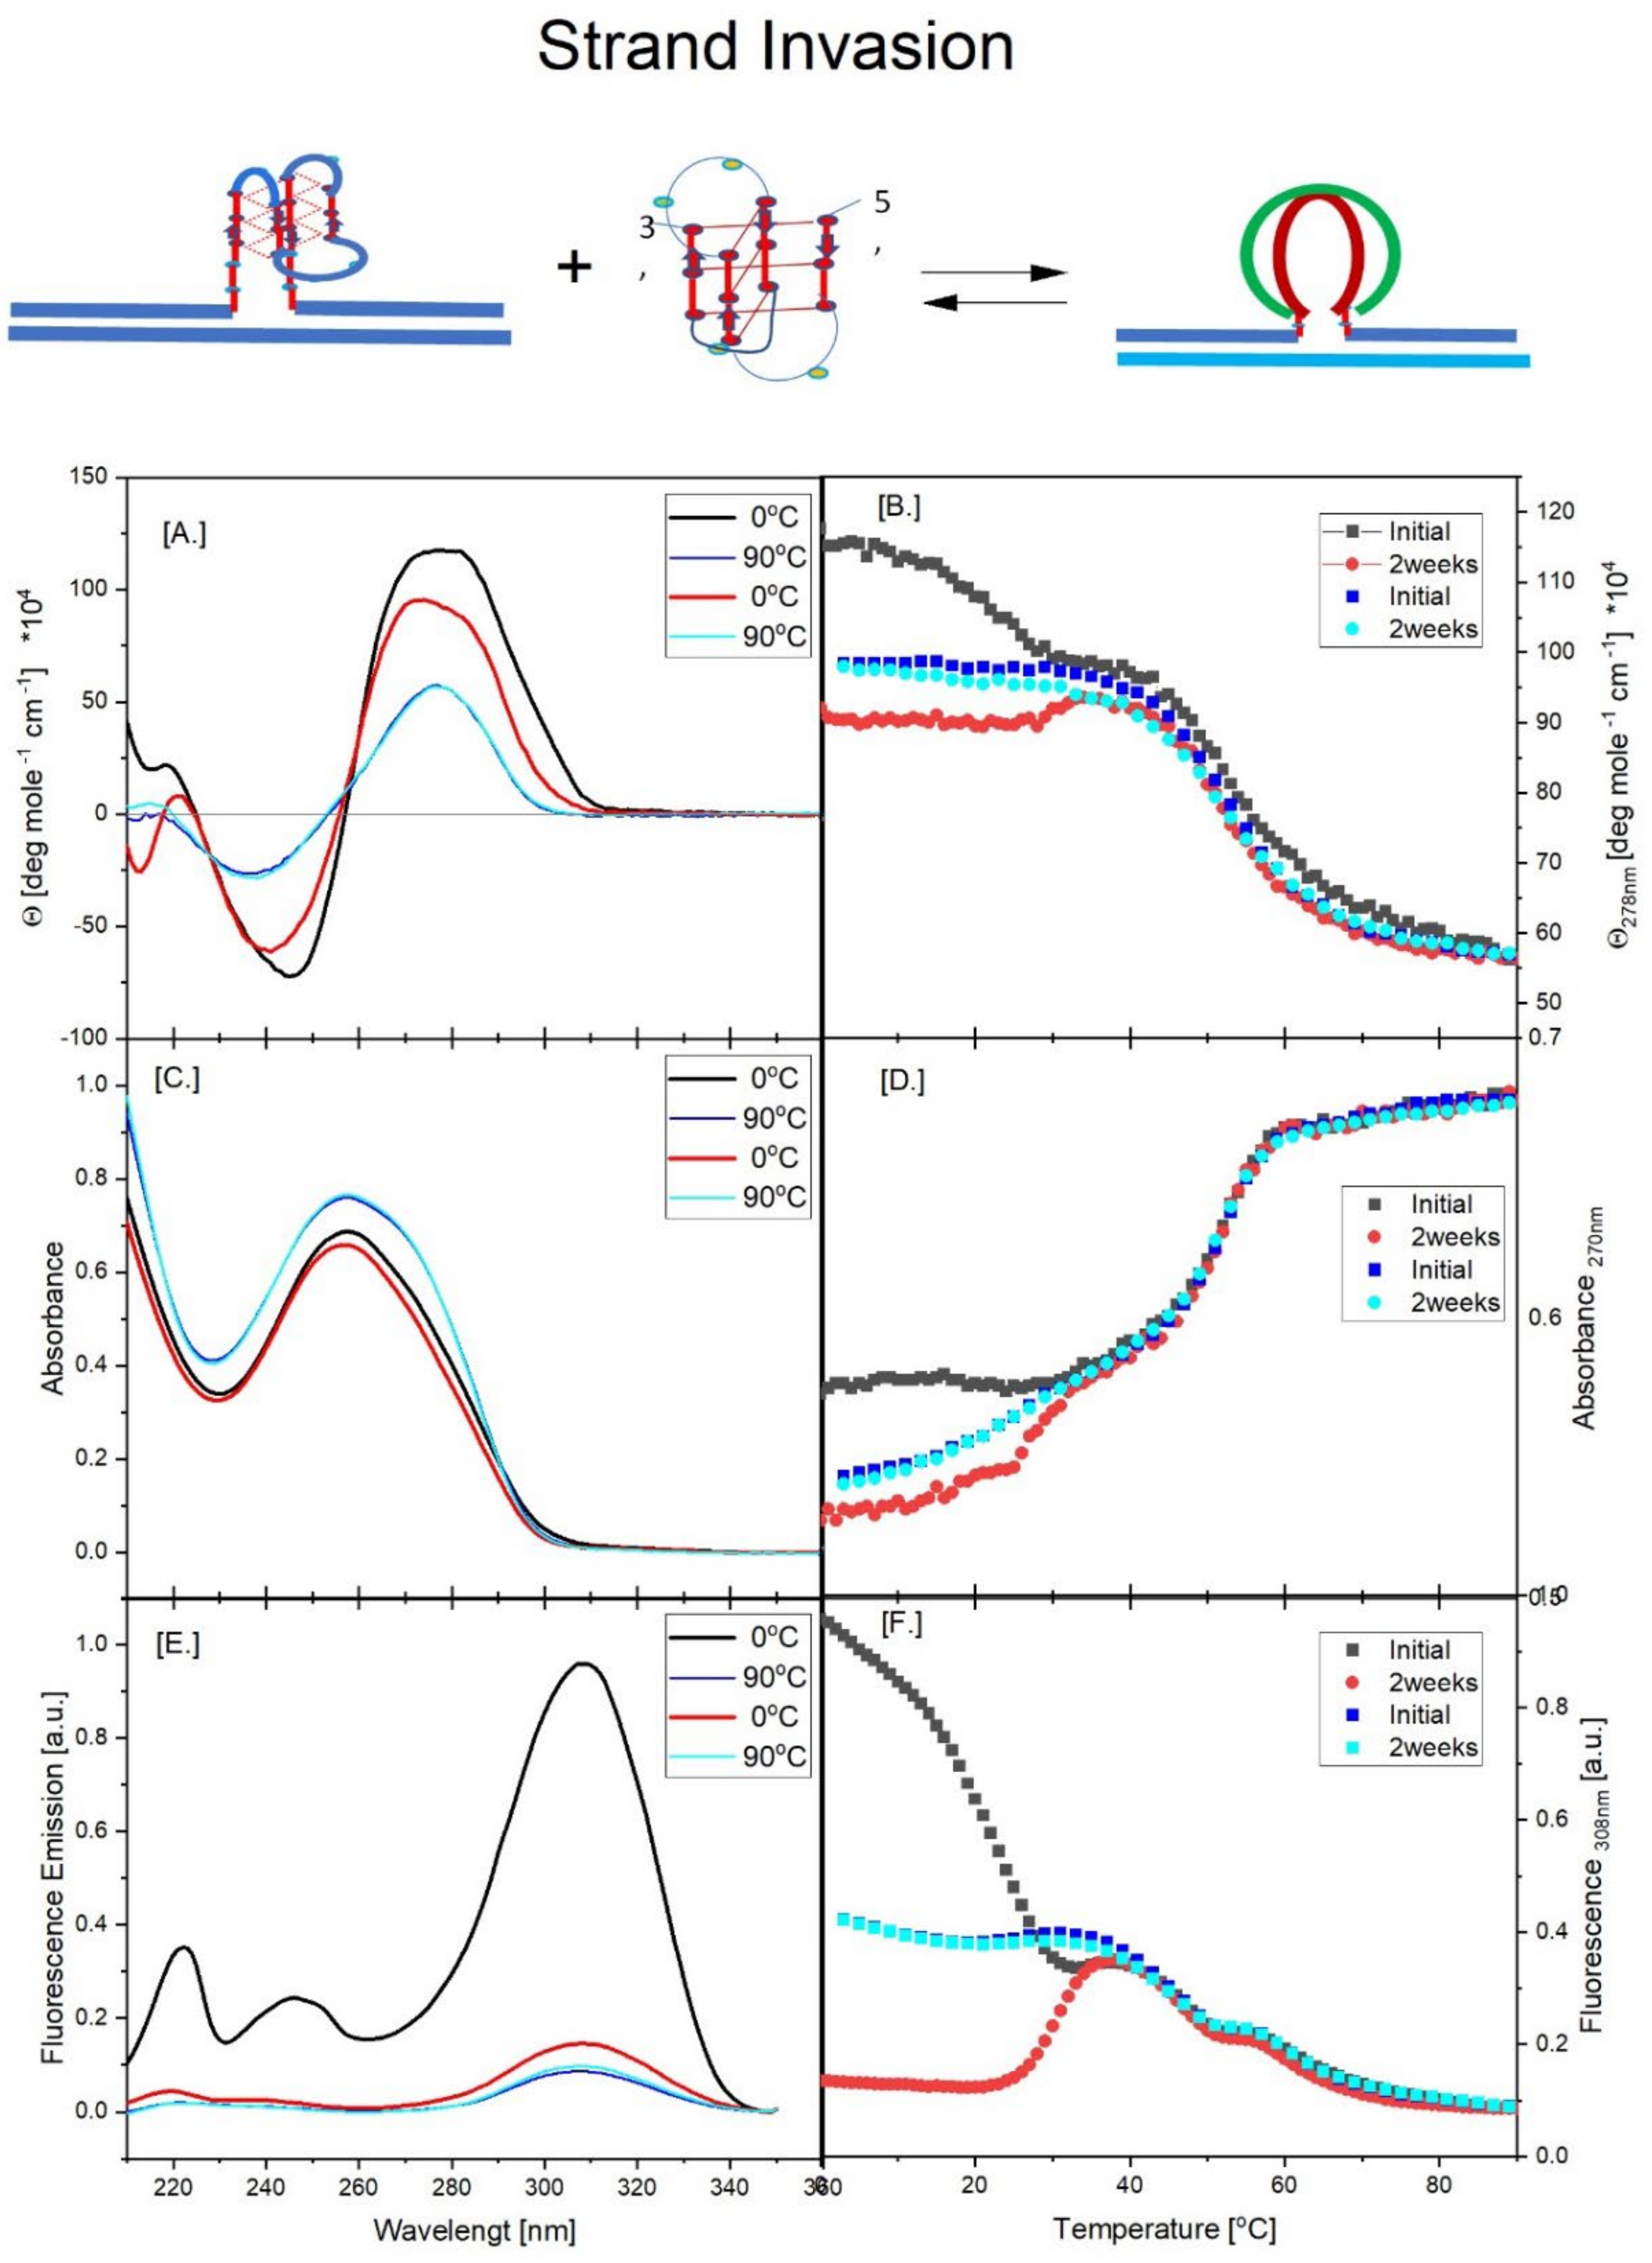
Figure 4.
Overlay of the CD melting curve at 288nm observed for isolated IS (blue curve, right Y axis) over the fluorescence melting (black and red, left Y axis) and reannealing curves (cyan, left Y axis) of cMycGˑ22merC0 with IS added. The black curve corresponds to the melting of the cMycGˑ22merC0/IS sample immediately after mixing, whereas the red curve is the melting profile obtained after 2-weeks incubation at 4°C. The fluorescence melting curves of cMycGˑ22merC0 with IS added in Figure 4 are identical with those depicted in Figure 3.
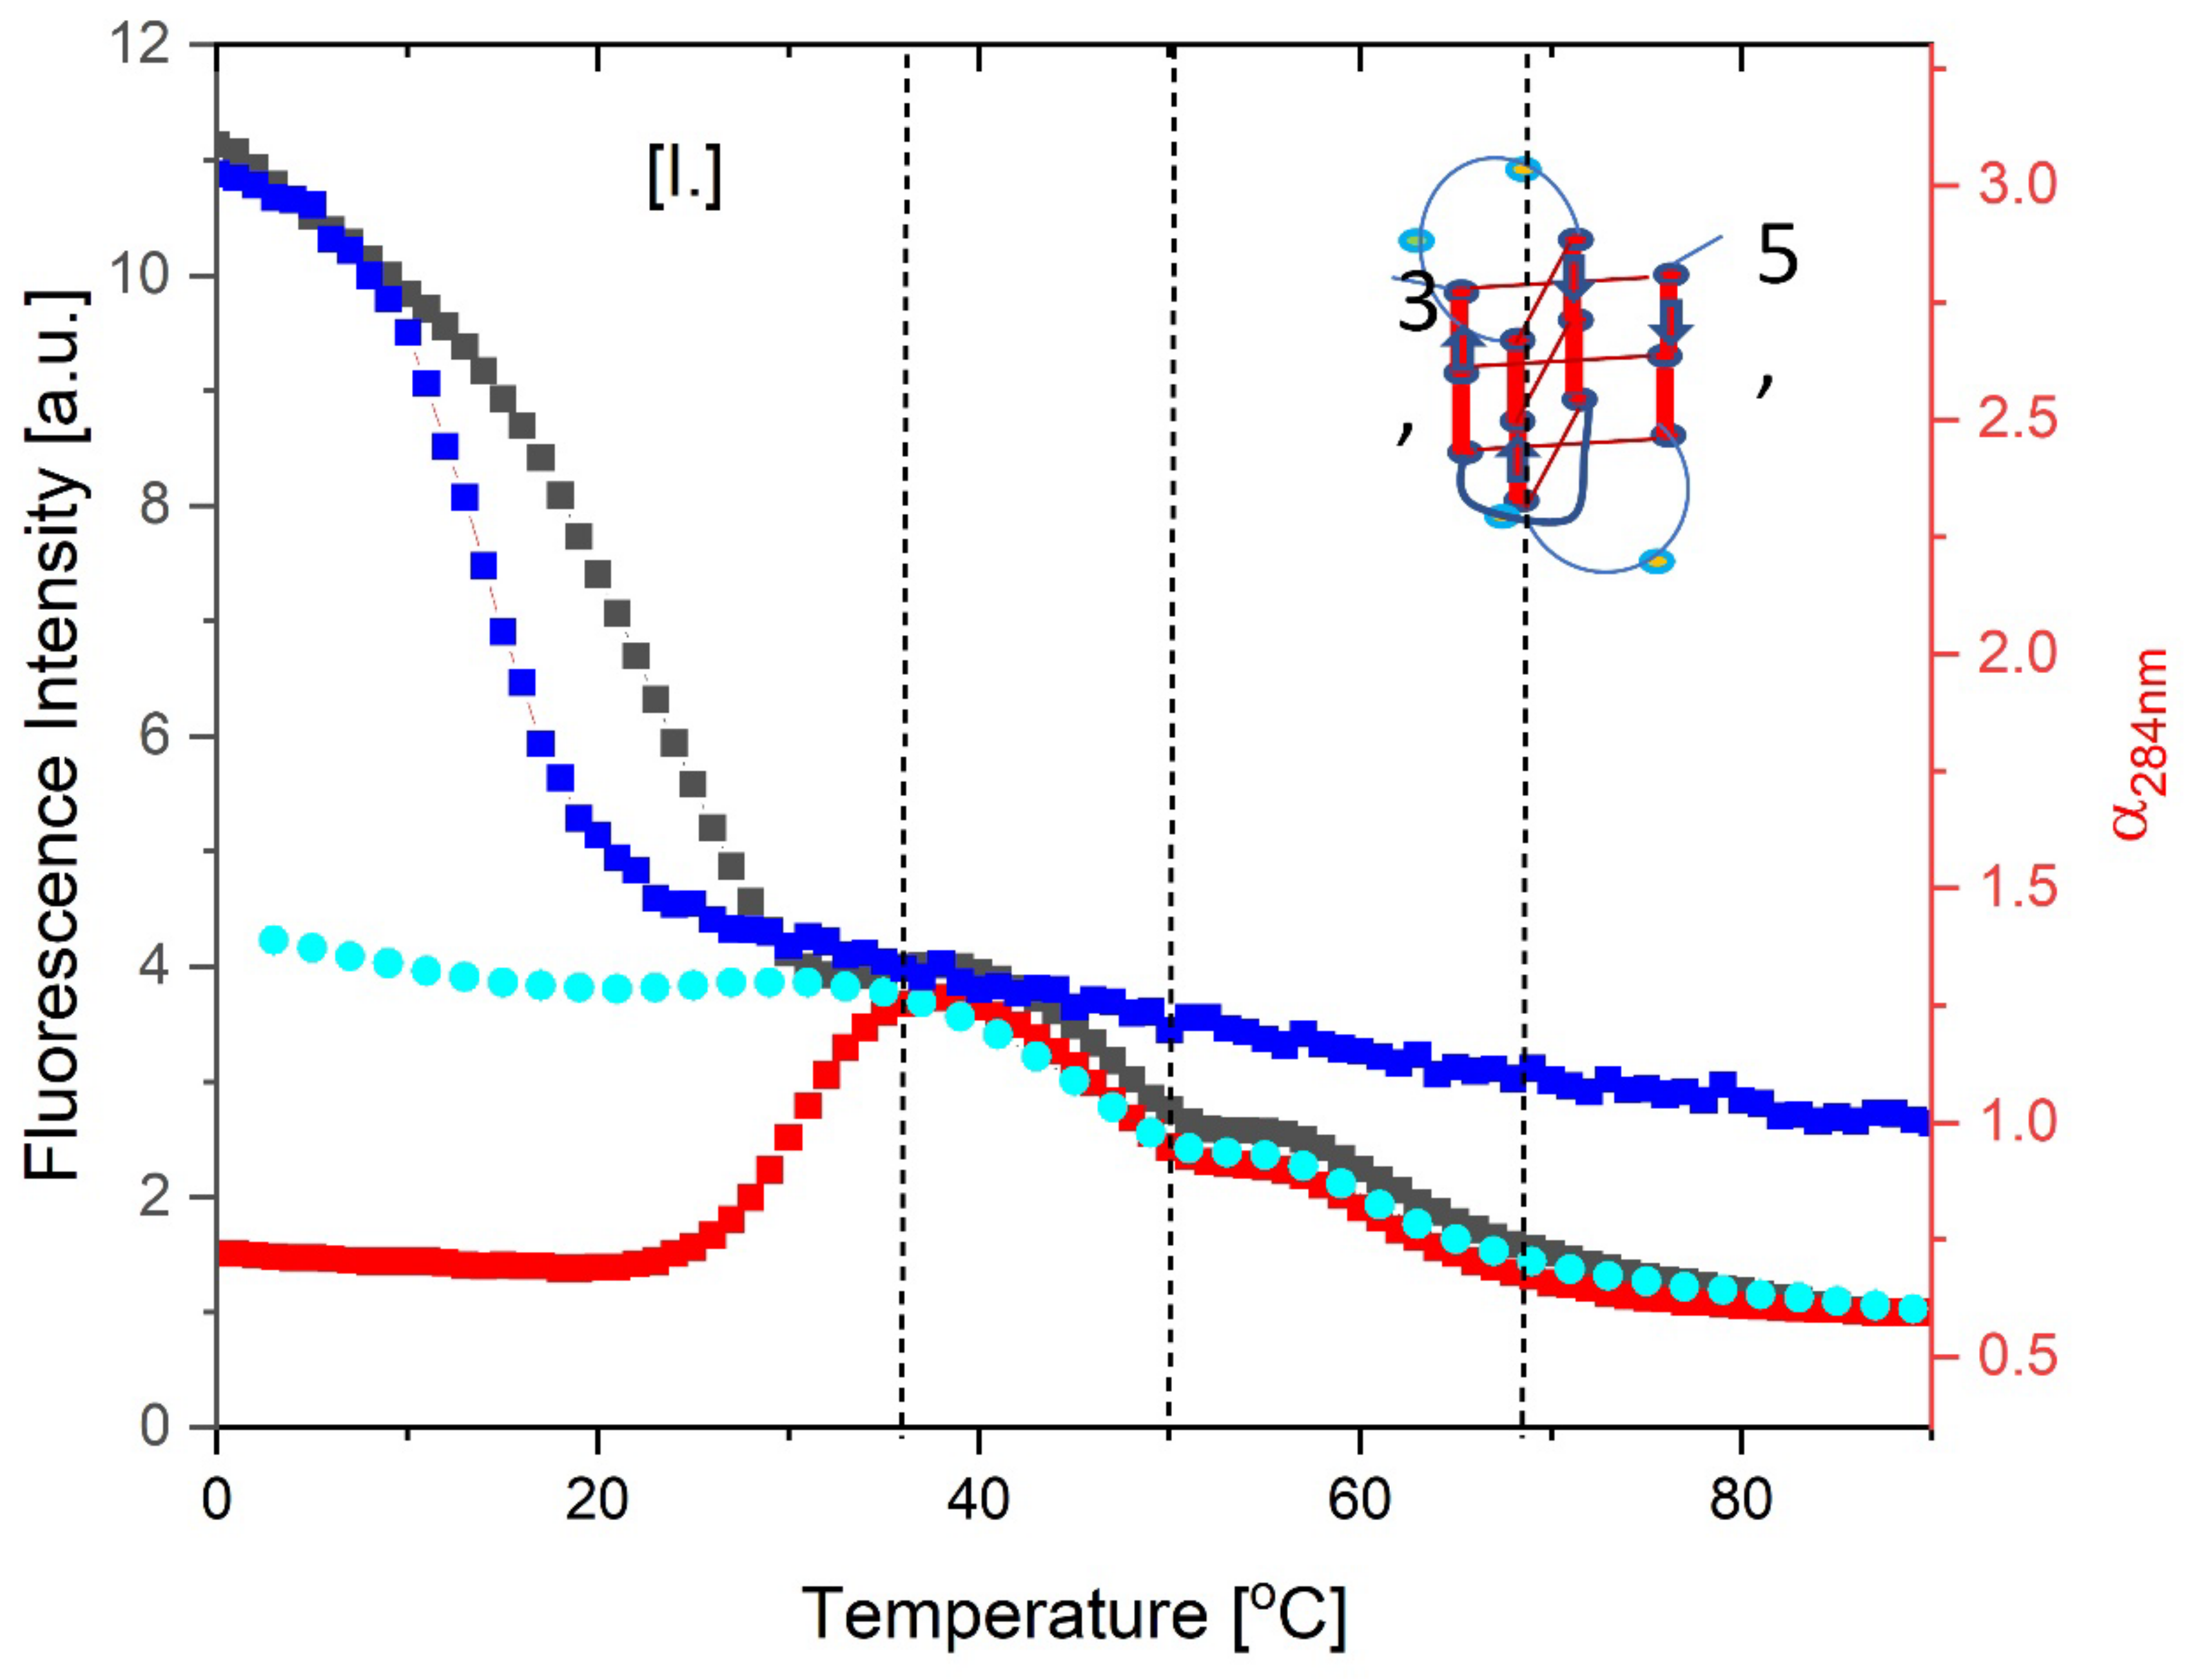
Figure 6.
An overlay of appropriately scaled fluorescence melting curves for isolated cMycGˑ22merC0 (blue curve, right Y axis) over the fluorescence melting (black and red, left Y axis) and reannealing curves (cyan, left Y axis) of cMycGˑ22merC0 with IS added. The black curve corresponds to the melting of the cMycGˑ22merC0/IS sample immediately after mixing, whereas the red curve is the melting curve obtained after 2 weeks of incubation at 4°C. The fluorescence melting curves of cMycGˑ22merC0 with IS added in Figure 6 are identical with those depicted in Figure 3.
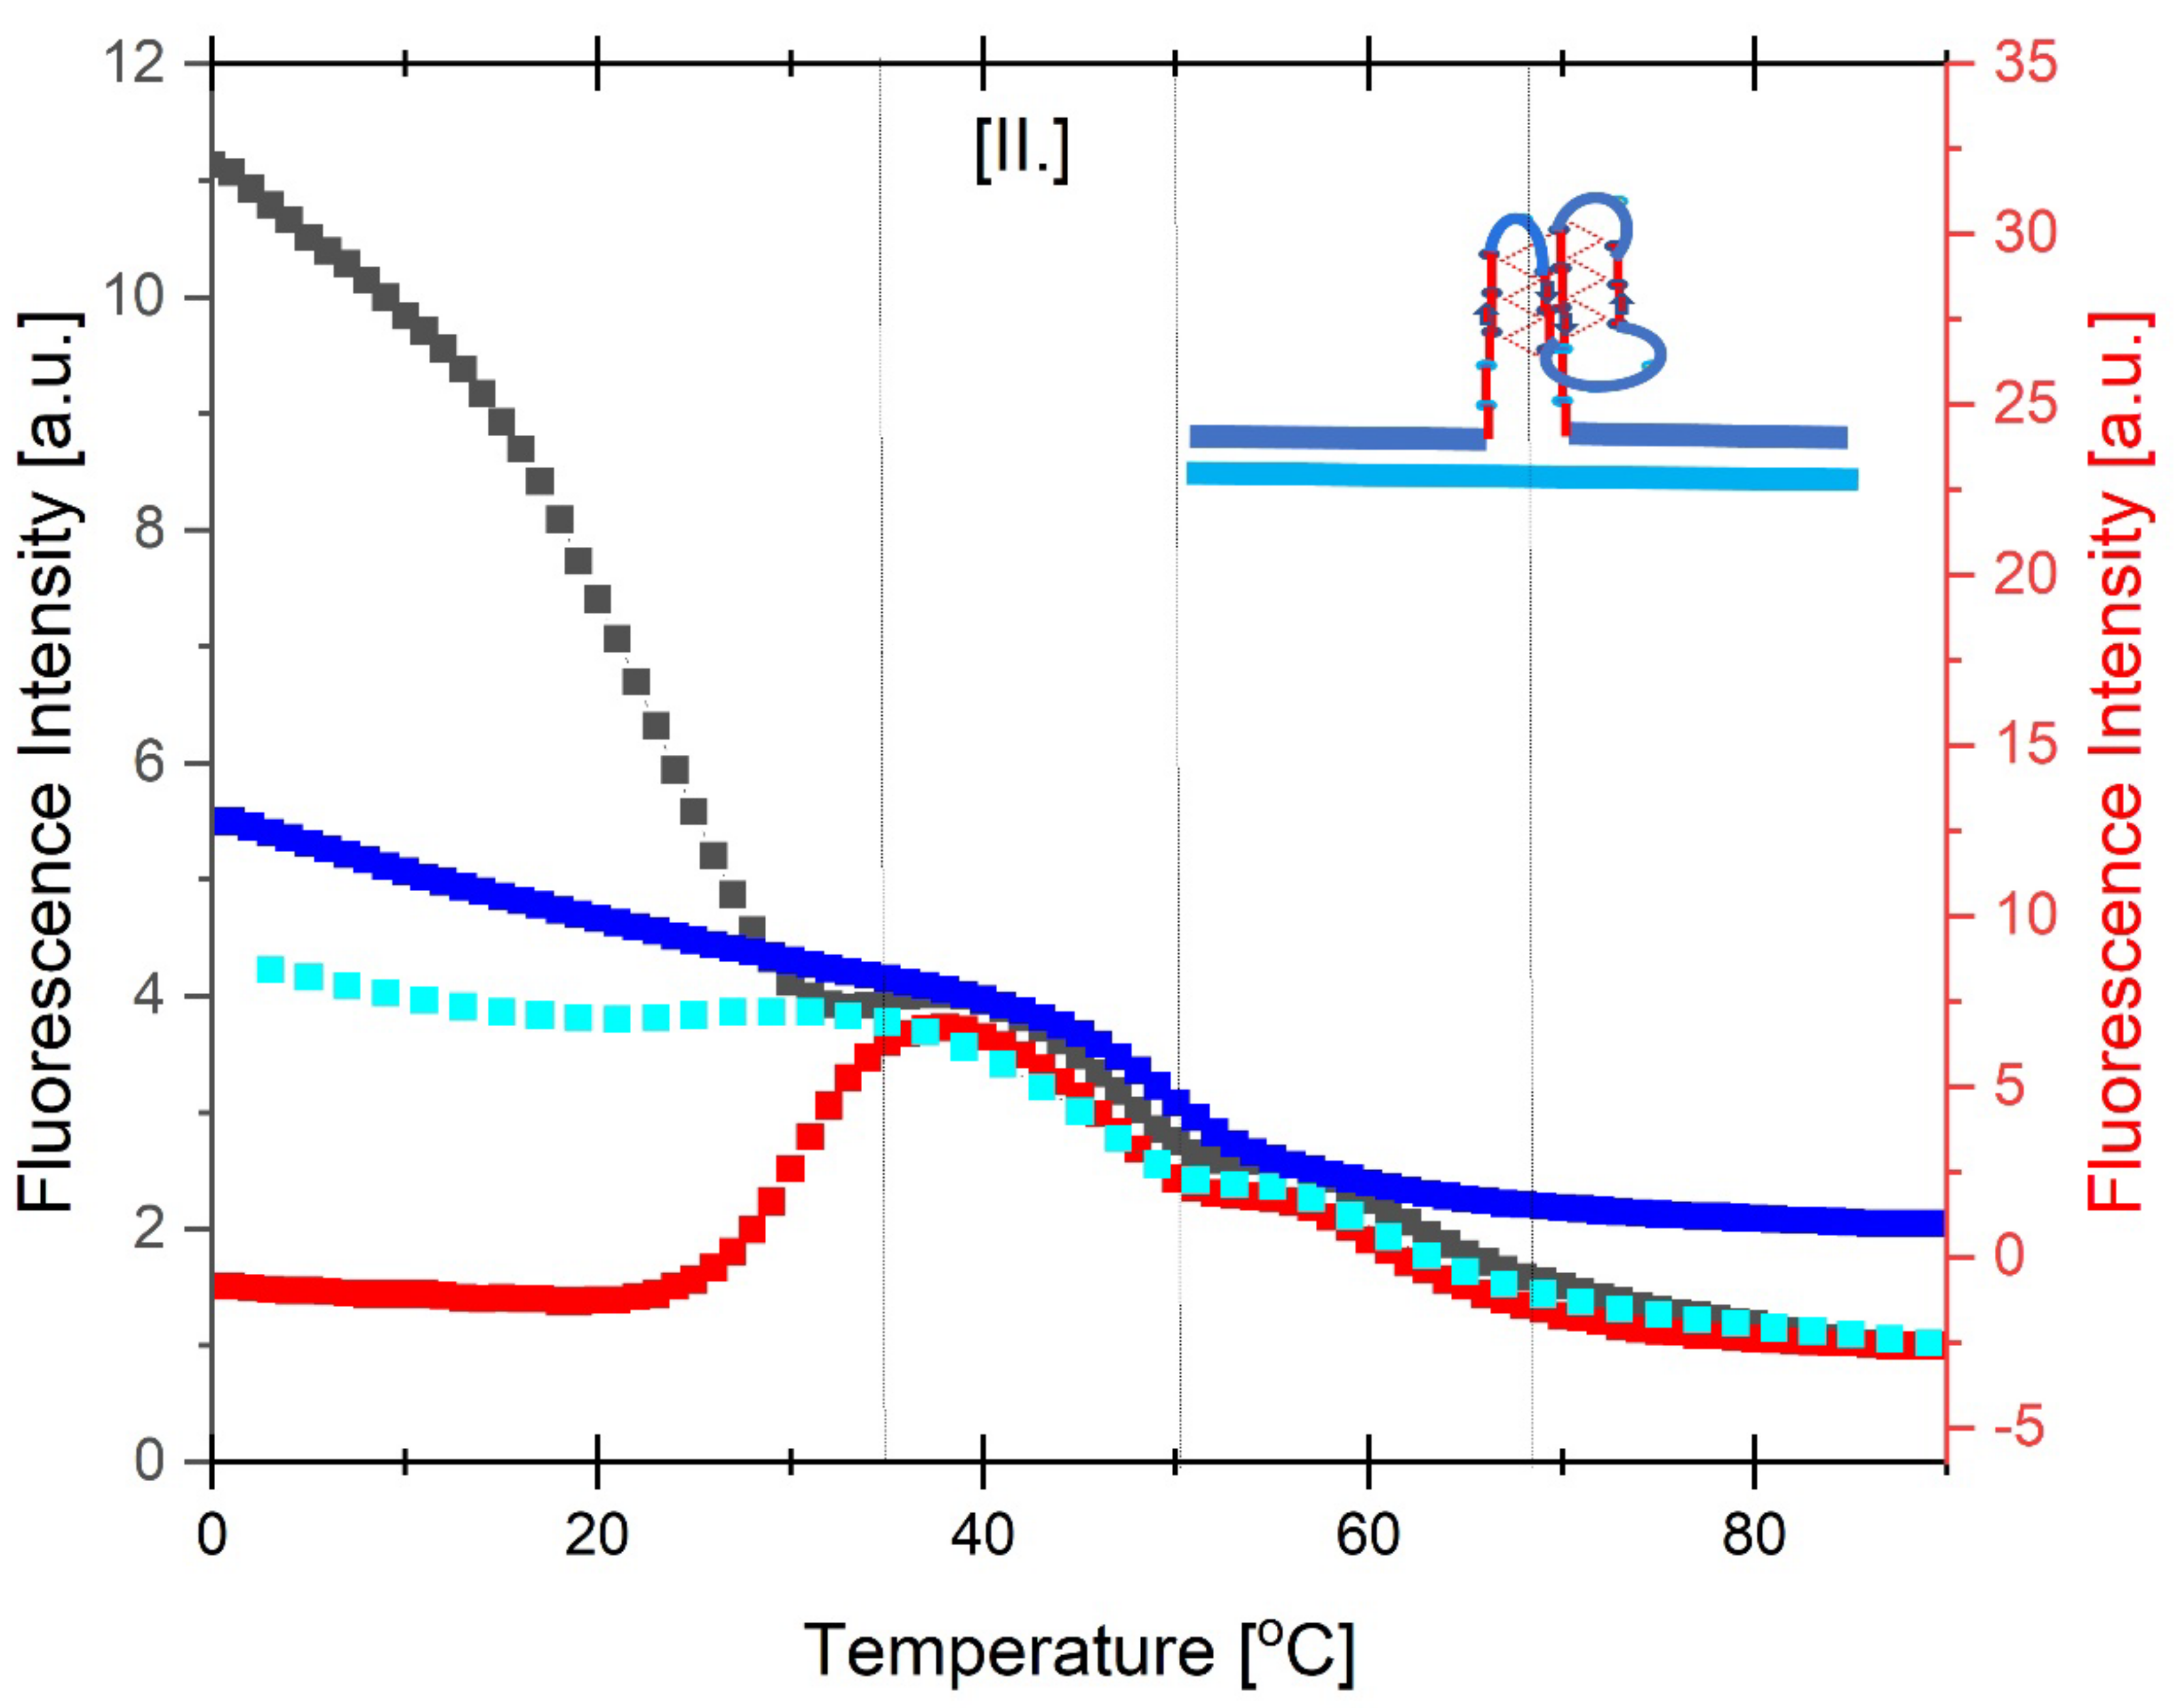
Figure 9.
An overlay of the fluorescent melting curves measured for the isolated cMycGˑIS complex (blue curve) and the fluorescent melting curves for the 1:1 mixture of preformed cMycG ˑ22merC0 with the IS immediately after mixing (black curve), and after incubation for 2 weeks at 4°C (red curve). The reannealing curve is shown in cyan. Inspection of Figure 9 reveals close agreement between the high temperature transitions in all three melting curves. This concurrence suggests that the cMycG ˑIS complex also is present in samples consisting of cMycG, 22merC0, and IS at high temperature, despite evidence that the IS becomes expelled from the G4ˑC4 loop-duplex at lower temperatures (i.e. see prior discussion of reaction 2). .
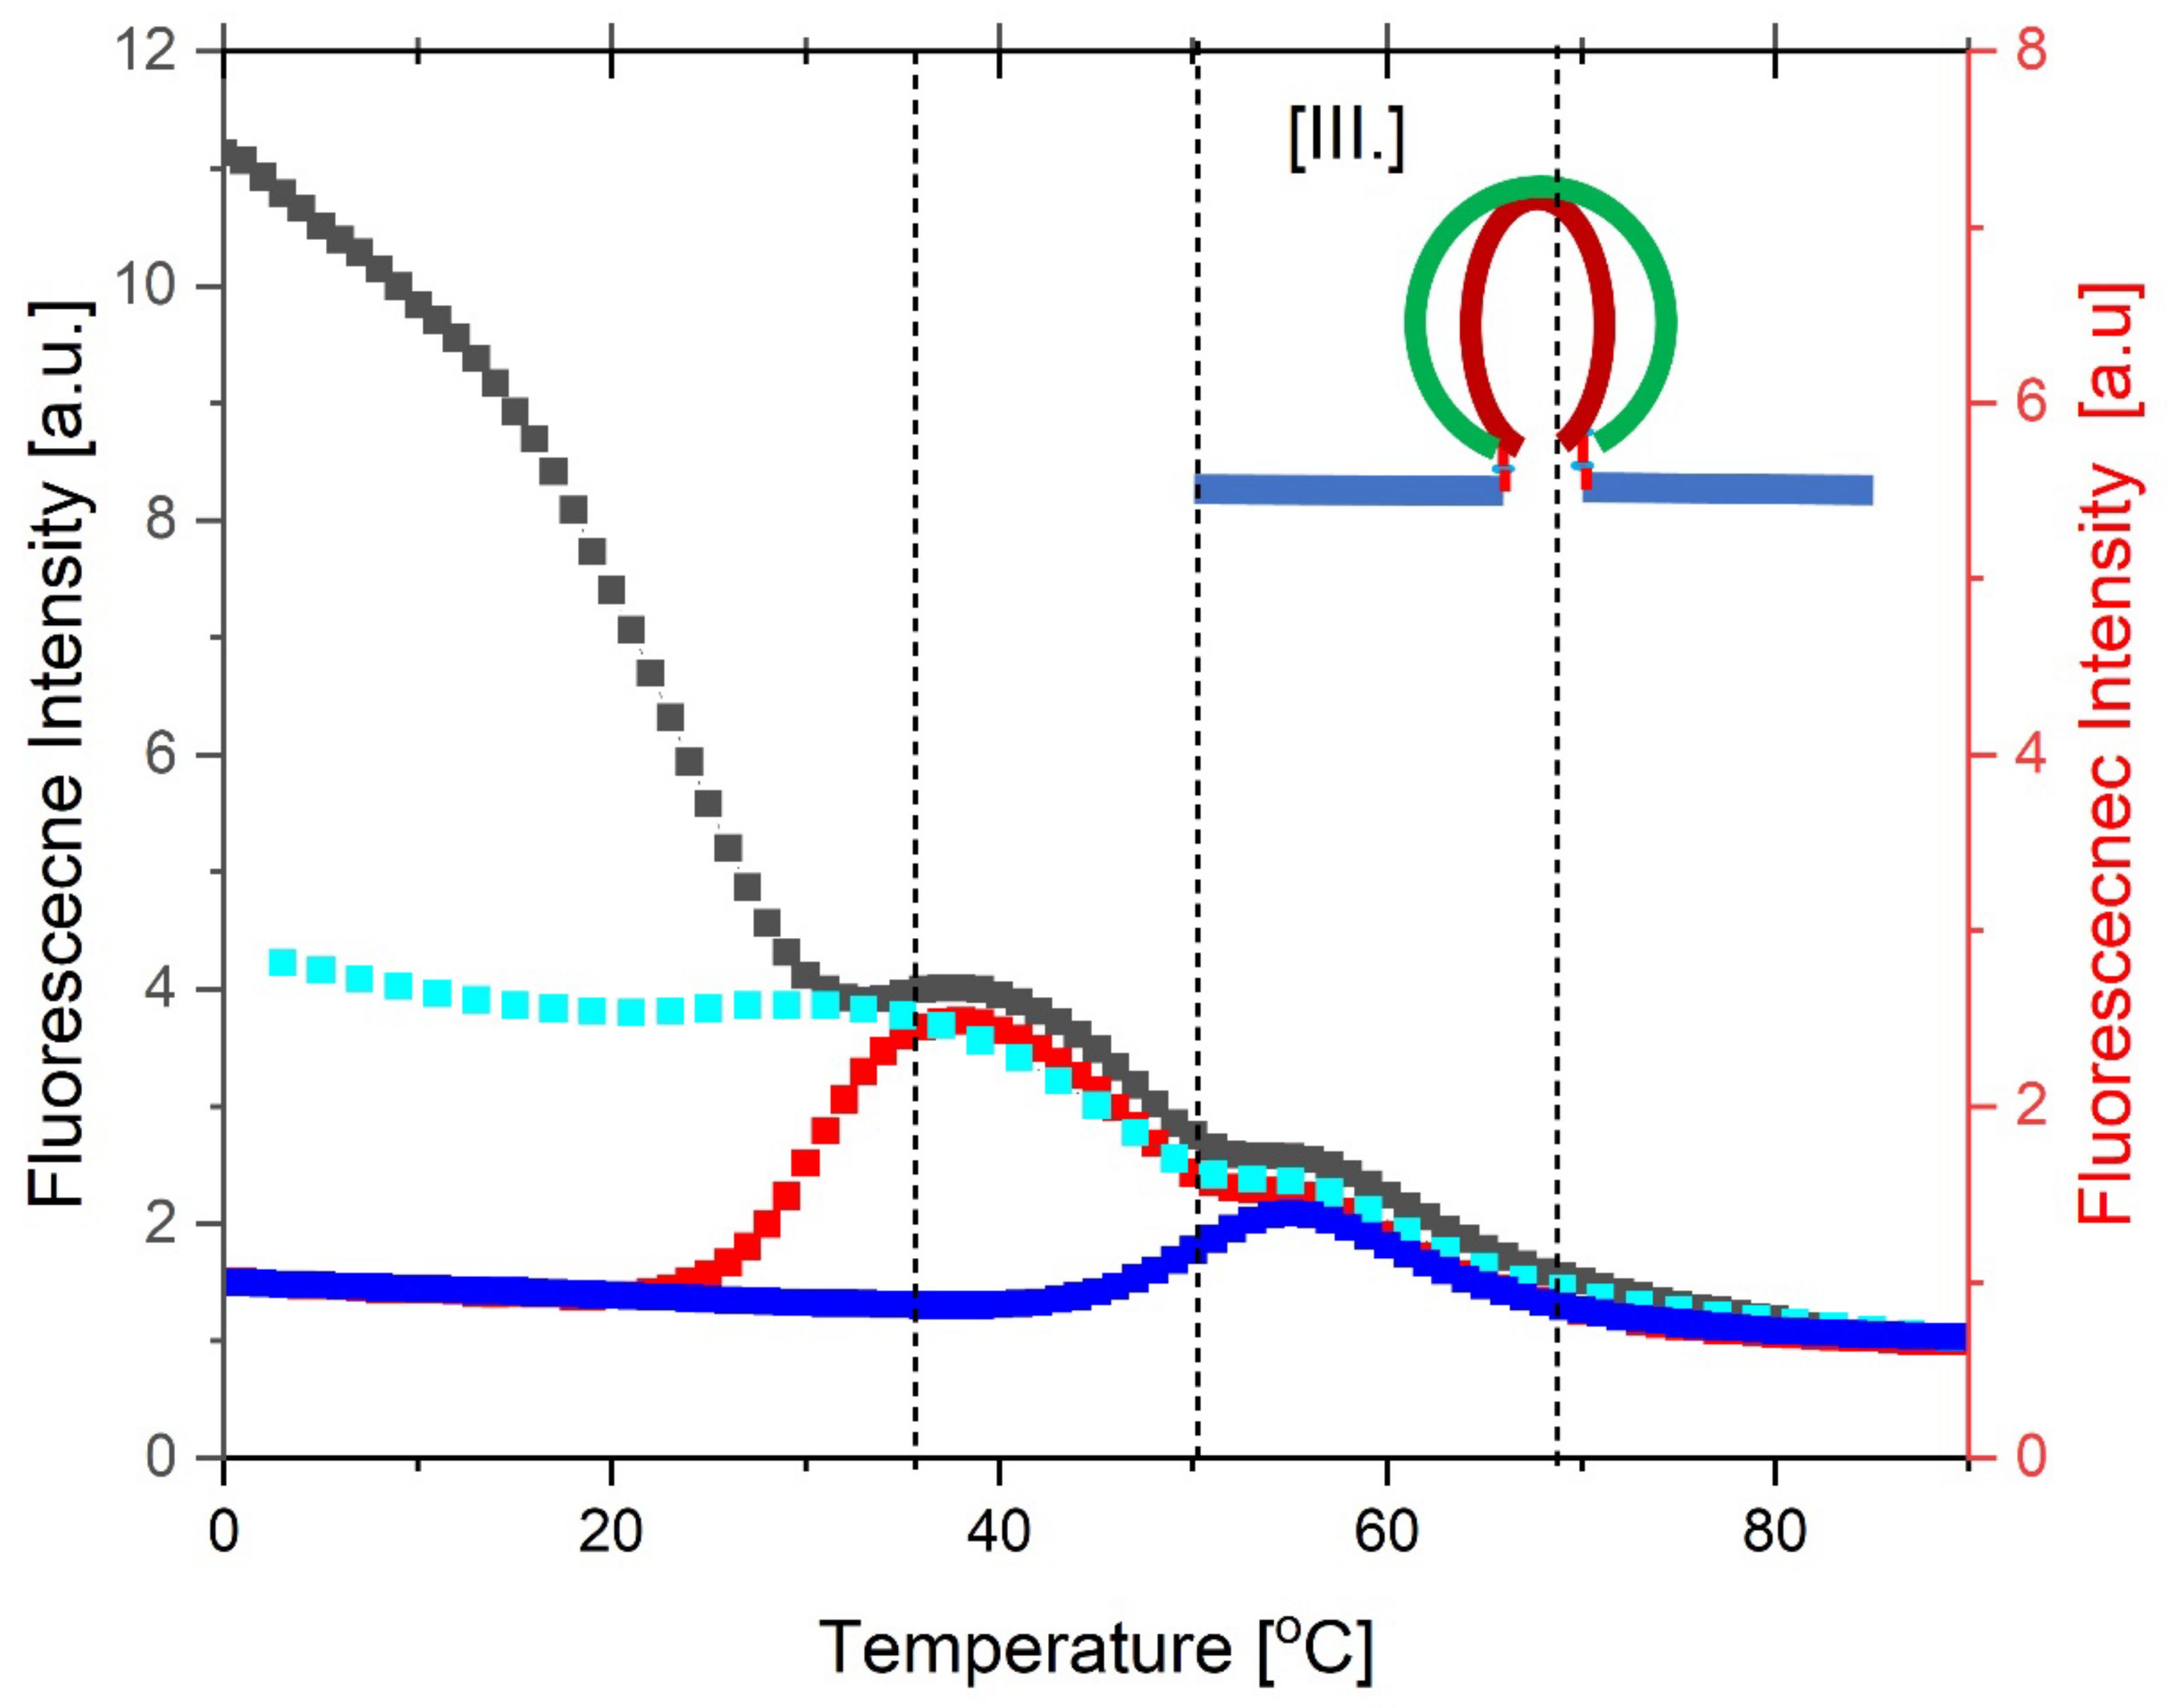

Table 1a.
Sequences of Oligonucleotides used in this study.
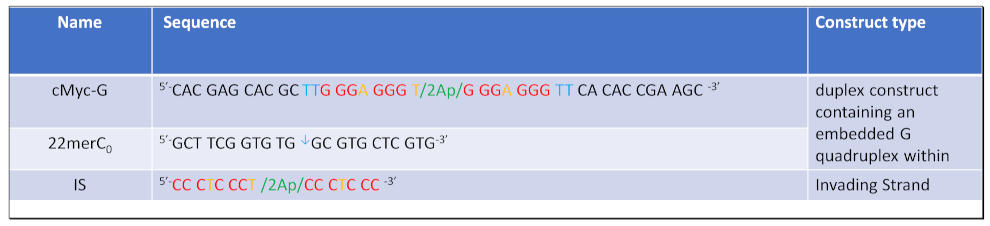 |
Table 1b.
Pictorial representation of the various DNA states that can result from different combinations of the oligonucleotides listed in Table 1a.
Table 1b.
Pictorial representation of the various DNA states that can result from different combinations of the oligonucleotides listed in Table 1a.
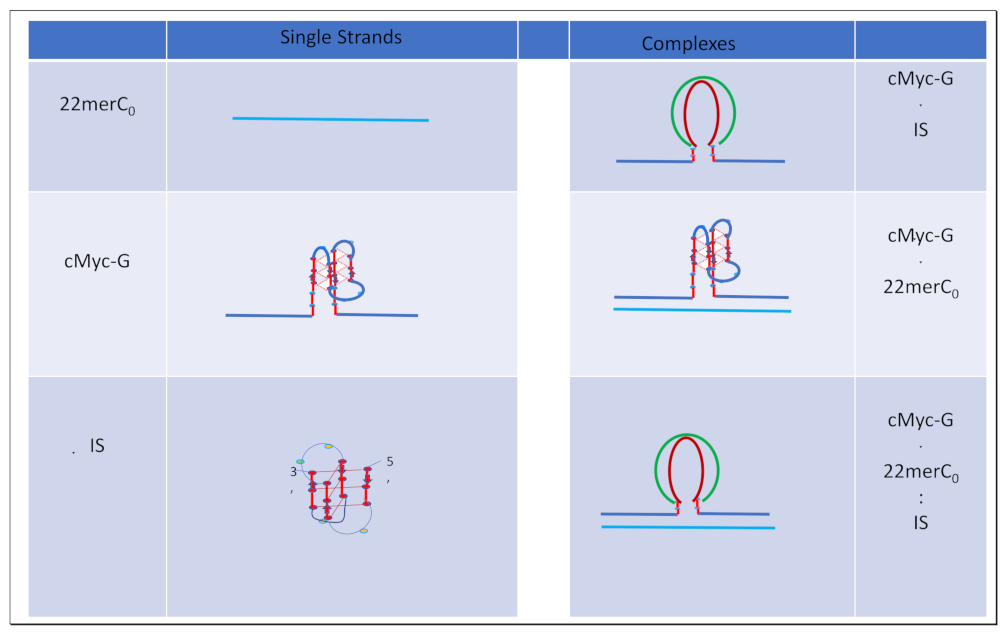 |
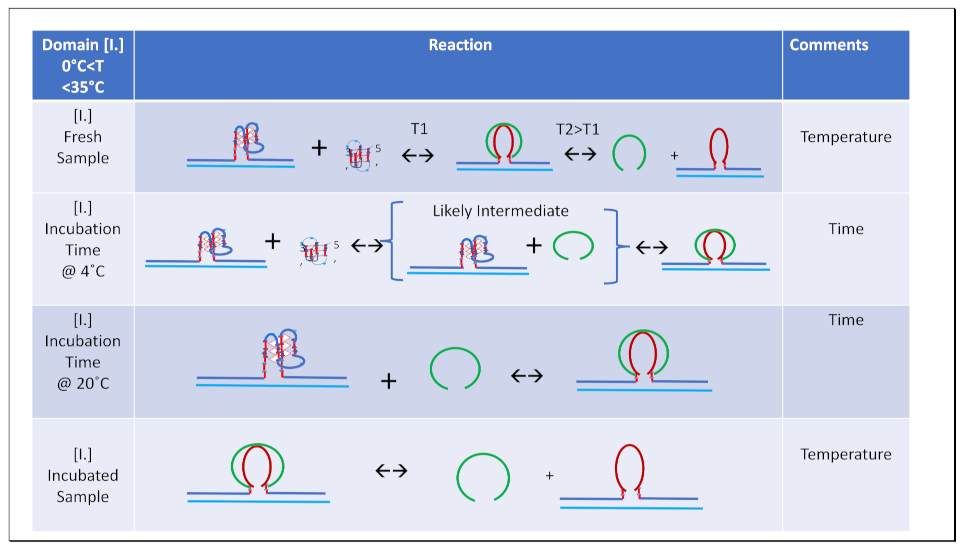 |
Table 3.
Schematically outlined coupled melting/reannealing processes associated with Temperature domain [II].
Table 3.
Schematically outlined coupled melting/reannealing processes associated with Temperature domain [II].
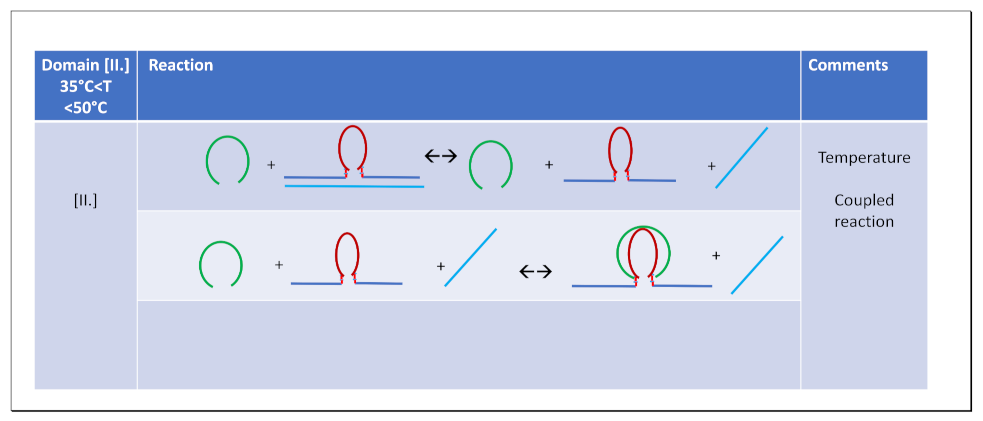 |
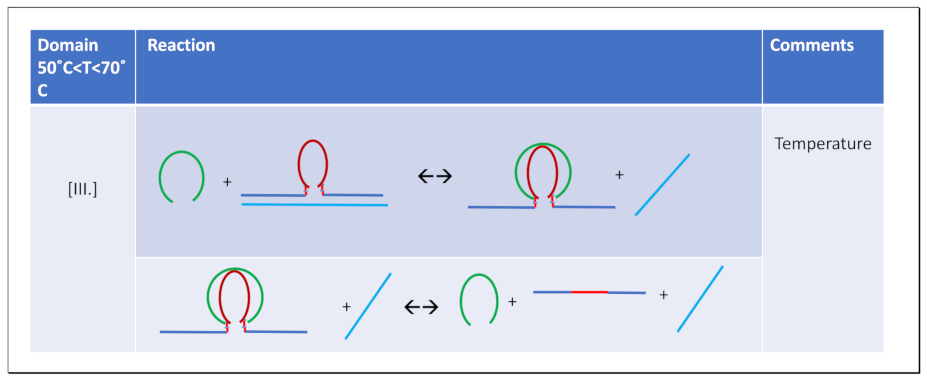 |
Disclaimer/Publisher’s Note: The statements, opinions and data contained in all publications are solely those of the individual author(s) and contributor(s) and not of MDPI and/or the editor(s). MDPI and/or the editor(s) disclaim responsibility for any injury to people or property resulting from any ideas, methods, instructions or products referred to in the content. |
© 2024 by the authors. Licensee MDPI, Basel, Switzerland. This article is an open access article distributed under the terms and conditions of the Creative Commons Attribution (CC BY) license (http://creativecommons.org/licenses/by/4.0/).
Copyright: This open access article is published under a Creative Commons CC BY 4.0 license, which permit the free download, distribution, and reuse, provided that the author and preprint are cited in any reuse.


