
Submitted:
11 November 2024
Posted:
13 November 2024
You are already at the latest version
Abstract
This paper discusses a unique and revolutionary method that quantitatively evaluates the programming of a media outlet regarding religious pluralism. Using an ‘program appeal’ score and entropy measures from Information Theory, the broadcast operator is able to determine if governmental compliance is being met and whether certain programs are problematic. The theoretical foundation of this tool is presented and illustrated using real-life data.
Keywords:
Religious pluralism
; measuring pluralism
; Entropy
; Diversity
; Cluster Analysis
Introduction
Radio Logos is the largest regional FM radio network in the European country of Albania. It currently consists of seven transmission sites which cover a wide geographical area of the country. The governmental agency over Radio Logos is the Albanian Audiovisual Media Authority (AMA) which is responsible for licensing radio and television stations and ensuring compliance to the broadcasting laws of the country. One aspect of these laws is
that is the content of our programs must clearly express general pluralism and impartiality of information. This includes religious pluralism.
Unfortunately, the exact meaning of pluralism is not
well-defined in the academic literature. Sometimes the expression ‘diversity’
is used as a synonym (which we do in this paper), but without a precise
definition of these terms, especially in the area of how to quantitatively
measure pluralism, discussions on this matter often degenerate into futile
exchanges of subjective opinions.
This lack of clarity also includes what broadcasting
programs should be included in a discussion on pluralism. Although the reader
will discover that our study encompasses all programs transmitted during a
typical broadcast day, it must be pointed out that not all agree with this
viewpoint. For example, Ofcom says “We recommended that the scope of
any plurality review should be limited to news and current affairs, but that
these genres should be considered across television, radio, the press and
online” (OFCOM, 2012:2). BBC also had a similar opinion (House
of Lords, 2014:12) where it states, “The BBC concurred that news and
current affairs are the most important genres in terms of driving the news
agenda and developing public debate, and so therefore should be the primary
genres to be considered in any plurality policy.
There are even some who express concern that the concept
of pluralism is not only ambiguous but lacks any universally recognized
standards for evaluating media performance and quality (Karppinen,
2013 in his book introduction).
Perhaps the only area of consensus is that governmental
agencies like AMA should have as a goal the promotion of a diversity of media
outlets (e.g. radio and television stations) in order to bring about pluralism,
that is, increased diversity (Salomon, 2006:39; Ofcom, 2012:1; Bleyer-Simon,
2023:63). The idea is that each media outlet will have its own unique
programming characteristics and that together they will create a pluralistic
voice for the public. Thus, an individual will have the opportunity to choose
from a diverse and pluralistic set of media choices.
It also must be noted that the academic literature is
sparse when it comes to correlating pluralism to an individual media outlet and
its programming. How can such a correlation be measured quantitatively? This
paper attempts to solve this problem by presenting a self-evaluation tool based
upon data collection and quantitative data analysis. This tool will help the
operator identify pluralism compliance status and areas of programming concern.
Methods
Although the following discussion will focus on religious
pluralism, the methods presented can be applied to other areas of concern (e.g.
gender and racial diversity).
First, we use the results from the 2023 Albanian census (Dhuli,
2024:76) which shows the general religious groupings with their respective
population percentages. For example, Muslims make up roughly 51% of the
population, Christians 16%, Atheists 17%, and Non-declared (ND) 16%. However,
it must be understood that these categories are not rigid and fixed, that is,
there is a lot of cross-over when it comes to people’s religion. It is no
secret that, practically speaking, religious observance in Albania is generally
lax, and few Albanians consider religion to be a dominant factor in their
lives. When asked about religion, people generally refer to their family's
historical religious legacy and not to their own choice of faith. It is also
very common that people will say that they are half of one religion and half of
another. Nevertheless, we will use the results of the 2023 census.
The next step is to analyse each program that is being
broadcast regarding the likelihood that this program would appeal to a person
of a particular religious grouping. We call this “program appeal.”
To better understand this concept of “program appeal,” we
create some illustrative and representative programs along with their appeal
numbers in the following table. These ‘appeal’ numbers are values between 0 and
1 (a score of 0.5 would mean that the program appeals to 50% of the listeners).
See Table 1 and Table 2.
Using these illustrative programs and appeal
numbers, we calculate four statistics that measure acceptance, pluralism and
diversity. The first is a simple weighted average and the other three come from
Information Theory. They are:
Overall appeal
This is the weighted average of the religious
grouping percentage with the likelihood that the particular program appeals to
that group. That is,
For example, for the offensive program (OF_ALL) we have,
Normalized Shannon Entropy.
The expression “entropy” was introduced into the field of communications by Claude Shannon, an American mathematician and engineer. As a result, it is often called Shannon entropy since he was the "the father of information theory." The concept of entropy is widely used in many scientific fields and is a measure of the diversity of a communication system (Sturm, 2017:17-43). Its formula is
Where
and
Which means that
The maximum value of Ent is 1.0. For example, for OF_ALL the calculations are the following.
Reflective Diversity (RD)
Reflective diversity (Van Cuilenburg, 2000: 51-84) is a measure to which existing population preferences are proportionally represented in the media programming. We are applying this statistic to measure reflective religious diversity. Its formula is
where
For example, for OF_ALL the calculations are the following.
Open diversity (OD)
This statistic (Van Cuilenburg, 2000: 51-84) measures how diverse preferences and opinions are uniformly represented in the media. We are applying this statistic to measure open religious diversity. Its formula is
where n=4.
For example, for OF_ALL the calculations are the following.
Using these statistics with our illustrative programs and appeal scores, we have the following results (Table 3).
The question now becomes – How do we collectively use this data to evaluate our programming regarding religious diversity? The answer is Cluster Analysis.
Cluster Analysis is a classical statistical technique that helps the researcher “reduce” or “simplify” the data into similar clusters. In our situation, Cluster Analysis will group the programs into similar clusters based upon the variables Overall, Entropy, RD and OD. Applying this technique to our data, a Cluster Dendrogram is produced which is a graphical method to assess which programs are similar.
The Dendrogram shows probability values for each cluster which indicates how strong the cluster is supported by the data. In fact, the Dendrogram shows two types of probability values: the red AU (Approximately Unbiased) probability value and the green BP (Bootstrap Probability) value. The AU probability value is thought to be a better approximation as to which clusters are significant. Thus, we will use the AU value instead of the BP value. The idea is that if the AU value is greater than or equal to 99, then we can group programs into a single cluster. The values in the grey color are simply the index numbers of the programs. In addition, several rectangles are drawn to highlight “significant” clusters.
Using the pvclust method (Ryota, 2019) from the R software package (R Core Team, 2014) and applying this to our illustrative and representative data, we obtain the following Dendrogram (see Figure 1).
The Dendrogram shows that the illustrative and representative programs can be grouped into six (6) clusters (see Table 4).
This clustering makes perfect sense in that programs that are offensive to some degree or lack religious diversity are grouped into separate clusters. Other “good” programs are likewise grouped into their own clusters. News is a cluster by itself.
Let us now introduce (see Table 5) the programs of Radio Logos (from a typical weekday). The appeal scores were based upon historical listener feedback.
Using the above scores we calculate the statistics overall, entropy, RD and OD. These are listed in Table 6.
Next, we use Cluster Analysis on the data. The analysis extracts three (3) main clusters (see Figure 2). The obvious highlight is a program that is called Permes Bibles which stands alone as a cluster.
Finally, we combine the data from illustrative and representative programs with the programs of Radio Logos and use Cluster Analysis. This produces six (6) significant clusters (see Figure 3).
Results
The results show that no Radio Logos program falls into the cluster which is offensive toward Christians, Atheists, and Non-declared. Radio Logos news is comparable with the ideal illustrative news category. Except for one program, all other Radio Logos programs fall into clusters with other general programs. The only exception is ‘Permes Bibles’ which, unfortunately, falls into the cluster with a number of potentially offensive programs. Therefore, this program needs to be considered as a possible program that is not religiously diverse enough.
A further examination of the data revealed that the programming of Radio Logos is not very appealing to Atheists. Specifically, the combined appeal scores of Muslims, Christian and ND was 0.791 as compared the score of 0.369 for Atheists. Without question, no radio station can be appealing to everyone. Nevertheless, this presents a challenge for us at Radio Logos to be creative in our programming towards Atheists.
Overall, except for one possible program, this self-evaluation tool shows that Radio Logos is doing a tremendous job of maintaining pluralism and diversity.
Conclusion
No media outlet should ever be satisfied with the status quo. The future always brings challenges in the form of a changing listener audience. Therefore, we must be diligent in monitoring our programs, refreshing our playlists, and creating new programs to ensure that they satisfy our goal of pluralism and diversity.
The self-evaluation tool presented in this paper is one way to do this. It is easy to understand and simple to implement. If used on a regular basis, it will give the broadcast operator valuable information that will help keep his station appealing to all religious groups, pluralistic in the eyes of the government, and help the operator to maintain a competitive market advantage over his rivals.
References
- Bleyer-Simon, K. , Brogi, E., et al (2023). Monitoring Media Pluralism in the Digital Era: Application of the Media Pluralism Monitor In the European Union, Albania, Montenegro, the Republic of North Macedonia, Serbia and Turkey in the year 2022. Centre for Media Pluralism and Media Freedom. European University Institute.
- Dhuli, E. (2024) Censi i Popullsise dhe Banesave ne Shqiperi 2023. INSTAT, Instituti i Statistikave, Tirane, Albania 1017.
- House of Lords (2014) Media Plurality. Select Committee on Communications, 1st Report of Session 2013-14. Published by the Authority of the House of Lords.
- Karppinen, K. (2013) Rethinking Media Pluralism, Fordham University Press. New York.
- OFCOM (2012, October) Measuring media plurality: Supplementary advice to the secretary of state for culture, media and sport and the Leveson inquiry. London, UK: Ofcom.
- R: A language and environment for statistical computing. R Foundation for Statistical Computing, Vienna, Austria. URL http://www.R-project.org/.
- Ryota, S. , Terada, Y., Shimodaira, H. (2019) pvclust: Hierarchical Clustering with P-Values via Multiscale Bootstrap. https://CRAN.R-project.org/package=pvclust.
- Salomon, E. (2006), Guidelines for broadcasting regulation,1st ed., Paris: Commonwealth Broadcasting Association (CBA) / Unesco. 76. Unesco. Reference: CI/COM/2006/PI/3.
- Sturm, G.W. (2017). Introduction to Information Theory. Pyongyang University of Science and Technology, DPRK.
- Van Cuilenburg, J. J. (2000). On measuring media competition and media diversity: Concepts, theories and methods. In R. G. Picard (Ed.), Measuring media content, quality, and diversity. Turku School of Economics and Business Administration (pp. 51-84). Finland: Turku.
Figure 1.
Dendrogram for the representative programs.
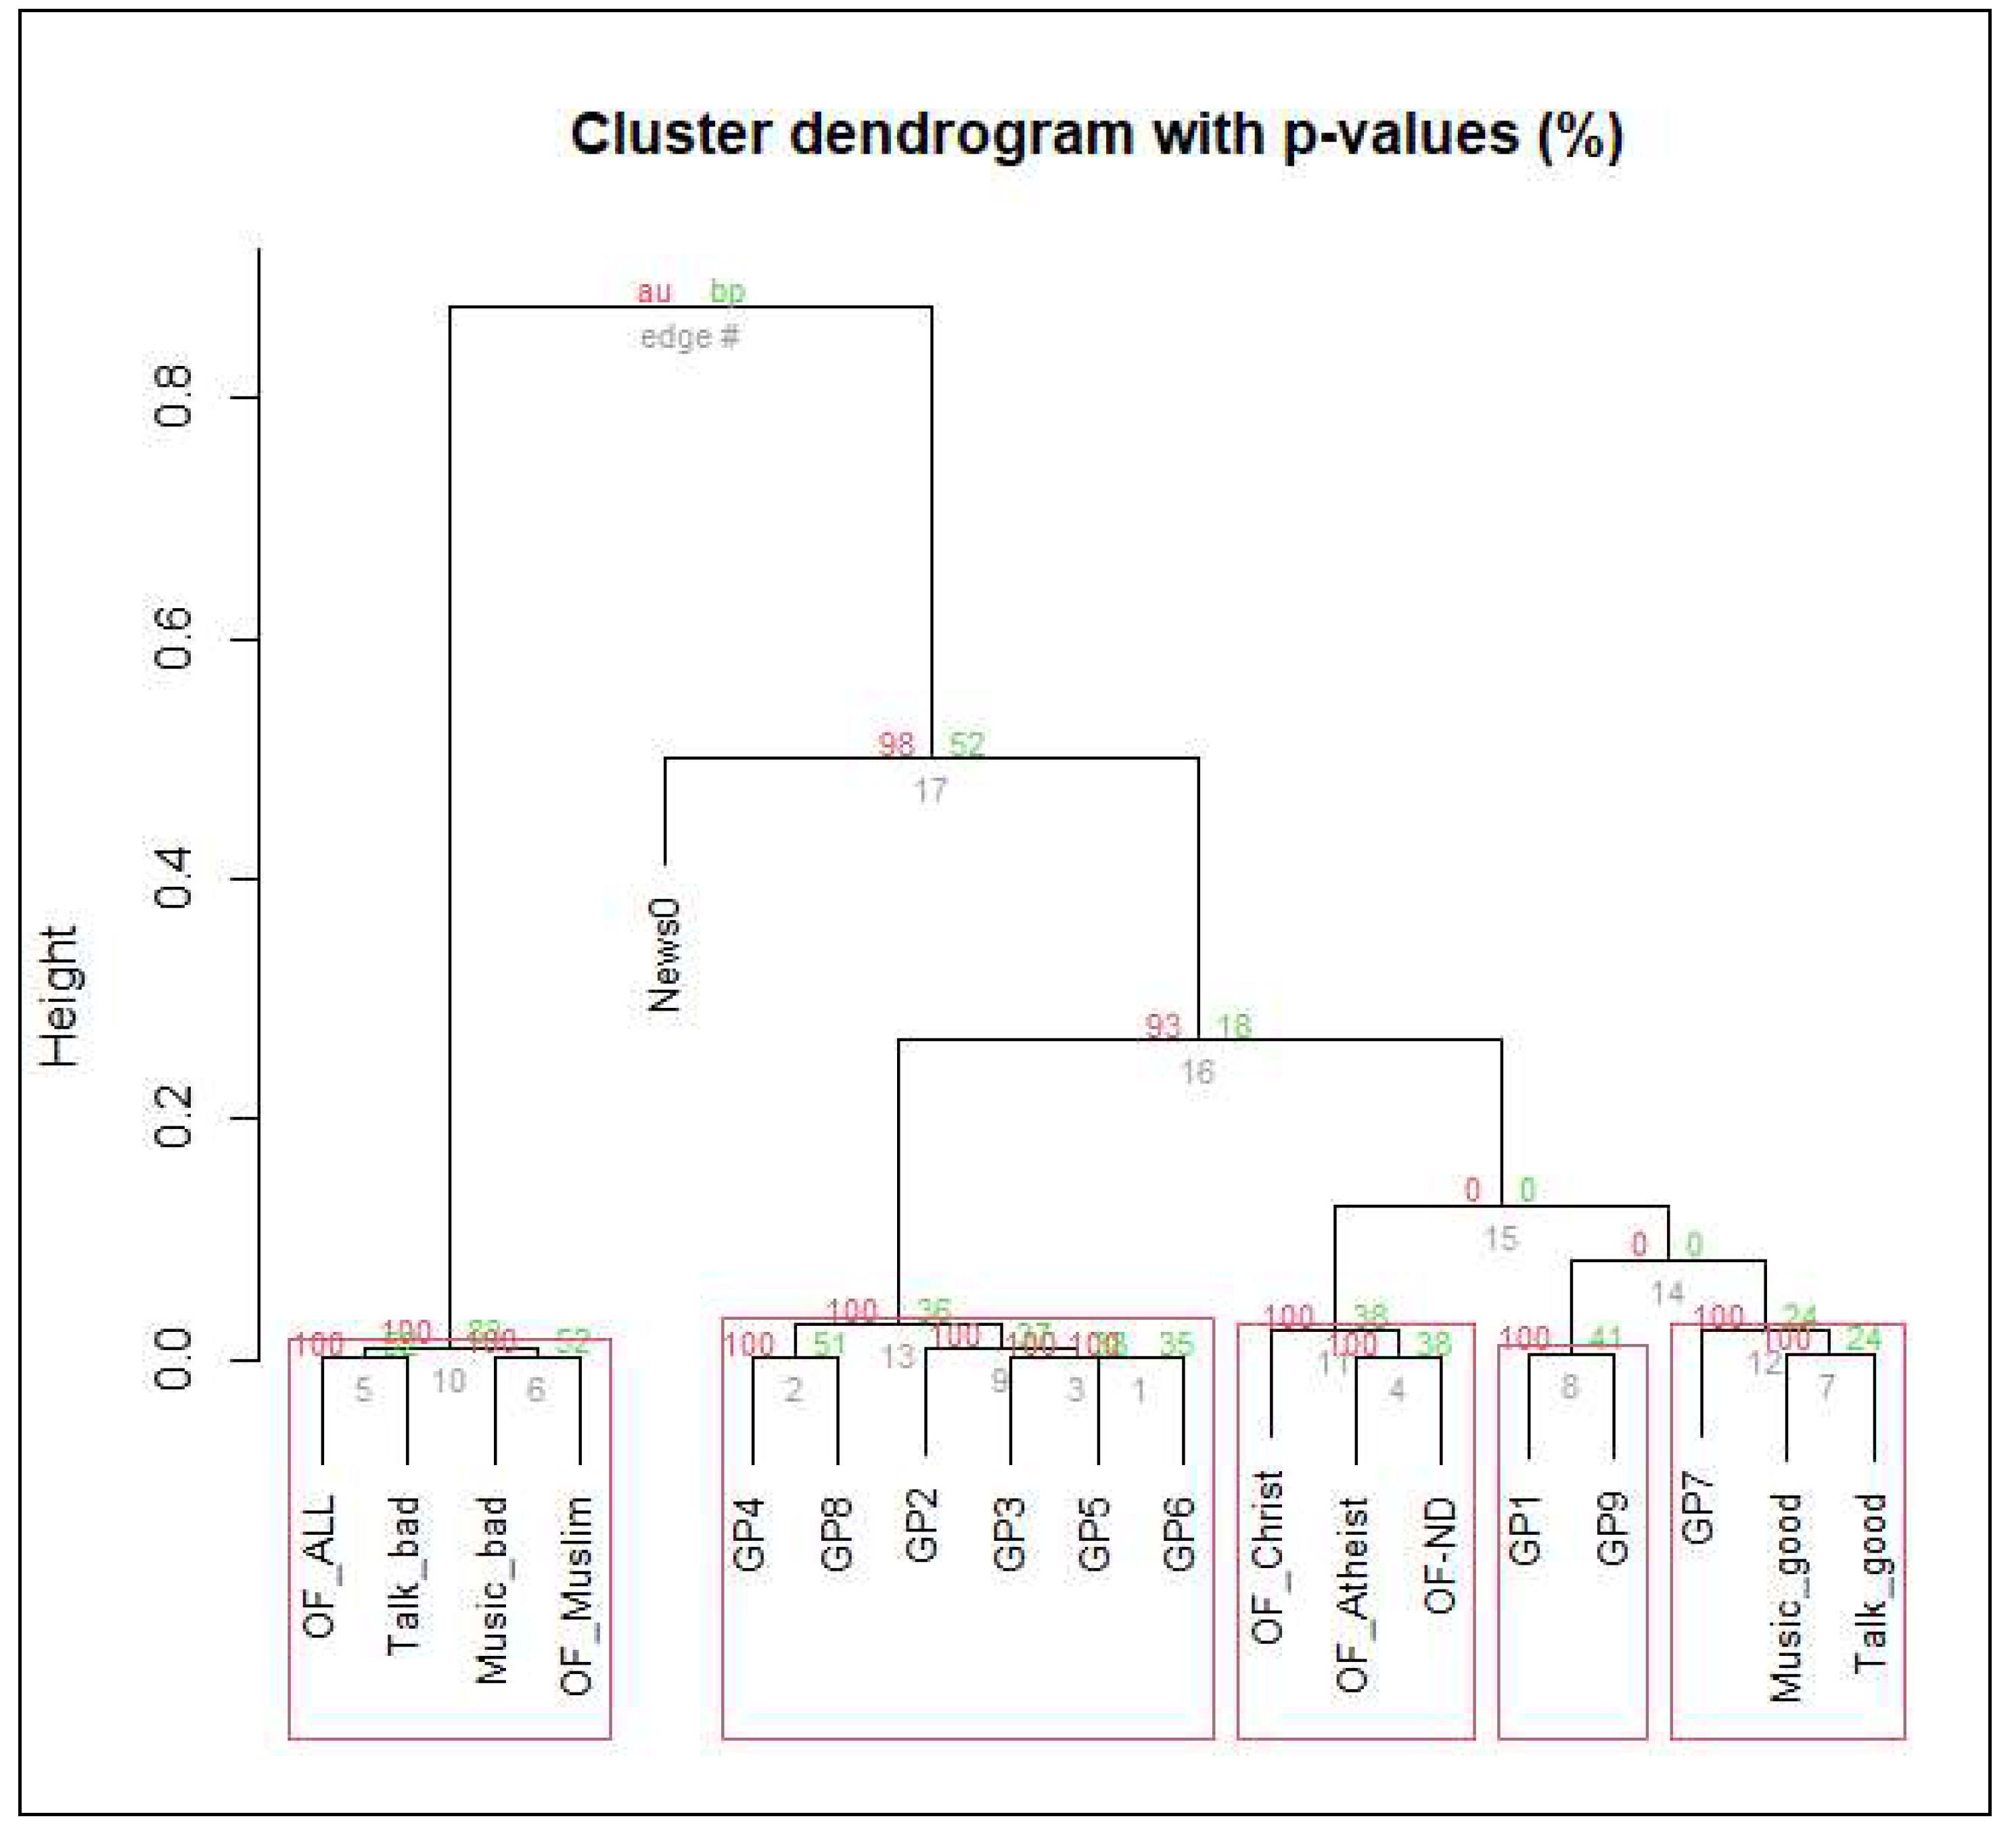
Figure 2.
Dendrogram for Radio Logos programs.
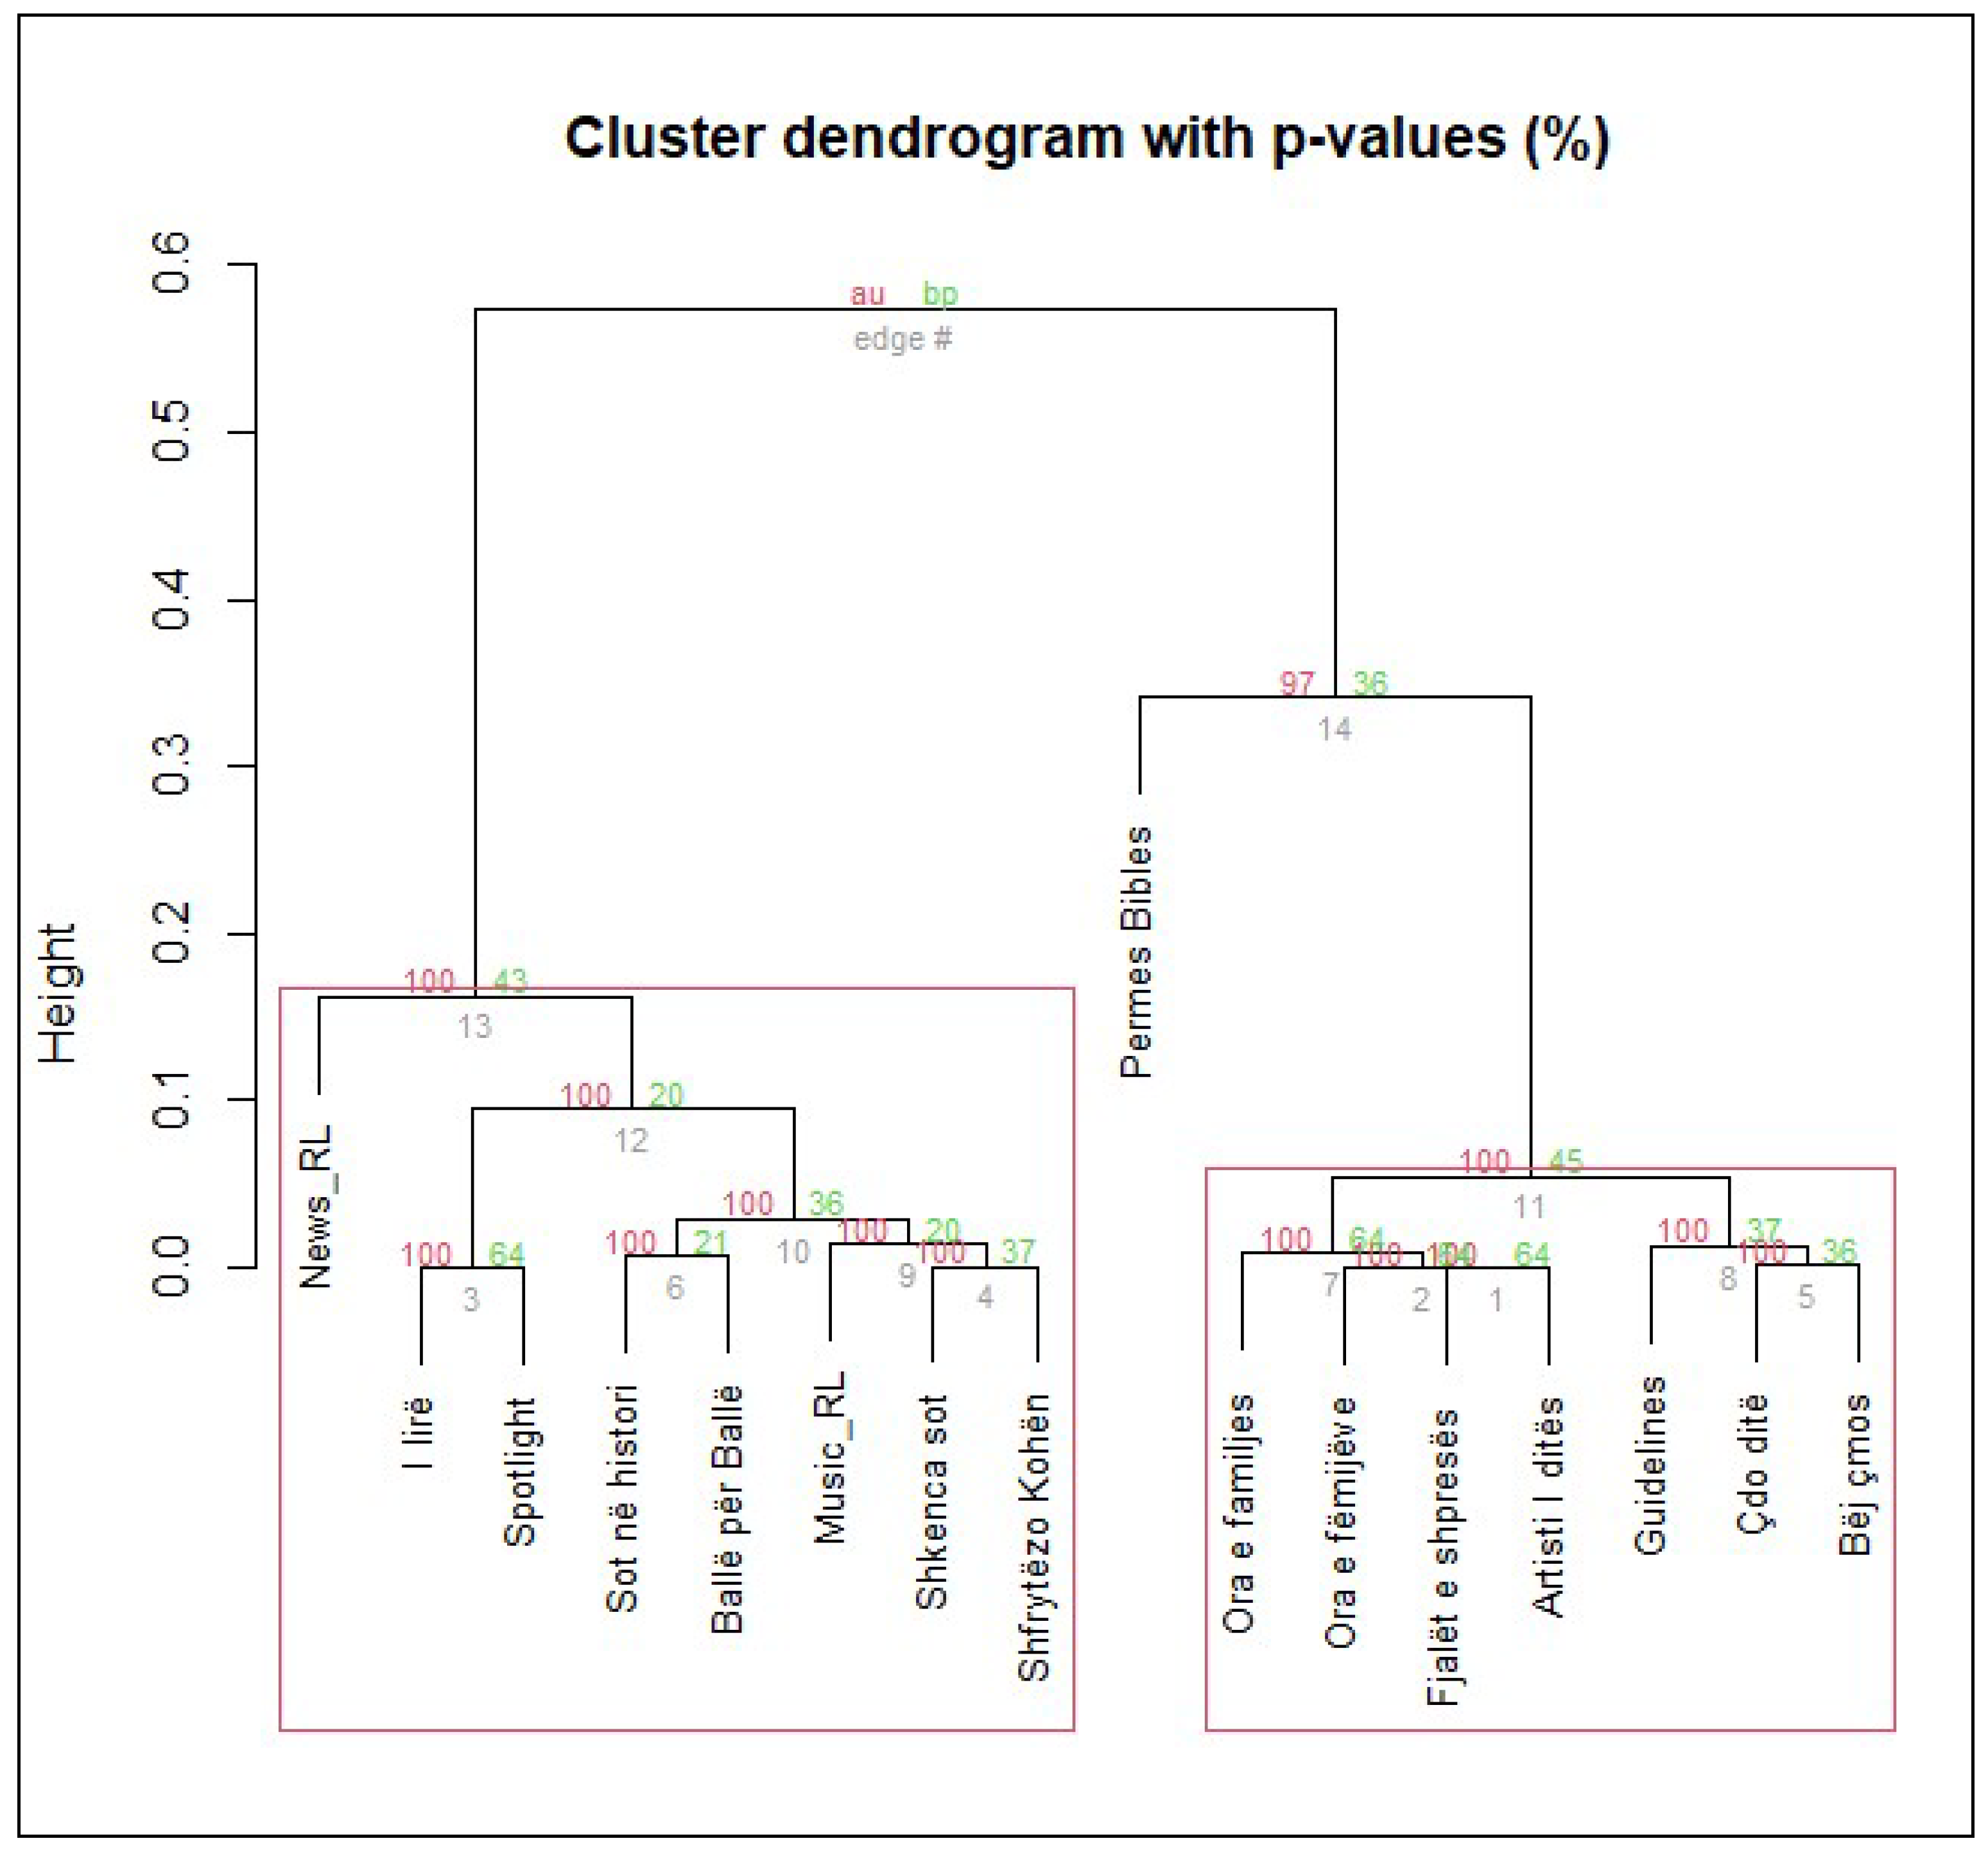
Figure 3.
Dendrogram for the combined programs.
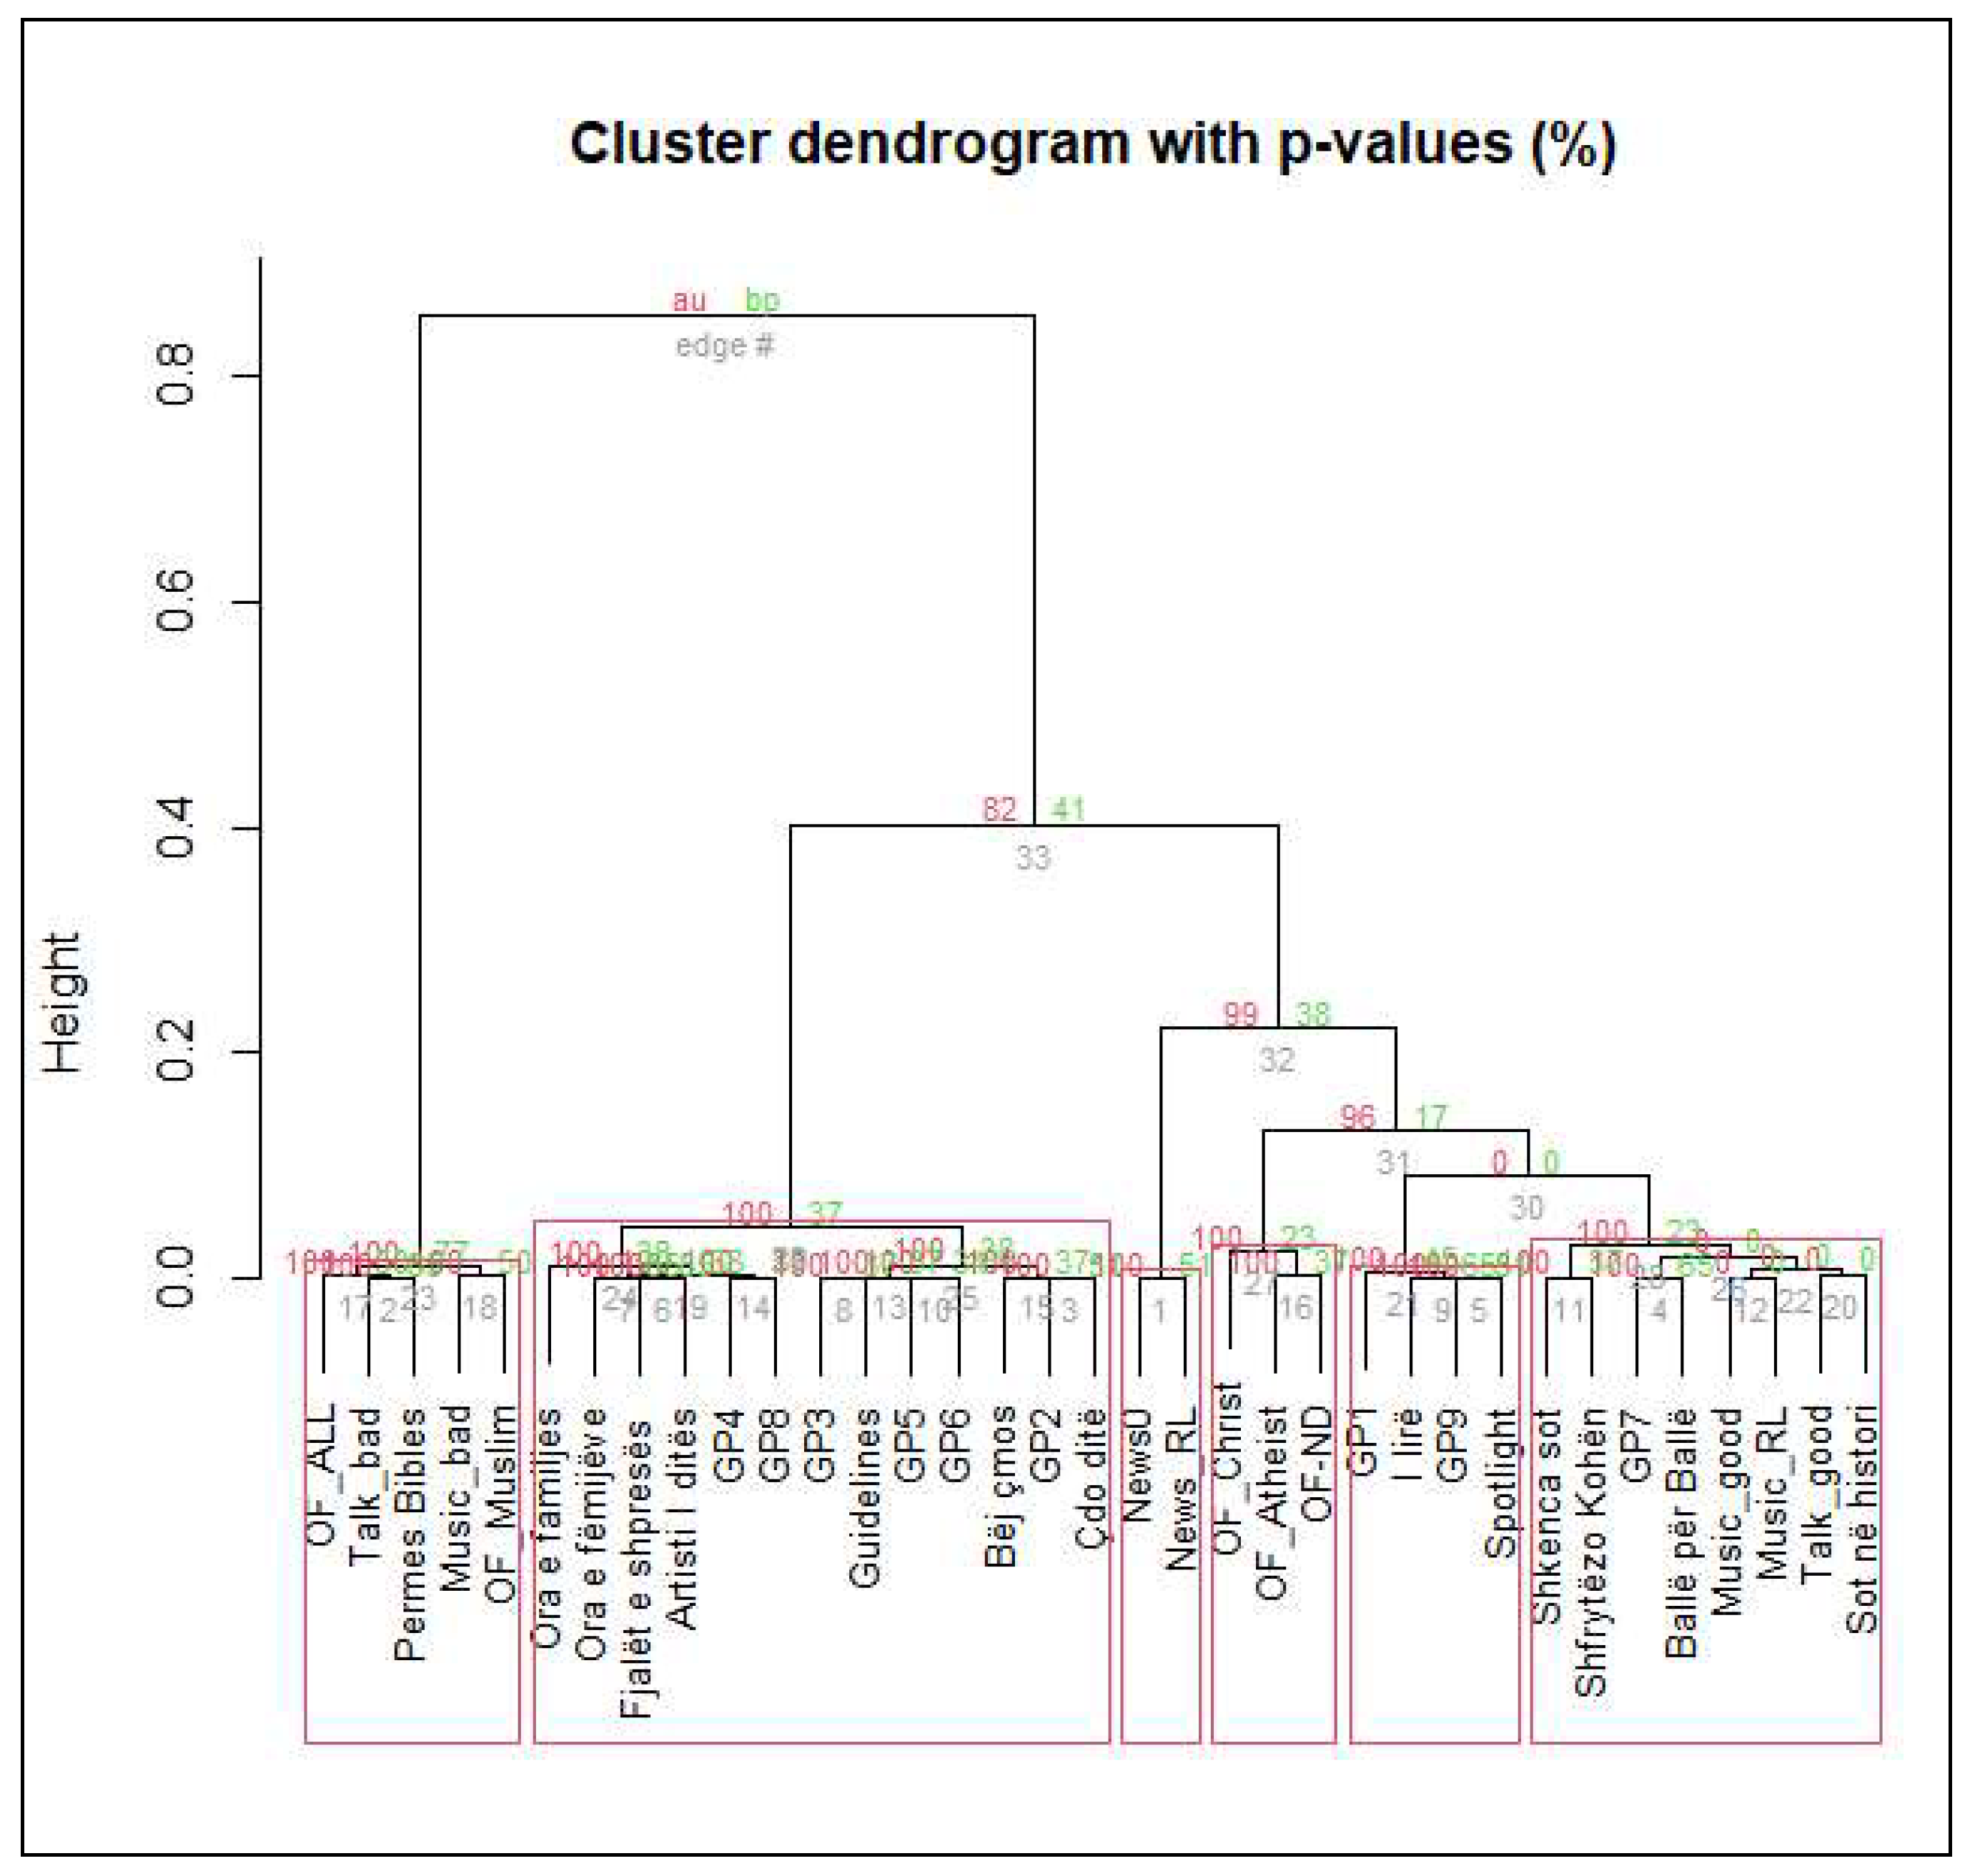

Table 1.
Representative programs.
| News0 | A news program (News0) would be very generic regarding its religious content and would have a universal appeal as listed in the table. One hundred percent of Muslims would have no objection, and so on. |
| OF_ALL | An offensive program (OF_ALL), one that is filled with cursing against God, denouncing of politicians and sexually inappropriate language, would only appeal to 10% of Muslims but be liked by Atheists, and so on. |
| Music_bad | Music that is highly immoral and represented by immoral people might be liked more by Atheists than anyone else. |
| Talk_bad | A talk show filled with cursing, immoral talk and so on, which might be liked more by an Atheist than anyone else. |
| OF_Muslim | A program that a Muslim would not find appealing. A similar concept is for OF_Christ, OF_Atheist, and OF-ND (Non-declared) |
| GP1 through GP9 | GP means General Program. We listed nine varieties, none particularly offense, but liked more by some groups and less by others. |
Table 2.
The appeal scores of the representative programs.
| Muslim 51% |
Christian 16% |
Atheists 17% |
Non-declared 16% |
|
| News0 | 1.0 | 1.0 | 1.0 | 1.0 |
| OF_ALL | 0.1 | 0.1 | 1.0 | 0.1 |
| Music_bad | 0.1 | 0.1 | 0.9 | 0.5 |
| Music_good | 0.9 | 0.9 | 0.2 | 0.5 |
| Talk_bad | 0.2 | 0.2 | 0.9 | 0.5 |
| Talk_good | 0.9 | 0.9 | 0.5 | 0.8 |
| OF_Muslim | 0.1 | 0.7 | 0.5 | 0.4 |
| OF_Christ | 0.8 | 0.1 | 0.5 | 0.4 |
| OF_Atheist | 0.8 | 0.8 | 0.0 | 0.5 |
| OF-ND | 0.8 | 0.8 | 0.5 | 0.0 |
| GP1 | 0.8 | 0.8 | 0.8 | 0.8 |
| GP2 | 0.7 | 0.9 | 0.1 | 0.5 |
| GP3 | 0.7 | 0.8 | 0.4 | 0.5 |
| GP4 | 0.6 | 0.7 | 0.3 | 0.6 |
| GP5 | 0.7 | 0.9 | 0.4 | 0.6 |
| GP6 | 0.7 | 0.8 | 0.5 | 0.7 |
| GP7 | 0.9 | 1.0 | 0.9 | 0.9 |
| GP8 | 0.6 | 0.9 | 0.3 | 0.6 |
| GP9 | 0.8 | 0.9 | 0.8 | 0.8 |
Table 3.
Overall appeal and entropy measurements.
| Muslim 51% |
Christian 16% |
Atheists 17% |
Non-declared 16% |
Overall | Ent | RD | OD | |
| Lajmet0 | 1.0 | 1.0 | 1.0 | 1.0 | 1.00 | 0.89 | 1.00 | 0.74 |
| OF_ALL | 0.1 | 0.1 | 1.0 | 0.1 | 0.25 | 0.68 | 0.50 | 0.58 |
| Music_bad | 0.1 | 0.1 | 0.9 | 0.5 | 0.30 | 0.83 | 0.55 | 0.72 |
| Music_good | 0.9 | 0.9 | 0.2 | 0.5 | 0.72 | 0.72 | 0.83 | 0.61 |
| Talk_bad | 0.2 | 0.2 | 0.9 | 0.5 | 0.37 | 0.91 | 0.70 | 0.81 |
| Talk_good | 0.9 | 0.9 | 0.5 | 0.8 | 0.82 | 0.83 | 0.93 | 0.69 |
| OF_Muslim | 0.1 | 0.7 | 0.5 | 0.4 | 0.31 | 0.97 | 0.65 | 0.87 |
| OF_Christ | 0.8 | 0.1 | 0.5 | 0.4 | 0.57 | 0.63 | 0.80 | 0.54 |
| OF_Atheist | 0.8 | 0.8 | 0.0 | 0.5 | 0.62 | 0.62 | 0.80 | 0.59 |
| OF-ND | 0.8 | 0.8 | 0.5 | 0.0 | 0.62 | 0.63 | 0.81 | 0.59 |
| GP1 | 0.8 | 0.8 | 0.8 | 0.8 | 0.80 | 0.89 | 1.00 | 0.74 |
| GP2 | 0.7 | 0.9 | 0.1 | 0.5 | 0.60 | 0.74 | 0.83 | 0.65 |
| GP3 | 0.7 | 0.8 | 0.4 | 0.5 | 0.63 | 0.83 | 0.90 | 0.69 |
| GP4 | 0.6 | 0.7 | 0.3 | 0.6 | 0.56 | 0.84 | 0.92 | 0.71 |
| GP5 | 0.7 | 0.9 | 0.4 | 0.6 | 0.66 | 0.85 | 0.92 | 0.71 |
| GP6 | 0.7 | 0.8 | 0.5 | 0.7 | 0.68 | 0.87 | 0.95 | 0.73 |
| GP7 | 0.9 | 1.0 | 0.9 | 0.9 | 0.92 | 0.90 | 0.99 | 0.75 |
| GP8 | 0.6 | 0.9 | 0.3 | 0.6 | 0.60 | 0.86 | 0.92 | 0.74 |
| GP9 | 0.8 | 0.9 | 0.8 | 0.8 | 0.82 | 0.90 | 0.98 | 0.75 |
Table 4.
Clusters of the representative programs.
| Cluster 1 | OF_ALL, Talk_bad, Music_bad, OF_Muslim. |
| Cluster 2 | GP2, GP3, GP4, GP5, GP6, GP8 |
| Cluster 3 | OF_Christ, OF_Atheist, OF_ND |
| Cluster 4 | GP1 and GP9 |
| Cluster 5 | GP7, Music_good, Talk_good |
| Cluster 6 | News0 (news program) |
Table 5.
Programs of Radio Logos.
| Program | Muslim 51% |
Christian 16% |
Atheists 17% |
Non-declared 16% |
Short description |
| News_RL | 1.0 | 1.0 | 1.0 | 1.0 | A general news program |
| Music_RL | 0.9 | 1.0 | 0.2 | 0.5 | We are famous for having good music |
| Shkenca_sot | 0.9 | 0.9 | 0.1 | 0.8 | Interesting to most, but not to most atheist since we often use science to prove that we did not come from monkeys. |
| Shfrytëzo_Kohën | 0.9 | 1.0 | 0.1 | 0.8 | General program on how to effectively use your time |
| Ora_familjes | 0.5 | 0.9 | 0.2 | 0.5 | A program that has a large variation in topics – book readings, biographies, family, etc. |
| Sot_histori | 0.9 | 1.0 | 0.6 | 0.9 | A general informative program |
| I_lirë | 0.8 | 1.0 | 0.5 | 0.9 | A radio drama that gives hope to those lost in alcoholism and drugs. |
| Çdo_ditë | 0.7 | 0.9 | 0.1 | 0.5 | Motivational thoughts for each day |
| Bëj_çmos | 0.7 | 0.8 | 0.1 | 0.5 | Motivational thoughts for each day |
| Fjalët_shpresës | 0.6 | 1.0 | 0.3 | 0.6 | A program that gives hope and covers a wide range of topics |
| Guidelines | 0.7 | 1.0 | 0.3 | 0.6 | Motivational thoughts for women and men |
| Artisti_ditës | 0.6 | 1.0 | 0.3 | 0.6 | A program with good music from a single artist |
| Ballë_për_Ballë | 0.9 | 1.0 | 0.9 | 0.9 | Interview program with people from many difficult backgrounds, economic status, and religious backgrounds. |
| Ora_fëmijëve | 0.6 | 1.0 | 0.3 | 0.6 | Well-received children program with music |
| Spotlight | 0.8 | 0.9 | 0.8 | 0.8 | A program to learn English that talks about interesting people, places and events |
| Permes_Bibles | 0.2 | 0.9 | 0.1 | 0.5 | A fairly religious oriented program |
Table 6.
Radio Logos overall appeal and entropy measurements.
| Program | Muslim 51% |
Christian 16% |
Atheists 17% |
Non-declared 16% |
Overall | Ent | RD | OD |
| News_RL | 1.0 | 1.0 | 1.0 | 1.0 | 1.00 | 0.89 | 1.00 | 0.74 |
| Music_RL | 0.9 | 1.0 | 0.2 | 0.5 | 0.73 | 0.73 | 0.83 | 0.62 |
| Shkenca_sot | 0.9 | 0.9 | 0.1 | 0.8 | 0.75 | 0.72 | 0.85 | 0.64 |
| Shfrytëzo_Kohën | 0.9 | 1.0 | 0.1 | 0.8 | 0.76 | 0.73 | 0.85 | 0.65 |
| Ora_familjes | 0.5 | 0.9 | 0.2 | 0.5 | 0.51 | 0.85 | 0.88 | 0.72 |
| Sot_histori | 0.9 | 1.0 | 0.6 | 0.9 | 0.86 | 0.86 | 0.95 | 0.72 |
| I_lirë | 0.8 | 1.0 | 0.5 | 0.9 | 0.80 | 0.87 | 0.94 | 0.74 |
| Çdo_ditë | 0.7 | 0.9 | 0.1 | 0.5 | 0.60 | 0.74 | 0.83 | 0.65 |
| Bëj_çmos | 0.7 | 0.8 | 0.1 | 0.5 | 0.58 | 0.73 | 0.84 | 0.64 |
| Fjalët_shpresës | 0.6 | 1.0 | 0.3 | 0.6 | 0.61 | 0.86 | 0.90 | 0.74 |
| Guidelines | 0.7 | 1.0 | 0.3 | 0.6 | 0.66 | 0.83 | 0.89 | 0.71 |
| Artisti_ditës | 0.6 | 1.0 | 0.3 | 0.6 | 0.61 | 0.86 | 0.90 | 0.74 |
| Ballë_për_Ballë | 0.9 | 1.0 | 0.9 | 0.9 | 0.92 | 0.90 | 0.99 | 0.75 |
| Ora_fëmijëve | 0.6 | 1.0 | 0.3 | 0.6 | 0.61 | 0.86 | 0.90 | 0.74 |
| Spotlight | 0.8 | 0.9 | 0.8 | 0.8 | 0.82 | 0.90 | 0.98 | 0.75 |
| Permes_Bibles | 0.2 | 0.9 | 0.1 | 0.5 | 0.34 | 0.88 | 0.67 | 0.78 |
Disclaimer/Publisher’s Note: The statements, opinions and data contained in all publications are solely those of the individual author(s) and contributor(s) and not of MDPI and/or the editor(s). MDPI and/or the editor(s) disclaim responsibility for any injury to people or property resulting from any ideas, methods, instructions or products referred to in the content. |
© 2024 by the authors. Licensee MDPI, Basel, Switzerland. This article is an open access article distributed under the terms and conditions of the Creative Commons Attribution (CC BY) license (http://creativecommons.org/licenses/by/4.0/).
Copyright: This open access article is published under a Creative Commons CC BY 4.0 license, which permit the free download, distribution, and reuse, provided that the author and preprint are cited in any reuse.


